
MPT 8-K
Medical Properties Trust Inc (MPT)
UNITED STATES
SECURITIES AND EXCHANGE COMMISSION
WASHINGTON, D.C. 20549
FORM
CURRENT REPORT
PURSUANT TO SECTION 13 OR 15(d)
OF THE SECURITIES EXCHANGE ACT OF 1934
Date of report (Date of earliest event reported):
(Exact Name of Registrant as Specified in Charter)
| Commission File Number |
||||
| (State or other jurisdiction of incorporation or organization) |
(I.R.S. Employer Identification No.) | |||
| |
||||
| (Address of principal executive offices) | (Zip Code) |
Registrant’s telephone number, including area code
Check the appropriate box below if the Form 8-K filing is intended to simultaneously satisfy the filing obligation of the Registrant under any of the following provisions:
| Written communications pursuant to Rule 425 under the Securities Act (17 CFR 230.425) |
| Soliciting material pursuant to Rule 14a-12 under the Exchange Act (17 CFR 240.14a-12) |
| Pre-commencement communications pursuant to Rule 14d-2(b) under the Exchange Act (17 CFR 240.14d-2(b)) |
| Pre-commencement communications pursuant to Rule 13e-4(c) under the Exchange Act (17 CFR 240.13e-4(c)) |
Securities registered pursuant to Section 12(b) of the Act:
| Title of each class |
Trading |
Name of each exchange | ||
Indicate by check mark whether the registrant is an emerging growth company as defined in Rule 405 of the Securities Act of 1933 (§230.405 of this chapter) or Rule 12b-2 of the Securities Exchange Act of 1934 (§240.12b-2 of this chapter).
Emerging growth company
If an emerging growth company, indicate by check mark if the registrant has elected not to use the extended transition period for complying with any new or revised financial accounting standards provided pursuant to Section 13(a) of the Exchange Act. ☐
| Item 2.02. | Results of Operations and Financial Condition. |
On February 27, 2025, Medical Properties Trust, Inc. issued a press release announcing its financial results for the three and twelve months ended December 31, 2024. A copy of the press release is attached as Exhibit 99.1 to this Current Report on Form 8-K and is incorporated herein by reference. The information in this Current Report on Form 8-K, including the information set forth in Exhibit 99.1 and Exhibit 99.2 attached hereto, shall not be deemed “filed” for purposes of Section 18 of the Securities Exchange Act of 1934, as amended, or otherwise subject to the liability of that section or Sections 11 and 12(a)(2) of the Securities Act of 1933, as amended. In addition, this information shall not be deemed incorporated by reference in any filing of Medical Properties Trust, Inc. with the Securities and Exchange Commission, except as expressly set forth by specific reference in any such filing.
| Item 9.01. | Financial Statements and Exhibits. |
(d) Exhibits.
| Exhibit |
Description | |
| 99.1 | Press release dated February 27, 2025 reporting financial results for the three and twelve months ended December 31, 2024 | |
| 99.2 | Medical Properties Trust, Inc. 4th Quarter 2024 Supplemental Information | |
| 104 | Cover Page Interactive Data File (embedded within the Inline XBRL document) | |
2
SIGNATURES
Pursuant to the requirements of the Securities Exchange Act of 1934, as amended, the registrant has duly caused this report to be signed on its behalf by the undersigned hereunder duly authorized.
| MEDICAL PROPERTIES TRUST, INC. | ||
| By: | /s/ R. Steven Hamner | |
| Name: | R. Steven Hamner | |
| Title: | Executive Vice President and Chief Financial Officer | |
Date: February 27, 2025
3
Exhibit 99.1

| Contact: Drew Babin, CFA, CMA Head of Financial Strategy and Investor Relations Medical Properties Trust, Inc. (646) 884-9809 |
MEDICAL PROPERTIES TRUST, INC. REPORTS FOURTH QUARTER AND FULL-YEAR RESULTS
Completed Approximately $5.5 Billion of Asset Monetization Transactions, Including February’s $2.5 Billion Senior Secured Notes Offering That Addresses All Debt Maturities Through 2026
Birmingham, AL – February 27, 2025 – Medical Properties Trust, Inc. (the “Company” or “MPT”) (NYSE: MPW) today announced financial and operating results for the fourth quarter and full-year ended December 31, 2024, as well as certain events occurring subsequent to quarter end.
| • | Net loss of ($0.69) and Normalized Funds from Operations (“NFFO”) of $0.18 for the 2024 fourth quarter and net loss of ($4.02) and NFFO of $0.80 for the full-year 2024, all on a per share basis. Fourth quarter 2024 net loss includes approximately $415 million ($0.69 per share) in impairments and fair market value adjustments related to Prospect Medical Group (“Prospect”) and PHP Holdings (“PHP”); |
| • | Completed a well-oversubscribed private offering of more than $2.5 billion of senior secured notes due in 2032 at a blended coupon rate of 7.885%, the proceeds from which will repay all debt maturities until October 2026 and result in expected combined cash and line of credit availability of $1.4 billion; |
| • | Simultaneous to the senior secured notes offering, the Company amended its line of credit to share collateral with the new senior secured notes and received universal affirmation of the long-standing banking group’s approximate $1.5 billion commitment with a fully extended (at MPT’s option) maturity in June 2027; |
| • | Commenced rent during the fourth quarter on a $50 million building improvement project in Idaho Falls, Idaho; |
| • | Sold two post-acute properties and agreed to sell an additional general acute facility during January for combined proceeds of approximately $45 million; and |
| • | Declared a regular quarterly dividend of $0.08 per share in February. |
Edward K. Aldag, Jr., Chairman, President and Chief Executive Officer, said, “We delivered on exactly what we said we would do in 2024 by using proceeds from transactions to accelerate repayment of debt maturities. Our global real estate portfolio remains attractive to sophisticated investors, as evidenced by our recent five-and-a-half times oversubscribed secured notes transaction. We improved the operator diversification of our portfolio and effectively addressed all debt maturities through 2026, positioning MPT to pursue a range of shareholder value initiatives in 2025.”
1
Included in the financial tables accompanying this press release is information about the Company’s assets and liabilities, operating results, and reconciliations of net (loss) income to NFFO, including per share amounts, all on a basis comparable to 2023 results.
PORTFOLIO UPDATE
Medical Properties Trust has total assets of approximately $14.3 billion, including $8.6 billion of general acute facilities, $2.4 billion of behavioral health facilities and $1.6 billion of post-acute facilities. As of December 31, 2024, MPT’s portfolio included 396 properties and approximately 39,000 licensed beds leased to or mortgaged by 53 hospital operating companies across the United States as well as in the United Kingdom, Switzerland, Germany, Spain, Finland, Colombia, Italy and Portugal.
Hospitals around Europe are benefiting from strong reimbursement trends, growing occupancy, and higher acuity levels. In the United Kingdom, private medical insurance utilization has reached an all-time high – enabling operators such as Circle Health to deliver strong financial performance driven by volume growth as increasingly complex cases are being addressed in the private sector.
In the United States, hospital fundamentals continue to broadly improve across the general acute segment as increasing admissions and growing surgical volumes are driving improved coverage. In the behavioral and post-acute segments, operators are reporting consistent growth in inpatient admissions as well as improvements in contract labor costs.
Following the first full quarter of operations since transitioning 15 hospitals to new operators in September, MPT is encouraged by performance trends being reported across this portfolio as well as by a fifth tenant who leased two additional facilities in November. Across this footprint, our tenants have reported improving volumes, increasing patient satisfaction, and stabilization of staffing and supplies.
In January, Prospect Medical Group commenced an in-court restructuring process under Chapter 11 of the U.S. Bankruptcy Code. In February, MPT entered into a Term Sheet providing for a settlement that will enable Prospect to sell its hospitals and the related real estate with MPT’s cooperation. This settlement is subject to Bankruptcy Court approval.
OPERATING RESULTS
Net loss for the fourth quarter and year ended December 31, 2024 was ($413 million) (($0.69) per share) and ($2.4 billion) (($4.02) per share), respectively, compared to net loss of ($664 million) (($1.11) per share) and net loss of ($556 million) (($0.93) per share) in the year earlier periods. Net loss for the quarter ended December 31, 2024 included, among other non-recurring items, approximately $415 million of impairments and fair market value adjustments related to Prospect and PHP.
NFFO for the fourth quarter and year ended December 31, 2024 was $108 million ($0.18 per share) and $483 million ($0.80 per share), respectively, compared to $218 million ($0.36 per share) and $951 million ($1.59 per share) in the year earlier periods.
2
CONFERENCE CALL AND WEBCAST
The Company has scheduled a conference call and webcast for February 27, 2025 at 11:00 a.m. Eastern Time to present the Company’s financial and operating results for the quarter and year ended December 31, 2024. The dial-in numbers for the conference call are 877-883-0383 (U.S.) and 412-902-6506 (International) along with passcode 9974897. The conference call will also be available via webcast in the Investor Relations section of the Company’s website, www.medicalpropertiestrust.com.
A telephone and webcast replay of the call will be available beginning shortly after the call’s completion. The telephone replay will be available through March 13, 2025, using dial-in numbers 877-344-7529 (U.S.), 855-669-9658 (Canada) and 412-317-0088 (International) along with passcode 1210933. The webcast replay will be available for one year following the call’s completion on the Investor Relations section of the Company’s website.
The Company’s supplemental information package for the current period will also be available on the Company’s website in the Investor Relations section.
The Company uses, and intends to continue to use, the Investor Relations page of its website, which can be found at www.medicalpropertiestrust.com, as a means of disclosing material nonpublic information and of complying with its disclosure obligations under Regulation FD, including, without limitation, through the posting of investor presentations that may include material nonpublic information. Accordingly, investors should monitor the Investor Relations page, in addition to following our press releases, SEC filings, public conference calls, presentations and webcasts. The information contained on, or that may be accessed through, our website is not incorporated by reference into, and is not a part of, this document.
About Medical Properties Trust, Inc.
Medical Properties Trust, Inc. is a self-advised real estate investment trust formed in 2003 to acquire and develop net-leased hospital facilities. From its inception in Birmingham, Alabama, the Company has grown to become one of the world’s largest owners of hospital real estate with 396 facilities and approximately 39,000 licensed beds in nine countries and across three continents as of December 31, 2024. MPT’s financing model facilitates acquisitions and recapitalizations and allows operators of hospitals to unlock the value of their real estate assets to fund facility improvements, technology upgrades and other investments in operations. For more information, please visit the Company’s website at www.medicalpropertiestrust.com.
Forward-Looking Statements
This press release includes forward-looking statements within the meaning of Section 27A of the Securities Act of 1933, as amended, and Section 21E of the Securities Exchange Act of 1934, as amended. Forward-looking statements can generally be identified by the use of forward-looking words such as “may”, “will”, “would”, “could”, “expect”, “intend”, “plan”, “estimate”, “target”, “anticipate”, “believe”, “objectives”, “outlook”, “guidance” or other similar words, and include statements regarding our strategies, objectives, asset sales and other liquidity transactions (including the use of proceeds thereof), expected re-tenanting of facilities and any related regulatory approvals, and expected outcomes from Prospect’s Chapter 11 restructuring process. Forward-looking statements involve known and unknown risks and uncertainties that may cause our actual results or future events to differ materially from those expressed in or underlying such forward-looking statements, including, but not limited to: (i) the risk that the outcome and terms of the bankruptcy restructuring of Prospect will not be consistent with those anticipated by the Company; (ii) our success in implementing our business strategy and our ability to identify, underwrite, finance, consummate and integrate acquisitions and investments; (iii) the risk that previously announced or contemplated property sales, loan repayments, and other capital recycling transactions do not occur as anticipated or at all; (iv) the risk that MPT is not able to attain its leverage, liquidity and cost of capital objectives within a reasonable time period or at all; (v) MPT’s ability to obtain or modify the terms of debt financing on attractive terms or at all, as a result of changes in interest rates and other factors, which may adversely impact its ability to pay down, refinance,
3
restructure or extend its indebtedness as it becomes due, or pursue acquisition and development opportunities; (vi) the ability of our tenants, operators and borrowers to satisfy their obligations under their respective contractual arrangements with us; (vii) the ability of our tenants and operators to operate profitably and generate positive cash flow, remain solvent, comply with applicable laws, rules and regulations in the operation of our properties, to deliver high-quality services, to attract and retain qualified personnel and to attract patients; (viii) the risk that we are unable to monetize our investments in certain tenants at full value within a reasonable time period or at all; and (ix) the risks and uncertainties of litigation or other regulatory proceedings.
The risks described above are not exhaustive and additional factors could adversely affect our business and financial performance, including the risk factors discussed under the section captioned “Risk Factors” in our Annual Report on Form 10-Ks and our Form 10-Qs, and as may be updated in our other filings with the SEC. Forward-looking statements are inherently uncertain and actual performance or outcomes may vary materially from any forward-looking statements and the assumptions on which those statements are based. Readers are cautioned to not place undue reliance on forward-looking statements as predictions of future events. We disclaim any responsibility to update such forward-looking statements, which speak only as of the date on which they were made.
# # #
4
MEDICAL PROPERTIES TRUST, INC. AND SUBSIDIARIES
Consolidated Balance Sheets
(Amounts in thousands, except for per share data)
| December 31, 2024 | December 31, 2023 | |||||||
| Assets | (Unaudited) | (A) | ||||||
| Real estate assets |
||||||||
| Land, buildings and improvements, intangible lease assets, and other |
$ | 11,259,842 | $ | 13,237,187 | ||||
| Investment in financing leases |
1,057,770 | 1,231,630 | ||||||
| Real estate held for sale |
34,019 | — | ||||||
| Mortgage loans |
119,912 | 309,315 | ||||||
|
|
|
|
|
|||||
| Gross investment in real estate assets |
12,471,543 | 14,778,132 | ||||||
| Accumulated depreciation and amortization |
(1,422,948 | ) | (1,407,971 | ) | ||||
|
|
|
|
|
|||||
| Net investment in real estate assets |
11,048,595 | 13,370,161 | ||||||
| Cash and cash equivalents |
332,335 | 250,016 | ||||||
| Interest and rent receivables |
36,327 | 45,059 | ||||||
| Straight-line rent receivables |
700,783 | 635,987 | ||||||
| Investments in unconsolidated real estate joint ventures |
1,156,397 | 1,474,455 | ||||||
| Investments in unconsolidated operating entities |
439,578 | 1,778,640 | ||||||
| Other loans |
109,175 | 292,615 | ||||||
| Other assets |
471,404 | 457,911 | ||||||
|
|
|
|
|
|||||
| Total Assets |
$ | 14,294,594 | $ | 18,304,844 | ||||
|
|
|
|
|
|||||
| Liabilities and Equity |
||||||||
| Liabilities |
||||||||
| Debt, net |
$ | 8,848,112 | $ | 10,064,236 | ||||
| Accounts payable and accrued expenses |
454,209 | 412,178 | ||||||
| Deferred revenue |
29,445 | 37,962 | ||||||
| Obligations to tenants and other lease liabilities |
129,045 | 156,603 | ||||||
|
|
|
|
|
|||||
| Total Liabilities |
9,460,811 | 10,670,979 | ||||||
| Equity |
||||||||
| Preferred stock, $0.001 par value. Authorized 10,000 shares; no shares outstanding |
— | — | ||||||
| Common stock, $0.001 par value. Authorized 750,000 shares; issued and outstanding - 600,403 shares at December 31, 2024 and 598,991 shares at December 31, 2023 |
600 | 599 | ||||||
| Additional paid-in capital |
8,584,917 | 8,560,309 | ||||||
| Retained deficit |
(3,658,516 | ) | (971,809 | ) | ||||
| Accumulated other comprehensive (loss) income |
(94,272 | ) | 42,501 | |||||
|
|
|
|
|
|||||
| Total Medical Properties Trust, Inc. Stockholders’ Equity |
4,832,729 | 7,631,600 | ||||||
| Non-controlling interests |
1,054 | 2,265 | ||||||
|
|
|
|
|
|||||
| Total Equity |
4,833,783 | 7,633,865 | ||||||
|
|
|
|
|
|||||
| Total Liabilities and Equity |
$ | 14,294,594 | $ | 18,304,844 | ||||
|
|
|
|
|
|||||
| (A) | Financials have been derived from the prior year audited financial statements. |
MEDICAL PROPERTIES TRUST, INC. AND SUBSIDIARIES
Consolidated Statements of Income
(Unaudited)
| (Amounts in thousands, except for per share data) | For the Three Months Ended | For the Twelve Months Ended | ||||||||||||||
| December 31, 2024 | December 31, 2023 | December 31, 2024 | December 31, 2023 | |||||||||||||
| Revenues |
||||||||||||||||
| Rent billed |
$ | 166,965 | $ | 78,421 | $ | 719,749 | $ | 803,375 | ||||||||
| Straight-line rent |
43,695 | (166,769 | ) | 163,414 | (127,894 | ) | ||||||||||
| Income from financing leases |
9,819 | 19,412 | 63,651 | 127,141 | ||||||||||||
| Interest and other income |
11,365 | (53,447 | ) | 48,733 | 69,177 | |||||||||||
|
|
|
|
|
|
|
|
|
|||||||||
| Total revenues |
231,844 | (122,383 | ) | 995,547 | 871,799 | |||||||||||
| Expenses |
||||||||||||||||
| Interest |
101,466 | 102,338 | 417,824 | 411,171 | ||||||||||||
| Real estate depreciation and amortization |
64,956 | 77,295 | 447,657 | 603,360 | ||||||||||||
| Property-related (A) |
9,780 | 3,298 | 27,255 | 41,567 | ||||||||||||
| General and administrative |
28,489 | 30,150 | 133,789 | 145,588 | ||||||||||||
|
|
|
|
|
|
|
|
|
|||||||||
| Total expenses |
204,691 | 213,081 | 1,026,525 | 1,201,686 | ||||||||||||
| Other (expense) income |
||||||||||||||||
| Gain (loss) on sale of real estate |
3,497 | (2,024 | ) | 478,693 | (1,815 | ) | ||||||||||
| Real estate and other impairment charges, net |
(386,973 | ) | (283,619 | ) | (1,825,402 | ) | (376,907 | ) | ||||||||
| Earnings (loss) from equity interests |
2,923 | (20,873 | ) | (366,642 | ) | 13,967 | ||||||||||
| Debt refinancing and unutilized financing (costs) benefit |
(615 | ) | 239 | (4,292 | ) | 285 | ||||||||||
| Other (including fair value adjustments on securities) |
(48,744 | ) | (17,861 | ) | (615,565 | ) | 7,586 | |||||||||
|
|
|
|
|
|
|
|
|
|||||||||
| Total other expense |
(429,912 | ) | (324,138 | ) | (2,333,208 | ) | (356,884 | ) | ||||||||
|
|
|
|
|
|
|
|
|
|||||||||
| Loss before income tax |
(402,759 | ) | (659,602 | ) | (2,364,186 | ) | (686,771 | ) | ||||||||
| Income tax (expense) benefit |
(9,563 | ) | (3,982 | ) | (44,101 | ) | 130,679 | |||||||||
|
|
|
|
|
|
|
|
|
|||||||||
| Net loss |
(412,322 | ) | (663,584 | ) | (2,408,287 | ) | (556,092 | ) | ||||||||
| Net income attributable to non-controlling interests |
(526 | ) | (359 | ) | (1,984 | ) | (384 | ) | ||||||||
|
|
|
|
|
|
|
|
|
|||||||||
| Net loss attributable to MPT common stockholders |
$ | (412,848) | $ | (663,943) | $ | (2,410,271) | $ | (556,476) | ||||||||
|
|
|
|
|
|
|
|
|
|||||||||
| Earnings per common share - basic and diluted: |
||||||||||||||||
| Net loss attributable to MPT common stockholders |
$ | (0.69 | ) | $ | (1.11 | ) | $ | (4.02 | ) | $ | (0.93 | ) | ||||
|
|
|
|
|
|
|
|
|
|||||||||
| Weighted average shares outstanding - basic |
600,402 | 598,984 | 600,248 | 598,518 | ||||||||||||
| Weighted average shares outstanding - diluted |
600,402 | 598,984 | 600,248 | 598,518 | ||||||||||||
| Dividends declared per common share |
$ | 0.08 | $ | 0.15 | $ | 0.46 | $ | 0.88 | ||||||||
| (A) | Includes $3.9 million and $0.7 million of ground lease and other expenses (such as property taxes and insurance) paid directly by us and reimbursed by our tenants for the three months ended December 31, 2024 and 2023, respectively, and $13.7 million and $29.3 million for the twelve months ended December 31, 2024 and 2023, respectively. |
MEDICAL PROPERTIES TRUST, INC. AND SUBSIDIARIES
Reconciliation of Net (Loss) Income to Funds From Operations
(Unaudited)
| (Amounts in thousands, except for per share data) | For the Three Months Ended | For the Twelve Months Ended | ||||||||||||||
| December 31, 2024 | December 31, 2023 | December 31, 2024 | December 31, 2023 | |||||||||||||
| FFO information: |
||||||||||||||||
| Net loss attributable to MPT common stockholders |
$ | (412,848 | ) | $ | (663,943 | ) | $ | (2,410,271 | ) | $ | (556,476 | ) | ||||
| Participating securities’ share in earnings |
(139 | ) | (349 | ) | (946 | ) | (1,644 | ) | ||||||||
|
|
|
|
|
|
|
|
|
|||||||||
| Net loss, less participating securities’ share in earnings |
$ | (412,987 | ) | $ | (664,292 | ) | $ | (2,411,217 | ) | $ | (558,120 | ) | ||||
|
|
|
|
|
|
|
|
|
|||||||||
| Depreciation and amortization |
79,396 | 95,648 | 509,524 | 676,132 | ||||||||||||
| (Gain) loss on sale of real estate |
(3,497 | ) | 2,024 | (478,693 | ) | 1,815 | ||||||||||
| Real estate impairment charges |
300,987 | 112,112 | 980,263 | 167,966 | ||||||||||||
|
|
|
|
|
|
|
|
|
|||||||||
| Funds from operations |
$ | (36,101 | ) | $ | (454,508 | ) | $ | (1,400,123 | ) | $ | 287,793 | |||||
|
|
|
|
|
|
|
|
|
|||||||||
| Write-off of billed and unbilled rent and other |
(332 | ) | 499,335 | 2,514 | 649,911 | |||||||||||
| Other impairment charges, net |
85,986 | 171,507 | 1,255,929 | 208,941 | ||||||||||||
| Litigation and other |
4,801 | 2,899 | 51,308 | 15,886 | ||||||||||||
| Share-based compensation adjustments |
— | (6,571 | ) | — | (9,691 | ) | ||||||||||
| Non-cash fair value adjustments |
52,194 | 8,405 | 563,666 | (34,157 | ) | |||||||||||
| Tax rate changes and other |
523 | (2,797 | ) | 5,119 | (167,332 | ) | ||||||||||
| Debt refinancing and unutilized financing costs (benefit) |
615 | (239 | ) | 4,292 | (285 | ) | ||||||||||
|
|
|
|
|
|
|
|
|
|||||||||
| Normalized funds from operations |
$ | 107,686 | $ | 218,031 | $ | 482,705 | $ | 951,066 | ||||||||
|
|
|
|
|
|
|
|
|
|||||||||
| Certain non-cash and related recovery information: |
||||||||||||||||
| Share-based compensation |
$ | 2,321 | $ | 10,102 | $ | 32,902 | $ | 42,941 | ||||||||
| Debt costs amortization |
$ | 5,292 | $ | 4,933 | $ | 20,061 | $ | 20,273 | ||||||||
| Non-cash rent and interest revenue (A) |
$ | — | $ | (57,920 | ) | $ | — | $ | (239,599 | ) | ||||||
| Cash recoveries of non-cash rent and interest revenue (B) |
$ | 542 | $ | 2,364 | $ | 7,382 | $ | 38,451 | ||||||||
| Straight-line rent revenue from operating and finance leases |
$ | (48,627 | ) | $ | (63,282 | ) | $ | (178,022 | ) | $ | (247,699 | ) | ||||
| Per diluted share data: |
||||||||||||||||
| Net loss, less participating securities’ share in earnings |
$ | (0.69 | ) | $ | (1.11 | ) | $ | (4.02 | ) | $ | (0.93 | ) | ||||
|
|
|
|
|
|
|
|
|
|||||||||
| Depreciation and amortization |
0.14 | 0.16 | 0.86 | 1.13 | ||||||||||||
| (Gain) loss on sale of real estate |
(0.01 | ) | — | (0.80 | ) | — | ||||||||||
| Real estate impairment charges |
0.50 | 0.19 | 1.63 | 0.28 | ||||||||||||
|
|
|
|
|
|
|
|
|
|||||||||
| Funds from operations |
$ | (0.06 | ) | $ | (0.76 | ) | $ | (2.33 | ) | $ | 0.48 | |||||
|
|
|
|
|
|
|
|
|
|||||||||
| Write-off of billed and unbilled rent and other |
— | 0.83 | — | 1.09 | ||||||||||||
| Other impairment charges, net |
0.14 | 0.29 | 2.08 | 0.35 | ||||||||||||
| Litigation and other |
0.01 | — | 0.09 | 0.03 | ||||||||||||
| Share-based compensation adjustments |
— | (0.01 | ) | — | (0.02 | ) | ||||||||||
| Non-cash fair value adjustments |
0.09 | 0.01 | 0.94 | (0.06 | ) | |||||||||||
| Tax rate changes and other |
— | — | 0.01 | (0.28 | ) | |||||||||||
| Debt refinancing and unutilized financing costs (benefit) |
— | — | 0.01 | — | ||||||||||||
|
|
|
|
|
|
|
|
|
|||||||||
| Normalized funds from operations |
$ | 0.18 | $ | 0.36 | $ | 0.80 | $ | 1.59 | ||||||||
|
|
|
|
|
|
|
|
|
|||||||||
| Certain non-cash and related recovery information: |
||||||||||||||||
| Share-based compensation |
$ | — | $ | 0.02 | $ | 0.05 | $ | 0.07 | ||||||||
| Debt costs amortization |
$ | 0.01 | $ | 0.01 | $ | 0.03 | $ | 0.03 | ||||||||
| Non-cash rent and interest revenue (A) |
$ | — | $ | (0.10 | ) | $ | — | $ | (0.40 | ) | ||||||
| Cash recoveries of non-cash rent and interest revenue (B) |
$ | — | $ | — | $ | 0.01 | $ | 0.06 | ||||||||
| Straight-line rent revenue from operating and finance leases |
$ | (0.08 | ) | $ | (0.11 | ) | $ | (0.30 | ) | $ | (0.41 | ) | ||||
Notes:
Investors and analysts following the real estate industry utilize funds from operations (“FFO”) as a supplemental performance measure. FFO, reflecting the assumption that real estate asset values rise or fall with market conditions, principally adjusts for the effects of GAAP depreciation and amortization of real estate assets, which assumes that the value of real estate diminishes predictably over time. We compute FFO in accordance with the definition provided by the National Association of Real Estate Investment Trusts, or Nareit, which represents net income (loss) (computed in accordance with GAAP), excluding gains (losses) on sales of real estate and impairment charges on real estate assets, plus real estate depreciation and amortization, including amortization related to in-place lease intangibles, and after adjustments for unconsolidated partnerships and joint ventures.
In addition to presenting FFO in accordance with the Nareit definition, we disclose normalized FFO, which adjusts FFO for items that relate to unanticipated or non-core events or activities or accounting changes that, if not noted, would make comparison to prior period results and market expectations less meaningful to investors and analysts. We believe that the use of FFO, combined with the required GAAP presentations, improves the understanding of our operating results among investors and the use of normalized FFO makes comparisons of our operating results with prior periods and other companies more meaningful. While FFO and normalized FFO are relevant and widely used supplemental measures of operating and financial performance of REITs, they should not be viewed as a substitute measure of our operating performance since the measures do not reflect either depreciation and amortization costs or the level of capital expenditures and leasing costs (if any not paid by our tenants) to maintain the operating performance of our properties, which can be significant economic costs that could materially impact our results of operations. FFO and normalized FFO should not be considered an alternative to net income (loss) (computed in accordance with GAAP) as indicators of our results of operations or to cash flow from operating activities (computed in accordance with GAAP) as an indicator of our liquidity.
Certain line items above (such as depreciation and amortization) include our share of such income/expense from unconsolidated joint ventures. These amounts are included with all activity of our equity interests in the “Earnings (loss) from equity interests” line on the consolidated statements of income.
| (A) | Includes revenue accrued during the period but not received in cash, such as deferred rent, payment -in-kind (“PIK”) interest or other accruals. |
| (B) | Includes cash received to satisfy previously accrued non -cash revenue, such as the cash receipt of previously deferred rent or PIK interest. |
Exhibit 99.2

Exhibit 99.2 QUARTERLY SUPPLEMENTAL4Q 2024

3 COMPANY OVERVIEWCompany Information 3FINANCIAL INFORMATION6 Reconciliation of Funds from Operations 6 Debt Summary 7 Debt Maturities and Debt Metrics 8PORTFOLIO INFORMATION Lease and Loan Maturity Schedule 99 Total Assets and Revenues by Asset Type, Operator, State and Country 10 Rent Coverage 13 Summary of Acquisitions, Active Developments, and Capital Addition Projects 15FINANCIAL STATEMENTSConsolidated Statements of Income 1616 Consolidated Balance Sheets 17 Investments in Unconsolidated Real EstateJoint Ventures 18 Investments in Unconsolidated Operating Entities 19Appendix—Non-GAAP Reconciliations 20FORWARD-LOOKING STATEMENTS This press release includes forward-looking statements within the meaning of Section 27A of the Securities Act of 1933, as amended, and Section 21E of the Securities Exchange Act of 1934, as amended. Forward-looking statements can generally be identified by the use of forward-looking words such as “may”, “will”, “would”, “could”, “expect”, “intend”, “plan”, “estimate”, “target”, “anticipate”, “believe”, “objectives”, “outlook”, “guidance” or other similar words, and include statements regarding our strategies, objectives, asset sales and other liquidity transactions (including the use of proceeds thereof), expected re-tenanting of facilities and any related regulatory approvals, and expected outcomes from Prospect’s Chapter 11 restructuring process. Forward-looking statements involve known and unknown risks and uncertainties that may cause our actual results or future events to differ materially from those expressed in or underlying such forward-looking statements, including, but not limited to: (i) the risk that the outcome and terms of the bankruptcy restructuring of Prospect will not be consistent with those anticipated by the Company; (ii) our success in implementing our business strategy and our ability to identify, underwrite, finance, consummate and integrate acquisitions and investments; (iii) the risk that previously announced or contemplated property sales, loan repayments, and other capital recycling transactions do not occur as anticipated or at all; (iv) the risk that MPT is not able to attain its leverage, liquidity and cost of capital objectives within a reasonable time period or at all; (v) MPT’s ability to obtain or modify the terms of debt financing on attractive terms or at all, as a result of changes in interest rates and other factors, which may adversely impact its ability to pay down, refinance, restructure or extend its indebtedness as it becomes due, or pursue acquisition and development opportunities; (vi) the ability of our tenants, operators and borrowers to satisfy their obligations under their respective contractual arrangements with us; (vii) the ability of our tenants and operators to operate profitably and generate positive cash flow, remain solvent, comply with applicable laws, rules and regulations in the operation of our properties, to deliver high-quality services, to attract and retain qualified personnel and to attract patients; (viii) the risk that we are unable to monetize our investments in certain tenants at full value within a reasonable time period or at all; and (ix) the risks and uncertainties of litigation or other regulatory proceedings.The risks described above are not exhaustive and additional factors could adversely affect our business and financial performance, including the risk factors discussed under the section captioned “Risk Factors” in our Annual Report on Form 10-Ks and our Form 10-Qs, and as may be updated in our other filings with the SEC. Forward-looking statements are inherently uncertain and actual performance or outcomes may vary materially from any forward-looking statements and the assumptions on which those statements are based. Readers are cautioned to not place undue reliance on forward-looking statements as predictions of future events. We disclaim any responsibility to update such forward-looking statements, which speak only as of the date on which they were made.Pictured above: Policlinico di Monza—Monza, Italy—Operated by Policlinico di Monza. On the cover: MPT employees visiting Medical West Freestanding Emergency Department—Hoover, AL—Operated by Medical West.MEDICAL PROPERTIES TRUST | SUPPLEMENTAL INFORMATION | Q4 2024
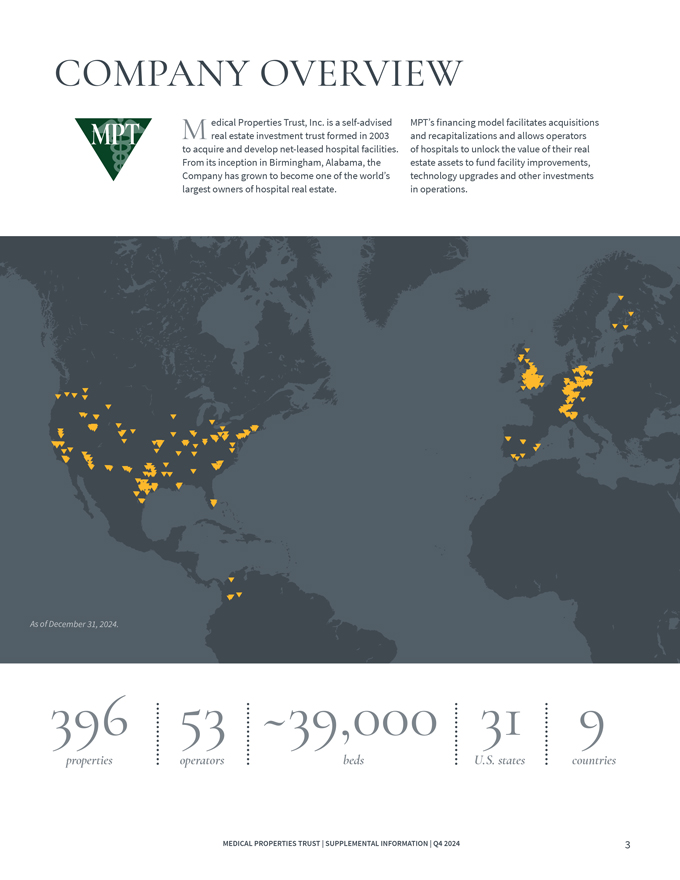
COMPANY OVERVIEWM edical Properties Trust, Inc. is a self-advised real estate investment trust formed in 2003 to acquire and develop net-leased hospital facilities. From its inception in Birmingham, Alabama, the Company has grown to become one of the world’s largest owners of hospital real estate. MPT’s financing model facilitates acquisitions and recapitalizations and allows operators of hospitals to unlock the value of their real estate assets to fund facility improvements, technology upgrades and other investments in operations.396 53 ~39,000 31 9properties operators beds U.S. states countriesMEDICAL PROPERTIES TRUST | SUPPLEMENTAL INFORMATION | Q4 2024

MPT OfficersEdward K. Aldag, Jr. Chairman, President and Chief Executive Officer R. Steven Hamner Executive Vice President and Chief Financial Officer J. Kevin Hanna Senior Vice President, Controller and Chief Accounting Officer Rosa H. Hooper Senior Vice President of Operations and Secretary Larry H. Portal Senior Vice President, Senior Advisor to the CEOCharles R. Lambert Senior Vice President of Finance and Treasurer R. Lucas Savage Vice President, Head of Global AcquisitionsBoard of Directors Corporate HeadquartersEdward K. Aldag, Jr.G. Steven Dawson Medical Properties Trust, Inc.R. Steven Hamner1000 Urban Center Drive, Suite 501 Caterina A. Mozingo Birmingham, AL 35242Emily W. MurphyElizabeth N. Pitman (205) 969-3755D. Paul Sparks, Jr. (205) 969-3756 (fax)Michael G. Stewart www.medicalpropertiestrust.comC. Reynolds Thompson, IIIMEDICAL PROPERTIES TRUST | SUPPLEMENTAL INFORMATION | Q4 2024

INVESTOR RELATIONSDrew Babin Tim BerrymanHead of Financial Strategy and Investor Relations Managing Director of Investor Relations(646) 884-9809 [email protected] (205) 397-8589 [email protected] Stock Exchange Agent Listing and Trading SymbolEquiniti Trust Company, LLC New York Stock Exchange 6201 15th Avenue (NYSE): MPWBrooklyn, NY 11219https://equiniti.com/usGenesisCare Hospital—Málaga, Spain—Operated by GenesisCare.

FINANCIAL INFORMATION RECONCILIATION OF NET (LOSS) INCOME TO FUNDS FROM OPERATIONS(Unaudited)(Amounts in thousands, except per share data)For the Three Months Ended For the Twelve Months EndedDecember 31, 2024 December 31, 2023 December 31, 2024 December 31, 2023FFO INFORMATION:Net loss attributable to MPT common stockholders $ (412,848) $ (663,943) $ (2,410,271) $ (556,476)Participating securities’ share in earnings (139) (349) (946) (1,644)Net loss, less participating securities’ share in earnings $ (412,987) $ (664,292) $ (2,411,217) $ (558,120)Depreciation and amortization 79,396 95,648 509,524 676,132 (Gain) loss on sale of real estate (3,497) 2,024 (478,693) 1,815 Real estate impairment charges 300,987 112,112 980,263 167,966Funds from operations $ (36,101) $ (454,508) $ (1,400,123) $ 287,793 Write-off of billed and unbilled rent and other (332) 499,335 2,514 649,911 Other impairment charges, net 85,986 171,507 1,255,929 208,941 Litigation and other 4,801 2,899 51,308 15,886 Share-based compensation adjustments — (6,571) — (9,691) Non-cash fair value adjustments 52,194 8,405 563,666 (34,157) Tax rate changes and other 523 (2,797) 5,119 (167,332) Debt refinancing and unutilized financing costs (benefit) 615 (239) 4,292 (285)Normalized funds from operations $ 107,686 $ 218,031 $ 482,705 $ 951,066 Certain non-cash and related recovery information:Share-based compensation $ 2,321 $ 10,102 $ 32,902 $ 42,941 Debt costs amortization $ 5,292 $ 4,933 $ 20,061 $ 20,273 Non-cash rent and interest revenue (A) $ —$ (57,920) $ —$ (239,599) Cash recoveries of non-cash rent and interest revenue (B) $ 542 $ 2,364 $ 7,382 $ 38,451 Straight-line rent revenue from operating and finance leases $ (48,627) $ (63,282) $ (178,022) $ (247,699)PER DILUTED SHARE DATA:Net loss, less participating securities’ share in earnings $ (0.69) $ (1.11) $ (4.02) $ (0.93)Depreciation and amortization 0.14 0.16 0.86 1.13 (Gain) loss on sale of real estate (0.01) — (0.80) -Real estate impairment charges 0.50 0.19 1.63 0.28Funds from operations $ (0 .06) $ (0 .76) $ (2 .33) $ 0.48Write-off of billed and unbilled rent and other — 0.83 — 1.09 Other impairment charges, net 0.14 0.29 2.08 0.35 Litigation and other 0.01 — 0.09 0.03 Share-based compensation adjustments — (0.01) — (0.02) Non-cash fair value adjustments 0.09 0.01 0.94 (0.06) Tax rate changes and other — — 0.01 (0.28) Debt refinancing and unutilized financing costs (benefit) — — 0.01 -Normalized funds from operations $ 0.18 $ 0.36 $ 0.80 $ 1.59Certain non-cash and related recovery information:Share-based compensation $ —$ 0.02 $ 0.05 $ 0.07 Debt costs amortization $ 0.01 $ 0.01 $ 0.03 $ 0.03 Non-cash rent and interest revenue (A) $ —$ (0.10) $ —$ (0.40) Cash recoveries of non-cash rent and interest revenue (B) $ —$ —$ 0.01 $ 0.06 Straight-line rent revenue from operating and finance leases $ (0.08) $ (0.11) $ (0.30) $ (0.41)Notes:Investors and analysts following the real estate industry utilize funds from operations (“FFO”) as a supplemental performance measure. FFO, reflecting the assumption that real estate asset values rise or fall with market conditions, principally adjusts for the effects of GAAP depreciation and amortization of real estate assets, which assumes that the value of real estate diminishes predictably over time. We compute FFO in accordance with the definition provided by the National Association of Real Estate Investment Trusts, or Nareit, which represents net income (loss) (computed in accordance with GAAP), excluding gains (losses) on sales of real estate and impairment charges on real estate assets, plus real estate depreciation and amortization, including amortization related to in-place lease intangibles, and after adjustments for unconsolidated partnerships and joint ventures.In addition to presenting FFO in accordance with the Nareit definition, we disclose normalized FFO, which adjusts FFO for items that relate to unanticipated or non-core events or activities or accounting changes that, if not noted, would make comparison to prior period results and market expectations less meaningful to investors and analysts. We believe that the use of FFO, combined with the required GAAP presentations, improves the understanding of our operating results among investors and the use of normalized FFO makes comparisons of our operating results with prior periods and other companies more meaningful. While FFO and normalized FFO are relevant and widely used supplemental measures of operating and financial performance of REITs, they should not be viewed as a substitute measure of our operating performance since the measures do not reflect either depreciation and amortization costs or the level of capital expenditures and leasing costs (if any not paid by our tenants) to maintain the operating performance of our properties, which can be significant economic costs that could materially impact our results of operations. FFO and normalized FFO should not be considered an alternative to net income (loss) (computed in accordance with GAAP) as indicators of our results of operations or to cash flow from operating activities (computed in accordance with GAAP) as an indicator of our liquidity.Certain line items above (such as depreciation and amortization) include our share of such income/expense from unconsolidated joint ventures. These amounts are included with all activity of our equity interests in the “Earnings (loss) from equity interests” line on the consolidated statements of income.(A) Includes revenue accrued during the period but not received in cash, such as deferred rent, payment-in-kind (“PIK”) interest or other accruals.(B) Includes cash received to satisfy previously accrued non-cash revenue, such as the cash receipt of previously deferred rent or PIK interest.

FINANCIAL INFORMATION (As of December 31, 2024) ($ amounts in thousands)DEBT SUMMARYDebt Instrument(C) Rate Type Rate Balance2026 Credit Facility Revolver(A)(B) Variable 5.863%—7.497% $ 361,726 2027 Term Loan(B) Variable 7.457% 200,0003.325% Notes Due 2025 (€500M)(A) Fixed 3.325% 517,700 2025 GBP Term Loan (Ł493M)(A)(D) Fixed 3.699% 617,0390.993% Notes Due 2026 (€500M)(A) Fixed 0.993% 517,7005.250% Notes Due 2026 Fixed 5.250% 500,0002.500% Notes Due 2026 (Ł500M)(A) Fixed 2.500% 625,8005.000% Notes Due 2027 Fixed 5.000% 1,400,0003.692% Notes Due 2028 (Ł600M)(A) Fixed 3.692% 750,9604.625% Notes Due 2029 Fixed 4.625% 900,0003.375% Notes Due 2030 (Ł350M)(A) Fixed 3.375% 438,0603.500% Notes Due 2031 Fixed 3.500% 1,300,000 2034 Secured GBP Term Loan (Ł631M)(A) Fixed 6.877% 790,234 $ 8,919,219Debt issuance costs and discount (71,107)Weighted average rate 4.238% $ 8,848,112Variable 6%Fixed 94%(A) Non-USD denominated debt converted to U.S. dollars at December 31, 2024.(B) We amended the Credit Facility agreement on August 6, 2024 which, among other things, reduced total revolving commitments to $1.28 billion. We further amended the Credit Facility agreement on February 13, 2025 which, among other things, reduced the borrowing spreads from 300 basis points to 225 basis points, provided notice to extend the maturity to June 30, 2027, subject to the satisfaction of other conditions, and provided for collateral pari passu with senior secured notes discussed in footnote C .(C) On February 13, 2025, we closed on a private offering that consisted of a $1.5 billion aggregate principal amount of senior secured notes due 2032 and €1.0 billion aggregate principal amount of senior secured notes due 2032. We used the net proceeds from these notes to fund the redemption of our 3.325% Notes due 2025, 2.500% Notes due 2026, and 5.250% Notes due 2026. We used the remaining net proceeds to pay down the revolving portion of our Credit Facility.(D) This term loan was fully paid off on January 15, 2025.

FINANCIAL INFORMATION (As of December 31, 2024) ($ amounts in thousands)DEBT MATURITIES(A)Senior Unsecured Year Term Loans/Revolver Total Debt % of Total Notes2025 $ 517,700 $ 617,039 $ 1,134,739 12.7% 2026 1,643,500 361,726 2,005,226 22.5% 2027 1,400,000 200,000 1,600,000 17.9% 2028 750,960 — 750,960 8.4% 2029 900,000 — 900,000 10.1% 2030 438,060 — 438,060 4.9% 2031 1,300,000 — 1,300,000 14.6% 2032 — — —0.0% 2033 — — —0.0% 2034 — 790,234 790,234 8.9%Totals $ 6,950,220 $ 1,968,999 $ 8,919,219 100.0%DEBT BY LOCAL CURRENCYSenior Unsecured Term Loans/Revolver Total Debt % of Total NotesUnited States $ 4,100,000 $ 248,000 $ 4,348,000 48.8% United Kingdom 1,814,820 1,407,273 3,222,093 36.1% Europe 1,035,400 313,726 1,349,126 15.1%Totals $ 6,950,220 $ 1,968,999 $ 8,919,219 100.0%DEBT METRICS For the Three Months Ended December 31, 2024Adjusted Net Debt to Annualized EBITDAre Ratios:Adjusted Net Debt $ 8,080,682 Adjusted Annualized EBITDAre $ 865,312Adjusted Net Debt to Adjusted Annualized EBITDAre Ratio 9.3xAdjusted Net Debt $ 8,080,682 Transaction Adjusted Annualized EBITDAre $ 865,508Adjusted Net Debt to Transaction Adjusted Annualized EBITDAre Ratio 9.3x Leverage Ratio:Unsecured Debt $ 8,128,985Secured Debt 790,234Total Debt $ 8,919,219 Total Gross Assets(B) $ 15,717,542Financial Leverage 56.7% Interest Coverage Ratio:Interest Expense $ 101,466Capitalized Interest 1,763 Debt Costs Amortization (5,081)Total Interest $ 98,148 Adjusted EBITDAre $ 216,328Adjusted Interest Coverage Ratio 2.2x(A) On February 13, 2025, we closed on a private offering that consisted of a $1.5 billion aggregate principal amount of senior secured notes due 2032 and €1.0 billion aggregate principal amount of senior secured notes due 2032. We used the net proceeds from these notes to fund the redemption of our 3.325% Notes due 2025, 2.500% Notes due 2026, and 5.250% Notes due 2026. We used the remaining net proceeds to pay down the revolving portion of our Credit Facility, which became secured in conjunction with the private offering in February 2025.(B) Total Gross Assets equals total assets plus accumulated depreciation and amortization.See appendix for reconciliation of Non-GAAP financial measures.
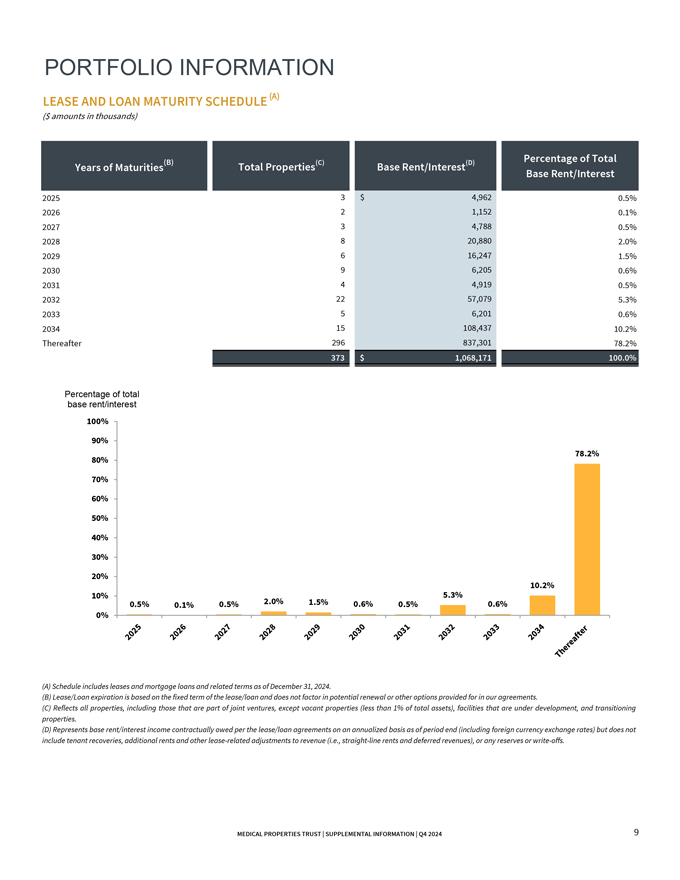
PORTFOLIO INFORMATION LEASE AND LOAN MATURITY SCHEDULE (A)($ amounts in thousands)(B) (C) (D) Percentage of Total Years of Maturities Total Properties Base Rent/Interest Base Rent/Interest2025 3 $ 4,962 0.5% 2026 2 1,152 0.1% 2027 3 4,788 0.5% 2028 8 20,880 2.0% 2029 6 16,247 1.5% 2030 9 6,205 0.6% 2031 4 4,919 0.5% 2032 22 57,079 5.3% 2033 5 6,201 0.6% 2034 15 108,437 10.2% Thereafter 296 837,301 78.2% 373 # $ 1,068,171 100.0%Percentage of total base rent/interest100% 90%78.2% 80% 70% 60% 50% 40% 30% 20% 10.2% 10% 5.3%0.5% 0.1% 0.5% 2.0% 1.5% 0.6% 0.5% 0.6% 0%(A) Schedule includes leases and mortgage loans and related terms as of December 31, 2024.(B) Lease/Loan expiration is based on the fixed term of the lease/loan and does not factor in potential renewal or other options provided for in our agreements. (C) Reflects all properties, including those that are part of joint ventures, except vacant properties (less than 1% of total assets), facilities that are under development, and transitioning properties. (D) Represents base rent/interest income contractually owed per the lease/loan agreements on an annualized basis as of period end (including foreign currency exchange rates) but does not include tenant recoveries, additional rents and other lease-related adjustments to revenue (i.e., straight-line rents and deferred revenues), or any reserves or write-offs.

PORTFOLIO INFORMATION TOTAL ASSETS AND REVENUES BY ASSET TYPE(December 31, 2024) ($ amounts in thousands)Total Percentage of Q4 2024 Percentage of Asset Types Properties (A) Assets Total Assets Revenues Q4 2024 RevenuesGeneral Acute Care Hospitals 173 $ 8,493,331 59.4% $ 137,705 59.4% Behavioral Health Facilities 69 2,376,460 16.7% 51,586 22.2% Post Acute Care Facilities 133 1,617,596 11.3% 40,542 17.5% Freestanding ER/Urgent Care Facilities 21 117,331 0.8% 2,011 0.9%Other — 1,689,876 11.8% — -Total 396 $ 14,294,594 100.0% $ 231,844 100.0%TOTAL ASSETS BY ASSET TYPE TOTAL REVENUES BY ASSET TYPE12% 1% 1%General Acute Care Hospitals 18% 11% Behavioral Health Facilities59%Post Acute Care Facilities 59% 17% 22%Freestanding ER/Urgent Care FacilitiesOtherDOMESTIC ASSETS BY ASSET TYPE DOMESTIC REVENUES BY ASSET TYPE13% 2% 2%General Acute Care HospitalsBehavioral Health Facilities 27% 13%54% 60% Post Acute Care Facilities12%Freestanding ER/Urgent Care Facilities 17%OtherNote: Investments in operating entities are allocated pro rata based on the gross book value of the real estate. Such pro rata allocations are subject to change from period to period. (A) Reflects total assets on our consolidated balance sheets.
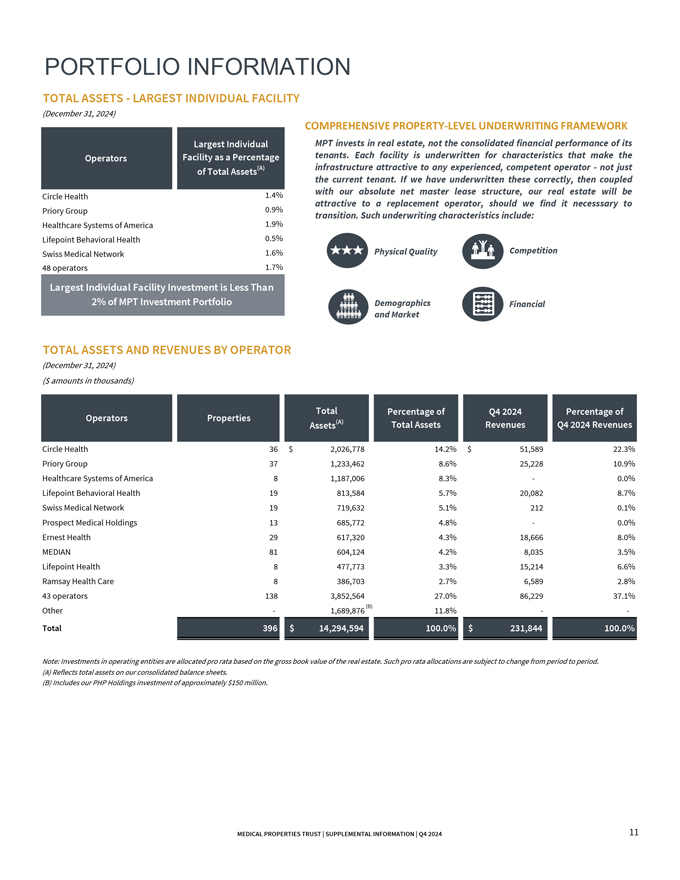
PORTFOLIO INFORMATION TOTAL ASSETS—LARGEST INDIVIDUAL FACILITY(December 31, 2024)Largest Individual Operators Facility as a Percentage of Total Assets(A)Circle Health 1.4% Priory Group 0.9% Healthcare Systems of America 1.9% Lifepoint Behavioral Health 0.5% Swiss Medical Network 1.6% 48 operators 1.7%Largest Individual Facility Investment is Less Than 2% of MPT Investment Portfolio MPT invests in real estate, not the consolidated financial performance of its tenants. Each facility is underwritten for characteristics that make the infrastructure attractive to any experienced, competent operator—not just the current tenant. If we have underwritten these correctly, then coupled with our absolute net master lease structure, our real estate will be attractive to a replacement operator, should we find it necesssary to transition. Such underwriting characteristics include:Physical Quality CompetitionDemographics Financial and MarketTOTAL ASSETS AND REVENUES BY OPERATOR(December 31, 2024) ($ amounts in thousands)Total Percentage of Q4 2024 Percentage of Operators Properties (A) Assets Total Assets Revenues Q4 2024 RevenuesCircle Health 36 $ 2,026,778 14.2% $ 51,589 22.3% Priory Group 37 1,233,462 8.6% 25,228 10.9% Healthcare Systems of America 8 1,187,006 8.3% —0.0% Lifepoint Behavioral Health 19 813,584 5.7% 20,082 8.7% Swiss Medical Network 19 719,632 5.1% 212 0.1% Prospect Medical Holdings 13 685,772 4.8% —0.0% Ernest Health 29 617,320 4.3% 18,666 8.0% MEDIAN 81 604,124 4.2% 8,035 3.5% Lifepoint Health 8 477,773 3.3% 15,214 6.6% Ramsay Health Care 8 386,703 2.7% 6,589 2.8% 43 operators 138 3,852,564 27.0% 86,229 37.1% Other — 1,689,876 (B) 11.8% — — Total 396 $ 14,294,594 100.0% $ 231,844 100.0%Note: Investments in operating entities are allocated pro rata based on the gross book value of the real estate. Such pro rata allocations are subject to change from period to period. (A) Reflects total assets on our consolidated balance sheets.(B) Includes our PHP Holdings investment of approximately $150 million.

PORTFOLIO INFORMATION TOTAL ASSETS AND REVENUES BY U.S. STATE AND COUNTRY(December 31, 2024) ($ amounts in thousands)Total Percentage of Q4 2024 Percentage of U.S. States and Other Countries Properties (A) Assets Total Assets Revenues Q4 2024 RevenuesTexas 48 $ 1,394,296 9.8% $ 23,318 10.1% California 17 935,470 6.4% 16,834 7.3% Florida 6 840,876 5.9% —0.0% Arizona 10 379,801 2.7% 10,674 4.6% Ohio 9 327,577 2.3% 6,783 2.9%26 Other States 83 2,636,587 18.5% 64,507 27.8% Other — 951,486 6.6% — -United States 173 $ 7,466,093 52.2% $ 122,116 52.7%United Kingdom 92 $ 3,985,672 27.9% $ 90,144 38.9% Switzerland 19 719,632 5.0% 212 0.1% Germany 85 672,343 4.7% 10,056 4.3% Spain 9 247,996 1.7% 2,903 1.3% Other Countries 18 464,468 3.3% 6,413 2.7% Other — 738,390 5.2% — -International 223 $ 6,828,501 47.8% $ 109,728 47.3% Total 396 $ 14,294,594 100.0% $ 231,844 100.0%Note: Investments in operating entities are allocated pro rata based on the gross book value of the real estate. Such pro rata allocations are subject to change from period to period. (A) Reflects total assets on our consolidated balance sheets.TOTAL ASSETS BY COUNTRY TOTAL REVENUES BY COUNTRY5% 1% 3% 3% 2%5% United States 4%5% United Kingdom 52% SwitzerlandGermany 39% 53% 28% Spain Other Countries OtherASSETS BY U.S. STATE REVENUES BY U.S. STATETexas6%10% California 10% FloridaArizona 7%6% 28% 19% Ohio6% 26 Other States 5%2% 3% Other 3%

PORTFOLIO INFORMATION TOTAL PORTFOLIO TTM EBITDARM(A)(B) RENT COVERAGEYoY and SEQUENTIAL QUARTER COMPARISONS BY PROPERTY TYPEEBITDARM Rent Coverage3.00x2.9x2.8x2.50x 2.5x2.4x2.3x2.1x 2.1x2.0x2.00x 2.0x1.7x 1.8x1.7x1.50x1.00x0.50x0.00xGeneral Acute Care Hospitals Post Acute Care Facilities (C) Behavioral Health Total Portfolio Facilities Q3 2023 TTM Q2 2024 TTM Q3 2024 TTM% of Total Assets(D)59.4% 11.3% 16.7% 87.4%Notes: All data presented is on a trailing twelve month (“TTM”) basis. For properties acquired in the preceding twelve months, data is for the period between MPT acquisition and September 30, 2024. (A) EBITDARM is facility-level earnings before interest, taxes, depreciation, amortization, rent and management fees. EBITDARM includes normal GAAP expensed maintenance and repair costs. EBITDARM does not give effect for capitalized expenditures that extend the life or improve the facility and equipment to increase revenues at the facility. The majority of these types of capital expenditures are financed and do not have an immediate cash impact. MPT’s rent has priority and is not subordinate to capitalized expenses. In addition, EBITDARM does not represent property net income or cash flows from operations and should not be considered an alternative to those indicators. EBITDARM figures utilized in calculating coverages presented are based on financial information provided by MPT’s tenants. MPT has not independently verified this information, but has no reason to believe this information is inaccurate in any material respect. TTM Coverages are calculated based on actual, unadjusted EBITDARM results as presented in tenant financial reporting and cash rent paid to MPT, except as noted below.- All CARES Act Grants received by tenants have been removed from the tenant’s reported financial results in the above time periods.- EBITDARM figures for California hospitals include amounts expected to be received under the Hospital Quality Assurance Fee (“HQAF”) Program 8. The HQAF amounts are based on the current payment model from the California Hospital Association which was approved by CMS on December 19, 2023.(B) General Acute Care coverages, Behavioral Health coverages and Total Portfolio coverages do not include Prospect Medical Holdings (PMH) facilities due to restructuring, and former Steward Health Care facilities due to re-tenanting.(C) Post Acute Care Facilities property type includes both Inpatient Rehabilitation Hospitals and Long Term Acute Care Hospitals. (D) Reflects percentage of total assets on December 31, 2024 balance sheet.
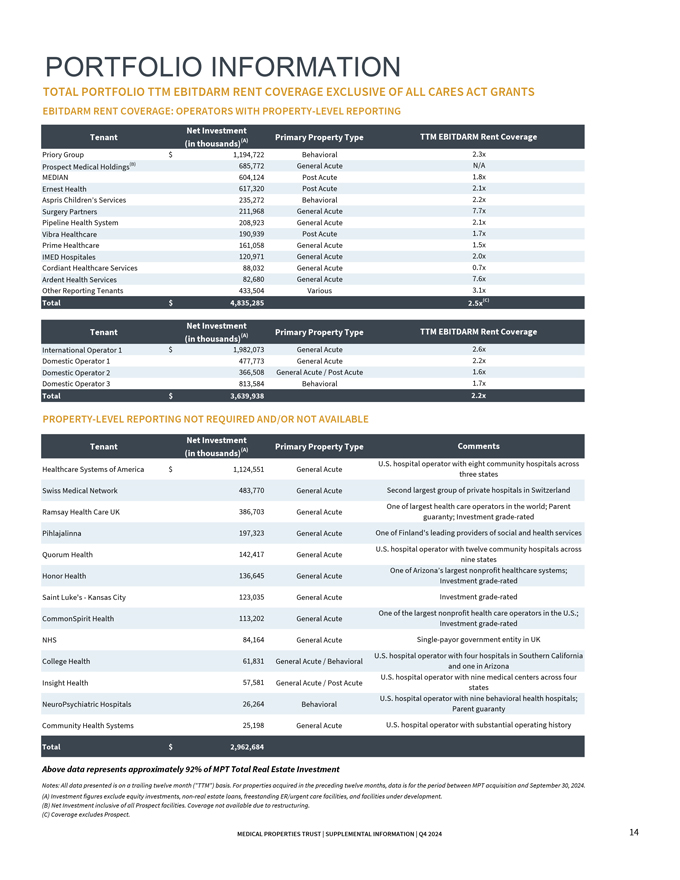
PORTFOLIO INFORMATION TOTAL PORTFOLIO TTM EBITDARM RENT COVERAGE EXCLUSIVE OF ALL CARES ACT GRANTSEBITDARM RENT COVERAGE: OPERATORS WITH PROPERTY-LEVEL REPORTINGNet InvestmentTenant (A) Primary Property Type TTM EBITDARM Rent Coverage (in thousands)Priory Group $ 1,194,722 Behavioral 2.3x Prospect Medical Holdings(B) 685,772 General Acute N/A MEDIAN 604,124 Post Acute 1.8x Ernest Health 617,320 Post Acute 2.1x Aspris Children’s Services 235,272 Behavioral 2.2x Surgery Partners 211,968 General Acute 7.7x Pipeline Health System 208,923 General Acute 2.1x Vibra Healthcare 190,939 Post Acute 1.7x Prime Healthcare 161,058 General Acute 1.5x IMED Hospitales 120,971 General Acute 2.0x Cordiant Healthcare Services 88,032 General Acute 0.7x Ardent Health Services 82,680 General Acute 7.6x Other Reporting Tenants 433,504 Various 3.1xTotal $ 4,835,285 2.5x(C)Net InvestmentTenant (A) Primary Property Type TTM EBITDARM Rent Coverage (in thousands)International Operator 1 $ 1,982,073 General Acute 2.6x Domestic Operator 1 477,773 General Acute 2.2x Domestic Operator 2 366,508 General Acute / Post Acute 1.6x Domestic Operator 3 813,584 Behavioral 1.7xTotal $ 3,639,938 2.2xPROPERTY-LEVEL REPORTING NOT REQUIRED AND/OR NOT AVAILABLENet InvestmentTenant (A) Primary Property Type Comments (in thousands)U.S. hospital operator with eight community hospitals across Healthcare Systems of America $ 1,124,551 General Acute three states Swiss Medical Network 483,770 General Acute Second largest group of private hospitals in Switzerland One of largest health care operators in the world; Parent Ramsay Health Care UK 386,703 General Acute guaranty; Investment grade-ratedPihlajalinna 197,323 General Acute One of Finland’s leading providers of social and health services U.S. hospital operator with twelve community hospitals across Quorum Health 142,417 General Acute nine states One of Arizona’s largest nonprofit healthcare systems; Honor Health 136,645 General Acute Investment grade-rated Saint Luke’s—Kansas City 123,035 General Acute Investment grade-rated One of the largest nonprofit health care operators in the U.S.; CommonSpirit Health 113,202 General Acute Investment grade-rated NHS 84,164 General Acute Single-payor government entity in UKU.S. hospital operator with four hospitals in Southern California College Health 61,831 General Acute / Behavioral and one in ArizonaU.S. hospital operator with nine medical centers across four Insight Health 57,581 General Acute / Post Acute statesU.S. hospital operator with nine behavioral health hospitals; NeuroPsychiatric Hospitals 26,264 Behavioral Parent guaranty Community Health Systems 25,198 General Acute U.S. hospital operator with substantial operating historyTotal $ 2,962,684Above data represents approximately 92% of MPT Total Real Estate InvestmentNotes: All data presented is on a trailing twelve month (“TTM”) basis. For properties acquired in the preceding twelve months, data is for the period between MPT acquisition and September 30, 2024. (A) Investment figures exclude equity investments, non-real estate loans, freestanding ER/urgent care facilities, and facilities under development.(B) Net Investment inclusive of all Prospect facilities. Coverage not available due to restructuring. (C) Coverage excludes Prospect.
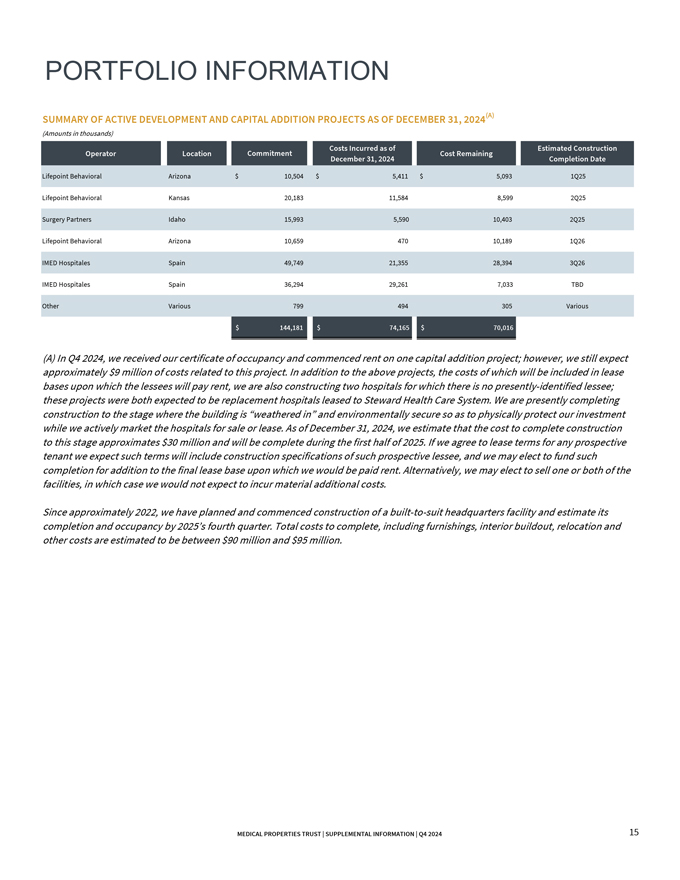
PORTFOLIO INFORMATION SUMMARY OF ACTIVE DEVELOPMENT AND CAPITAL ADDITION PROJECTS AS OF DECEMBER 31, 2024(A)(Amounts in thousands)Costs Incurred as of Estimated Construction Operator Location Commitment Cost Remaining December 31, 2024 Completion DateLifepoint Behavioral Arizona $ 10,504 $ 5,411 $ 5,093 1Q25 Lifepoint Behavioral Kansas 20,183 11,584 8,599 2Q25 Surgery Partners Idaho 15,993 5,590 10,403 2Q25 Lifepoint Behavioral Arizona 10,659 470 10,189 1Q26 IMED Hospitales Spain 49,749 21,355 28,394 3Q26 IMED Hospitales Spain 36,294 29,261 7,033 TBD Other Various 799 494 305 Various $ 144,181 $ 74,165 $ 70,016 (A) In Q4 2024, we received our certificate of occupancy and commenced rent on one capital addition project; however, we still expect approximately $9 million of costs related to this project. In addition to the above projects, the costs of which will be included in lease bases upon which the lessees will pay rent, we are also constructing two hospitals for which there is no presently-identified lessee; these projects were both expected to be replacement hospitals leased to Steward Health Care System. We are presently completing construction to the stage where the building is “weathered in” and environmentally secure so as to physically protect our investment while we actively market the hospitals for sale or lease. As of December 31, 2024, we estimate that the cost to complete construction to this stage approximates $30 million and will be complete during the first half of 2025. If we agree to lease terms for any prospective tenant we expect such terms will include construction specifications of such prospective lessee, and we may elect to fund such completion for addition to the final lease base upon which we would be paid rent. Alternatively, we may elect to sell one or both of the facilities, in which case we would not expect to incur material additional costs.Since approximately 2022, we have planned and commenced construction of a built-to-suit headquarters facility and estimate its completion and occupancy by 2025’s fourth quarter. Total costs to complete, including furnishings, interior buildout, relocation and other costs are estimated to be between $90 million and $95 million.
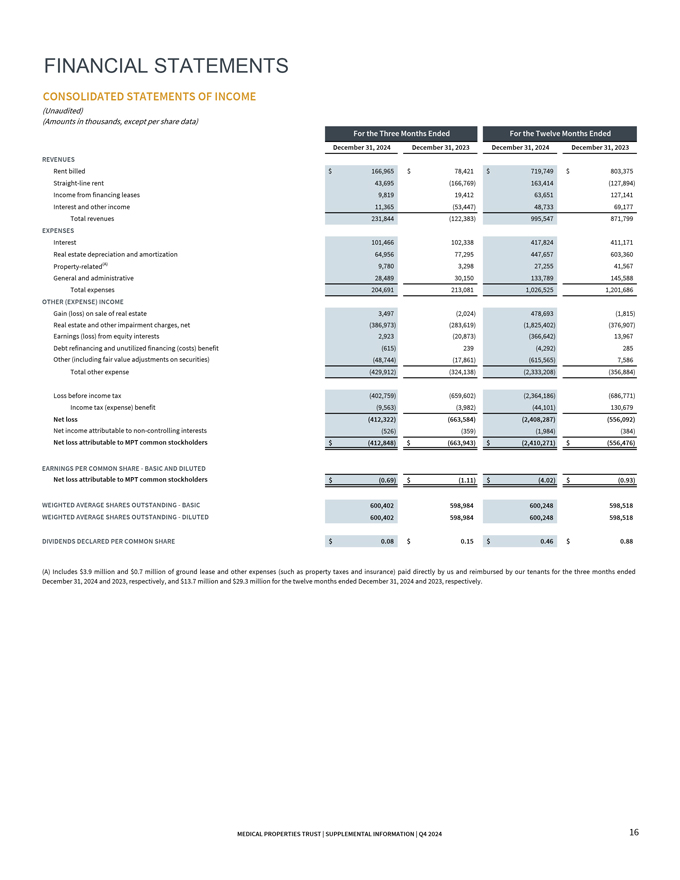
FINANCIAL STATEMENTS CONSOLIDATED STATEMENTS OF INCOME(Unaudited)(Amounts in thousands, except per share data)For the Three Months Ended For the Twelve Months EndedDecember 31, 2024 December 31, 2023 December 31, 2024 December 31, 2023 REVENUESRent billed $ 166,965 $ 78,421 $ 719,749 $ 803,375 Straight-line rent 43,695 (166,769) 163,414 (127,894) Income from financing leases 9,819 19,412 63,651 127,141 Interest and other income 11,365 (53,447) 48,733 69,177 Total revenues 231,844 (122,383) 995,547 871,799EXPENSESInterest 101,466 102,338 417,824 411,171 Real estate depreciation and amortization 64,956 77,295 447,657 603,360 Property-related(A) 9,780 3,298 27,255 41,567 General and administrative 28,489 30,150 133,789 145,588 Total expenses 204,691 213,081 1,026,525 1,201,686OTHER (EXPENSE) INCOMEGain (loss) on sale of real estate 3,497 (2,024) 478,693 (1,815) Real estate and other impairment charges, net (386,973) (283,619) (1,825,402) (376,907) Earnings (loss) from equity interests 2,923 (20,873) (366,642) 13,967 Debt refinancing and unutilized financing (costs) benefit (615) 239 (4,292) 285 Other (including fair value adjustments on securities) (48,744) (17,861) (615,565) 7,586 Total other expense (429,912) (324,138) (2,333,208) (356,884)Loss before income tax (402,759) (659,602) (2,364,186) (686,771) Income tax (expense) benefit (9,563) (3,982) (44,101) 130,679Net loss (412,322) (663,584) (2,408,287) (556,092)Net income attributable to non-controlling interests (526) (359) (1,984) (384)Net loss attributable to MPT common stockholders $ (412,848) $ (663,943) $ (2,410,271) $ (556,476)EARNINGS PER COMMON SHARE—BASIC AND DILUTEDNet loss attributable to MPT common stockholders $ (0.69) $ (1.11) $ (4.02) $ (0.93)WEIGHTED AVERAGE SHARES OUTSTANDING—BASIC 600,402 598,984 600,248 598,518 WEIGHTED AVERAGE SHARES OUTSTANDING—DILUTED 600,402 598,984 600,248 598,518 $ —$ -DIVIDENDS DECLARED PER COMMON SHARE $ 0.08 $ 0.15 $ 0.46 $ 0.88(A) Includes $3.9 million and $0.7 million of ground lease and other expenses (such as property taxes and insurance) paid directly by us and reimbursed by our tenants for the three months ended December 31, 2024 and 2023, respectively, and $13.7 million and $29.3 million for the twelve months ended December 31, 2024 and 2023, respectively.

FINANCIAL STATEMENTS CONSOLIDATED BALANCE SHEETS(Amounts in thousands, except per share data)December 31, 2024 December 31, 2023(Unaudited) (A) ASSETSReal estate assetsLand, buildings and improvements, intangible lease assets, and other $ 11,259,842 $ 13,237,187 Investment in financing leases 1,057,770 1,231,630 Real estate held for sale 34,019 -Mortgage loans 119,912 309,315Gross investment in real estate assets 12,471,543 14,778,132Accumulated depreciation and amortization (1,422,948) (1,407,971)Net investment in real estate assets 11,048,595 13,370,161Cash and cash equivalents 332,335 250,016 Interest and rent receivables 36,327 45,059 Straight-line rent receivables 700,783 635,987 Investments in unconsolidated real estate joint ventures 1,156,397 1,474,455 Investments in unconsolidated operating entities 439,578 1,778,640 Other loans 109,175 292,615 Other assets 471,404 457,911Total Assets $ 14,294,594 $ 18,304,844LIABILITIES AND EQUITY LiabilitiesDebt, net $ 8,848,112 $ 10,064,236 Accounts payable and accrued expenses 454,209 412,178 Deferred revenue 29,445 37,962 Obligations to tenants and other lease liabilities 129,045 156,603 Total Liabilities 9,460,811 10,670,979Equity Preferred stock, $0.001 par value. Authorized 10,000 shares; no shares outstanding — -Common stock, $0.001 par value. Authorized 750,000 shares; issued and outstanding —600,403 shares at December 31, 2024 and 598,991 shares at December 31, 2023 600 599 Additional paid-in capital 8,584,917 8,560,309 Retained deficit (3,658,516) (971,809) Accumulated other comprehensive (loss) income (94,272) 42,501 Total Medical Properties Trust, Inc. Stockholders’ Equity 4,832,729 7,631,600 Non-controlling interests 1,054 2,265Total Equity 4,833,783 7,633,865Total Liabilities and Equity $ 14,294,594 $ 18,304,844(A) Financials have been derived from the prior year audited financial statements.

FINANCIAL STATEMENTSINVESTMENTS IN UNCONSOLIDATED REAL ESTATE JOINT VENTURES(As of and for the three months ended December 31, 2024) (Unaudited) ($ amounts in thousands)Swiss Medical HM MEDIAN(B) (C) CommonSpirit(D) Policlinico di Monza(E) (F) Total MPT Pro Rata Share Network HospitalesGross real estate $ 1,843,219 $ 1,563,851 $ 1,264,657 $ 173,551 $ 350,554 $ 5,195,832 $ 2,576,995 Cash 35,433 2,934 48 11,507 2,010 51,932 26,440 Accumulated depreciation and amortization (271,610) (180,192) — (35,213) (37,975) (524,990) (296,635) Other assets 60,426 63,719 11,738 5,200 9,061 150,144 84,428Total Assets $ 1,667,468 $ 1,450,312 $ 1,276,443 $ 155,045 $ 323,650 $ 4,872,918 $ 2,391,228Debt (third party) $ 677,252 $ 647,838 $ 770,000 $ — $ 134,058 $ 2,229,148 $ 1,044,939 Other liabilities 126,288 111,374 53,636 (139) 78,771 369,930 189,892(A)Equity and shareholder loans 863,928 691,100 452,807 155,184 110,821 2,273,840 1,156,397Total Liabilities and Equity $ 1,667,468 $ 1,450,312 $ 1,276,443 $ 155,045 $ 323,650 $ 4,872,918 $ 2,391,228MPT share of real estate joint venture 50% 70% 25% 50% 45%Total $ 431,964 $ 483,770 $ 113,202 $ 77,592 $ 49,869 $ 1,156,397 Swiss Medical HM MEDIAN(B) (C) CommonSpirit(D) Policlinico di Monza(E) (F) Total MPT Pro Rata Share Network HospitalesTotal revenues $ 32,962 $ 21,753 $ 24,141 $ 5,153 $ 3,783 $ 87,792 $ 42,035Other expenses (income):Property-related $ 623 $ 1,503 $ 43 $ 1,028 $ 65 $ 3,262 $ 1,917 Interest 13,101 3,821 13,163 — 525 30,610 12,759 Real estate depreciation and amortization 11,154 10,453 — 1,022 2,015 24,644 14,312 General and administrative 929 301 — (49) 14 1,195 657 Fair value adjustments — — 26,180 — — 26,180 6,558 Non-controlling interest expense — — (26) — — (26) (6) Income taxes 4,379 813 — — 297 5,489 2,893Total other expenses (income) $ 30,186 $ 16,891 $ 39,360 $ 2,001 $ 2,916 $ 91,354 $ 39,090Net Income $ 2,776 $ 4,862 $ (15,219) $ 3,152 $ 867 $ (3,562) $ 2,945 MPT share of real estate joint venture 50% 70% 25% 50% 45%Earnings (loss) from equity interests $ 1,388 $ 3,403 $ (3,812) $ 1,576 $ 390 $ 2,945 (G)(A) Includes a €309 million loan from both shareholders.(B) MPT managed joint venture of 71-owned German facilities that are fully leased.(C) Represents ownership in Infracore, which owns and leases 17 Switzerland facilities. We also have two Infracore facilities currently under development.(D) On April 12, 2024, we closed a joint venture on five properties in Utah operated by CommonSpirit for which we hold a 25% interest accounted for under the equity method. We are recording our share of income on a quarterly lag basis. The joint venture elected to apply specialized accounting and reporting for investment companies under Topic 946, which measures the underlying investments at fair value. For this quarter, our share of the joint venture’s unfavorable fair value adjustment was ($6.6) million, primarily related to the interest rate swap.(E) Represents ownership in eight Italian facilities that are fully leased. (F) Represents ownership in two Spanish facilities that are fully leased. (G) Excludes amortization of equity investment costs.
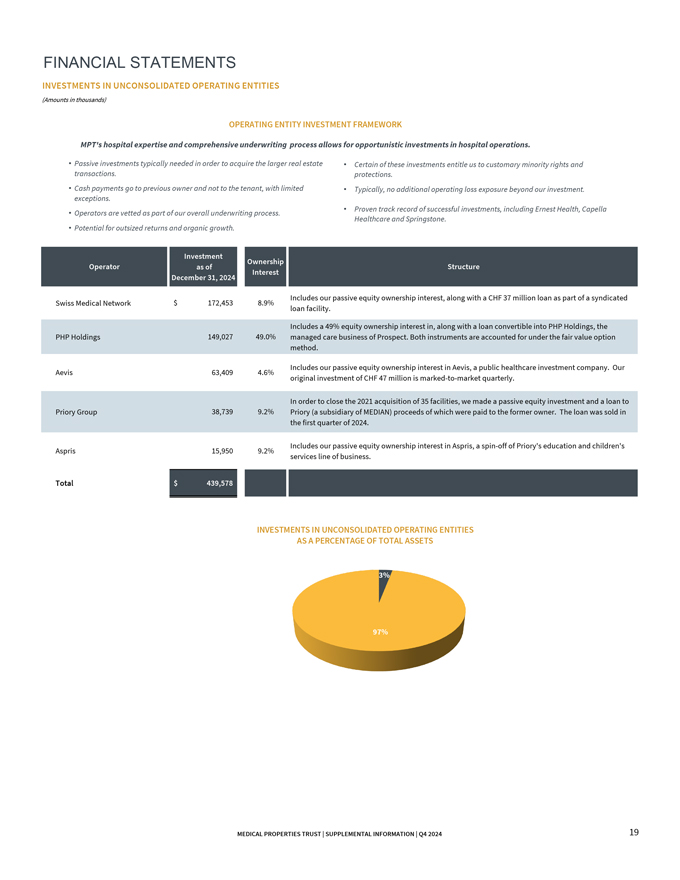
FINANCIAL STATEMENTS INVESTMENTS IN UNCONSOLIDATED OPERATING ENTITIES(Amounts in thousands)OPERATING ENTITY INVESTMENT FRAMEWORKMPT’s hospital expertise and comprehensive underwriting process allows for opportunistic investments in hospital operations.• Passive investments typically needed in order to acquire the larger real estate • Certain of these investments entitle us to customary minority rights and transactions. protections.• Cash payments go to previous owner and not to the tenant, with limited • Typically, no additional operating loss exposure beyond our investment. exceptions.• Proven track record of successful investments, including Ernest Health, Capella • Operators are vetted as part of our overall underwriting process.Healthcare and Springstone. • Potential for outsized returns and organic growth.Investment Ownership Operator as of Structure Interest December 31, 2024Includes our passive equity ownership interest, along with a CHF 37 million loan as part of a syndicated Swiss Medical Network $ 172,453 8.9% loan facility. Includes a 49% equity ownership interest in, along with a loan convertible into PHP Holdings, the PHP Holdings 149,027 49.0% managed care business of Prospect. Both instruments are accounted for under the fair value option method.Includes our passive equity ownership interest in Aevis, a public healthcare investment company. Our Aevis 63,409 4.6% original investment of CHF 47 million is marked-to-market quarterly.In order to close the 2021 acquisition of 35 facilities, we made a passive equity investment and a loan to Priory Group 38,739 9.2% Priory (a subsidiary of MEDIAN) proceeds of which were paid to the former owner. The loan was sold in the first quarter of 2024. Includes our passive equity ownership interest in Aspris, a spin-off of Priory’s education and children’s Aspris 15,950 9.2% services line of business. Total $ 439,578INVESTMENTS IN UNCONSOLIDATED OPERATING ENTITIES AS A PERCENTAGE OF TOTAL ASSETS7%3%97%

APPENDIX—NON-GAAP RECONCILIATIONSADJUSTED NET DEBT/ANNUALIZED EBITDAre(Unaudited)(Amounts in thousands)For the Three Months Ended December 31, 2024ADJUSTED EBITDAre RECONCILIATIONNet loss $ (412,322)Add back:Interest 101,466 Income tax 9,563 Depreciation and amortization 66,204 Gain on sale of real estate (3,497) Real estate impairment charges 300,987 Adjustment to reflect MPT’s share of unlevered EBITDAre from unconsolidated real estate joint ventures(A) 8,3424Q 2024 EBITDAre $ 70,743 Share-based compensation 2,321 Write-off of billed and unbilled rent and other (332) Other impairment charges, net 85,986 Litigation and other 4,801 Debt refinancing and unutilized financing costs 615Non-cash fair value adjustments 52,194 Annualized4Q 2024 Adjusted EBITDAre $ 216,328 $ 865,312 Adjustments for mid-quarter investment activity(B) 494Q 2024 Transaction Adjusted EBITDAre $ 216,377 $ 865,508ADJUSTED NET DEBT RECONCILIATION Total debt at December 31, 2024 $ 8,848,112 Less: Cash at December 31, 2024 (332,335) Less: Cash funded for development and capital addition projects at December 31, 2024(C) (435,095) Adjusted Net Debt $ 8,080,682Investors and analysts following the real estate industry utilize net debt (debt less cash) to EBITDAre as a measurement of leverage that shows how many years it would take for us to pay back our debt, assuming net debt and EBITDAre are held constant. In our calculation, we start with EBITDAre , as defined by Nareit, which is net income before interest expense, income tax expense, depreciation and amortization, losses/gains on disposition of depreciated property, impairment losses, and adjustments to reflect our share of EBITDAre from unconsolidated real estate joint ventures. We then adjust EBITDAre for non-cash share-based compensation, non-cash fair value adjustments and other items that would make comparison of our operating results with prior periods and other companies more meaningful, to derive Adjusted EBITDAre . We adjust net debt for cash funded for building improvements in progress and construction in progress for which we are not yet receiving rent to derive Adjusted Net Debt. We adjust Adjusted EBITDAre for the effects from investments and capital transactions that were completed during the period, assuming such transactions were consummated/fully funded as of the beginning of the period to derive Transaction Adjusted EBITDAre . Although non-GAAP measures, we believe Adjusted Net Debt, Adjusted EBITDAre , and Transaction Adjusted EBITDAre are useful to investors and analysts as they allow for a more current view of our credit quality and allow for the comparison of our credit strength between periods and to other real estate companies without the effect of items that by their nature are not comparable from period to period. (A) Includes only the unlevered portion of our share of EBITDAre from unconsolidated real estate joint ventures, as we have excluded any net debt from our unconsolidated real estate joint ventures in the Adjusted Net Debt line. We believe this adjustment is needed to appropriately reflect the relationship between EBITDAre and net debt.(B) Reflects a full quarter impact from our mid-quarter investments, disposals, and loan payoffs.(C) Reflects development and capital improvement projects that are in process and not yet generating a cash return.

1000 Urban Center Drive, Suite 501 Birmingham, AL 35242 (205) 969-3755 NYSE: MPW www.medicalpropertiestrust.comContact:Drew Babin, Head of Financial Strategy and Investor Relations (646) 884-9809 or [email protected] orTim Berryman, Managing Director of Investor Relations (205) 397-8589 or [email protected]