NAGE 8-K
Niagen Bioscience, Inc. (NAGE)
8-K
2021-03-10
For: 2021-03-10
View Original
Added on
April 10, 2026
UNITED STATES
SECURITIES AND EXCHANGE COMMISSION
WASHINGTON, D.C. 20549
____________
FORM 8-K
CURRENT
REPORT
PURSUANT TO SECTION 13 OR 15(d) OF THE
SECURITIES
EXCHANGE ACT OF 1934
Date of
Report (Date of earliest event reported): March 10,
2021
(Exact name of registrant as specified in its
charter)
|
|
|
|
|
(State
or other jurisdiction of incorporation)
|
(Commission
File Number)
|
(IRS
Employer Identification No.)
|
(Address
of principal executive offices, including zip code)
(Registrant's telephone number, including area
code)
Check
the appropriate box below if the Form 8-K filing is intended to
simultaneously satisfy the filing obligation of the registrant
under any of the following provisions:
Securities
registered pursuant to Section 12(b) of the Act:
|
Title
of each class
|
Trading
Symbol(s)
|
Name of
each exchange on which registered
|
|
|
|
The
|
Indicate by check
mark whether the registrant is an emerging growth company as
defined in Rule 405 of the
Securities Act of 1933 (§230.405 of this chapter) or
Rule 12b-2 of the
Securities Exchange Act of 1934 (§240.12b-2 of this
chapter).
Emerging growth
company ☐
If an
emerging growth company, indicate by check mark if the registrant
has elected not to use the extended transition period for complying
with any new or revised financial accounting standards provided
pursuant to Section 13(a) of the Exchange Act. ☐
|
Item 2.02.
|
Results of Operations and Financial Condition.
|
On
March 10, 2021, ChromaDex Corporation (the “Company”)
issued a press release announcing its earnings for the quarter and
the year ended December 31, 2020. A copy of the press release is
attached hereto as Exhibit 99.1.
The
information in this Item 2.02 and the exhibit hereto are being
furnished and shall not be deemed to be “filed” for
purposes of Section 18 of the Securities Exchange Act of 1934, as
amended (the “Exchange Act”), or otherwise subject to
the liability of that section, nor shall they be deemed
incorporated by reference in any filing under the Securities Act of
1933, as amended, or the Exchange Act, except as expressly set
forth by specific reference in such filing.
|
Item 7.01.
|
Regulation FD Disclosure.
|
On
March 10, 2021, the Company released a corporate presentation which
it made available on its website. A copy of the corporate
presentation is attached hereto as Exhibit 99.2.
The
information in this Item 7.01 and the exhibit hereto are being
furnished and shall not be deemed to be “filed” for
purposes of Section 18 of the Exchange Act, or otherwise subject to
the liability of that section, nor shall they be deemed
incorporated by reference in any filing under the Securities Act of
1933, as amended, or the Exchange Act, except as expressly set
forth by specific reference in such filing.
Item 9.01 Financial Statements and Exhibits.
(d) Exhibits.
|
Exhibit Number
|
|
Description
|
|
|
|
|
|
|
Press
Release dated March 10, 2021
|
|
|
|
Investor
Presentation of ChromaDex Corporation
|
|
|
104
|
|
Cover
Page Interactive Data File (embedded within the Inline XBRL
document)
|
|
|
|
|
SIGNATURES
Pursuant to the
requirements of the Securities Exchange Act of 1934, the registrant
has duly caused this report to be signed on its behalf by the
undersigned hereunto duly authorized.
|
|
|
|
|
|
|
|
|
|
|
|
|
CHROMADEX CORPORATION
|
||
|
|
|
|
||||
|
Dated:
March 10, 2021
|
|
|
|
|
||
|
|
|
|
|
|||
|
|
|
|
|
By:
|
|
/s/
Kevin M.
Farr
|
|
|
|
|
|
|
|
Name:
Kevin M. Farr
|
|
|
|
|
|
|
|
Chief
Financial Officer
|
Exhibit 99.1
ChromaDex Corporation Reports 2020 Financial Results
Revenue for the Three-Month Period Ended December 31, 2020 Totals
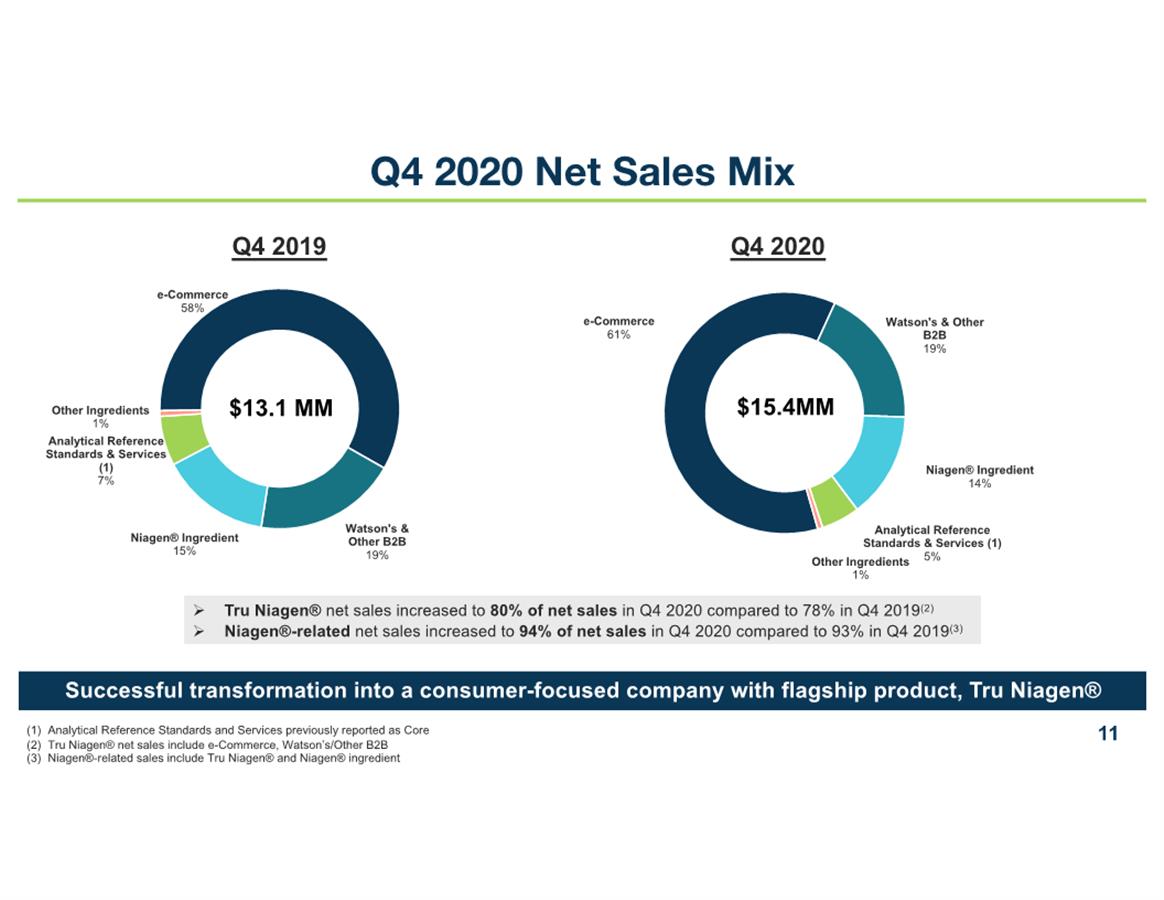
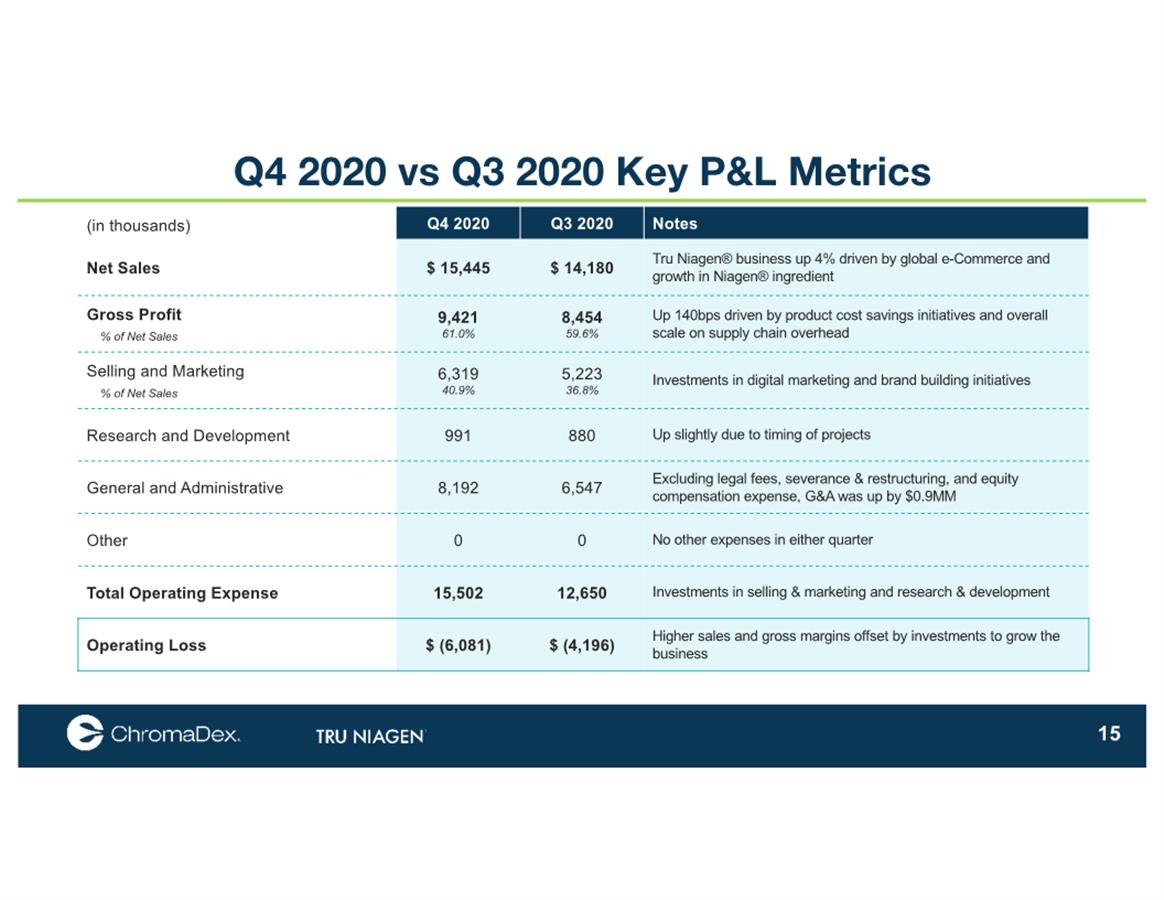
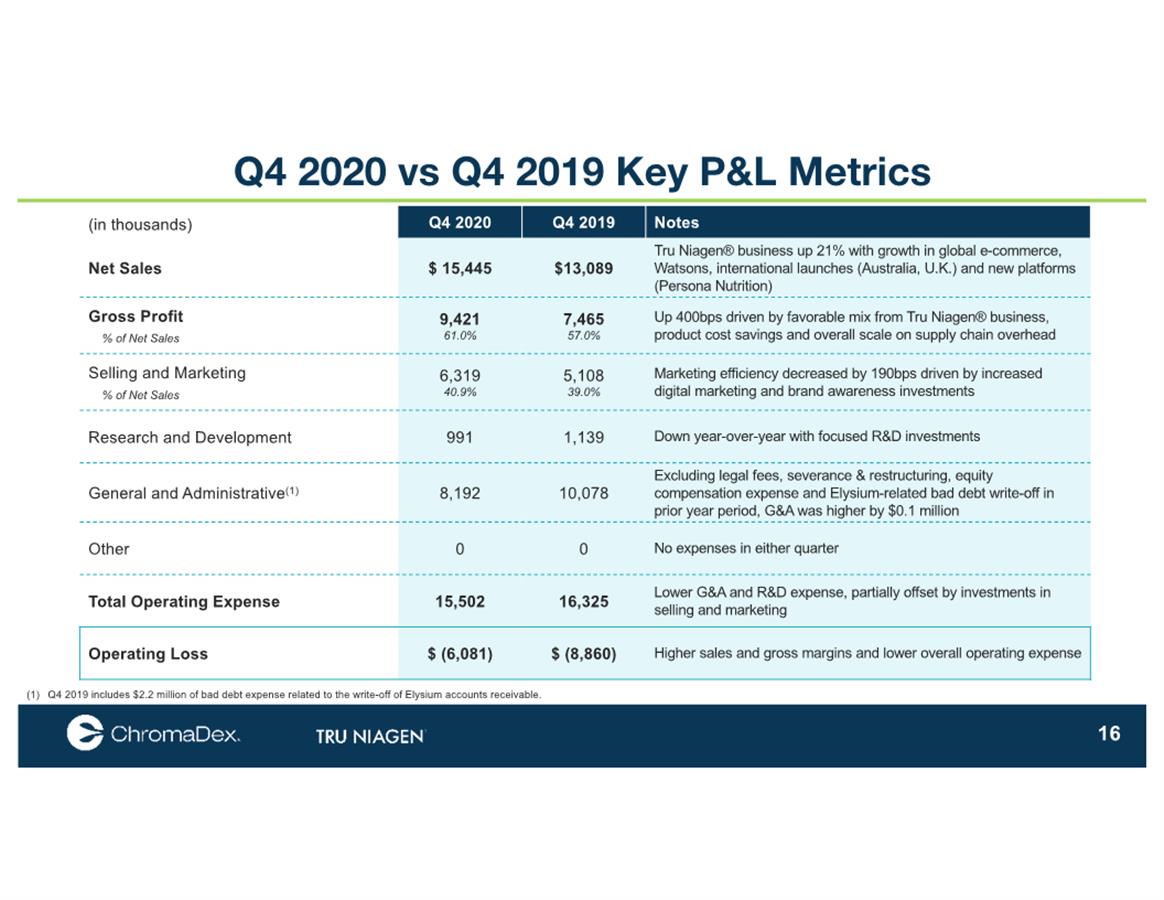
$15.4 Million, up 18% Year-over-Year, with
Gross Margin of 61.0%, and Lower Operating Expenses. Full Year
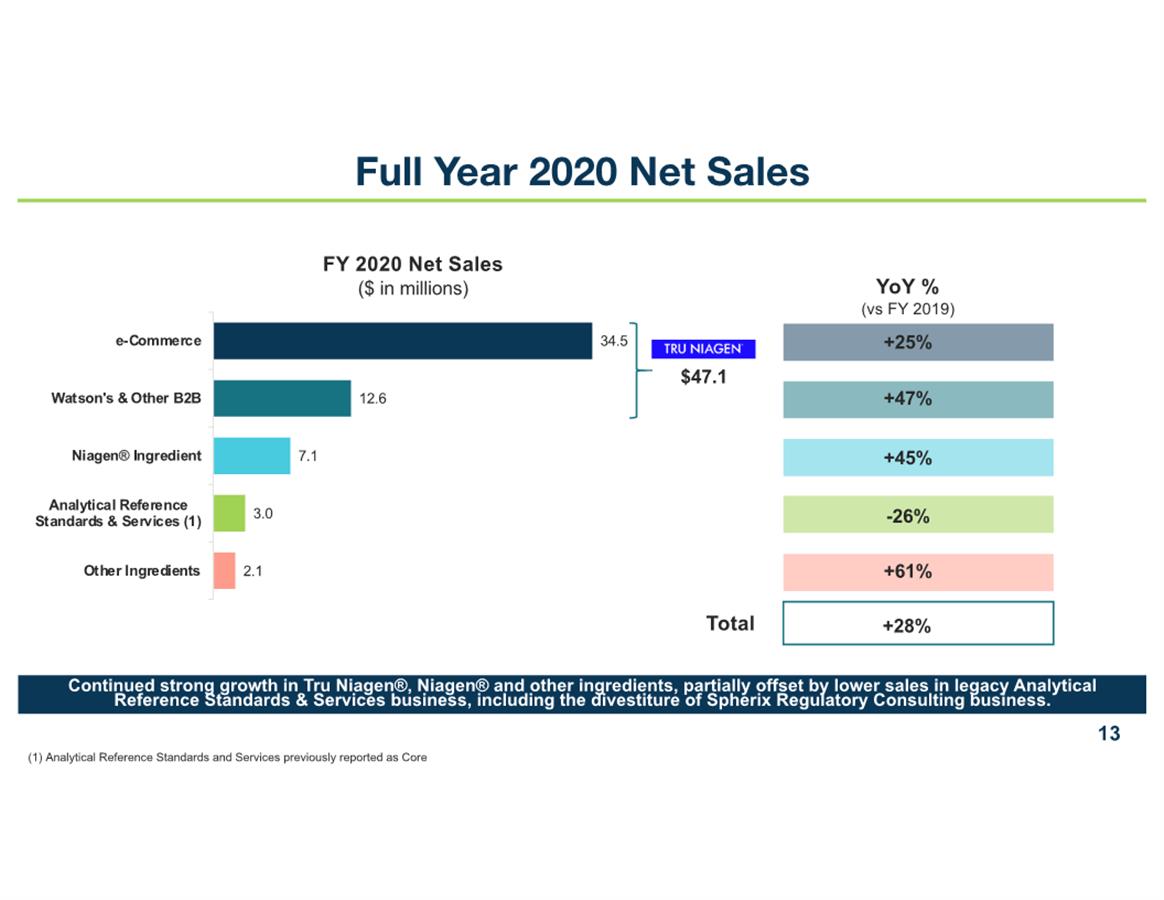
Revenue of $59.3 Million, with $47.1 Million from Tru
Niagen®.
LOS ANGELES, March 10, 2021 (GLOBE NEWSWIRE) - ChromaDex Corp. (NASDAQ:CDXC)
today
reported fourth quarter and full year 2020 financial
results.
Fourth Quarter 2020 and Recent Highlights
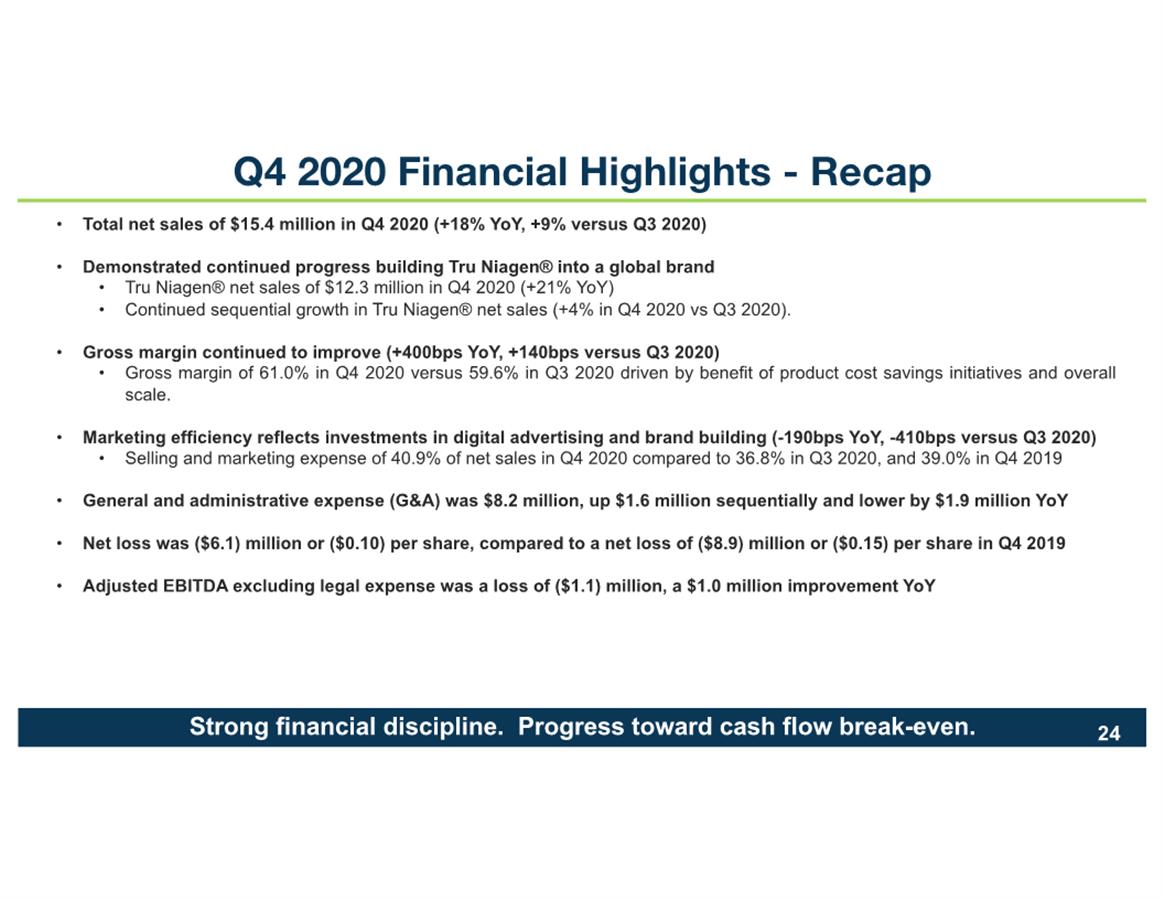
●
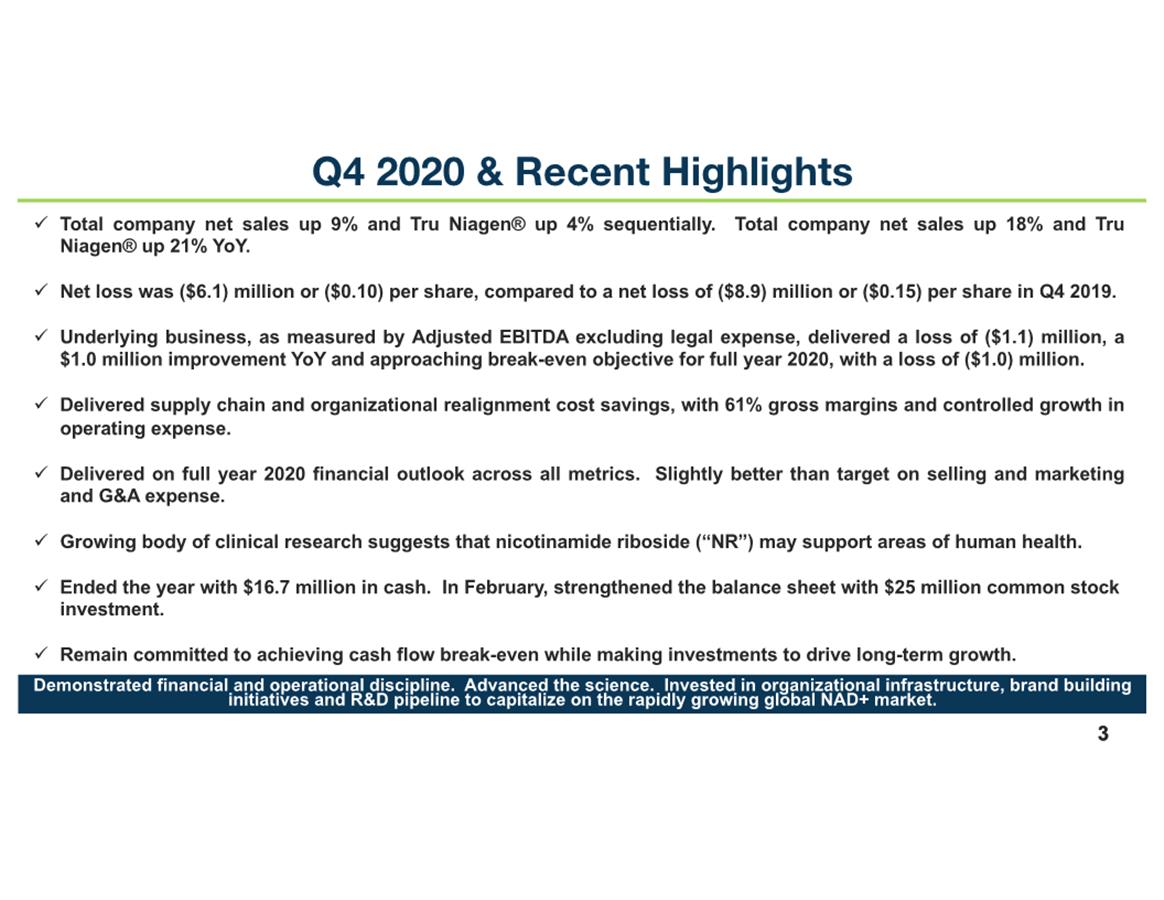
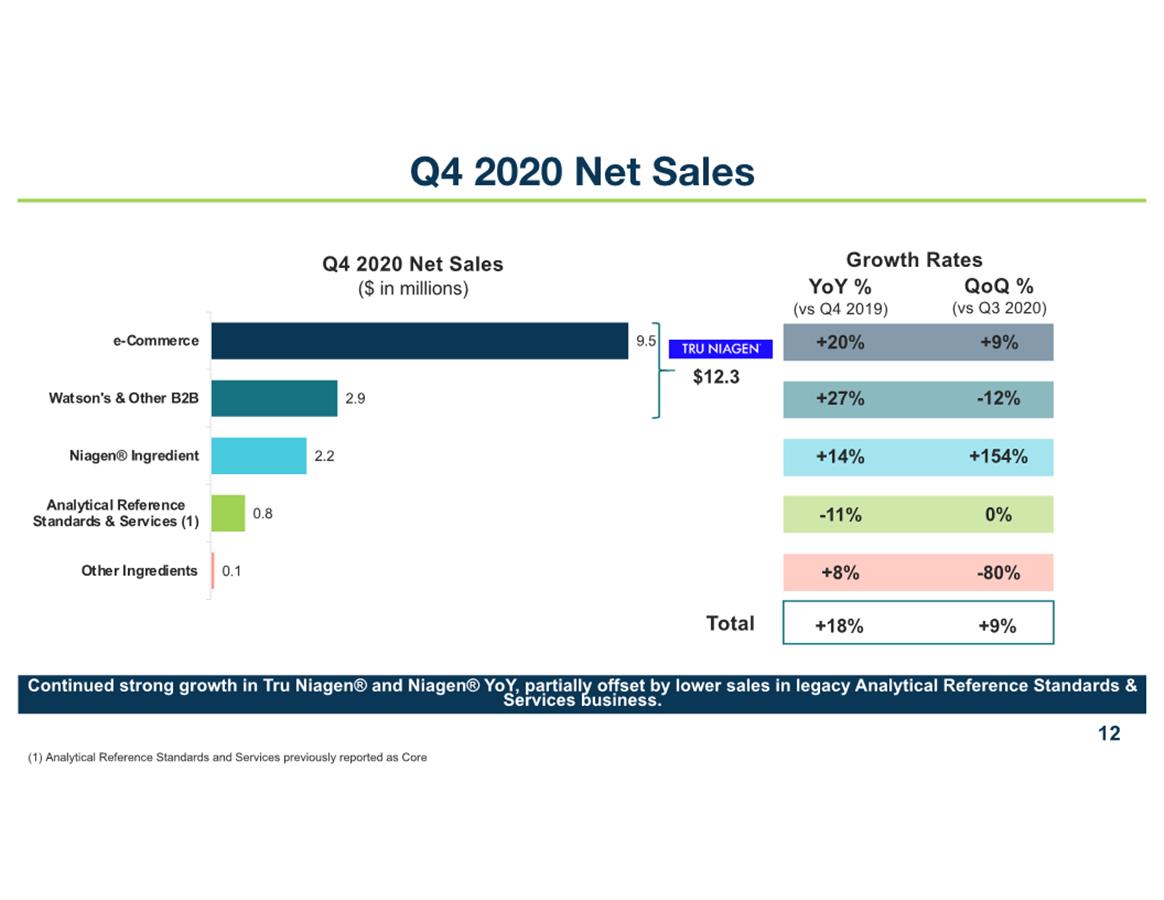
Total net sales of $15.4 million, up 18% from $13.1 million in the
year ago quarter.
●
Tru Niagen® net sales of $12.3 million, a 21% increase from
the year ago quarter.
●
Gross margin of 61.0%, a 400 basis point increase from the year ago
quarter.
●
Net loss was ($6.1) million or ($0.10) per share, an improvement of
$0.05 per share year-over-year.
●
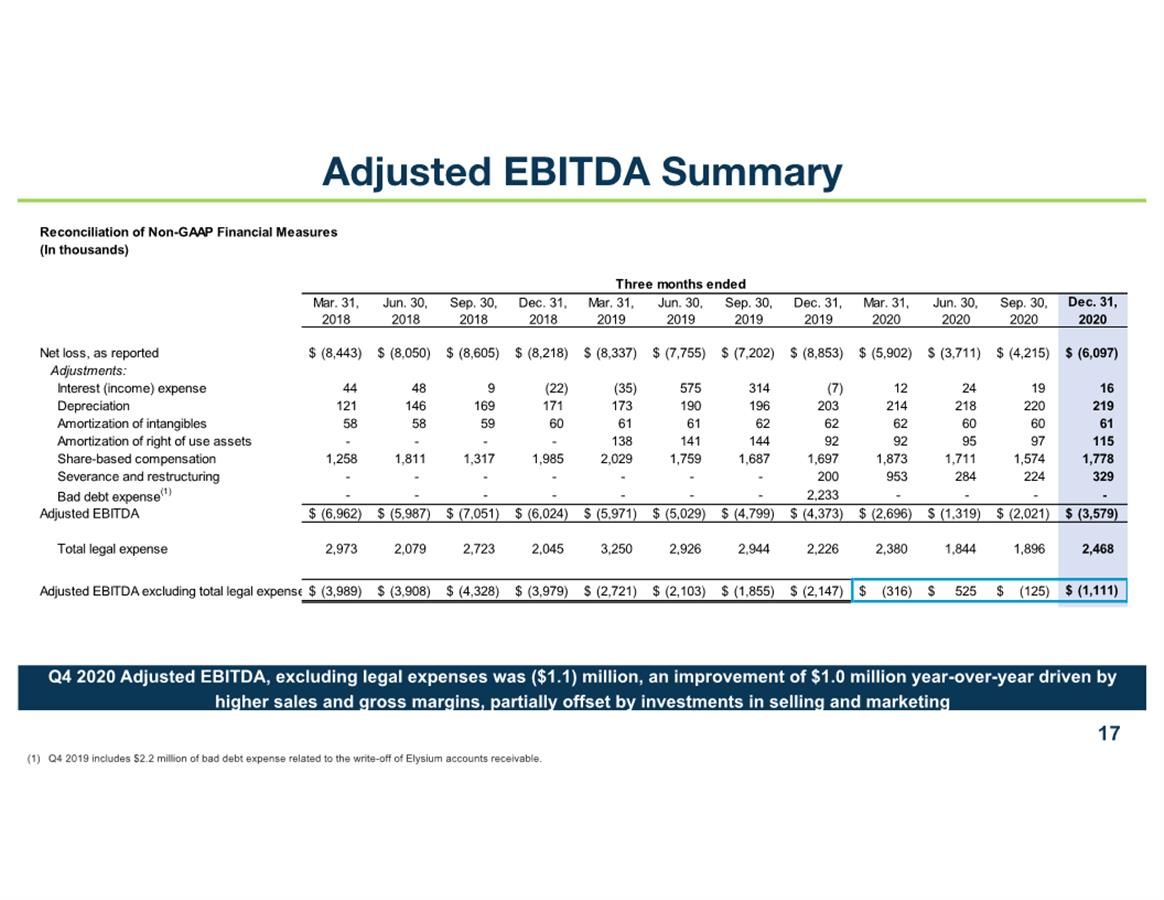
Adjusted EBITDA
excluding total legal expense, a non-GAAP measure, was a loss of
($1.1) million, a $1.0 million improvement
year-over-year.
●
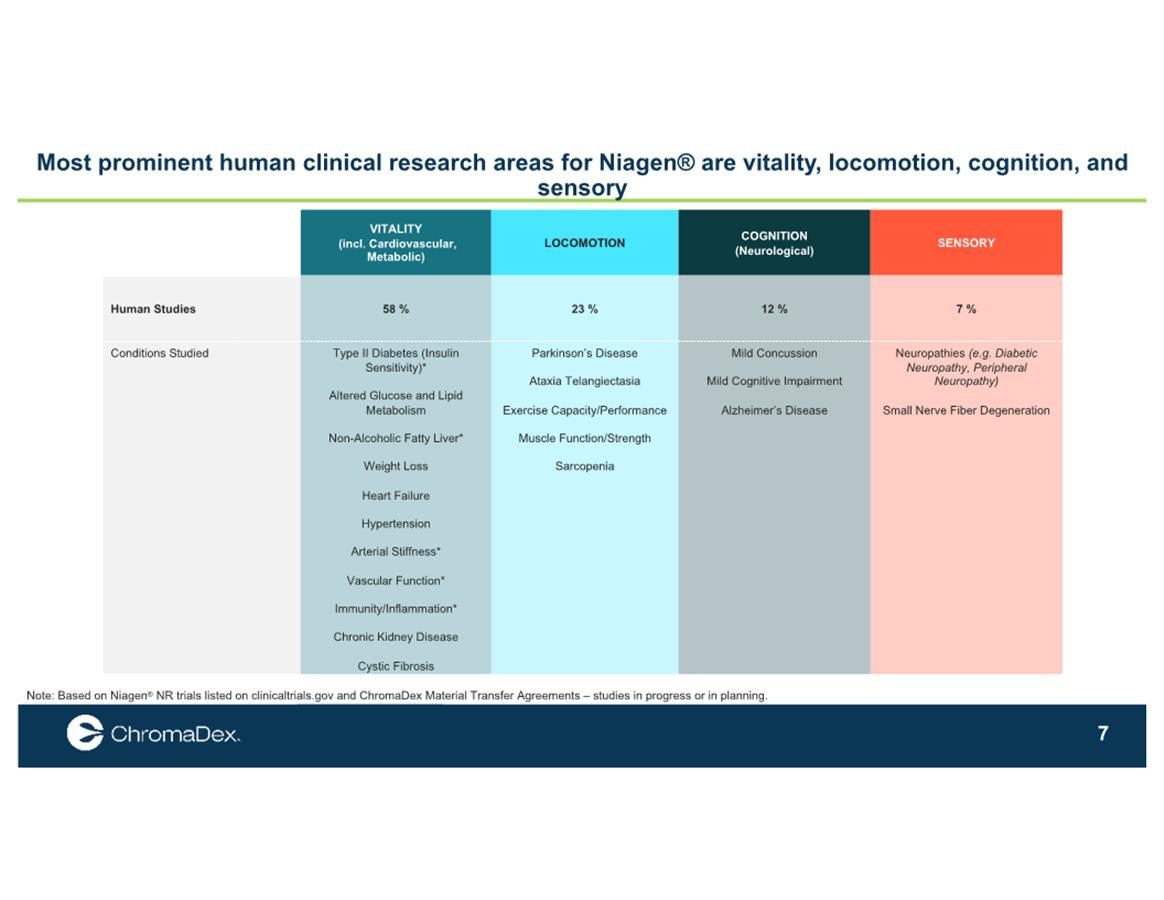
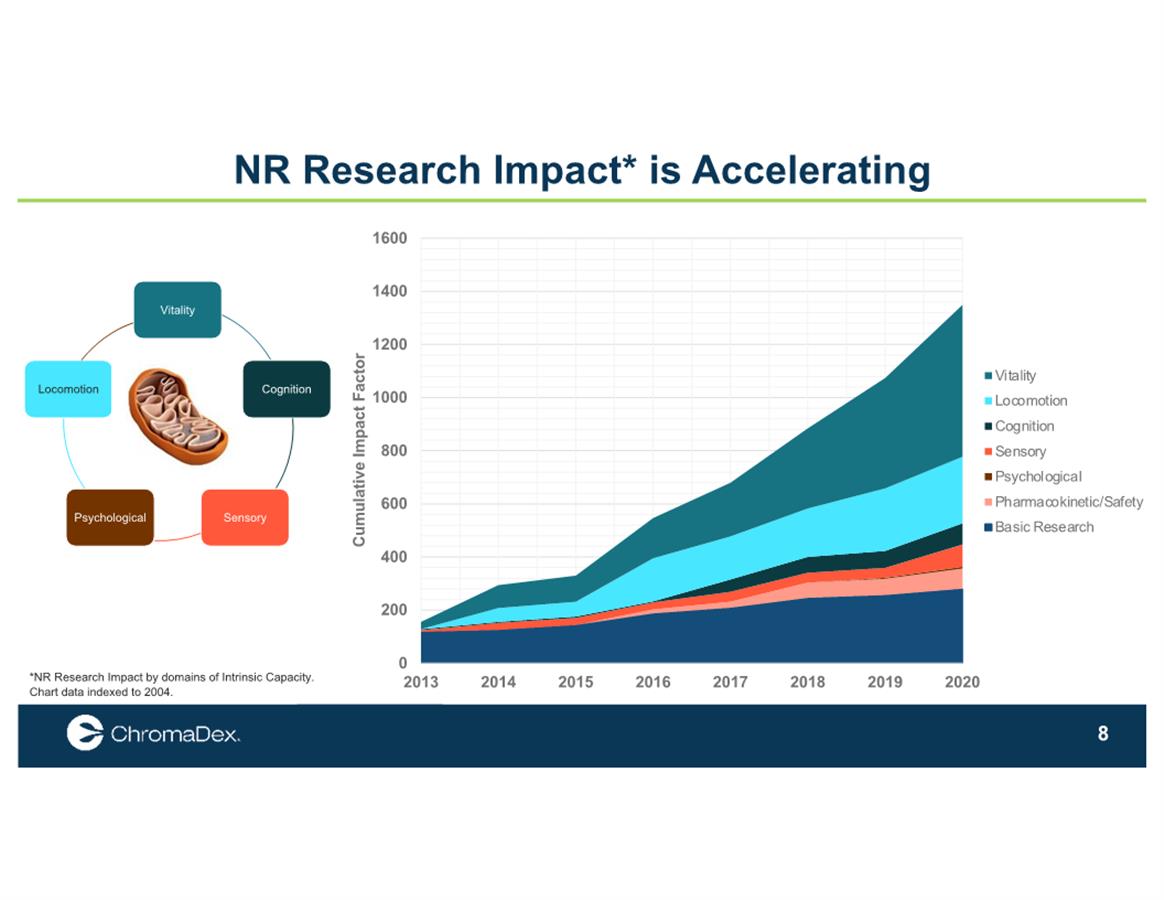
Growing body of
clinical research suggests that nicotinamide riboside
(“NR”) may support important areas of human
health.
●
Phase 2 clinical
study showed a reduction in liver fat and inflammatory markers in
patients with non-alcoholic fatty liver disease (NAFLD) when
receiving a nutritional protocol that included NR.
●
Phase 3 clinical
study on 300 patients in Turkey with mild-to-moderate COVID-19
showed a 3.5 day reduction in recovery time when adding a daily
nutritional protocol that included NR to the local standard of
care.
●
Tru
Niagen® received the
‘Most Favourite Brand’ award by Watsons Hong Kong
loyalty members for the second consecutive year.
Full Year 2020 Highlights
●
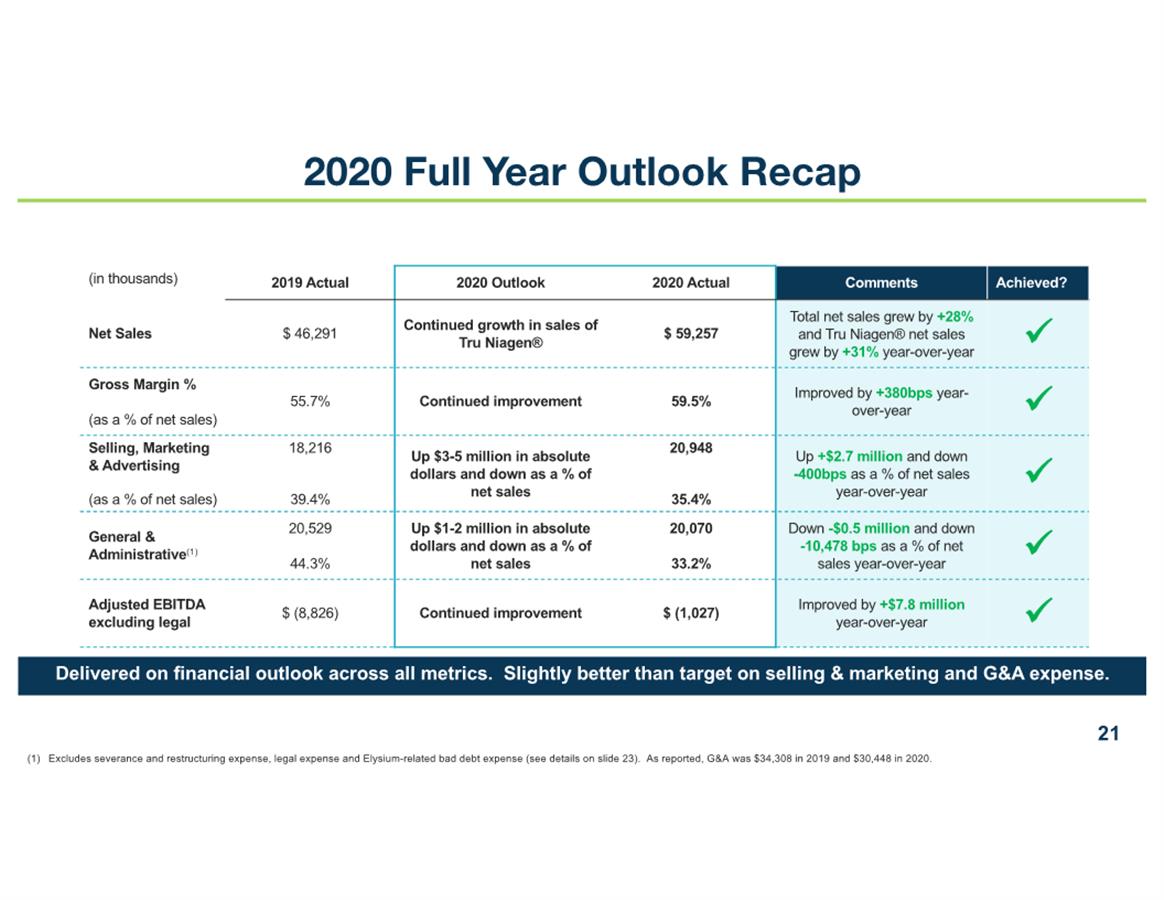
Delivered on financial outlook to investors across all metrics.
Slightly better than target on selling and marketing and G&A
expense.
●
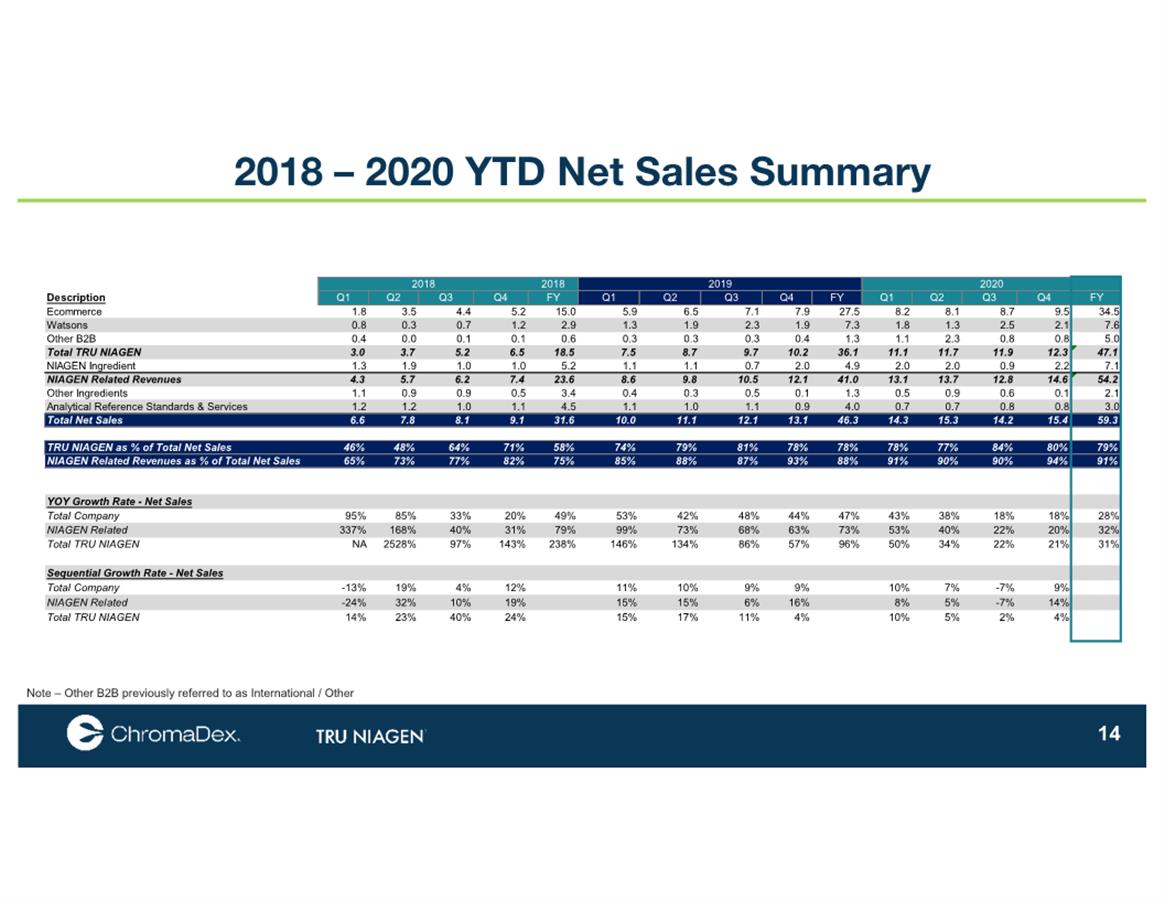
Total net sales of $59.3 million, up 28% from $46.3 million in the
prior year.
●
Tru Niagen® net sales of
$47.1 million, a 31% increase from $36.1 million in the prior
year.
●
Gross margins of 59.5%, a 390 basis point increase from the prior
year.
●
Lower selling and marketing expense as a percentage of net sales
(35.4% in 2020 versus 39.4% in 2019).
●
Net loss was ($19.9) million or ($0.33) per share, an improvement
of $0.24 per share year-over-year.
●
Adjusted EBITDA
excluding total legal expense, a non-GAAP measure, was a loss of
($1.0) million for FY 2020, a $7.8 million improvement
year-over-year.
●
Expanded in Europe and Australia, following regulatory approval for
Tru Niagen®.
●
Nestlé Health Science’s new Celltrient™ Cellular
Energy products featuring Tru Niagen® launched in the
United States, following the launch of Tru Niagen® capsules on
Persona, a Nestlé Health Science company and leading
personalized vitamin subscription program, earlier this
year.
●
ChromaDex Chief
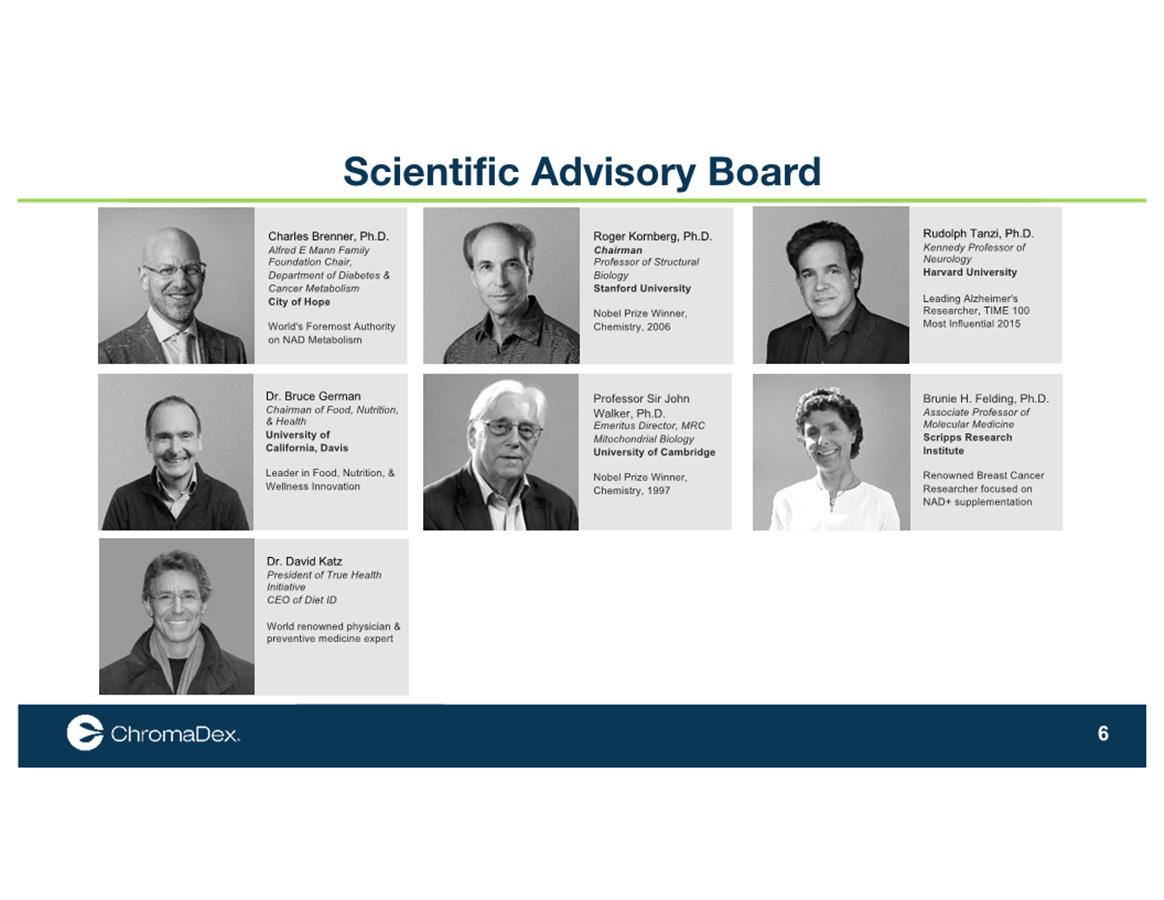
Scientific Advisor, Dr. Charles Brenner, Receives 2020 National
Scientific Achievement Award from the American Society for
Nutrition.
“ChromaDex’s
philosophy of focusing on business fundamentals with a
science-based strategic approach continued in 2020,” said
ChromaDex CEO Rob Fried. “In 2021, we will further our
position as the world's leading NAD+ company by
growing the Tru Niagen brand, extending partnerships and furthering
scientific advancements with world-leading
scientists."
Results of operations for the three months ended December 31,
2020
For the
three months ended December 31, 2020 (“Q4 2020”),
ChromaDex reported net sales of $15.4 million, up 18% compared to
$13.1 million in the fourth quarter of 2019 ("Q4 2019"). The
increase in Q4 2020 revenues was driven by growth in sales of Tru
Niagen® and Niagen® ingredient
revenues.
Gross
margin percentage improved by 400 basis points to 61.0% in Q4 2020
compared to 57.0% in Q4 2019. The improvement in gross margin
percentage was driven by the positive impact of increased Tru
Niagen® consumer
product sales and product cost savings initiatives.
Operating
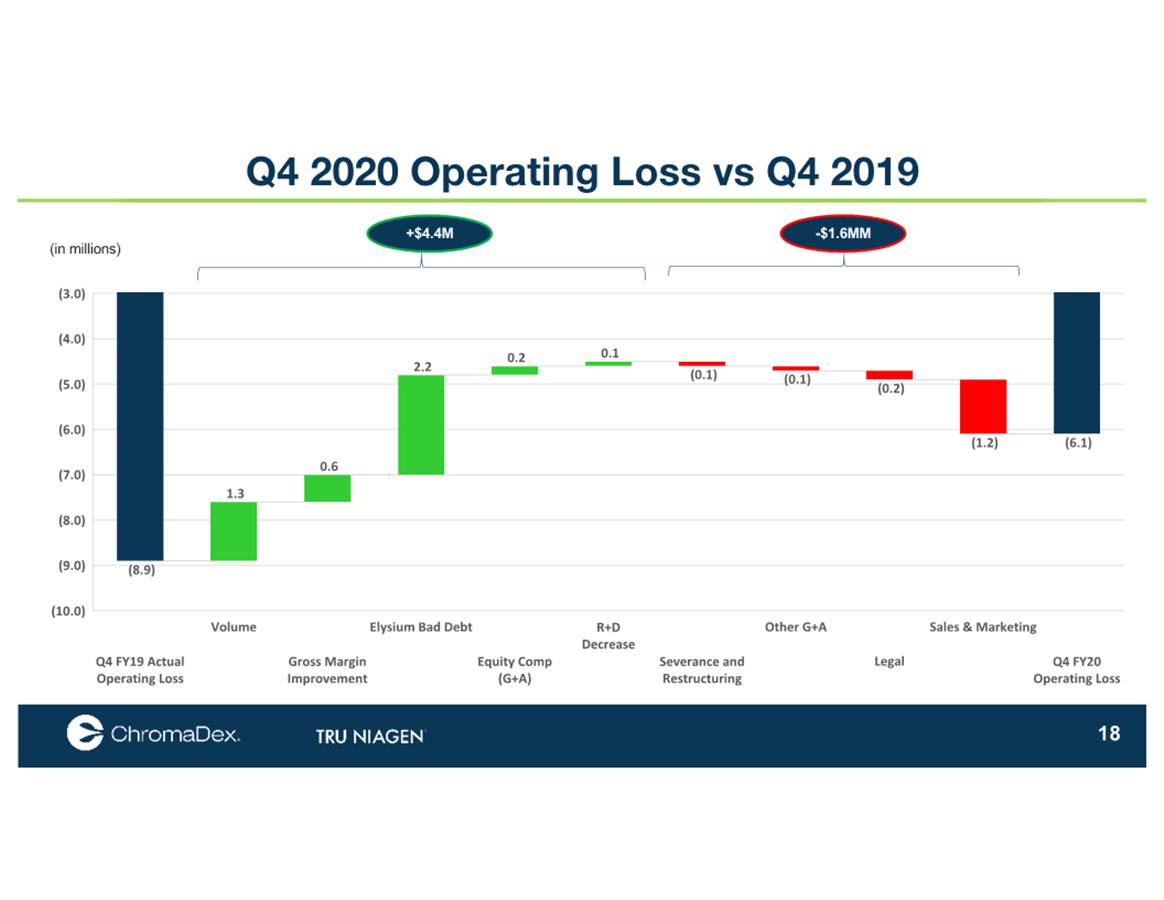
expenses decreased by $0.8 million to $15.5 million in Q4 2020,
compared to $16.3 million in Q4 2019. The decrease in operating
expenses was driven by a decrease of $1.9 million in general and
administrative expense, and a decrease of $0.1 million of R&D
expense, partially offset by $1.2 million of higher selling and
marketing expenses. The decrease in general and administrative
expense was driven by the absence of $2.2 million of bad debt
expense related to the write-off of an Elysium receivable in Q4
2019.
The net
loss for Q4 2020 was ($6.1) million or ($0.10) per share as
reported compared to a net loss of ($8.9) million or ($0.15) per
share for Q4 2019 as reported. Non-GAAP net loss per share in Q4
2019 was ($0.11) excluding a $2.2 million, or $0.04 per share,
non-cash charge related to the write-off of the Elysium receivable
as bad debt.
Adjusted
EBITDA excluding total legal expense, a non-GAAP measure, was a
loss of ($1.1) million for Q4 2020, compared to a loss of ($2.1)
million for Q4 2019, a $1.0 million improvement.
ChromaDex
defines Adjusted EBITDA excluding total legal expense as net income
or (loss) which is adjusted for interest, income tax, depreciation,
amortization, non-cash stock compensation costs, severance and
restructuring expense, bad debt expense related to Elysium Health
and total legal expense.
For Q4
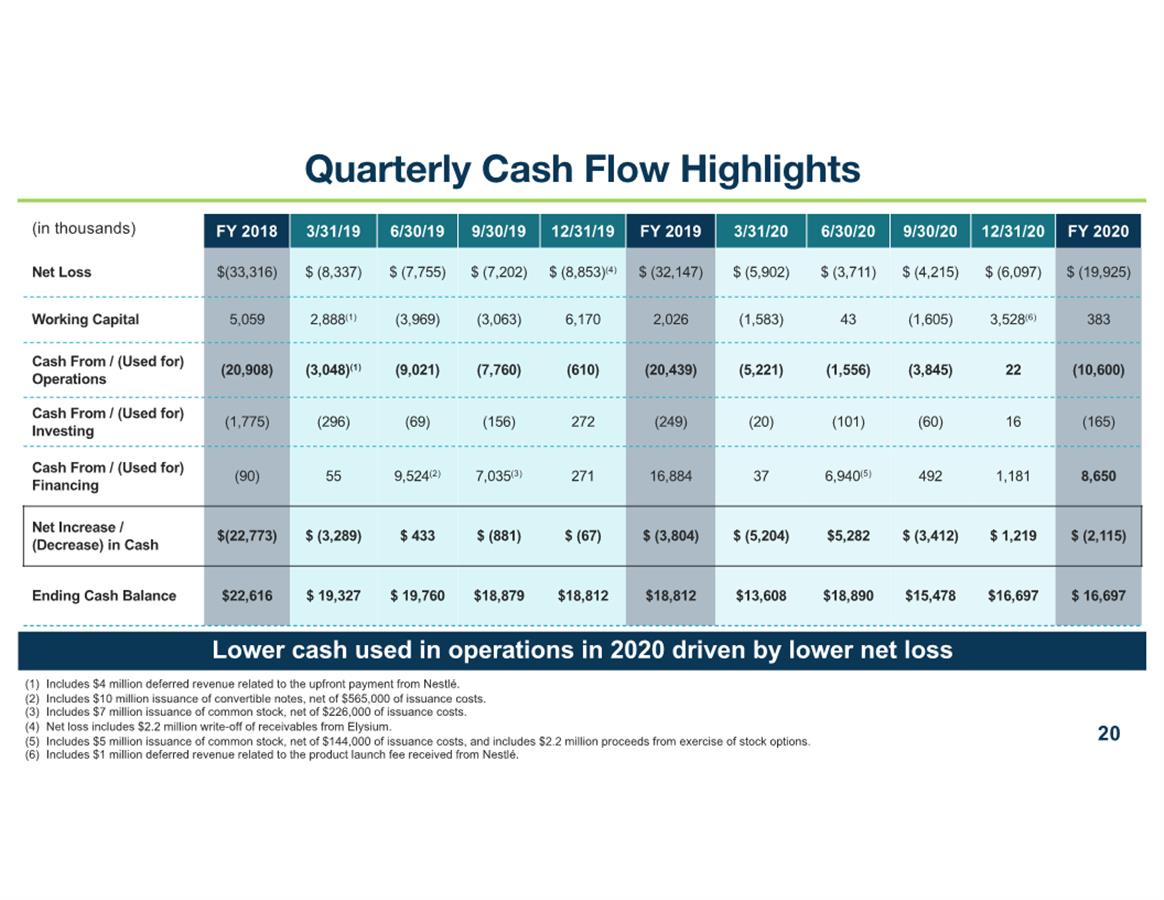
2020, the net cash flow from operating activities was at
break-even, versus ($0.6) million used in Q4 2019.
Results of operations for the year ended December 31,
2020
For the
full year ended December 31, 2020 (“FY 2020”),
ChromaDex reported net sales of $59.3 million, up 28% compared to
$46.3 million in the full year ended December 31, 2019 ("FY 2019").
The increase in FY 2019 revenues was driven by growth in sales of
Tru Niagen®.
Gross
margin percentage improved by 390 basis points to 59.5% in FY 2020
compared to 55.7% in FY 2019. The improvement in gross margin
percentage was driven by the positive impact of increased Tru
Niagen® consumer
product sales and product cost savings initiatives.
Operating
expenses decreased by $1.9 million to $55.1 million in FY 2020,
compared to $57.1 million in FY 2019. The decrease in operating
expenses was driven by a decrease of $3.9 million in general and
administrative expense, and a decrease of $0.7 million of R&D
expense, partially offset by $2.7 million of higher selling and
marketing expense. The decrease in general and administrative
expense was driven by lower legal costs of $2.7 million and the
absence of $2.2 million of bad debt expense related to the
write-off of an Elysium receivable in 2019.
The net
loss for FY 2020 was ($19.9) million or ($0.33) per share as
reported compared to a net loss of ($32.1) million or ($0.56) per
share for FY 2019 as reported. For FY 2020, the reported loss was
negatively impacted by a non-cash charge of $6.9 million related to
stock-based compensation.
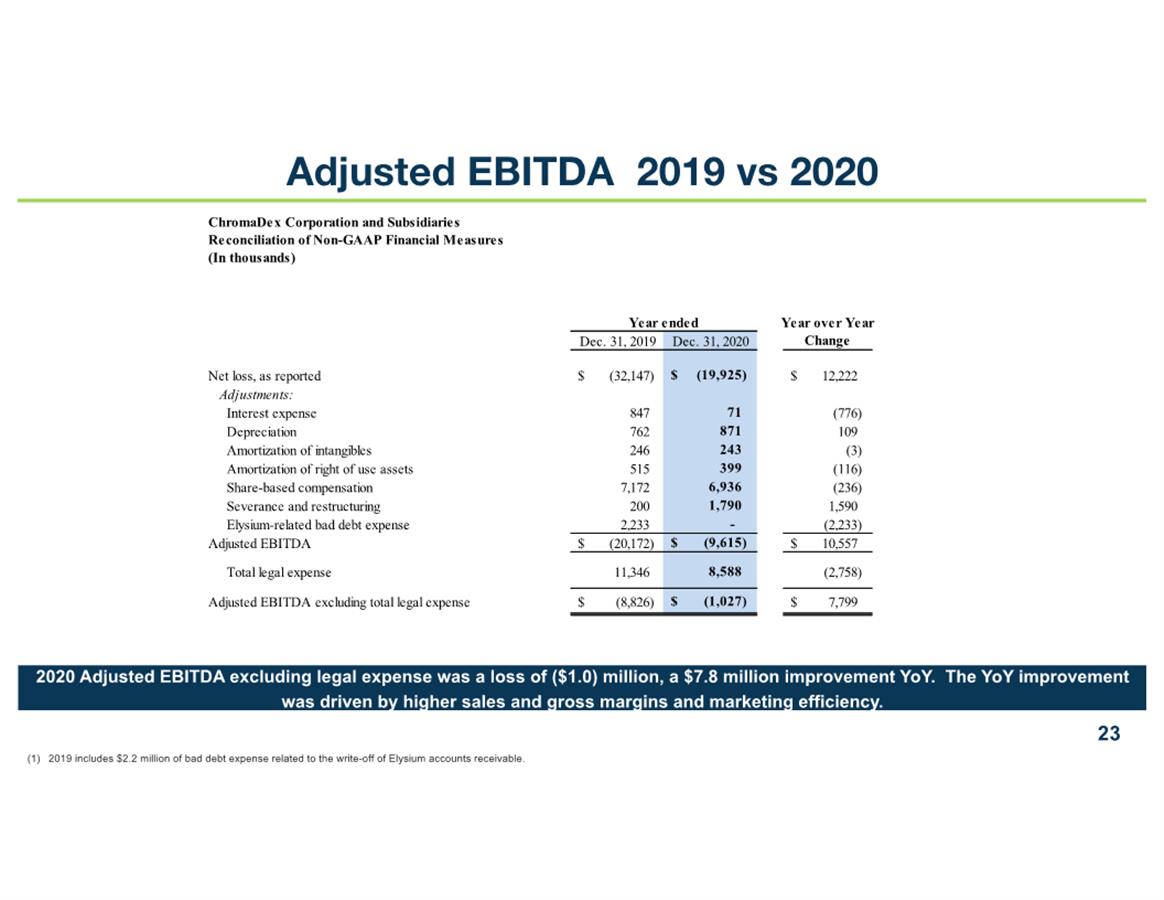
Adjusted
EBITDA excluding total legal expense, a non-GAAP measure, was a
loss of ($1.0) million for FY 2020, compared to a loss of ($8.8)
million for FY 2019, a $7.8 million improvement. The $7.8 million
improvement was primarily driven by higher sales and gross margins,
partially offset by higher marketing and selling
expense.
For
full year 2020, the net cash used in operating activities was
($10.6) million versus ($20.4) million for the same period in the
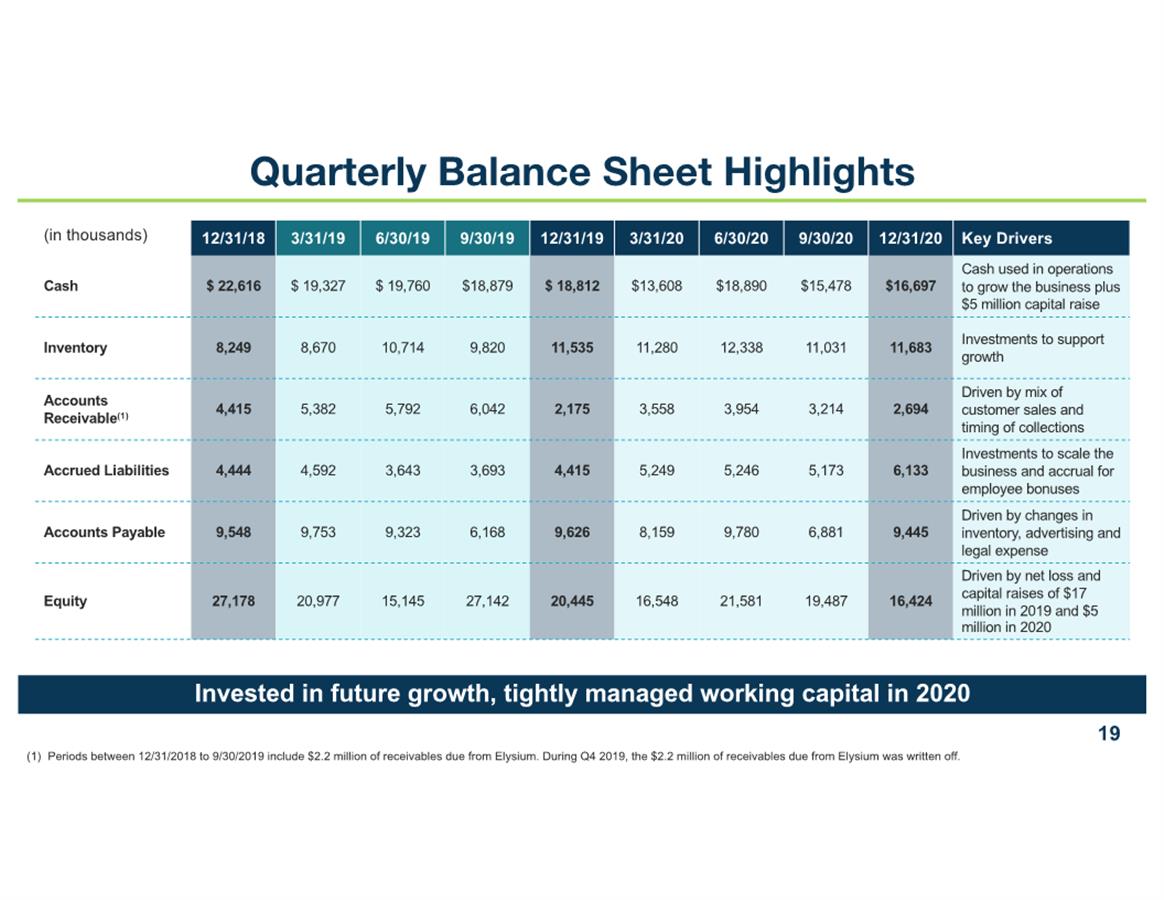
prior year. The Company ended the year of 2020 with cash of $16.7
million.
2021 Outlook
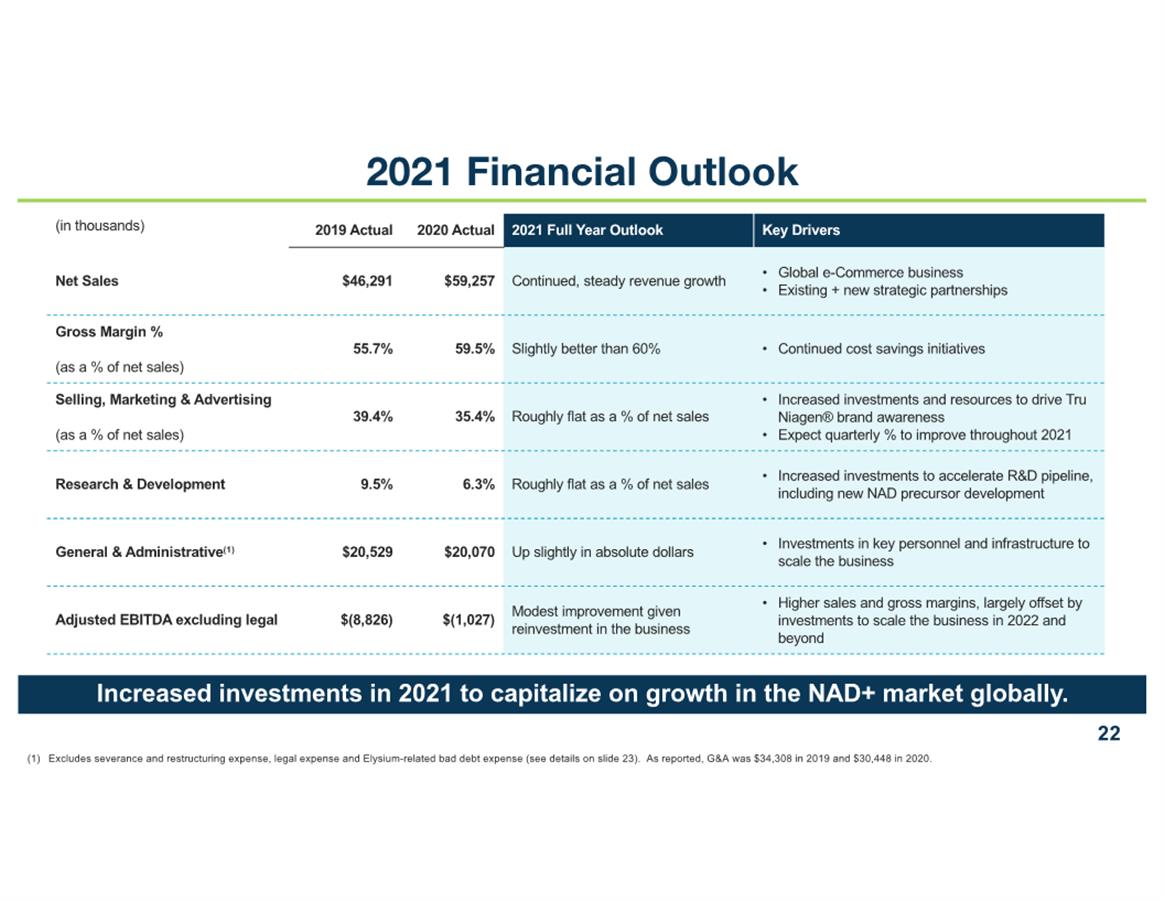
Looking
forward, the Company expects continued, steady revenue growth
driven by its global ecommerce business, as well as growth with
existing and new strategic partners. The Company expects
continued gross margin improvement to slightly better than 60%, and
roughly flat selling and marketing and R&D expense as a
percentage of net sales year-over-year. The Company expects
slightly higher general and administrative expense, excluding
severance, restructuring and legal expense. The Company plans to
increase investments and resources to drive brand awareness and
accelerate its R&D pipeline to capitalize on growth in the NAD+
market globally.
Investor Conference Call
ChromaDex
management will host an investor conference call to discuss the
fourth quarter results and provide a general business update on
Wednesday, March 10, at 4:30pm ET.
Participants
should call in at least 10 minutes prior to the call. The dial-in
information is as follows:
Date: Wed., March 10, 2021
Time: 4:30
p.m. Eastern time (1:30 p.m. Pacific time)
Toll-free dial-in number: 1-833-979-2703
International dial-in number: 236-714-2223
Conference ID: 8433848
Webcast link: ChromaDex Fourth
Quarter 2020 Earnings Conference Call
The conference call will be broadcast live and available for
replay here and
via the investor relations section of the Company’s website
at www.chromadex.com.
A replay of the conference call will be available after 7:30
p.m. ET.
Toll-free replay number: (800) 585-8367
Replay ID: 8433848
The
earnings press release, and its accompanying financial exhibits,
will be available on the Investor Relations section of the Company
website, www.chromadex.com.
About Non-GAAP Financial Measures:
Adjusted
EBITDA excluding total legal expense excludes interest, income tax,
depreciation, amortization, non-cash share-based compensation
costs, severance and restructuring expense, bad debt expense
related to Elysium Health, and total legal expense.
ChromaDex used these non-GAAP measures when evaluating its
financial results as well as for internal resource management,
planning and forecasting purposes. ChromaDex believes the
presentation of its non-GAAP financial measures enhances the
overall understanding of the company’s historical financial
performance. These non-GAAP measures should not be viewed in
isolation from or as a substitute for ChromaDex’s financial
results in accordance with GAAP. Reconciliation of GAAP to non-GAAP
measures are attached to this press release.
About ChromaDex:
ChromaDex
Corp. is a global bioscience company dedicated to healthy aging.
The ChromaDex team, which includes world-renowned scientists, is
pioneering research on nicotinamide adenine dinucleotide (NAD+),
levels of which decline with age. ChromaDex is the innovator behind
NAD+ precursor nicotinamide riboside (NR), which is protected by
ChromaDex’s patent portfolio along with other NAD+
precursors. ChromaDex maintains a website at www.chromadex.com to
which ChromaDex regularly posts copies of its press releases as
well as additional and financial information about the
Company.
Important Note on Forward Looking Statements:
This
release contains forward-looking statements within the meaning of
Section 27A of the Securities Act of 1933, as amended, and Section
21E of the Securities and Exchange Act of 1934, as amended. Because
such statements are subject to risks and uncertainties, actual
results may differ materially from those expressed or implied by
such forward-looking statements. Such statements include the
quotation from ChromaDex’s Chief Executive Officer, and
statements related to the company’s 2021 financial outlook,
including the impact of COVID-19. Other risks that contribute to
the uncertain nature of the forward-looking statements are reported
in our most recent Quarterly Report on Form 10-Q and Annual Report
on Form 10-K as filed with the SEC. Readers are cautioned not to
place undue reliance on these forward-looking statements, which
speak only as of the date hereof, and actual results may differ
materially from those suggested by these forward-looking
statements. All forward-looking statements are qualified in their
entirety by this cautionary statement and ChromaDex undertakes no
obligation to revise or update this release to reflect events or
circumstances after the date hereof.
ChromaDex Investor Relations Contact:
Brianna
Gerber, Vice President of Finance and Investor
Relations
949-419-0288
ext. 127
ChromaDex Media Contact:
Alex
Worsham, Vice President of Global Marketing &
Communications
310-388-6706
ext. 689

ChromaDex
Corporation
ChromaDex
Corporation and Subsidiaries
Consolidated
Statements of Operations
Three
Months Ended December 31, 2020 and December 31, 2019
(In
thousands, except per share data)
|
|
Three Months
Ended
|
|
|
|
Dec.
31, 2020
|
Dec.
31, 2019
|
|
|
|
|
|
Sales,
net
|
$15,445
|
$13,089
|
|
Cost of
sales
|
6,024
|
5,624
|
|
|
|
|
|
Gross
profit
|
9,421
|
7,465
|
|
|
|
|
|
Operating
expenses:
|
|
|
|
Sales and
marketing
|
6,319
|
5,108
|
|
Research and
development
|
991
|
1,139
|
|
General and
administrative
|
8,192
|
10,078
|
|
Operating
expenses
|
15,502
|
16,325
|
|
|
|
|
|
Operating
loss
|
(6,081)
|
(8,860)
|
|
|
|
|
|
Nonoperating income
(expense):
|
|
|
|
Interest income
(expense), net
|
(16)
|
7
|
|
Nonoperating
income (expense):
|
(16)
|
7
|
|
|
|
|
|
Net
loss
|
(6,097)
|
(8,853)
|
|
|
|
|
|
|
|
|
|
Basic and diluted
loss per common share:
|
$(0.10)
|
$(0.15)
|
|
|
|
|
|
Basic and diluted
weighted average common shares outstanding
|
61,869
|
59,650
|
See Notes
to Consolidated Financial Statements in Part II Item 8 of
ChromaDex's Annual Report on Form 10-K to be filed with Securities
and Exchange Commission.
ChromaDex
Corporation and Subsidiaries
Consolidated
Statements of Operations
Years
Ended December 31, 2020 and December 31, 2019
(In
thousands, except per share data)
|
|
2020
|
2019
|
|
|
|
|
|
Sales,
net
|
$59,257
|
$46,291
|
|
Cost of
sales
|
23,983
|
20,522
|
|
|
|
|
|
Gross
profit
|
35,274
|
25,769
|
|
|
|
|
|
Operating
expenses:
|
|
|
|
Sales and
marketing
|
20,948
|
18,216
|
|
Research and
development
|
3,732
|
4,420
|
|
General and
administrative
|
30,448
|
34,308
|
|
Other
|
-
|
125
|
|
Operating
expenses
|
55,128
|
57,069
|
|
|
|
|
|
Operating
loss
|
(19,854)
|
(31,300)
|
|
|
|
|
|
Nonoperating
expense:
|
|
|
|
Interest expense,
net
|
(71)
|
(847)
|
|
Nonoperating
expenses
|
(71)
|
(847)
|
|
|
|
|
|
Net
loss
|
(19,925)
|
(32,147)
|
|
|
|
|
|
|
|
|
|
Basic and diluted
loss per common share:
|
$(0.33)
|
$(0.56)
|
|
|
|
|
|
Basic and diluted
weighted average common shares outstanding
|
61,067
|
57,056
|
See
Notes to Consolidated Financial Statements in Part II Item 8 of
ChromaDex's Annual Report on Form 10-K to be filed with Securities
and Exchange Commission.
ChromaDex
Corporation and Subsidiaries
Consolidated
Balance Sheets
December
31, 2020 and December 31, 2019
(In
thousands, except per share data)
|
|
Dec.
31, 2020
|
Dec.
31, 2019
|
|
Assets
|
|
|
|
Current
Assets
|
|
|
|
Cash, including
restricted cash of $0.2 million and $0.2 million,
respectively
|
$16,697
|
$18,812
|
|
Trade receivables,
net of allowances of $0.2 million and $2.8 million,
respectively;
|
|
|
|
Receivables
from Related Party: $0.9 million and $0.8 million,
respectively
|
2,694
|
2,175
|
|
Inventories
|
11,683
|
11,535
|
|
Prepaid expenses
and other assets
|
1,145
|
996
|
|
Total
current assets
|
32,219
|
33,518
|
|
|
|
|
|
Leasehold
Improvements and Equipment, net
|
3,206
|
3,765
|
|
Intangible Assets,
net
|
1,082
|
1,311
|
|
Right of Use
Assets
|
1,226
|
891
|
|
Other Long-term
Assets
|
625
|
762
|
|
Total
assets
|
$38,358
|
$40,247
|
|
|
|
|
|
Liabilities
and Stockholders' Equity
|
|
|
|
Current
Liabilities
|
|
|
|
Accounts
payable
|
$9,445
|
$9,626
|
|
Accrued
expenses
|
6,133
|
4,415
|
|
Current maturities
of operating lease obligations
|
589
|
595
|
|
Current maturities
of finance lease obligations
|
31
|
258
|
|
Customer
deposits
|
278
|
169
|
|
Total
current liabilities
|
16,476
|
15,063
|
|
|
|
|
|
Deferred
Revenue
|
4,441
|
3,873
|
|
Operating Lease
Obligations, Less Current Maturities
|
997
|
848
|
|
Finance Lease
Obligations, Less Current Maturities
|
20
|
18
|
|
Total
liabilities
|
21,934
|
19,802
|
|
|
|
|
|
Commitments and
Contingencies
|
|
|
|
Stockholders'
Equity
|
|
|
|
Common stock, $.001
par value; authorized 150,000 shares;
|
|
|
|
issued
and outstanding December 31, 2020 61,881 shares and
|
|
|
|
December
31, 2019 59,562 shares
|
62
|
60
|
|
Additional paid-in
capital
|
158,190
|
142,285
|
|
Accumulated
deficit
|
(141,825)
|
(121,900)
|
|
Cumulative
translation adjustments
|
(3)
|
-
|
|
Total
stockholders' equity
|
16,424
|
20,445
|
|
Total
liabilities and stockholders' equity
|
$38,358
|
$40,247
|
See
Notes to Consolidated Financial Statements in Part II Item 8 of
ChromaDex's Annual Report on Form 10-K to be filed with Securities
and Exchange Commission.
ChromaDex Corporation and Subsidiaries
Reconciliation of Non-GAAP Financial Measures
1. Adjusted EBITDA
|
Year ended December 31, 2020
|
|
|
|
|
|
|
|
Q1 2020
|
Q2 2020
|
Q3 2020
|
Q4 2020
|
Full
Year 2020
|
|
(In
thousands)
|
|
|
|
|
|
|
Net
loss, as reported
|
$(5,902)
|
$(3,711)
|
$(4,215)
|
$(6,097)
|
$(19,925)
|
|
Adjustments:
|
|
|
|
|
|
|
Interest
expense
|
12
|
24
|
19
|
16
|
71
|
|
Depreciation
|
214
|
218
|
220
|
219
|
871
|
|
Amortization
of intangibles
|
62
|
60
|
60
|
61
|
243
|
|
Amortization
of right of use assets
|
92
|
95
|
97
|
115
|
399
|
|
Share-based
compensation
|
1,873
|
1,711
|
1,574
|
1,778
|
6,936
|
|
Severance
and restructuring
|
953
|
284
|
224
|
329
|
1,790
|
|
Adjusted
EBITDA
|
$(2,696)
|
$(1,319)
|
$(2,021)
|
$(3,579)
|
$(9,615)
|
|
|
|
|
|
|
|
|
Total
legal expense
|
2,380
|
1,844
|
1,896
|
2,468
|
8,588
|
|
|
|
|
|
|
|
|
Adjusted
EBITDA excluding total legal expense
|
$(316)
|
$525
|
$(125)
|
$(1,111)
|
$(1,027)
|
|
|
|
|
|
|
|
|
|
|
|
|
|
|
|
Year ended December 31, 2019
|
|
|
|
|
|
|
|
Q1 2019
|
Q2 2019
|
Q3 2019
|
Q4 2019
|
Full
Year 2019
|
|
(In
thousands)
|
|
|
|
|
|
|
Net
loss, as reported
|
$(8,337)
|
$(7,755)
|
$(7,202)
|
$(8,853)
|
$(32,147)
|
|
Adjustments:
|
|
|
|
|
|
|
Interest
(income) expense
|
(35)
|
575
|
314
|
(7)
|
847
|
|
Depreciation
|
173
|
190
|
196
|
203
|
762
|
|
Amortization
of intangibles
|
61
|
61
|
62
|
62
|
246
|
|
Amortization
of right of use assets
|
138
|
141
|
144
|
92
|
515
|
|
Share-based
compensation
|
2,029
|
1,759
|
1,687
|
1,697
|
7,172
|
|
Severance
and restructuring
|
-
|
-
|
-
|
200
|
200
|
|
Elysium-related
bad debt expense
|
-
|
-
|
-
|
2,233
|
2,233
|
|
Adjusted
EBITDA
|
$(5,971)
|
$(5,029)
|
$(4,799)
|
$(4,373)
|
$(20,172)
|
|
|
|
|
|
|
|
|
Total
legal expense
|
3,250
|
2,926
|
2,944
|
2,226
|
11,346
|
|
|
|
|
|
|
|
|
Adjusted
EBITDA excluding total legal expense
|
$(2,721)
|
$(2,103)
|
$(1,855)
|
$(2,147)
|
$(8,826)
|
2. Net loss per share
|
|
3
Months Ended
|
Year
Ended
|
|
|
Dec.
31, 2019
|
Dec.
31, 2019
|
|
|
|
|
|
Net
loss per share, as reported
|
$(0.15)
|
$(0.56)
|
|
|
|
|
|
Net
loss per share related to $2.2 million write-off of the Elysium
receivable as bad debt
|
(0.04)
|
(0.04)
|
|
|
|
|
|
Net
loss per share, excluding $2.2 million write-off of the Elysium
receivable as bad debt
|
$(0.11)
|
$(0.52)
|
|
|
|
|
Exhibit
99.2