
NBR 8-K
Nabors Industries Ltd (NBR)
UNITED STATES
SECURITIES AND EXCHANGE COMMISSION
Washington, D.C. 20549
Form
CURRENT REPORT
PURSUANT TO SECTION 13 OR 15(d) OF THE
SECURITIES EXCHANGE ACT OF 1934
Date of Report (Date of earliest event reported):
(Exact name of registrant as specified in its charter)
| (State or Other Jurisdiction of Incorporation or Organization) |
(Commission File Number) | (I.R.S. Employer Identification No.) |
| N/A | ||
| (Address of principal executive offices) | (Zip Code) |
(
(Registrant’s telephone number, including area code)
N/A
(Former name or former address, if changed since last report.)
Check the appropriate box below if the Form 8-K filing is intended to simultaneously satisfy the filing obligation of the registrant under any of the following provisions:
| Written communications pursuant to Rule 425 under the Securities Act (17 CFR 230.425) |
| Soliciting material pursuant to Rule 14a-12 under the Exchange Act (17 CFR 240.14a-12) |
| Pre-commencement communications pursuant to Rule 14d-2(b) under the Exchange Act (17 CFR 240.14d-2(b)) |
| Pre-commencement communications pursuant to Rule 13e-4(c) under the Exchange Act (17 CFR 240.13e-4(c)) |
Securities registered pursuant to Section 12(b) of the Act:
| Title of each class | Trading Symbol(s) | Name of exchange on which registered | ||
Indicate by check mark whether the registrant is an emerging growth company as defined in Rule 405 of the Securities Act of 1933 (§230.405 of this chapter) or Rule 12b-2 of the Securities Exchange Act of 1934 (§240.12b-2 of this chapter).
Emerging growth
company
If an emerging growth company, indicate by check mark if the registrant has elected not to use the extended transition period for complying with any new or revised financial accounting standards provided pursuant to Section 13(a) of the Exchange Act. ¨
| Item 2.02 | Results of Operations and Financial Condition. |
On October 26, 2021, Nabors Industries Ltd. (“Nabors”) issued a press release announcing its results of operations for the three months ended September 30, 2021. A copy of that release is furnished herewith as Exhibit 99.1 and is incorporated herein by reference.
On October 27, 2021, Nabors will hold a conference call at 11:00 a.m. Central Time, regarding the Company’s financial results for the quarter ended September 30, 2021. Information about the call - including dial-in information, recording and replay of the call, and supplemental information - is available on the Investor Relations page of www.nabors.com.
The information in this Item 2.02, including Exhibits 99.1 and 99.2, shall not be deemed “filed” for purposes of Section 18 of the Securities Exchange Act, of 1934 or otherwise subject to liabilities of that Section or Sections 11 and 12(a)(2) of the Securities Act of 1933.
| Item 9.01 | Financial Statements and Exhibits. |
(d) Exhibits
| Exhibit No. | Description | |
| 99.1 | Press Release | |
| 99.2 | Investor Information | |
| 104 | Cover Page Interactive Data File (embedded within the Inline XBRL document) |
SIGNATURE
Pursuant to the requirements of the Securities Exchange Act of 1934, the Registrant has duly caused this report to be signed on its behalf by the undersigned hereunto duly authorized.
| NABORS INDUSTRIES LTD. | ||
| Date: October 26, 2021 | By: | /s/ Mark D. Andrews |
| Mark D. Andrews | ||
| Corporate Secretary | ||
Exhibit 99.1
 |
NEWS RELEASE |
Nabors Announces Third Quarter 2021 Results
HAMILTON, Bermuda, October 26, 2021 /PRNewswire/ -- Nabors Industries Ltd. (“Nabors” or the “Company”) (NYSE: NBR) today reported third quarter 2021 operating revenues of $524 million, compared to operating revenues of $489 million in the second quarter of 2021. The net loss from continuing operations attributable to Nabors shareholders for the quarter was $122 million, or $15.79 per share. The third quarter included a $13 million after tax expense, or $1.63 per share, related to the purchase of technology in the energy transition space. This compares to a loss of $196 million, or $26.59 per share, in the second quarter. The second quarter results included charges of $81 million after taxes, comprised mainly of an impairment of assets in Canada related to the sale of our Canada drilling rigs, and a tax reserve for contingencies in our International segment. Third quarter adjusted EBITDA was $125 million compared to $117 million in the second quarter.
Anthony G. Petrello, Nabors Chairman, CEO and President, commented, “Our performance in the third quarter was noteworthy on a number of fronts. Adjusted EBITDA increased by 7% versus the second quarter even with the sale of Canada drilling operations. All of our current segments grew sequentially. Once again, our free cash flow generation was excellent. That performance drove another improvement in our leverage. We reached notable milestones in our technology portfolio, which reinforces our leadership in innovation. In particular, we successfully deployed the industry’s first fully-automated PACE®-R rig for an operator in the Permian Basin. The R-801 utilizes Nabors’ full portfolio of digital solutions. It recently completed drilling its initial well with a total depth of 20,000 feet. We are proud of the performance delivered by this transformative and unique addition to our technology portfolio.
“In the third quarter, global oil prices remained above the $60 mark. Since the end of the quarter, they have climbed above $80. Natural gas prices have risen to levels not seen in over a decade. In turn, oilfield activity has strengthened. In our two largest markets – Saudi Arabia and the United States – both the industry’s and our own rig counts grew. In the U.S., pricing increased as industry utilization rose. Looking through the balance of this year and into 2022, we are optimistic that a continued favorable commodity environment will drive strong increases in rig count and pricing.”
Consolidated and Segment Results
International Drilling adjusted EBITDA increased sequentially by 7%, to $76.2 million. The rig count averaged 67 rigs, a one rig decrease from the second quarter. This change was driven primarily by rigs moving between clients in Latin America, partially offset by the reactivation of temporarily idled rigs in Saudi Arabia. Average margin per day was $14,375, an increase of $955, driven by $7 million in early termination revenue somewhat offset by the impact of lost margin from rig moves in Mexico.
The U.S. Drilling segment reported $62.1 million in adjusted EBITDA for the third quarter of 2021, a 4% increase from the prior quarter. Nabors’ average Lower 48 rig count, at 68, increased by more than four rigs, or 6%. Average daily margins in the Lower 48 were $7,025, in line with the prior quarter. The U.S. Drilling segment’s rig count currently stands at 78, with 72 rigs in the Lower 48.
|
NEWS RELEASE |
In Drilling Solutions, adjusted EBITDA of $15.6 million increased by 22% reflecting stronger activity in performance drilling software, especially in the U.S., and in casing running services in both our U.S. and international markets.
In Rig Technologies, adjusted EBITDA increased to $3.0 million in the third quarter, up from $2.0 million in the second quarter. Higher international deliveries of capital equipment were the primary driver of this increase.
Outlook for the Fourth Quarter of 2021
International
| o | Quarterly average rig count is expected to increase by approximately four rigs over the third quarter average, primarily reflecting reactivations of two suspended rigs in Saudi Arabia and additional rigs in Latin America. | |
| o | Daily drilling margin is expected to decline to $13,000 - $13,500, primarily reflecting the non-recurring early termination revenue received in the third quarter. |
U.S. Drilling
| o | Quarterly average Lower 48 rig count is expected to increase by approximately five rigs over the third quarter average. | |
| o | Lower 48 daily drilling margin is expected to remain in line with the third quarter level, as the Company anticipates offsetting planned compensation increases with higher dayrates. | |
| o | Quarterly average Alaska rig count is expected to increase by approximately one rig over the third quarter level, while the quarterly average U.S. Offshore rig count is expected to remain substantially in line with the third quarter average. |
Drilling Solutions
| o | Adjusted EBITDA is expected to increase by approximately 10% over the third quarter level. |
Rig Technologies
| o | Adjusted EBITDA is expected to increase moderately above the third quarter level. |
Capital Expenditures
| o | Capital expenditures for the full year are expected to total approximately $270 million, including approximately $90 million supporting SANAD’s newbuild rig program. This translates into targeted fourth quarter capital expenditures of $91 million, of which $32 million is for SANAD newbuilds. |
Free Cash Flow and Capital Discipline
Free cash flow, defined as net cash provided by operating activities less net cash used by investing activities, as presented in the Company’s cash flow statement, totaled $133 million in the third quarter. This amount included proceeds from the sale of Canada drilling assets of $94 million offset by $16 million for energy transition investments. Capital expenditures accounted for $63 million while cash interest payments totaled $78 million. The Company improved net debt, defined as total debt less cash, cash equivalents and short-term investments, by $120 million. For the first nine months of 2021, the Company generated free cash flow of $261 million.
|
NEWS RELEASE |
William Restrepo, Nabors CFO, stated, “The third quarter was a further demonstration of Nabors’ leading operational performance both in the U.S. and internationally, with the potential for meaningful growth in the year ahead. Our strong performance is also translating into robust free cash flow generation that has allowed us to reduce our net debt materially. We expect further net debt reductions in the fourth quarter and in 2022.
“With our rapid progress in technology introduction, our modern industry leading fleet and our close relationships with customers across the globe, Nabors has never been stronger operationally. And with our deleveraging efforts of the last five years, our capital structure and debt profile are considerably stronger than they have been in a long time. We believe we are much better positioned to keep reducing our leverage, while taking advantage of the exciting opportunities presented by an improving industry environment.”
Mr. Petrello concluded, “We are pleased with the level of our operational and financial performance. These allowed us to make further progress on our goals to generate free cash flow and reduce net debt. We have implemented multiple financial strategies to improve our leverage and they are delivering the desired results.
“We continue to advance on our Sustainability plans. We are on target to meet our commitment to reduce GHG emissions by 5% in the U.S. this year, and our Environmental and Social score metrics once again improved. We expect to make significant additional improvements on our emissions in the coming year.
“We took further steps to advance our efforts in the energy transition. We completed the third geothermal investment; all three companies in our portfolio have potentially disruptive technology. We also made additional development progress in the areas of energy storage, hydrogen, and carbon capture.
“As we approach the close of 2021 and look into 2022, we are optimistic that industry fundamentals will improve further. Nabors has the industry’s most talented workforce and a global fleet that is second-to-none. We have the most robust offering of apps and digital automation technology in the industry, and we are working to extend that leadership. With this combination, I am confident we will continue our advancement towards the achievement of our financial goals while simultaneously creating significant value for all of our stakeholders.”
About Nabors Industries
Nabors Industries is a leading provider of advanced technology for the energy industry. With operations in approximately 20 countries, Nabors has established a global network of people, technology and equipment to deploy solutions that deliver safe, efficient and sustainable energy production. By leveraging its core competencies, particularly in drilling, engineering, automation, data science and manufacturing, Nabors aims to help shape the future of energy and enable the transition to a lower carbon world. Learn more about Nabors and its 100-year history of energy technology leadership: www.nabors.com.
|
NEWS RELEASE |
Forward-looking Statements
The information included in this press release includes forward-looking statements within the meaning of the Securities Act of 1933 and the Securities Exchange Act of 1934. Such forward-looking statements are subject to a number of risks and uncertainties, as disclosed by Nabors from time to time in its filings with the Securities and Exchange Commission. As a result of these factors, Nabors' actual results may differ materially from those indicated or implied by such forward-looking statements. The forward-looking statements contained in this press release reflect management's estimates and beliefs as of the date of this press release. Nabors does not undertake to update these forward-looking statements.
Non-GAAP Disclaimer
This press release presents certain “non-GAAP” financial measures. The components of these non-GAAP measures are computed by using amounts that are determined in accordance with accounting principles generally accepted in the United States of America (“GAAP”). Adjusted operating income (loss) represents income (loss) from continuing operations before income taxes, interest expense, earnings (losses) from unconsolidated affiliates, investment income (loss), (gain)/loss on debt buybacks and exchanges, impairments and other charges and other, net. Adjusted EBITDA is computed similarly, but also excludes depreciation and amortization expenses. In addition, adjusted EBITDA and adjusted operating income (loss) exclude certain cash expenses that the Company is obligated to make. Net debt is calculated as total debt minus the sum of cash, cash equivalents and short-term investments. Free cash flow represents net cash provided by operating activities less cash used for investing activities. Free cash flow is an indicator of our ability to generate cash flow after required spending to maintain or expand our asset base. Management believes that this non-GAAP measure is useful information to investors when comparing our cash flows with the cash flows of other companies. Each of these non-GAAP measures has limitations and therefore should not be used in isolation or as a substitute for the amounts reported in accordance with GAAP. However, management evaluates the performance of its operating segments and the consolidated Company based on several criteria, including adjusted EBITDA, adjusted operating income (loss), net debt, and free cash flow, because it believes that these financial measures accurately reflect the Company’s ongoing profitability and performance. Securities analysts and investors also use these measures as some of the metrics on which they analyze the Company’s performance. Other companies in this industry may compute these measures differently. Reconciliations of consolidated adjusted EBITDA and adjusted operating income (loss) to income (loss) from continuing operations before income taxes, net debt to total debt, and free cash flow to cash flow provided by operations, which are their nearest comparable GAAP financial measures, are included in the tables at the end of this press release.
|
NEWS RELEASE |
Investor Contacts: William C. Conroy, Vice President of Corporate Development & Investor Relations, +1 281-775-2423 or via e-mail [email protected], or Kara Peak, Director of Corporate Development & Investor Relations, +1 281-775-4954 or via email [email protected]. To request investor materials, contact Nabors' corporate headquarters in Hamilton, Bermuda at +441-292-1510 or via e-mail [email protected]
NABORS INDUSTRIES LTD. AND SUBSIDIARIES
CONDENSED CONSOLIDATED STATEMENTS OF INCOME (LOSS)
(Unaudited)
| Three Months Ended | Nine Months Ended | |||||||||||||||||||
| September 30, | June 30, | September 30, | ||||||||||||||||||
| (In thousands, except per share amounts) | 2021 | 2020 | 2021 | 2021 | 2020 | |||||||||||||||
| Revenues and other income: | ||||||||||||||||||||
| Operating revenues | $ | 524,165 | $ | 438,352 | $ | 489,333 | $ | 1,474,009 | $ | 1,690,647 | ||||||||||
| Investment income (loss) | 200 | (742 | ) | (62 | ) | 1,401 | (1,904 | ) | ||||||||||||
| Total revenues and other income | 524,365 | 437,610 | 489,271 | 1,475,410 | 1,688,743 | |||||||||||||||
| Costs and other deductions: | ||||||||||||||||||||
| Direct costs | 336,538 | 270,397 | 312,466 | 939,658 | 1,058,794 | |||||||||||||||
| General and administrative expenses | 52,897 | 46,168 | 51,580 | 159,137 | 149,796 | |||||||||||||||
| Research and engineering | 9,498 | 7,565 | 7,965 | 24,930 | 26,279 | |||||||||||||||
| Depreciation and amortization | 173,375 | 206,862 | 174,775 | 525,426 | 645,045 | |||||||||||||||
| Interest expense | 42,217 | 52,403 | 41,714 | 126,906 | 158,331 | |||||||||||||||
| Other, net | 22,758 | 4,592 | 66,455 | 96,559 | 290,973 | |||||||||||||||
| Total costs and other deductions | 637,283 | 587,987 | 654,955 | 1,872,616 | 2,329,218 | |||||||||||||||
| Income (loss) from continuing operations before income taxes | (112,918 | ) | (150,377 | ) | (165,684 | ) | (397,206 | ) | (640,475 | ) | ||||||||||
| Income tax expense (benefit) | 2,784 | (3,695 | ) | 24,719 | 37,228 | 18,444 | ||||||||||||||
| Income (loss) from continuing operations, net of tax | (115,702 | ) | (146,682 | ) | (190,403 | ) | (434,434 | ) | (658,919 | ) | ||||||||||
| Income (loss) from discontinued operations, net of tax | (20 | ) | 22 | 8 | 7 | (48 | ) | |||||||||||||
| Net income (loss) | (115,722 | ) | (146,660 | ) | (190,395 | ) | (434,427 | ) | (658,967 | ) | ||||||||||
| Less: Net (income) loss attributable to noncontrolling interest | (6,778 | ) | (10,805 | ) | (5,614 | ) | (21,168 | ) | (38,437 | ) | ||||||||||
| Net income (loss) attributable to Nabors | (122,500 | ) | (157,465 | ) | (196,009 | ) | (455,595 | ) | (697,404 | ) | ||||||||||
| Less: Preferred stock dividend | - | (3,653 | ) | - | (3,653 | ) | (10,958 | ) | ||||||||||||
| Net income (loss) attributable to Nabors common shareholders | $ | (122,500 | ) | $ | (161,118 | ) | $ | (196,009 | ) | $ | (459,248 | ) | $ | (708,362 | ) | |||||
| Amounts attributable to Nabors common shareholders: | ||||||||||||||||||||
| Net income (loss) from continuing operations | $ | (122,480 | ) | $ | (161,140 | ) | $ | (196,017 | ) | $ | (459,255 | ) | $ | (708,314 | ) | |||||
| Net income (loss) from discontinued operations | (20 | ) | 22 | 8 | 7 | (48 | ) | |||||||||||||
| Net income (loss) attributable to Nabors common shareholders | $ | (122,500 | ) | $ | (161,118 | ) | $ | (196,009 | ) | $ | (459,248 | ) | $ | (708,362 | ) | |||||
| Earnings (losses) per share: | ||||||||||||||||||||
| Basic from continuing operations | $ | (15.79 | ) | $ | (23.42 | ) | $ | (26.59 | ) | $ | (62.26 | ) | $ | (102.25 | ) | |||||
| Basic from discontinued operations | - | - | - | - | (0.01 | ) | ||||||||||||||
| Total Basic | $ | (15.79 | ) | $ | (23.42 | ) | $ | (26.59 | ) | $ | (62.26 | ) | $ | (102.26 | ) | |||||
| Diluted from continuing operations | $ | (15.79 | ) | $ | (23.42 | ) | $ | (26.59 | ) | $ | (62.26 | ) | $ | (102.25 | ) | |||||
| Diluted from discontinued operations | - | - | - | - | (0.01 | ) | ||||||||||||||
| Total Diluted | $ | (15.79 | ) | $ | (23.42 | ) | $ | (26.59 | ) | $ | (62.26 | ) | $ | (102.26 | ) | |||||
| Weighted-average number of common shares outstanding: | ||||||||||||||||||||
| Basic | 7,907 | 7,064 | 7,460 | 7,490 | 7,056 | |||||||||||||||
| Diluted | 7,907 | 7,064 | 7,460 | 7,490 | 7,056 | |||||||||||||||
| Adjusted EBITDA | $ | 125,232 | $ | 114,222 | $ | 117,322 | $ | 350,284 | $ | 455,778 | ||||||||||
| Adjusted operating income (loss) | $ | (48,143 | ) | $ | (92,640 | ) | $ | (57,453 | ) | $ | (175,142 | ) | $ | (189,267 | ) | |||||
1-1
NABORS INDUSTRIES LTD. AND SUBSIDIARIES
CONDENSED CONSOLIDATED BALANCE SHEETS
| September 30, | June 30, | December 31, | ||||||||||
| (In thousands) | 2021 | 2021 | 2020 | |||||||||
| (Unaudited) | ||||||||||||
| ASSETS | ||||||||||||
| Current assets: | ||||||||||||
| Cash and short-term investments | $ | 771,884 | $ | 399,897 | $ | 481,746 | ||||||
| Accounts receivable, net | 282,726 | 312,136 | 362,977 | |||||||||
| Assets held for sale | 16,785 | 111,682 | 16,562 | |||||||||
| Other current assets | 251,232 | 263,424 | 270,180 | |||||||||
| Total current assets | 1,322,627 | 1,087,139 | 1,131,465 | |||||||||
| Property, plant and equipment, net | 3,443,737 | 3,562,350 | 3,985,707 | |||||||||
| Other long-term assets | 408,462 | 392,829 | 386,256 | |||||||||
| Total assets | $ | 5,174,826 | $ | 5,042,318 | $ | 5,503,428 | ||||||
| LIABILITIES AND EQUITY | ||||||||||||
| Current liabilities: | ||||||||||||
| Current portion of debt | $ | - | $ | - | $ | - | ||||||
| Other current liabilities | 516,088 | 529,116 | 515,469 | |||||||||
| Total current liabilities | 516,088 | 529,116 | 515,469 | |||||||||
| Long-term debt | 3,075,520 | 2,823,125 | 2,968,701 | |||||||||
| Other long-term liabilities | 348,542 | 354,637 | 319,610 | |||||||||
| Total liabilities | 3,940,150 | 3,706,878 | 3,803,780 | |||||||||
| Redeemable noncontrolling interest in subsidiary | 400,853 | 398,497 | 442,840 | |||||||||
| Equity: | ||||||||||||
| Shareholders' equity | 709,021 | 818,919 | 1,151,384 | |||||||||
| Noncontrolling interest | 124,802 | 118,024 | 105,424 | |||||||||
| Total equity | 833,823 | 936,943 | 1,256,808 | |||||||||
| Total liabilities and equity | $ | 5,174,826 | $ | 5,042,318 | $ | 5,503,428 | ||||||
1-2
NABORS INDUSTRIES LTD. AND SUBSIDIARIES
SEGMENT REPORTING
(Unaudited)
The following tables set forth certain information with respect to our reportable segments and rig activity:
| Three Months Ended | Nine Months Ended | |||||||||||||||||||
| September 30, | June 30, | September 30, | ||||||||||||||||||
| (In thousands, except rig activity) | 2021 | 2020 | 2021 | 2021 | 2020 | |||||||||||||||
| Operating revenues: | ||||||||||||||||||||
| U.S. Drilling | $ | 173,441 | $ | 130,243 | $ | 161,606 | $ | 477,346 | $ | 578,928 | ||||||||||
| Canada Drilling | 6,034 | 10,774 | 12,313 | 39,336 | 39,929 | |||||||||||||||
| International Drilling | 270,008 | 248,392 | 255,282 | 772,128 | 886,580 | |||||||||||||||
| Drilling Solutions | 45,880 | 29,324 | 39,111 | 120,697 | 117,837 | |||||||||||||||
| Rig Technologies (1) | 42,053 | 28,466 | 34,552 | 102,353 | 104,198 | |||||||||||||||
| Other reconciling items (2) | (13,251 | ) | (8,847 | ) | (13,531 | ) | (37,851 | ) | (36,825 | ) | ||||||||||
| Total operating revenues | $ | 524,165 | $ | 438,352 | $ | 489,333 | $ | 1,474,009 | $ | 1,690,647 | ||||||||||
| Adjusted EBITDA: (3) | ||||||||||||||||||||
| U.S. Drilling | $ | 62,132 | $ | 60,520 | $ | 59,784 | $ | 180,702 | $ | 239,988 | ||||||||||
| Canada Drilling | 1,607 | 2,150 | 3,008 | 14,274 | 9,517 | |||||||||||||||
| International Drilling | 76,211 | 71,885 | 71,322 | 210,144 | 256,904 | |||||||||||||||
| Drilling Solutions | 15,620 | 7,129 | 12,796 | 39,874 | 35,979 | |||||||||||||||
| Rig Technologies (1) | 3,005 | 1,309 | 2,035 | 4,507 | 1,307 | |||||||||||||||
| Other reconciling items (4) | (33,343 | ) | (28,771 | ) | (31,623 | ) | (99,216 | ) | (87,917 | ) | ||||||||||
| Total adjusted EBITDA | $ | 125,232 | $ | 114,222 | $ | 117,322 | $ | 350,284 | $ | 455,778 | ||||||||||
| Adjusted operating income (loss): (5) | ||||||||||||||||||||
| U.S. Drilling | $ | (19,700 | ) | $ | (39,162 | ) | $ | (20,869 | ) | $ | (63,905 | ) | $ | (69,961 | ) | |||||
| Canada Drilling | 1,371 | (3,507 | ) | (2,608 | ) | 2,670 | (9,265 | ) | ||||||||||||
| International Drilling | (7,297 | ) | (16,872 | ) | (8,439 | ) | (34,368 | ) | (20,743 | ) | ||||||||||
| Drilling Solutions | 8,607 | (3,583 | ) | 6,524 | 19,841 | 8,699 | ||||||||||||||
| Rig Technologies (1) | 1,926 | (1,807 | ) | (692 | ) | (1,335 | ) | (11,450 | ) | |||||||||||
| Other reconciling items (4) | (33,050 | ) | (27,709 | ) | (31,369 | ) | (98,045 | ) | (86,547 | ) | ||||||||||
| Total adjusted operating income (loss) | $ | (48,143 | ) | $ | (92,640 | ) | $ | (57,453 | ) | $ | (175,142 | ) | $ | (189,267 | ) | |||||
| Rig activity: | ||||||||||||||||||||
| Average Rigs Working: (6) | ||||||||||||||||||||
| Lower 48 | 67.6 | 48.2 | 63.5 | 62.5 | 64.7 | |||||||||||||||
| Other US | 5.0 | 5.2 | 5.7 | 5.0 | 6.4 | |||||||||||||||
| U.S. Drilling | 72.6 | 53.4 | 69.2 | 67.5 | 71.1 | |||||||||||||||
| Canada Drilling | 4.1 | 7.4 | 8.2 | 8.6 | 8.8 | |||||||||||||||
| International Drilling | 67.0 | 71.3 | 68.3 | 66.7 | 80.1 | |||||||||||||||
| Total average rigs working | 143.7 | 132.1 | 145.7 | 142.8 | 160.0 | |||||||||||||||
| Daily Rig Revenue: | ||||||||||||||||||||
| Lower 48 | $ | 21,312 | $ | 21,764 | $ | 21,015 | $ | 21,314 | $ | 25,120 | ||||||||||
| Other US | 88,175 | 71,175 | 78,215 | 83,177 | 76,214 | |||||||||||||||
| U.S. Drilling (8) | 25,940 | 26,548 | 25,694 | 25,908 | 29,712 | |||||||||||||||
| Canada Drilling | 16,056 | 15,867 | 16,512 | 16,693 | 16,622 | |||||||||||||||
| International Drilling | 43,789 | 37,842 | 41,102 | 42,410 | 40,375 | |||||||||||||||
| Daily Rig Margin: (7) | ||||||||||||||||||||
| Lower 48 | $ | 7,025 | $ | 9,527 | $ | 7,017 | $ | 7,450 | $ | 9,964 | ||||||||||
| Other US | 53,947 | 48,636 | 48,657 | 52,251 | 45,861 | |||||||||||||||
| U.S. Drilling (8) | 10,272 | 13,314 | 10,424 | 10,777 | 13,190 | |||||||||||||||
| Canada Drilling | 5,654 | 4,203 | 4,993 | 6,758 | 4,880 | |||||||||||||||
| International Drilling | 14,375 | 12,678 | 13,420 | 13,582 | 13,446 | |||||||||||||||
1-3
| (1) | Includes our oilfield equipment manufacturing, automated systems, and downhole tools. |
| (2) | Represents the elimination of inter-segment transactions related to our Rig Technologies operating segment. |
| (3) | Adjusted EBITDA represents income (loss) from continuing operations before income taxes, interest expense, depreciation and amortization, earnings (losses) from unconsolidated affiliates, investment income (loss), impairments and other charges and other, net. Adjusted EBITDA is a non-GAAP financial measure and should not be used in isolation or as a substitute for the amounts reported in accordance with GAAP. In addition, adjusted EBITDA excludes certain cash expenses that the Company is obligated to make. However, management evaluates the performance of its operating segments and the consolidated Company based on several criteria, including adjusted EBITDA and adjusted operating income (loss), because it believes that these financial measures accurately reflect the Company’s ongoing profitability and performance. Securities analysts and investors use this measure as one of the metrics on which they analyze the Company’s performance. Other companies in this industry may compute these measures differently. A reconciliation of this non-GAAP measure to income (loss) from continuing operations before income taxes, which is the most closely comparable GAAP measure, is provided in the table set forth immediately following the heading "Reconciliation of Non-GAAP Financial Measures to Income (loss) from Continuing Operations before Income Taxes". |
| (4) | Represents the elimination of inter-segment transactions and unallocated corporate expenses. |
| (5) | Adjusted operating income (loss) represents income (loss) from continuing operations before income taxes, interest expense, earnings (losses) from unconsolidated affiliates, investment income (loss), impairments and other charges and other, net. Adjusted operating income (loss) is a non-GAAP financial measure and should not be used in isolation or as a substitute for the amounts reported in accordance with GAAP. In addition, adjusted operating income (loss) excludes certain cash expenses that the Company is obligated to make. However, management evaluates the performance of its operating segments and the consolidated Company based on several criteria, including adjusted EBITDA and adjusted operating income (loss), because it believes that these financial measures accurately reflect the Company’s ongoing profitability and performance. Securities analysts and investors use this measure as one of the metrics on which they analyze the Company’s performance. Other companies in this industry may compute these measures differently. A reconciliation of this non-GAAP measure to income (loss) from continuing operations before income taxes, which is the most closely comparable GAAP measure, is provided in the table set forth immediately following the heading "Reconciliation of Non-GAAP Financial Measures to Income (loss) from Continuing Operations before Income Taxes". |
| (6) | Represents a measure of the average number of rigs operating during a given period. For example, one rig operating 45 days during a quarter represents approximately 0.5 average rigs working for the quarter. On an annual period, one rig operating 182.5 days represents approximately 0.5 average rigs working for the year. |
| (7) | Daily rig margin represents operating revenue less operating expenses, divided by the total number of revenue days during the quarter. |
| (8) | The U.S. Drilling segment includes the Lower 48, Alaska, and Gulf of Mexico operating areas. |
1-4
NABORS INDUSTRIES LTD. AND SUBSIDIARIES
RECONCILIATION OF NON-GAAP FINANCIAL MEASURES TO
INCOME (LOSS) FROM CONTINUING OPERATIONS BEFORE INCOME TAXES
(Unaudited)
| Three Months Ended | Nine Months Ended | |||||||||||||||||||
| September 30, | June 30, | September 30, | ||||||||||||||||||
| (In thousands) | 2021 | 2020 | 2021 | 2021 | 2020 | |||||||||||||||
| Adjusted EBITDA | $ | 125,232 | $ | 114,222 | $ | 117,322 | $ | 350,284 | $ | 455,778 | ||||||||||
| Depreciation and amortization | (173,375 | ) | (206,862 | ) | (174,775 | ) | (525,426 | ) | (645,045 | ) | ||||||||||
| Adjusted operating income (loss) | (48,143 | ) | (92,640 | ) | (57,453 | ) | (175,142 | ) | (189,267 | ) | ||||||||||
| Investment income (loss) | 200 | (742 | ) | (62 | ) | 1,401 | (1,904 | ) | ||||||||||||
| Interest expense | (42,217 | ) | (52,403 | ) | (41,714 | ) | (126,906 | ) | (158,331 | ) | ||||||||||
| Other, net | (22,758 | ) | (4,592 | ) | (66,455 | ) | (96,559 | ) | (290,973 | ) | ||||||||||
| Income (loss) from continuing operations before income taxes | $ | (112,918 | ) | $ | (150,377 | ) | $ | (165,684 | ) | $ | (397,206 | ) | $ | (640,475 | ) | |||||
1-5
NABORS INDUSTRIES LTD. AND SUBSIDIARIES
RECONCILIATION OF NET DEBT TO TOTAL DEBT
| September 30, | June 30, | December 31, | ||||||||||
| 2021 | 2021 | 2020 | ||||||||||
| (In thousands) | (Unaudited) | |||||||||||
| Current portion of debt | $ | - | $ | - | $ | - | ||||||
| Long-term debt | 3,075,520 | 2,823,125 | 2,968,701 | |||||||||
| Total Debt | 3,075,520 | 2,823,125 | 2,968,701 | |||||||||
| Less: Cash and short-term investments | 771,884 | 399,897 | 481,746 | |||||||||
| Net Debt | $ | 2,303,636 | $ | 2,423,228 | $ | 2,486,955 | ||||||
1-6
NABORS INDUSTRIES LTD. AND SUBSIDIARIES
RECONCILIATION OF FREE CASH FLOW TO
NET CASH PROVIDED BY OPERATING ACTIVITIES
(Unaudited)
| Three Months Ended | Nine Months Ended | |||||||||||
| September 30, | June 30, | September 30, | ||||||||||
| (In thousands) | 2021 | 2021 | 2021 | |||||||||
| Net cash provided by operating activities | $ | 113,280 | $ | 133,713 | $ | 326,483 | ||||||
| Net cash provided by (used for) investing activities | 19,831 | (65,800 | ) | (65,088 | ) | |||||||
| Free cash flow | $ | 133,111 | $ | 67,913 | $ | 261,395 | ||||||
Free cash flow represents net cash provided by operating activities less cash used for investing activities. Free cash flow is an indicator of our ability to generate cash flow after required spending to maintain or expand our asset base. Management believes that this non-GAAP measure is useful information to investors when comparing our cash flows with the cash flows of other companies. This non-GAAP measure has limitations and therefore should not be used in isolation or as a substitute for the amounts reported in accordance with GAAP. However, management evaluates the performance of the consolidated Company based on several criteria, including free cash flow, because it believes that these financial measures accurately reflect the Company's ongoing profitability and performance.
1-7
Exhibit 99.2
NABORS INDUSTRIES LTD. NABORS INDUSTRIES LTD. 3Q 2021 Earnings Presentation NABORS October 26, 2021
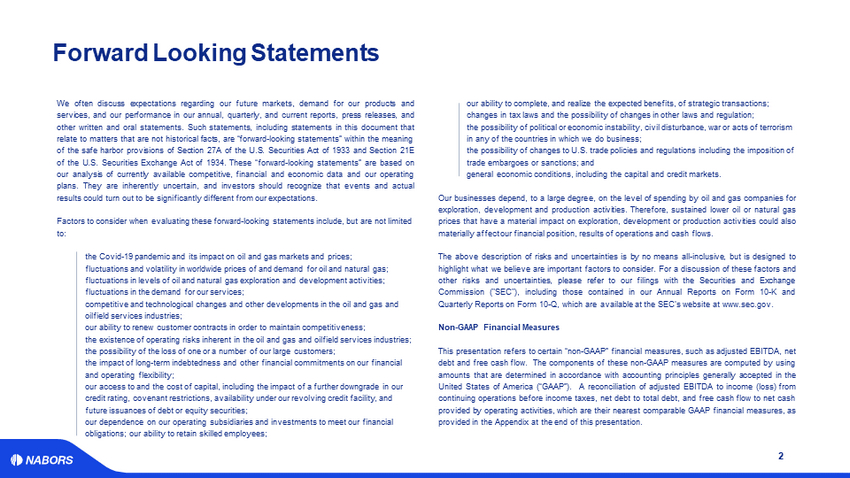
Forward Looking Statements • our ability to complete, and realize the expected benefits, of strategic transactions; • changes in tax laws and the possibility of changes in other laws and regulation; • the possibility of political or economic instability, civil disturbance, war or acts of terrorism in any of the countries in which we do business; • the possibility of changes to U.S. trade policies and regulations including the imposition of trade embargoes or sanctions; and • general economic conditions, including the capital and credit markets. Our businesses depend, to a large degree, on the level of spending by oil and gas companies for exploration, development and production activities . Therefore, sustained lower oil or natural gas prices that have a material impact on exploration, development or production activities could also materially affect our financial position, results of operations and cash flows . The above description of risks and uncertainties is by no means all - inclusive, but is designed to highlight what we believe are important factors to consider . For a discussion of these factors and other risks and uncertainties, please refer to our filings with the Securities and Exchange Commission ("SEC"), including those contained in our Annual Reports on Form 10 - K and Quarterly Reports on Form 10 - Q, which are available at the SEC's website at www . sec . gov . Non - GAAP Financial Measures This presentation refers to certain “non - GAAP” financial measures, such as adjusted EBITDA, net debt and free cash flow . The components of these non - GAAP measures are computed by using amounts that are determined in accordance with accounting principles generally accepted in the United States of America (“GAAP”) . A reconciliation of adjusted EBITDA to income (loss) from continuing operations before income taxes, net debt to total debt, and free cash flow to net cash provided by operating activities, which are their nearest comparable GAAP financial measures, as provided in the Appendix at the end of this presentation . We often discuss expectations regarding our future markets, demand for our products and services, and our performance in our annual, quarterly, and current reports, press releases, and other written and oral statements . Such statements, including statements in this document that relate to matters that are not historical facts, are “forward - looking statements” within the meaning of the safe harbor provisions of Section 27 A of the U . S . Securities Act of 1933 and Section 21 E of the U . S . Securities Exchange Act of 1934 . These “forward - looking statements” are based on our analysis of currently available competitive, financial and economic data and our operating plans . They are inherently uncertain, and investors should recognize that events and actual results could turn out to be significantly different from our expectations . Factors to consider when evaluating these forward - looking statements include, but are not limited to: • the Covid - 19 pandemic and its impact on oil and gas markets and prices; • fluctuations and volatility in worldwide prices of and demand for oil and natural gas; • fluctuations in levels of oil and natural gas exploration and development activities; • fluctuations in the demand for our services; • competitive and technological changes and other developments in the oil and gas and oilfield services industries; • our ability to renew customer contracts in order to maintain competitiveness; • the existence of operating risks inherent in the oil and gas and oilfield services industries; • the possibility of the loss of one or a number of our large customers; • the impact of long - term indebtedness and other financial commitments on our financial and operating flexibility; • our access to and the cost of capital, including the impact of a further downgrade in our credit rating, covenant restrictions, availability under our revolving credit facility, and future issuances of debt or equity securities; • our dependence on our operating subsidiaries and investments to meet our financial obligations; our ability to retain skilled employees; 2
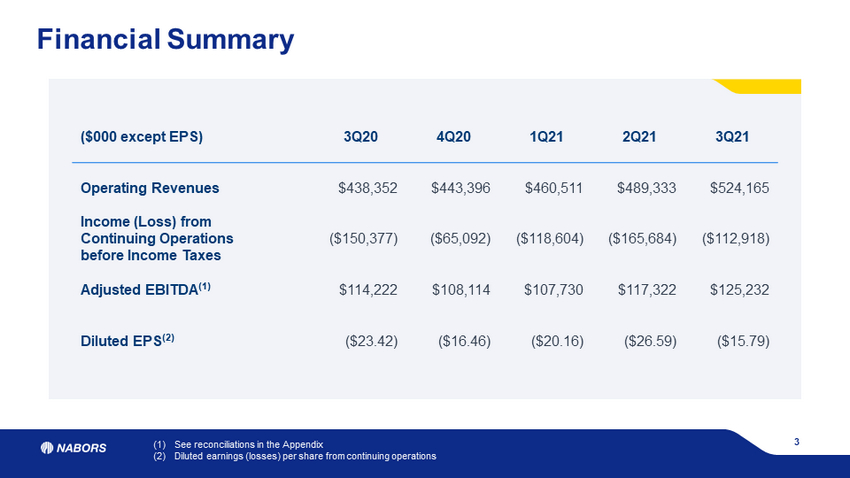
3 Financial Summary (1) See reconciliations in the Appendix (2) Diluted earnings (losses) per share from continuing operations ($000 except EPS) 3Q20 4Q20 1Q21 2Q21 3Q21 Operating Revenues $438,352 $443,396 $460,511 $489,333 $524,165 Income (Loss) from Continuing Operations before Income Taxes ($150,377) ($65,092) ($118,604) ($165,684) ($112,918) Adjusted EBITDA (1) $114,222 $108,114 $107,730 $117,322 $125,232 Diluted EPS (2) ($23.42) ($16.46) ($20.16) ($26.59) ($15.79)
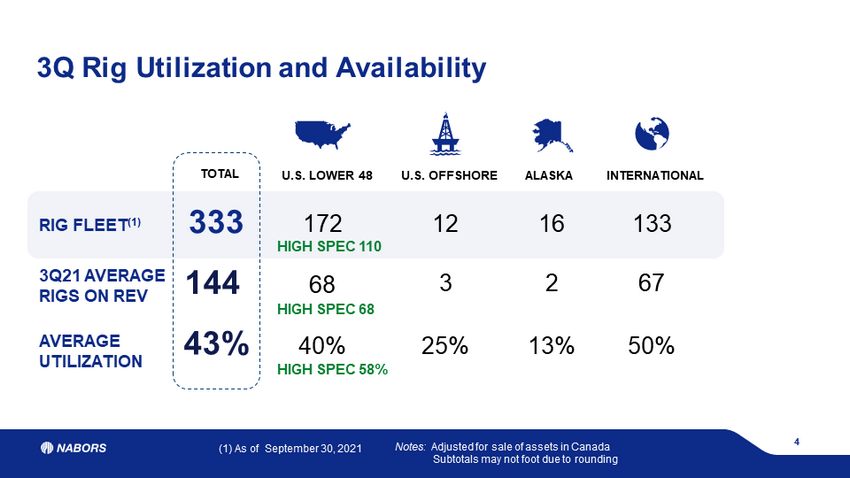
4 3Q Rig Utilization and Availability RIG FLEET (1) 333 3Q21 AVERAGE RIGS ON REV 144 AVERAGE UTILIZATION 43% (1) As of September 30, 2021 TOTAL U.S. OFFSHORE 12 3 25% 16 2 13% ALASKA INTERNATIONAL 133 67 50% 172 68 40% U.S. LOWER 48 HIGH SPEC 110 HIGH SPEC 68 HIGH SPEC 58% Notes: Adjusted for sale of assets in Canada Subtotals may not foot due to rounding
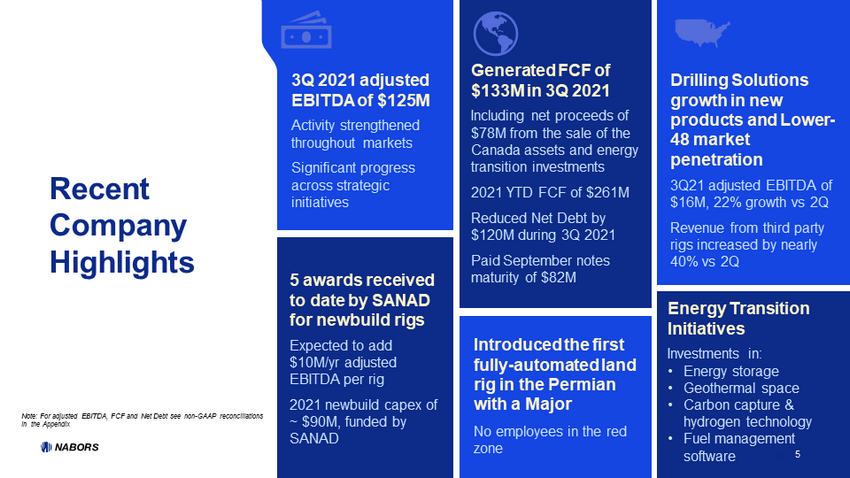
Recent Company Highlights Generated FCF of $133M in 3Q 2021 Including net proceeds of $78M from the sale of the Canada assets and energy transition investments 2021 YTD FCF of $261M Reduced Net Debt by $120M during 3Q 2021 Paid September notes maturity of $82M Introduced the first fully - automated land rig in the Permian with a Major No employees in the red zone 3Q 2021 adjusted EBITDA of $125M Activity strengthened throughout markets Significant progress across strategic initiatives Drilling Solutions growth in new products and Lower - 48 market penetration 3Q21 adjusted EBITDA of $16M, 22% growth vs 2Q Revenue from third party rigs increased by nearly 40% vs 2Q 5 awards received to date by SANAD for newbuild rigs Expected to add $10M/ yr adjusted EBITDA per rig 2021 newbuild capex of ~ $90M, funded by SANAD Energy Transition Initiatives Investments in: • Energy storage • Geothermal space • Carbon capture & hydrogen technology • Fuel management software 5 Note: For adjusted EBITDA, FCF and Net Debt see non - GAAP reconciliations in the Appendix 5
Performance excellence in the Lower - 48 Resilience leading to growth in our International segment Improving outlook for our technology & innovation Progress on our commitment to delever Leading in Sustainability and the Energy Transition 6 Five Keys to Excellence 1 4 3 2 5
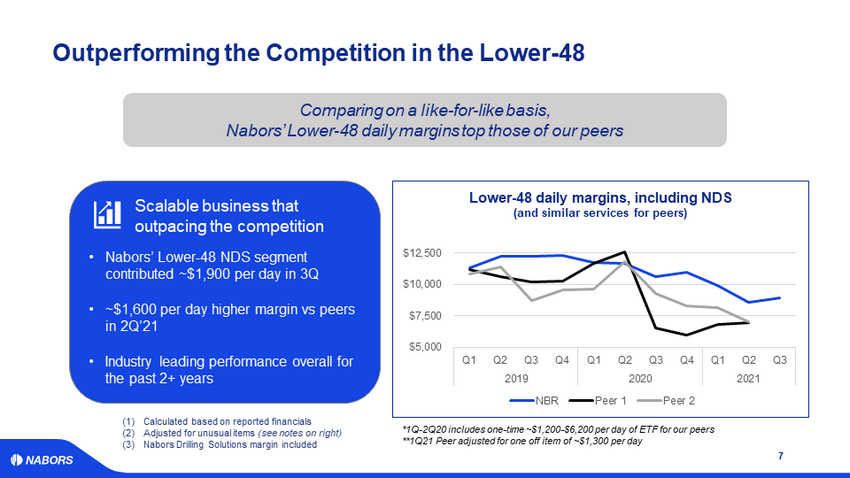
$5,000 $7,500 $10,000 $12,500 Q1 Q2 Q3 Q4 Q1 Q2 Q3 Q4 Q1 Q2 Q3 2019 2020 2021 Lower - 48 daily margins, including NDS (and similar services for peers) NBR Peer 1 Peer 2 Outperforming the Competition in the Lower - 48 7 Comparing on a like - for - like basis, Nabors’ Lower - 48 daily margins top those of our peers (1) Calculated based on reported financials (2) Adjusted for unusual items (see notes on right) (3) Nabors Drilling Solutions margin included Scalable business that outpacing the competition • Nabors’ Lower - 48 NDS segment contributed ~$1,900 per day in 3Q • ~$1,600 per day higher margin vs peers in 2Q’21 • Industry leading performance overall for the past 2+ years *1Q - 2Q20 includes one - time ~$1,200 - $6,200 per day of ETF for our peers **1Q21 Peer adjusted for one off item of ~$1,300 per day
Performance excellence in the Lower - 48 Resilience leading to growth in our International segment Improving outlook for our technology & innovation Progress on our commitment to delever Leading in Sustainability and the Energy Transition 8 1 4 3 2 5 Five Keys to Excellence
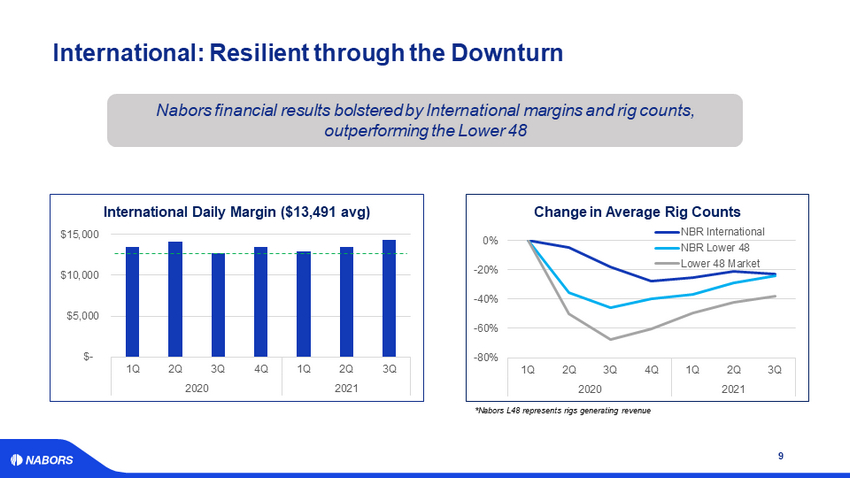
$- $5,000 $10,000 $15,000 1Q 2Q 3Q 4Q 1Q 2Q 3Q 2020 2021 International Daily Margin ($13,491 avg ) -80% -60% -40% -20% 0% 1Q 2Q 3Q 4Q 1Q 2Q 3Q 2020 2021 Change in Average Rig Counts NBR International NBR Lower 48 Lower 48 Market International: Resilient through the Downturn 9 Nabors financial results bolstered by International margins and rig counts, outperforming the Lower 48 *Nabors L48 represents rigs generating revenue
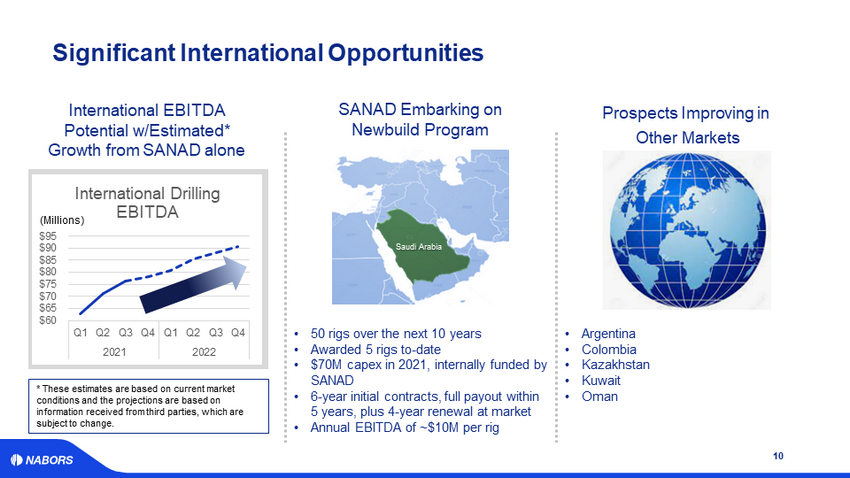
$60 $65 $70 $75 $80 $85 $90 $95 Q1 Q2 Q3 Q4 Q1 Q2 Q3 Q4 2021 2022 International Drilling EBITDA Significant International Opportunities 10 • 50 rigs over the next 10 years • Awarded 5 rigs to - date • $70M capex in 2021, internally funded by SANAD • 6 - year initial contracts, full payout within 5 years, plus 4 - year renewal at market • Annual EBITDA of ~$10M per rig SANAD Embarking on Newbuild Program Prospects Improving in Other Markets (Millions) • Argentina • Colombia • Kazakhstan • Kuwait • Oman International EBITDA Potential w/Estimated* Growth from SANAD alone Saudi Arabia * These estimates are based on current market conditions and the projections are based on information received from third parties, which are subject to change.
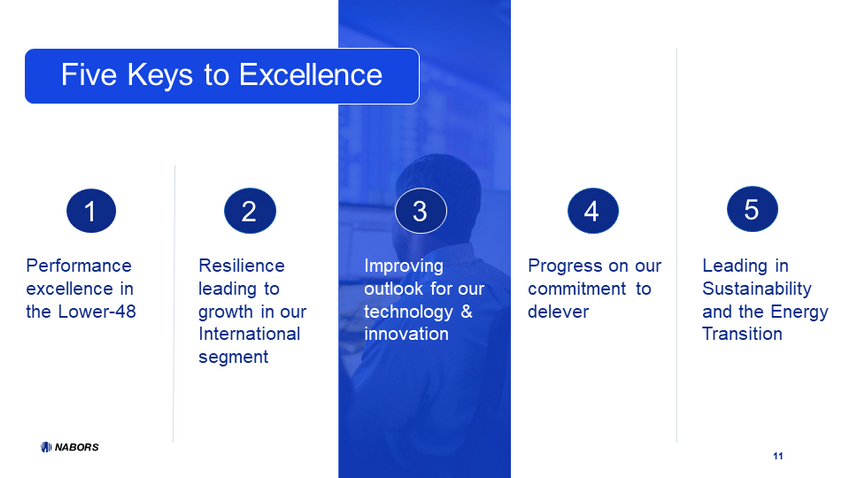
Performance excellence in the Lower - 48 Resilience leading to growth in our International segment Improving outlook for our technology & innovation Progress on our commitment to delever Leading in Sustainability and the Energy Transition 11 1 4 3 2 5 Five Keys to Excellence
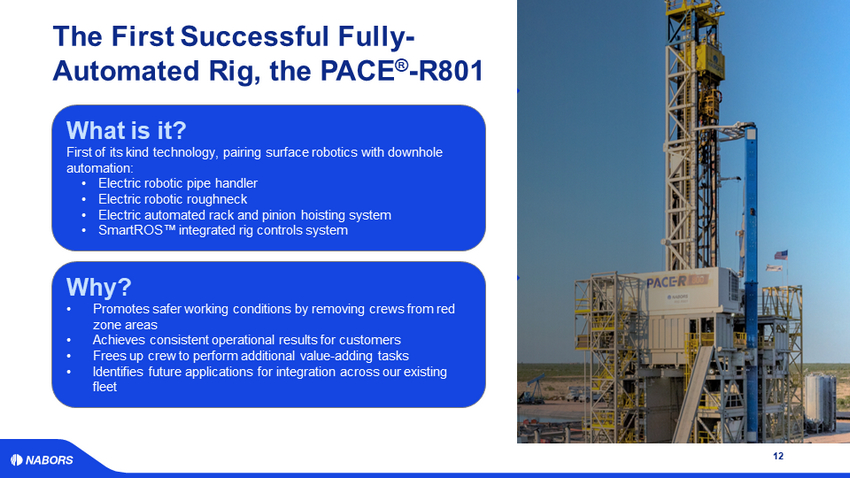
The First Successful Fully - Automated Rig, the PACE ® - R801 12 What is it? First of its kind technology, pairing surface robotics with downhole automation : • Electric robotic pipe handler • Electric robotic roughneck • Electric automated rack and pinion hoisting system • SmartROS Œ integrated rig controls system Why? • Promotes safer working conditions by removing crews from red zone areas • Achieves consistent operational results for customers • Frees up crew to perform additional value - adding tasks • Identifies future applications for integration across our existing fleet
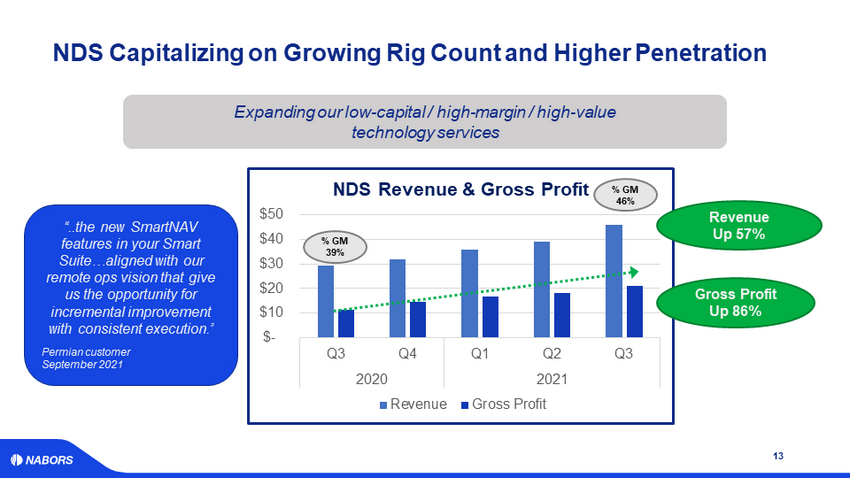
$- $10 $20 $30 $40 $50 Q3 Q4 Q1 Q2 Q3 2020 2021 NDS Revenue & Gross Profit Revenue Gross Profit NDS Capitalizing on Growing Rig Count and Higher Penetration 13 Revenue Up 57% Gross Profit Up 86% % GM 39% % GM 46% Expanding our low - capital / high - margin / high - value technology services “..the new SmartNAV features in your Smart Suite…aligned with our remote ops vision that give us the opportunity for incremental improvement with consistent execution.” Permian customer September 2021
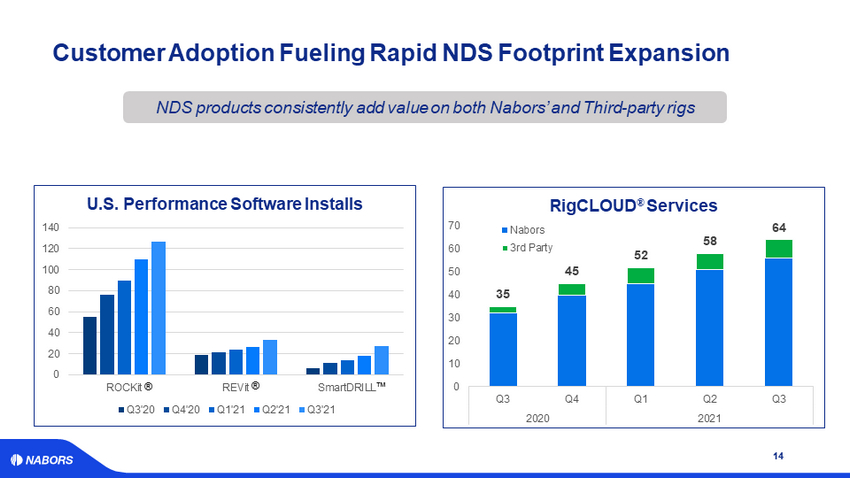
0 20 40 60 80 100 120 140 ROCKit REVit SmartDRILL U.S. Performance Software Installs Q3'20 Q4'20 Q1'21 Q2'21 Q3'21 Customer Adoption Fueling Rapid NDS Footprint Expansion 14 NDS products consistently add value on both Nabors’ and Third - party rigs 35 45 52 58 64 0 10 20 30 40 50 60 70 Q3 Q4 Q1 Q2 Q3 2020 2021 RigCLOUD ® Services Nabors 3rd Party ® Œ ®
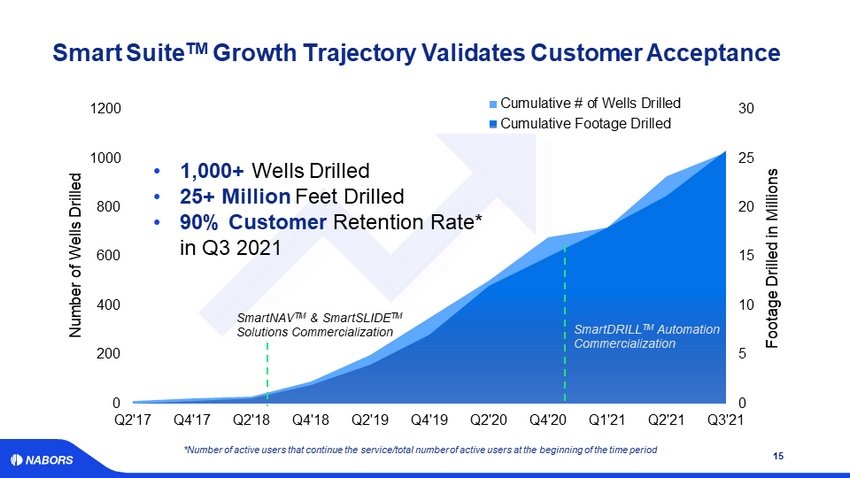
0 5 10 15 20 25 30 0 200 400 600 800 1000 1200 Q2'17 Q4'17 Q2'18 Q4'18 Q2'19 Q4'19 Q2'20 Q4'20 Q1'21 Q2'21 Q3'21 Footage Drilled in Millions Number of Wells Drilled Cumulative # of Wells Drilled Cumulative Footage Drilled • 1,000+ Wells Drilled • 25+ Million Feet Drilled • 90% Customer Retention Rate* in Q3 2021 SmartDRILL TM Automation Commercialization SmartNAV TM & SmartSLIDE TM Solutions Commercialization *Number of active users that continue the service/total number of active users at the beginning of the time period Smart Suite TM Growth Trajectory Validates Customer Acceptance 15
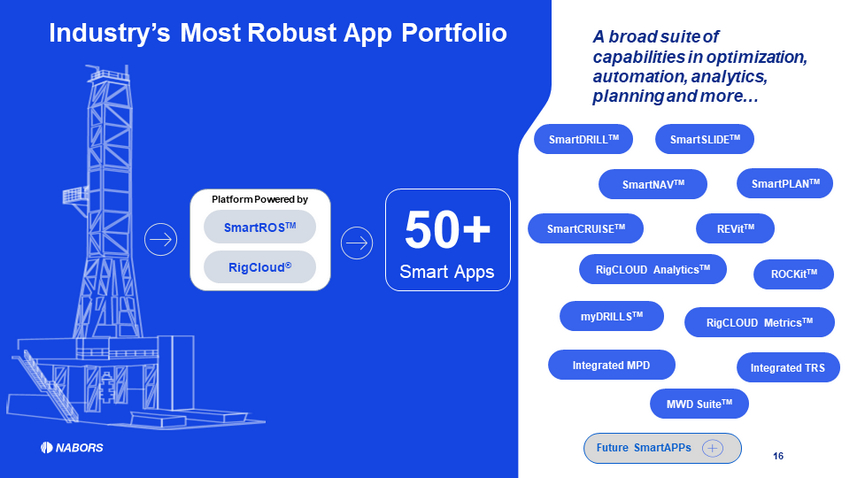
Platform Powered by SmartROS TM 16 RigCloud ® Industry’s Most Robust App Portfolio 50+ Smart Apps SmartNAV TM SmartSLIDE TM SmartPLAN TM SmartDRILL TM SmartCRUISE TM RigCLOUD Analytics TM myDRILLS TM MWD Suite TM REVit TM ROCKit TM RigCLOUD Metrics TM Integrated TRS Integrated MPD A broad suite of capabilities in optimization, automation, analytics, planning and more… Future SmartAPPs
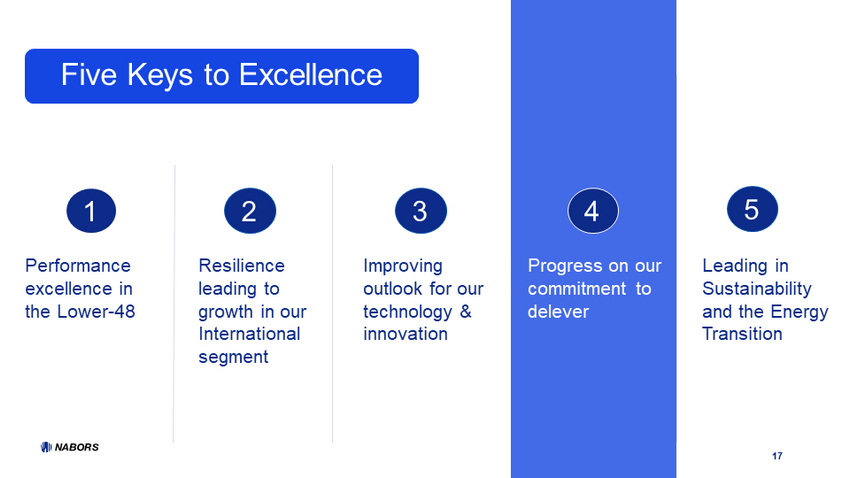
Performance excellence in the Lower - 48 Resilience leading to growth in our International segment Improving outlook for our technology & innovation Progress on our commitment to delever Leading in Sustainability and the Energy Transition 17 1 4 3 2 5 Five Keys to Excellence
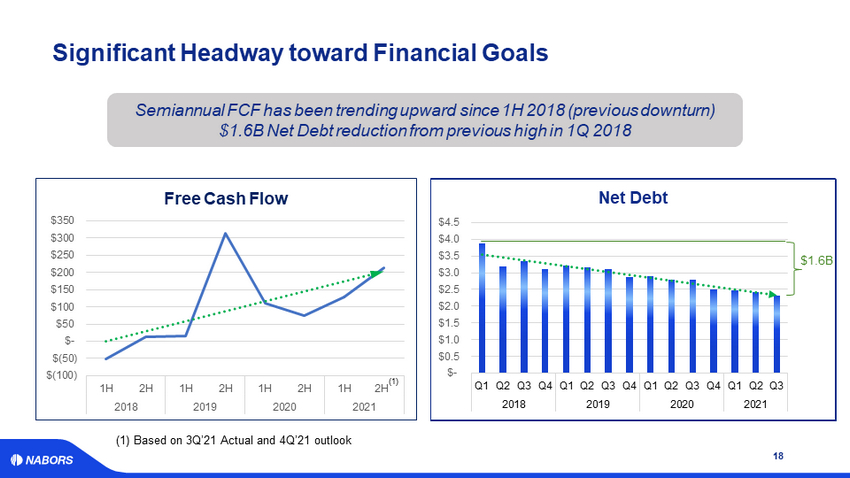
$- $0.5 $1.0 $1.5 $2.0 $2.5 $3.0 $3.5 $4.0 $4.5 Q1 Q2 Q3 Q4 Q1 Q2 Q3 Q4 Q1 Q2 Q3 Q4 Q1 Q2 Q3 2018 2019 2020 2021 Net Debt $(100) $(50) $- $50 $100 $150 $200 $250 $300 $350 1H 2H 1H 2H 1H 2H 1H YTD 2018 2019 2020 2021 Free Cash Flow Significant Headway toward Financial Goals 18 Semiannual FCF has been trending upward since 1H 2018 (previous downturn) $1.6B Net Debt reduction from previous high in 1Q 2018 $1.6B (1) Based on 3Q’21 Actual and 4Q’21 outlook $(100) $(50) $- $50 $100 $150 $200 $250 $300 $350 1H 2H 1H 2H 1H 2H 1H 2H 2018 2019 2020 2021 Free Cash Flow (1)
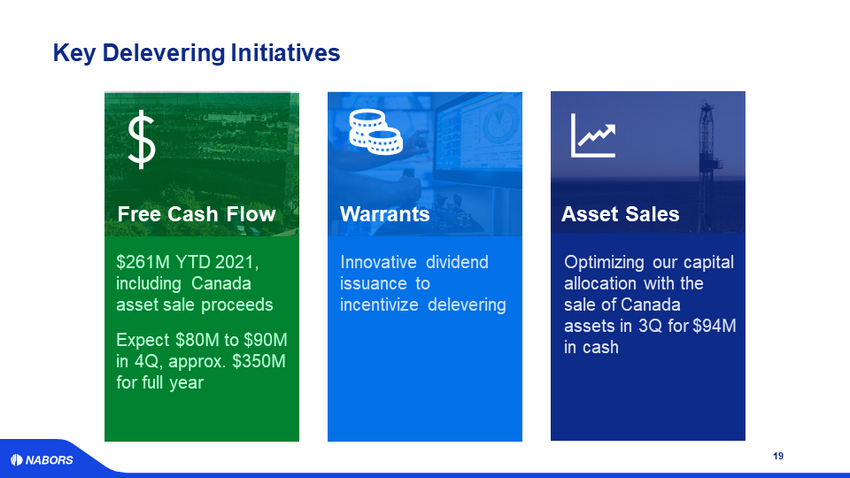
Optimizing our capital allocation with the sale of Canada assets in 3Q for $94M in cash $261M YTD 2021, including Canada asset sale proceeds Expect $80M to $90M in 4Q, approx. $350M for full year Free Cash Flow Key Delevering Initiatives 19 Asset Sales Innovative dividend issuance to incentivize delevering Warrants
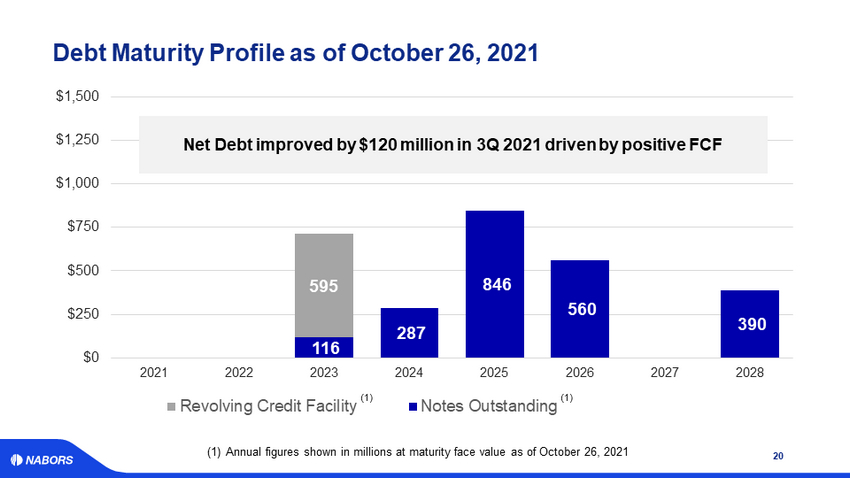
116 287 846 560 390 595 $0 $250 $500 $750 $1,000 $1,250 $1,500 2021 2022 2023 2024 2025 2026 2027 2028 Revolving Credit Facility Notes Outstanding Debt Maturity Profile as of October 26, 2021 20 (1) Net Debt improved by $120 million in 3Q 2021 driven by positive FCF (1) (1) Annual figures shown in millions at maturity face value as of October 26, 2021
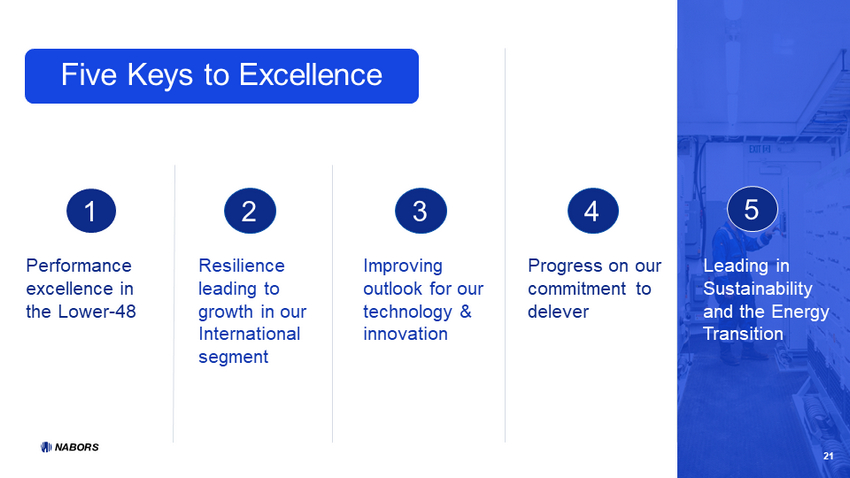
Improving outlook for our technology & innovation Performance excellence in the Lower - 48 Resilience leading to growth in our International segment Progress on our commitment to delever Leading in Sustainability and the Energy Transition 21 1 4 3 2 5 Five Keys to Excellence
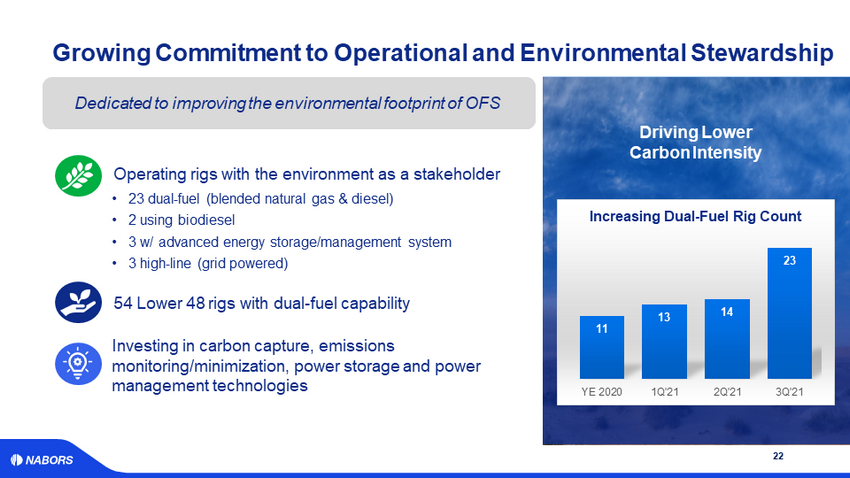
Growing Commitment to Operational and Environmental Stewardship 22 11 13 14 23 YE 2020 1Q'21 2Q'21 3Q'21 Increasing Dual - Fuel Rig Count 54 Lower 48 rigs with dual - fuel capability • 23 dual - fuel (blended natural gas & diesel) • 2 using biodiesel • 3 w/ advanced energy storage/management system • 3 high - line (grid powered) Operating rigs with the environment as a stakeholder Dedicated to improving the environmental footprint of OFS Driving Lower Carbon Intensity Investing in carbon capture, emissions monitoring/minimization, power storage and power management technologies
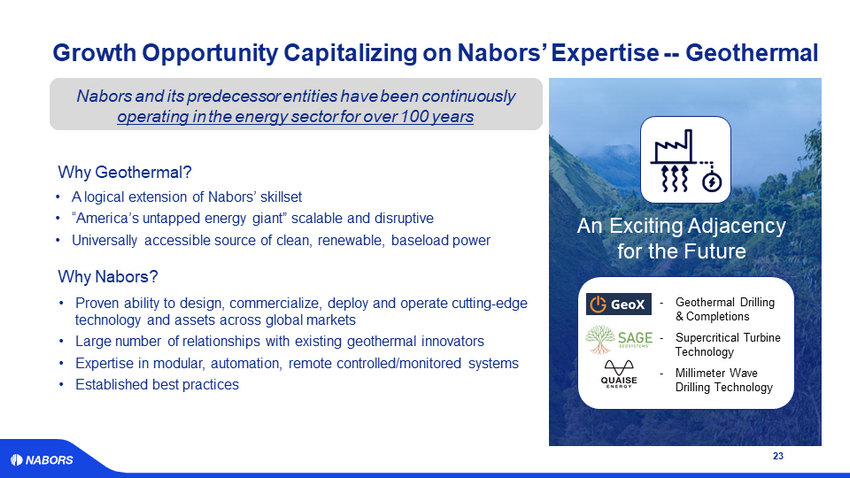
Growth Opportunity Capitalizing on Nabors’ Expertise -- Geothermal 23 An Exciting Adjacency for the Future Nabors and its predecessor entities have been continuously operating in the energy sector for over 100 years • Proven ability to design, commercialize, deploy and operate cutting - edge technology and assets across global markets • Large number of relationships with existing geothermal innovators • Expertise in modular, automation, remote controlled/monitored systems • Established best practices - Geothermal Drilling & Completions - Supercritical Turbine Technology - Millimeter Wave Drilling Technology Why Nabors? • A logical extension of Nabors’ skillset • “America’s untapped energy giant” scalable and disruptive • Universally accessible source of clean, renewable, baseload power Why Geothermal?
24 Investment Thesis Driving the evolution of energy production technology with the leading position in automation and digitalization, largest international footprint, and commitment to advancing the energy transition NABORS

Appendix 25
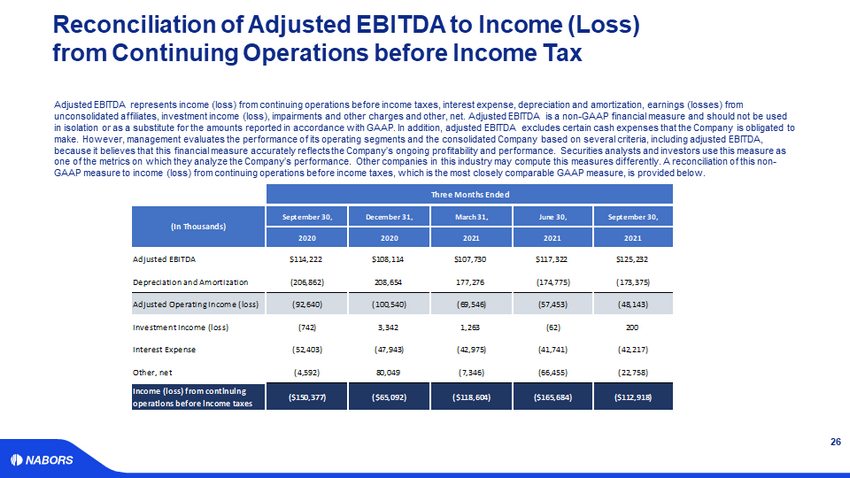
Reconciliation of Adjusted EBITDA to Income (Loss) from Continuing Operations before Income Tax 26 Adjusted EBITDA represents income (loss) from continuing operations before income taxes, interest expense, depreciation and a mor tization, earnings (losses) from unconsolidated affiliates, investment income (loss), impairments and other charges and other, net. Adjusted EBITDA is a non - GAAP financial measure and should not be used in isolation or as a substitute for the amounts reported in accordance with GAAP. In addition, adjusted EBITDA excludes certa in cash expenses that the Company is obligated to make. However, management evaluates the performance of its operating segments and the consolidated Company based on several c rit eria, including adjusted EBITDA, because it believes that this financial measure accurately reflects the Company’s ongoing profitability and performance. Sec uri ties analysts and investors use this measure as one of the metrics on which they analyze the Company’s performance. Other companies in this industry may compute this measur es differently. A reconciliation of this non - GAAP measure to income (loss) from continuing operations before income taxes, which is the most closely comparable GAAP measu re, is provided below. Three Months Ended September 30, December 31, March 31, June 30, September 30, 2020 2020 2021 2021 2021 Adjusted EBITDA $114,222 $108,114 $107,730 $117,322 $125,232 Depreciation and Amortization (206,862) 208,654 177,276 (174,775) (173,375) Adjusted Operating Income (loss) (92,640) (100,540) (69,546) (57,453) (48,143) Investment Income (loss) (742) 3,342 1,263 (62) 200 Interest Expense (52,403) (47,943) (42,975) (41,741) (42,217) Other, net (4,592) 80,049 (7,346) (66,455) (22,758) Income (loss) from continuing operations before income taxes ($150,377) ($65,092) ($118,604) ($165,684) ($112,918) (In Thousands)
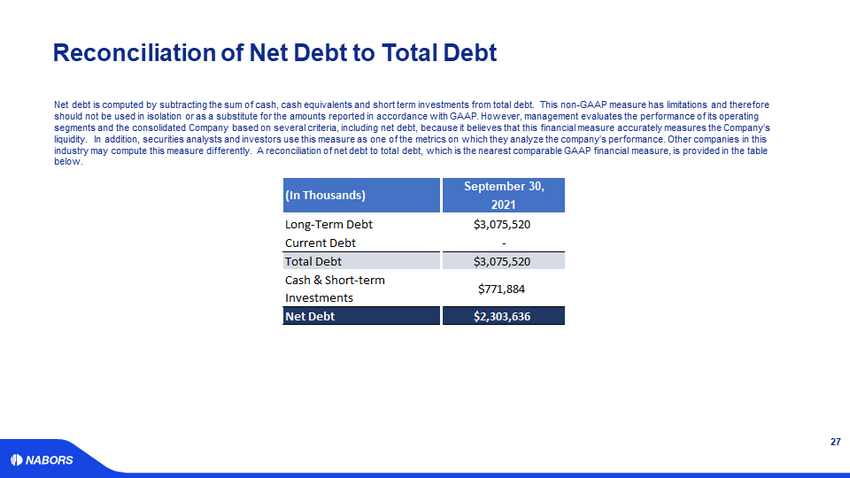
September 30, 2021 Long-Term Debt $3,075,520 Current Debt - Total Debt $3,075,520 Cash & Short-term Investments $771,884 Net Debt $2,303,636 (In Thousands) Reconciliation of Net Debt to Total Debt 27 Net debt is computed by subtracting the sum of cash, cash equivalents and short term investments from total debt. This non - GAAP measure has limitations and therefore should not be used in isolation or as a substitute for the amounts reported in accordance with GAAP. However, management eval uat es the performance of its operating segments and the consolidated Company based on several criteria, including net debt, because it believes that this financial mea sure accurately measures the Company’s liquidity. In addition, securities analysts and investors use this measure as one of the metrics on which they analyze the comp any’s performance. Other companies in this industry may compute this measure differently. A reconciliation of net debt to total debt, which is the nearest comparable GAAP financial measure, is provided in the table below.
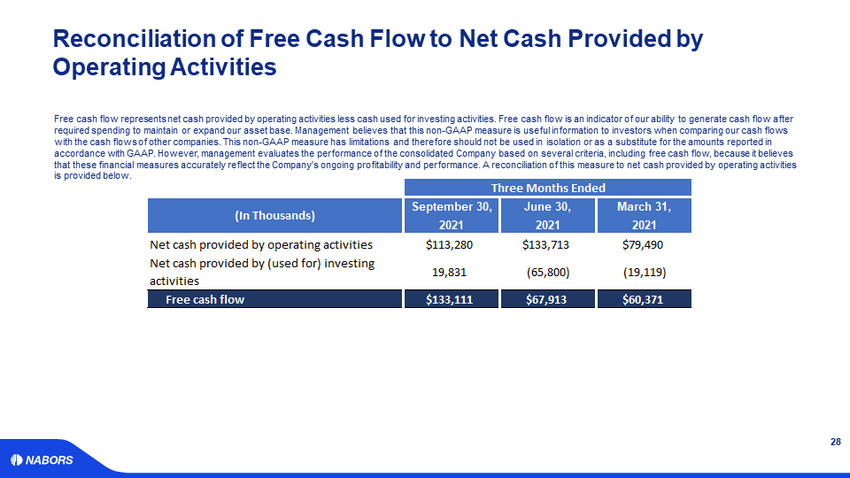
Three Months Ended September 30, June 30, March 31, 2021 2021 2021 Net cash provided by operating activities $113,280 $133,713 $79,490 Net cash provided by (used for) investing activities 19,831 (65,800) (19,119) Free cash flow $133,111 $67,913 $60,371 (In Thousands) Reconciliation of Free Cash Flow to Net Cash Provided by Operating Activities 28 Free cash flow represents net cash provided by operating activities less cash used for investing activities. Free cash flow i s a n indicator of our ability to generate cash flow after required spending to maintain or expand our asset base. Management believes that this non - GAAP measure is useful information to investors when comparing our cash flows with the cash flows of other companies. This non - GAAP measure has limitations and therefore should not be used in isolation or a s a substitute for the amounts reported in accordance with GAAP. However, management evaluates the performance of the consolidated Company based on several criteria, in clu ding free cash flow, because it believes that these financial measures accurately reflect the Company's ongoing profitability and performance. A reconciliation of thi s m easure to net cash provided by operating activities is provided below.
NABORS.COM NABORS CORPORATE SERVICES 515 W. Greens Road Suite 1200 Houston, TX 77067 - 4525 Contact Us: William C. Conroy VP - Corporate Development and Investor Relations [email protected] Kara K. Peak Director - Corporate Development and Investor Relations [email protected] NABORS.COM