
NJR 8-K
New Jersey Resources Corp (NJR)
8-K
2021-11-18
For: 2021-11-17
View Original
Added on
April 08, 2026
UNITED STATES
SECURITIES AND EXCHANGE COMMISSION
Washington, DC 20549
FORM 8-K
CURRENT REPORT
PURSUANT TO SECTION 13 OR 15(d) OF THE
SECURITIES EXCHANGE ACT OF 1934
Date of Report (Date of earliest event reported): November 17, 2021
(Exact Name of registrant as specified in its charter)
|
|
|
|
|
(State or Other Jurisdiction of Incorporation)
|
(Commission File Number)
|
(IRS Employer Identification No.)
|
|
|
|
|
|
(Address of Principal Executive Offices)
|
(Zip Code)
|
(732 ) 938-1480
(Registrant’s telephone number, including area code)
Check the appropriate box below if the Form 8-K filing is intended to simultaneously satisfy the filing obligation of the registrant under any of the following
provisions:
|
Written communications pursuant to Rule 425 under the Securities Act (17 CFR 230.425)
|
|
Soliciting material pursuant to Rule 14a-12 under the Exchange Act (17 CFR 240.14a-12)
|
|
Pre-commencement communications pursuant to Rule 14d-2(b) under the Exchange Act (17 CFR 240.14d-2(b))
|
|
Pre-commencement communications pursuant to Rule 13e-4(c) under the Exchange Act (17 CFR 240.13e-4(c))
|
Securities registered pursuant to Section 12(b) of the Act:
|
Title of each class
|
Trading Symbol(s)
|
Name of each exchange on which registered
|
||
|
|
|
|
Indicate by check mark whether the registrant is an emerging growth company as defined in Rule 405 of the Securities Act of 1933 (§230.405 of this chapter) or Rule 12b-2
of the Securities Exchange Act of 1934 (§240.12b-2 of this chapter).
Emerging growth company ☐
If an emerging growth company, indicate by check mark if the registrant has elected not to use the extended transition period for complying with any new or revised
financial accounting standards provided pursuant to Section 13(a) of the Exchange Act. ☐
| Item 2.02 |
Results of Operations and Financial Condition.
|
On November 18, 2021, New Jersey Resources Corporation (“NJR”) issued a press release reporting financial results for the fourth fiscal quarter and fiscal year ended
September 30, 2021 (the “Earnings Release”). A copy of the Earnings Release is attached hereto as Exhibit 99.1 and is incorporated herein by reference.
| Item 7.01 |
Regulation FD Disclosure.
|
Earnings Presentation
NJR will deliver a presentation via live public webcast on November 18, 2021, at 10:00 a.m. ET. The slides to be used for the presentation are
furnished herewith as Exhibit 99.2 and are incorporated by reference into Item 7.01 of this Current Report on Form 8-K.
Base Rate Case Settlement
On November 17, 2021, New Jersey Natural Gas Company (“NJNG”) issued a press release announcing it received approval from the New Jersey Board of Public Utilities on the
settlement of its rate case and conclusion of its Safety Acceleration and Facility Enhancement (SAFE II) and New Jersey Reinvestment in System Enhancement (NJ RISE) programs resulting in a $79.269 million increase to its base rates (the “Press
Release”) and published an investor fact sheet summarizing the base rate case filing (the “Investor Fact Sheet”). A copy of the Press Release and Investor Fact Sheet are attached hereto as Exhibit 99.3 and Exhibit 99.4, respectively.
The information in Item 7.01 of this Current Report on Form 8-K is being furnished and shall not be deemed “filed” for the purposes of Section 18 of the Securities
Exchange Act of 1934, as amended, or otherwise subject to the liabilities of that Section and shall not be deemed to be incorporated by reference into any registration statement or other document pursuant to the Securities Act of 1933, as amended.
| Item 9.01 |
Financial Statements and Exhibits.
|
(d) Exhibits.
|
Exhibit Number
|
Exhibit
|
|
|
104
|
Cover page in Inline XBRL format
|
SIGNATURE
Pursuant to the requirements of the Securities Exchange Act of 1934, the registrant has duly caused this report to be signed on its behalf by the undersigned hereunto
duly authorized.
|
NEW JERSEY RESOURCES CORPORATION
|
||
|
Date: November 18, 2021
|
By:
|
/s/ Patrick J. Migliaccio
|
|
Patrick J. Migliaccio
|
||
|
Senior Vice President and Chief Financial Officer
|
||
Exhibit 99.1

NEW JERSEY RESOURCES REPORTS FOURTH-QUARTER AND FISCAL 2021 RESULTS
AFFIRMS FISCAL 2022 GUIDANCE AND UPDATES LONG-TERM PROJECTED GROWTH RATE
WALL, N.J., November 18, 2021 — Today, New Jersey Resources Corporation (NYSE: NJR) reported results for the fourth-quarter and fiscal 2021. Highlights include:
| • |
Consolidated net income of $117.9 million for fiscal 2021 compared with $163.0 million in fiscal 2020
|
| • |
Consolidated net financial earnings (NFE), a non-GAAP financial measure of $207.7 million for fiscal 2021 , or $2.16 per share, compared with NFE of $165.3 million, or $1.74 per share, in fiscal 2020
|
| • |
Affirmed fiscal 2022 net financial earnings per share (NFEPS) guidance range of $2.20 to $2.30 and narrowed long-term projected NFEPS growth rate to 7 to 9 percent, from previous range of 6 to 10 percent
|
| • |
Increased annual dividend by nine percent to $1.45 per share
|
| • |
New Jersey Natural Gas (NJNG) received approval from the BPU on the settlement of its rate case authorizing a $79.0 million increase to its base rates
|
| • |
The Southern Reliability Link (SRL) was placed in service in fiscal 2021
|
| • |
NJNG's Hydrogen project was completed and began producing green hydrogen in October 2021
|
Fourth-quarter fiscal 2021 net (loss)/income totaled $(1.1) million, or $(0.01) per share, compared with $32.7 million, or $0.34 per share, during the same period in
fiscal 2020. Fiscal 2021 net income totaled $117.9 million, or $1.23 per share, compared with $163.0 million, or $1.72 per share, for fiscal 2020.
Fourth-quarter fiscal 2021 NFE totaled $6.6 million, or $0.07 per share, compared to NFE of $43.4 million, or $0.45 per share, during the same period in fiscal 2020.
Fiscal 2021 NFE totaled $207.7 million, or $2.16 per share, compared with $165.3 million, or $1.74 per share, for fiscal 2020. The difference between GAAP earnings and NFE is due primarily to a $92.0 million impairment ($74.5 million after
considering the related tax effects) of NJR's investment in the PennEast Project, which is excluded from NFE.
"Fiscal 2021 results exceeded the expectations we laid out at our Analyst Day last November, " said Steve Westhoven, President and CEO of NJR. "Strong execution against
our plan positions our diversified portfolio of infrastructure assets for long-term growth, creating value for shareowners and meeting the needs of our customers."
Key Performance Metrics
|
Three Months Ended
September 30,
|
Twelve Months Ended
September 30,
|
|||||||||||||||
|
($ in Thousands)
|
2021
|
2020
|
2021
|
2020
|
||||||||||||
|
Net income
|
$
|
(1,133
|
)
|
$
|
32,707
|
$
|
117,890
|
$
|
163,007
|
|||||||
|
Basic EPS
|
$
|
(0.01
|
)
|
$
|
0.34
|
$
|
1.23
|
$
|
1.72
|
|||||||
|
Net financial earnings
|
$
|
6,599
|
$
|
43,429
|
$
|
207,712
|
$
|
165,333
|
||||||||
|
Basic net financial earnings per share
|
$
|
0.07
|
$
|
0.45
|
$
|
2.16
|
$
|
1.74
|
||||||||
NJR Reports Fourth Quarter and Fiscal 2021 Results
Page 2 of 13
Effective October 1, 2020, NJR changed its method of accounting for Investment Tax Credits (ITCs) from the flow through method
to the deferral method. Our historical financial reporting presented herein has been retrospectively revised to apply this change. For additional details, please refer to our Form 10-K.
A reconciliation of net income to NFE for the three and twelve months ended September 30, 2021, and 2020, is provided below.
|
Three Months Ended
September 30, 2021
|
Twelve Months Ended
September 30,
|
|||||||||||||||
|
(Thousands)
|
2021
|
2020
|
2021
|
2020
|
||||||||||||
|
Net income
|
$
|
(1,133
|
)
|
$
|
32,707
|
$
|
117,890
|
$
|
163,007
|
|||||||
|
Add:
|
||||||||||||||||
|
Unrealized loss (gain) on derivative instruments and related transactions
|
40,576
|
12,183
|
54,203
|
(9,644
|
)
|
|||||||||||
|
Tax effect
|
(9,647
|
)
|
(2,893
|
)
|
(12,887
|
)
|
2,296
|
|||||||||
|
Effects of economic hedging related to natural gas inventory
|
(30,150
|
)
|
2,216
|
(42,405
|
)
|
12,690
|
||||||||||
|
Tax effect
|
7,166
|
(527
|
)
|
10,078
|
(3,016
|
)
|
||||||||||
|
Impairment of equity method investment
|
—
|
—
|
92,000
|
—
|
||||||||||||
|
Tax effect
|
767
|
—
|
(11,167
|
)
|
—
|
|||||||||||
|
Net income to NFE tax adjustment
|
(980
|
)
|
(257
|
)
|
—
|
—
|
||||||||||
|
Net financial earnings (loss)
|
$
|
6,599
|
$
|
43,429
|
$
|
207,712
|
$
|
165,333
|
||||||||
|
Weighted Average Shares Outstanding
|
||||||||||||||||
|
Basic
|
96,198
|
95,764
|
96,227
|
94,798
|
||||||||||||
|
Diluted
|
96,198
|
95,764
|
96,560
|
95,103
|
||||||||||||
|
Basic earnings (loss) per share
|
$
|
(0.01
|
)
|
$
|
0.34
|
$
|
1.23
|
$
|
1.72
|
|||||||
|
Add:
|
||||||||||||||||
|
Unrealized loss (gain) on derivative instruments and related transactions
|
0.42
|
0.13
|
0.56
|
(0.10
|
)
|
|||||||||||
|
Tax effect
|
(0.10
|
)
|
(0.03
|
)
|
(0.13
|
)
|
0.02
|
|||||||||
|
Effects of economic hedging related to natural gas inventory
|
(0.31
|
)
|
0.02
|
(0.44
|
)
|
0.13
|
||||||||||
|
Tax effect
|
0.07
|
(0.01
|
)
|
0.10
|
(0.03
|
)
|
||||||||||
|
Impairment of equity method investment
|
—
|
—
|
0.96
|
—
|
||||||||||||
|
Tax effect
|
0.01
|
—
|
(0.12
|
)
|
—
|
|||||||||||
|
Net income to NFE tax adjustment
|
(0.01
|
)
|
—
|
—
|
—
|
|||||||||||
|
Basic net financial earnings (loss) per share
|
$
|
0.07
|
$
|
0.45
|
$
|
2.16
|
$
|
1.74
|
||||||||
NFE is a measure of earnings based on the elimination of timing differences to effectively match the earnings effects of the economic hedges with the physical sale of
natural gas, SRECs and foreign currency contracts. Consequently, to reconcile net income and NFE, current-period unrealized gains and losses on the derivatives are excluded from NFE as a reconciling item. Realized derivative gains and losses are
also included in current-period net income. However, NFE includes only realized gains and losses related to natural gas sold out of inventory, effectively matching the full earnings effects of the derivatives with realized margins on physical
natural gas flows. NFE also excludes impairment charges associated with equity method investments, which are non-cash charges considered unusual in nature that occur infrequently and are not indicative of the Company's performance for its ongoing
operations. Included in the tax effects are current and deferred income tax expense corresponding with the components of NFE.
NJR Reports Fourth Quarter and Fiscal 2021 Results
Page 3 of 13
A table detailing NFE for the three and twelve months ended September 30, 2021, and 2020, is provided below.
Net Financial Earnings (Loss) by Business Unit
|
Three Months Ended
September 30,
|
Twelve Months Ended
September 30,
|
|||||||||||||||
|
(Thousands)
|
2021
|
2020
|
2021
|
2020
|
||||||||||||
|
New Jersey Natural Gas
|
$
|
(24,214
|
)
|
$
|
(15,258
|
)
|
$
|
107,375
|
$
|
126,902
|
||||||
|
Clean Energy Ventures
|
40,861
|
44,805
|
16,789
|
22,111
|
||||||||||||
|
Storage and Transportation
|
2,440
|
7,434
|
13,046
|
18,311
|
||||||||||||
|
Energy Services
|
(14,384
|
)
|
1,381
|
71,117
|
(7,873
|
)
|
||||||||||
|
Home Services and Other
|
(1,127
|
)
|
5,109
|
(826
|
)
|
5,784
|
||||||||||
|
Subtotal
|
3,576
|
43,471
|
207,501
|
165,235
|
||||||||||||
|
Eliminations
|
3,023
|
(42
|
)
|
211
|
98
|
|||||||||||
|
Total
|
$
|
6,599
|
$
|
43,429
|
$
|
207,712
|
$
|
165,333
|
||||||||
Fiscal 2022 NFE Guidance:
NJR reaffirmed fiscal 2022 NFE guidance of $2.20 to $2.30 per share and, as a result of the progress on our major infrastructure projects, narrowed the expected long-term
NFEPS growth range to 7 to 9 percent, from the previous range of 6 to 10 percent, subject to the risk and uncertainties identified below under "Forward-Looking Statements." The following chart represents NJR’s current expected contributions from
its subsidiaries for fiscal 2022:
|
Company
|
Expected Fiscal 2022
Net Financial Earnings Contribution
|
|
New Jersey Natural Gas
|
60 to 65 percent
|
|
Clean Energy Ventures
|
20 to 23 percent
|
|
Storage and Transportation
|
5 to 10 percent
|
|
Energy Services1
|
9 to 11 percent
|
|
Home Services and Other
|
0 to 1 percent
|
|
1. Assumes NFEPS contributions from Asset Management Agreements only
|
|
In providing fiscal 2022 NFE guidance and narrowing our expected long-term NFEPS growth range, management is aware there could be differences between reported GAAP
earnings and NFE due to matters such as, but not limited to, the positions of our energy-related derivatives. Management is not able to reasonably estimate the aggregate impact or significance of these items on reported earnings and, therefore, is
not able to provide a reconciliation to the corresponding GAAP equivalent for its operating earnings guidance without unreasonable efforts.
New Jersey Natural Gas
NJNG reported fiscal 2021 NFE of $107.4 million, compared to NFE of $126.9 million during fiscal 2020. Fourth-quarter fiscal 2021 net financial loss was $24.2 million,
compared to net financial loss of $15.3 million during the same period in fiscal 2020. The decrease for both periods was due to higher O&M expenses primarily related to increased bad debt.
NJR Reports Fourth Quarter and Fiscal 2021 Results
Page 4 of 13
Customer Growth:
| • |
NJNG added 7,854 new customers during fiscal 2021, compared with 8,349 in fiscal 2020. The lower customer growth was due primarily to the effects of the COVID-19 pandemic. NJNG expects to return to a more typical customer growth rate of
1.7% in fiscal 2022.
|
Base Rate Filing:
| • |
On November 17, 2021, NJNG received approval from the New Jersey Board of Public Utilities on its rate
case settlement agreement and new rates will be effective on December 1, 2021. Under the approved rate case agreement, NJNG's total annual revenue is expected to increase by $79.0 million. The rate case agreement includes a return on equity of 9.60% with a 54.0% common equity ratio and
reflects a rate base of $2.52 billion with an overall rate of return of 6.84%.
|
Infrastructure Update:
| • |
The Southern Reliability Link diversifies supply to our customers by providing a new intrastate feed into the southern end of NJNG’s distribution system. Construction was completed and the project was placed in service in August 2021. The recovery of
our investment in this project was included in the recently settled rate case.
|
| • |
NJNG's Infrastructure Investment Program (IIP) is a five-year, $150 million accelerated recovery program that began in fiscal 2021 and consists of a series of infrastructure projects designed to enhance the safety and reliability of NJNG's natural gas
distribution system. In fiscal 2021, NJNG spent $9.4 million under the program to begin work on various distribution system reinforcement projects.
|
| • |
The Howell Green Hydrogen Project delivers hydrogen through NJNG's utility distribution pipeline to heat customers' homes and businesses and began commercial operation in October 2021. The recovery of investment in this project was included in
the recently settled rate case.
|
BGSS Incentive Programs:
BGSS incentive programs contributed $13.4 million to utility gross margin, compared with $9.5 million during fiscal 2020. The higher results for fiscal 2021 were due to
improved margins in off-system sales and storage incentives compared to fiscal 2020.
For more information on utility gross margin, please see "Non-GAAP Financial Information" at the end of the press release.
Energy-Efficiency Programs:
On July 1, 2021, NJNG's new three-year, $259 million SAVEGREEN program became effective. SAVEGREEN invested $31.0 million during fiscal 2021 to help customers with energy-efficiency upgrades for their homes and businesses. NJNG recovered $12.4 million of its outstanding
investments during fiscal 2021.
Clean Energy Ventures (CEV)
CEV reported fiscal 2021 NFE of $16.8 million, compared with NFE of $22.1 million during fiscal 2020.
Fourth-quarter fiscal 2021 NFE was $40.9 million, compared with NFE of $44.8 million during the same period in fiscal 2020. The decrease in NFE for both periods was due
primarily to lower SREC revenue, partially offset by lower depreciation expense. The decrease in depreciation expense is due to an increase in the useful life of CEV's assets.
NJR Reports Fourth Quarter and Fiscal 2021 Results
Page 5 of 13
Storage and Transportation
Storage and Transportation, formerly known as our Midstream reporting segment, reported fiscal 2021 NFE of $13.0 million, compared with NFE of $18.3 million during fiscal
2020. Fourth-quarter fiscal 2021 NFE were $2.4 million, compared with NFE of $7.4 million during the same period in fiscal 2020. The decrease in NFE for both periods was due primarily to lower equity in earnings contributions from our investments
in Steckman Ridge and PennEast, and higher O&M, which was partially offset by increased operating revenues at Leaf River and Adelphia Gateway.
The NFE results exclude a $74.5 million after-tax impairment charge related to NJR's investment in the PennEast Project.
Infrastructure Updates:
| • |
Adelphia Gateway - During fiscal 2021, Adelphia Gateway received all necessary permits for the second phase of construction on the South Zone. The second phase includes construction of laterals and interconnects.
|
Energy Services
Energy Services reported fiscal 2021 NFE of $71.1 million, compared with a net financial loss of $7.9 million in fiscal 2020. The increase was due primarily to higher
natural gas price volatility in February 2021, as a result of cold weather in regions where Energy Services had contracted rights to storage assets. Fourth-quarter fiscal 2021 net financial loss was $14.4 million, compared with NFE of $1.4 million
for the same period last fiscal year. The decrease was due primarily to increased compensation expense and higher O&M expenses related to charitable contributions compared to the same period a year ago.
Home Services and Other Operations
Home Services and Other Operations reported fiscal 2021 net financial loss of $0.8 million, compared with NFE of $5.8 million during fiscal 2020. Fourth-quarter fiscal
2021 net financial loss was $(1.1) million compared with NFE of $5.1 million for the same period in fiscal 2020. The decrease in both periods was due primarily to higher O&M related to increased compensation and technology expenses and one-time
income tax benefits that occurred in the fourth quarter of fiscal 2020 that did not reoccur in fiscal 2021.
Capital Expenditures and Cash Flows:
NJR is committed to maintaining a strong financial profile.
| • |
During fiscal 2021, capital expenditures were $682.9 million, including accruals, of which $468.3 million were related to NJNG, compared with $499.1 million ($1.0 billion including the acquisition of assets), of which $333.9 million were
related to NJNG, during fiscal 2020.
|
| • |
During fiscal 2021, cash flows from operations were $391.0 million, compared with $213.5 million during the same period of fiscal 2020. The increase was due primarily to increased NFE at Energy
Services.
|
NJR Reports Fourth Quarter and Fiscal 2021 Results
Page 6 of 13
Forward-Looking Statements:
This earnings release contains forward-looking statements within the meaning of Section 27A of the Securities Act of 1933, as amended, Section 21E of
the Securities Exchange Act of 1934, as amended, and the Private Securities Litigation Reform Act of 1995. NJR cautions readers that the assumptions forming the basis for forward-looking statements include many factors that are beyond NJR’s ability
to control or estimate precisely, such as estimates of future market conditions and the behavior of other market participants. Words such as “anticipates,” “estimates,” “expects,” “projects,” “may,” “will,” “intends,” “plans,” “believes,” “should”
and similar expressions may identify forward-looking statements and such forward-looking statements are made based upon management’s current expectations, assumptions and beliefs as of this date concerning future developments and their potential
effect upon NJR. There can be no assurance that future developments will be in accordance with management’s expectations, assumptions and beliefs or that the effect of future developments on NJR will be those anticipated by management.
Forward-looking statements in this earnings release include, but are not limited to, certain statements regarding NJR’s NFEPS guidance for fiscal 2022, projected NFEPS growth rate, results of future rate cases, forecasted contribution of business
segments to NJR’s NFE for fiscal 2022, future NJR and NJNG capital expenditures, infrastructure programs and investments such as SRL, IIP, the Howell Green Hydrogen Project and energy efficiency programs, the ability to operate the Adelphia Gateway
Pipeline project, and other legal and regulatory expectations.
Additional information and factors that could cause actual results to differ materially from NJR’s expectations are contained in NJR’s filings with
the SEC, including NJR’s Annual Reports on Form 10-K and subsequent Quarterly Reports on Form 10-Q, recent Current Reports on Form 8-K, and other SEC filings, which are available at the SEC’s web site, http://www.sec.gov. Information included in
this earnings release is representative as of today only and while NJR periodically reassesses material trends and uncertainties affecting NJR's results of operations and financial condition in connection with its preparation of management's
discussion and analysis of results of operations and financial condition contained in its Quarterly and Annual Reports filed with the SEC, NJR does not, by including this statement, assume any obligation to review or revise any particular
forward-looking statement referenced herein in light of future events.
Non-GAAP Financial Information:
This earnings release includes the non-GAAP financial measures NFE/net financial loss, NFE per basic share, financial margin and utility gross margin.
A reconciliation of these non-GAAP financial measures to the most directly comparable financial measures calculated and reported in accordance with GAAP can be found below. As an indicator of NJR’s operating performance, these measures should not
be considered an alternative to, or more meaningful than, net income or operating revenues as determined in accordance with GAAP. This information has been provided pursuant to the requirements of SEC Regulation G.
NFE and financial margin exclude unrealized gains or losses on derivative instruments related to NJR’s unregulated subsidiaries and certain realized
gains and losses on derivative instruments related to natural gas that has been placed into storage at Energy Services and the impairment on NJR's investments in the PennEast Project, net of applicable tax adjustments as described below. Volatility
associated with the change in value of these financial instruments and physical commodity reported on the income statement in the current period. In order to manage its business, NJR views its results without the impacts of the unrealized gains and
losses, and certain realized gains and losses, caused by changes in value of these financial instruments and physical commodity contracts prior to the completion of the planned transaction because it shows changes in value currently instead of when
the planned transaction ultimately is settled. An annual estimated effective tax rate is calculated for NFE purposes and any necessary quarterly tax adjustment is applied to NJR Energy Services Company.
NJNG’s utility gross margin represents the results of revenues less natural gas costs, sales, expenses and other taxes and regulatory rider expenses,
which are key components of NJR’s operations. Natural gas costs, sales, expenses and other taxes and regulatory rider expenses are passed through to customers and, therefore, have no effect on utility gross margin. Management uses these non-GAAP
financial measures as supplemental measures to other GAAP results to provide a more complete understanding of NJR’s performance. Management believes these non-GAAP financial measures are more reflective of NJR’s business model, provide transparency
to investors and enable period-to-period comparability of financial performance. A reconciliation of all non-GAAP financial measures to the most directly comparable financial measures calculated and reported in accordance with GAAP can be found
below. For a full discussion of NJR’s non-GAAP financial measures, please see NJR’s most recent Report on Form 10-K, Item 7.
NJR Reports Fourth Quarter and Fiscal 2021 Results
Page 7 of 13
About New Jersey Resources
New Jersey Resources (NYSE: NJR) is a Fortune 1000 company that, through its subsidiaries, provides safe and reliable natural gas and clean energy services, including transportation, distribution, asset management and home services. NJR is composed
of five primary businesses:
| • |
New Jersey Natural Gas, NJR’s principal subsidiary, operates and maintains over 7,500 miles of natural gas transportation and distribution infrastructure to
serve over half a million customers in New Jersey’s Monmouth, Ocean and parts of Morris, Middlesex and Burlington counties.
|
| • |
Clean Energy Ventures invests in, owns and operates solar projects with a total capacity of more than 365 megawatts, providing residential and commercial customers with low-carbon solutions.
|
| • |
Energy Services
manages a diversified portfolio of natural gas transportation and storage assets and provides physical natural gas services and customized energy solutions to its customers across North America.
|
| • |
Storage and Transportation serves customers from local distributors and producers to electric generators and wholesale marketers through its ownership of Leaf River and the Adelphia Gateway Pipeline Project, as well as our 50% equity ownership in
the Steckman Ridge natural gas storage facility.
|
| • |
Home Services
provides service contracts as well as heating, central air conditioning, water heaters, standby generators, solar and other indoor and outdoor comfort products to residential homes throughout New Jersey.
|
NJR and its nearly 1,200 employees are committed to helping customers save energy and money by promoting conservation and encouraging efficiency through Conserve to
Preserve® and initiatives such as The SAVEGREEN Project® and The Sunlight Advantage®.
For more information about NJR:
www.njresources.com.
Follow us on Twitter @NJNaturalGas.
“Like” us on facebook.com/NewJerseyNaturalGas.
NJR Reports Fourth Quarter and Fiscal 2021 Results
Page 8 of 13
NEW JERSEY RESOURCES
CONSOLIDATED STATEMENTS OF OPERATIONS
(Unaudited)
|
Three Months Ended
September 30,
|
Twelve Months Ended
September 30,
|
|||||||||||||||
|
(Thousands, except per share data)
|
2021
|
2020
|
2021
|
2020
|
||||||||||||
|
OPERATING REVENUES
|
||||||||||||||||
|
Utility
|
$
|
97,937
|
$
|
84,548
|
$
|
731,459
|
$
|
729,923
|
||||||||
|
Nonutility
|
434,591
|
315,496
|
1,425,154
|
1,223,745
|
||||||||||||
|
Total operating revenues
|
532,528
|
400,044
|
2,156,613
|
1,953,668
|
||||||||||||
|
OPERATING EXPENSES
|
||||||||||||||||
|
Gas purchases
|
||||||||||||||||
|
Utility
|
36,569
|
26,789
|
247,734
|
275,831
|
||||||||||||
|
Nonutility
|
356,721
|
220,304
|
1,096,920
|
1,022,805
|
||||||||||||
|
Related parties
|
1,850
|
1,535
|
7,013
|
6,083
|
||||||||||||
|
Operation and maintenance
|
101,126
|
79,425
|
366,905
|
278,143
|
||||||||||||
|
Regulatory rider expenses
|
3,734
|
1,993
|
38,304
|
34,529
|
||||||||||||
|
Depreciation and amortization
|
29,410
|
27,343
|
111,387
|
107,368
|
||||||||||||
|
Total operating expenses
|
529,410
|
357,389
|
1,868,263
|
1,724,759
|
||||||||||||
|
OPERATING (LOSS) INCOME
|
3,118
|
42,655
|
288,350
|
228,909
|
||||||||||||
|
Other income, net
|
10,656
|
13,618
|
24,597
|
23,878
|
||||||||||||
|
Interest expense, net of capitalized interest
|
19,876
|
17,180
|
78,559
|
67,597
|
||||||||||||
|
(LOSS) INCOME BEFORE INCOME TAXES AND EQUITY IN EARNINGS OF AFFILIATES
|
(6,102
|
)
|
39,093
|
234,388
|
185,190
|
|||||||||||
|
Income tax (benefit) provision
|
(4,427
|
)
|
10,506
|
33,286
|
36,494
|
|||||||||||
|
Equity in earnings of affiliates
|
542
|
4,120
|
(83,212
|
)
|
14,311
|
|||||||||||
|
NET (LOSS) INCOME
|
$
|
(1,133
|
)
|
$
|
32,707
|
$
|
117,890
|
$
|
163,007
|
|||||||
|
(LOSS) EARNINGS PER COMMON SHARE
|
||||||||||||||||
|
Basic
|
$
|
(0.01
|
)
|
$
|
0.34
|
$
|
1.23
|
$
|
1.72
|
|||||||
|
Diluted
|
$
|
(0.01
|
)
|
$
|
0.34
|
$
|
1.22
|
$
|
1.71
|
|||||||
|
WEIGHTED AVERAGE SHARES OUTSTANDING
|
||||||||||||||||
|
Basic
|
96,198
|
95,933
|
96,227
|
94,798
|
||||||||||||
|
Diluted
|
96,198
|
95,933
|
96,560
|
95,103
|
||||||||||||
NJR Reports Fourth Quarter and Fiscal 2021 Results
Page 9 of 13
RECONCILIATION OF NON-GAAP PERFORMANCE MEASURES
(Unaudited)
|
Three Months Ended
|
Twelve Months Ended
|
|||||||||||||||
|
September 30,
|
September 30,
|
|||||||||||||||
|
(Thousands)
|
2021
|
2020
|
2021
|
2020
|
||||||||||||
|
NEW JERSEY RESOURCES
|
||||||||||||||||
|
A reconciliation of net (loss) income, the closest GAAP financial measurement, to net financial earnings is as
follows:
|
||||||||||||||||
|
Net (loss) income
|
$
|
(1,133
|
)
|
$
|
32,707
|
$
|
117,890
|
$
|
163,007
|
|||||||
|
Add:
|
||||||||||||||||
|
Unrealized loss (gain) on derivative instruments and related transactions
|
40,576
|
12,183
|
54,203
|
(9,644
|
)
|
|||||||||||
|
Tax effect
|
(9,647
|
)
|
(2,893
|
)
|
(12,887
|
)
|
2,296
|
|||||||||
|
Effects of economic hedging related to natural gas inventory
|
(30,150
|
)
|
2,216
|
(42,405
|
)
|
12,690
|
||||||||||
|
Tax effect
|
7,166
|
(527
|
)
|
10,078
|
(3,016
|
)
|
||||||||||
|
Impairment of equity method investment
|
—
|
—
|
92,000
|
—
|
||||||||||||
|
Tax effect
|
767
|
—
|
(11,167
|
)
|
—
|
|||||||||||
|
Net income to NFE tax adjustment
|
(980
|
)
|
(257
|
)
|
—
|
—
|
||||||||||
|
Net financial (loss) earnings
|
$
|
6,599
|
$
|
43,429
|
$
|
207,712
|
$
|
165,333
|
||||||||
|
Weighted Average Shares Outstanding
|
||||||||||||||||
|
Basic
|
96,198
|
95,933
|
96,227
|
94,798
|
||||||||||||
|
Diluted
|
96,198
|
95,933
|
96,560
|
95,103
|
||||||||||||
|
A reconciliation of basic earnings per share, the closest GAAP financial measurement, to basic net financial
earnings per share is as follows:
|
||||||||||||||||
|
Basic (loss) earnings per share
|
$
|
(0.01
|
)
|
$
|
0.34
|
$
|
1.23
|
$
|
1.72
|
|||||||
|
Add:
|
||||||||||||||||
|
Unrealized loss (gain) on derivative instruments and related transactions
|
$
|
0.42
|
$
|
0.13
|
$
|
0.56
|
$
|
(0.10
|
)
|
|||||||
|
Tax effect
|
$
|
(0.10
|
)
|
$
|
(0.03
|
)
|
$
|
(0.13
|
)
|
$
|
0.02
|
|||||
|
Effects of economic hedging related to natural gas inventory
|
$
|
(0.31
|
)
|
$
|
0.02
|
$
|
(0.44
|
)
|
$
|
0.13
|
||||||
|
Tax effect
|
$
|
0.07
|
$
|
(0.01
|
)
|
$
|
0.10
|
$
|
(0.03
|
)
|
||||||
|
Impairment of equity method investment
|
$
|
—
|
$
|
—
|
$
|
0.96
|
$
|
—
|
||||||||
|
Tax effect
|
$
|
0.01
|
$
|
—
|
$
|
(0.12
|
)
|
$
|
—
|
|||||||
|
Net income to NFE tax adjustment
|
$
|
(0.01
|
)
|
$
|
—
|
$
|
—
|
$
|
—
|
|||||||
|
Basic NFE per share
|
$
|
0.07
|
$
|
0.45
|
$
|
2.16
|
$
|
1.74
|
||||||||
|
NATURAL GAS DISTRIBUTION
|
||||||||||||||||
|
A reconciliation of operating revenue, the closest GAAP financial measurement, to utility gross margin is as
follows:
|
||||||||||||||||
|
Operating revenues
|
$
|
98,274
|
$
|
84,548
|
$
|
731,796
|
$
|
729,923
|
||||||||
|
Less:
|
||||||||||||||||
|
Gas purchases
|
38,842
|
29,113
|
260,714
|
287,307
|
||||||||||||
|
Regulatory rider expense
|
3,734
|
1,993
|
38,304
|
34,529
|
||||||||||||
|
Utility gross margin
|
$
|
55,698
|
$
|
53,442
|
$
|
432,778
|
$
|
408,087
|
||||||||
NJR Reports Fourth Quarter and Fiscal 2021 Results
Page 10 of 13
|
Three Months Ended
|
Twelve Months Ended
|
|||||||||||||||
|
(Unaudited)
|
September 30,
|
September 30,
|
||||||||||||||
|
(Thousands)
|
2021
|
2020
|
2021
|
2020
|
||||||||||||
|
ENERGY SERVICES
|
||||||||||||||||
|
The following table is a computation of financial margin:
|
||||||||||||||||
|
Operating revenues
|
$
|
334,780
|
$
|
212,760
|
$
|
1,228,420
|
$
|
1,030,419
|
||||||||
|
Less: Gas purchases
|
357,133
|
220,882
|
1,098,261
|
1,024,579
|
||||||||||||
|
Add:
|
||||||||||||||||
|
Unrealized loss (gain) on derivative instruments and related transactions
|
45,011
|
12,723
|
58,362
|
(8,583
|
)
|
|||||||||||
|
Effects of economic hedging related to natural gas inventory
|
(30,150
|
)
|
2,216
|
(42,405
|
)
|
12,690
|
||||||||||
|
Financial margin
|
$
|
(7,492
|
)
|
$
|
6,817
|
$
|
146,116
|
$
|
9,947
|
|||||||
|
A reconciliation of operating income, the closest GAAP financial measurement, to financial margin is as
follows:
|
||||||||||||||||
|
Operating (loss) income
|
$
|
(32,186
|
)
|
$
|
(12,216
|
)
|
$
|
79,163
|
$
|
(11,651
|
)
|
|||||
|
Add:
|
||||||||||||||||
|
Operation and maintenance expense
|
9,805
|
4,055
|
50,885
|
17,368
|
||||||||||||
|
Depreciation and amortization
|
28
|
39
|
111
|
123
|
||||||||||||
|
Subtotal
|
(22,353
|
)
|
(8,122
|
)
|
130,159
|
5,840
|
||||||||||
|
Add:
|
||||||||||||||||
|
Unrealized loss (gain) on derivative instruments and related transactions
|
45,011
|
12,723
|
58,362
|
(8,583
|
)
|
|||||||||||
|
Effects of economic hedging related to natural gas inventory
|
(30,150
|
)
|
2,216
|
(42,405
|
)
|
12,690
|
||||||||||
|
Financial margin
|
$
|
(7,492
|
)
|
$
|
6,817
|
$
|
146,116
|
$
|
9,947
|
|||||||
|
A reconciliation of net income to net financial earnings is as follows:
|
||||||||||||||||
|
Net (loss) income
|
$
|
(24,731
|
)
|
$
|
(9,753
|
)
|
$
|
58,957
|
$
|
(11,008
|
)
|
|||||
|
Add:
|
||||||||||||||||
|
Unrealized loss (gain) on derivative instruments and related transactions
|
45,011
|
12,723
|
58,362
|
(8,583
|
)
|
|||||||||||
|
Tax effect
|
(10,700
|
)
|
(3,021
|
)
|
(13,875
|
)
|
2,044
|
|||||||||
|
Effects of economic hedging related to natural gas
|
(30,150
|
)
|
2,216
|
(42,405
|
)
|
12,690
|
||||||||||
|
Tax effect
|
7,166
|
(527
|
)
|
10,078
|
(3,016
|
)
|
||||||||||
|
Net income to NFE tax adjustment
|
(980
|
)
|
(257
|
)
|
—
|
—
|
||||||||||
|
Net financial (loss) earnings
|
$
|
(14,384
|
)
|
$
|
1,381
|
$
|
71,117
|
$
|
(7,873
|
)
|
||||||
|
STORAGE AND TRANSPORTATION
|
||||||||||||||||
|
A reconciliation of net income to net financial earnings is as follows:
|
||||||||||||||||
|
Net (loss) income
|
$
|
1,673
|
$
|
7,434
|
$
|
(67,787
|
)
|
$
|
18,311
|
|||||||
|
Add:
|
||||||||||||||||
|
Impairment of equity method investment
|
—
|
—
|
92,000
|
—
|
||||||||||||
|
Tax effect
|
767
|
—
|
(11,167
|
)
|
—
|
|||||||||||
|
Net financial earnings
|
$
|
2,440
|
$
|
7,434
|
$
|
13,046
|
$
|
18,311
|
||||||||
NJR Reports Fourth Quarter and Fiscal 2021 Results
Page 11 of 13
FINANCIAL STATISTICS BY BUSINESS UNIT
(Unaudited)
|
Three Months Ended
September 30,
|
Twelve Months Ended
September 30,
|
|||||||||||||||
|
(Thousands, except per share data)
|
2021
|
2020
|
2021
|
2020
|
||||||||||||
|
NEW JERSEY RESOURCES
|
||||||||||||||||
|
Operating Revenues
|
||||||||||||||||
|
Natural Gas Distribution
|
$
|
98,274
|
$
|
84,548
|
$
|
731,796
|
$
|
729,923
|
||||||||
|
Clean Energy Ventures
|
69,048
|
77,014
|
95,275
|
102,617
|
||||||||||||
|
Energy Services
|
334,780
|
212,760
|
1,228,420
|
1,030,419
|
||||||||||||
|
Storage and Transportation
|
12,341
|
12,717
|
51,020
|
44,728
|
||||||||||||
|
Home Services and Other
|
13,567
|
13,376
|
52,229
|
51,017
|
||||||||||||
|
Sub-total
|
528,010
|
400,415
|
2,158,740
|
1,958,704
|
||||||||||||
|
Eliminations
|
4,518
|
(371
|
)
|
(2,127
|
)
|
(5,036
|
)
|
|||||||||
|
Total
|
$
|
532,528
|
$
|
400,044
|
$
|
2,156,613
|
$
|
1,953,668
|
||||||||
|
Operating Income (Loss)
|
||||||||||||||||
|
Natural Gas Distribution
|
$
|
(21,281
|
)
|
$
|
(12,703
|
)
|
$
|
148,993
|
$
|
173,412
|
||||||
|
Clean Energy Ventures
|
54,014
|
63,426
|
37,993
|
46,978
|
||||||||||||
|
Energy Services
|
(32,186
|
)
|
(12,216
|
)
|
79,163
|
(11,651
|
)
|
|||||||||
|
Storage and Transportation
|
595
|
5,436
|
10,659
|
12,451
|
||||||||||||
|
Home Services and Other
|
(4,091
|
)
|
(2,673
|
)
|
4,033
|
3,062
|
||||||||||
|
Sub-total
|
(2,949
|
)
|
41,270
|
280,841
|
224,252
|
|||||||||||
|
Eliminations
|
6,067
|
1,385
|
7,509
|
4,656
|
||||||||||||
|
Total
|
$
|
3,118
|
$
|
42,655
|
$
|
288,350
|
$
|
228,909
|
||||||||
|
Equity in Earnings of Affiliates
|
||||||||||||||||
|
Storage and Transportation
|
$
|
964
|
$
|
4,703
|
$
|
(81,072
|
)
|
$
|
15,903
|
|||||||
|
Eliminations
|
(422
|
)
|
(583
|
)
|
(2,140
|
)
|
(1,592
|
)
|
||||||||
|
Total
|
$
|
542
|
$
|
4,120
|
$
|
(83,212
|
)
|
$
|
14,311
|
|||||||
|
Net Income (Loss)
|
||||||||||||||||
|
Natural Gas Distribution
|
$
|
(24,214
|
)
|
$
|
(15,258
|
)
|
$
|
107,375
|
$
|
126,902
|
||||||
|
Clean Energy Ventures
|
40,861
|
44,805
|
16,789
|
22,111
|
||||||||||||
|
Energy Services
|
(24,731
|
)
|
(9,753
|
)
|
58,957
|
(11,008
|
)
|
|||||||||
|
Storage and Transportation
|
1,673
|
7,434
|
(67,787
|
)
|
18,311
|
|||||||||||
|
Home Services and Other
|
(1,127
|
)
|
5,109
|
(826
|
)
|
5,784
|
||||||||||
|
Sub-total
|
(7,538
|
)
|
32,337
|
114,508
|
162,100
|
|||||||||||
|
Eliminations
|
6,405
|
370
|
3,382
|
907
|
||||||||||||
|
Total
|
$
|
(1,133
|
)
|
$
|
32,707
|
$
|
117,890
|
$
|
163,007
|
|||||||
|
Net Financial Earnings (Loss)
|
||||||||||||||||
|
Natural Gas Distribution
|
$
|
(24,214
|
)
|
$
|
(15,258
|
)
|
$
|
107,375
|
$
|
126,902
|
||||||
|
Clean Energy Ventures
|
40,861
|
44,805
|
16,789
|
22,111
|
||||||||||||
|
Energy Services
|
(14,384
|
)
|
1,381
|
71,117
|
(7,873
|
)
|
||||||||||
|
Storage and Transportation
|
2,440
|
7,434
|
13,046
|
18,311
|
||||||||||||
|
Home Services and Other
|
(1,127
|
)
|
5,109
|
(826
|
)
|
5,784
|
||||||||||
|
Sub-total
|
3,576
|
43,471
|
207,501
|
165,235
|
||||||||||||
|
Eliminations
|
3,023
|
(42
|
)
|
211
|
98
|
|||||||||||
|
Total
|
$
|
6,599
|
$
|
43,429
|
$
|
207,712
|
$
|
165,333
|
||||||||
|
Throughput (Bcf)
|
||||||||||||||||
|
NJNG, Core Customers
|
17.8
|
17.6
|
91.4
|
97.0
|
||||||||||||
|
NJNG, Off System/Capacity Management
|
26.9
|
34.1
|
101.3
|
118.4
|
||||||||||||
|
Energy Services Fuel Mgmt. and Wholesale Sales
|
89.5
|
121.6
|
382.0
|
526.7
|
||||||||||||
|
Total
|
134.2
|
173.3
|
574.7
|
742.1
|
||||||||||||
|
Common Stock Data
|
||||||||||||||||
|
Yield at September 30
|
4.2
|
%
|
4.9
|
%
|
4.2
|
%
|
4.9
|
%
|
||||||||
|
Market Price at September 30
|
$
|
34.81
|
$
|
27.02
|
$
|
34.81
|
$
|
27.02
|
||||||||
|
Shares Out. at September 30
|
95,710
|
95,949
|
95,710
|
95,949
|
||||||||||||
|
Market Cap. at September 30
|
$
|
3,331,653
|
$
|
2,592,547
|
$
|
3,331,653
|
$
|
2,592,547
|
||||||||
NJR Reports Fourth Quarter and Fiscal 2021 Results
Page 12 of 13
|
(Unaudited)
|
Three Months Ended
September 30,
|
Twelve Months Ended
September 30,
|
||||||||||||||
|
(Thousands, except customer and weather data)
|
2021
|
2020
|
2021
|
2020
|
||||||||||||
|
NATURAL GAS DISTRIBUTION
|
||||||||||||||||
|
Utility Gross Margin
|
||||||||||||||||
|
Operating revenues
|
$
|
98,274
|
$
|
84,548
|
$
|
731,796
|
$
|
729,923
|
||||||||
|
Less:
|
||||||||||||||||
|
Gas purchases
|
38,842
|
29,113
|
260,714
|
287,307
|
||||||||||||
|
Regulatory rider expense
|
3,734
|
1,993
|
38,304
|
34,529
|
||||||||||||
|
Total Utility Gross Margin
|
$
|
55,698
|
$
|
53,442
|
$
|
432,778
|
$
|
408,087
|
||||||||
|
Utility Gross Margin, Operating Income and Net Income
|
||||||||||||||||
|
Residential
|
$
|
29,947
|
$
|
30,408
|
$
|
288,723
|
$
|
275,033
|
||||||||
|
Commercial, Industrial & Other
|
10,578
|
8,190
|
64,950
|
57,929
|
||||||||||||
|
Firm Transportation
|
10,518
|
10,416
|
61,870
|
60,199
|
||||||||||||
|
Total Firm Margin
|
51,043
|
49,014
|
415,543
|
393,161
|
||||||||||||
|
Interruptible
|
1,192
|
1,675
|
3,820
|
5,455
|
||||||||||||
|
Total System Margin
|
52,235
|
50,689
|
419,363
|
398,616
|
||||||||||||
|
Off System/Capacity Management/FRM/Storage Incentive
|
3,463
|
2,753
|
13,415
|
9,471
|
||||||||||||
|
Total Utility Gross Margin
|
55,698
|
53,442
|
432,778
|
408,087
|
||||||||||||
|
Operation and maintenance expense
|
55,472
|
47,448
|
203,740
|
162,792
|
||||||||||||
|
Depreciation and amortization
|
21,507
|
18,697
|
80,045
|
71,883
|
||||||||||||
|
Operating Income
|
$
|
(21,281
|
)
|
$
|
(12,703
|
)
|
$
|
148,993
|
$
|
173,412
|
||||||
|
Net Income
|
$
|
(24,214
|
)
|
$
|
(15,258
|
)
|
$
|
107,375
|
$
|
126,902
|
||||||
|
Net Financial Earnings
|
$
|
(24,214
|
)
|
$
|
(15,258
|
)
|
$
|
107,375
|
$
|
126,902
|
||||||
|
Throughput (Bcf)
|
||||||||||||||||
|
Residential
|
3.3
|
3.4
|
46.2
|
44.6
|
||||||||||||
|
Commercial, Industrial & Other
|
0.7
|
0.6
|
8.6
|
8.2
|
||||||||||||
|
Firm Transportation
|
1.6
|
1.6
|
13.7
|
13.3
|
||||||||||||
|
Total Firm Throughput
|
5.6
|
5.6
|
68.5
|
66.1
|
||||||||||||
|
Interruptible
|
12.2
|
12.0
|
22.9
|
30.9
|
||||||||||||
|
Total System Throughput
|
17.8
|
17.6
|
91.4
|
97.0
|
||||||||||||
|
Off System/Capacity Management
|
26.9
|
34.1
|
101.3
|
118.4
|
||||||||||||
|
Total Throughput
|
44.7
|
51.7
|
192.7
|
215.4
|
||||||||||||
|
Customers
|
||||||||||||||||
|
Residential
|
502,546
|
497,779
|
502,546
|
497,779
|
||||||||||||
|
Commercial, Industrial & Other
|
30,615
|
28,735
|
30,615
|
28,735
|
||||||||||||
|
Firm Transportation
|
30,697
|
31,604
|
30,697
|
31,604
|
||||||||||||
|
Total Firm Customers
|
563,858
|
558,118
|
563,858
|
558,118
|
||||||||||||
|
Interruptible
|
27
|
29
|
27
|
29
|
||||||||||||
|
Total System Customers
|
563,885
|
558,147
|
563,885
|
558,147
|
||||||||||||
|
Off System/Capacity Management*
|
20
|
19
|
20
|
19
|
||||||||||||
|
Total Customers
|
563,905
|
558,166
|
563,905
|
558,166
|
||||||||||||
|
*The number of customers represents those active during the last month of the period.
|
||||||||||||||||
|
Degree Days
|
||||||||||||||||
|
Actual
|
8
|
595
|
4,247
|
4,208
|
||||||||||||
|
Normal
|
29
|
488
|
4,541
|
4,556
|
||||||||||||
|
Percent of Normal
|
27.6
|
121.9
|
93.5
|
92.4
|
||||||||||||
NJR Reports Fourth Quarter and Fiscal 2021 Results
Page 13 of 13
|
(Unaudited)
|
Three Months Ended
September 30,
|
Twelve Months Ended
September 30,
|
||||||||||||||
|
(Thousands, except customer, SREC, TREC and megawatt)
|
2021
|
2020
|
2021
|
2020
|
||||||||||||
|
CLEAN ENERGY VENTURES
|
||||||||||||||||
|
Operating Revenues
|
||||||||||||||||
|
SREC sales
|
$
|
58,898
|
$
|
69,301
|
$
|
65,434
|
$
|
81,134
|
||||||||
|
TREC sales
|
1,496
|
1,384
|
4,571
|
1,384
|
||||||||||||
|
Solar electricity sales and other
|
5,878
|
3,676
|
14,491
|
9,930
|
||||||||||||
|
Sunlight Advantage
|
2,776
|
2,653
|
10,779
|
10,169
|
||||||||||||
|
Total Operating Revenues
|
$
|
69,048
|
$
|
77,014
|
$
|
95,275
|
$
|
102,617
|
||||||||
|
Depreciation and Amortization
|
$
|
5,249
|
$
|
5,633
|
$
|
20,567
|
$
|
25,329
|
||||||||
|
Operating (Loss)
|
$
|
54,014
|
$
|
63,426
|
$
|
37,993
|
$
|
46,978
|
||||||||
|
Income Tax (Benefit)
|
$
|
12,296
|
$
|
19,386
|
$
|
5,048
|
$
|
11,034
|
||||||||
|
Net (Loss)
|
$
|
40,861
|
$
|
44,805
|
$
|
16,789
|
$
|
22,111
|
||||||||
|
Net Financial (Loss)
|
$
|
40,861
|
$
|
44,805
|
$
|
16,789
|
$
|
22,111
|
||||||||
|
Solar Renewable Energy Certificates Generated
|
130,847
|
136,067
|
406,118
|
389,716
|
||||||||||||
|
Solar Renewable Energy Certificates Sold
|
300,530
|
345,420
|
333,025
|
408,100
|
||||||||||||
|
Transition Renewable Energy Certificates Generated
|
10,561
|
9,270.0
|
31,767
|
9,270.0
|
||||||||||||
|
Solar Megawatts Under Construction
|
59.3
|
32.5
|
59.3
|
32.5
|
||||||||||||
|
ENERGY SERVICES
|
||||||||||||||||
|
Operating Income
|
||||||||||||||||
|
Operating revenues
|
$
|
334,780
|
$
|
212,760
|
$
|
1,228,420
|
$
|
1,030,419
|
||||||||
|
Less:
|
||||||||||||||||
|
Gas purchases
|
357,133
|
220,882
|
1,098,261
|
1,024,579
|
||||||||||||
|
Operation and maintenance expense
|
9,805
|
4,055
|
50,885
|
17,368
|
||||||||||||
|
Depreciation and amortization
|
28
|
39
|
111
|
123
|
||||||||||||
|
Operating (Loss) Income
|
$
|
(32,186
|
)
|
$
|
(12,216
|
)
|
$
|
79,163
|
$
|
(11,651
|
)
|
|||||
|
Net (Loss) Income
|
$
|
(24,731
|
)
|
$
|
(9,753
|
)
|
$
|
58,957
|
$
|
(11,008
|
)
|
|||||
|
Financial Margin
|
$
|
(7,492
|
)
|
$
|
6,817
|
$
|
146,116
|
$
|
9,947
|
|||||||
|
Net Financial (Loss) Earnings
|
$
|
(14,384
|
)
|
$
|
1,381
|
$
|
71,117
|
$
|
(7,873
|
)
|
||||||
|
Gas Sold and Managed (Bcf)
|
89.5
|
121.6
|
382.0
|
526.7
|
||||||||||||
|
STORAGE AND TRANSPORTATION
|
||||||||||||||||
|
Operating Revenues
|
$
|
12,341
|
$
|
12,717
|
$
|
51,020
|
$
|
44,728
|
||||||||
|
Equity in Earnings of Affiliates
|
$
|
964
|
$
|
4,703
|
$
|
(81,072
|
)
|
$
|
15,903
|
|||||||
|
Operation and Maintenance Expense
|
$
|
8,765
|
$
|
4,460
|
$
|
29,135
|
$
|
21,862
|
||||||||
|
Other Income, Net
|
$
|
1,796
|
$
|
927
|
$
|
5,931
|
$
|
7,328
|
||||||||
|
Interest Expense
|
$
|
2,851
|
$
|
2,838
|
$
|
13,348
|
$
|
13,124
|
||||||||
|
Income Tax (Benefit) Provision
|
$
|
(1,169
|
)
|
$
|
794
|
$
|
(10,043
|
)
|
$
|
4,247
|
||||||
|
Net (Loss) Income
|
$
|
1,673
|
$
|
7,434
|
$
|
(67,787
|
)
|
$
|
18,311
|
|||||||
|
Net Financial Earnings
|
$
|
2,440
|
$
|
7,434
|
$
|
13,046
|
$
|
18,311
|
||||||||
|
HOME SERVICES AND OTHER
|
||||||||||||||||
|
Operating Revenues
|
$
|
13,567
|
$
|
13,376
|
$
|
52,229
|
$
|
51,017
|
||||||||
|
Operating Income
|
$
|
(4,091
|
)
|
$
|
(2,673
|
)
|
$
|
4,033
|
$
|
3,062
|
||||||
|
Other Expense, Net
|
$
|
1,602
|
$
|
(15,203
|
)
|
$
|
(1,001
|
)
|
$
|
5,177
|
||||||
|
Net (Loss) Income
|
$
|
(1,127
|
)
|
$
|
5,109
|
$
|
(826
|
)
|
$
|
5,784
|
||||||
|
Net Financial (Loss) Earnings
|
$
|
(1,127
|
)
|
$
|
5,109
|
$
|
(826
|
)
|
$
|
5,784
|
||||||
|
Total Service Contract Customers at September 30
|
105,720
|
107,224
|
105,720
|
107,224
|
||||||||||||
Exhibit 99.2

s November 18, 2021 Fourth-Quarter 2021 Results
Forward-Looking Statements and Non-GAAP Measures 1 Forward-Looking StatementsThis presentation
contains forward-looking statements within the meaning of Section 27A of the Securities Act of 1933, as amended, Section 21E of the Securities Exchange Act of 1934, as amended, and the Private Securities Litigation Reform Act of 1995. New
Jersey Resources Corporation (“NJR”, or the “Company”) cautions readers that the assumptions forming the basis for forward-looking statements include many factors that are beyond NJR’s ability to control or estimate precisely, such as
estimates of future market conditions and the behavior of other market participants. Words such as “anticipates,” “estimates,” “expects,” “projects,” “may,” “will,” “intends,” “plans,” “believes,” “should” and similar expressions may identify
forward-looking statements and such forward-looking statements are made based upon management’s current expectations, assumptions and beliefs as of this date concerning future developments and their potential effect upon NJR. There can be no
assurance that future developments will be in accordance with management’s expectations, assumptions and beliefs or that the effect of future developments on NJR will be those anticipated by management. Forward-looking statements in this
presentation include, but are not limited to, certain statements regarding NJR’s net financial earnings (“NFE”) per share guidance for fiscal 2022 and beyond, dividend growth goals, capital plans, planned capital expenditures, projected cash
flows, impacts of hedging strategies, customer growth rate and timetable and results of future base rates, schedule for completion of infrastructure projects, including but not limited to, New Jersey Natural Gas’s Southern Reliability Link
and the Howell Green Hydrogen Project, NJR's environmental sustainability and clean energy goals, emissions reduction strategies, initiatives and targets as well as our related investments in infrastructure, renewables and emerging
technologies such as renewable natural gas and hydrogen gas, NJR Clean Energy Ventures’ future capital investment target, projected installed solar capacity, revenue growth, project returns, impacts of Asset Management Agreements, demand for
residential and commercial solar energy, and our ability to profitably operate and expand the Adelphia Gateway pipeline and the impairment of NJR’s investment in PennEast.Additional information and factors that could cause actual results to
differ materially from NJR’s expectations are contained in NJR’s filings with the U.S. Securities and Exchange Commission (SEC), including NJR’s Annual Reports on Form 10-K and subsequent Quarterly Reports on Form 10-Q, recent Current Reports
on Form 8-K, and other SEC filings, which are available at the SEC’s web site, https://www.sec.gov. Information included in this presentation is representative as of today only and while NJR periodically reassesses material trends and
uncertainties affecting NJR's results of operations and financial condition in connection with its preparation of management's discussion and analysis of results of operations and financial condition contained in its Quarterly and Annual
Reports filed with the SEC, NJR does not, by including this statement, assume any obligation to review or revise any particular forward-looking statement referenced herein in light of future events.Non-GAAP MeasuresThis presentation includes
the non-GAAP measures, including, NFE/net financial loss, utility gross margin and financial margin. As an indicator of the Company’s operating performance, these measures should not be considered an alternative to, or moremeaningful than,
GAAP measures, such as cash flows, net income(loss), operating income or earnings per share.NFE/net financial loss and financial margin exclude unrealized gains or losses on derivative instruments related to the Company’s unregulated
subsidiaries and certain realized gains and losses on derivative instruments related to natural gas that has been placed into storage at Energy Services, and the impairment of NJR’s investment in the PennEast project, net of applicable tax
adjustments, as described below. Volatility associated with the change in value of these financial and physical commodity contracts is reported in the income statement in the current period. In order to manage its business, NJR views its
results without the impacts of the unrealized gains and losses, and certain realized gains and losses, caused by changes in value of these financial instruments and physical commodity contracts prior to the completion of the planned
transaction because it shows changes in value currently as opposed to when the planned transaction ultimately is settled. An annual estimated effective tax rate is calculated for NFE purposes, and any necessary quarterly tax adjustment is
applied to “NJCEV”, as such adjustment is related to tax credits generated by CEV.NJNG’s utility gross margin represents the results of revenues less natural gas costs, sales and other taxes and regulatory rider expenses, which are key
components of the Company’s operations that move in relation to each other. Natural gas costs, sales and other taxes and regulatory rider expenses are passed through to customers and therefore, have no effect on gross margin.Management uses
NFE/net financial loss, utility gross margin and financial margin, as supplemental measures to other GAAP results to provide a more complete understanding of the Company’s performance. Management believes these non-GAAP measures are more
reflective of the Company’s business model, provide transparency to investors and enable period-to-period comparability of financial performance. In providing NFE guidance, management is aware that there could be differences between reported
GAAP earnings and NFE/net financial loss due to matters such as, but not limited to, the positions of our energy-related derivatives. Management is not able to reasonably estimate the aggregate impact or significance of these items on
reported earnings and therefore is not able to provide a reconciliation to the corresponding GAAP equivalent for its operating earnings guidance without unreasonable efforts. NFE/net financial loss, utility gross margin and financial margin
are discussed more fully in Item 7 of our Report on Form 10-K and, we have provided presentations of the most directly comparable GAAP financial measure and a reconciliation of our non-GAAP financial measure, NFE/net financial loss, to the
most directly comparable GAAP financial measure, in the appendix to this presentation. This information has been provided pursuant to the requirements of SEC Regulation G.
Agenda 1 Fourth-Quarter FY 2021 HighlightsSteve Westhoven | President & CEO 2 Financial
HighlightsPat Migliaccio | SVP and CFO 3 Q&A Session 2
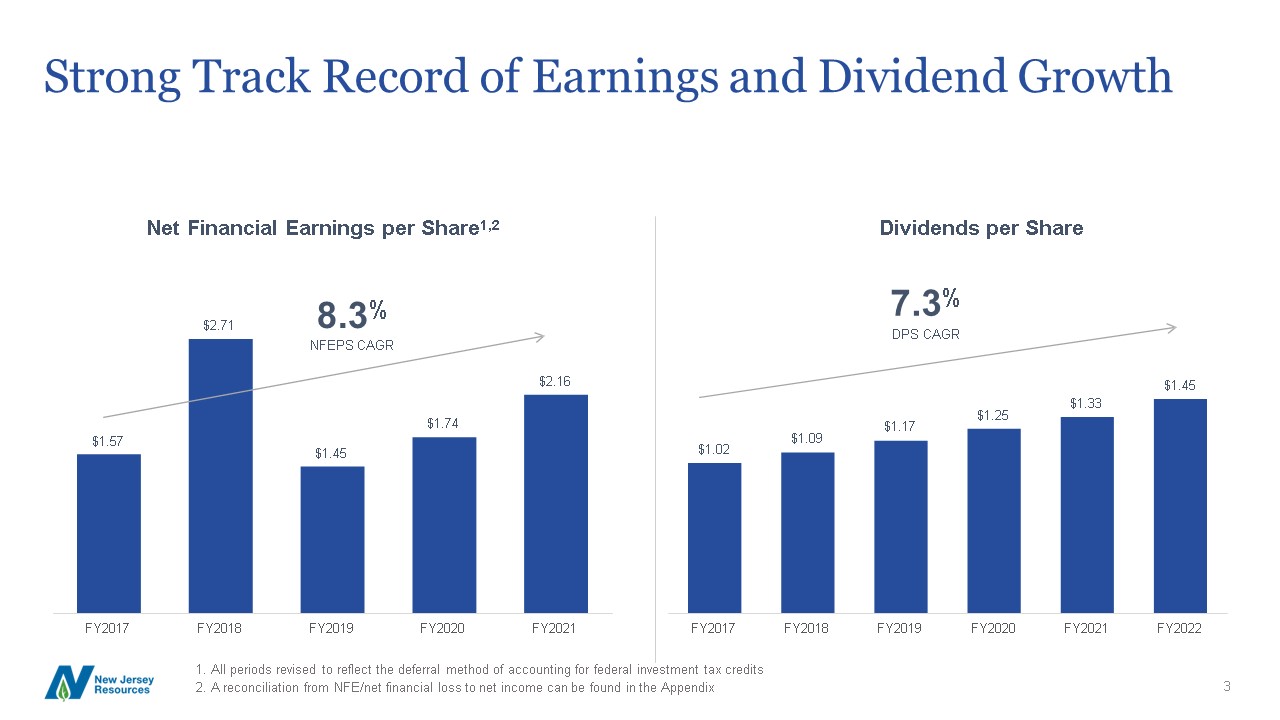
Strong Track Record of Earnings and Dividend Growth 3 Net Financial Earnings per
Share1,2 $1.57 $2.71 $1.45 $1.74 $2.16 FY2017 8.3% NFEPS CAGR FY2018 FY2019 FY2020 FY2021 FY2017All periods revised to reflect the deferral method of accounting for federal investment tax creditsA reconciliation from NFE/net
financial loss to net income can be found in the Appendix Dividends per Share $1.02 $1.09 $1.17 $1.25 $1.33 $1.45 FY2018 FY2019 FY2020 FY2021 FY2022 7.3%DPS CAGR
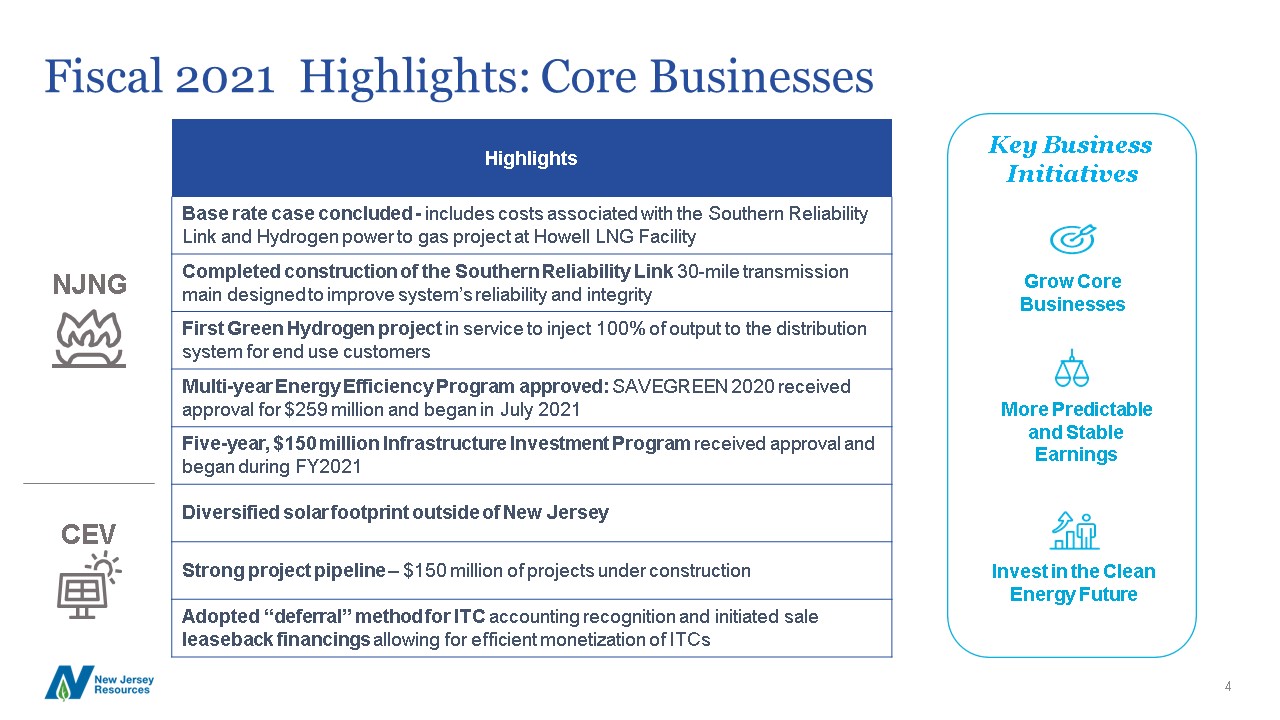
Highlights Base rate case concluded - includes costs associated with the Southern Reliability Link and
Hydrogen power to gas project at Howell LNG Facility Completed construction of the Southern Reliability Link 30-mile transmission main designed to improve system’s reliability and integrity First Green Hydrogen project in service to inject
100% of output to the distributionsystem for end use customers Multi-year Energy Efficiency Program approved: SAVEGREEN 2020 received approval for $259 million and began in July 2021 Five-year, $150 million Infrastructure Investment Program
received approval and began during FY2021 Diversified solar footprint outside of New Jersey Strong project pipeline – $150 million of projects under construction Adopted “deferral” method for ITC accounting recognition and initiated
saleleaseback financings allowing for efficient monetization of ITCs NJNG CEV Grow Core Businesses 4 More Predictable and Stable Earnings Invest in the CleanEnergy Future Key Business Initiatives Fiscal 2021 Highlights: Core
Businesses
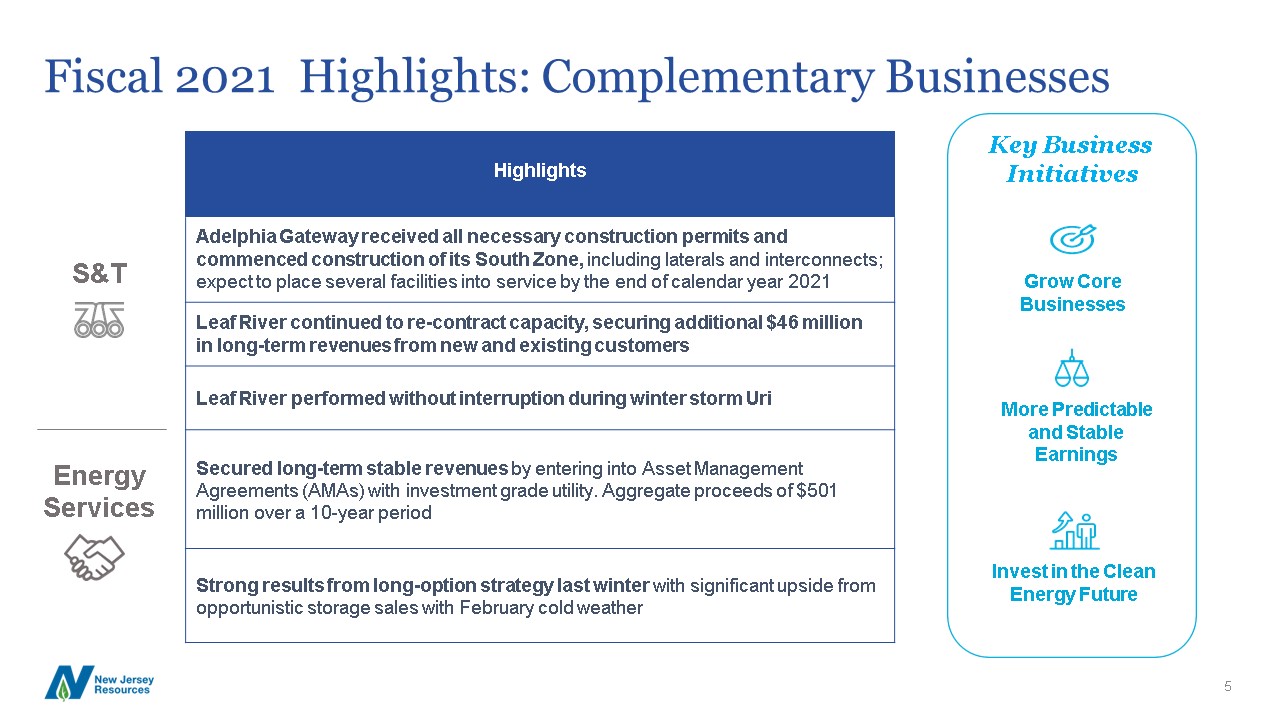
Fiscal 2021 Highlights: Complementary Businesses Highlights Adelphia Gateway received all necessary
construction permits and commenced construction of its South Zone, including laterals and interconnects; expect to place several facilities into service by the end of calendar year 2021 Leaf River continued to re-contract capacity, securing
additional $46 million in long-term revenues from new and existing customers Leaf River performed without interruption during winter storm Uri Secured long-term stable revenues by entering into Asset Management Agreements (AMAs) with
investment grade utility. Aggregate proceeds of $501 million over a 10-year period Strong results from long-option strategy last winter with significant upside from opportunistic storage sales with February cold weather S&T Energy
Services Grow Core Businesses 5 More Predictable and Stable Earnings Invest in the CleanEnergy Future Key Business Initiatives
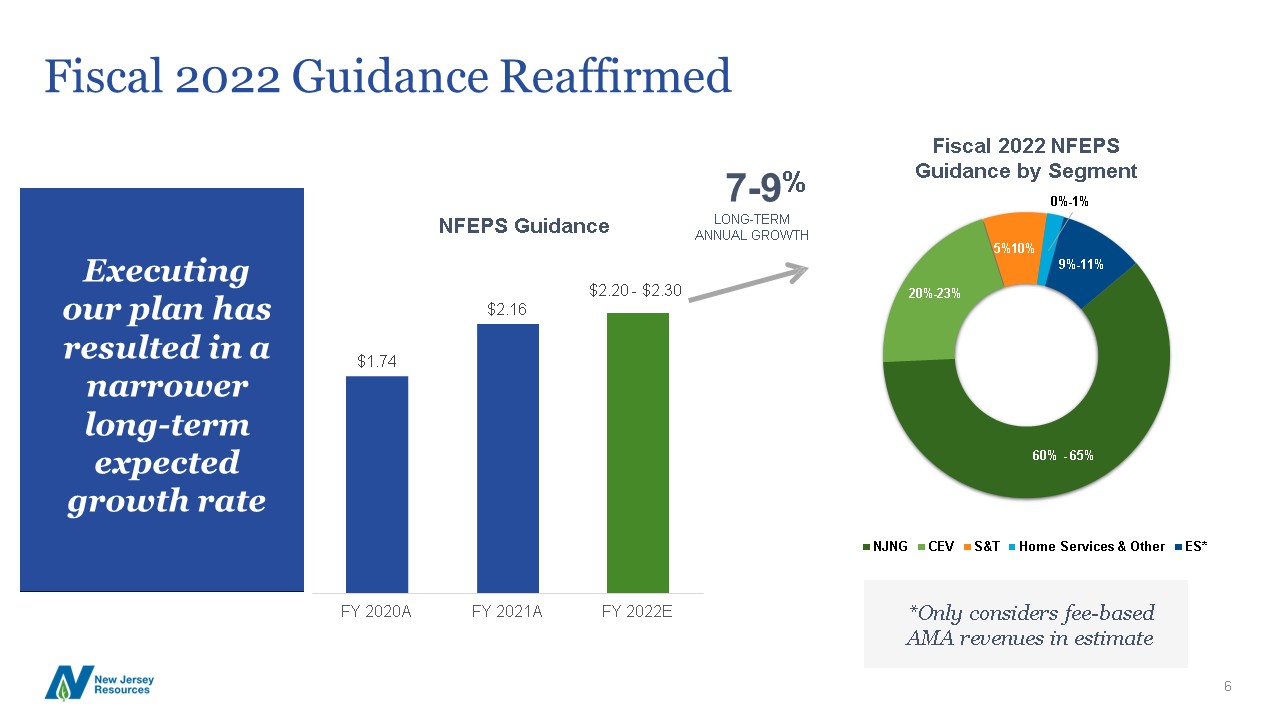
Fiscal 2022 Guidance Reaffirmed NFEPS Guidance $1.74 $2.16 $2.20 - $2.30 FY 2020A FY
2021A FY 2022E 60% - 65% 20%-23% 5%10% Fiscal 2022 NFEPS Guidance by Segment0%-1% 9%-11% NJNG CEV S&T Home Services & Other ES* 7-9%LONG-TERM ANNUAL GROWTH Executing our plan has resulted in a narrower
long-term expected growth rate 6 *Only considers fee-based AMA revenues in estimate
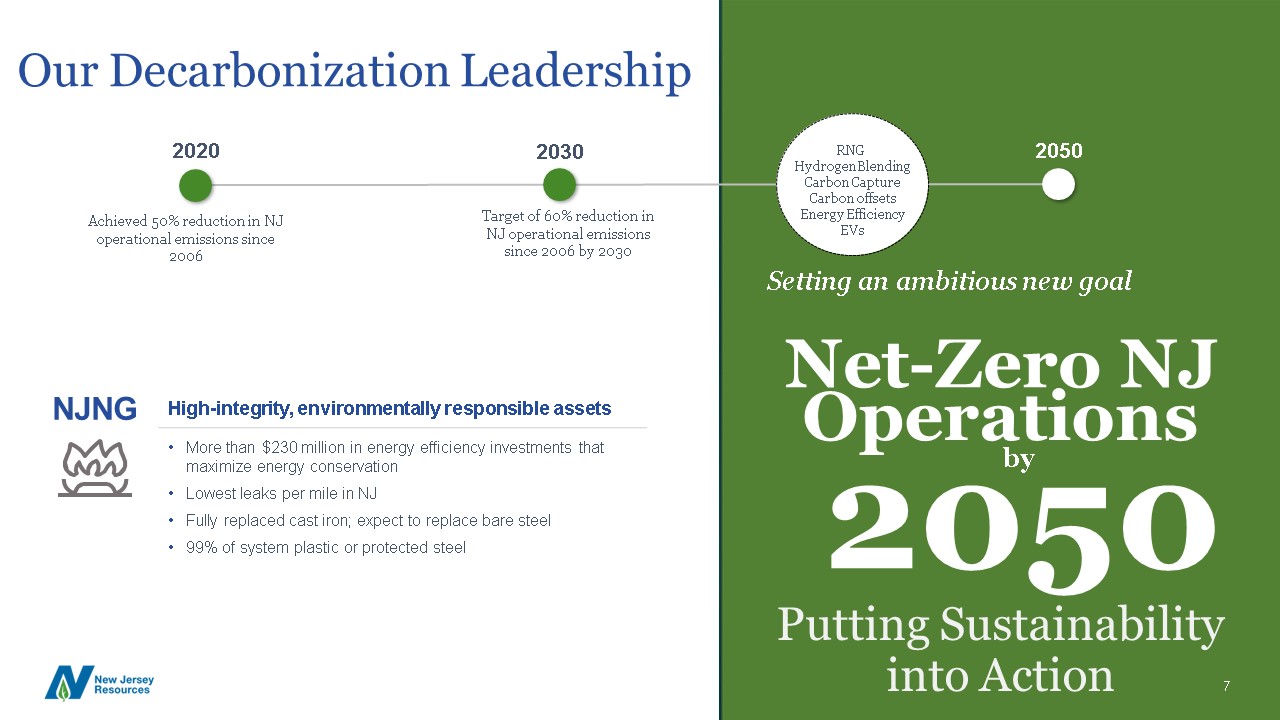
7 Setting an ambitious new goal 2050 Putting Sustainability into Action Our Decarbonization
Leadership High-integrity, environmentally responsible assets More than $230 million in energy efficiency investments that maximize energy conservationLowest leaks per mile in NJFully replaced cast iron; expect to replace bare steel99% of
system plastic or protected steel 2020 Achieved 50% reduction in NJ operational emissions since 2006 2030 Target of 60% reduction in NJ operational emissions since 2006 by 2030 2050 RNGHydrogen Blending Carbon
Capture Carbon offsets Energy Efficiency EVs NJNG by Net-Zero NJ Operations
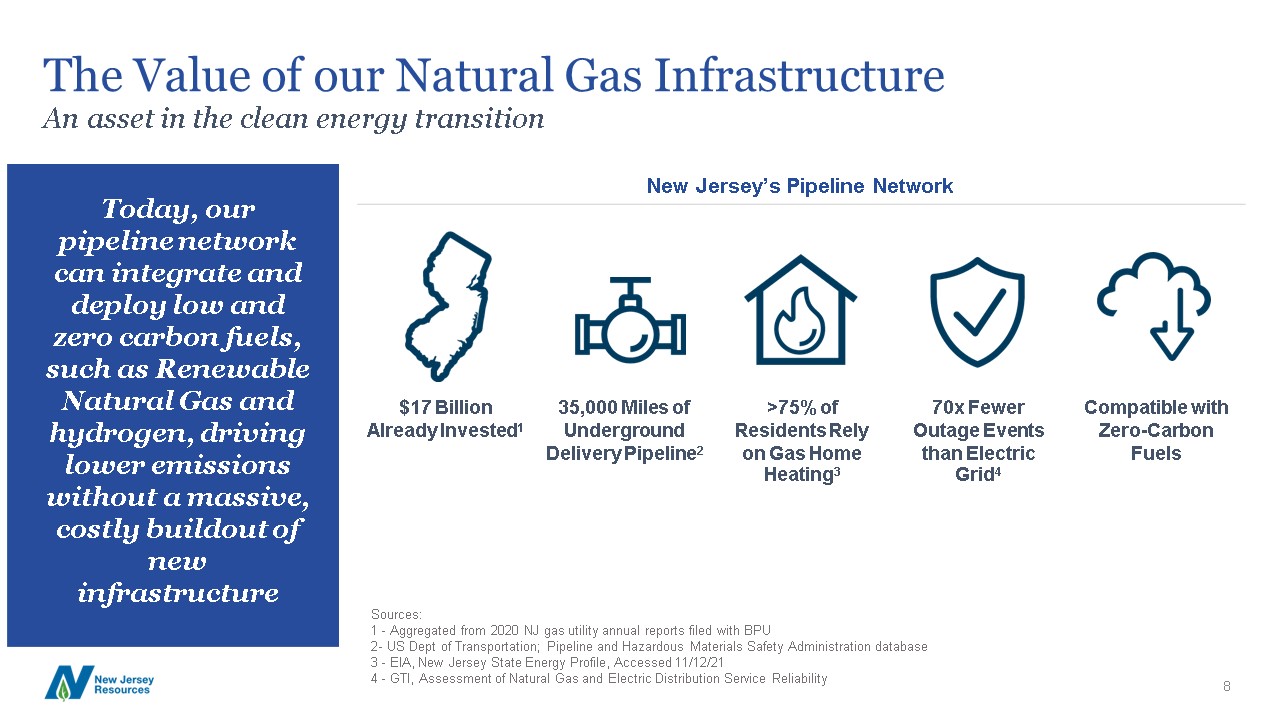
The Value of our Natural Gas InfrastructureAn asset in the clean energy transition 8 New Jersey’s
Pipeline Network $17 Billion 35,000 Miles of >75% of 70x Fewer Compatible with Already Invested1 Underground Residents Rely Outage Events Zero-Carbon Delivery Pipeline2 on Gas Home than
Electric Fuels Heating3 Grid4 Today, our pipeline network can integrate and deploy low and zero carbon fuels, such as Renewable Natural Gas and hydrogen, driving lower emissions without a massive, costly buildout of new
infrastructure Sources:- Aggregated from 2020 NJ gas utility annual reports filed with BPU- US Dept of Transportation; Pipeline and Hazardous Materials Safety Administration database 3 - EIA, New Jersey State Energy Profile, Accessed
11/12/214 - GTI, Assessment of Natural Gas and Electric Distribution Service Reliability
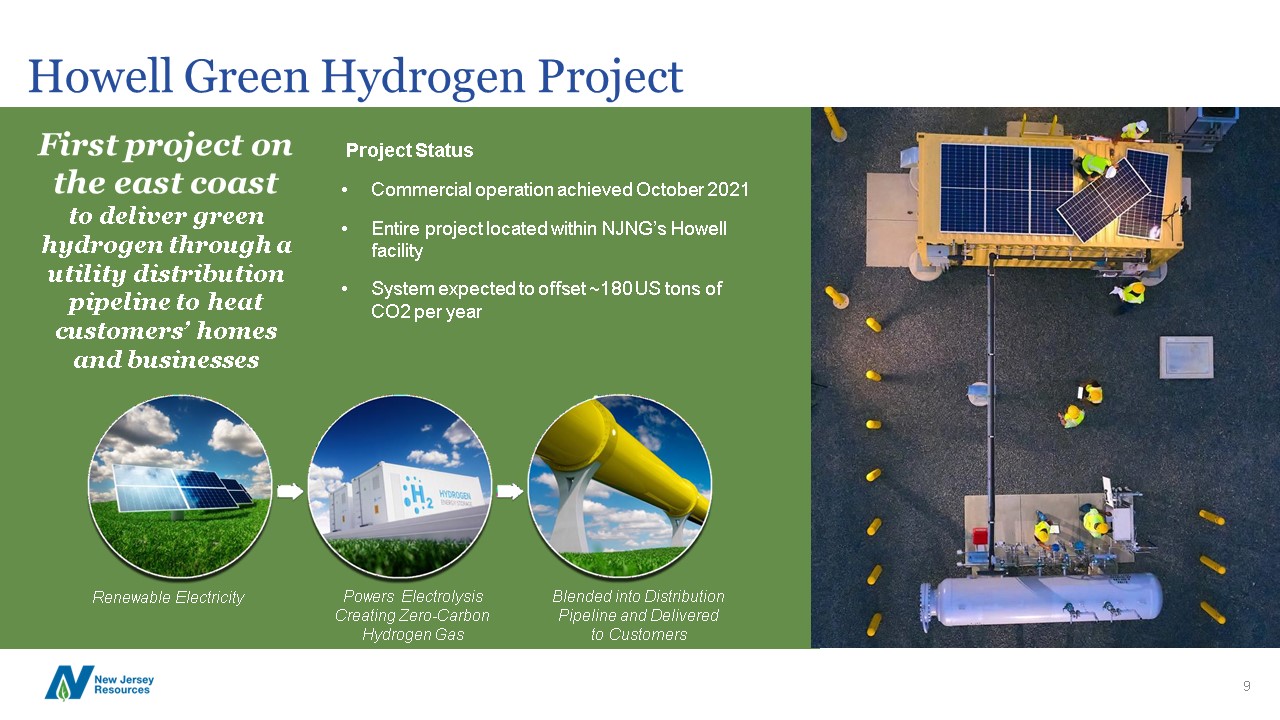
Renewable Electricity Blended into Distribution Pipeline and Delivered to Customers Powers
Electrolysis Creating Zero-Carbon Hydrogen Gas Howell Green Hydrogen Project 9 Project Status Commercial operation achieved October 2021Entire project located within NJNG’s Howell facilitySystem expected to offset ~180 US tons of CO2 per
year First project on the east coastto deliver green hydrogen through a utility distribution pipeline to heatcustomers’ homesand businesses

Financial Review Pat MigliaccioSVP & Chief Financial Officer 10
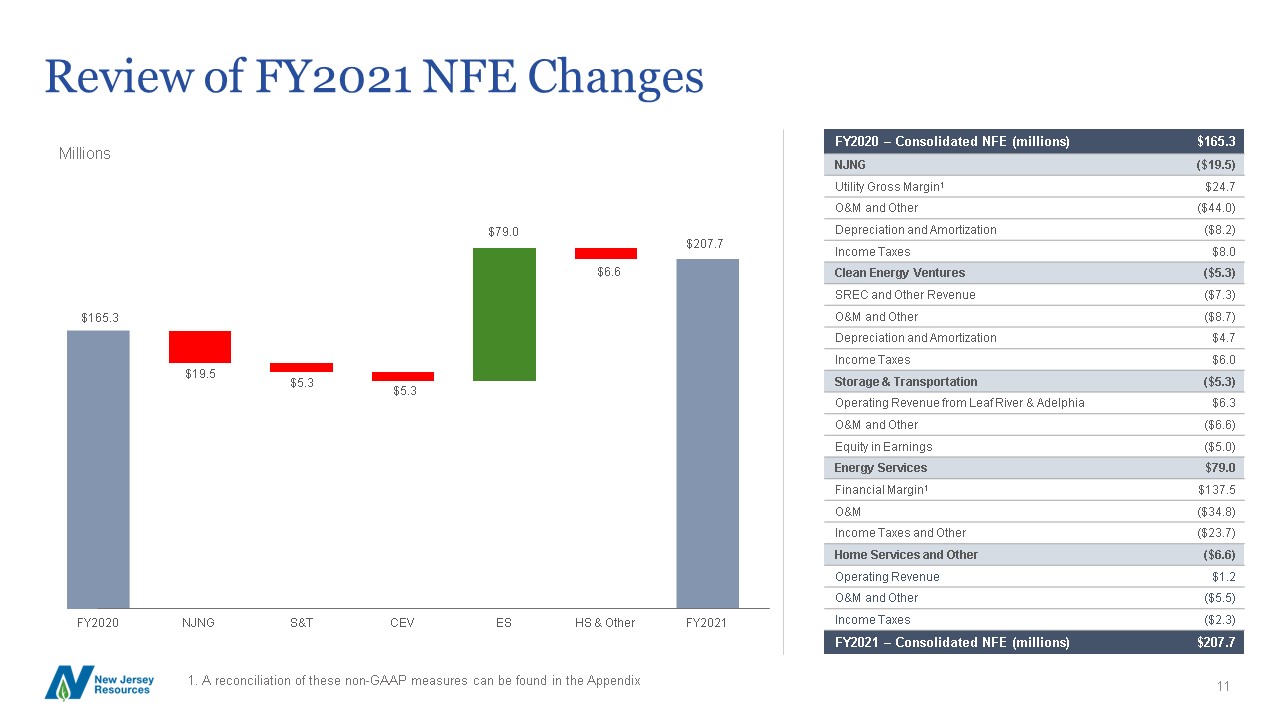
Review of FY2021 NFE
Changes 11 Millions $19.5 $5.3 $5.3 $207.7$6.6 $165.3 $79.0 FY2020 NJNG S&T CEV ES HS & Other FY2021 FY2020 – Consolidated NFE (millions) $165.3 NJNG ($19.5) Utility Gross Margin1 $24.7 O&M
and Other ($44.0) Depreciation and Amortization ($8.2) Income Taxes $8.0 Clean Energy Ventures ($5.3) SREC and Other Revenue ($7.3) O&M and Other ($8.7) Depreciation and Amortization $4.7 Income Taxes $6.0 Storage &
Transportation ($5.3) Operating Revenue from Leaf River & Adelphia $6.3 O&M and Other ($6.6) Equity in Earnings ($5.0) Energy Services $79.0 Financial Margin1 $137.5 O&M ($34.8) Income Taxes and Other ($23.7) Home
Services and Other ($6.6) Operating Revenue $1.2 O&M and Other ($5.5) Income Taxes ($2.3) FY2021 – Consolidated NFE (millions) $207.7 1. A reconciliation of these non-GAAP measures can be found in the Appendix
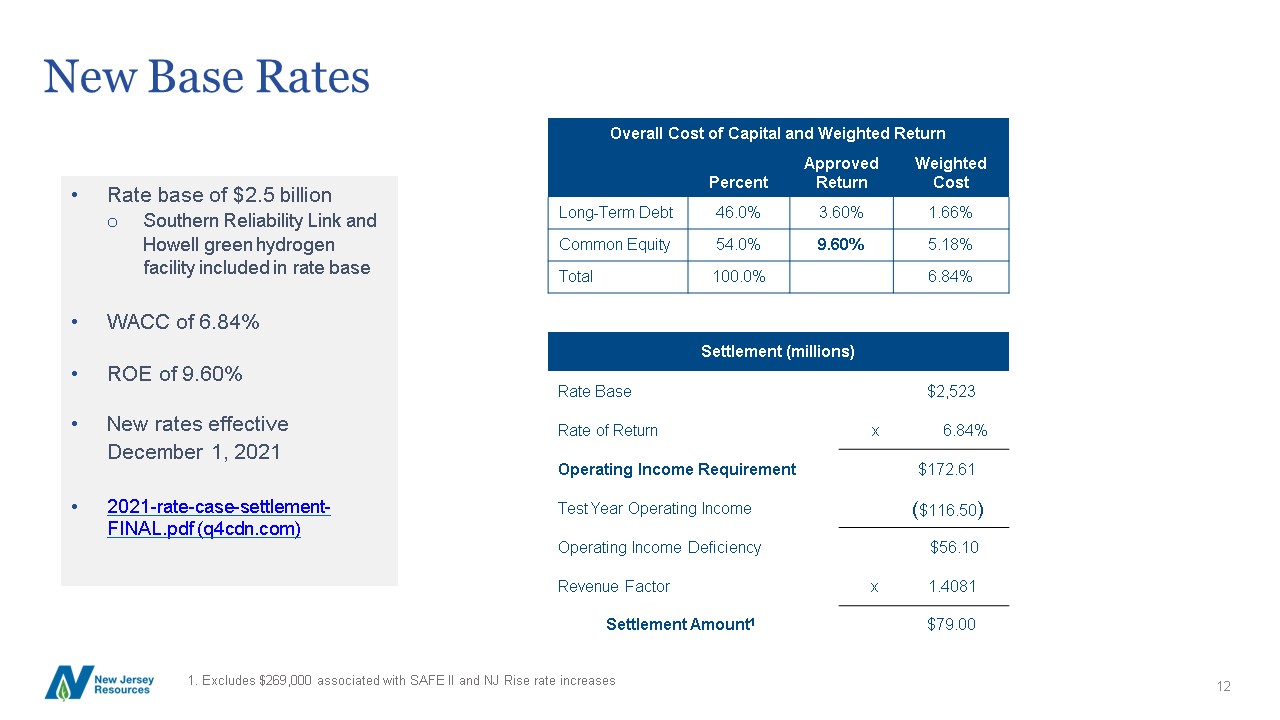
New Base Rates 12 Overall Cost of Capital and Weighted
Return Percent ApprovedReturn WeightedCost Long-Term Debt 46.0% 3.60% 1.66% Common Equity 54.0% 9.60% 5.18% Total 100.0% 6.84% Settlement (millions) Rate Base $2,523 Rate of Return x 6.84% Operating Income
Requirement $172.61 Test Year Operating Income ($116.50) Operating Income Deficiency $56.10 Revenue Factor x 1.4081 Settlement Amount1 $79.00 Rate base of $2.5 billiono Southern Reliability Link and Howell green hydrogen facility
included in rate baseWACC of 6.84%ROE of 9.60%New rates effective December 1, 20212021-rate-case-settlement- FINAL.pdf (q4cdn.com) 1. Excludes $269,000 associated with SAFE II and NJ Rise rate increases
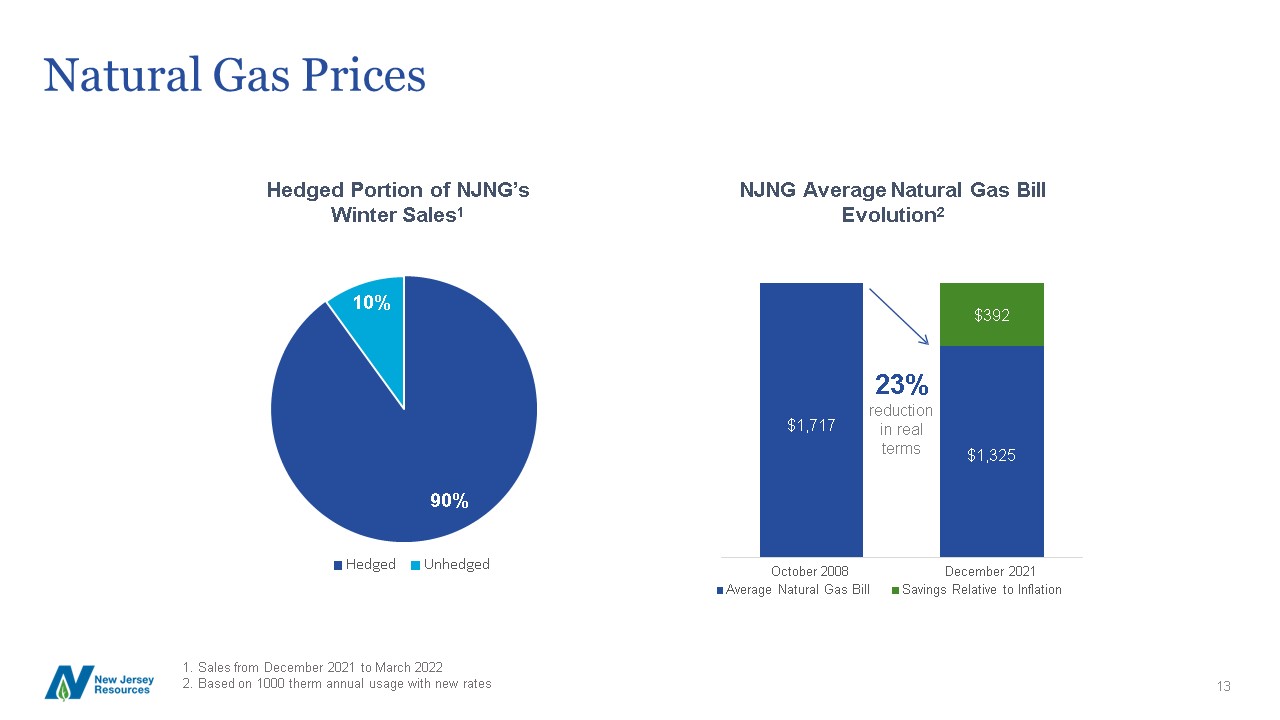
Natural Gas Prices 13 90% 10% Hedged Unhedged Hedged Portion of NJNG’sWinter
Sales1 Sales from December 2021 to March 2022Based on 1000 therm annual usage with new rates $1,717 $1,325 $392 October 2008 Average Natural Gas Bill December 2021 Savings Relative to Inflation NJNG Average Natural Gas
BillEvolution2 23%reduction in real terms
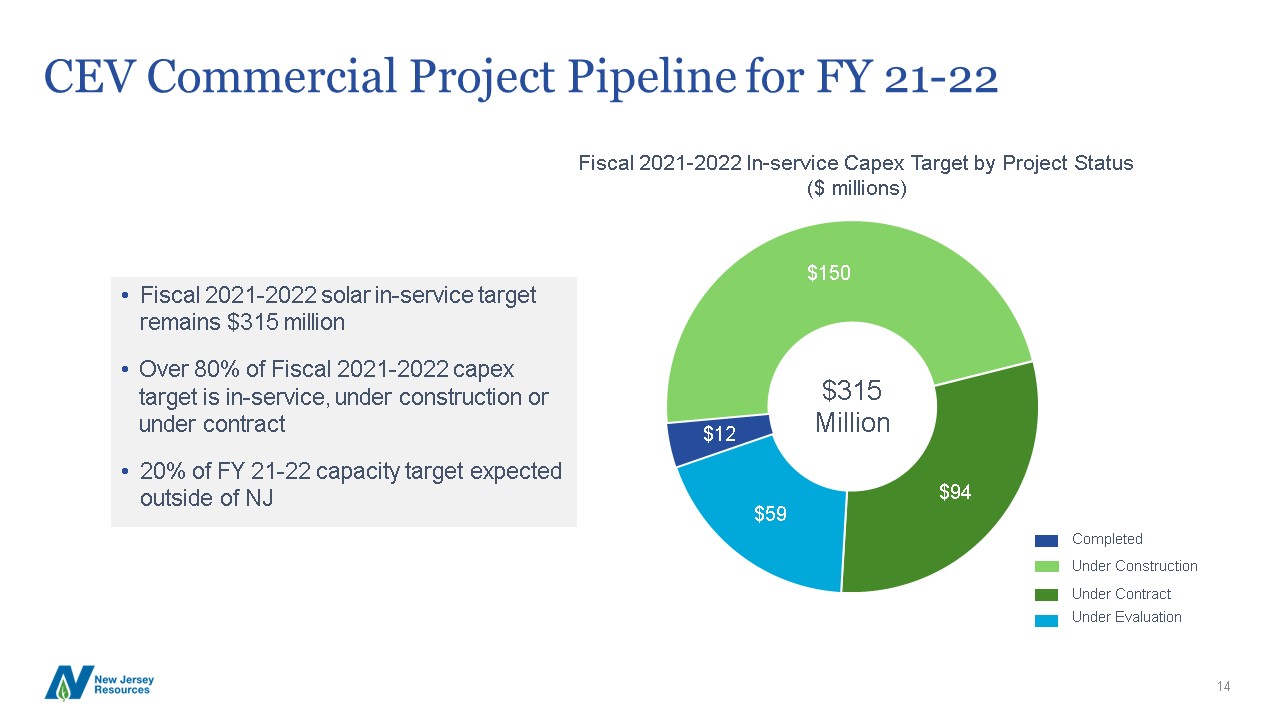
Fiscal 2021-2022 solar in-service target remains $315 millionOver 80% of Fiscal 2021-2022 capex target
is in-service, under construction or under contract20% of FY 21-22 capacity target expected outside of NJ $12 $150 $94 $59 $315Million CEV Commercial Project Pipeline for FY 21-22 Completed Under Construction Under
Contract Under Evaluation Fiscal 2021-2022 In-service Capex Target by Project Status ($ millions) 14
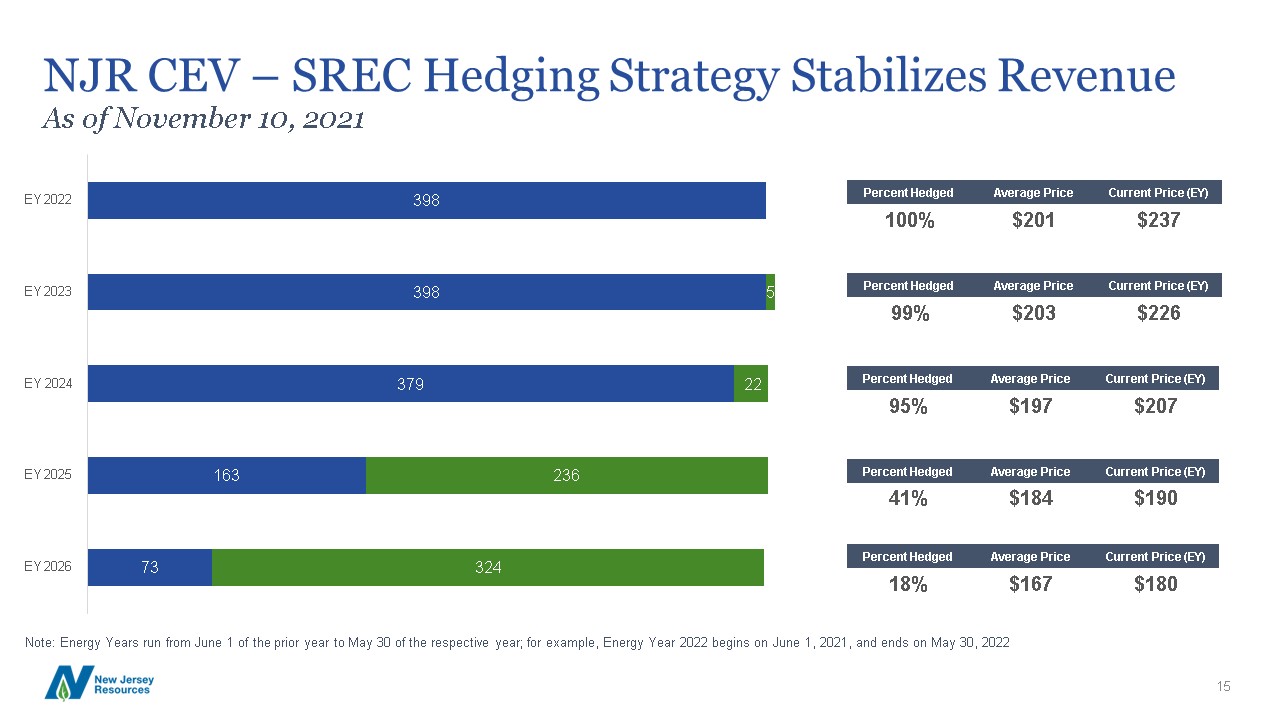
73 15 163 379 398 398 324 236 22 5 EY 2026 EY 2025 EY 2024 EY 2023 EY
2022 NJR CEV – SREC Hedging Strategy Stabilizes RevenueAs of November 10, 2021 Percent Hedged Average Price Current Price (EY) 100% $201 $237 Percent Hedged Average Price Current Price (EY) 99% $203 $226 Percent Hedged Average
Price Current Price (EY) 95% $197 $207 Percent Hedged Average Price Current Price (EY) 41% $184 $190 Percent Hedged Average Price Current Price (EY) 18% $167 $180 Note: Energy Years run from June 1 of the prior year to May 30
of the respective year; for example, Energy Year 2022 begins on June 1, 2021, and ends on May 30, 2022
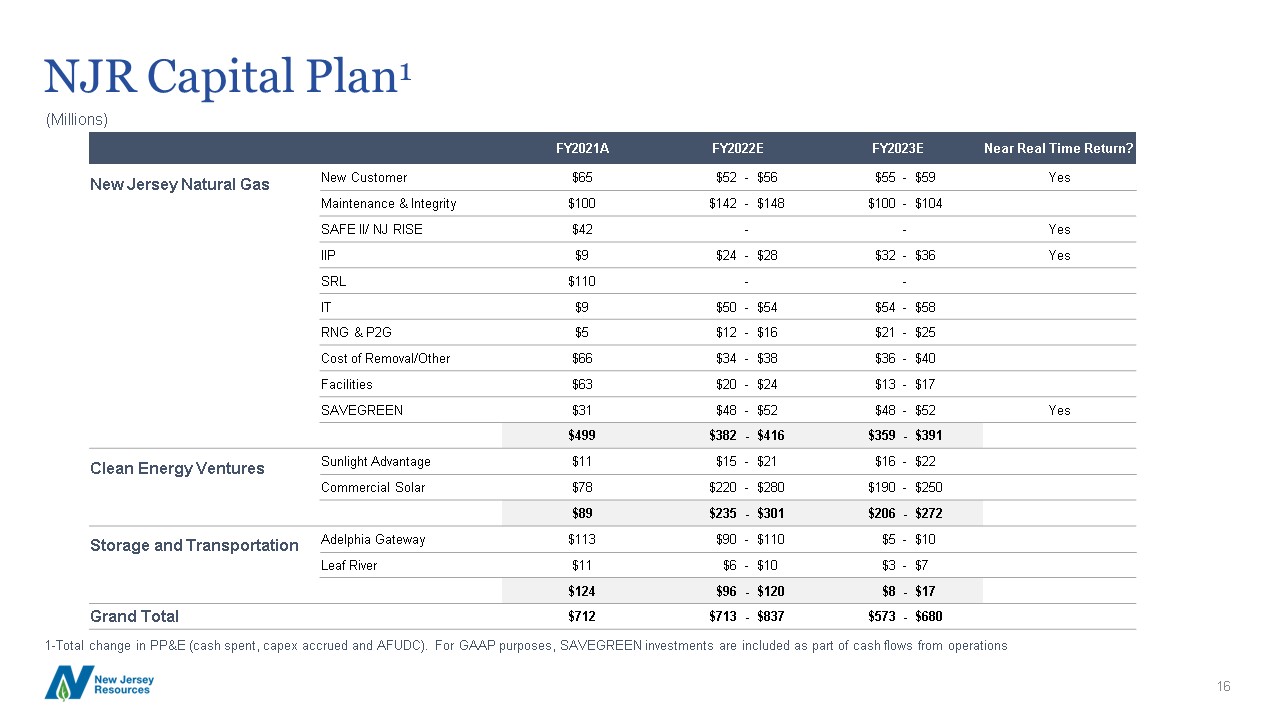
NJR Capital Plan1(Millions) 1-Total change in PP&E (cash spent, capex accrued and AFUDC). For GAAP
purposes, SAVEGREEN investments are included as part of cash flows from operations FY2021A FY2022E FY2023E Near Real Time Return? New Jersey Natural Gas New Customer $65 $52 - $56 $55 - $59 Yes Maintenance &
Integrity $100 $142 - $148 $100 - $104 SAFE II/ NJ RISE $42 - - Yes IIP $9 $24 - $28 $32 - $36 Yes SRL $110 - - IT $9 $50 - $54 $54 - $58 RNG &
P2G $5 $12 - $16 $21 - $25 Cost of Removal/Other $66 $34 - $38 $36 - $40 Facilities $63 $20 - $24 $13 - $17 SAVEGREEN $31 $48 - $52 $48 - $52 Yes $499 $382 - $416 $359 - $391 Clean
Energy Ventures Sunlight Advantage $11 $15 - $21 $16 - $22 Commercial Solar $78 $220 - $280 $190 - $250 $89 $235 - $301 $206 - $272 Storage and Transportation Adelphia
Gateway $113 $90 - $110 $5 - $10 Leaf River $11 $6 - $10 $3 - $7 $124 $96 - $120 $8 - $17 Grand Total $712 $713 - $837 $573 - $680 16
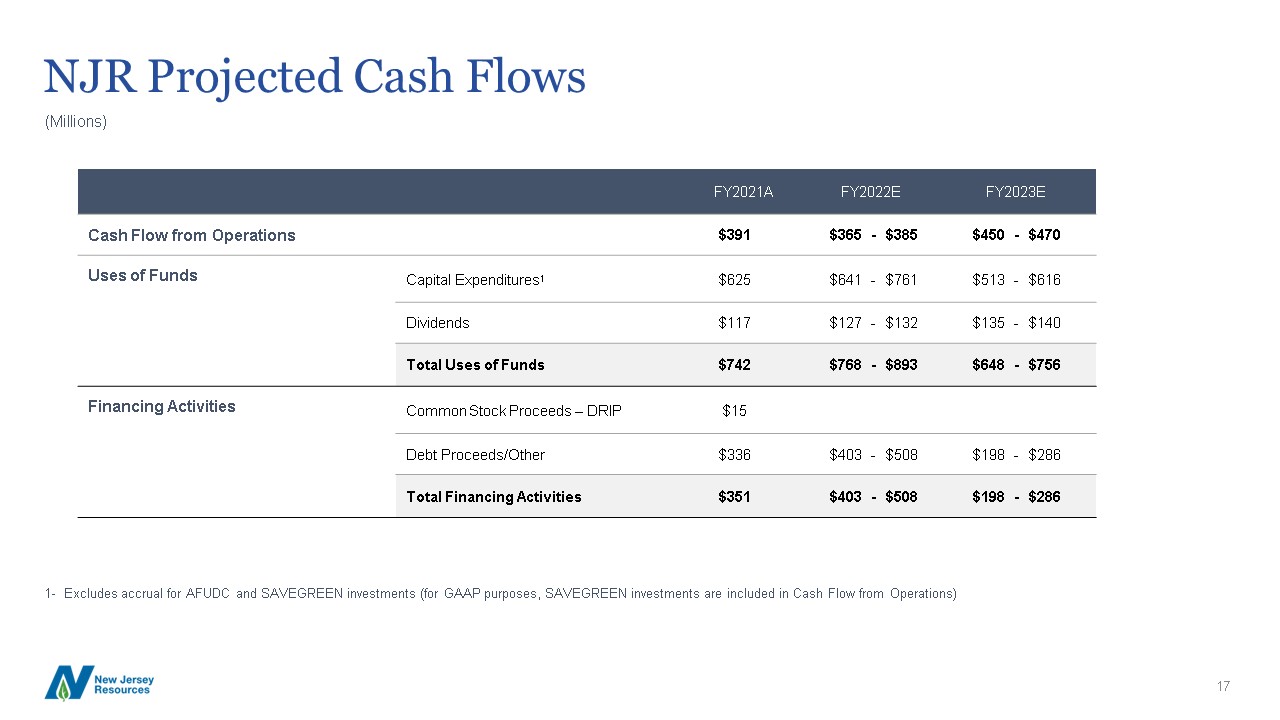
NJR Projected Cash Flows(Millions) 17 1- Excludes accrual for AFUDC and SAVEGREEN investments (for
GAAP purposes, SAVEGREEN investments are included in Cash Flow from Operations) FY2021A FY2022E FY2023E Cash Flow from Operations $391 $365 - $385 $450 - $470 Uses of Funds Capital
Expenditures1 $625 $641 - $761 $513 - $616 Dividends $117 $127 - $132 $135 - $140 Total Uses of Funds $742 $768 - $893 $648 - $756 Financing Activities Common Stock Proceeds – DRIP $15 Debt
Proceeds/Other $336 $403 - $508 $198 - $286 Total Financing Activities $351 $403 - $508 $198 - $286
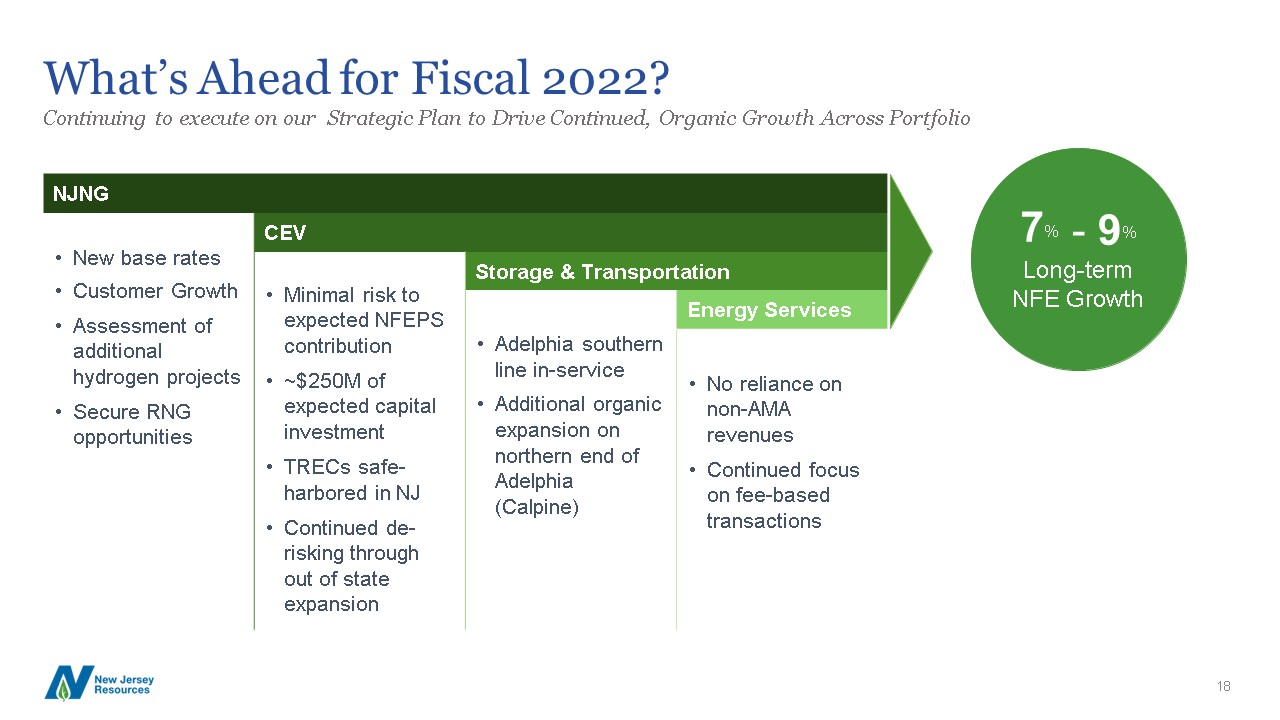
What’s Ahead for Fiscal 2022?Continuing to execute on our Strategic Plan to Drive Continued, Organic
Growth Across Portfolio NJNG New base rates CEV Storage & Transportation Customer GrowthAssessment of additional hydrogen projectsSecure RNG opportunities Minimal risk to expected NFEPS contribution~$250M of expected
capital investmentTRECs safe- harbored in NJContinued de- risking through out of state expansion Adelphia southern line in-serviceAdditional organic expansion on northern end of Adelphia (Calpine) Energy Services No reliance
on non-AMA revenuesContinued focus on fee-based transactions 7% 18 - 9% Long-termNFE Growth
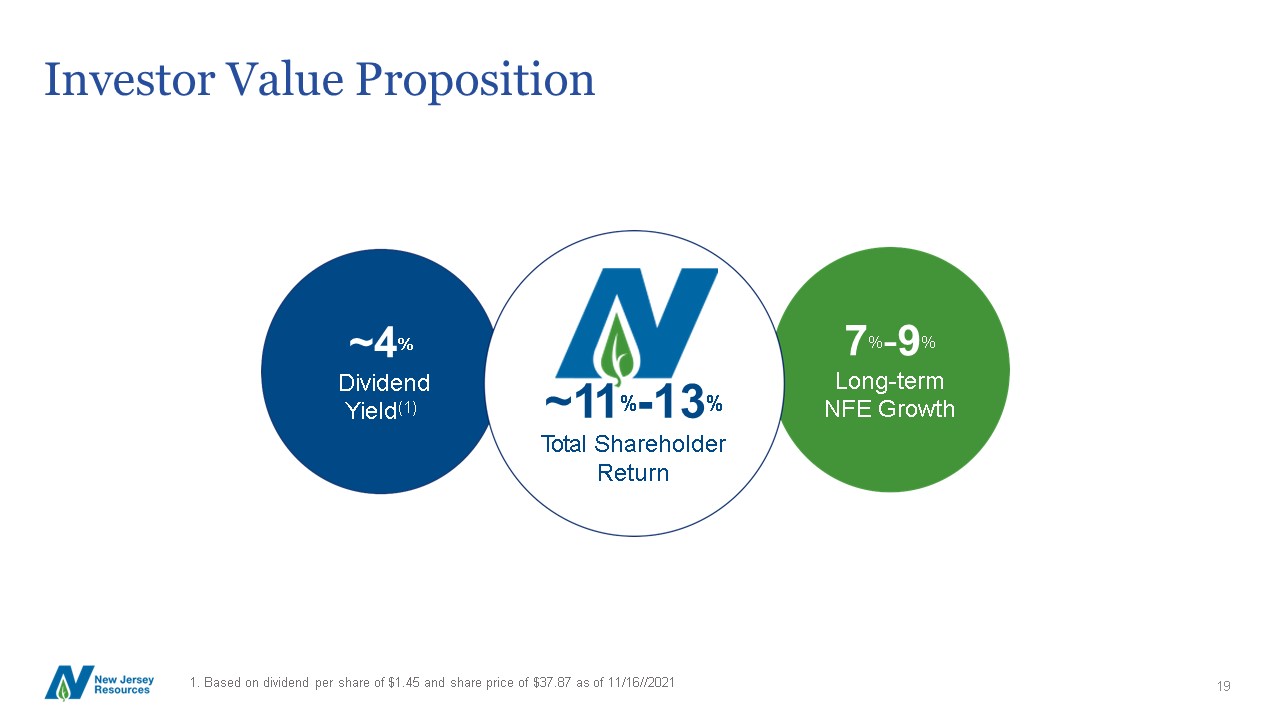
~4%Dividend Yield(1) 7%-9%Long-termNFE Growth ~11%-13%Total Shareholder Return Investor Value
Proposition 1. Based on dividend per share of $1.45 and share price of $37.87 as of 11/16//2021 19

Q&A 20

Appendix 22
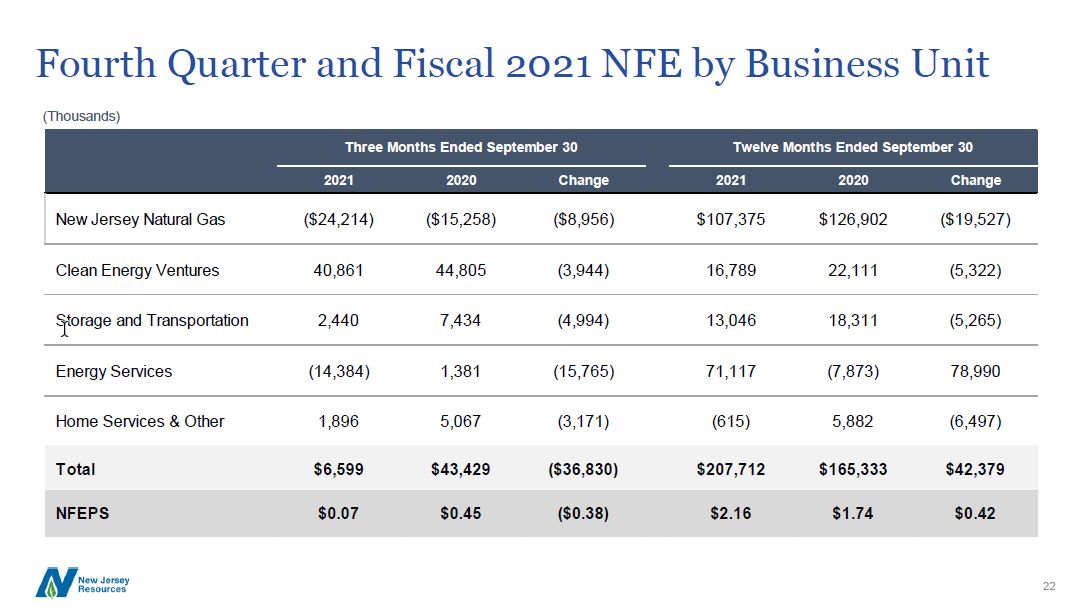
Fourth Quarter and Fiscal 2021 NFE by Business Unit (Thousands) Three Months Ended September 302021
2020 Change Twelve Months Ended September 30 2021 2020 Change New Jersey Natural
Gas ($24,214) ($15,258) ($8,956) $107,375 $126,902 ($19,527) Total $6,599 $43,429 ($36,830) $207,712 $165,333 $42,379 NFEPS $0.07 $0.45 ($0.38) $2.16 $1.74 $0.42 Clean Energy
Ventures 40,861 44,805 (3,944) 16,789 22,111 (5,322) Storage and Transportation 2,440 7,434 (4,994) 13,046 18,311 (5,265) Energy Services (14,384) 1,381 (15,765) 71,117 (7,873) 78,990 Home Services &
Other 1,896 5,067 (3,171) (615) 5,882 (6,497) 23
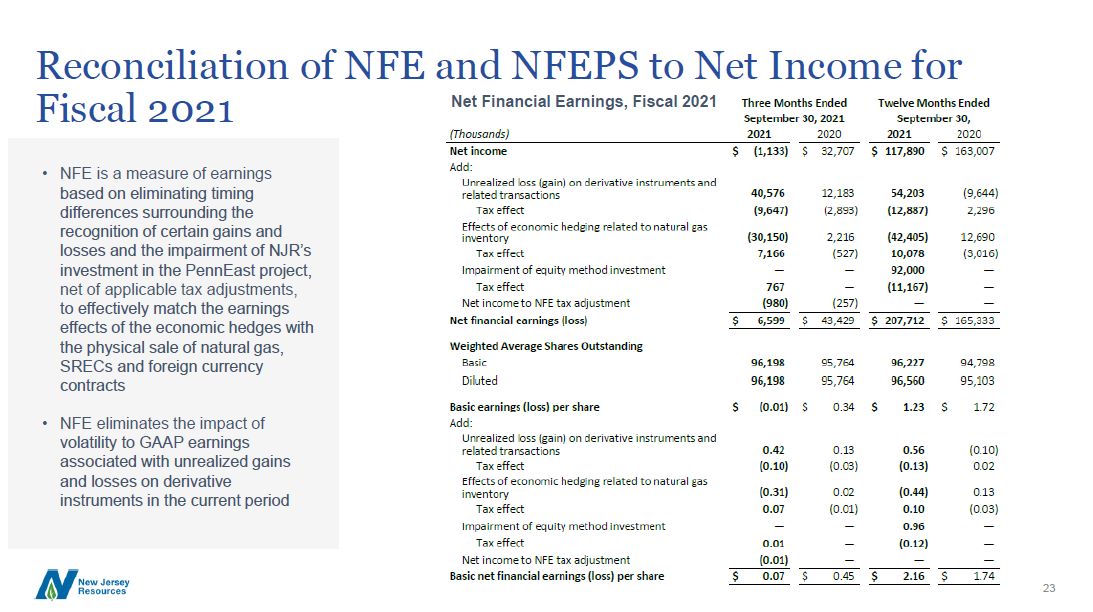
Reconciliation of NFE and NFEPS to Net Income for Fiscal 2021 NFE is a measure of earnings based on
eliminating timing differences surrounding the recognition of certain gains and losses and the impairment of NJR’s investment in the PennEast project, net of applicable tax adjustments, to effectively match the earnings effects of the
economic hedges with the physical sale of natural gas, SRECs and foreign currency contracts NFE eliminates the impact of volatility to GAAP earnings associated with unrealized gains and losses on derivative instruments in the current
period Net Financial Earnings, Fiscal 2021 24
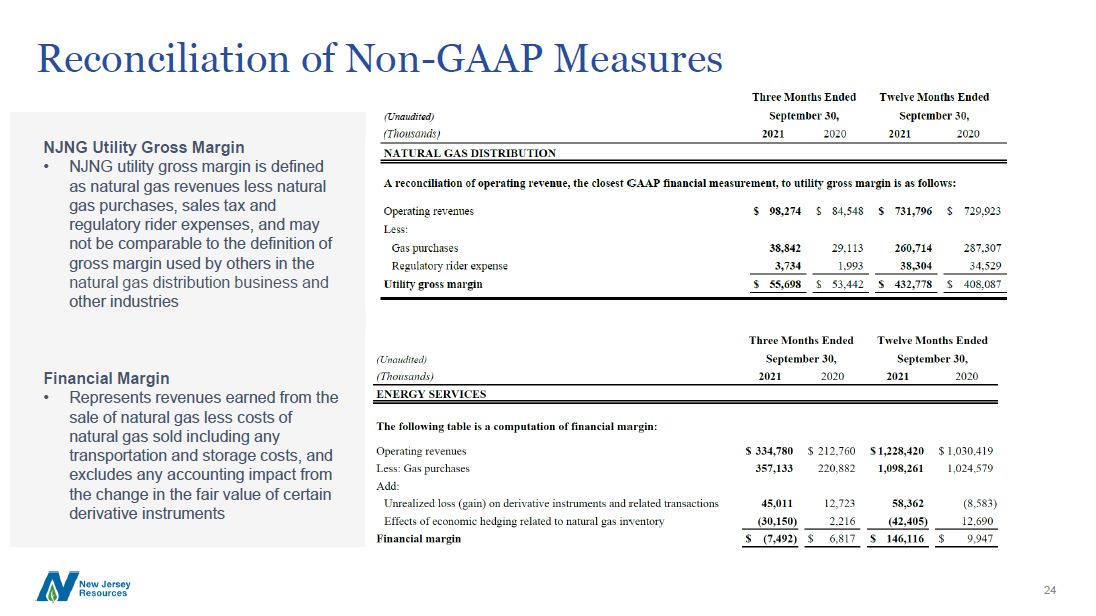
Reconciliation of Non-GAAP Measures NJNG Utility Gross MarginNJNG utility gross margin is defined as
natural gas revenues less natural gas purchases, sales tax and regulatory rider expenses, and may not be comparable to the definition of gross margin used by others in the natural gas distribution business and other industries Financial
MarginRepresents revenues earned from the sale of natural gas less costs of natural gas sold including any transportation and storage costs, and excludes any accounting impact from the change in the fair value of certain derivative
instruments 25
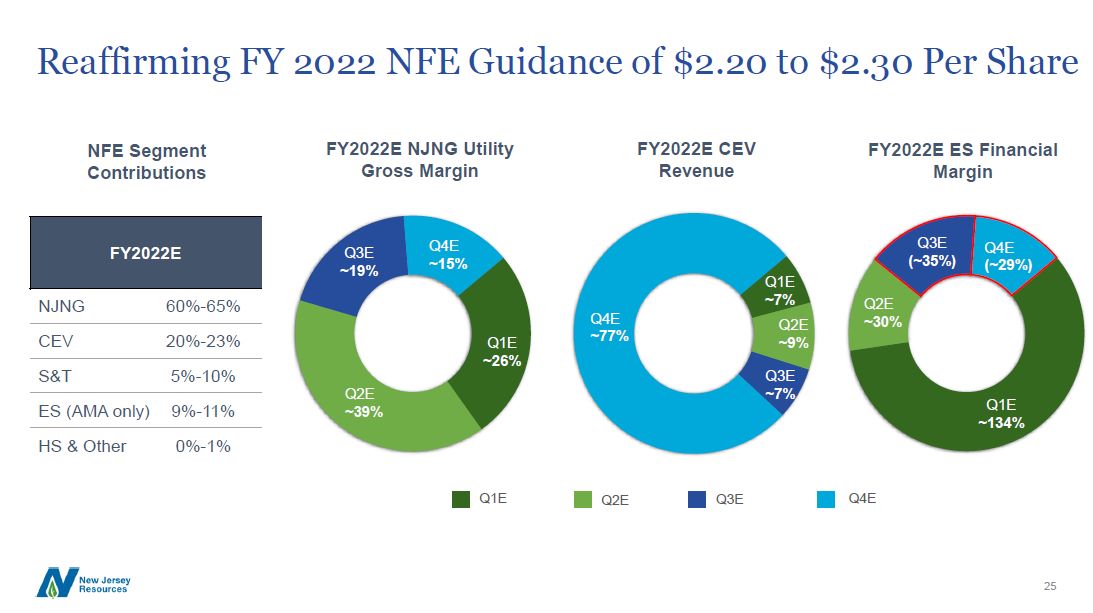
Reaffirming FY 2022 NFE Guidance of $2.20 to $2.30 Per
Share FY2022E NJNG 60%-65% CEV 20%-23% S&T 5%-10% ES (AMA only) 9%-11% HS & Other 0%-1% FY2022E NJNG UtilityGross Margin FY2022E CEVRevenue NFE
SegmentContributions Q1E Q1E~26% Q2E~39% Q3E~19% Q4E~15% FY2022E ES Financial Margin Q2E 26 Q3E Q4E Q1E~7%Q2E~9% Q3E~7% Q4E~77% Q1E~134% Q2E~30% Q3E(~35%) Q4E(~29%)
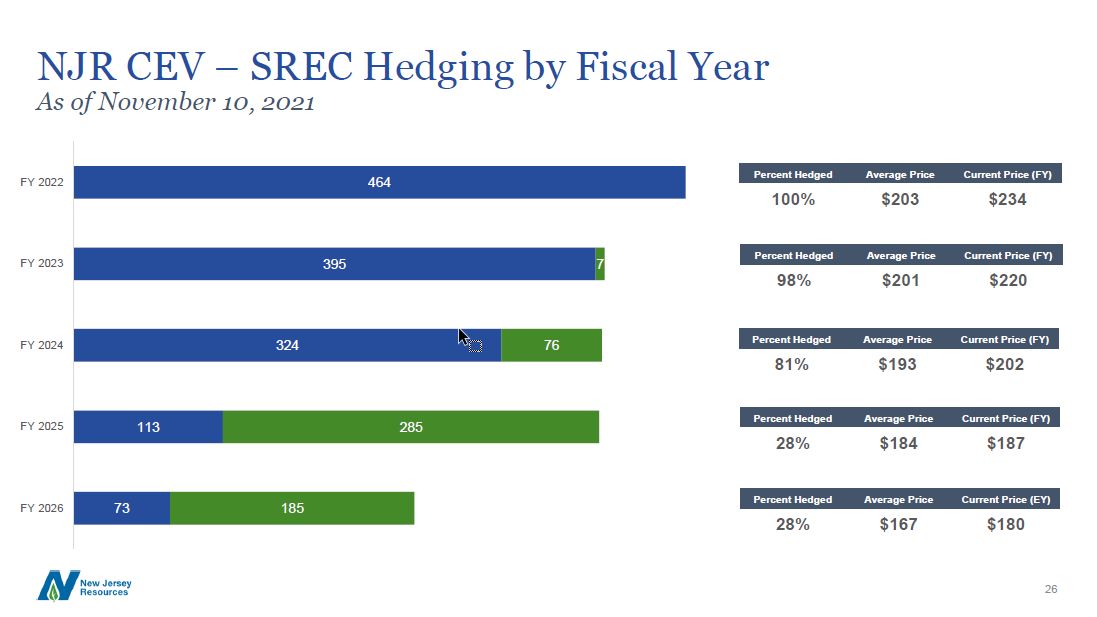
73 27 113 324 395 464 185 285 76 7 FY 2026 FY 2025 FY 2024 FY 2023 FY
2022 NJR CEV – SREC Hedging by Fiscal YearAs of November 10, 2021 Percent Hedged Average Price Current Price (FY) 100% $203 $234 Percent Hedged Average Price Current Price (FY) 98% $201 $220 Percent Hedged Average
Price Current Price (FY) 81% $193 $202 Percent Hedged Average Price Current Price (FY) 28% $184 $187 Percent Hedged Average Price Current Price (EY) 28% $167 $180
Exhibit 99.3

NEW JERSEY BOARD OF PUBLIC UTILITIES APPROVES NEW RATES
FOR NEW JERSEY NATURAL GAS
WALL, NJ, November 17, 2021 – New Jersey Natural Gas (NJNG) today received approval from the New Jersey Board of Public Utilities (BPU) on the settlement of its base rate case and conclusion of its Safety Acceleration and
Facility Enhancement (SAFE II) and New Jersey Reinvestment in System Enhancement (NJ RISE) programs, resulting in a $79.269 million increase to its base rates. NJNG requested the increase to recover costs associated with the responsible operation
of its business, system enhancements and infrastructure investments, including an emission-reducing green hydrogen project, the Southern Reliability Link (SRL) and a new training facility.
“This is a reasonable, fair settlement that recognizes the value of the more than $800 million of investments we’ve made in our system and operations since
2019,” said Steve Westhoven, President and CEO of New Jersey Natural Gas. “These investments have significantly enhanced the reliability of our delivery system, driven down emissions and supported the critical operation of our lifeline utility
service. We thank the Board of Public Utilities for their work in reaching an outcome that balances the interests of our customers and our company.”
After a thorough review by regulators, the settlement reflects a rate base of $2.523 billion, an increase in revenue requirement of $79 million, an overall rate
of return of 6.84 percent and a composite depreciation rate of 2.78%.
The BPU also authorized a $269,000 rate increase related to SAFE II and NJ RISE investments through June 30, 2021, effectively concluding those programs.
Approved in 2016 and 2014, respectively, SAFE II and NJ RISE replaced unprotected base steel main in NJNG’s pipeline network and enhanced system resiliency in the most storm prone areas of its service territory.
The approved rates include recovery of NJNG’s new emission-reducing green hydrogen facility. This cutting-edge project is the first of its kind on the east
coast to generate zero-carbon green hydrogen and blend that energy with natural gas on an existing distribution system serving customers. The project results in lower emissions from the energy NJNG delivers, without any change to the way its
customers receive or consume energy.
Also included is the recovery of all capital investments related to the SRL and a new safety training facility. The SRL is a new 30-mile transmission pipeline
that significantly strengthens NJNG’s delivery system and provides greater reliability and supply diversity to customers at the southern end of its service territory. The training facility is a part of NJNG’s commitment to safety. It will provide
mandated operator qualification and safety-related training, including classroom and simulated field activities for NJNG employees and third-party contractors, as well as training opportunities for local emergency personnel.
NEW JERSEY BOARD OF PUBLIC UTILITIES APPROVES NEW RATES FOR
NEW JERSEY NATURAL GAS
Page 2 of 3
Separately, the BPU approved a 1.4% increase related to Basic Gas Supply Service (BGSS) recoveries. The BGSS represents the cost of the commodity that is passed
through to customers. Any change to this rate does not result in a change in earnings for NJNG.
The new rates will go into effect on December 1, 2021.
As a result of the BGSS and base rate adjustments approved by the BPU, the typical residential heating customer using 100 therms a month will see an increase of
$13.23 or 11.3% on their monthly bill, from $117.05 to $130.28. Even with this change, customers’ bills are still 23.4% lower than they were in 2008.
Energy assistance is available for customers struggling to pay their natural gas bill. Email [email protected] or call 800-221-0051 to
learn more about eligibility and available programs. NJNG also offers energy-efficiency programs through The SAVEGREEN PROJECT®, including rebates and financing options for high-efficiency equipment, to help customers save energy and money. For
more information, visit savegreenproject.com.
About New Jersey Resources
New Jersey Resources (NYSE: NJR) is a Fortune 1000 company that, through its subsidiaries, provides safe and reliable natural gas and clean energy services, including transportation, distribution, asset management and home
services. NJR is composed of five primary businesses:
| • |
New Jersey Natural Gas, NJR’s principal subsidiary, operates and maintains over 7,500 miles of natural gas transportation and distribution infrastructure to serve over half a million customers in Monmouth, Ocean and parts of
Morris, Middlesex and Burlington counties in New Jersey.
|
| • |
NJR Clean Energy Ventures invests in, owns and operates solar projects with a total capacity of more than 365 megawatts, providing residential and commercial customers with low-carbon energy solutions.
|
| • |
NJR Energy Services manages a diversified portfolio of natural gas transportation and storage assets and provides physical natural gas services and customized energy solutions to its customers across North America.
|
| • |
NJR Home Services provides service contracts as well as heating, central air conditioning, water heaters, standby generators, solar and other indoor and outdoor comfort products to residential homes throughout New Jersey.
|
NEW JERSEY BOARD OF PUBLIC UTILITIES APPROVES NEW RATES FOR
NEW JERSEY NATURAL GAS
Page 3 of 3
NJR and its more than 1,200 employees are committed to helping customers save
energy and money by promoting conservation and encouraging efficiency through Conserve to Preserve® and initiatives such as The SAVEGREEN
Project® and The Sunlight Advantage®.
Follow us on Twitter @NJNaturalGas.
“Like” us on facebook.com/NewJerseyNaturalGas.
###
Exhibit 99.4

NJR Contacts:
|
Roberto Bel, Vice President, Treasurer & Investor Relations
|
732-938-1049
|
|
Dennis Puma, Director, Investor Relations & Treasury Services
|
732-938-1229
|
November 17, 2021
SUMMARY OF BASE RATE CASE SETTLEMENT
A 43% Increase in Rate Base to $2.523 Billion
At its regularly scheduled meeting today, the New Jersey Board of Public Utilities (“BPU”) approved a $79.0 million base rate increase for New Jersey Natural Gas
Company (“NJNG” or the “Company”), the principal subsidiary of New Jersey Resources Corporation (NJR). New base rates will be effective on December 1, 2021.
BACKGROUND
NJNG filed a base rate case in March 2021 seeking a $165.67 million increase in its delivery rates. Based upon its final update, NJNG supported an increase of $162.46
million, reflecting the Company’s actual test year. Since the conclusion of its last base rate case in 2019, NJNG has invested approximately $814.0 million to upgrade and enhance the safety and reliability of its transmission and distribution
systems, including the installation of its Southern Reliability Link (“SRL”).
KEY PROVISIONS
The rate case settlement (the “Settlement”) contains several important components including:
| • |
A 43% increase in rate base to $2.523 billion from $1.765 billion.
|
| • |
An overall rate of return of 6.84% calculated as follows:
|
|
Ratios
|
Cost Rate
|
Weighted Cost Rate
|
||||||||||
|
Long-term Debt
|
46.0
|
%
|
3.60
|
%
|
1.66
|
%
|
||||||
|
Common Equity
|
54.0
|
%
|
9.60
|
%
|
5.18
|
%
|
||||||
|
Total
|
100.0
|
%
|
6.84
|
%
|
||||||||
| • |
An agreed upon Return on Equity of 9.60% with a 54.0% equity ratio. This maintains the 9.60% ROE with a 54.0% equity ratio in NJNG’s last base rate case in 2019.
|
| • |
Maintaining the existing composite depreciation rate of 2.78%.
|
| • |
New Assets.
|
Included is the recovery of all capital investments related to NJNG’s SRL project, a new training facility and green hydrogen facility.
The SRL, a new 30-mile transmission pipeline, provides a new natural gas feed into the southern end of NJNG’s service territory, significantly
enhancing the reliability and resiliency of its distribution system.
The new training facility is a part of NJNG’s commitment to safety. It will provide mandated operator qualification and safety-related training,
including classroom and simulated field activities for NJNG employees and third-party contractors, as well as training opportunities for local emergency personnel.
The cutting-edge green hydrogen project is the first of its kind on the east coast to generate zero-carbon green hydrogen and blend that energy with
natural gas on an existing distribution system serving customers. The project results in lower emissions from the energy NJNG delivers.
REVENUE INCREASE DETAILS
|
($ millions, except as noted)
|
||||
|
Rate Base
|
$
|
2,523
|
||
|
Rate of Return
|
6.84
|
%
|
||
|
Income Requirement
|
$
|
172.61
|
||
|
Pro-Forma Income
|
$
|
116.50
|
||
|
Operating Income Deficiency
|
$
|
56.10
|
||
|
Revenue Factor
|
1.4081
|
|||
|
Revenue Requirement
|
$
|
79.00
|
||
RECONCILIATION
The primary differences between the Company's original request and the increase granted are as follows:
|
($ millions)
|
Amount
|
|||||||
|
AMOUNT REQUESTED - March 2021
|
$
|
165.67
|
||||||
|
UPDATES
|
||||||||
|
Rate Base/Cost of Debt Updates
|
24.62
|
|||||||
|
Operating Income Updates
|
(27.83
|
)
|
(3.21
|
)
|
||||
|
SUPPORTED AMOUNT AFTER UPDATES - September 2021
|
$
|
162.46
|
||||||
|
SETTLEMENT RECONCILIATION
|
||||||||
|
Reduction in Rate Base/WACC
|
(24.29
|
)
|
||||||
|
Operating Income Adjustments
|
(59.17
|
)
|
(83.46
|
)
|
||||
|
SETTLEMENT AMOUNT
|
$
|
79.00
|
||||||
2
COMPARISON OF PREVIOUS NJNG BASE RATE CASES
Listed below is a comparison of the major financial aspects of NJNG’s last three base rate cases:
|
($ millions, except as noted)
|
November 2021 Order
|
November 2019 Order
|
September 2016 Order
|
|||||||||
|
Rate Base
|
$
|
2,523
|
$
|
1,764
|
$
|
1,374
|
||||||
|
Common Equity Component
|
54.0
|
%
|
54.0
|
%
|
52.5
|
%
|
||||||
|
Return on Equity
|
9.60
|
%
|
9.60
|
%
|
9.75
|
%
|
||||||
|
Depreciation Rate
|
2.78
|
%
|
2.78
|
%
|
2.40
|
%
|
||||||
|
Filing Date
|
March 2021
|
March 2019
|
November 2015
|
|||||||||
FORWARD LOOKING STATEMENTS
This fact sheet contains forward-looking statements within the meaning of Section 27A of the Securities Act of 1933, as amended, Section 21E of the Securities Exchange
Act of 1934, as amended, and the Private Securities Litigation Reform Act of 1995. NJR cautions readers that the assumptions forming the basis for forward-looking statements include many factors that are beyond NJR’s ability to control or estimate
precisely, such as estimates of future market conditions and the behavior of other market participants. Words such as “anticipates,” “estimates,” “expects,” “projects,” “may,” “will,” “intends,” “plans,” “believes,” “should” and similar expressions
may identify forward-looking statements and such forward-looking statements are made based upon management’s current expectations, assumptions, and beliefs as of this date concerning future developments and their potential effect upon NJR. There
can be no assurance that future developments will be in accordance with management’s expectations, assumptions and beliefs or that the effect of future developments on NJR will be those anticipated by management. Forward-looking statements in this
earnings release include, but are not limited to, certain statements regarding NJR’s NFEPS guidance for fiscal 2021 or fiscal 2022, results of ongoing and future rate cases, forecasted contribution of business segments to NJR’s NFE for fiscal 2021
or fiscal 2022, future NJR and NJNG capital expenditures, infrastructure programs and investments such as SRL, Infrastructure Investment Program, Safety Acceleration and Facility Enhancement Program, Phase II and energy efficiency programs, the
ability to construct and operate the Adelphia Gateway Pipeline project, and other legal and regulatory expectations.
Additional information and factors that could cause actual results to differ materially from NJR’s expectations are contained in NJR’s filings with the SEC, including
NJR’s Annual Reports on Form 10-K and subsequent Quarterly Reports on Form 10-Q, recent Current Reports on Form 8-K, and other SEC filings, which are available at the SEC’s web site, http://www.sec.gov. Information included in this fact
sheet is representative as of today only and while NJR periodically reassesses material trends and uncertainties affecting NJR's results of operations and financial condition in connection with its preparation of management's discussion and
analysis of results of operations and financial condition contained in its Quarterly and Annual Reports filed with the SEC, NJR does not, by including this statement, assume any obligation to review or revise any particular forward-looking
statement referenced herein in light of future events.
ABOUT NEW JERSEY RESOURCES
New Jersey Resources (NYSE: NJR) is a Fortune 1000 company that, through its subsidiaries, provides safe and reliable natural gas and clean energy services, including transportation, distribution, asset management and home services. NJR is
composed of five primary businesses:
3
| • |
New Jersey Natural Gas, NJR’s principal subsidiary, operates and maintains over 7,500 miles of natural gas transportation and distribution infrastructure to serve over half a million customers in New Jersey’s Monmouth, Ocean and parts of
Morris, Middlesex and Burlington counties.
|
| • |
NJR Clean Energy Ventures invests in, owns and operates solar projects with a total capacity of more than 365 megawatts, providing residential and commercial customers with low-carbon solutions.
|
| • |
NJR Energy Services manages a diversified portfolio of natural gas transportation and storage assets and provides physical natural gas services and customized energy solutions to its customers across North America.
|
| • |
NJR Home Services provides service contracts as well as heating, central air conditioning, water heaters, standby generators, solar and other indoor and outdoor comfort products to residential homes throughout New Jersey.
|
NJR and its nearly 1,200 employees are committed to helping customers save energy and
money by promoting conservation and encouraging efficiency through Conserve to Preserve® and initiatives such as The SAVEGREEN Project® and The Sunlight
Advantage®.
Follow us on Twitter @NJNaturalGas.
“Like” us on facebook.com/NewJerseyNaturalGas.
4