NJR 8-K
New Jersey Resources Corp (NJR)
8-K
2025-06-13
For: 2025-06-13
View Original
Added on
April 08, 2026
UNITED STATES
SECURITIES AND EXCHANGE COMMISSION
Washington, D.C. 20549
FORM 8-K
CURRENT REPORT
PURSUANT TO SECTION 13 OR 15 (d) OF THE
SECURITIES EXCHANGE ACT OF 1934
Date of Report (Date of earliest event reported): June 13, 2025
(Exact name of registrant as specified in its charter)
|
|
|
|
|
(State or other jurisdiction of incorporation)
|
(Commission File Number)
|
(IRS Employer Identification No.)
|
|
|
|
|
|
(Address of principal executive offices)
|
(Zip Code)
|
(732 ) 938-1480
(Registrant’s telephone number, including area code)
Check the appropriate box below if the Form 8-K filing is intended to simultaneously satisfy the filing obligation of the registrant under any of the
following provisions:
|
Written communications pursuant to Rule 425 under the Securities Act (17 CFR 230.425)
|
|
Soliciting material pursuant to Rule 14a-12 under the Exchange Act (17 CFR 240.14a-12)
|
|
Pre-commencement communications pursuant to Rule 14d-2(b) under the Exchange Act (17 CFR 240.14d-2(b))
|
|
Pre-commencement communications pursuant to Rule 13e-4(c) under the Exchange Act (17 CFR 240.13e-4(c))
|
Securities registered pursuant to Section 12(b) of the Act:
|
Title of each class
|
Trading Symbol(s)
|
Name of each exchange on which registered
|
|
|
|
|
Indicate by check mark whether the registrant is an emerging growth company as defined in Rule 405 of the Securities Act of 1933 (§230.405 of this chapter)
or Rule 12b-2 of the Securities Exchange Act of 1934 (§240.12b-2 of this chapter).
Emerging growth company ☐
If an emerging growth company, indicate by check mark if the registrant has elected not to use the extended transition period for complying with any new or
revised financial accounting standards provided pursuant to Section 13(a) of the Exchange Act. ☐
| Item 7.01 |
Regulation FD Disclosure
|
In June 2025, New Jersey Resources Corporation will be hosting one-on-one meetings with investors, analysts, and other members of the
financial community in London and Zurich (June 16-17, 2025), as well as participating in the J.P. Morgan 2025 Energy, Power, Renewables & Mining Conference in New York (June 24, 2025).
During these meetings, they will be providing certain information concerning the Company in a slide presentation. The slides to be
used at the meeting are furnished herewith as Exhibit 99.1 and are incorporated by reference into Item 7.01 of this Current Report on Form 8-K.
The information in Item 7.01 of this Current Report is being furnished and shall not be deemed “filed” for the purposes of Section 18
of the Securities Exchange Act of 1934, as amended, or otherwise subject to the liabilities of that Section and shall not be deemed to be incorporated by reference into any registration statement or other document pursuant to the Securities Act of
1933, as amended.
| Item 9.01. |
Financial Statements and Exhibits
|
|
Exhibit
Number
|
Description
|
|
Investor Presentation, dated June 13, 2025 (furnished, not filed)
|
|
|
104
|
Cover page in Inline XBRL format
|
SIGNATURE
Pursuant to the requirements of the Securities Exchange Act of 1934, the registrant has duly caused this report to be signed on its
behalf by the undersigned hereunto duly authorized.
|
NEW JERSEY RESOURCES CORPORATION
|
||
|
Date: June 13, 2025
|
||
|
By:
|
/s/ Roberto F. Bel
|
|
|
Roberto F. Bel
|
||
|
Senior Vice President and Chief Financial Officer
|
||
Exhibit 99.1

Investor Meetings June 2025 Investor Presentation

Forward-Looking Statements and Non-GAAP Measures Forward-Looking
Statements This presentation contains forward-looking statements within the meaning of Section 27A of the Securities Act of 1933, as amended, Section 21E of the Securities Exchange Act of 1934, as amended, and the Private Securities
Litigation Reform Act of 1995. NJR cautions readers that the assumptions forming the basis for forward-looking statements include many factors that are beyond NJR’s ability to control or estimate precisely, such as estimates of future market
conditions and the behavior of other market participants. Words such as “anticipates,” “estimates,” “expects,” “projects,” “may,” “will,” “intends,” “plans,” “believes,” “should” and similar expressions may identify forward-looking statements
and such forward-looking statements are made based upon management’s current expectations, assumptions and beliefs as of this date concerning future developments and their potential effect upon NJR. There can be no assurance that future
developments will be in accordance with management’s expectations, assumptions and beliefs or that the effect of future developments on NJR will be those anticipated by management. Forward-looking statements in this earnings presentation
include, but are not limited to, statements regarding NJR’s NFEPS guidance for fiscal 2025, including NFEPS guidance by Segment and EPS, long term growth targets and guidance range, long term annual growth projections and targets, our CIP,
IIP and Savegreen programs, NFEPS expectations from utility operations, Capital Plan expectations, our credit metrics, projections of dividend and financing activities, customer growth at NJNG, future NJR and NJNG capital expenditures,
potential CEV capital projects, project pipeline (under construction, contract or exclusivity) through Fiscal 2029, total expected shareholder return projections, dividend growth, CEV revenue and service projections, our debt repayment
schedule, contributions from Leaf River, Steckman Ridge and Adelphia Gateway, SREC Hedging and long option strategies and Asset Management Agreements, our Energy Efficiency Expansion as approved by the BPU, our current and future base rate
cases, our solar project pipeline and commercial solar growth goals, the outcome or timing of Adelphia's rate case with FERC, emissions reduction strategies and clean energy goals, changing interest rates, and other legal and regulatory
expectations, and statements that include other projections, predictions, expectations or beliefs about future events or results or otherwise are not statements of historical fact. Additional information and factors that could cause actual
results to differ materially from NJR’s expectations are contained in NJR’s filings with the SEC, including NJR’s Annual Reports on Form 10-K and subsequent Quarterly Reports on Form 10-Q, recent Current Reports on Form 8-K, and other SEC
filings, which are available at the SEC’s web site, http://www.sec.gov. Information included in this presentation is representative as of today only and while NJR periodically reassesses material trends and uncertainties affecting NJR's
results of operations and financial condition in connection with its preparation of management's discussion and analysis of results of operations and financial condition contained in its Quarterly and Annual Reports filed with the SEC, NJR
does not, by including this statement, assume any obligation to review or revise any particular forward-looking statement referenced herein in light of new information future events or otherwise, except as required by law. Non-GAAP
Measures Non-GAAP Measures This presentation includes the non-GAAP financial measures NFE/net financial loss, NFE per basic share, financial margin, utility gross margin, adjusted funds from operations and adjusted debt. A reconciliation of
these non-GAAP financial measures to the most directly comparable financial measures calculated and reported in accordance with GAAP can be found below. As an indicator of NJR’s operating performance, these measures should not be considered
an alternative to, or more meaningful than, net income or operating revenues as determined in accordance with GAAP. This information has been provided pursuant to the requirements of SEC Regulation G. NFE and financial margin exclude
unrealized gains or losses on derivative instruments related to NJR’s unregulated subsidiaries and certain realized gains and losses on derivative instruments related to natural gas that has been placed into storage at Energy Services, net of
applicable tax adjustments as described below. Financial margin also differs from gross margin as defined on a GAAP basis as it excludes certain operations and maintenance expense and depreciation and amortization as well as the effects of
derivatives as discussed above. Volatility associated with the change in value of these financial instruments and physical commodity reported on the income statement in the current period. In order to manage its business, NJR views its
results without the impacts of the unrealized gains and losses, and certain realized gains and losses, caused by changes in value of these financial instruments and physical commodity contracts prior to the completion of the planned
transaction because it shows changes in value currently instead of when the planned transaction ultimately is settled. An annual estimated effective tax rate is calculated for NFE purposes and any necessary quarterly tax adjustment is applied
to NJR Energy Services Company. NJNG’s utility gross margin is defined as operating revenues less natural gas purchases, sales tax, and regulatory rider expense. This measure differs from gross margin as presented on a GAAP basis as it
excludes certain operations and maintenance expense and depreciation and amortization. Utility gross margin may also not be comparable to the definition of gross margin used by others in the natural gas distribution business and other
industries. Management believes that utility gross margin provides a meaningful basis for evaluating utility operations since natural gas costs, sales tax and regulatory rider expenses are included in operating revenues and passed through to
customers and, therefore, have no effect on utility gross margin. Adjusted funds from operations is cash flows from operating activities, plus components of working capital, cash paid for interest (net of amounts capitalized), capitalized
interest, the incremental change in SAVEGREEN loans, grants, rebates, and related investments, and operating lease expense. Adjusted debt is total long-term and short-term debt, net of cash and cash equivalents, excluding solar asset
financing obligations but including solar contractually committed payments for sale lease-backs, debt issuance costs, and other Fitch credit metric adjustments. Management uses NFE/net financial loss, utility gross margin, financial margin,
adjusted funds from operations and adjusted debt, as supplemental measures to other GAAP results to provide a more complete understanding of the Company’s performance. Management believes these non-GAAP measures are more reflective of the
Company’s business model, provide transparency to investors and enable period-to-period comparability of financial performance. In providing NFE guidance, management is aware that there could be differences between reported GAAP earnings and
NFE/net financial loss due to matters such as, but not limited to, the positions of our energy-related derivatives. Management is not able to reasonably estimate the aggregate impact or significance of these items on reported earnings and
therefore is not able to provide a reconciliation to the corresponding GAAP equivalent for its operating earnings guidance without unreasonable efforts. In addition, in making forecasts relating to S&T’s Adjusted EBITDA and adjusted funds
from operations and adjusted debt, management is aware that there could be differences between reported GAAP earnings, cash flows from operations and total long-term and short-term debt due to matters such as, but not limited to, the
unpredictability and variability of future earnings, working capital and cash positions. Management is not able to reasonably estimate the aggregate impact or significance of these items on reported GAAP measures and therefore is not able to
provide a reconciliation to the corresponding GAAP equivalent for such forecasts without unreasonable efforts. NFE/net financial loss, utility gross margin and financial margin are discussed more fully in Item 7 of our Report on Form 10-K
and, we have provided presentations of the most directly comparable GAAP financial measure and a reconciliation of our non-GAAP financial measures, NFE/net financial loss, utility gross margin, financial margin, adjusted funds from operations
and adjusted debt, to the most directly comparable GAAP financial measures, in the appendix to this presentation. This information has been provided pursuant to the requirements of SEC Regulation G.

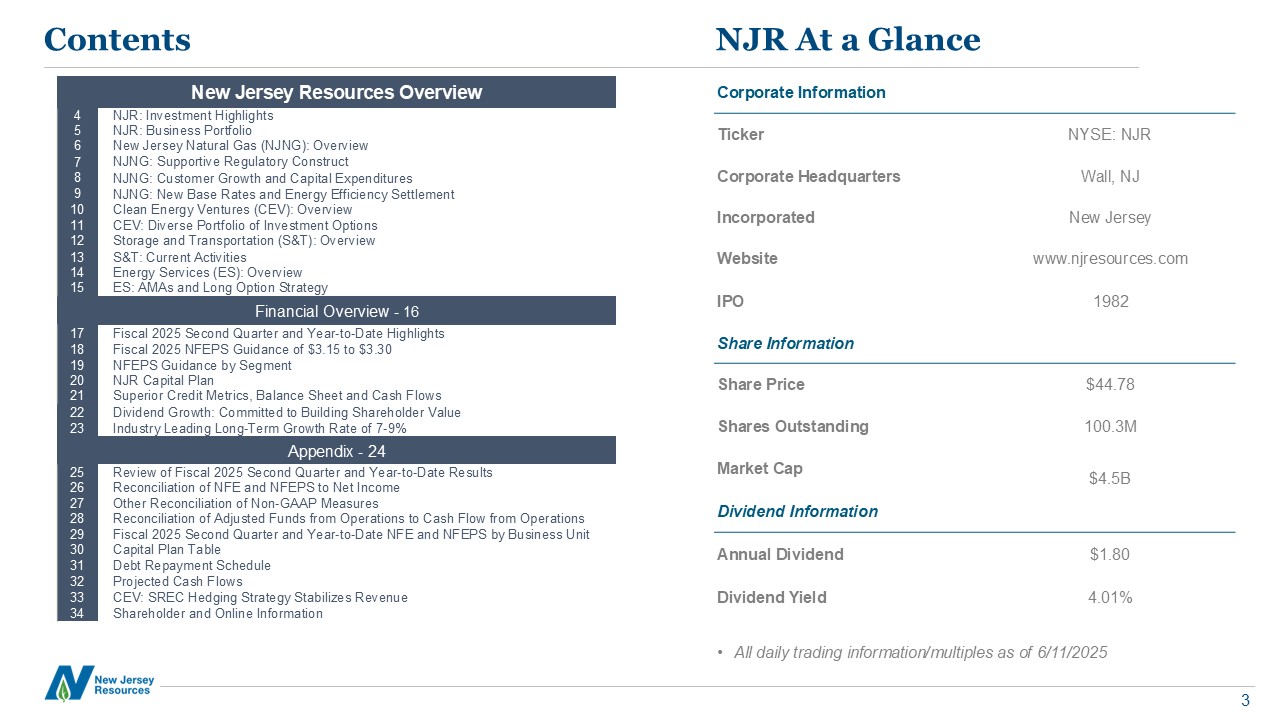
Contents NJR At a Glance New Jersey Resources Overview 4 NJR: Investment
Highlights 5 NJR: Business Portfolio 6 New Jersey Natural Gas (NJNG): Overview 7 NJNG: Supportive Regulatory Construct 8 NJNG: Customer Growth and Capital Expenditures 9 NJNG: New Base Rates and Energy Efficiency
Settlement 10 Clean Energy Ventures (CEV): Overview 11 CEV: Diverse Portfolio of Investment Options 12 Storage and Transportation (S&T): Overview 13 S&T: Current Activities 14 Energy Services (ES): Overview 15 ES: AMAs
and Long Option Strategy Financial Overview - 16 17 Fiscal 2025 Second Quarter and Year-to-Date Highlights 18 Fiscal 2025 NFEPS Guidance of $3.15 to $3.30 19 NFEPS Guidance by Segment 20 NJR Capital Plan 21 Superior Credit Metrics,
Balance Sheet and Cash Flows 22 Dividend Growth: Committed to Building Shareholder Value 23 Industry Leading Long-Term Growth Rate of 7-9% Appendix - 24 25 Review of Fiscal 2025 Second Quarter and Year-to-Date
Results 26 Reconciliation of NFE and NFEPS to Net Income 27 Other Reconciliation of Non-GAAP Measures 28 Reconciliation of Adjusted Funds from Operations to Cash Flow from Operations 29 Fiscal 2025 Second Quarter and Year-to-Date NFE
and NFEPS by Business Unit 30 Capital Plan Table 31 Debt Repayment Schedule 32 Projected Cash Flows 33 CEV: SREC Hedging Strategy Stabilizes Revenue 34 Shareholder and Online Information Corporate Information Ticker NYSE:
NJR Corporate Headquarters Wall, NJ Incorporated New Jersey Website www.njresources.com IPO 1982 Share Information Share Price $44.78 Shares Outstanding 100.3M Market Cap $4.5B Dividend Information Annual
Dividend $1.80 Dividend Yield 4.01% All daily trading information/multiples as of 6/11/2025

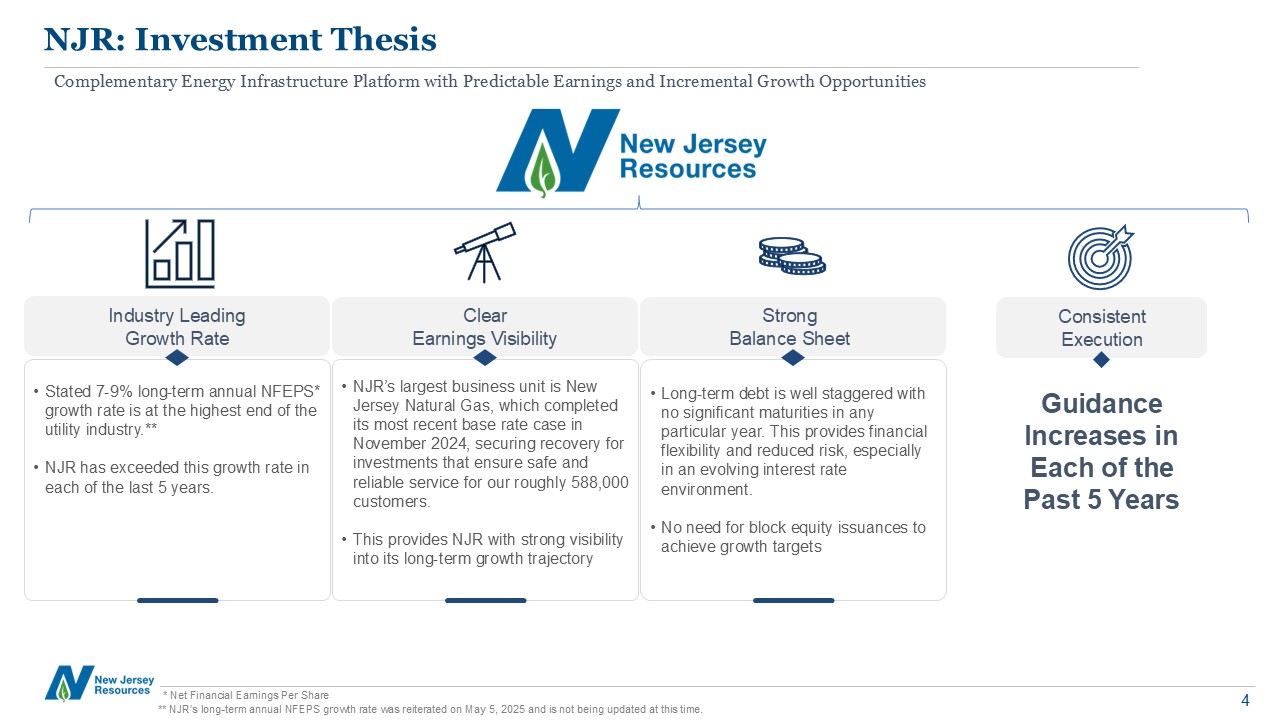
NJR: Investment Thesis Complementary Energy Infrastructure Platform with
Predictable Earnings and Incremental Growth Opportunities * Net Financial Earnings Per Share Consistent Execution Guidance Increases in Each of the Past 5 Years Industry Leading Growth Rate Stated 7-9% long-term annual NFEPS*
growth rate is at the highest end of the utility industry.** NJR has exceeded this growth rate in each of the last 5 years. Clear Earnings Visibility NJR’s largest business unit is New Jersey Natural Gas, which completed its most recent
base rate case in November 2024, securing recovery for investments that ensure safe and reliable service for our roughly 588,000 customers. This provides NJR with strong visibility into its long-term growth trajectory Strong Balance
Sheet Long-term debt is well staggered with no significant maturities in any particular year. This provides financial flexibility and reduced risk, especially in an evolving interest rate environment. No need for block equity issuances to
achieve growth targets ** NJR’s long-term annual NFEPS growth rate was reiterated on May 5, 2025 and is not being updated at this time.

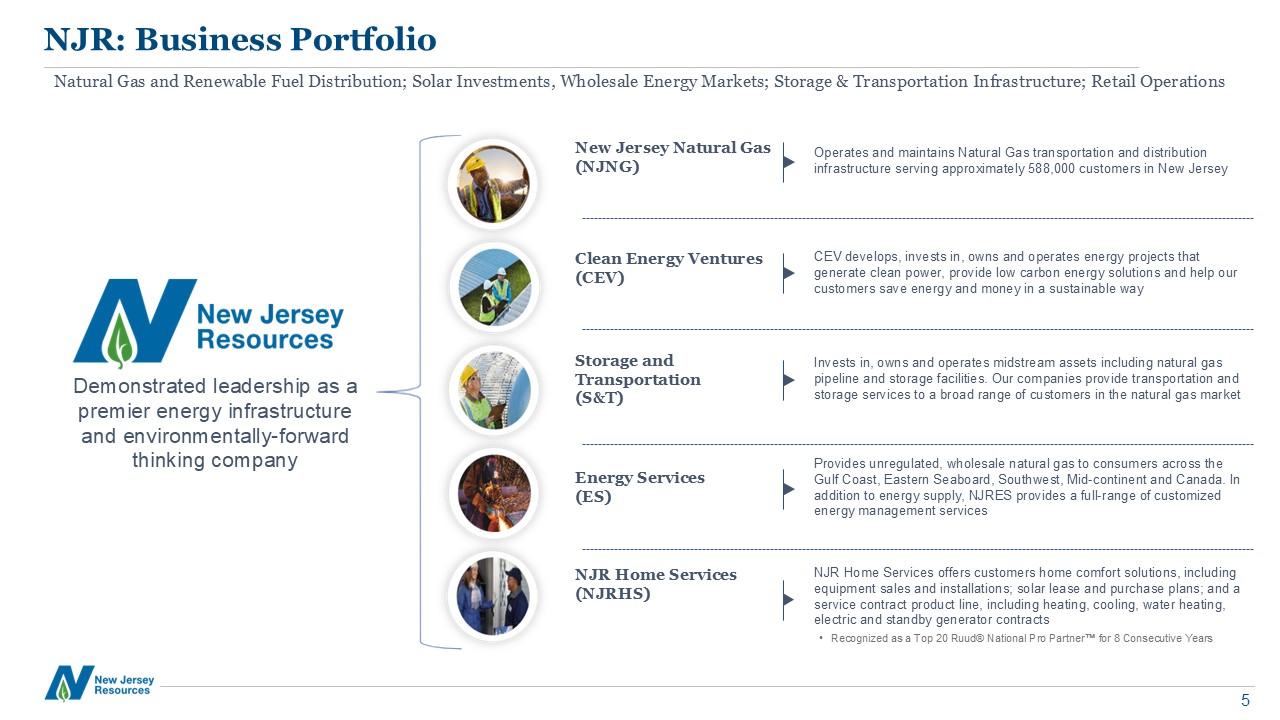
NJR Home Services offers customers home comfort solutions, including equipment
sales and installations; solar lease and purchase plans; and a service contract product line, including heating, cooling, water heating, electric and standby generator contracts Recognized as a Top 20 Ruud® National Pro Partner™ for 8
Consecutive Years NJR: Business Portfolio Natural Gas and Renewable Fuel Distribution; Solar Investments, Wholesale Energy Markets; Storage & Transportation Infrastructure; Retail Operations Operates and maintains Natural Gas
transportation and distribution infrastructure serving approximately 588,000 customers in New Jersey New Jersey Natural Gas (NJNG) Clean Energy Ventures (CEV) Storage and Transportation (S&T) Energy Services (ES) NJR Home
Services (NJRHS) CEV develops, invests in, owns and operates energy projects that generate clean power, provide low carbon energy solutions and help our customers save energy and money in a sustainable way Invests in, owns and operates
midstream assets including natural gas pipeline and storage facilities. Our companies provide transportation and storage services to a broad range of customers in the natural gas market Provides unregulated, wholesale natural gas to
consumers across the Gulf Coast, Eastern Seaboard, Southwest, Mid-continent and Canada. In addition to energy supply, NJRES provides a full-range of customized energy management services Demonstrated leadership as a premier energy
infrastructure and environmentally-forward thinking company

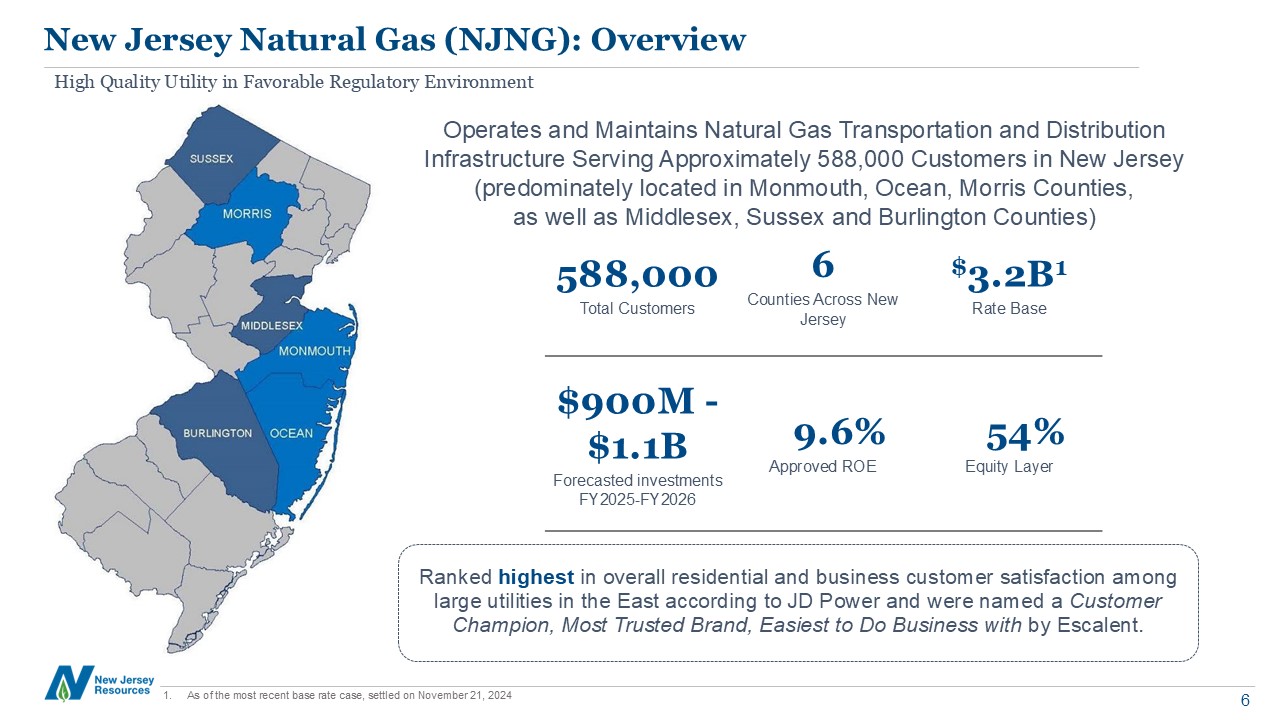
New Jersey Natural Gas (NJNG): Overview Operates and Maintains Natural Gas
Transportation and Distribution Infrastructure Serving Approximately 588,000 Customers in New Jersey (predominately located in Monmouth, Ocean, Morris Counties, as well as Middlesex, Sussex and Burlington Counties) 588,000 Total
Customers 6 Counties Across New Jersey $3.2B1 Rate Base $900M - $1.1B Forecasted investments FY2025-FY2026 9.6% Approved ROE 54% Equity Layer Ranked highest in overall residential and business customer satisfaction among large
utilities in the East according to JD Power and were named a Customer Champion, Most Trusted Brand, Easiest to Do Business with by Escalent. As of the most recent base rate case, settled on November 21, 2024 High Quality Utility in
Favorable Regulatory Environment

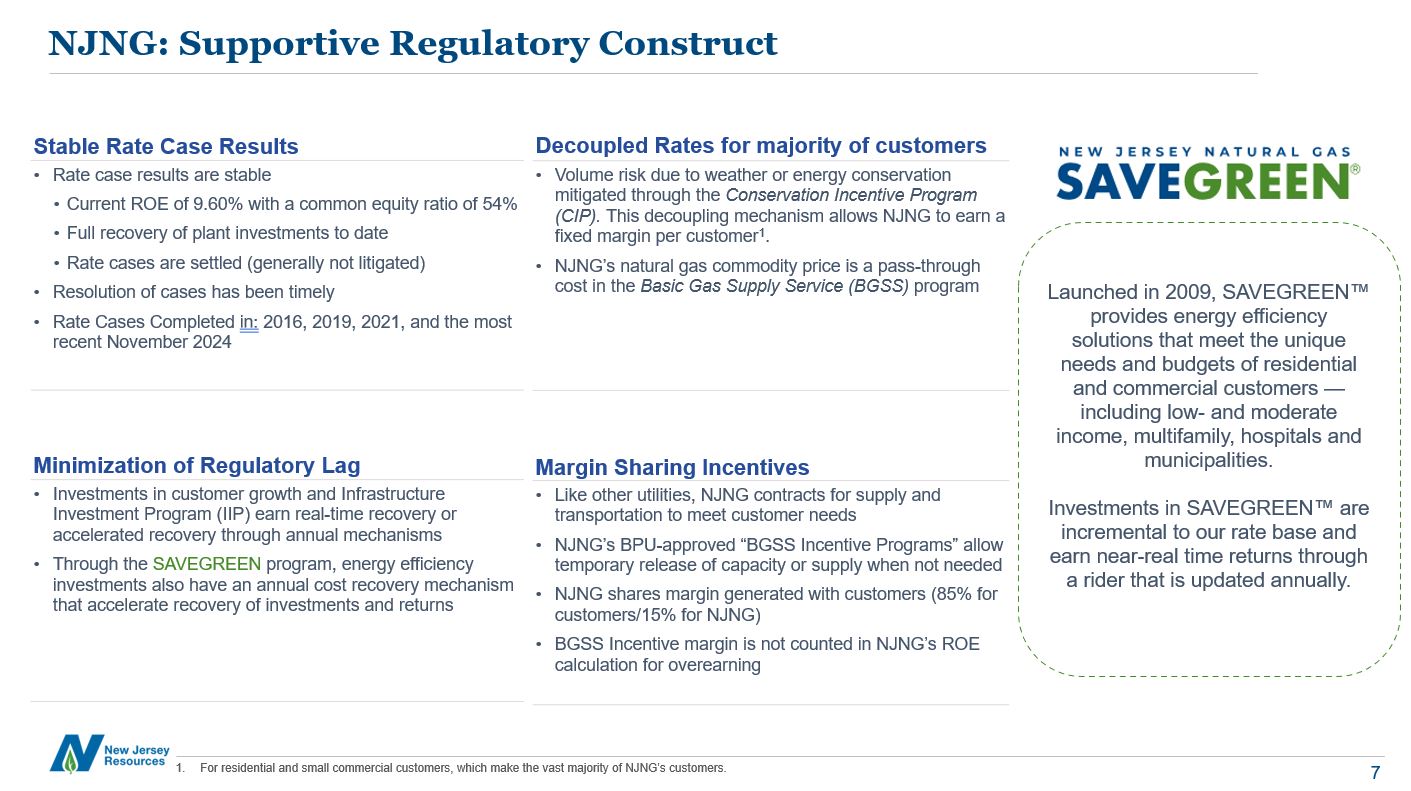
Launched in 2009, SAVEGREEN™ provides energy efficiency solutions that meet the
unique needs and budgets of residential and commercial customers — including low- and moderate income, multifamily, hospitals and municipalities. Investments in SAVEGREEN™ are incremental to our rate base and earn near-real time returns
through a rider that is updated annually. NJNG: Supportive Regulatory Construct 7 Stable Rate Case Results Rate case results are stable Current ROE of 9.60% with a common equity ratio of 54% Full recovery of plant investments to
date Rate cases are settled (generally not litigated) Resolution of cases has been timely Rate Cases Completed in: 2016, 2019, 2021, and the most recent November 2024 Decoupled Rates for majority of customers Volume risk due to weather
or energy conservation mitigated through the Conservation Incentive Program (CIP). This decoupling mechanism allows NJNG to earn a fix margin per customer1. NJNG’s natural gas commodity price is a pass-through cost the Basic Gas Supply
Service (BGSS) program Minimization of Regulatory Lag Investments in customer growth and Infrastructure Investment Program (IIP) earn real-time recovery or accelerated recovery through annual mechanisms Through the SAVEGREEN program,
energy efficiency investments also have an annual cost recovery mechanism that accelerate recovery of investments and returns Margin Sharing Incentives Like other utilities, NJNG contracts for supply and transportation to meet customer
needs NJNG’s BPU-approved “BGSS Incentive Programs” allow temporary release of capacity or supply when not needed NJNG shares margin generated with customers (85% for customers/15% for NJNG) BGSS Incentive margin is not counted in NJNG’s
ROE calculation for overearning For residential and small commercial customers, which make the vast majority of NJNG’s customers.

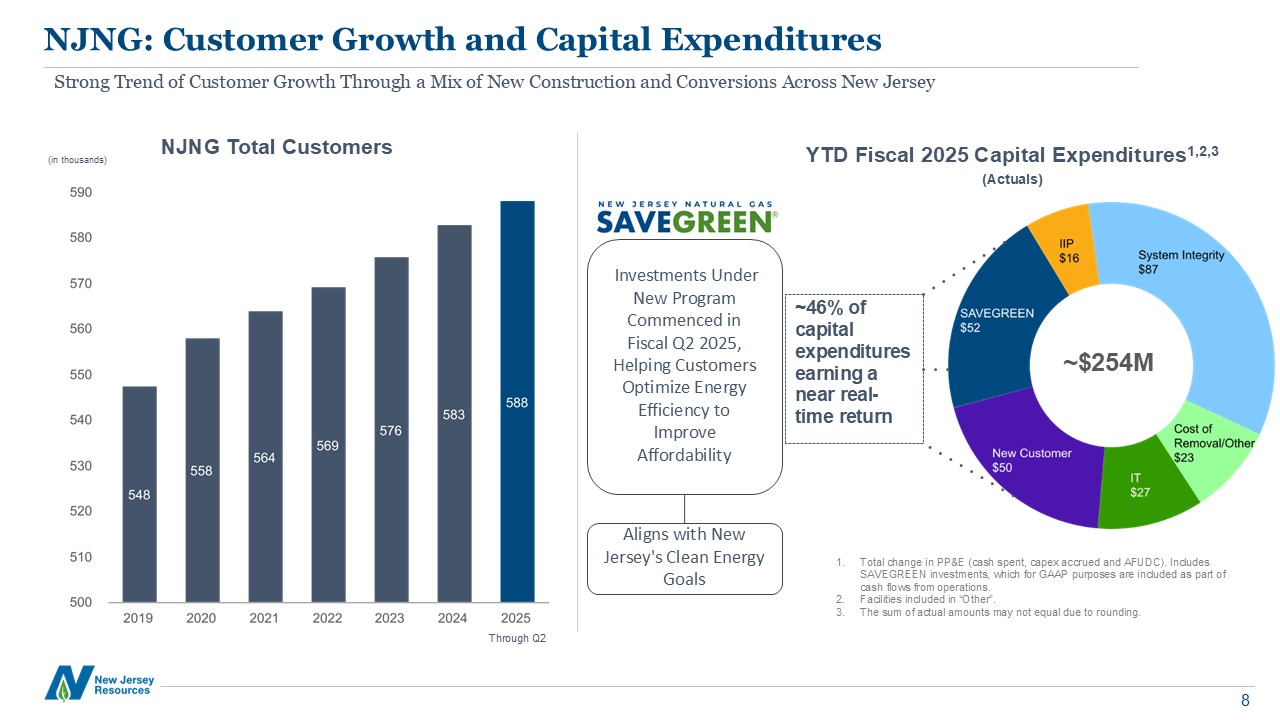
Investments Under New Program Commenced in Fiscal Q2 2025, Helping Customers
Optimize Energy Efficiency to Improve Affordability NJNG: Customer Growth and Capital Expenditures ~46% of capital expenditures earning a near real-time return NJNG Total Customers YTD Fiscal 2025 Capital
Expenditures1,2,3 (Actuals) ~$254M Strong Trend of Customer Growth Through a Mix of New Construction and Conversions Across New Jersey (in thousands) Total change in PP&E (cash spent, capex accrued and AFUDC). Includes SAVEGREEN
investments, which for GAAP purposes are included as part of cash flows from operations. Facilities included in “Other”. The sum of actual amounts may not equal due to rounding. Through Q2 Aligns with New Jersey's Clean Energy Goals

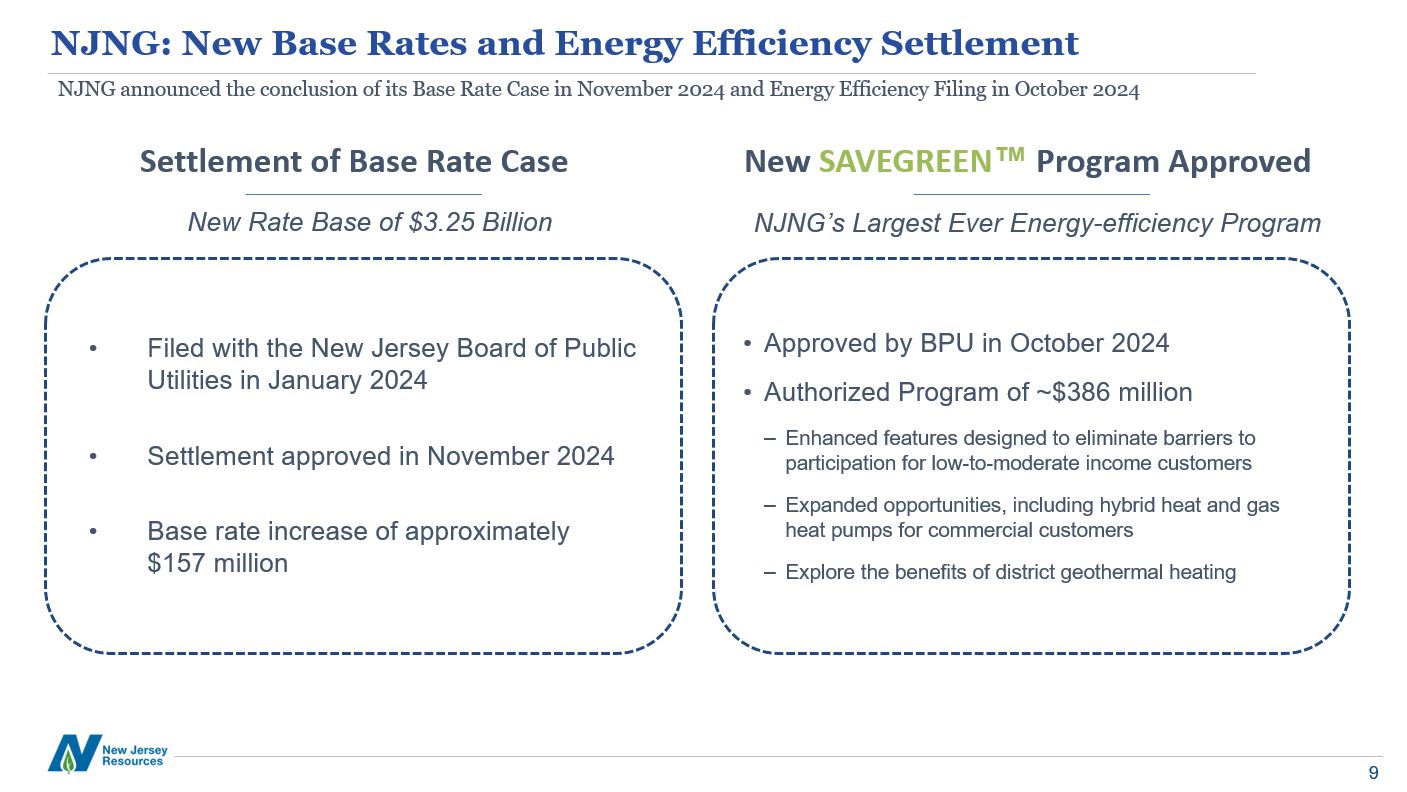
NJNG: New Base Rates and Energy Efficiency Settlement NJNG announced the
conclusion of its Base Rate Case in November 2024 and Energy Efficiency in October 2024 New SAVEGREEN™ Program Approved Settlement of Base Rate Case Filed with the New Jersey Board of Public Utilities in January 2024 Settlement approved
in November 2024 Base rate increase of approximately $157 million Approved by BPU in October 2024 Authorized Program of ~$386 million Enhanced features designed to eliminate barriers to participation for low-to-moderate income
customers Expanded opportunities, including hybrid heat and gas heat pumps for commercial customers Explore the benefits of district geothermal heating New Rate Base of $3.25 Billion NJNG’s Largest Ever Energy-efficiency Program

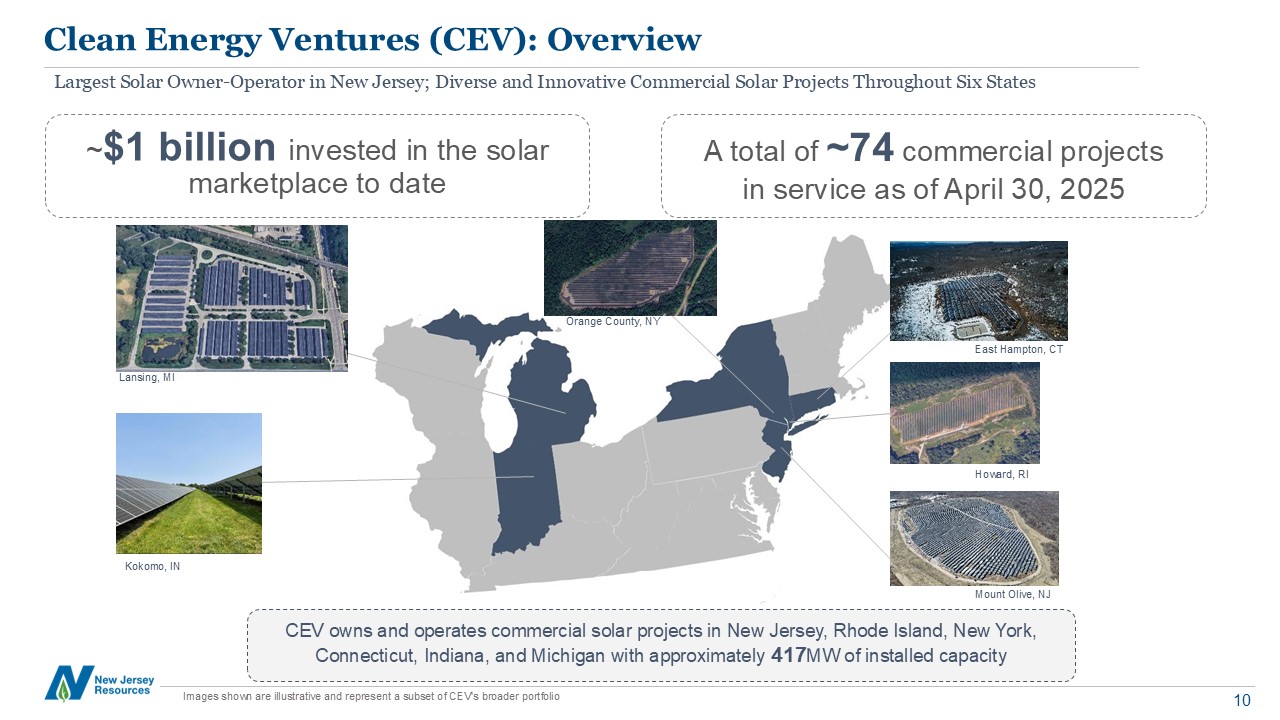
Clean Energy Ventures (CEV): Overview Largest Solar Owner-Operator in New
Jersey; Diverse and Innovative Commercial Solar Projects Throughout Six States CEV owns and operates commercial solar projects in New Jersey, Rhode Island, New York, Connecticut, Indiana, and Michigan with approximately 417MW of installed
capacity ~$1 billion invested in the solar marketplace to date A total of ~74 commercial projects in service as of April 30, 2025 Lansing, MI Orange County, NY Mount Olive, NJ East Hampton, CT Howard, RI Images shown are
illustrative and represent a subset of CEV's broader portfolio Kokomo, IN

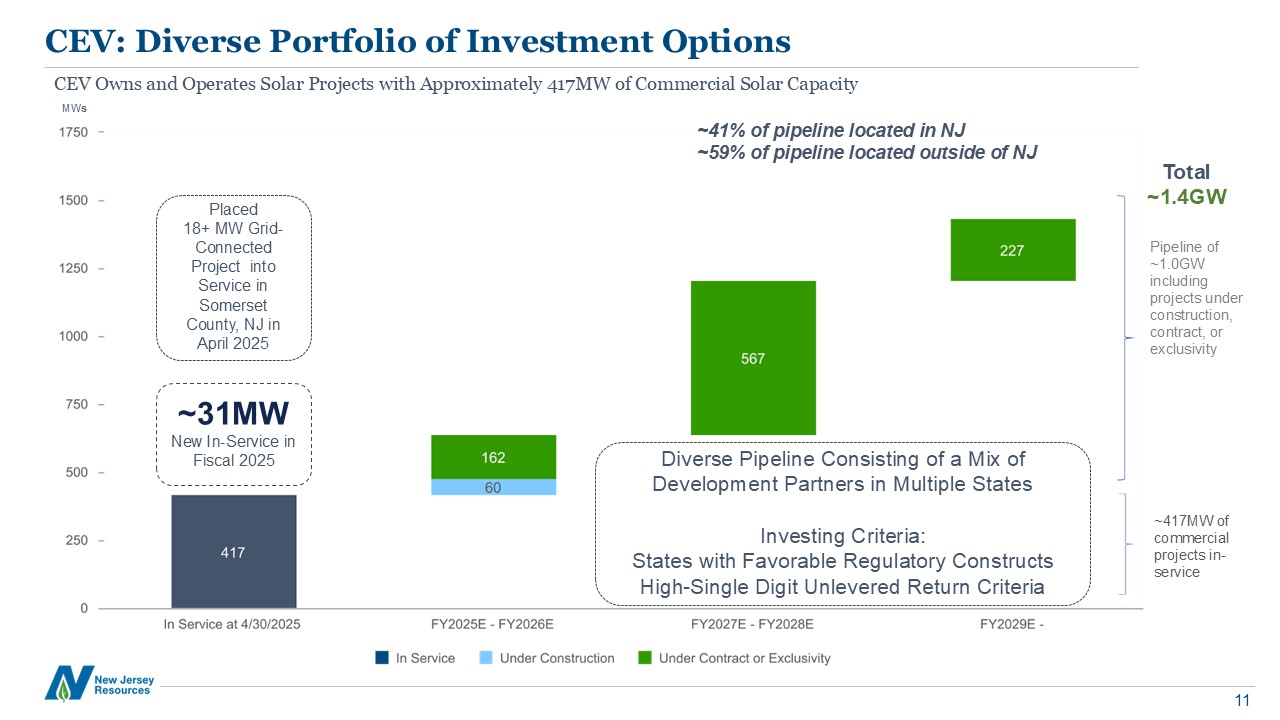
CEV: Diverse Portfolio of Investment Options CEV Owns and Operates Solar
Projects with Approximately 417MW of Commercial Solar Capacity Total ~1.4GW MWs Pipeline of ~1.0GW including projects under construction, contract, or exclusivity ~417MW of commercial projects in-service ~41% of pipeline located in
NJ ~59% of pipeline located outside of NJ ~31MW New In-Service in Fiscal 2025 Placed 18+ MW Grid-Connected Project into Service in Somerset County, NJ in April 2025 Diverse Pipeline Consisting of a Mix of Development Partners in
Multiple States Investing Criteria: States with Favorable Regulatory Constructs High-Single Digit Unlevered Return Criteria

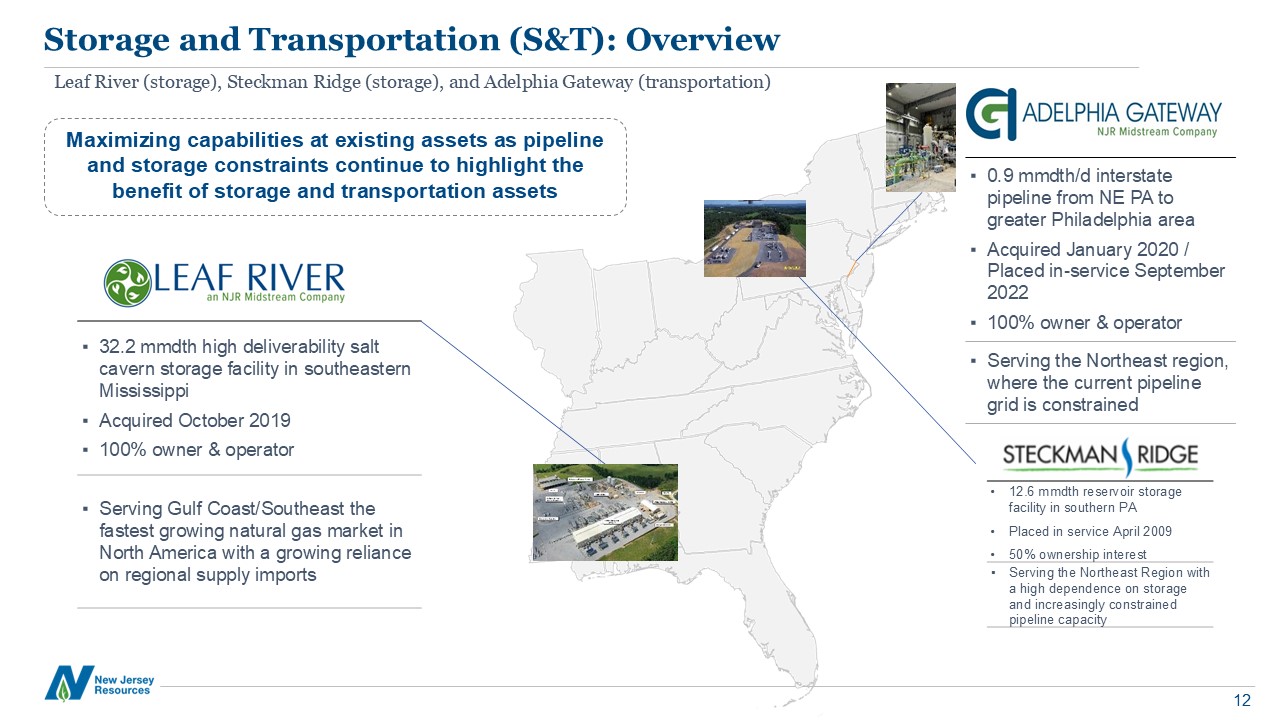
Storage and Transportation (S&T): Overview Leaf River (storage), Steckman
Ridge (storage), and Adelphia Gateway (transportation) 32.2 mmdth high deliverability salt cavern storage facility in southeastern Mississippi Acquired October 2019 100% owner & operator Serving Gulf Coast/Southeast the fastest
growing natural gas market in North America with a growing reliance on regional supply imports 12.6 mmdth reservoir storage facility in southern PA Placed in service April 2009 50% ownership interest Serving the Northeast Region with a
high dependence on storage and increasingly constrained pipeline capacity 0.9 mmdth/d interstate pipeline from NE PA to greater Philadelphia area Acquired January 2020 / Placed in-service September 2022 100% owner & operator Serving
the Northeast region, where the current pipeline grid is constrained Maximizing capabilities at existing assets as pipeline and storage constraints continue to highlight the benefit of storage and transportation assets

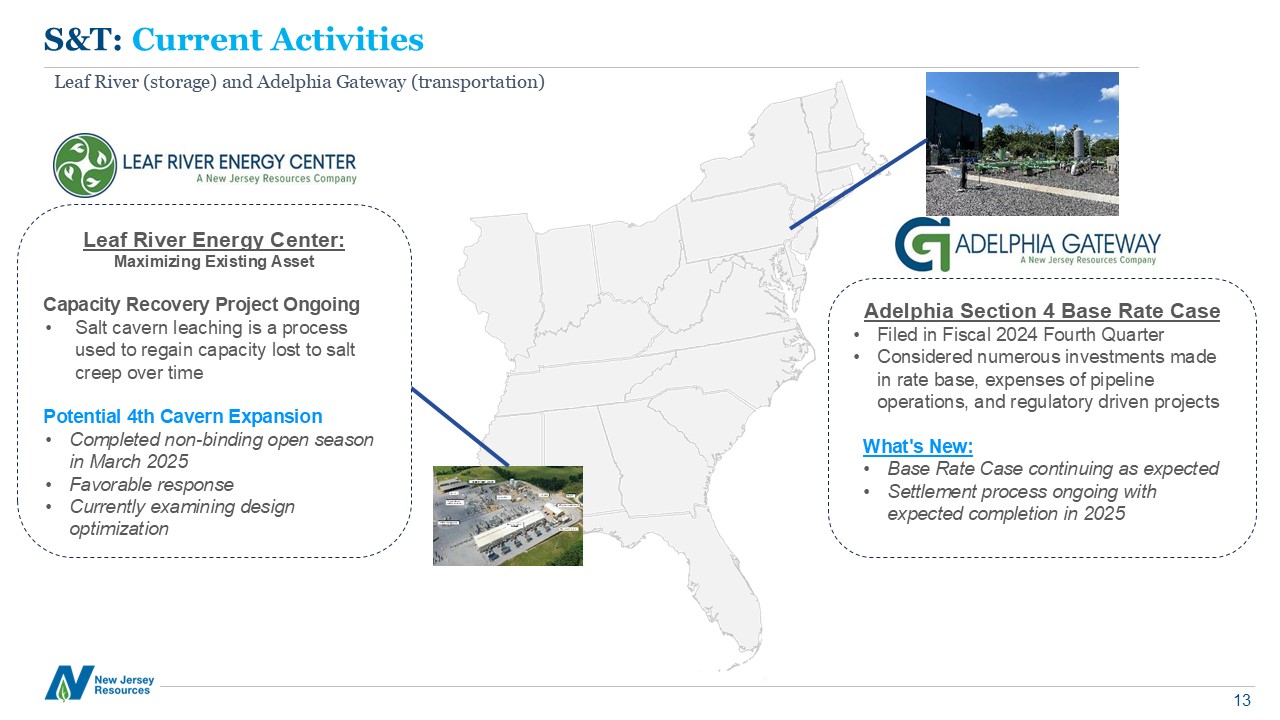
S&T: Current Activities Leaf River (storage) and Adelphia Gateway
(transportation) Adelphia Section 4 Base Rate Case Filed in Fiscal 2024 Fourth Quarter Considered numerous investments made in rate base, expenses of pipeline operations, and regulatory driven projects What's New: Base Rate Case
continuing as expected Settlement process ongoing with expected completion in 2025 Leaf River Energy Center: Maximizing Existing Asset Capacity Recovery Project Ongoing Salt cavern leaching is a process used to regain capacity lost
to salt creep over time Potential 4th Cavern Expansion Completed non-binding open season in March 2025 Favorable response Currently examining design optimization

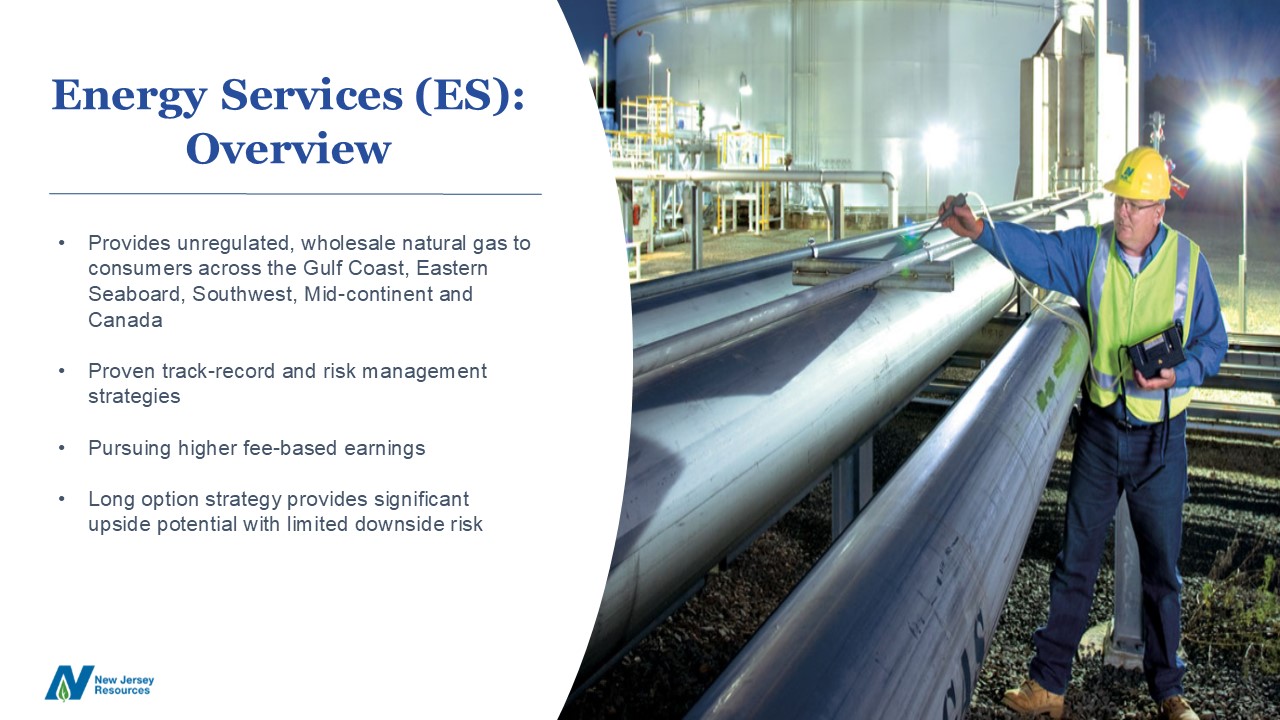
14 Energy Services (ES): Overview Provides unregulated, wholesale natural gas
to consumers across the Gulf Coast, Eastern Seaboard, Southwest, Mid-continent and Canada Proven track-record and risk management strategies Pursuing higher fee-based earnings Long option strategy provides significant upside potential with
limited downside risk

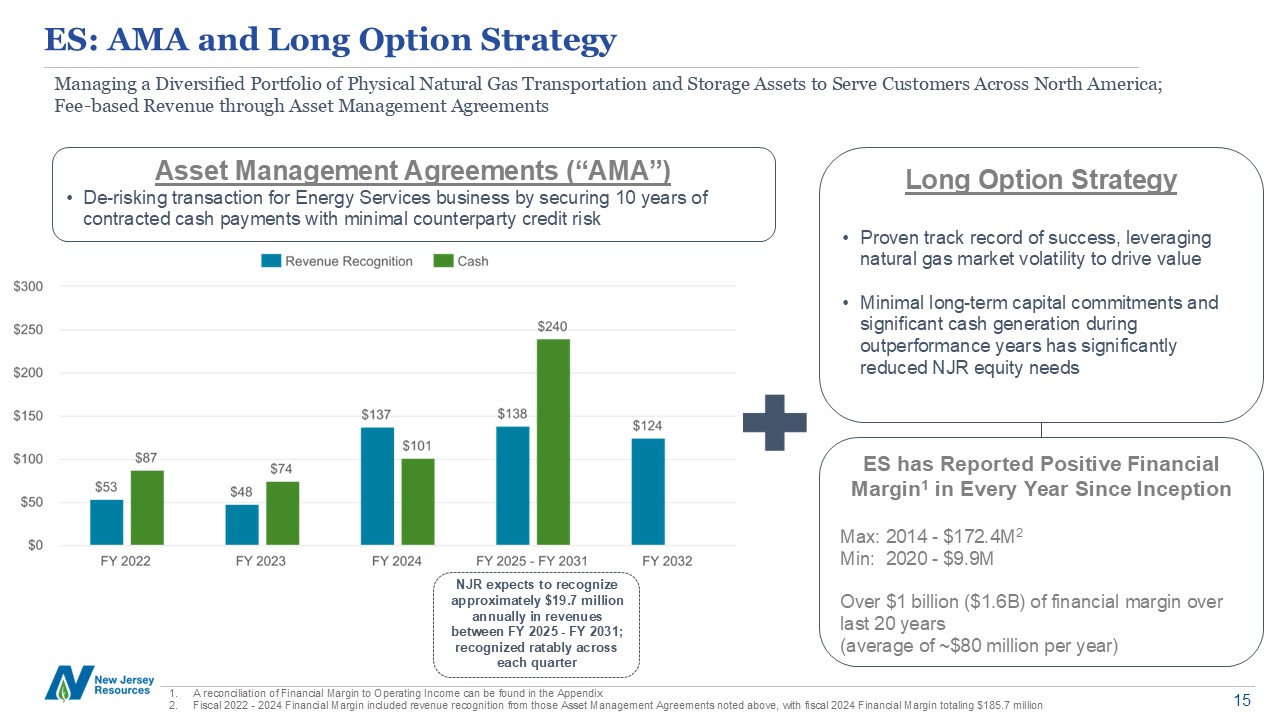
ES: AMA and Long Option Strategy Managing a Diversified Portfolio of Physical
Natural Gas Transportation and Storage Assets to Serve Customers Across North America; Fee-based Revenue through Asset Management Agreements Asset Management Agreements (“AMA”) De-risking transaction for Energy Services business by
securing 10 years of contracted cash payments with minimal counterparty credit risk Long Option Strategy Proven track record of success, leveraging natural gas market volatility to drive value Minimal long-term capital commitments and
significant cash generation during outperformance years has significantly reduced NJR equity needs NJR expects to recognize approximately $19.7 million annually in revenues between FY 2025 - FY 2031; recognized ratably across each
quarter ES has Reported Positive Financial Margin1 in Every Year Since Inception Max: 2014 - $172.4M2 Min: 2020 - $9.9M Over $1 billion ($1.6B) of financial margin over last 20 years (average of ~$80 million per year) A reconciliation
of Financial Margin to Operating Income can be found in the Appendix Fiscal 2022 - 2024 Financial Margin included revenue recognition from those Asset Management Agreements noted above, with fiscal 2024 Financial Margin totaling $185.7
million

16 16 Financial Review 17 Fiscal 2025 Second Quarter and Year-to-Date
Highlights 18 Fiscal 2025 NFEPS Guidance of $3.15 to $3.30 19 NFEPS Guidance by Segment 20 NJR Capital Plan 21 Superior Credit Metrics, Balance Sheet and Cash Flows 22 Dividend Growth: Committed to Building Shareholder
Value 23 Industry Leading Long-Term Growth Rate of 7-9%

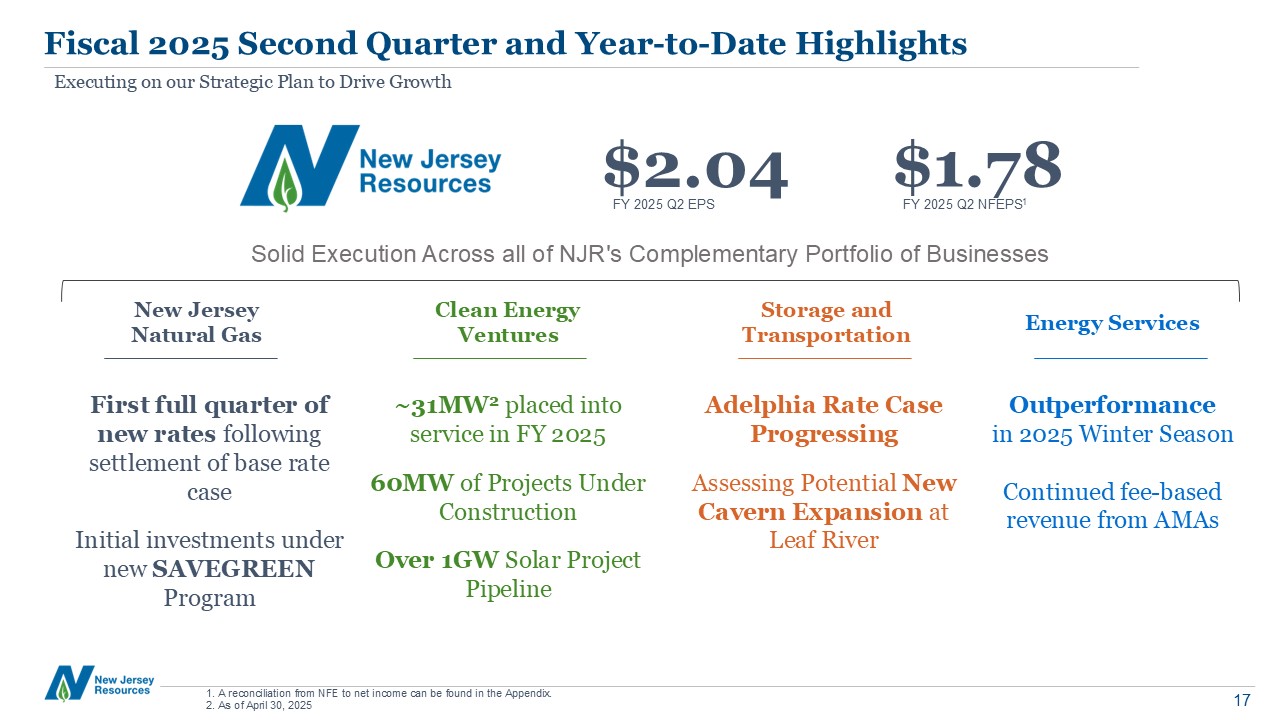
Fiscal 2025 Second Quarter and Year-to-Date Highlights Executing on our
Strategic Plan to Drive Growth Energy Services New Jersey Natural Gas Clean Energy Ventures Storage and Transportation Adelphia Rate Case Progressing Assessing Potential New Cavern Expansion at Leaf River FY 2025 Q2 EPS FY 2025 Q2
NFEPS1 Outperformance in 2025 Winter Season Continued fee-based revenue from AMAs ~31MW2 placed into service in FY 2025 60MW of Projects Under Construction Over 1GW Solar Project Pipeline First full quarter of new rates following
settlement of base rate case Initial investments under new SAVEGREEN Program 1. A reconciliation from NFE to net income can be found in the Appendix. 2. As of April 30, 2025 Solid Execution Across all of NJR's Complementary Portfolio of
Businesses $1.78 $2.04

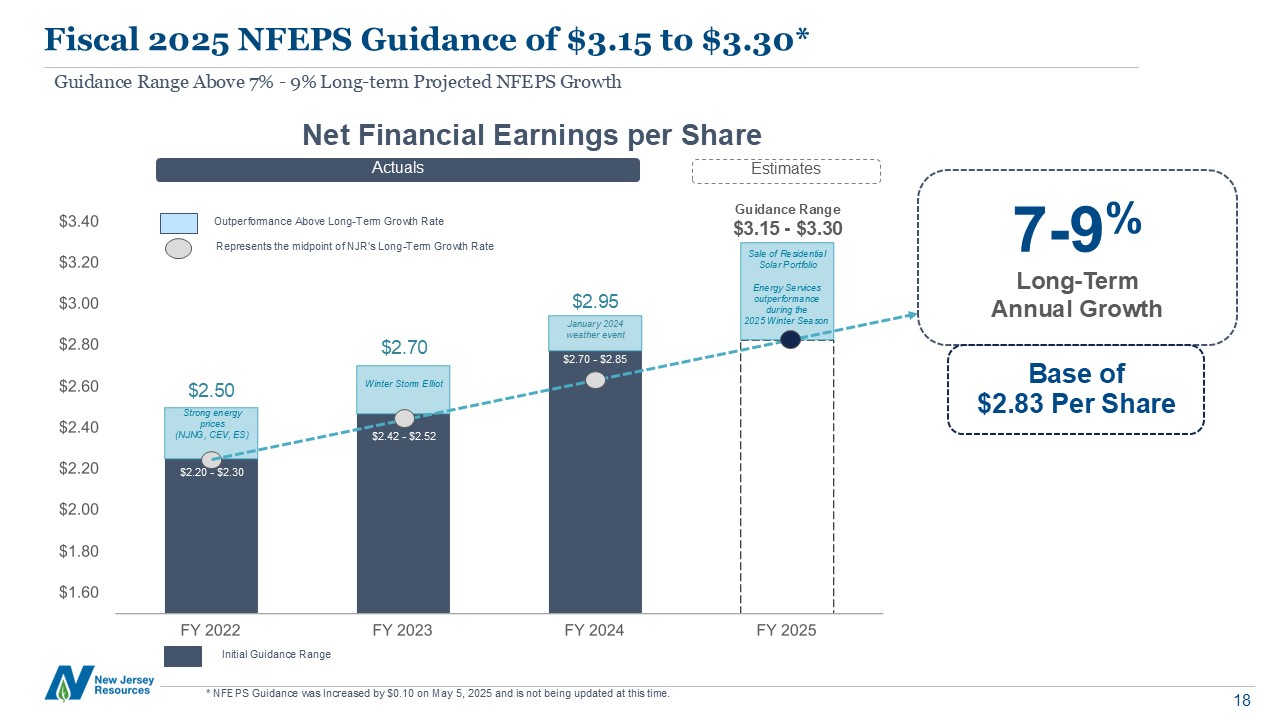
Fiscal 2025 NFEPS Guidance of $3.15 to $3.30* Net Financial Earnings per
Share Guidance Range Above 7% - 9% Long-term Projected NFEPS Growth Guidance Range $3.15 - $3.30 7-9% Long-Term Annual Growth $2.50 $2.70 Outperformance Above Long-Term Growth Rate $2.20 - $2.30 $2.42 - $2.52 Strong energy
prices(NJNG, CEV, ES) Winter Storm Elliot January 2024 weather event Initial Guidance Range Represents the midpoint of NJR's Long-Term Growth Rate $2.70 - $2.85 Base of $2.83 Per Share $2.95 Sale of Residential Solar
Portfolio Energy Services outperformance during the 2025 Winter Season Actuals Estimates * NFEPS Guidance was Increased by $0.10 on May 5, 2025 and is not being updated at this time.

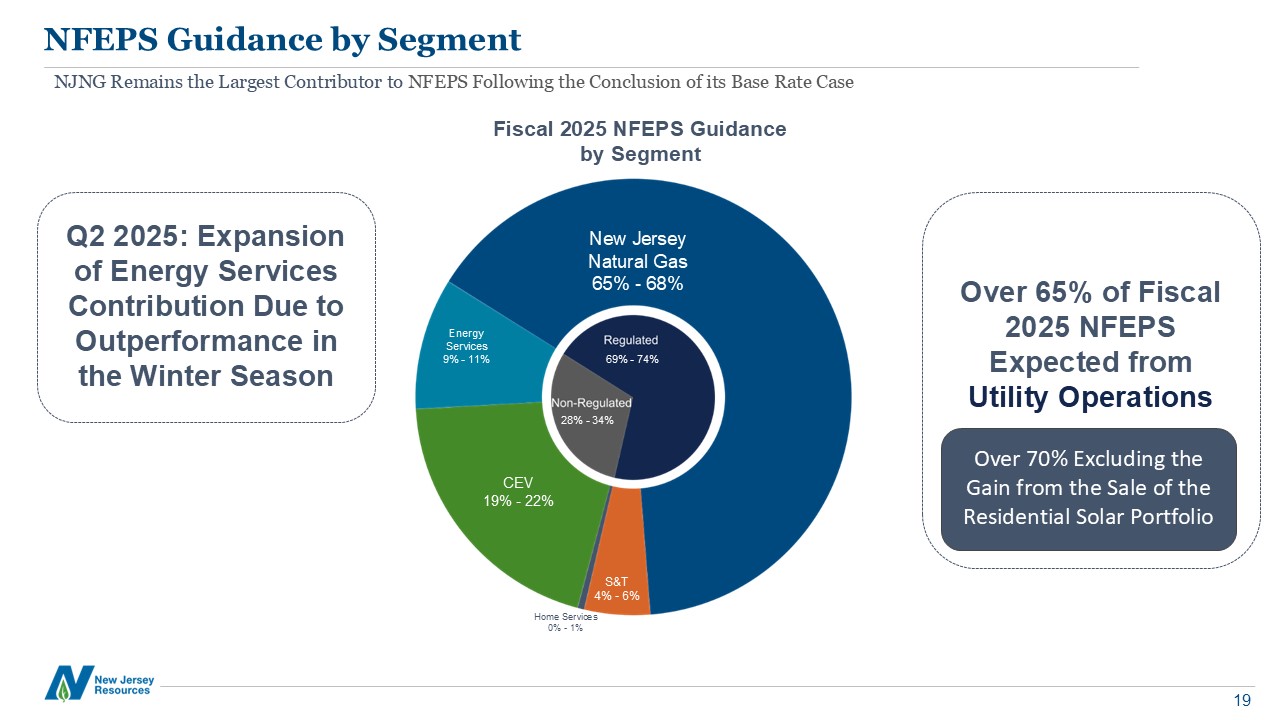
NFEPS Guidance by Segment NJNG Remains the Largest Contributor to NFEPS
Following the Conclusion of its Base Rate Case Fiscal 2025 NFEPS Guidance by Segment New Jersey Natural Gas 65% - 68% Energy Services 9% - 11% Home Services 0% - 1% S&T 4% - 6% CEV 19% - 22% 69% - 74% 28% - 34% Q2 2025:
Expansion of Energy Services Contribution Due to Outperformance in the Winter Season Over 65% of Fiscal 2025 NFEPS Expected from Utility Operations Over 70% Excluding the Gain from the Sale of the Residential Solar Portfolio

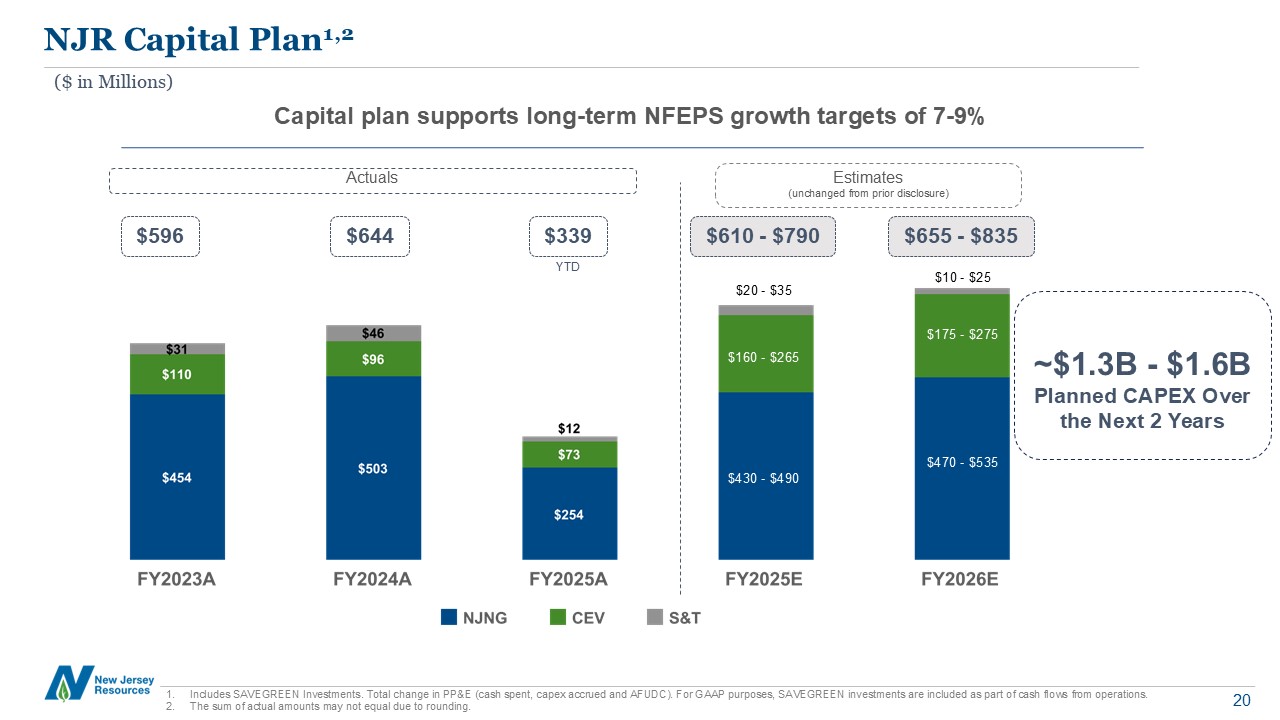
NJR Capital Plan1,2 Includes SAVEGREEN Investments. Total change in PP&E
(cash spent, capex accrued and AFUDC). For GAAP purposes, SAVEGREEN investments are included as part of cash flows from operations. The sum of actual amounts may not equal due to rounding. $596 $644 $610 - $790 $655 - $835 ($ in
Millions) Capital plan supports long-term NFEPS growth targets of 7-9% $430 - $490 $470 - $535 $160 - $265 $20 - $35 $10 - $25 $175 - $275 Actuals Estimates (unchanged from prior disclosure) $339 ~$1.3B - $1.6B Planned CAPEX
Over the Next 2 Years YTD

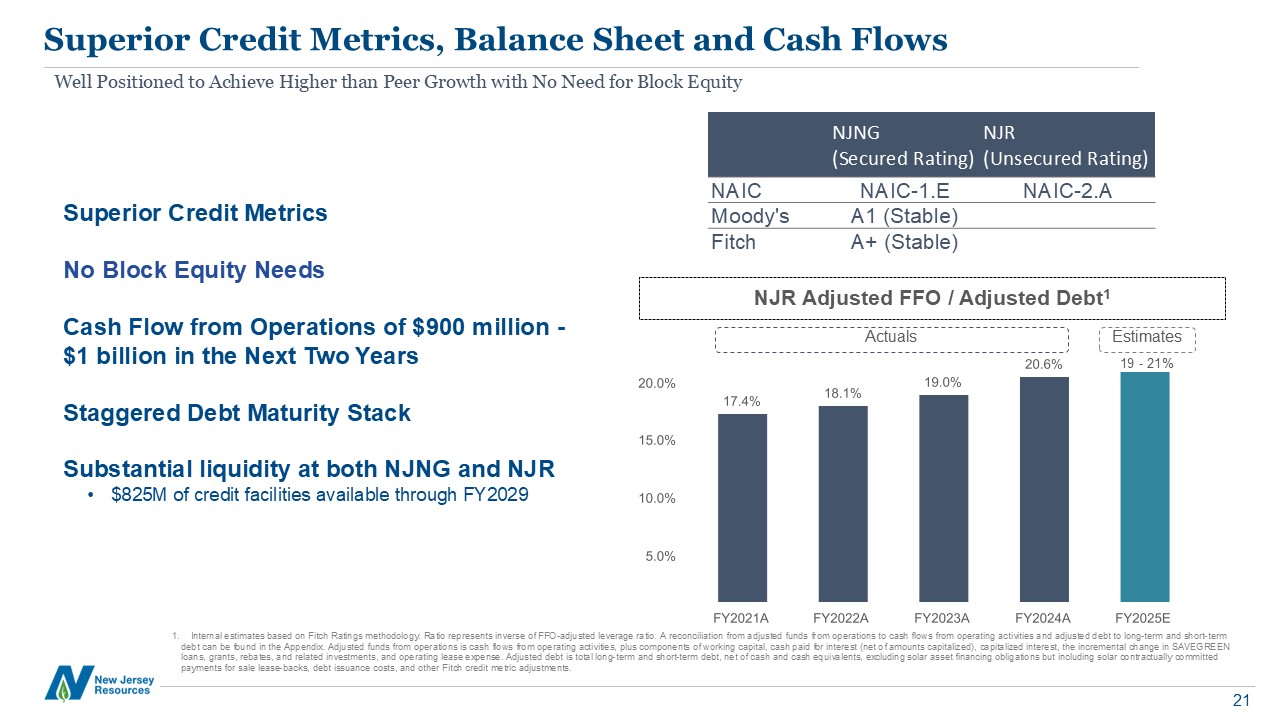
Well Positioned to Achieve Higher than Peer Growth with No Need for Block
Equity Superior Credit Metrics, Balance Sheet and Cash Flows 1. Internal estimates based on Fitch Ratings methodology. Ratio represents inverse of FFO-adjusted leverage ratio. A reconciliation from adjusted funds from operations to cash
flows from operating activities and adjusted debt to long-term and short-term debt can be found in the Appendix. Adjusted funds from operations is cash flows from operating activities, plus components of working capital, cash paid for
interest (net of amounts capitalized), capitalized interest, the incremental change in SAVEGREEN loans, grants, rebates, and related investments, and operating lease expense. Adjusted debt is total long-term and short-term debt, net of cash
and cash equivalents, excluding solar asset financing obligations but including solar contractually committed payments for sale lease-backs, debt issuance costs, and other Fitch credit metric adjustments. NJR Adjusted FFO / Adjusted
Debt1 NJNG (Secured Rating) NJR (Unsecured Rating) NAIC NAIC-1.E NAIC-2.A Moody's A1 (Stable) Fitch A+ (Stable) Actuals Estimates Superior Credit Metrics No Block Equity Needs Cash Flow from Operations of $900 million - $1
billion in the Next Two Years Staggered Debt Maturity Stack Substantial liquidity at both NJNG and NJR $825M of credit facilities available through FY2029 19 - 21%

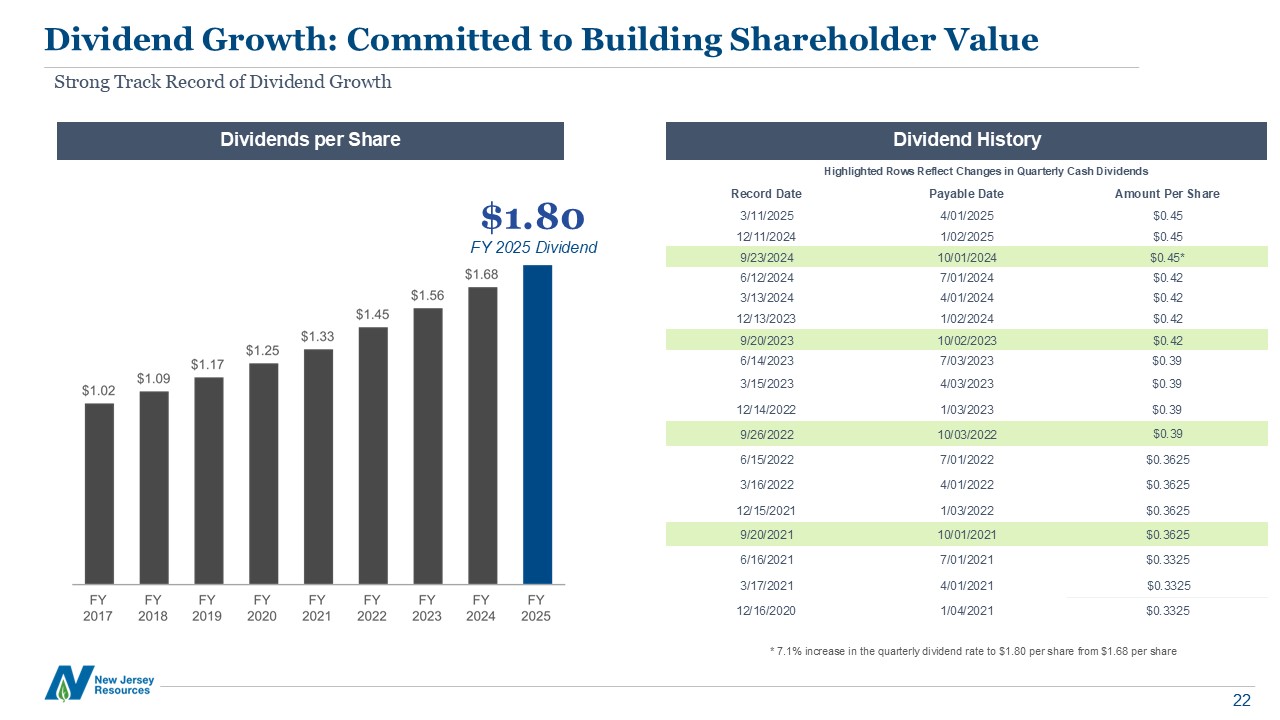
Dividend Growth: Committed to Building Shareholder Value Strong Track Record of
Dividend Growth $1.80 FY 2025 Dividend Dividend History Dividends per Share Record Date Payable Date Amount Per
Share 3/11/2025 4/01/2025 $0.45 12/11/2024 1/02/2025 $0.45 9/23/2024 10/01/2024 $0.45* 6/12/2024 7/01/2024 $0.42 3/13/2024 4/01/2024 $0.42 12/13/2023 1/02/2024 $0.42 9/20/2023 10/02/2023 $0.42 6/14/2023 7/03/2023 $0.39 3/15/2023 4/03/2023 $0.39 12/14/2022 1/03/2023 $0.39 9/26/2022 10/03/2022 $0.39 6/15/2022 7/01/2022 $0.3625 3/16/2022 4/01/2022 $0.3625 12/15/2021 1/03/2022 $0.3625 9/20/2021 10/01/2021 $0.3625 6/16/2021 7/01/2021 $0.3325 3/17/2021 4/01/2021 $0.3325 12/16/2020 1/04/2021 $0.3325 Highlighted
Rows Reflect Changes in Quarterly Cash Dividends * 7.1% increase in the quarterly dividend rate to $1.80 per share from $1.68 per share

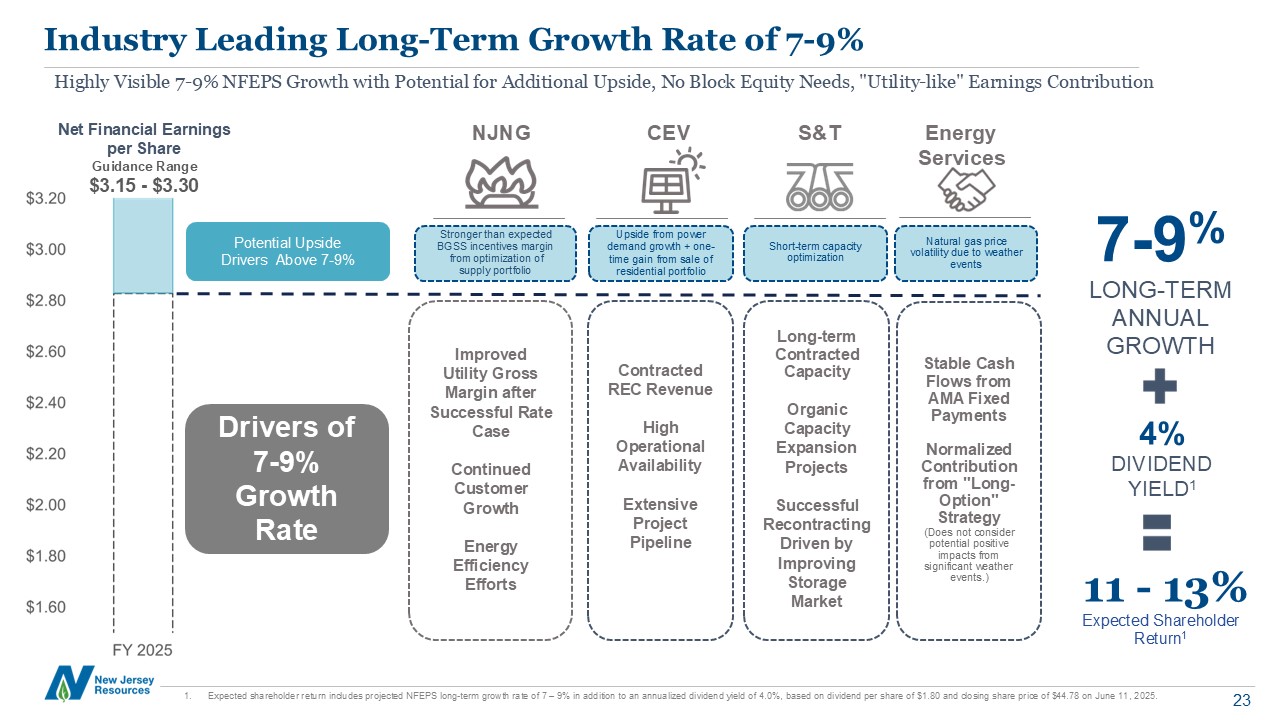
Industry Leading Long-Term Growth Rate of 7-9% Net Financial Earnings per
Share Highly Visible 7-9% NFEPS Growth with Potential for Additional Upside, No Block Equity Needs, "Utility-like" Earnings Contribution 7-9% LONG-TERM ANNUAL GROWTH NJNG CEV S&T Energy Services Improved Utility Gross Margin
after Successful Rate Case Continued Customer Growth Energy Efficiency Efforts Drivers of 7-9% Growth Rate Potential Upside Drivers Above 7-9% Contracted REC Revenue High Operational Availability Extensive
Project Pipeline Stronger than expected BGSS incentives margin from optimization of supply portfolio Upside from power demand growth + one-time gain from sale of residential portfolio Long-term Contracted Capacity Organic Capacity
Expansion Projects Successful Recontracting Driven by Improving Storage Market Short-term capacity optimization Stable Cash Flows from AMA Fixed Payments Normalized Contribution from "Long-Option" Strategy (Does not consider potential
positive impacts from significant weather events.) Natural gas price volatility due to weather events Guidance Range $3.15 - $3.30 4% DIVIDEND YIELD1 11 - 13% Expected Shareholder Return1 Expected shareholder return includes projected
NFEPS long-term growth rate of 7 – 9% in addition to an annualized dividend yield of 4.0%, based on dividend per share of $1.80 and closing share price of $44.78 on June 11, 2025.

Appendix: Financial Statements and Additional Information 24 25 Review of
Fiscal 2025 Second Quarter and Year-to-Date Results 26 Reconciliation of NFE and NFEPS to Net Income 27 Other Reconciliation of Non-GAAP Measures 28 Reconciliation of Adjusted Funds from Operations to Cash Flow from
Operations 29 Fiscal 2025 Second Quarter and Year-to-Date NFE and NFEPS by Business Unit 30 Capital Plan Table 31 Debt Repayment Schedule 32 Projected Cash Flows 33 CEV: SREC Hedging Strategy Stabilizes Revenue 34 Shareholder and
Online Information

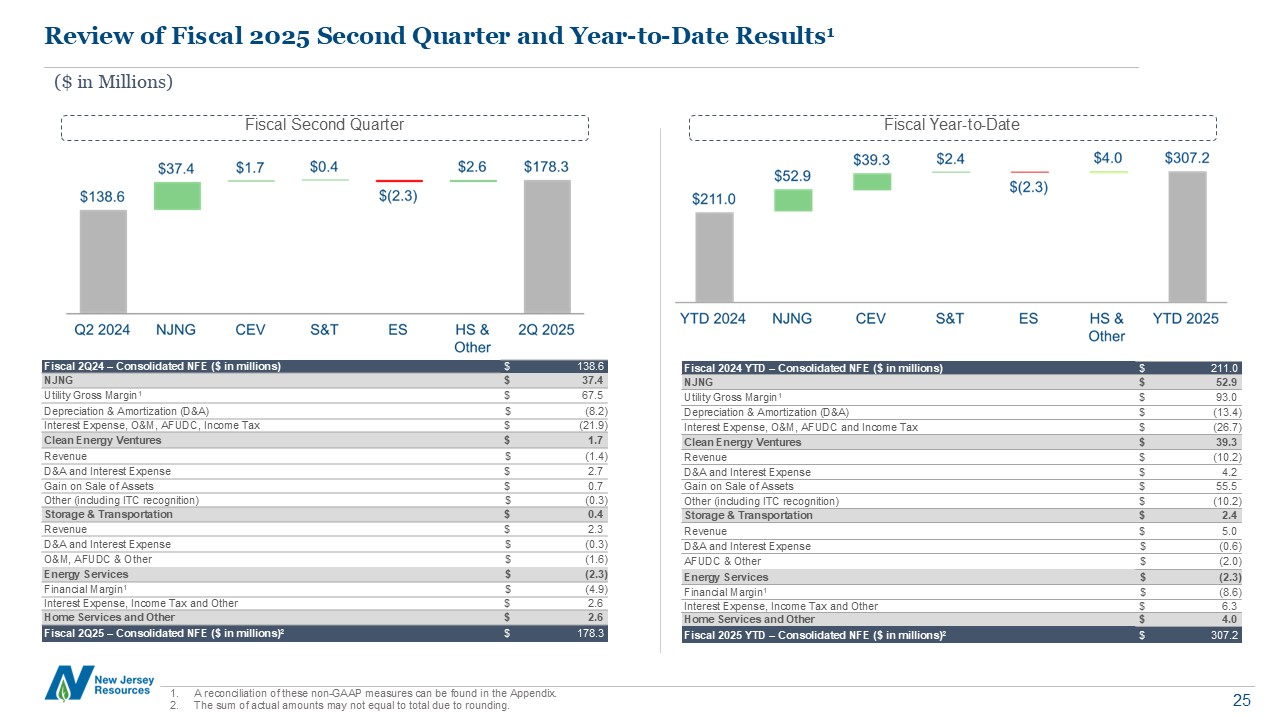
Fiscal 2024 YTD – Consolidated NFE ($ in millions) $ 211.0 NJNG $ 52.9
Utility Gross Margin1 $ 93.0 Depreciation & Amortization (D&A) $ (13.4) Interest Expense, O&M, AFUDC and Income Tax $ (26.7) Clean Energy Ventures $ 39.3 Revenue $ (10.2) D&A and Interest Expense $ 4.2 Gain on
Sale of Assets $ 55.5 Other (including ITC recognition) $ (10.2) Storage & Transportation $ 2.4 Revenue $ 5.0 D&A and Interest Expense $ (0.6) AFUDC & Other $ (2.0) Energy Services $ (2.3) Financial Margin1 $
(8.6) Interest Expense, Income Tax and Other $ 6.3 Home Services and Other $ 4.0 Fiscal 2025 YTD – Consolidated NFE ($ in millions)2 $ 307.2 Fiscal 2Q24 – Consolidated NFE ($ in millions) $ 138.6 NJNG $ 37.4 Utility Gross
Margin1 $ 67.5 Depreciation & Amortization (D&A) $ (8.2) Interest Expense, O&M, AFUDC, Income Tax $ (21.9) Clean Energy Ventures $ 1.7 Revenue $ (1.4) D&A and Interest Expense $ 2.7 Gain on Sale of Assets $ 0.7
Other (including ITC recognition) $ (0.3) Storage & Transportation $ 0.4 Revenue $ 2.3 D&A and Interest Expense $ (0.3) O&M, AFUDC & Other $ (1.6) Energy Services $ (2.3) Financial Margin1 $ (4.9) Interest
Expense, Income Tax and Other $ 2.6 Home Services and Other $ 2.6 Fiscal 2Q25 – Consolidated NFE ($ in millions)2 $ 178.3 A reconciliation of these non-GAAP measures can be found in the Appendix. The sum of actual amounts may not
equal to total due to rounding. Review of Fiscal 2025 Second Quarter and Year-to-Date Results1 ($ in Millions) Fiscal Second Quarter Fiscal Year-to-Date

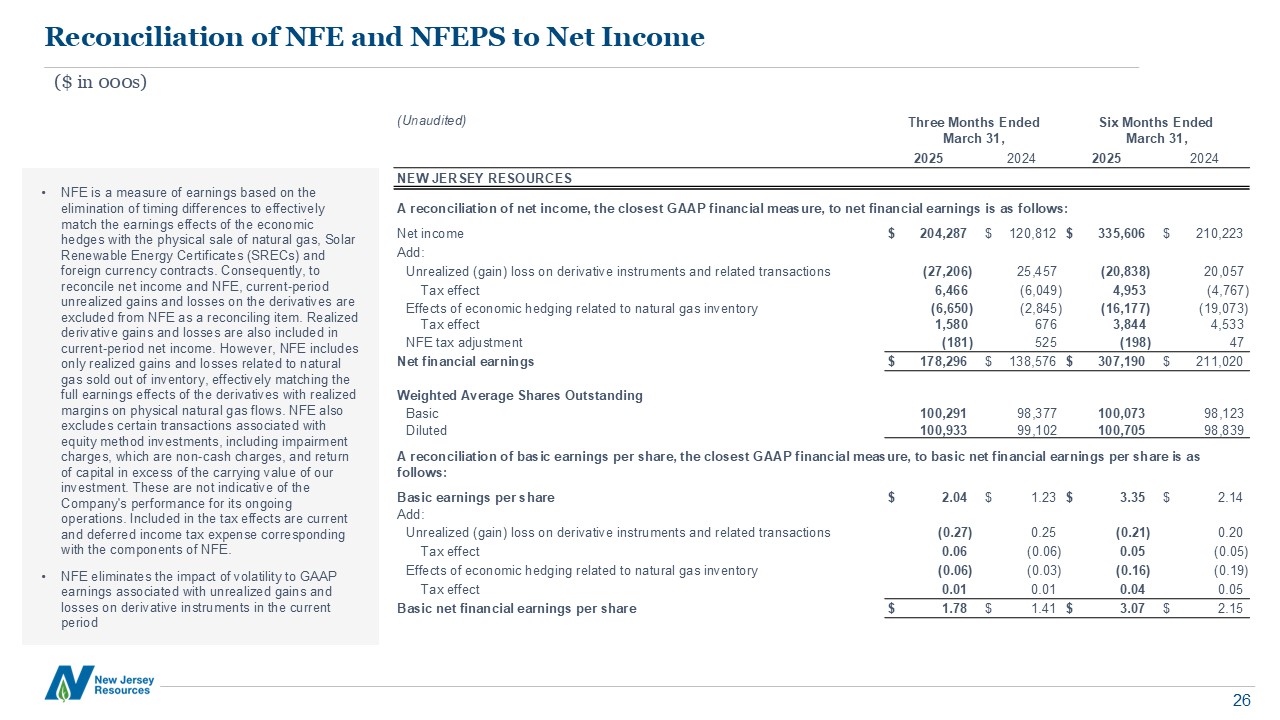
Reconciliation of NFE and NFEPS to Net Income ($ in 000s) NFE is a measure of
earnings based on the elimination of timing differences to effectively match the earnings effects of the economic hedges with the physical sale of natural gas, Solar Renewable Energy Certificates (SRECs) and foreign currency contracts.
Consequently, to reconcile net income and NFE, current-period unrealized gains and losses on the derivatives are excluded from NFE as a reconciling item. Realized derivative gains and losses are also included in current-period net income.
However, NFE includes only realized gains and losses related to natural gas sold out of inventory, effectively matching the full earnings effects of the derivatives with realized margins on physical natural gas flows. NFE also excludes
certain transactions associated with equity method investments, including impairment charges, which are non-cash charges, and return of capital in excess of the carrying value of our investment. These are not indicative of the Company's
performance for its ongoing operations. Included in the tax effects are current and deferred income tax expense corresponding with the components of NFE. NFE eliminates the impact of volatility to GAAP earnings associated with unrealized
gains and losses on derivative instruments in the current period (Unaudited) Three Months Ended March 31, Six Months Ended March 31, 2025 2024 2025 2024 NEW JERSEY RESOURCES A reconciliation of net income, the closest GAAP
financial measure, to net financial earnings is as follows: Net income $ 204,287 $ 120,812 $ 335,606 $ 210,223 Add: Unrealized (gain) loss on derivative instruments and related transactions (27,206) 25,457 (20,838) 20,057
Tax effect 6,466 (6,049) 4,953 (4,767) Effects of economic hedging related to natural gas inventory (6,650) (2,845) (16,177) (19,073) Tax effect 1,580 676 3,844 4,533 NFE tax adjustment (181) 525
(198) 47 Net financial earnings $ 178,296 $ 138,576 $ 307,190 $ 211,020 Weighted Average Shares Outstanding Basic 100,291 98,377 100,073 98,123 Diluted 100,933 99,102 100,705 98,839 A reconciliation of
basic earnings per share, the closest GAAP financial measure, to basic net financial earnings per share is as follows: Basic earnings per share $ 2.04 $ 1.23 $ 3.35 $ 2.14 Add: Unrealized (gain) loss on derivative instruments and
related transactions (0.27) 0.25 (0.21) 0.20 Tax effect 0.06 (0.06) 0.05 (0.05) Effects of economic hedging related to natural gas inventory (0.06) (0.03) (0.16) (0.19) Tax effect 0.01 0.01 0.04 0.05
Basic net financial earnings per share $ 1.78 $ 1.41 $ 3.07 $ 2.15

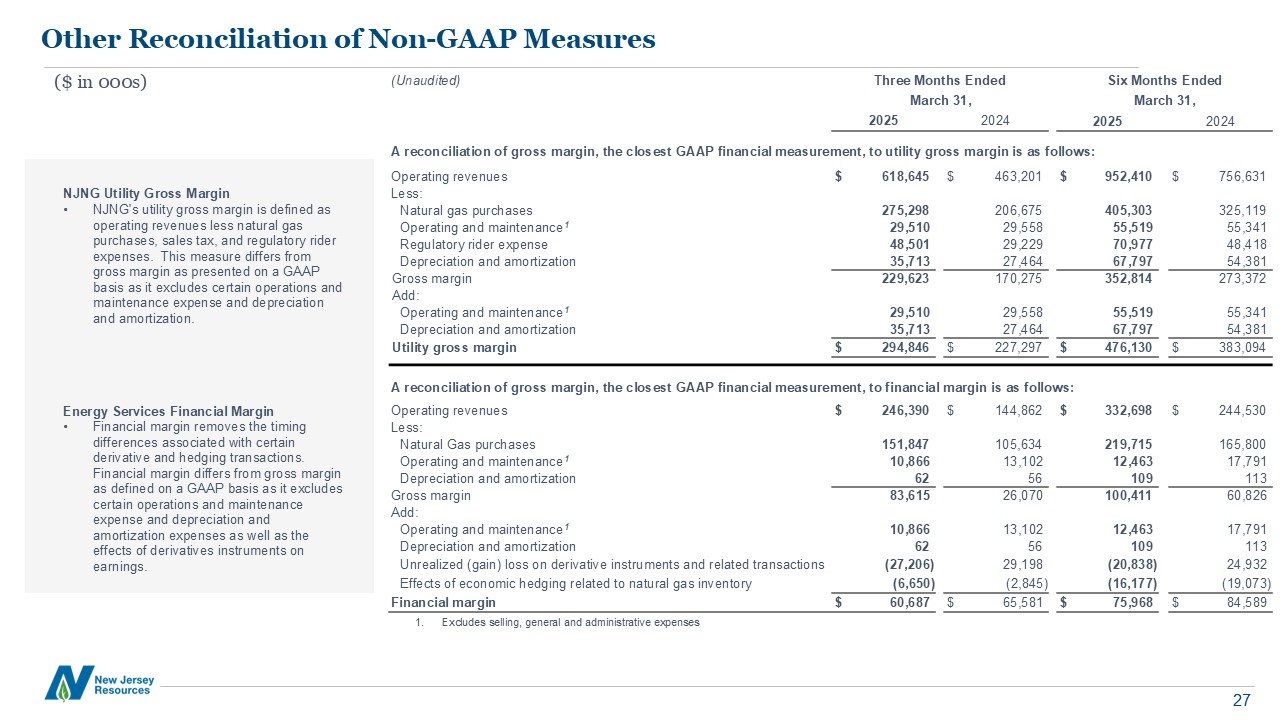
Other Reconciliation of Non-GAAP Measures NJNG Utility Gross Margin NJNG's
utility gross margin is defined as operating revenues less natural gas purchases, sales tax, and regulatory rider expenses. This measure differs from gross margin as presented on a GAAP basis as it excludes certain operations and maintenance
expense and depreciation and amortization. Energy Services Financial Margin Financial margin removes the timing differences associated with certain derivative and hedging transactions. Financial margin differs from gross margin as defined
on a GAAP basis as it excludes certain operations and maintenance expense and depreciation and amortization expenses as well as the effects of derivatives instruments on earnings. (Unaudited) Three Months Ended Six Months Ended March
31, March 31, 2025 2024 2025 2024 A reconciliation of gross margin, the closest GAAP financial measurement, to utility gross margin is as follows: Operating revenues $ 618,645 $ 463,201 $ 952,410 $ 756,631 Less: Natural gas
purchases 275,298 206,675 405,303 325,119 Operating and maintenance1 29,510 29,558 55,519 55,341 Regulatory rider expense 48,501 29,229 70,977 48,418 Depreciation and amortization 35,713 27,464
67,797 54,381 Gross margin 229,623 170,275 352,814 273,372 Add: Operating and maintenance1 29,510 29,558 55,519 55,341 Depreciation and amortization 35,713 27,464 67,797 54,381 Utility gross
margin $ 294,846 $ 227,297 $ 476,130 $ 383,094 A reconciliation of gross margin, the closest GAAP financial measurement, to financial margin is as follows: Operating revenues $ 246,390 $ 144,862 $ 332,698 $ 244,530
Less: Natural Gas purchases 151,847 105,634 219,715 165,800 Operating and maintenance1 10,866 13,102 12,463 17,791 Depreciation and amortization 62 56 109 113 Gross margin 83,615 26,070
100,411 60,826 Add: Operating and maintenance1 10,866 13,102 12,463 17,791 Depreciation and amortization 62 56 109 113 Unrealized (gain) loss on derivative instruments and related transactions (27,206)
29,198 (20,838) 24,932 Effects of economic hedging related to natural gas inventory (6,650) (2,845) (16,177) (19,073) Financial margin $ 60,687 $ 65,581 $ 75,968 $ 84,589 Excludes selling, general and administrative
expenses ($ in 000s)

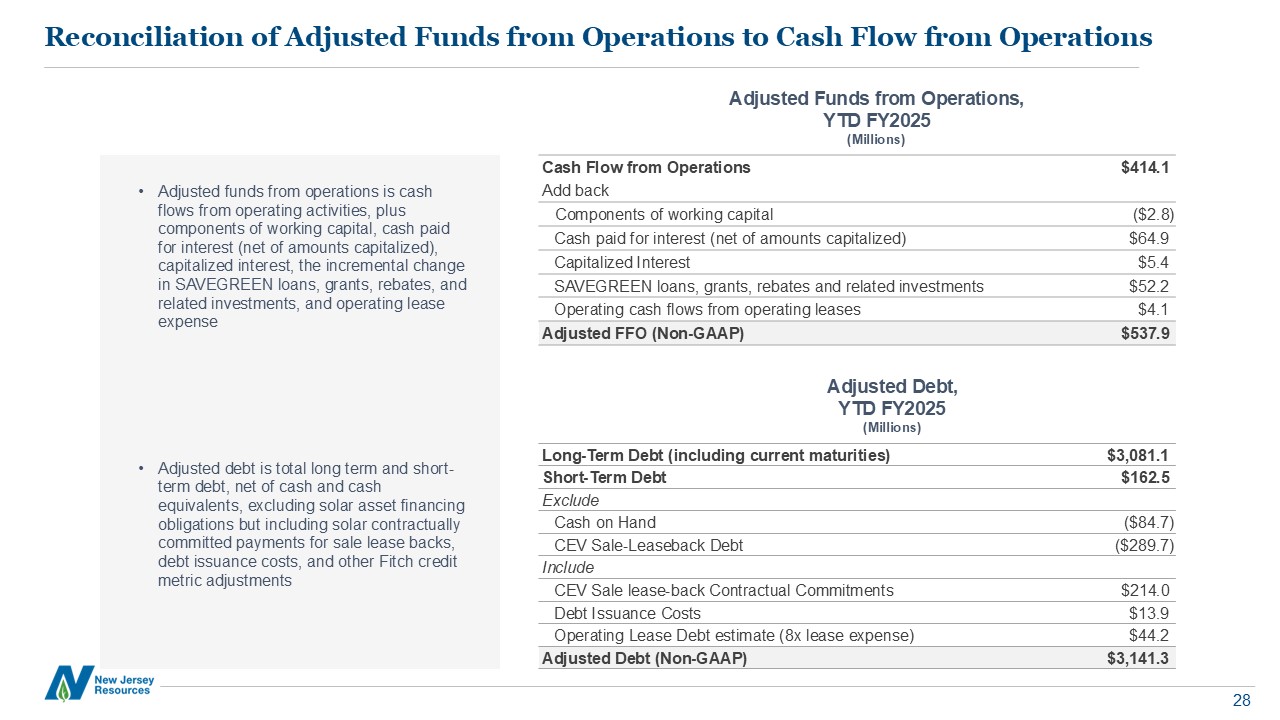
Reconciliation of Adjusted Funds from Operations to Cash Flow from
Operations Adjusted funds from operations is cash flows from operating activities, plus components of working capital, cash paid for interest (net of amounts capitalized), capitalized interest, the incremental change in SAVEGREEN loans,
grants, rebates, and related investments, and operating lease expense Adjusted debt is total long term and short-term debt, net of cash and cash equivalents, excluding solar asset financing obligations but including solar contractually
committed payments for sale lease backs, debt issuance costs, and other Fitch credit metric adjustments Cash Flow from Operations $414.1 Add back Components of working capital ($2.8) Cash paid for interest (net of amounts
capitalized) $64.9 Capitalized Interest $5.4 SAVEGREEN loans, grants, rebates and related investments $52.2 Operating cash flows from operating leases $4.1 Adjusted FFO (Non-GAAP) $537.9 Long-Term Debt (including current
maturities) $3,081.1 Short-Term Debt $162.5 Exclude Cash on Hand ($84.7) CEV Sale-Leaseback Debt ($289.7) Include CEV Sale lease-back Contractual Commitments $214.0 Debt Issuance Costs $13.9 Operating Lease Debt
estimate (8x lease expense) $44.2 Adjusted Debt (Non-GAAP) $3,141.3 Adjusted Debt, YTD FY2025 (Millions) Adjusted Funds from Operations, YTD FY2025 (Millions)

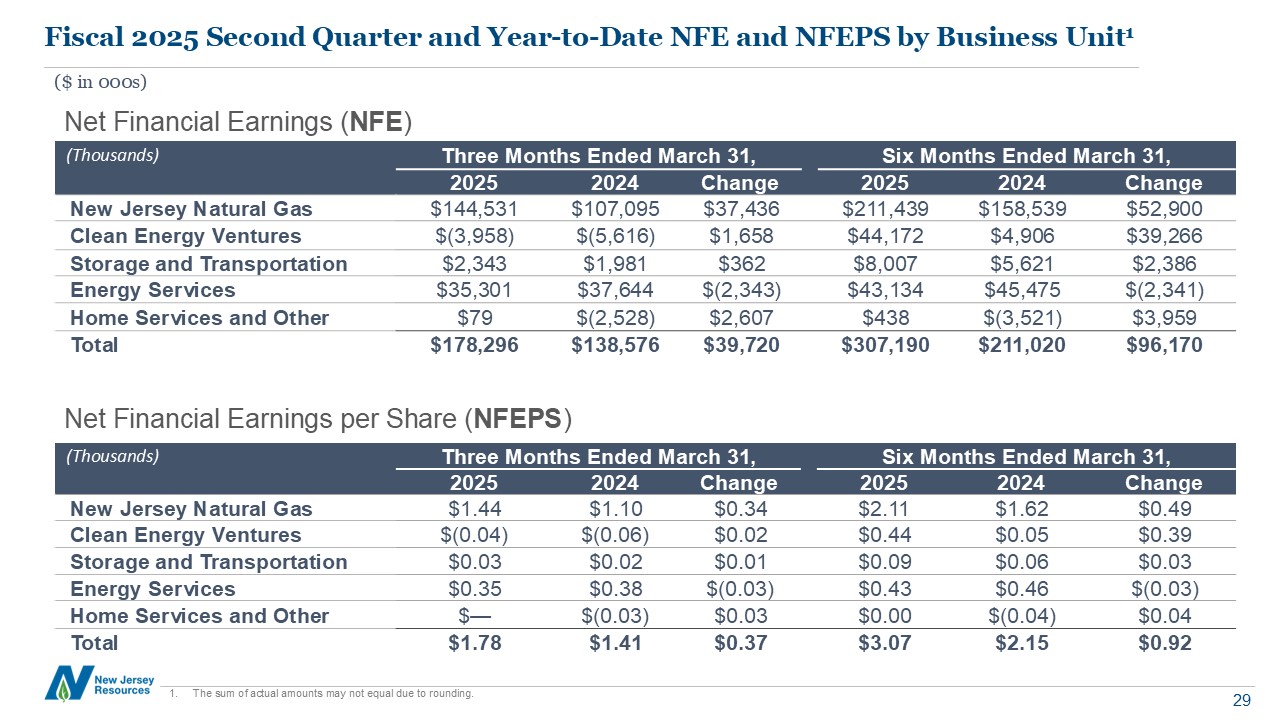
Fiscal 2025 Second Quarter and Year-to-Date NFE and NFEPS by Business Unit1 ($
in 000s) (Thousands) Three Months Ended March 31, Six Months Ended March 31, 2025 2024 Change 2025 2024 Change New Jersey Natural Gas $144,531 $107,095 $37,436 $211,439 $158,539 $52,900 Clean Energy
Ventures $(3,958) $(5,616) $1,658 $44,172 $4,906 $39,266 Storage and Transportation $2,343 $1,981 $362 $8,007 $5,621 $2,386 Energy Services $35,301 $37,644 $(2,343) $43,134 $45,475 $(2,341) Home Services and
Other $79 $(2,528) $2,607 $438 $(3,521) $3,959 Total $178,296 $138,576 $39,720 $307,190 $211,020 $96,170 (Thousands) Three Months Ended March 31, Six Months Ended March 31, 2025 2024 Change 2025 2024 Change New Jersey
Natural Gas $1.44 $1.10 $0.34 $2.11 $1.62 $0.49 Clean Energy Ventures $(0.04) $(0.06) $0.02 $0.44 $0.05 $0.39 Storage and Transportation $0.03 $0.02 $0.01 $0.09 $0.06 $0.03 Energy
Services $0.35 $0.38 $(0.03) $0.43 $0.46 $(0.03) Home Services and Other $— $(0.03) $0.03 $0.00 $(0.04) $0.04 Total $1.78 $1.41 $0.37 $3.07 $2.15 $0.92 Net Financial Earnings (NFE) Net Financial Earnings per Share
(NFEPS) The sum of actual amounts may not equal due to rounding.

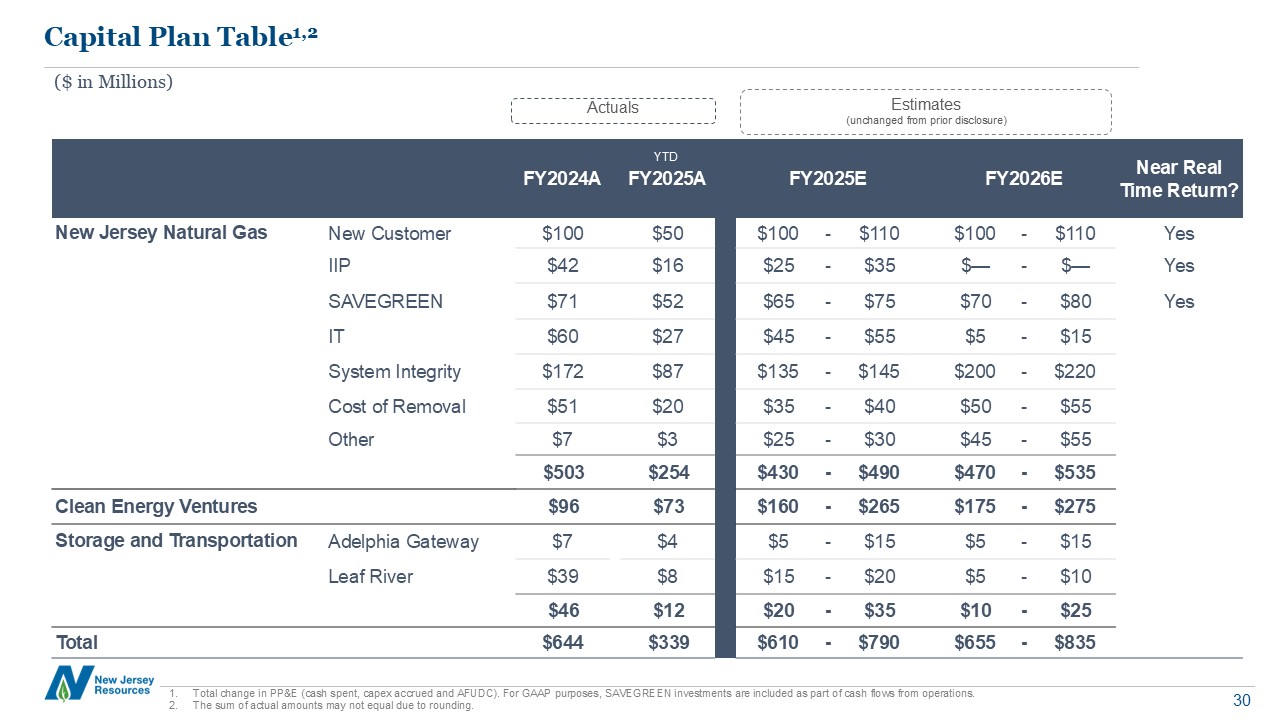
Capital Plan Table1,2 ($ in Millions) Total change in PP&E (cash spent,
capex accrued and AFUDC). For GAAP purposes, SAVEGREEN investments are included as part of cash flows from operations. The sum of actual amounts may not equal due to rounding. FY2024A FY2025A FY2025E FY2026E Near Real Time
Return? New Jersey Natural Gas New Customer $100 $50 $100 - $110 $100 - $110 Yes IIP $42 $16 $25 - $35 $— - $— Yes SAVEGREEN $71 $52 $65 - $75 $70 - $80 Yes IT $60 $27 $45 - $55 $5 - $15 System
Integrity $172 $87 $135 - $145 $200 - $220 Cost of Removal $51 $20 $35 - $40 $50 - $55 Other $7 $3 $25 - $30 $45 - $55 $503 $254 $430 - $490 $470 - $535 Clean Energy
Ventures $96 $73 $160 - $265 $175 - $275 Storage and Transportation Adelphia Gateway $7 $4 $5 - $15 $5 - $15 Leaf
River $39 $8 $15 - $20 $5 - $10 $46 $12 $20 - $35 $10 - $25 Total $644 $339 $610 - $790 $655 - $835 Actuals Estimates (unchanged from prior disclosure) YTD

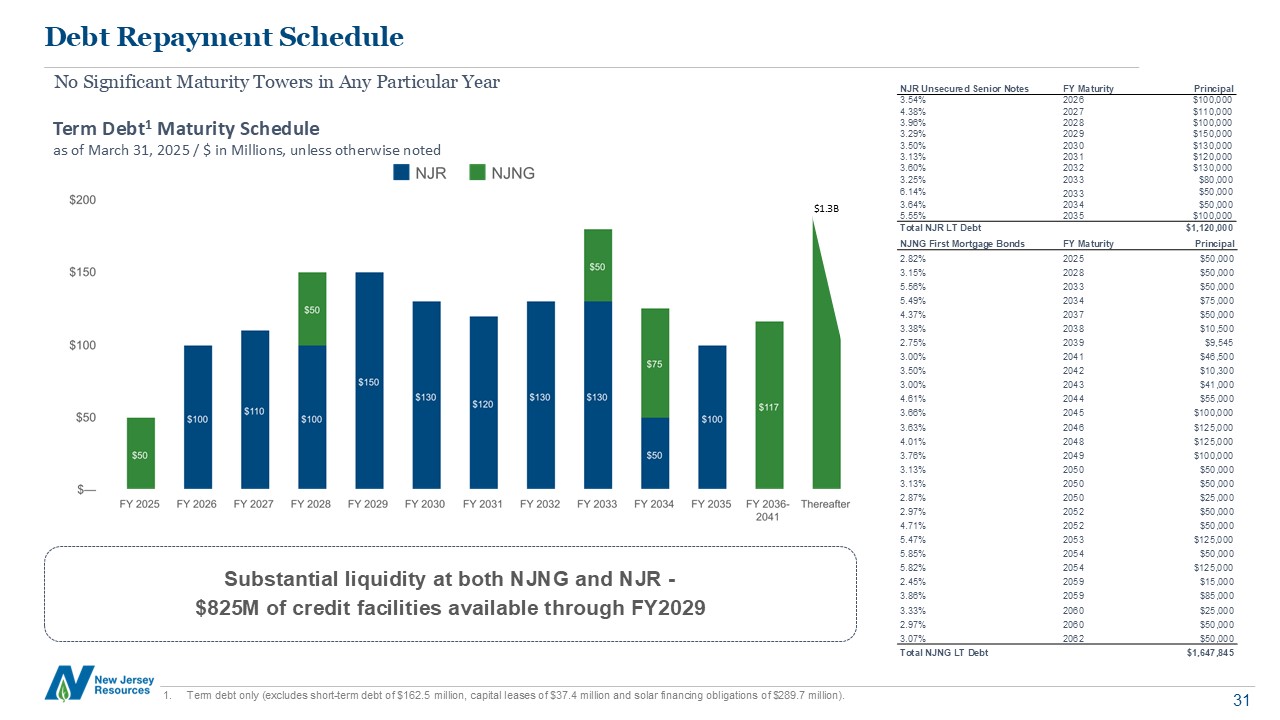
Debt Repayment Schedule No Significant Maturity Towers in Any Particular
Year Term debt only (excludes short-term debt of $162.5 million, capital leases of $37.4 million and solar financing obligations of $289.7 million). Term Debt1 Maturity Schedule as of March 31, 2025 / $ in Millions, unless otherwise
noted $1.3B NJR Unsecured Senior Notes FY Maturity Principal 3.54% 2026 $100,000 4.38% 2027 $110,000 3.96% 2028 $100,000 3.29% 2029 $150,000 3.50% 2030 $130,000 3.13% 2031 $120,000 3.60% 2032 $130,000
3.25% 2033 $80,000 6.14% 2033 $50,000 3.64% 2034 $50,000 5.55% 2035 $100,000 Total NJR LT Debt $1,120,000 NJNG First Mortgage Bonds FY Maturity Principal 2.82% 2025 $50,000 3.15% 2028 $50,000
5.56% 2033 $50,000 5.49% 2034 $75,000 4.37% 2037 $50,000 3.38% 2038 $10,500 2.75% 2039 $9,545 3.00% 2041 $46,500 3.50% 2042 $10,300 3.00% 2043 $41,000 4.61% 2044 $55,000 3.66% 2045 $100,000
3.63% 2046 $125,000 4.01% 2048 $125,000 3.76% 2049 $100,000 3.13% 2050 $50,000 3.13% 2050 $50,000 2.87% 2050 $25,000 2.97% 2052 $50,000 4.71% 2052 $50,000 5.47% 2053 $125,000 5.85% 2054
$50,000 5.82% 2054 $125,000 2.45% 2059 $15,000 3.86% 2059 $85,000 3.33% 2060 $25,000 2.97% 2060 $50,000 3.07% 2062 $50,000 Total NJNG LT Debt $1,647,845 Substantial liquidity at both NJNG and NJR - $825M
of credit facilities available through FY2029

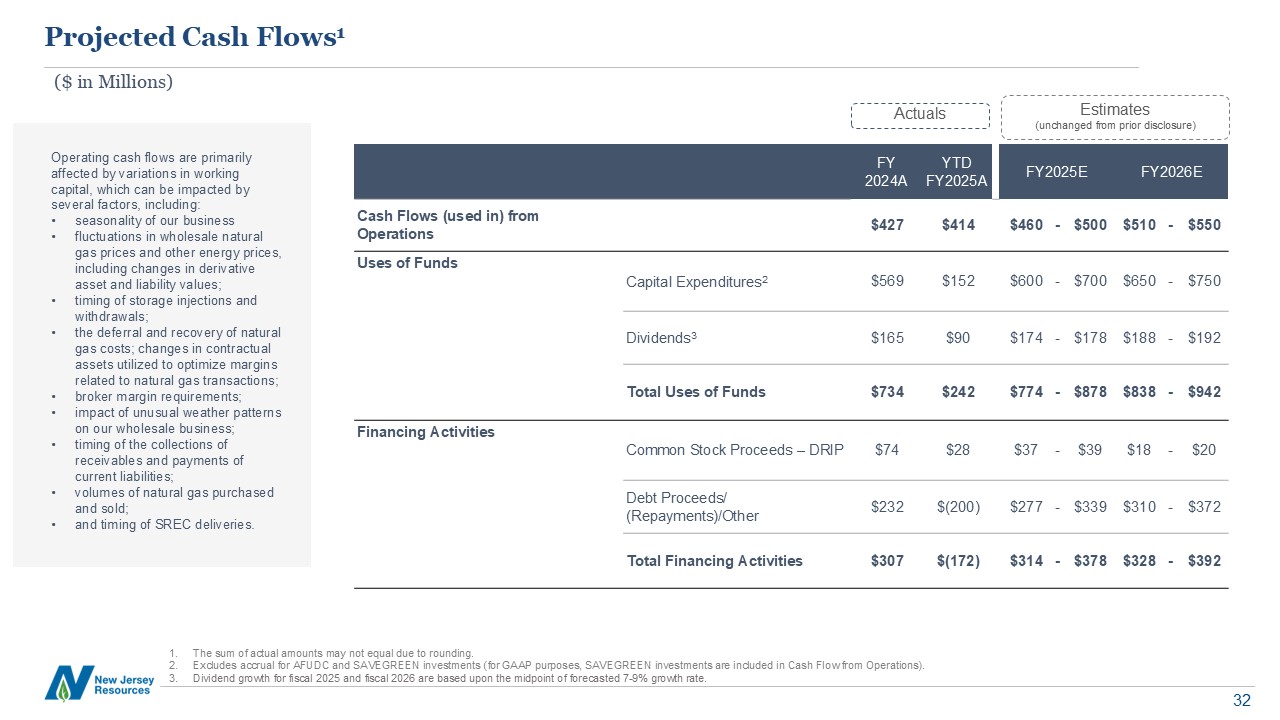
FY 2024A YTD FY2025A FY2025E FY2026E Cash Flows (used in) from
Operations $427 $414 $460 - $500 $510 - $550 Uses of Funds Capital Expenditures2 $569 $152 $600 - $700 $650 - $750 Dividends3 $165 $90 $174 - $178 $188 - $192 Total Uses of
Funds $734 $242 $774 - $878 $838 - $942 Financing Activities Common Stock Proceeds – DRIP $74 $28 $37 - $39 $18 - $20 Debt Proceeds/ (Repayments)/Other $232 $(200) $277 - $339 $310 - $372 Total Financing
Activities $307 $(172) $314 - $378 $328 - $392 Projected Cash Flows1 ($ in Millions) The sum of actual amounts may not equal due to rounding. Excludes accrual for AFUDC and SAVEGREEN investments (for GAAP purposes, SAVEGREEN
investments are included in Cash Flow from Operations). Dividend growth for fiscal 2025 and fiscal 2026 are based upon the midpoint of forecasted 7-9% growth rate. Actuals Estimates (unchanged from prior disclosure) Operating cash flows
are primarily affected by variations in working capital, which can be impacted by several factors, including: seasonality of our business fluctuations in wholesale natural gas prices and other energy prices, including changes in derivative
asset and liability values; timing of storage injections and withdrawals; the deferral and recovery of natural gas costs; changes in contractual assets utilized to optimize margins related to natural gas transactions; broker margin
requirements; impact of unusual weather patterns on our wholesale business; timing of the collections of receivables and payments of current liabilities; volumes of natural gas purchased and sold; and timing of SREC deliveries.

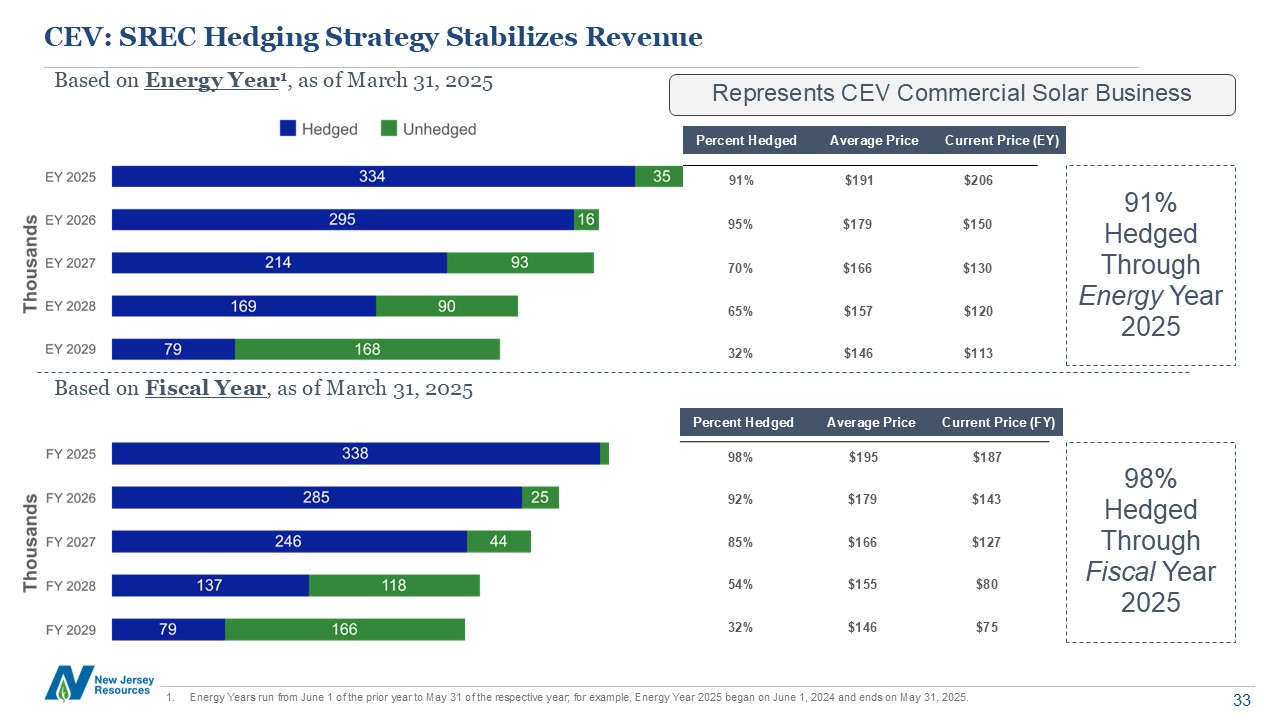
CEV: SREC Hedging Strategy Stabilizes Revenue Based on Energy Year1, as of
March 31, 2025 Energy Years run from June 1 of the prior year to May 31 of the respective year; for example, Energy Year 2025 began on June 1, 2024 and ends on May 31, 2025. Based on Fiscal Year, as of March 31, 2025 98% Hedged Through
Fiscal Year 2025 91% Hedged Through Energy Year 2025 Percent Hedged Average Price Current Price (EY) 95% $179 $150 70% $166 $130 65% $157 $120 32% $146 $113 Percent Hedged Average Price Current Price
(FY) 92% $179 $143 85% $166 $127 54% $155 $80 32% $146 $75 Represents CEV Commercial Solar Business 91% $191 $206 98% $195 $187

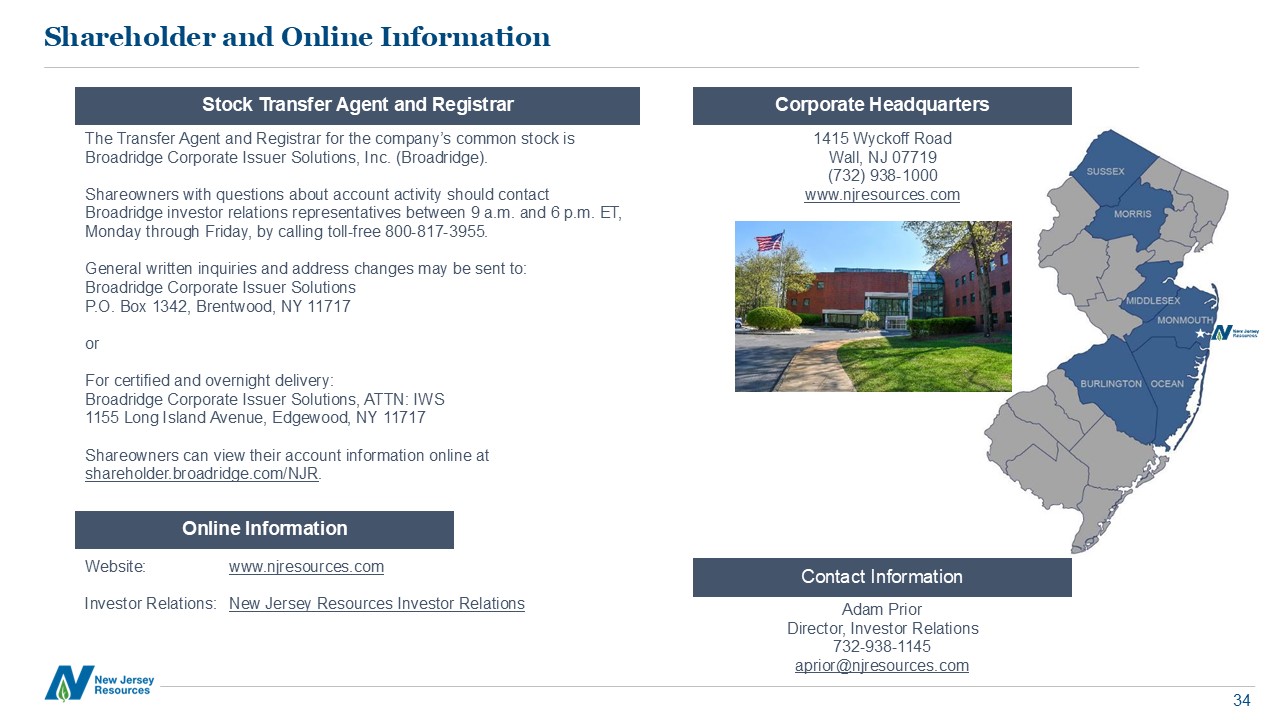
The Transfer Agent and Registrar for the company’s common stock is Broadridge
Corporate Issuer Solutions, Inc. (Broadridge). Shareowners with questions about account activity should contact Broadridge investor relations representatives between 9 a.m. and 6 p.m. ET, Monday through Friday, by calling toll-free
800-817-3955. General written inquiries and address changes may be sent to: Broadridge Corporate Issuer Solutions P.O. Box 1342, Brentwood, NY 11717 or For certified and overnight delivery: Broadridge Corporate Issuer Solutions, ATTN:
IWS 1155 Long Island Avenue, Edgewood, NY 11717 Shareowners can view their account information online at shareholder.broadridge.com/NJR. Website: www.njresources.com Investor Relations: New Jersey Resources Investor Relations Contact
Information Adam Prior Director, Investor Relations 732-938-1145 [email protected] 1415 Wyckoff Road Wall, NJ 07719 (732) 938-1000 www.njresources.com Corporate Headquarters Online Information Shareholder and Online
Information Stock Transfer Agent and Registrar