
NJR 8-K
New Jersey Resources Corp (NJR)
8-K
2022-05-05
For: 2022-05-05
View Original
Added on
April 08, 2026
UNITED STATES
SECURITIES AND EXCHANGE COMMISSION
Washington, DC 20549
FORM 8-K
CURRENT REPORT
PURSUANT TO SECTION 13 OR 15(d) OF THE
SECURITIES EXCHANGE ACT OF 1934
Date of Report (Date of earliest event reported): May 5, 2022
(Exact Name of registrant as specified in its charter)
|
|
|
|
|
(State or Other
|
(Commission
|
(IRS Employer
|
|
Jurisdiction
|
File Number)
|
Identification No.)
|
|
of Incorporation)
|
|
|
||
|
|
|
|
|
(Address of Principal Executive Offices)
|
(Zip Code)
|
(732 ) 938-1480
(Registrant’s telephone number, including area code)
Check the appropriate box below if the Form 8-K filing is intended to simultaneously satisfy the filing obligation of the registrant under any of the following
provisions:
|
Written communications pursuant to Rule 425 under the Securities Act (17 CFR 230.425)
|
|
Soliciting material pursuant to Rule 14a-12 under the Exchange Act (17 CFR 240.14a-12)
|
|
Pre-commencement communications pursuant to Rule 14d-2(b) under the Exchange Act (17 CFR 240.14d-2(b))
|
|
Pre-commencement communications pursuant to Rule 13e-4(c) under the Exchange Act (17 CFR 240.13e-4(c))
|
Securities registered pursuant to Section 12(b) of the Act:
|
Title of each class
|
Trading Symbol(s)
|
Name of each exchange on which registered
|
|
|
|
|
Indicate by check mark whether the registrant is an emerging growth company as defined in Rule 405 of the Securities Act of 1933 (§230.405 of this chapter) or Rule 12b-2
of the Securities Exchange Act of 1934 (§240.12b-2 of this chapter).
Emerging growth company ☐
If an emerging growth company, indicate by check mark if the registrant has elected not to use the extended transition period for complying with any new or revised
financial accounting standards provided pursuant to Section 13(a) of the Exchange Act. ☐
| Item 2.02 |
Results of Operations and Financial Condition.
|
On May 5, 2022, New Jersey Resources Corporation (“NJR”) issued a press release reporting financial results for the second fiscal quarter ended March 31, 2022 (the
“Press Release”). A copy of the Press Release is attached hereto as Exhibit 99.1 and is incorporated herein by reference.
| Item 7.01 |
Regulation FD Disclosure.
|
NJR will deliver a presentation via live public webcast on May 5, 2022, at 10 a.m. ET. The slides to be used for the presentation are furnished herewith as Exhibit
99.2 and are incorporated by reference into Item 7.01 of this Current Report on Form 8-K.
The information in Item 7.01 of this Current Report on Form 8-K is being furnished and shall not be deemed “filed” for the purposes of Section 18 of the Securities
Exchange Act of 1934, as amended, or otherwise subject to the liabilities of that Section and shall not be deemed to be incorporated by reference into any registration statement or other document pursuant to the Securities Act of 1933, as amended.
| Item 9.01 |
Financial Statements and Exhibits.
|
(d) Exhibits.
|
Exhibit Number
|
Exhibit
|
|
|
Press Release dated May 5, 2022 (furnished, not filed)
|
||
|
Presentation dated May 5, 2022 (furnished, not filed)
|
||
|
104
|
Cover page in Inline XBRL format
|
SIGNATURE
Pursuant to the requirements of the Securities Exchange Act of 1934, the registrant has duly caused this report to be signed on its behalf by the undersigned hereunto
duly authorized.
|
NEW JERSEY RESOURCES CORPORATION
|
||
|
Date: May 5, 2022
|
By:
|
/s/ Roberto F. Bel
|
|
Roberto F. Bel
|
||
|
Senior Vice President and Chief Financial Officer
|
||
Exhibit 99.1

NEW JERSEY RESOURCES REPORTS SECOND-QUARTER FISCAL 2022 RESULTS AND
INCREASES NET FINANCIAL EARNINGS GUIDANCE FOR FISCAL 2022
Energy Services’ Long Option Strategy Contributes to Guidance Increase
WALL, N.J., May 5, 2022 — Today, New Jersey Resources Corporation (NYSE: NJR) reported results for the second-quarter of fiscal 2022. Highlights include:
| • |
Consolidated net income of $96.0 million, compared with $149.8 million in the second quarter of fiscal 2021.
|
| • |
Consolidated net financial earnings (NFE), a non-GAAP financial measure, of $130.2 million, or $1.36 per share, compared with $170.6 million, or $1.77 per share, in the second quarter of fiscal 2021.
|
| • |
The comparable prior year period included unusually high net financial earnings at Energy Services due to increased natural gas price volatility related to the extreme weather during February 2021.
|
| • |
Increased fiscal 2022 net financial earnings per share (NFEPS) guidance range to $2.30 to $2.40 from the previously announced range of $2.20 to $2.30.
|
| • |
Adelphia Gateway is now flowing gas to its South Zone, allowing for at least one large industrial customer in the Philadelphia metro area to replace coal power generation with natural gas.
|
Second-quarter fiscal 2022 net income totaled $96.0 million, or $1.00 per share, compared with $149.8 million, or $1.56 per share, during the same period in fiscal 2021.
Fiscal 2022 year-to-date net income totaled $207.3 million, or $2.16 per share, compared with $230.9 million, or $2.40 per share, for the same period in fiscal 2021.
Second-quarter fiscal 2022 NFE totaled $130.2 million, or $1.36 per share, compared to NFE of $170.6 million, or $1.77 per share, during the same period in fiscal 2021.
Fiscal 2022 year-to-date NFE totaled $196.0 million, or $2.04 per share, compared with $215.3 million, or $2.24 per share, for the same period in fiscal 2021.
Steve Westhoven, President and CEO, stated, "NJR reported strong operating results for the second quarter of fiscal 2022, led by our utility, New Jersey Natural Gas, and
Energy Services. Better than expected performance from Energy Services is enabling us to raise our fiscal 2022 NFEPS guidance to a range of $2.30 to $2.40."
Key Performance Metrics
|
Three Months Ended
March 31,
|
Six Months Ended
March 31,
|
|||||||||||||||
|
($ in Thousands)
|
2022
|
2021
|
2022
|
2021
|
||||||||||||
|
Net income
|
$
|
96,035
|
$
|
149,809
|
$
|
207,347
|
$
|
230,854
|
||||||||
|
Basic EPS
|
$
|
1.00
|
$
|
1.56
|
$
|
2.16
|
$
|
2.40
|
||||||||
|
Net financial earnings
|
$
|
130,206
|
$
|
170,604
|
$
|
195,976
|
$
|
215,261
|
||||||||
|
Basic net financial earnings per share
|
$
|
1.36
|
$
|
1.77
|
$
|
2.04
|
$
|
2.24
|
||||||||
NJR Reports Second Quarter Fiscal 2022 Results
Page 2 of 13
A reconciliation of net income to NFE for the three and six months ended March 31, 2022 and 2021, is provided below.
|
Three Months Ended
March 31,
|
Six Months Ended
March 31,
|
|||||||||||||||
|
(Thousands)
|
2022
|
2021
|
2022
|
2021
|
||||||||||||
|
Net income
|
$
|
96,035
|
$
|
149,809
|
$
|
207,347
|
$
|
230,854
|
||||||||
|
Add:
|
||||||||||||||||
|
Unrealized loss (gain) on derivative instruments and related transactions
|
42,022
|
29,255
|
(40,169
|
)
|
(8,235
|
)
|
||||||||||
|
Tax effect
|
(9,980
|
)
|
(6,954
|
)
|
9,556
|
1,958
|
||||||||||
|
Effects of economic hedging related to natural gas inventory
|
1,155
|
(7,209
|
)
|
24,732
|
(14,741
|
)
|
||||||||||
|
Tax effect
|
(274
|
)
|
1,713
|
(5,877
|
)
|
3,503
|
||||||||||
|
Net income to NFE tax adjustment
|
1,248
|
3,990
|
387
|
1,922
|
||||||||||||
|
Net financial earnings
|
$
|
130,206
|
$
|
170,604
|
$
|
195,976
|
$
|
215,261
|
||||||||
|
Weighted Average Shares Outstanding
|
||||||||||||||||
|
Basic
|
96,068
|
96,248
|
96,006
|
96,181
|
||||||||||||
|
Diluted
|
96,516
|
96,618
|
96,480
|
96,598
|
||||||||||||
|
Basic earnings per share
|
$
|
1.00
|
$
|
1.56
|
$
|
2.16
|
$
|
2.40
|
||||||||
|
Add:
|
||||||||||||||||
|
Unrealized loss (gain) on derivative instruments and related transactions
|
0.44
|
0.30
|
(0.42
|
)
|
(0.09
|
)
|
||||||||||
|
Tax effect
|
(0.10
|
)
|
(0.08
|
)
|
0.10
|
0.02
|
||||||||||
|
Effects of economic hedging related to natural gas inventory
|
0.01
|
(0.07
|
)
|
0.26
|
(0.15
|
)
|
||||||||||
|
Tax effect
|
—
|
0.02
|
(0.06
|
)
|
0.04
|
|||||||||||
|
Net income to NFE tax adjustment
|
0.01
|
0.04
|
—
|
0.02
|
||||||||||||
|
Basic net financial earnings per share
|
$
|
1.36
|
$
|
1.77
|
$
|
2.04
|
$
|
2.24
|
||||||||
NFE is a measure of earnings based on the elimination of timing differences to effectively match the earnings effects of the economic hedges with the physical sale of
natural gas, Solar Renewable Energy Certificates (SRECs) and foreign currency contracts. Consequently, to reconcile net income and NFE, current-period unrealized gains and losses on the derivatives are excluded from NFE as a reconciling item.
Realized derivative gains and losses are also included in current-period net income. However, NFE includes only realized gains and losses related to natural gas sold out of inventory, effectively matching the full earnings effects of the
derivatives with realized margins on physical natural gas flows. NFE also may exclude impairment charges associated with equity method investments, which are non-cash charges considered unusual in nature that occur infrequently and are not
indicative of the Company's performance for its ongoing operations. For the six months ended March 31, 2022 and 2021, there were no impairments of equity method investments recorded to earnings. Included in the tax effects are current and deferred
income tax expense corresponding with the components of NFE.
NJR Reports Second Quarter Fiscal 2022 Results
Page 3 of 13
A table detailing NFE for the three and six months ended March 31, 2022 and 2021, is provided below.
Net Financial Earnings (Loss) by Business Unit
|
Three Months Ended
March 31,
|
Six Months Ended
March 31,
|
|||||||||||||||
|
(Thousands)
|
2022
|
2021
|
2022
|
2021
|
||||||||||||
|
New Jersey Natural Gas
|
$
|
102,783
|
$
|
80,541
|
$
|
153,863
|
$
|
130,008
|
||||||||
|
Clean Energy Ventures
|
(6,491
|
)
|
(8,872
|
)
|
(13,312
|
)
|
(19,146
|
)
|
||||||||
|
Storage and Transportation
|
4,625
|
4,711
|
7,587
|
8,219
|
||||||||||||
|
Energy Services
|
29,940
|
96,528
|
47,507
|
98,028
|
||||||||||||
|
Home Services and Other
|
451
|
747
|
898
|
685
|
||||||||||||
|
Subtotal
|
131,308
|
173,655
|
196,543
|
217,794
|
||||||||||||
|
Eliminations
|
(1,102
|
)
|
(3,051
|
)
|
(567
|
)
|
(2,533
|
)
|
||||||||
|
Total
|
$
|
130,206
|
$
|
170,604
|
$
|
195,976
|
$
|
215,261
|
||||||||
Fiscal 2022 NFE Guidance:
NJR increased fiscal 2022 NFE guidance to $2.30 to $2.40 per share, subject to the risk and uncertainties identified below under "Forward-Looking Statements." The
following chart represents NJR’s current expected contributions from its subsidiaries for fiscal 2022:
|
Company
|
Expected Fiscal 2022
Net Financial Earnings
Contribution
|
|
New Jersey Natural Gas
|
60 to 62 percent
|
|
Clean Energy Ventures
|
17 to 20 percent
|
|
Storage and Transportation
|
5 to 8 percent
|
|
Energy Services
|
13 to 15 percent
|
|
Home Services and Other
|
0 to 1 percent
|
In providing fiscal 2022 NFE guidance, management is aware there could be differences between reported GAAP earnings and NFE due to matters such as, but not limited to,
the positions of our energy-related derivatives. Management is not able to reasonably estimate the aggregate impact or significance of these items on reported earnings and, therefore, is not able to provide a reconciliation to the corresponding
GAAP equivalent for its operating earnings guidance without unreasonable efforts.
New Jersey Natural Gas
New Jersey Natural Gas Company (NJNG) reported second-quarter fiscal 2022 NFE of $102.8 million, compared to NFE of $80.5 million during the same period in fiscal 2021.
Fiscal 2022 year-to-date NFE were $153.9 million, compared to NFE of $130.0 million during the same period in fiscal 2021. The increase for both periods was due primarily to higher base rates, which became effective on December 1, 2021.
Customer Growth:
| • |
NJNG added 3,579 new customers during the first six months of fiscal 2022, compared with 3,694 during the same period in fiscal 2021. NJNG expects these new customers to contribute approximately $2.9 million of incremental utility gross
margin on an annualized basis.
|
NJR Reports Second Quarter Fiscal 2022 Results
Page 4 of 13
Infrastructure Update:
| • |
NJNG's Infrastructure Investment Program (IIP) is a five-year, $150 million accelerated recovery program that began in fiscal 2021. IIP consists of a series of infrastructure projects designed to enhance the safety and reliability of NJNG's natural gas
distribution system. In the second quarter, NJNG spent $10.0 million under the program on various distribution system reinforcement projects. On March 31, 2022, the Company filed its first rate recovery request with the BPU for $25.6
million of estimated investments, including AFUDC, from November 30, 2020 through June 30, 2022.
|
BGSS Incentive Programs:
BGSS incentive programs contributed $6.3 million to utility gross margin in the second-quarter of fiscal 2022, compared with $2.1 million during the same period in fiscal
2021.
Fiscal 2022 year-to-date, these programs contributed $10.1 million to utility gross margin, compared with $6.7 million during the same period in fiscal 2021.
The increase in both periods was due primarily to increased margins from off-system sales, partially offset by the timing differences for storage incentives and lower
capacity release volumes.
For more information on utility gross margin, please see "Non-GAAP Financial Information" below.
Energy-Efficiency Programs:
SAVEGREEN invested $24.2 million during the first six months of fiscal 2022 in energy-efficiency upgrades for their customers' homes and businesses. NJNG recovered $12.5
million of its outstanding investments during the first six months of fiscal 2022. On January 26, 2022, the BPU approved the annual SAVEGREEN filing, which will increase annual recoveries by $2.2 million, effective February 1, 2022.
Clean Energy Ventures (CEV)
CEV reported second-quarter fiscal 2022 net financial loss of $6.5 million, compared with net financial loss of $8.9 million during the same period in fiscal 2021. Fiscal
2022 year-to-date net financial loss was $13.3 million, compared with a net financial loss of $19.1 million during the same period in fiscal 2021. The improvement for both periods was due primarily to increased revenue from the sale of SRECs and
higher electricity prices.
CEV now has over 680 megawatts (MW) of potential capital deployment through fiscal 2027 in projects under construction, under exclusivity or under contract. However,
current policy transitions, interconnect delays, land-use constraints and supply chain issues are temporarily slowing CEV’s ability to deploy capital in the short-term and will delay our previously expected in-service timeline for fiscal year 2022.
Storage and Transportation
Storage and Transportation reported second-quarter fiscal 2022 NFE of $4.6 million, compared
with NFE of $4.7 million during the same period in fiscal 2021. Fiscal 2022 year-to-date NFE were $7.6 million, compared with NFE of $8.2 million during the same period in fiscal 2021. The decrease in NFE was due primarily to lower equity in
earnings of affiliates, partially offset by higher AFUDC equity at Adelphia Gateway.
Infrastructure Update:
| • |
Adelphia Gateway - Adelphia Gateway is an 84-mile pipeline running from Marcus Hook to Martins Creek, Pennsylvania originally built as an oil pipeline, which is now being repurposed to deliver natural gas to the Philadelphia and New Jersey markets.
Adelphia Gateway is now flowing gas to its South Zone allowing for Kimberly Clark's mill in Chester, Pennsylvania to replace coal power generation with natural gas. Adelphia Gateway is now 90% complete and the project is expected to be
completed by the end of the year.
|
NJR Reports Second Quarter Fiscal 2022 Results
Page 5 of 13
Energy Services
Energy Services reported second-quarter fiscal 2022 NFE of $29.9 million, compared with NFE of $96.5 million for the same period last fiscal year. Fiscal 2022
year-to-date NFE were $47.5 million, compared with NFE of $98.0 million during the same period in fiscal 2021. The lower NFE for the second quarter of fiscal 2022 was due primarily to higher natural gas price volatility in February 2021, as a
result of cold weather in regions where Energy Services had contracted rights to storage assets, offset by the recognition of revenues from the Asset Management Agreements entered into during fiscal 2021 that became effective during the first
quarter of fiscal 2022.
Home Services and Other Operations
Home Services and Other Operations reported second-quarter fiscal 2022 NFE of $0.5 million compared to NFE of $0.7 million for the same period in fiscal 2021. The
decrease was due to due primarily to increased O&M for the three months. Fiscal 2022 year-to-date NFE were $0.9 million, compared with NFE of $0.7 million during the same period in fiscal 2021. The increase was due primarily to higher operating
income related to an increase in installation revenue.
Expenditures and Cash Flows:
NJR is committed to maintaining a strong financial profile.
| • |
During the first six months of fiscal 2022, capital expenditures were $285.7 million, including accruals, of which $119.3 million were related to NJNG, compared with $257.6 million, of which $188.4 million were related to NJNG, during
the same period in fiscal 2021.
|
| • |
During the first six months of fiscal 2022, cash flows from operations were $330.5 million, compared
with cash flows from operations of $356.3 million during the same period of
fiscal 2021. The decrease in operating cash flows was due primarily to the reduction in net income due to the outperformance of Energy Services in fiscal 2021.
|
NJR Reports Second Quarter Fiscal 2022 Results
Page 6 of 13
Forward-Looking Statements:
This earnings release contains forward-looking statements within the meaning of Section 27A of the Securities Act of 1933, as amended, Section 21E of
the Securities Exchange Act of 1934, as amended, and the Private Securities Litigation Reform Act of 1995. NJR cautions readers that the assumptions forming the basis for forward-looking statements include many factors that are beyond NJR’s ability
to control or estimate precisely, such as estimates of future market conditions and the behavior of other market participants. Words such as “anticipates,” “estimates,” “expects,” “projects,” “may,” “will,” “intends,” “plans,” “believes,” “should”
and similar expressions may identify forward-looking statements and such forward-looking statements are made based upon management’s current expectations, assumptions and beliefs as of this date concerning future developments and their potential
effect upon NJR. There can be no assurance that future developments will be in accordance with management’s expectations, assumptions and beliefs or that the effect of future developments on NJR will be those anticipated by management.
Forward-looking statements in this earnings release include, but are not limited to, certain statements regarding NJR’s NFEPS guidance for fiscal 2022, projected NFEPS growth rate, results of future rate cases, forecasted contribution of business
segments to NJR’s NFE for fiscal 2022, customer growth at NJNG, future NJR and NJNG capital expenditures, infrastructure programs and investments such as IIP and energy efficiency programs, the ability to complete the Adelphia Gateway Pipeline
project, and other legal and regulatory expectations.
Additional information and factors that could cause actual results to differ materially from NJR’s expectations are contained in NJR’s filings with
the SEC, including NJR’s Annual Reports on Form 10-K and subsequent Quarterly Reports on Form 10-Q, recent Current Reports on Form 8-K, and other SEC filings, which are available at the SEC’s web site, http://www.sec.gov. Information included in
this earnings release is representative as of today only and while NJR periodically reassesses material trends and uncertainties affecting NJR's results of operations and financial condition in connection with its preparation of management's
discussion and analysis of results of operations and financial condition contained in its Quarterly and Annual Reports filed with the SEC, NJR does not, by including this statement, assume any obligation to review or revise any particular
forward-looking statement referenced herein in light of future events.
Non-GAAP Financial Information:
This earnings release includes the non-GAAP financial measures NFE/net financial loss, NFE per basic share, financial margin and utility gross margin.
A reconciliation of these non-GAAP financial measures to the most directly comparable financial measures calculated and reported in accordance with GAAP can be found below. As an indicator of NJR’s operating performance, these measures should not
be considered an alternative to, or more meaningful than, net income or operating revenues as determined in accordance with GAAP. This information has been provided pursuant to the requirements of SEC Regulation G.
NFE and financial margin exclude unrealized gains or losses on derivative instruments related to NJR’s unregulated subsidiaries and certain
realized gains and losses on derivative instruments related to natural gas that has been placed into storage at Energy Services and the impairment on NJR's investments in the PennEast Project, net of applicable tax adjustments as described below.
Financial margin also differs from gross margin as defined on a GAAP basis as it excludes certain operations and maintenance expense and depreciation and amortization as well as the effects of derivatives as discussed above. Volatility associated
with the change in value of these financial instruments and physical commodity reported on the income statement in the current period. In order to manage its business, NJR views its results without the impacts of the unrealized gains and losses,
and certain realized gains and losses, caused by changes in value of these financial instruments and physical commodity contracts prior to the completion of the planned transaction because it shows changes in value currently instead of when the
planned transaction ultimately is settled. An annual estimated effective tax rate is calculated for NFE purposes and any necessary quarterly tax adjustment is applied to NJR Energy Services Company.
NJNG’s utility gross margin is defined as operating revenues less natural
gas purchases, sales tax, and regulatory rider expense. This measure differs from gross margin as presented on a GAAP basis as it excludes certain operations and maintenance expense and depreciation and amortization. Utility gross margin may also
not be comparable to the definition of gross margin used by others in the natural gas distribution business and other industries. Management believes that utility gross margin provides a meaningful basis for evaluating utility operations since
natural gas costs, sales tax and regulatory rider expenses are included in operating revenues and passed through to customers and, therefore, have no effect on utility gross margin.
Management uses these non-GAAP financial measures as supplemental measures to other GAAP results to provide a more complete understanding of NJR’s
performance. Management believes these non-GAAP financial measures are more reflective of NJR’s business model, provide transparency to investors and enable period-to-period comparability of financial performance. A reconciliation of all non-GAAP
financial measures to the most directly comparable financial measures calculated and reported in accordance with GAAP can be found below. For a full discussion of NJR’s non-GAAP financial measures, please see NJR’s most recent Report on Form 10-K,
Item 7 and NJR’s Form 10-Q filed on May 5, 2022.
NJR Reports Second Quarter Fiscal 2022 Results
Page 7 of 13
About New Jersey Resources
New Jersey Resources (NYSE: NJR) is a Fortune 1000 company that, through its subsidiaries, provides safe and reliable natural gas and clean energy services, including transportation, distribution, asset management and home services. NJR is composed
of five primary businesses:
| • |
New Jersey Natural Gas, NJR’s principal subsidiary, operates and maintains over 7,600 miles of natural gas transportation and distribution infrastructure to
serve over half a million customers in New Jersey’s Monmouth, Ocean and parts of Morris, Middlesex, Sussex and Burlington counties.
|
| • |
Clean Energy Ventures invests in, owns and operates solar projects with a total capacity of more than 370 megawatts, providing residential and commercial customers with low-carbon solutions.
|
| • |
Energy Services
manages a diversified portfolio of natural gas transportation and storage assets and provides physical natural gas services and customized energy solutions to its customers across North America.
|
| • |
Storage and Transportation serves customers from local distributors and producers to electric generators and wholesale marketers through its ownership of Leaf River and the Adelphia Gateway Pipeline Project, as well as our 50% equity ownership in
the Steckman Ridge natural gas storage facility.
|
| • |
Home Services
provides service contracts as well as heating, central air conditioning, water heaters, standby generators, solar and other indoor and outdoor comfort products to residential homes throughout New Jersey.
|
NJR and its over 1,200 employees are committed to helping customers save energy and money by promoting conservation and encouraging efficiency through Conserve to
Preserve® and initiatives such as The SAVEGREEN Project® and The Sunlight Advantage®.
For more information about NJR:
www.njresources.com.
Follow us on Twitter @NJNaturalGas.
“Like” us on facebook.com/NewJerseyNaturalGas.
NJR Reports Second Quarter Fiscal 2022 Results
Page 8 of 13
NEW JERSEY RESOURCES
CONSOLIDATED STATEMENTS OF OPERATIONS
(Unaudited)
|
Three Months Ended
March 31,
|
Six Months Ended
March 31,
|
|||||||||||||||
|
(Thousands, except per share data)
|
2022
|
2021
|
2022
|
2021
|
||||||||||||
|
OPERATING REVENUES
|
||||||||||||||||
|
Utility
|
$
|
463,474
|
$
|
310,167
|
$
|
737,909
|
$
|
505,896
|
||||||||
|
Nonutility
|
448,842
|
492,020
|
850,249
|
750,596
|
||||||||||||
|
Total operating revenues
|
912,316
|
802,187
|
1,588,158
|
1,256,492
|
||||||||||||
|
OPERATING EXPENSES
|
||||||||||||||||
|
Gas purchases
|
||||||||||||||||
|
Utility
|
212,892
|
113,235
|
335,161
|
169,380
|
||||||||||||
|
Nonutility
|
410,535
|
330,488
|
689,329
|
503,735
|
||||||||||||
|
Related parties
|
1,883
|
1,730
|
3,729
|
3,464
|
||||||||||||
|
Operation and maintenance
|
85,786
|
110,265
|
154,770
|
183,901
|
||||||||||||
|
Regulatory rider expenses
|
30,910
|
18,413
|
47,581
|
29,114
|
||||||||||||
|
Depreciation and amortization
|
31,435
|
26,848
|
61,828
|
54,210
|
||||||||||||
|
Total operating expenses
|
773,441
|
600,979
|
1,292,398
|
943,804
|
||||||||||||
|
OPERATING INCOME
|
138,875
|
201,208
|
295,760
|
312,688
|
||||||||||||
|
Other income, net
|
4,127
|
5,007
|
8,263
|
9,124
|
||||||||||||
|
Interest expense, net of capitalized interest
|
18,926
|
20,153
|
38,403
|
39,939
|
||||||||||||
|
INCOME BEFORE INCOME TAXES AND EQUITY IN EARNINGS OF AFFILIATES
|
124,076
|
186,062
|
265,620
|
281,873
|
||||||||||||
|
Income tax provision
|
28,810
|
39,057
|
59,617
|
56,498
|
||||||||||||
|
Equity in earnings of affiliates
|
769
|
2,804
|
1,344
|
5,479
|
||||||||||||
|
NET INCOME
|
$
|
96,035
|
$
|
149,809
|
$
|
207,347
|
$
|
230,854
|
||||||||
|
EARNINGS PER COMMON SHARE
|
||||||||||||||||
|
Basic
|
$
|
1.00
|
$
|
1.56
|
$
|
2.16
|
$
|
2.40
|
||||||||
|
Diluted
|
$
|
1.00
|
$
|
1.55
|
$
|
2.15
|
$
|
2.39
|
||||||||
|
WEIGHTED AVERAGE SHARES OUTSTANDING
|
||||||||||||||||
|
Basic
|
96,068
|
96,248
|
96,006
|
96,181
|
||||||||||||
|
Diluted
|
96,516
|
96,618
|
96,480
|
96,598
|
||||||||||||
NJR Reports Second Quarter Fiscal 2022 Results
Page 9 of 13
RECONCILIATION OF NON-GAAP PERFORMANCE MEASURES
(Unaudited)
|
Three Months Ended
March 31,
|
Six Months Ended
March 31,
|
|||||||||||||||
|
(Thousands)
|
2022
|
2021
|
2022
|
2021
|
||||||||||||
|
NEW JERSEY RESOURCES
|
||||||||||||||||
|
A reconciliation of net income, the closest GAAP financial measure, to net financial earnings is as follows:
|
||||||||||||||||
|
Net income
|
$
|
96,035
|
$
|
149,809
|
$
|
207,347
|
$
|
230,854
|
||||||||
|
Add:
|
||||||||||||||||
|
Unrealized loss (gain) on derivative instruments and related transactions
|
42,022
|
29,255
|
(40,169
|
)
|
(8,235
|
)
|
||||||||||
|
Tax effect
|
(9,980
|
)
|
(6,954
|
)
|
9,556
|
1,958
|
||||||||||
|
Effects of economic hedging related to natural gas inventory
|
1,155
|
(7,209
|
)
|
24,732
|
(14,741
|
)
|
||||||||||
|
Tax effect
|
(274
|
)
|
1,713
|
(5,877
|
)
|
3,503
|
||||||||||
|
Net income to NFE tax adjustment
|
1,248
|
3,990
|
387
|
1,922
|
||||||||||||
|
Net financial earnings
|
$
|
130,206
|
$
|
170,604
|
$
|
195,976
|
$
|
215,261
|
||||||||
|
Weighted Average Shares Outstanding
|
||||||||||||||||
|
Basic
|
96,068
|
96,248
|
96,006
|
96,181
|
||||||||||||
|
Diluted
|
96,516
|
96,618
|
96,480
|
96,598
|
||||||||||||
|
A reconciliation of basic earnings per share, the closest GAAP financial measure, to basic net financial earnings per share is as follows:
|
||||||||||||||||
|
Basic earnings per share
|
$
|
1.00
|
$
|
1.56
|
$
|
2.16
|
$
|
2.40
|
||||||||
|
Add:
|
||||||||||||||||
|
Unrealized loss (gain) on derivative instruments and related transactions
|
$
|
0.44
|
$
|
0.30
|
$
|
(0.42
|
)
|
$
|
(0.09
|
)
|
||||||
|
Tax effect
|
$
|
(0.10
|
)
|
$
|
(0.08
|
)
|
$
|
0.10
|
$
|
0.02
|
||||||
|
Effects of economic hedging related to natural gas inventory
|
$
|
0.01
|
$
|
(0.07
|
)
|
$
|
0.26
|
$
|
(0.15
|
)
|
||||||
|
Tax effect
|
$
|
—
|
$
|
0.02
|
$
|
(0.06
|
)
|
$
|
0.04
|
|||||||
|
Net income to NFE tax adjustment
|
$
|
0.01
|
$
|
0.04
|
$
|
—
|
$
|
0.02
|
||||||||
|
Basic NFE per share
|
$
|
1.36
|
$
|
1.77
|
$
|
2.04
|
$
|
2.24
|
||||||||
|
NATURAL GAS DISTRIBUTION
|
||||||||||||||||
|
A reconciliation of gross margin, the closest GAAP financial measure, to utility gross margin is as follows:
|
||||||||||||||||
|
Operating revenues
|
$
|
463,812
|
$
|
310,167
|
$
|
738,584
|
$
|
505,896
|
||||||||
|
Less:
|
||||||||||||||||
|
Natural gas purchases
|
215,223
|
118,452
|
339,817
|
177,761
|
||||||||||||
|
Operating and maintenance (1)
|
26,748
|
26,281
|
39,889
|
51,106
|
||||||||||||
|
Regulatory rider expense
|
30,910
|
18,413
|
47,581
|
29,114
|
||||||||||||
|
Depreciation and amortization
|
23,344
|
19,475
|
46,237
|
38,644
|
||||||||||||
|
Gross margin
|
167,587
|
127,546
|
265,060
|
209,271
|
||||||||||||
|
Add:
|
||||||||||||||||
|
Operating and maintenance (1)
|
26,748
|
26,281
|
39,889
|
51,106
|
||||||||||||
|
Depreciation and amortization
|
23,344
|
19,475
|
46,237
|
38,644
|
||||||||||||
|
Utility gross margin
|
$
|
217,679
|
$
|
173,302
|
$
|
351,186
|
$
|
299,021
|
||||||||
(1) Excludes selling, general and administrative expenses of $26.3 million and $26.7 million for the three months ended March 31, 2022 and 2021, respectively, and approximately $49.6 million and $45.5 million for the six months ended March 31,
2022 and 2021, respectively
NJR Reports Second Quarter Fiscal 2022 Results
Page 10 of 13
|
(Unaudited)
|
Three Months Ended
March 31,
|
Six Months Ended
March 31,
|
||||||||||||||
|
(Thousands)
|
2022
|
2021
|
2022
|
2021
|
||||||||||||
|
ENERGY SERVICES
|
||||||||||||||||
|
A reconciliation of gross margin, the closest GAAP financial measure, to Energy Services' financial margin is as follows:
|
||||||||||||||||
|
Operating revenues
|
$
|
412,645
|
$
|
462,569
|
$
|
781,889
|
$
|
692,046
|
||||||||
|
Less:
|
||||||||||||||||
|
Natural Gas purchases
|
411,146
|
330,280
|
689,833
|
504,117
|
||||||||||||
|
Operation and maintenance (1)
|
3,978
|
20,924
|
7,247
|
24,608
|
||||||||||||
|
Depreciation and amortization
|
32
|
13
|
60
|
55
|
||||||||||||
|
Gross margin
|
(2,511
|
)
|
111,352
|
84,749
|
163,266
|
|||||||||||
|
Add:
|
||||||||||||||||
|
Operation and maintenance (1)
|
3,978
|
20,924
|
7,247
|
24,608
|
||||||||||||
|
Depreciation and amortization
|
32
|
13
|
60
|
55
|
||||||||||||
|
Unrealized loss (gain) on derivative instruments and related transactions
|
40,446
|
29,348
|
(45,201
|
)
|
(9,433
|
)
|
||||||||||
|
Effects of economic hedging related to natural gas inventory
|
1,155
|
(7,209
|
)
|
24,732
|
(14,741
|
)
|
||||||||||
|
Financial margin
|
$
|
43,100
|
$
|
154,428
|
$
|
71,587
|
$
|
163,755
|
||||||||
|
(1) Excludes selling, general and administrative expenses of $0.6 million and $12.1 million for the three months ended March 31, 2022 and 2021, respectively, and approximately $1.1 million and $12.4 million for the six
months ended March 31, 2022 and 2021, respectively.
|
||||||||||||||||
|
A reconciliation of net income to net financial earnings is as follows:
|
||||||||||||||||
|
Net (loss) income
|
$
|
(3,031
|
)
|
$
|
75,662
|
$
|
62,713
|
$
|
114,534
|
|||||||
|
Add:
|
||||||||||||||||
|
Unrealized loss (gain) on derivative instruments and related transactions
|
40,446
|
29,348
|
(45,201
|
)
|
(9,433
|
)
|
||||||||||
|
Tax effect
|
(9,604
|
)
|
(6,976
|
)
|
10,753
|
2,243
|
||||||||||
|
Effects of economic hedging related to natural gas
|
1,155
|
(7,209
|
)
|
24,732
|
(14,741
|
)
|
||||||||||
|
Tax effect
|
(274
|
)
|
1,713
|
(5,877
|
)
|
3,503
|
||||||||||
|
Net income to NFE tax adjustment
|
1,248
|
3,990
|
387
|
1,922
|
||||||||||||
|
Net financial earnings
|
$
|
29,940
|
$
|
96,528
|
$
|
47,507
|
$
|
98,028
|
||||||||
NJR Reports Second Quarter Fiscal 2022 Results
Page 11 of 13
FINANCIAL STATISTICS BY BUSINESS UNIT
(Unaudited)
|
Three Months Ended
March 31,
|
Six Months Ended
March 31,
|
|||||||||||||||
|
(Thousands, except per share data)
|
2022
|
2021
|
2022
|
2021
|
||||||||||||
|
NEW JERSEY RESOURCES
|
||||||||||||||||
|
Operating Revenues
|
||||||||||||||||
|
Natural Gas Distribution
|
$
|
463,812
|
$
|
310,167
|
$
|
738,584
|
$
|
505,896
|
||||||||
|
Clean Energy Ventures
|
11,827
|
6,476
|
22,010
|
12,846
|
||||||||||||
|
Energy Services
|
412,645
|
462,569
|
781,889
|
692,046
|
||||||||||||
|
Storage and Transportation
|
13,342
|
13,926
|
25,485
|
27,030
|
||||||||||||
|
Home Services and Other
|
13,222
|
12,773
|
27,173
|
25,350
|
||||||||||||
|
Sub-total
|
914,848
|
805,911
|
1,595,141
|
1,263,168
|
||||||||||||
|
Eliminations
|
(2,532
|
)
|
(3,724
|
)
|
(6,983
|
)
|
(6,676
|
)
|
||||||||
|
Total
|
$
|
912,316
|
$
|
802,187
|
$
|
1,588,158
|
$
|
1,256,492
|
||||||||
|
Operating Income (Loss)
|
||||||||||||||||
|
Natural Gas Distribution
|
$
|
141,311
|
$
|
100,876
|
$
|
215,494
|
$
|
163,788
|
||||||||
|
Clean Energy Ventures
|
(2,696
|
)
|
(6,469
|
)
|
(6,668
|
)
|
(14,733
|
)
|
||||||||
|
Energy Services
|
(3,132
|
)
|
99,278
|
83,646
|
150,860
|
|||||||||||
|
Storage and Transportation
|
3,180
|
4,185
|
5,056
|
7,874
|
||||||||||||
|
Home Services and Other
|
901
|
3,292
|
1,763
|
5,288
|
||||||||||||
|
Sub-total
|
139,564
|
201,162
|
299,291
|
313,077
|
||||||||||||
|
Eliminations
|
(689
|
)
|
46
|
(3,531
|
)
|
(389
|
)
|
|||||||||
|
Total
|
$
|
138,875
|
$
|
201,208
|
$
|
295,760
|
$
|
312,688
|
||||||||
|
|
||||||||||||||||
|
Equity in Earnings of Affiliates
|
||||||||||||||||
|
Storage and Transportation
|
$
|
1,256
|
$
|
3,386
|
$
|
2,312
|
$
|
6,579
|
||||||||
|
Eliminations
|
(487
|
)
|
(582
|
)
|
(968
|
)
|
(1,100
|
)
|
||||||||
|
Total
|
$
|
769
|
$
|
2,804
|
$
|
1,344
|
$
|
5,479
|
||||||||
|
Net Income (Loss)
|
||||||||||||||||
|
Natural Gas Distribution
|
$
|
102,783
|
$
|
80,541
|
$
|
153,863
|
$
|
130,008
|
||||||||
|
Clean Energy Ventures
|
(6,491
|
)
|
(8,872
|
)
|
(13,312
|
)
|
(19,146
|
)
|
||||||||
|
Energy Services
|
(3,031
|
)
|
75,662
|
62,713
|
114,534
|
|||||||||||
|
Storage and Transportation
|
4,625
|
4,711
|
7,587
|
8,219
|
||||||||||||
|
Home Services and Other
|
451
|
747
|
898
|
685
|
||||||||||||
|
Sub-total
|
98,337
|
152,789
|
211,749
|
234,300
|
||||||||||||
|
Eliminations
|
(2,302
|
)
|
(2,980
|
)
|
(4,402
|
)
|
(3,446
|
)
|
||||||||
|
Total
|
$
|
96,035
|
$
|
149,809
|
$
|
207,347
|
$
|
230,854
|
||||||||
|
Net Financial Earnings (Loss)
|
||||||||||||||||
|
Natural Gas Distribution
|
$
|
102,783
|
$
|
80,541
|
$
|
153,863
|
$
|
130,008
|
||||||||
|
Clean Energy Ventures
|
(6,491
|
)
|
(8,872
|
)
|
(13,312
|
)
|
(19,146
|
)
|
||||||||
|
Energy Services
|
29,940
|
96,528
|
47,507
|
98,028
|
||||||||||||
|
Storage and Transportation
|
4,625
|
4,711
|
7,587
|
8,219
|
||||||||||||
|
Home Services and Other
|
451
|
747
|
898
|
685
|
||||||||||||
|
Sub-total
|
131,308
|
173,655
|
196,543
|
217,794
|
||||||||||||
|
Eliminations
|
(1,102
|
)
|
(3,051
|
)
|
(567
|
)
|
(2,533
|
)
|
||||||||
|
Total
|
$
|
130,206
|
$
|
170,604
|
$
|
195,976
|
$
|
215,261
|
||||||||
|
Throughput (Bcf)
|
||||||||||||||||
|
NJNG, Core Customers
|
34.0
|
33.5
|
58.6
|
57.9
|
||||||||||||
|
NJNG, Off System/Capacity Management
|
24.0
|
23.6
|
49.1
|
49.5
|
||||||||||||
|
Energy Services Fuel Mgmt. and Wholesale Sales
|
76.7
|
112.7
|
140.2
|
217.5
|
||||||||||||
|
Total
|
134.7
|
169.8
|
247.9
|
324.9
|
||||||||||||
|
Common Stock Data
|
||||||||||||||||
|
Yield at March 31
|
3.1
|
%
|
3.3
|
%
|
3.1
|
%
|
3.3
|
%
|
||||||||
|
Market Price at March 31
|
$
|
46.66
|
$
|
39.87
|
$
|
46.66
|
$
|
39.87
|
||||||||
|
Shares Out. at March 31
|
96,082
|
96,262
|
96,082
|
96,262
|
||||||||||||
|
Market Cap. at March 31
|
$
|
4,482,696
|
$
|
3,837,967
|
$
|
4,482,696
|
$
|
3,837,967
|
||||||||
NJR Reports Second Quarter Fiscal 2022 Results
Page 12 of 13
|
(Unaudited)
|
Three Months Ended
March 31,
|
Six Months Ended
March 31,
|
||||||||||||||
|
(Thousands, except customer and weather data)
|
2022
|
2021
|
2022
|
2021
|
||||||||||||
|
NATURAL GAS DISTRIBUTION
|
||||||||||||||||
|
Utility Gross Margin
|
||||||||||||||||
|
Operating revenues
|
$
|
463,812
|
$
|
310,167
|
$
|
738,584
|
$
|
505,896
|
||||||||
|
Less:
|
||||||||||||||||
|
Natural gas purchases
|
215,223
|
118,452
|
339,817
|
177,761
|
||||||||||||
|
Operating and maintenance (1)
|
26,748
|
26,281
|
39,889
|
51,106
|
||||||||||||
|
Regulatory rider expense
|
30,910
|
18,413
|
47,581
|
29,114
|
||||||||||||
|
Depreciation and amortization
|
23,344
|
19,475
|
46,237
|
38,644
|
||||||||||||
|
Gross margin
|
167,587
|
127,546
|
265,060
|
209,271
|
||||||||||||
|
Add:
|
||||||||||||||||
|
Operating and maintenance (1)
|
26,748
|
26,281
|
39,889
|
51,106
|
||||||||||||
|
Depreciation and amortization
|
23,344
|
19,475
|
46,237
|
38,644
|
||||||||||||
|
Total Utility Gross Margin
|
$
|
217,679
|
$
|
173,302
|
$
|
351,186
|
$
|
299,021
|
||||||||
|
(1) Excludes selling, general and administrative expenses of $26.3 million and $26.7 million for the three months ended March 31, 2022 and 2021, respectively, and approximately $49.6 million and $45.5 million for the six months ended
March 31, 2022 and 2021, respectively
|
||||||||||||||||
|
Utility Gross Margin, Operating Income and Net Income
|
||||||||||||||||
|
Residential
|
$
|
155,514
|
$
|
124,468
|
$
|
248,119
|
$
|
210,443
|
||||||||
|
Commercial, Industrial & Other
|
30,120
|
23,050
|
49,222
|
40,090
|
||||||||||||
|
Firm Transportation
|
25,090
|
22,878
|
42,372
|
40,166
|
||||||||||||
|
Total Firm Margin
|
210,724
|
170,396
|
339,713
|
290,699
|
||||||||||||
|
Interruptible
|
606
|
792
|
1,360
|
1,630
|
||||||||||||
|
Total System Margin
|
211,330
|
171,188
|
341,073
|
292,329
|
||||||||||||
|
Off System/Capacity Management/FRM/Storage Incentive
|
6,349
|
2,114
|
10,113
|
6,692
|
||||||||||||
|
Total Utility Gross Margin
|
217,679
|
173,302
|
351,186
|
299,021
|
||||||||||||
|
Operation and maintenance expense
|
53,024
|
52,951
|
89,455
|
96,589
|
||||||||||||
|
Depreciation and amortization
|
23,344
|
19,475
|
46,237
|
38,644
|
||||||||||||
|
Operating Income
|
$
|
141,311
|
$
|
100,876
|
$
|
215,494
|
$
|
163,788
|
||||||||
|
|
||||||||||||||||
|
Net Income
|
$
|
102,783
|
$
|
80,541
|
$
|
153,863
|
$
|
130,008
|
||||||||
|
|
||||||||||||||||
|
Net Financial Earnings
|
$
|
102,783
|
$
|
80,541
|
$
|
153,863
|
$
|
130,008
|
||||||||
|
Throughput (Bcf)
|
||||||||||||||||
|
Residential
|
23.0
|
22.7
|
35.6
|
36.3
|
||||||||||||
|
Commercial, Industrial & Other
|
4.3
|
4.3
|
6.6
|
6.7
|
||||||||||||
|
Firm Transportation
|
5.6
|
5.7
|
9.2
|
9.6
|
||||||||||||
|
Total Firm Throughput
|
32.9
|
32.7
|
51.4
|
52.6
|
||||||||||||
|
Interruptible
|
1.1
|
0.8
|
7.2
|
5.3
|
||||||||||||
|
Total System Throughput
|
34.0
|
33.5
|
58.6
|
57.9
|
||||||||||||
|
Off System/Capacity Management
|
24.0
|
23.6
|
49.1
|
49.5
|
||||||||||||
|
Total Throughput
|
58.0
|
57.1
|
107.7
|
107.4
|
||||||||||||
|
Customers
|
||||||||||||||||
|
Residential
|
508,729
|
498,583
|
508,729
|
498,583
|
||||||||||||
|
Commercial, Industrial & Other
|
32,116
|
31,313
|
32,116
|
31,313
|
||||||||||||
|
Firm Transportation
|
27,226
|
31,545
|
27,226
|
31,545
|
||||||||||||
|
Total Firm Customers
|
568,071
|
561,441
|
568,071
|
561,441
|
||||||||||||
|
Interruptible
|
31
|
28
|
31
|
28
|
||||||||||||
|
Total System Customers
|
568,102
|
561,469
|
568,102
|
561,469
|
||||||||||||
|
Off System/Capacity Management*
|
22
|
17
|
22
|
17
|
||||||||||||
|
Total Customers
|
568,124
|
561,486
|
568,124
|
561,486
|
||||||||||||
|
*The number of customers represents those active during the last month of the period.
|
||||||||||||||||
|
Degree Days
|
||||||||||||||||
|
Actual
|
2,371
|
2,355
|
3,645
|
3,773
|
||||||||||||
|
Normal
|
2,444
|
2,456
|
3,994
|
4,031
|
||||||||||||
|
Percent of Normal
|
97.0
|
%
|
95.9
|
%
|
91.3
|
%
|
93.6
|
%
|
||||||||
NJR Reports Second Quarter Fiscal 2022 Results
Page 13 of 13
|
(Unaudited)
|
Three Months Ended
March 31,
|
Six Months Ended
March 31,
|
||||||||||||||
|
(Thousands, except customer, SREC, TREC and megawatt)
|
2022
|
2021
|
2022
|
2021
|
||||||||||||
|
CLEAN ENERGY VENTURES
|
||||||||||||||||
|
Operating Revenues
|
||||||||||||||||
|
SREC sales
|
$
|
3,962
|
$
|
777
|
$
|
6,829
|
$
|
2,069
|
||||||||
|
TREC sales
|
1,019
|
817
|
1,865
|
1,507
|
||||||||||||
|
Solar electricity sales and other
|
4,057
|
2,268
|
7,711
|
3,988
|
||||||||||||
|
Sunlight Advantage
|
2,789
|
2,614
|
5,605
|
5,282
|
||||||||||||
|
Total Operating Revenues
|
$
|
11,827
|
$
|
6,476
|
$
|
22,010
|
$
|
12,846
|
||||||||
|
Depreciation and Amortization
|
$
|
5,311
|
$
|
4,685
|
$
|
10,544
|
$
|
10,118
|
||||||||
|
Operating (Loss)
|
$
|
(2,696
|
)
|
$
|
(6,469
|
)
|
$
|
(6,668
|
)
|
$
|
(14,733
|
)
|
||||
|
Income Tax (Benefit)
|
$
|
(1,952
|
)
|
$
|
(2,714
|
)
|
$
|
(3,998
|
)
|
$
|
(5,800
|
)
|
||||
|
Net (Loss)
|
$
|
(6,491
|
)
|
$
|
(8,872
|
)
|
$
|
(13,312
|
)
|
$
|
(19,146
|
)
|
||||
|
Net Financial (Loss)
|
$
|
(6,491
|
)
|
$
|
(8,872
|
)
|
$
|
(13,312
|
)
|
$
|
(19,146
|
)
|
||||
|
Solar Renewable Energy Certificates Generated
|
65,730
|
53,863
|
157,902
|
141,071
|
||||||||||||
|
Solar Renewable Energy Certificates Sold
|
20,000
|
3,400
|
32,200
|
9,495
|
||||||||||||
|
Transition Renewable Energy Certificates Generated
|
7,176
|
5,627
|
13,261
|
10,310
|
||||||||||||
|
Solar Megawatts Under Construction
|
67.7
|
12.4
|
67.7
|
12.4
|
||||||||||||
|
ENERGY SERVICES
|
||||||||||||||||
|
Operating Income
|
||||||||||||||||
|
Operating revenues
|
$
|
412,645
|
$
|
462,569
|
$
|
781,889
|
$
|
692,046
|
||||||||
|
Less:
|
||||||||||||||||
|
Gas purchases
|
411,146
|
330,280
|
689,833
|
504,117
|
||||||||||||
|
Operation and maintenance expense
|
4,599
|
32,998
|
8,350
|
37,014
|
||||||||||||
|
Depreciation and amortization
|
32
|
13
|
60
|
55
|
||||||||||||
|
Total Operating (Loss) Income
|
$
|
(3,132
|
)
|
$
|
99,278
|
$
|
83,646
|
$
|
150,860
|
|||||||
|
|
||||||||||||||||
|
Net (Loss) Income
|
$
|
(3,031
|
)
|
$
|
75,662
|
$
|
62,713
|
$
|
114,534
|
|||||||
|
Financial Margin
|
$
|
43,100
|
$
|
154,428
|
$
|
71,587
|
$
|
163,755
|
||||||||
|
Net Financial Earnings
|
$
|
29,940
|
$
|
96,528
|
$
|
47,507
|
$
|
98,028
|
||||||||
|
Gas Sold and Managed (Bcf)
|
76.7
|
112.7
|
140.2
|
217.5
|
||||||||||||
|
STORAGE AND TRANSPORTATION
|
||||||||||||||||
|
Operating Revenues
|
$
|
13,342
|
$
|
13,926
|
$
|
25,485
|
$
|
27,030
|
||||||||
|
Equity in Earnings of Affiliates
|
$
|
1,256
|
$
|
3,386
|
$
|
2,312
|
$
|
6,579
|
||||||||
|
Operation and Maintenance Expense
|
$
|
7,254
|
$
|
7,139
|
$
|
14,684
|
$
|
13,681
|
||||||||
|
Other Income, Net
|
$
|
2,750
|
$
|
1,591
|
$
|
5,259
|
$
|
2,845
|
||||||||
|
Interest Expense
|
$
|
1,847
|
$
|
3,578
|
$
|
3,983
|
$
|
7,560
|
||||||||
|
Income Tax Provision
|
$
|
714
|
$
|
873
|
$
|
1,057
|
$
|
1,519
|
||||||||
|
Net Income
|
$
|
4,625
|
$
|
4,711
|
$
|
7,587
|
$
|
8,219
|
||||||||
|
Net Financial Earnings
|
$
|
4,625
|
$
|
4,711
|
$
|
7,587
|
$
|
8,219
|
||||||||
|
HOME SERVICES AND OTHER
|
||||||||||||||||
|
Operating Revenues
|
$
|
13,222
|
$
|
12,773
|
$
|
27,173
|
$
|
25,350
|
||||||||
|
Operating Income
|
$
|
901
|
$
|
3,292
|
$
|
1,763
|
$
|
5,288
|
||||||||
|
Net Income
|
$
|
451
|
$
|
747
|
$
|
898
|
$
|
685
|
||||||||
|
Net Financial Earnings
|
$
|
451
|
$
|
747
|
$
|
898
|
$
|
685
|
||||||||
|
Total Service Contract Customers at March 31
|
105,022
|
106,471
|
105,022
|
106,471
|
||||||||||||
Exhibit 99.2

May 5, 2022 Second Quarter 2022Financial Results
Forward-Looking Statements and Non-GAAP Measures Forward-Looking StatementsThis presentation contains
forward-looking statements within the meaning of Section 27A of the Securities Act of 1933, as amended, Section 21E of the Securities Exchange Act of 1934, as amended, and the Private Securities Litigation Reform Act of 1995. NJR cautions
readers that the assumptions forming the basis for forward-looking statements include many factors that are beyond NJR’s ability to control or estimate precisely, such as estimates of future market conditions and the behavior of other market
participants. Words such as “anticipates,” “estimates,” “expects,” “projects,” “may,” “will,” “intends,” “plans,” “believes,” “should” and similar expressions may identify forward-looking statements and such forward-looking statements are
made based upon management’s current expectations, assumptions and beliefs as of this date concerning future developments and their potential effect upon NJR. There can be no assurance that future developments will be in accordance with
management’s expectations, assumptions and beliefs or that the effect of future developments on NJR will be those anticipated by management. Forward-looking statements in this presentation include, but are not limited to, certain statements
regarding NJR’s NFEPS guidance for fiscal 2022, projected NFEPS growth rate, results of future rate cases, forecasted contribution of business segments to NJR’s NFE for fiscal 2022, customer growth at NJNG, future NJR and NJNG capital
expenditures, projections of dividends and financing activities, infrastructure programs and investments such as IIP and energy efficiency programs, the ability to complete the Adelphia Gateway Pipeline project, and other legal and regulatory
expectations.Additional information and factors that could cause actual results to differ materially from NJR’s expectations are contained in NJR’s filings with the SEC, including NJR’s Annual Reports on Form 10-K and subsequent Quarterly
Reports on Form 10-Q, recent Current Reports on Form 8-K, and other SEC filings, which are available at the SEC’s web site, http://www.sec.gov. Information included in this presentation is representative as of today only and while NJR
periodically reassesses material trends and uncertainties affecting NJR's results of operations and financial condition in connection with its preparation of management's discussion and analysis of results of operations and financial
condition contained in its Quarterly and Annual Reports filed with the SEC, NJR does not, by including this statement, assume any obligation to review or revise any particular forward-looking statement referenced herein in light of future
events.Non-GAAP MeasuresThis presentation includes the non-GAAP financial measures NFE/net financial loss, NFE per basic share, financial margin and utility gross margin. A reconciliation of these non-GAAP financial measures to the most
directly comparable financial measures calculated and reported in accordance with GAAP can be found below. As an indicator of NJR’s operating performance, these measures should not be considered an alternative to, or more meaningful than, net
income or operating revenues as determined in accordance with GAAP. This information has been provided pursuant to the requirements of SEC Regulation G.NFE and financial margin exclude unrealized gains or losses on derivative instruments
related to NJR’s unregulated subsidiaries and certain realized gains and losses on derivative instruments related to natural gas that has been placed into storage at Energy Services and the impairment on NJR's investments in the PennEast
Project, net of applicable tax adjustments as described below. Financial margin also differs from gross margin as defined on a GAAP basis as it excludes certain operations and maintenance expense and depreciation and amortization as well as
the effects of derivatives as discussed above. Volatility associated with the change in value of these financial instruments and physical commodity reported on the income statement in the current period. In order to manage its business, NJR
views its results without the impacts of the unrealized gains and losses, and certain realized gains and losses, caused by changes in value of these financial instruments and physical commodity contracts prior to the completion of the planned
transaction because it shows changes in value currently instead of when the planned transaction ultimately is settled. An annual estimated effective tax rate is calculated for NFE purposes and any necessary quarterly tax adjustment is applied
to NJR Energy Services Company.NJNG’s utility gross margin is defined as operating revenues less natural gas purchases, sales tax, and regulatory rider expense. This measure differs from gross margin as presented on a GAAP basis as it
excludes certain operations and maintenance expense and depreciation and amortization. Utility gross margin may also not be comparable to the definition of gross margin used by others in the natural gas distribution business and other
industries. Management believes that utility gross margin provides a meaningful basis for evaluating utility operations since natural gas costs, sales tax and regulatory rider expenses are included in operating revenues and passed through to
customers and, therefore, have no effect on utility gross margin. Management uses NFE/net financial loss, utility gross margin and financial margin, as supplemental measures to other GAAP results to provide a more complete understanding of
the Company’s performance. Management believes these non-GAAP measures are more reflective of the Company’s business model, provide transparency to investors and enable period-to-period comparability of financial performance. In providing NFE
guidance, management is aware that there could be differences between reported GAAP earnings and NFE/net financial loss due to matters such as, but not limited to, the positions of our energy-related derivatives. Management is not able to
reasonably estimate the aggregate impact or significance of these items on reported earnings and therefore is not able to provide a reconciliation to the corresponding GAAP equivalent for its operating earnings guidance without unreasonable
efforts. NFE/net financial loss, utility gross margin and financial margin are discussed more fully in Item 7 of our Report on Form 10-K, NJR’s Form 10-Q filed on May 5, 2022 and, we have provided presentations of the most directly comparable
GAAP financial measure and a reconciliation of our non-GAAP financial measure, NFE/net financial loss, to the most directly comparable GAAP financial measure, in the appendix to this presentation. This information has been provided pursuant
to the requirements of SEC Regulation G.

1 Second-Quarter FY 2022 HighlightsSteve Westhoven | President & CEO 2 Financial
HighlightsRoberto Bel | SVP and CFO 3 Q&A Session Agenda
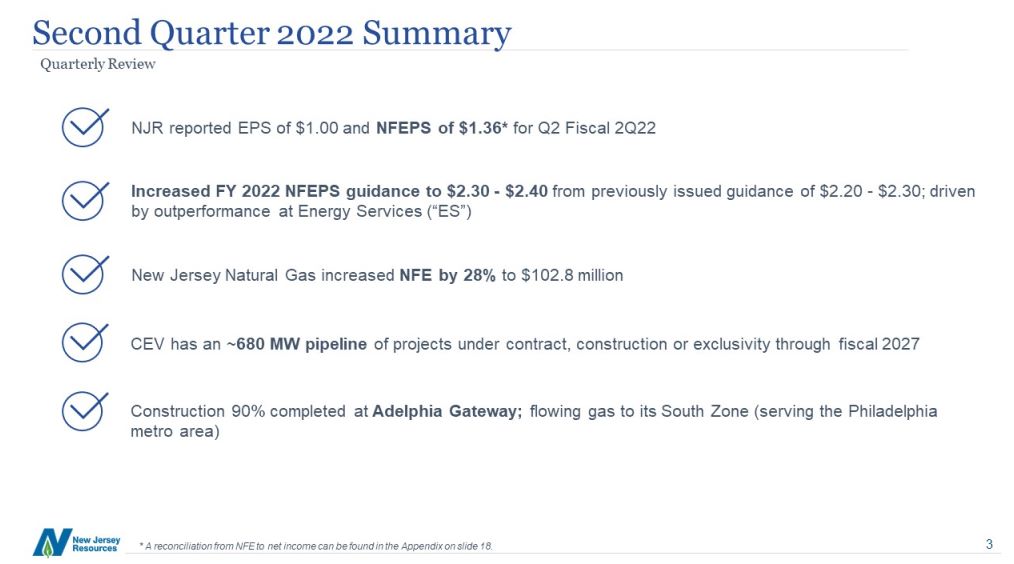
Second Quarter 2022 Summary Quarterly Review NJR reported EPS of $1.00 and NFEPS of $1.36* for Q2
Fiscal 2Q22 * A reconciliation from NFE to net income can be found in the Appendix on slide 18. Construction 90% completed at Adelphia Gateway; flowing gas to its South Zone (serving the Philadelphia metro area) CEV has an ~680
MW pipeline of projects under contract, construction or exclusivity through fiscal 2027 Increased FY 2022 NFEPS guidance to $2.30 - $2.40 from previously issued guidance of $2.20 - $2.30; driven by outperformance at Energy Services
(“ES”) New Jersey Natural Gas increased NFE by 28% to $102.8 million
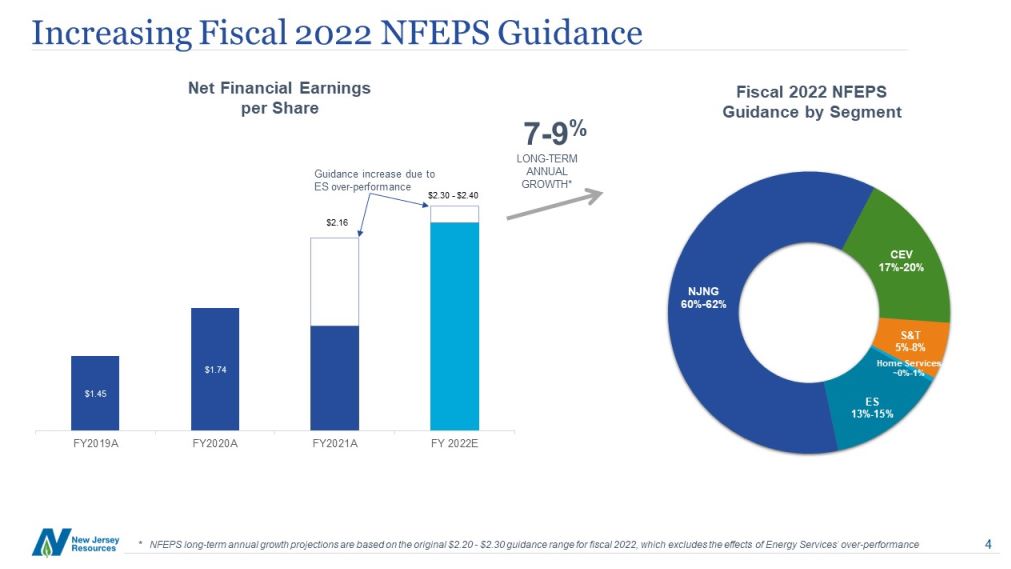
Increasing Fiscal 2022 NFEPS Guidance Fiscal 2022 NFEPS Guidance by Segment Guidance increase due to
ES over-performance Net Financial Earnings per Share * NFEPS long-term annual growth projections are based on the original $2.20 - $2.30 guidance range for fiscal 2022, which excludes the effects of Energy Services’ over-performance 7-9%
LONG-TERM ANNUAL GROWTH*
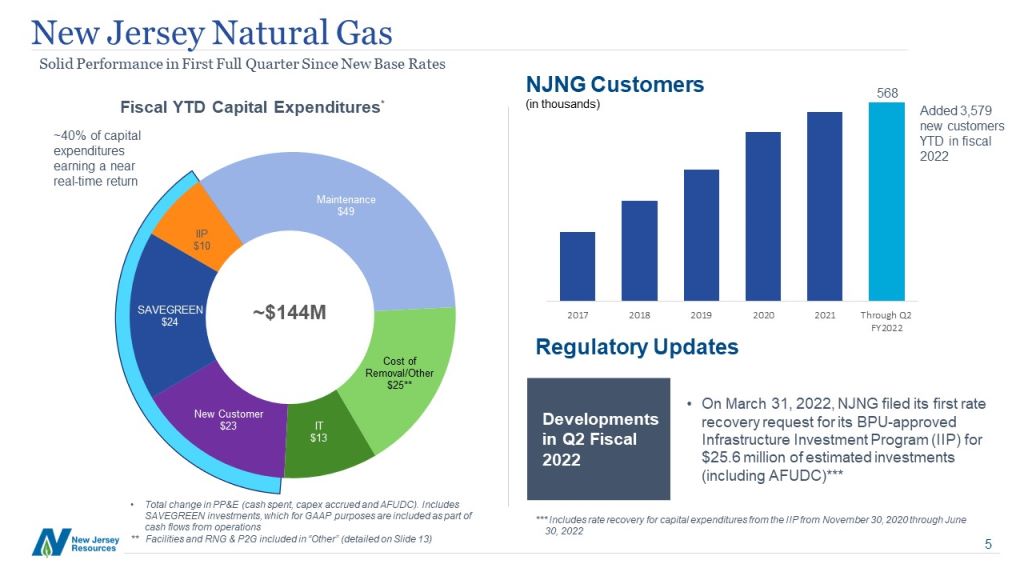
Developments in Q2 Fiscal 2022 On March 31, 2022, NJNG filed its first rate recovery request for its
BPU-approved Infrastructure Investment Program (IIP) for $25.6 million of estimated investments (including AFUDC)*** New Jersey Natural Gas Solid Performance in First Full Quarter Since New Base Rates Fiscal YTD Capital
Expenditures* ~$144M Total change in PP&E (cash spent, capex accrued and AFUDC). Includes SAVEGREEN investments, which for GAAP purposes are included as part of cash flows from operations** Facilities and RNG & P2G included in
“Other” (detailed on Slide 13) ~40% of capital expenditures earning a near real-time return NJNG Customers (in thousands) 568 Added 3,579 new customers YTD in fiscal 2022 Regulatory Updates *** Includes rate recovery for capital
expenditures from the IIP from November 30, 2020 through June 30, 2022
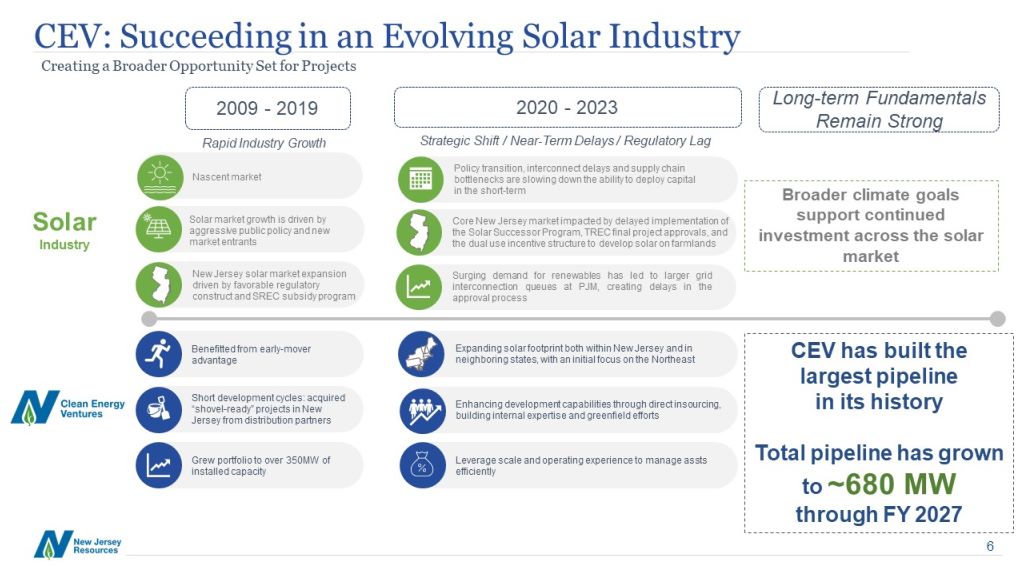
CEV has built the largest pipeline in its historyTotal pipeline has grown to ~680 MW through FY
2027 CEV: Succeeding in an Evolving Solar Industry Surging demand for renewables has led to larger grid interconnection queues at PJM, creating delays in the approval process Policy transition, interconnect delays and
supply chain bottlenecks are slowing down the ability to deploy capital in the short-term Core New Jersey market impacted by delayed implementation of the Solar Successor Program, TREC final project approvals, and the dual use incentive
structure to develop solar on farmlands 2009 - 2019 2020 - 2023 Solar Industry Solar market growth is driven by aggressive public policy and new market entrants New Jersey solar market expansion driven by favorable regulatory
construct and SREC subsidy program Short development cycles: acquired “shovel-ready” projects in New Jersey from distribution partners Grew portfolio to over 350MW of installed capacity Expanding solar footprint both within New
Jersey and in neighboring states, with an initial focus on the Northeast Leverage scale and operating experience to manage assts efficiently Enhancing
development capabilities through direct insourcing, building internal expertise and greenfield efforts Long-term Fundamentals Remain Strong Broader climate goals support continued investment across the solar market Creating a Broader
Opportunity Set for Projects Rapid Industry Growth Strategic Shift / Near-Term Delays / Regulatory Lag Nascent market Benefitted from early-mover advantage
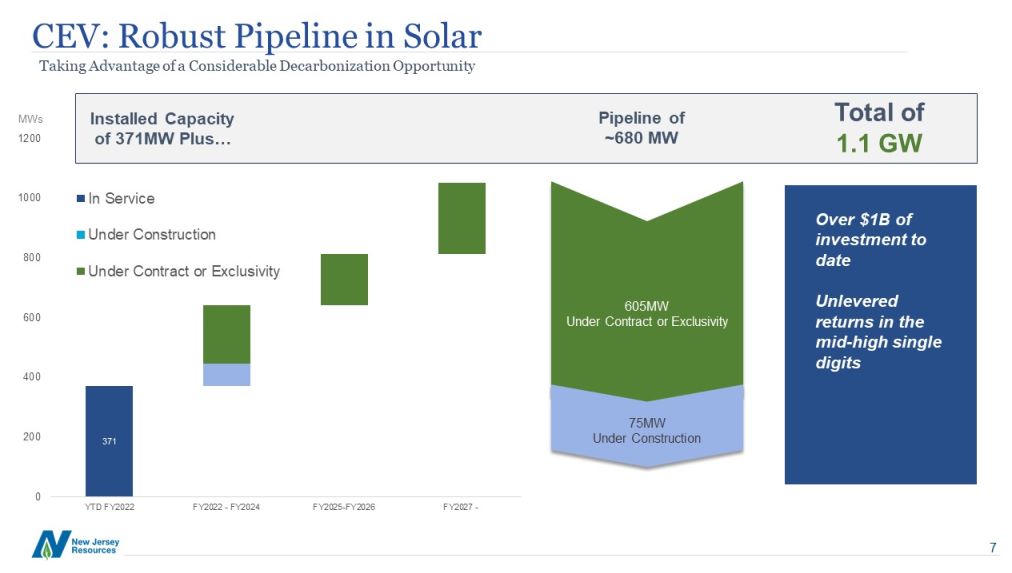
Over $1B of investment to dateUnlevered returns in the mid-high single digits Installed Capacity
of 371MW Plus… CEV: Robust Pipeline in Solar Taking Advantage of a Considerable Decarbonization Opportunity Pipeline of~680 MW 605MWUnder Contract or Exclusivity 75MWUnder Construction MWs Total of 1.1 GW
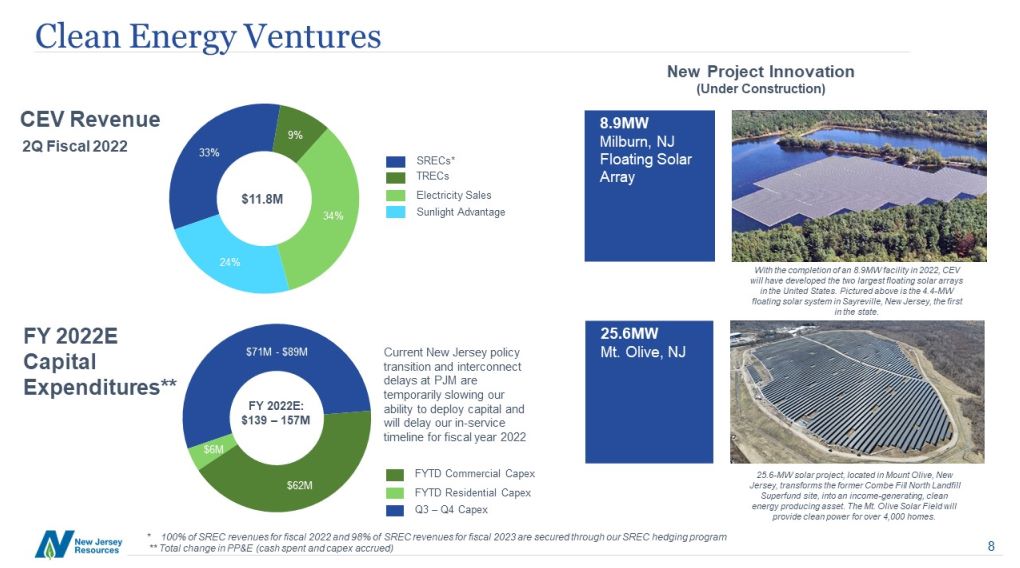
$11.8M 2Q Fiscal 2022 8-13% Clean Energy Ventures 8.9MW Milburn, NJ Floating Solar Array CEV
Revenue New Project Innovation(Under Construction) 25.6MWMt. Olive, NJ 25.6-MW solar project, located in Mount Olive, New Jersey, transforms the former Combe Fill North Landfill Superfund site, into an income-generating, clean energy
producing asset. The Mt. Olive Solar Field will provide clean power for over 4,000 homes. With the completion of an 8.9MW facility in 2022, CEV will have developed the two largest floating solar arrays in the United States. Pictured above is
the 4.4-MW floating solar system in Sayreville, New Jersey, the first in the state. SRECs* TRECs Electricity Sales Sunlight Advantage * 100% of SREC revenues for fiscal 2022 and 98% of SREC revenues for fiscal 2023 are secured
through our SREC hedging program ** Total change in PP&E (cash spent and capex accrued) FY 2022E Capital Expenditures** FY 2022E: $139 – 157M FYTD Commercial Capex FYTD Residential Capex Q3 – Q4 Capex Current New Jersey
policy transition and interconnect delays at PJM are temporarily slowing our ability to deploy capital and will delay our in-service timeline for fiscal year 2022
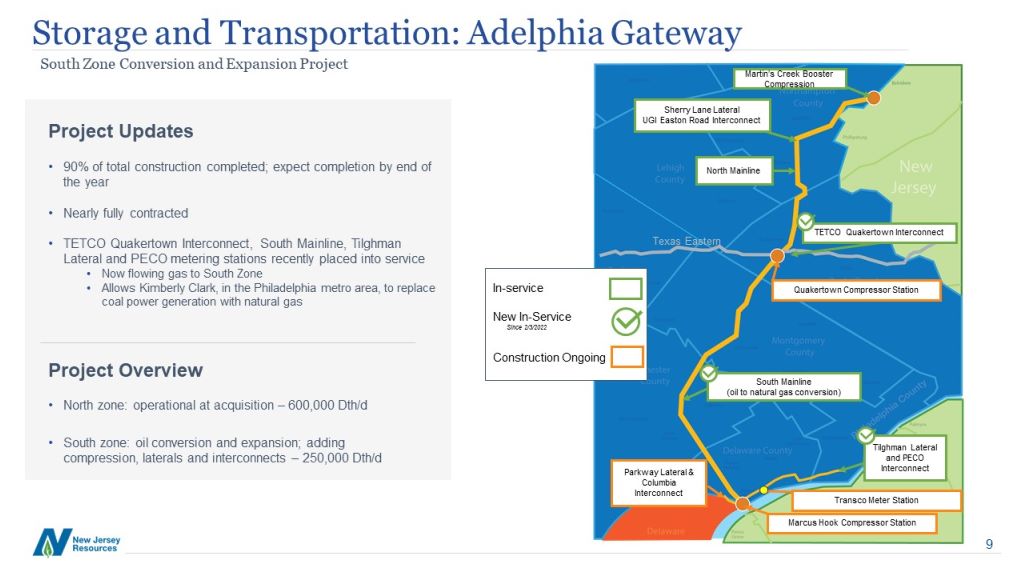
Project OverviewNorth zone: operational at acquisition – 600,000 Dth/d South zone: oil conversion and
expansion; adding compression, laterals and interconnects – 250,000 Dth/d Project Updates 90% of total construction completed; expect completion by end of the yearNearly fully contractedTETCO Quakertown Interconnect, South Mainline,
Tilghman Lateral and PECO metering stations recently placed into serviceNow flowing gas to South Zone Allows Kimberly Clark, in the Philadelphia metro area, to replace coal power generation with natural gas Storage and Transportation:
Adelphia Gateway South Zone Conversion and Expansion Project Martin’s Creek Booster Compression Texas Eastern Sherry Lane LateralUGI Easton Road Interconnect In-serviceNew In-ServiceConstruction Ongoing Since 2/3/2022 Quakertown
Compressor Station TETCO Quakertown Interconnect South Mainline(oil to natural gas conversion) Tilghman Lateral and PECO Interconnect Parkway Lateral & Columbia Interconnect Marcus Hook Compressor Station Transco Meter
Station North Mainline

Financial ReviewRoberto BelSVP & Chief Financial Officer 10
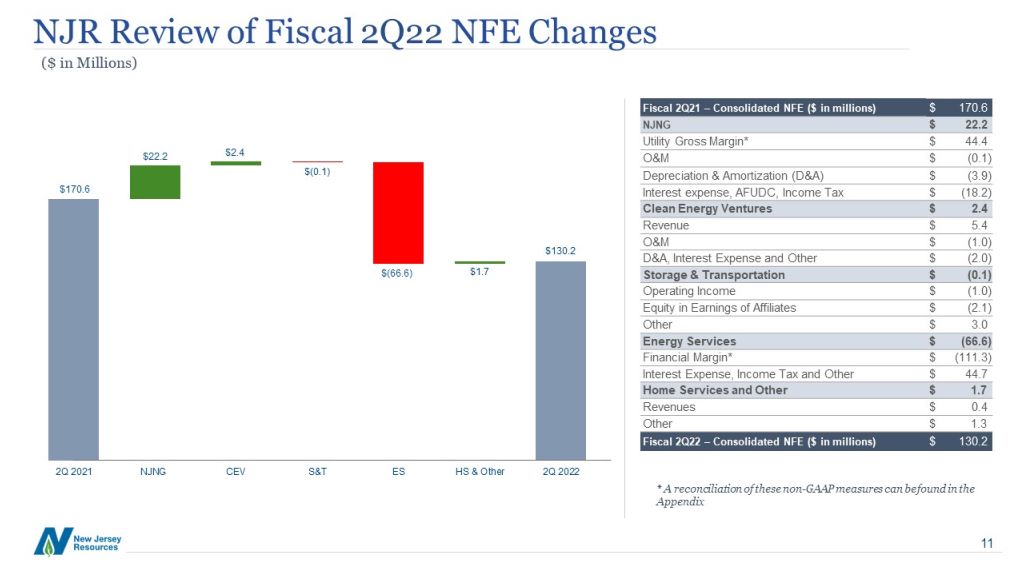
NJR Review of Fiscal 2Q22 NFE Changes * A reconciliation of these non-GAAP measures can be found in
the Appendix ($ in Millions) Fiscal 2Q21 – Consolidated NFE ($ in millions) $ 170.6 NJNG $ 22.2 Utility Gross Margin* $ 44.4 O&M $ (0.1) Depreciation & Amortization (D&A) $ (3.9) Interest expense, AFUDC, Income
Tax $ (18.2) Clean Energy Ventures $ 2.4 Revenue $ 5.4 O&M $ (1.0) D&A, Interest Expense and Other $ (2.0) Storage & Transportation $ (0.1) Operating Income $ (1.0) Equity in Earnings of Affiliates $
(2.1) Other $ 3.0 Energy Services $ (66.6) Financial Margin* $ (111.3) Interest Expense, Income Tax and Other $ 44.7 Home Services and Other $ 1.7 Revenues $ 0.4 Other $ 1.3 Fiscal 2Q22 – Consolidated NFE ($ in
millions) $ 130.2
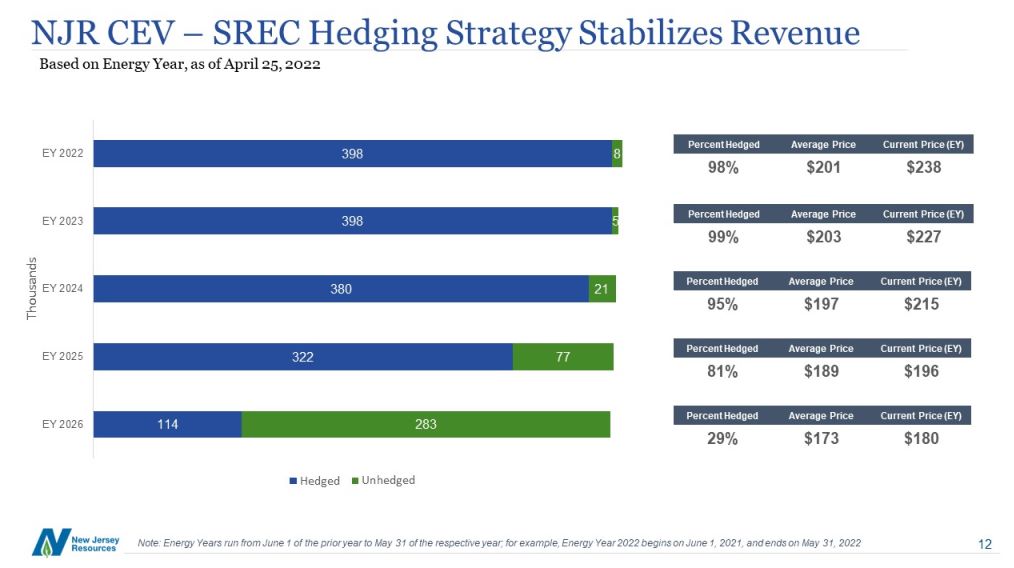
NJR CEV – SREC Hedging Strategy Stabilizes Revenue Based on Energy Year, as of April 25, 2022 Percent
Hedged Average Price Current Price (EY) 98% $201 $238 Percent Hedged Average Price Current Price (EY) 99% $203 $227 Percent Hedged Average Price Current Price (EY) 95% $197 $215 Percent Hedged Average Price Current Price
(EY) 81% $189 $196 Percent Hedged Average Price Current Price (EY) 29% $173 $180 Note: Energy Years run from June 1 of the prior year to May 31 of the respective year; for example, Energy Year 2022 begins on June 1, 2021, and ends
on May 31, 2022
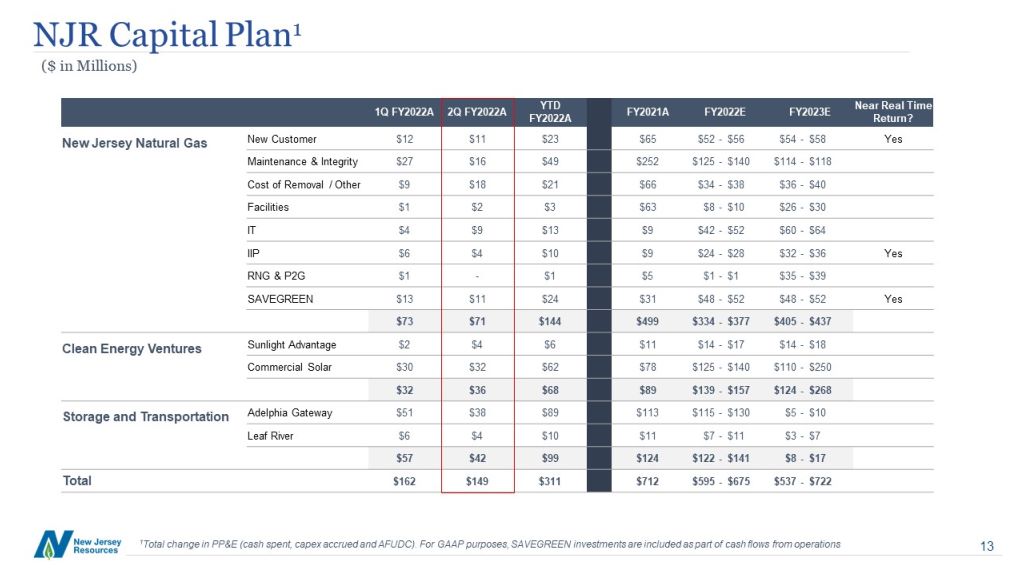
NJR Capital Plan1 ($ in Millions) 1Q FY2022A 2Q
FY2022A YTDFY2022A FY2021A FY2022E FY2023E Near Real Time Return? New Jersey Natural Gas New Customer $12 $11 $23 $65 $52 - $56 $54 - $58 Yes Maintenance & Integrity $27 $16 $49 $252 $125
- $140 $114 - $118 Cost of Removal / Other $9 $18 $21 $66 $34 - $38 $36 - $40 Facilities $1 $2 $3 $63 $8 - $10 $26 - $30 IT $4 $9 $13 $9 $42 - $52 $60 - $64
IIP $6 $4 $10 $9 $24 - $28 $32 - $36 Yes RNG & P2G $1 - $1 $5 $1 - $1 $35 - $39 SAVEGREEN $13 $11 $24 $31 $48 - $52 $48 - $52 Yes $73 $71 $144 $499 $334 - $377
$405 - $437 Clean Energy Ventures Sunlight Advantage $2 $4 $6 $11 $14 - $17 $14 - $18 Commercial Solar $30 $32 $62 $78 $125 - $140 $110 - $250 $32 $36 $68 $89 $139 - $157 $124
- $268 Storage and Transportation Adelphia Gateway $51 $38 $89 $113 $115 - $130 $5 - $10 Leaf River $6 $4 $10 $11 $7 - $11 $3 - $7 $57 $42 $99 $124 $122 - $141 $8 - $17
Total $162 $149 $311 $712 $595 - $675 $537 - $722 1Total change in PP&E (cash spent, capex accrued and AFUDC). For GAAP purposes, SAVEGREEN investments are included as part of cash flows from operations
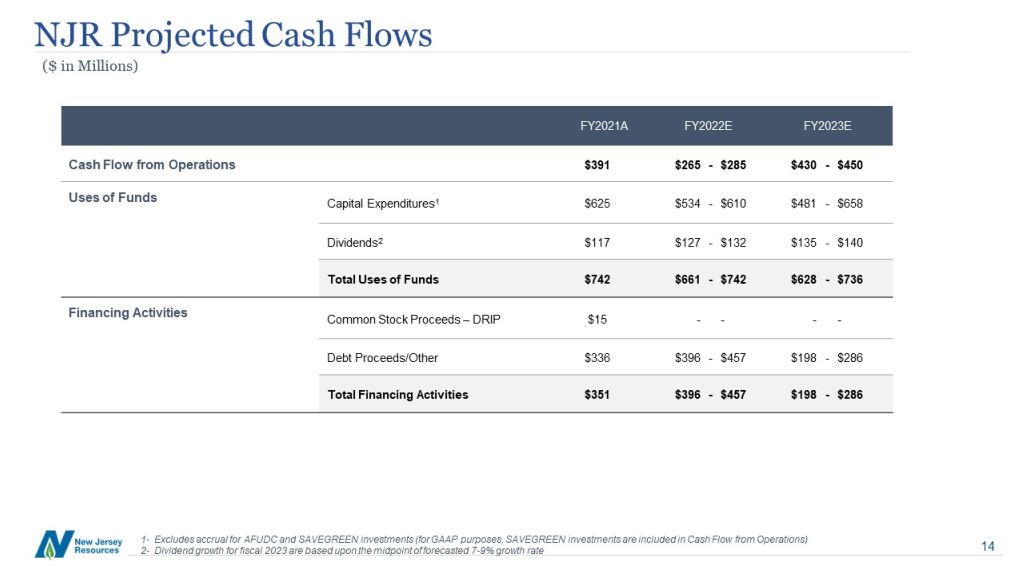
NJR Projected Cash Flows ($ in Millions) FY2021A FY2022E FY2023E Cash Flow from
Operations $391 $265 - $285 $430 - $450 Uses of Funds Capital Expenditures1 $625 $534 - $610 $481 - $658 Dividends2 $117 $127 - $132 $135 - $140 Total Uses of
Funds $742 $661 - $742 $628 - $736 Financing Activities Common Stock Proceeds – DRIP $15 - - - - Debt Proceeds/Other $336 $396 - $457 $198 - $286 Total Financing Activities $351
$396 - $457 $198 - $286 1- Excludes accrual for AFUDC and SAVEGREEN investments (for GAAP purposes, SAVEGREEN investments are included in Cash Flow from Operations)2- Dividend growth for fiscal 2023 are based upon the midpoint of
forecasted 7-9% growth rate
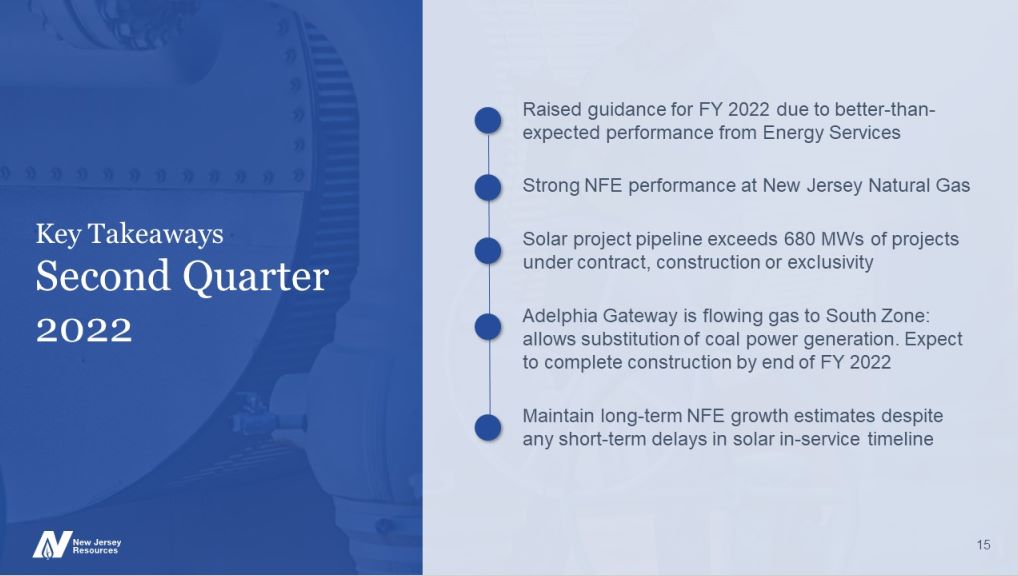
Key TakeawaysSecond Quarter 2022 Raised guidance for FY 2022 due to better-than-expected
performance from Energy Services Adelphia Gateway is flowing gas to South Zone: allows substitution of coal power generation. Expect to complete construction by end of FY 2022 Solar project pipeline exceeds 680 MWs of projects under
contract, construction or exclusivity 15 Maintain long-term NFE growth estimates despite any short-term delays in solar in-service timeline Strong NFE performance at New Jersey Natural Gas

Appendix Leadership and Board of Directors Reconciliation of NFE and NFEPS to Net Income for Q2
Fiscal 2022 Reconciliation of Non-GAAP Measures Corporate and Equity Information Second Quarter Fiscal 2022 NFE by Business Unit Revenue Recognition for AMAs NJR CEV – SREC Hedging by Fiscal Year Raising FY 2022 NFE Guidance to $2.30 -
$2.40 Per Share Investor Value Proposition Review of Fiscal YTD NFE Changes 16
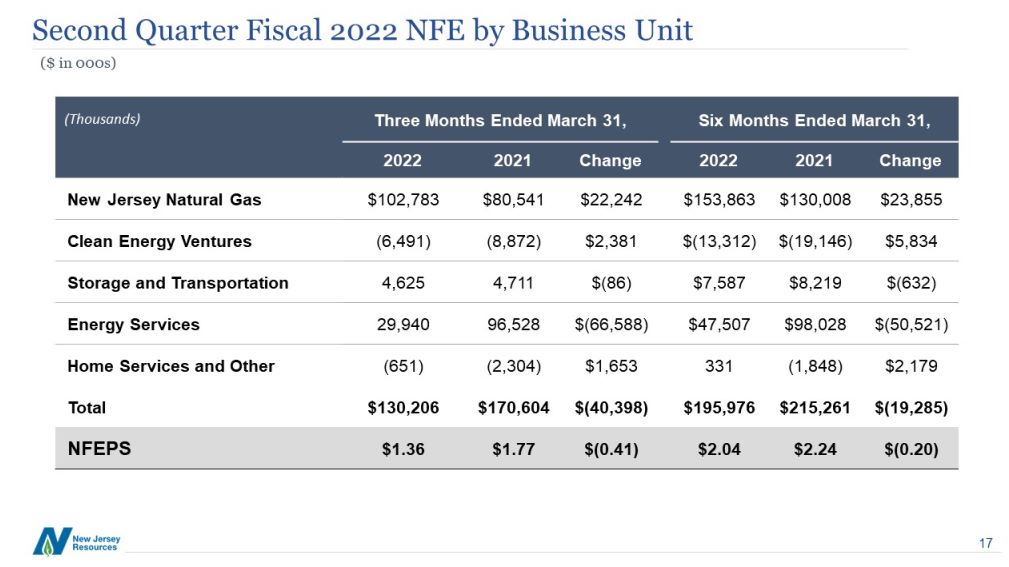
Second Quarter Fiscal 2022 NFE by Business Unit ($ in 000s) (Thousands) Three Months Ended March
31, Six Months Ended March 31, 2022 2021 Change 2022 2021 Change New Jersey Natural Gas $102,783 $80,541 $22,242 $153,863 $130,008 $23,855 Clean Energy
Ventures (6,491) (8,872) $2,381 $(13,312) $(19,146) $5,834 Storage and Transportation 4,625 4,711 $(86) $7,587 $8,219 $(632) Energy Services 29,940 96,528 $(66,588) $47,507 $98,028 $(50,521) Home Services and
Other (651) (2,304) $1,653 331 (1,848) $2,179 Total $130,206 $170,604 $(40,398) $195,976 $215,261 $(19,285) NFEPS $1.36 $1.77 $(0.41) $2.04 $2.24 $(0.20)
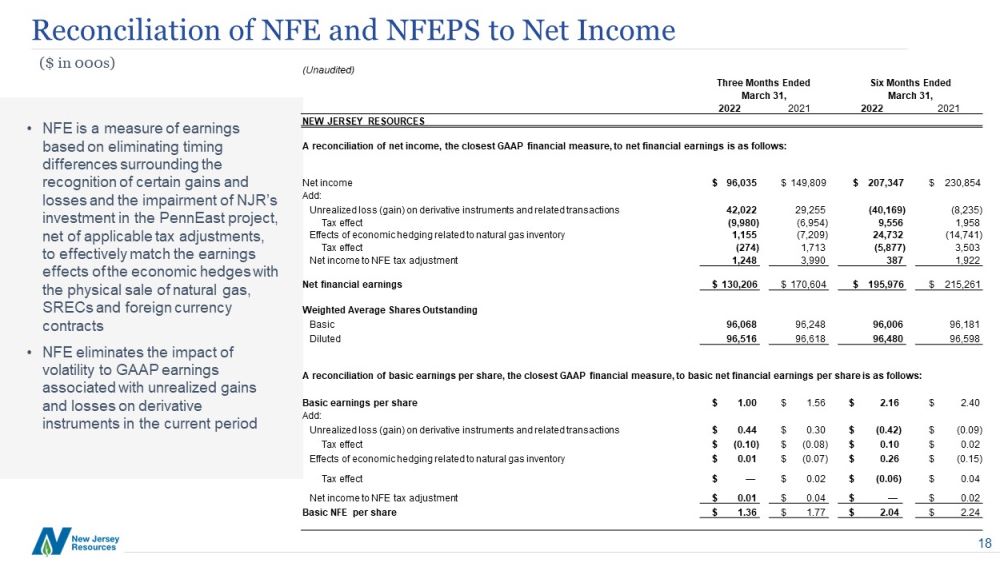
Reconciliation of NFE and NFEPS to Net Income ($ in 000s) NFE is a measure of earnings based on
eliminating timing differences surrounding the recognition of certain gains and losses and the impairment of NJR’s investment in the PennEast project, net of applicable tax adjustments, to effectively match the earnings effects of the
economic hedges with the physical sale of natural gas, SRECs and foreign currency contractsNFE eliminates the impact of volatility to GAAP earnings associated with unrealized gains and losses on derivative instruments in the current
period (Unaudited) Three Months Ended Six Months Ended March 31, March 31, 2022 2021 2022 2021 NEW JERSEY
RESOURCES A reconciliation of net income, the closest GAAP financial measure, to net financial earnings is as follows: Net income $ 96,035 $
149,809 $ 207,347 $ 230,854 Add: Unrealized loss (gain) on derivative instruments and related transactions 42,022 29,255 (40,169) (8,235) Tax effect (9,980)
(6,954) 9,556 1,958 Effects of economic hedging related to natural gas inventory 1,155 (7,209) 24,732 (14,741) Tax effect (274) 1,713 (5,877) 3,503 Net income to NFE tax
adjustment 1,248 3,990 387 1,922 Net financial earnings $ 130,206 $ 170,604 $ 195,976 $ 215,261 Weighted Average Shares
Outstanding Basic 96,068 96,248 96,006 96,181 Diluted 96,516 96,618 96,480 96,598 A reconciliation of basic earnings per share, the
closest GAAP financial measure, to basic net financial earnings per share is as follows: Basic earnings per share $ 1.00 $ 1.56 $ 2.16 $ 2.40
Add: Unrealized loss (gain) on derivative instruments and related transactions $ 0.44 $ 0.30 $ (0.42) $ (0.09) Tax effect $ (0.10) $ (0.08) $ 0.10 $ 0.02 Effects of
economic hedging related to natural gas inventory $ 0.01 $ (0.07) $ 0.26 $ (0.15) Tax effect $ — $ 0.02 $ (0.06) $ 0.04 Net income to NFE tax adjustment $ 0.01 $ 0.04 $ — $
0.02 Basic NFE per share $ 1.36 $ 1.77 $ 2.04 $ 2.24
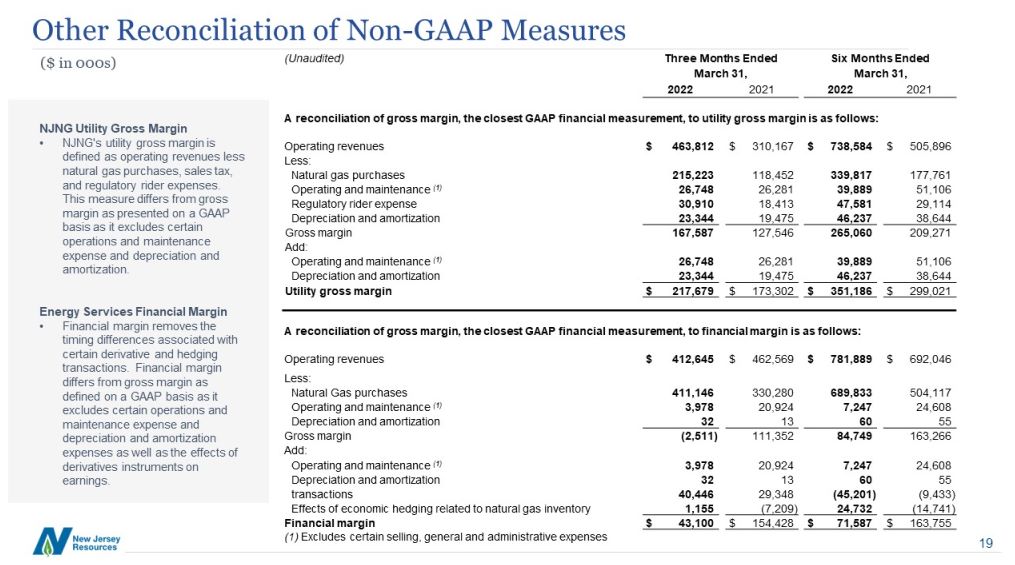
Other Reconciliation of Non-GAAP Measures ($ in 000s) NJNG Utility Gross MarginNJNG's utility gross
margin is defined as operating revenues less natural gas purchases, sales tax, and regulatory rider expenses. This measure differs from gross margin as presented on a GAAP basis as it excludes certain operations and maintenance expense and
depreciation and amortization. Energy Services Financial MarginFinancial margin removes the timing differences associated with certain derivative and hedging transactions. Financial margin differs from gross margin as defined on a GAAP basis
as it excludes certain operations and maintenance expense and depreciation and amortization expenses as well as the effects of derivatives instruments on earnings. (Unaudited) Three Months Ended Six Months Ended March
31, March 31, 2022 2021 2022 2021 A reconciliation of gross margin, the closest GAAP financial measurement, to utility gross margin is as follows: Operating revenues $
463,812 $ 310,167 $ 738,584 $ 505,896 Less: Natural gas purchases 215,223 118,452 339,817 177,761 Operating and maintenance (1) 26,748 26,281 39,889 51,106 Regulatory rider
expense 30,910 18,413 47,581 29,114 Depreciation and amortization 23,344 19,475 46,237 38,644 Gross margin 167,587 127,546 265,060 209,271 Add: Operating and maintenance
(1) 26,748 26,281 39,889 51,106 Depreciation and amortization 23,344 19,475 46,237 38,644 Utility gross margin $ 217,679 $ 173,302 $ 351,186 $ 299,021 A
reconciliation of gross margin, the closest GAAP financial measurement, to financial margin is as follows: Operating revenues $ 412,645 $ 462,569 $ 781,889 $ 692,046 Less: Natural
Gas purchases 411,146 330,280 689,833 504,117 Operating and maintenance (1) 3,978 20,924 7,247 24,608 Depreciation and amortization 32 13 60 55 Gross margin (2,511) 111,352
84,749 163,266 Add: Operating and maintenance (1) 3,978 20,924 7,247 24,608 Depreciation and amortization 32 13 60 55 transactions 40,446 29,348 (45,201)
(9,433) Effects of economic hedging related to natural gas inventory 1,155 (7,209) 24,732 (14,741) Financial margin $ 43,100 $ 154,428 $ 71,587 $ 163,755 (1) Excludes certain selling, general and
administrative expenses
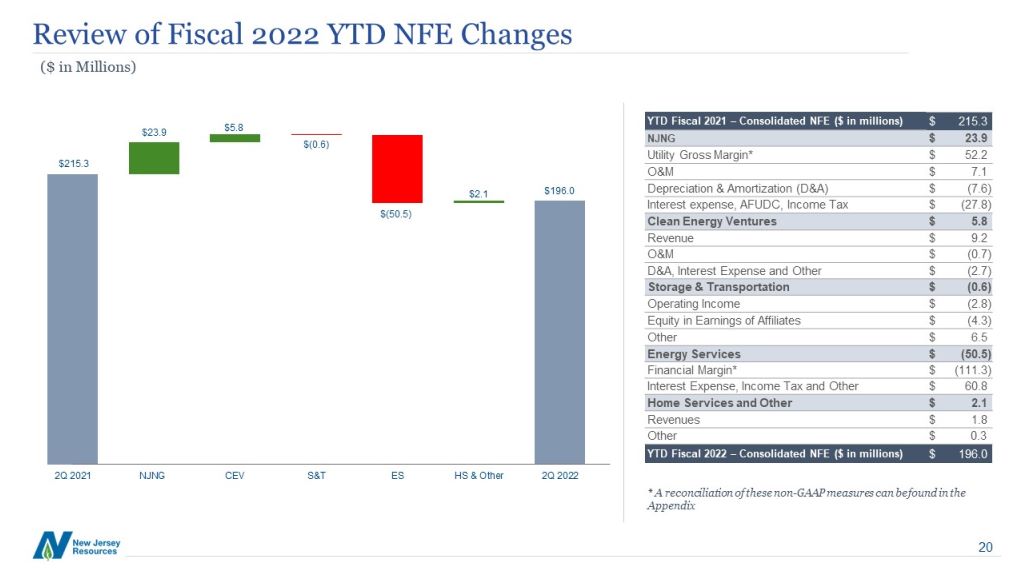
Review of Fiscal 2022 YTD NFE Changes * A reconciliation of these non-GAAP measures can be found in
the Appendix ($ in Millions) YTD Fiscal 2021 – Consolidated NFE ($ in millions) $ 215.3 NJNG $ 23.9 Utility Gross Margin* $ 52.2 O&M $ 7.1 Depreciation & Amortization (D&A) $ (7.6) Interest expense, AFUDC, Income
Tax $ (27.8) Clean Energy Ventures $ 5.8 Revenue $ 9.2 O&M $ (0.7) D&A, Interest Expense and Other $ (2.7) Storage & Transportation $ (0.6) Operating Income $ (2.8) Equity in Earnings of Affiliates $
(4.3) Other $ 6.5 Energy Services $ (50.5) Financial Margin* $ (111.3) Interest Expense, Income Tax and Other $ 60.8 Home Services and Other $ 2.1 Revenues $ 1.8 Other $ 0.3 YTD Fiscal 2022 – Consolidated NFE ($ in
millions) $ 196.0
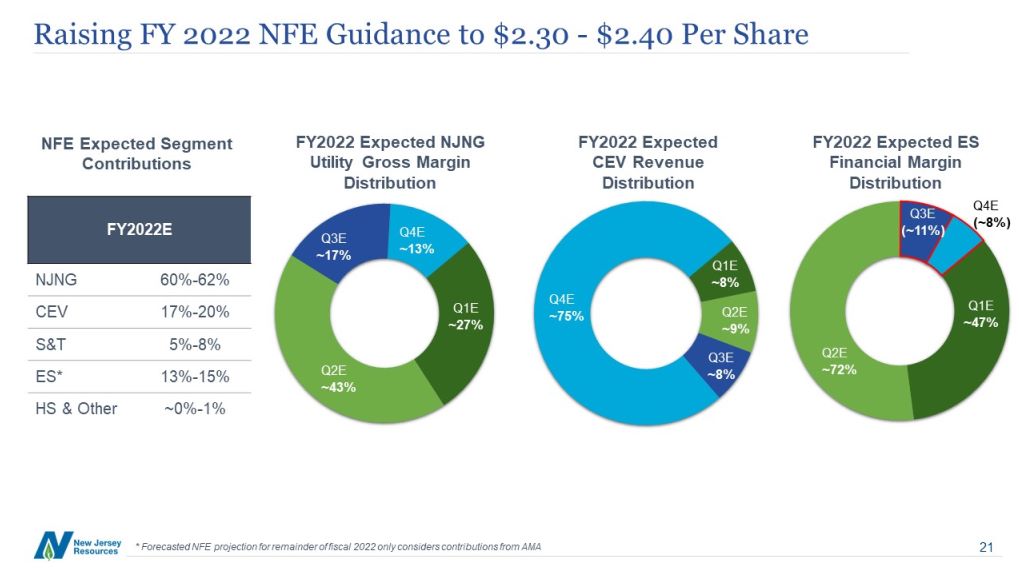
Raising FY 2022 NFE Guidance to $2.30 - $2.40 Per
Share FY2022E NJNG 60%-62% CEV 17%-20% S&T 5%-8% ES* 13%-15% HS & Other ~0%-1% FY2022 Expected NJNG Utility Gross Margin Distribution FY2022 Expected CEV Revenue Distribution NFE Expected Segment Contributions
Q1E~27% Q2E~43% Q3E~17% Q4E~13% FY2022 Expected ES Financial Margin Distribution Q1E~8% Q2E~9% Q3E~8% Q4E~75% Q1E~47% Q2E~72% Q3E(~11%) Q4E(~8%) * Forecasted NFE projection for remainder of fiscal 2022 only considers
contributions from AMA
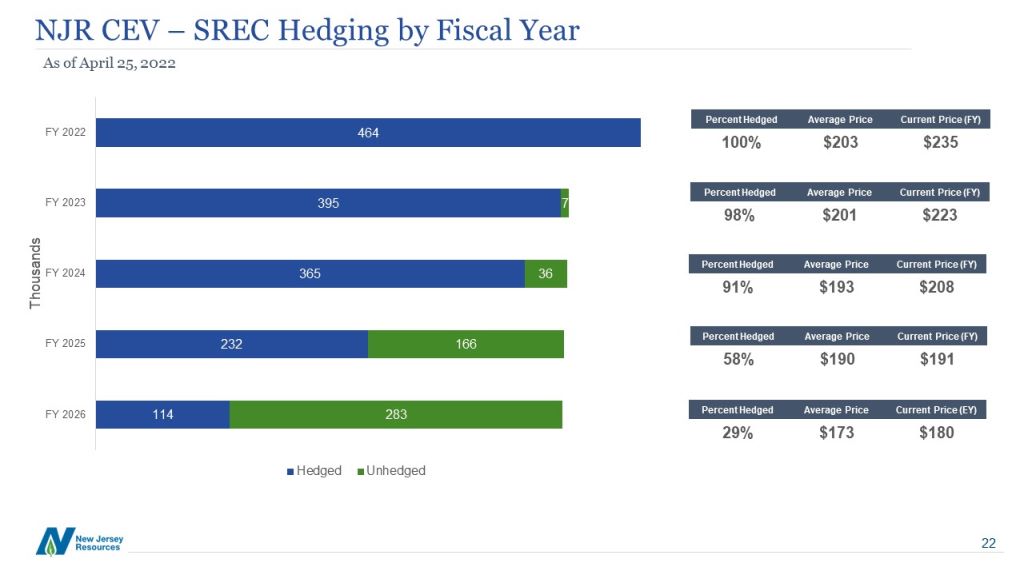
NJR CEV – SREC Hedging by Fiscal Year As of April 25, 2022 Percent Hedged Average Price Current
Price (FY) 100% $203 $235 Percent Hedged Average Price Current Price (FY) 98% $201 $223 Percent Hedged Average Price Current Price (FY) 91% $193 $208 Percent Hedged Average Price Current Price (FY) 58% $190 $191 Percent
Hedged Average Price Current Price (EY) 29% $173 $180
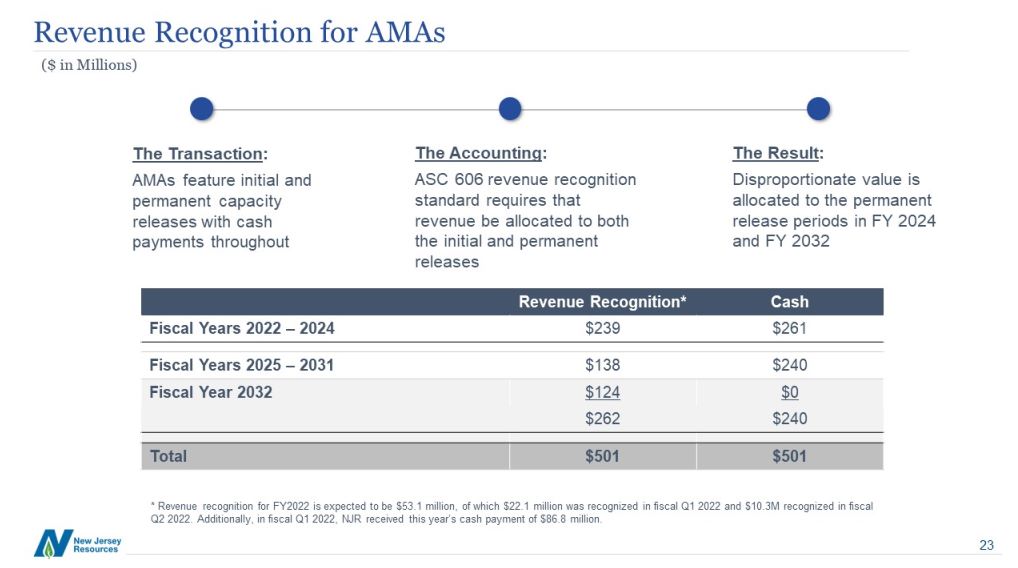
Revenue Recognition for AMAs The Transaction: AMAs feature initial and permanent capacity
releases with cash payments throughout The Accounting: ASC 606 revenue recognition standard requires that revenue be allocated to both the initial and permanent releases The Result: Disproportionate value is allocated to the permanent
release periods in FY 2024 and FY 2032 Revenue Recognition* Cash Fiscal Years 2022 – 2024 $239 $261 Fiscal Years 2025 – 2031 $138 $240 Fiscal Year 2032 $124 $0 $262 $240 Total $501 $501 * Revenue recognition
for FY2022 is expected to be $53.1 million, of which $22.1 million was recognized in fiscal Q1 2022 and $10.3M recognized in fiscal Q2 2022. Additionally, in fiscal Q1 2022, NJR received this year’s cash payment of $86.8 million. ($ in
Millions)
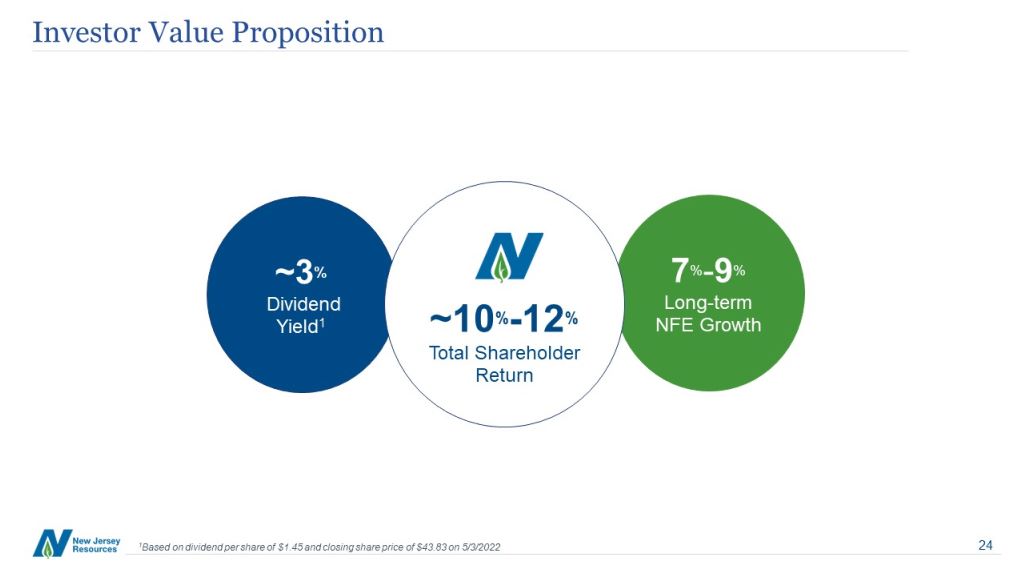
Investor Value Proposition ~3% Dividend Yield1 7%-9% Long-term NFE Growth ~10%-12% Total Shareholder
Return 1Based on dividend per share of $1.45 and closing share price of $43.83 on 5/3/2022

Leadership and Board of Directors Executive Officers Directors Patrick MigliaccioSenior Vice
President and Chief Operating OfficerNew Jersey Natural GasAmanda MullanSenior Vice President and Chief Human Resources OfficerNew Jersey ResourcesRobert PohlmanVice President - Strategy, Communications, Government Relations and PolicyRichard
ReichSenior Vice President, General Counseland Corporate Secretary, New Jersey ResourcesGinger P. RichmanVice PresidentNJR Midstream ServicesKraig SandersVice President - OperationsNew Jersey Natural GasDaniel SergottTreasurerNew Jersey
ResourcesJacqueline K. SheaVice President and Chief Information OfficerNew Jersey ResourcesMark F. ValoriVice PresidentNJR Clean Energy VenturesJohn B. WyckoffVice President - Energy DeliveryNew Jersey Natural Gas * Independent Directors**
Chairman of the Board Stephen D. WesthovenPresident and Chief Executive OfficerNew Jersey ResourcesSean AnnittoVice PresidentNJR Energy ServicesRoberto BelSenior Vice President and Chief Financial OfficerNew Jersey ResourcesJohn Bremner Vice
President – NJR MidstreamNew Jersey ResourcesAmy CradicSenior Vice President and Chief Operating Officer of Non-Utility Businesses, Strategy and External AffairsNew Jersey ResourcesDavid JohnsonVice President – Corporate Business
DevelopmentNew Jersey ResourcesMark G. KahrerSenior Vice President – Regulatory Affairs, Marketing and Energy EfficiencyNew Jersey Natural GasJames KentVice President – Corporate Risk ManagementNew Jersey ResourcesThomas J. Massaro Jr.Senior
Vice President – NJR RetailPresident – NJR Home Services Gregory E. Aliff*Partner, Deloitte & Touche LLP (Retired)Donald L. Correll*,**President and CEO (Retired), American WaterJames H. DeGraffenreidt Jr.*Chairman and CEO, WGL Holdings,
Inc. (Retired)Robert B. Evans*President and CEO, Duke Energy Americas (Retired)M. Susan Hardwick*President and CEO of American Water Works Company, Inc.Jane M. Kenny*SVP and Managing Director, The Whitman Strategy GroupThomas C.
O'Connor*Chairman, President and CEO, DCP Midstream, LLC (Retired)Sharon C. Taylor*SVP, Human Resources, Prudential Financial (Retired)David A. Trice*President and CEO (Retired), Newfield Exploration CompanyStephen D. WesthovenPresident and
CEO, NJRGeorge R. Zoffinger*President and CEO, Constellation Capital Corporation
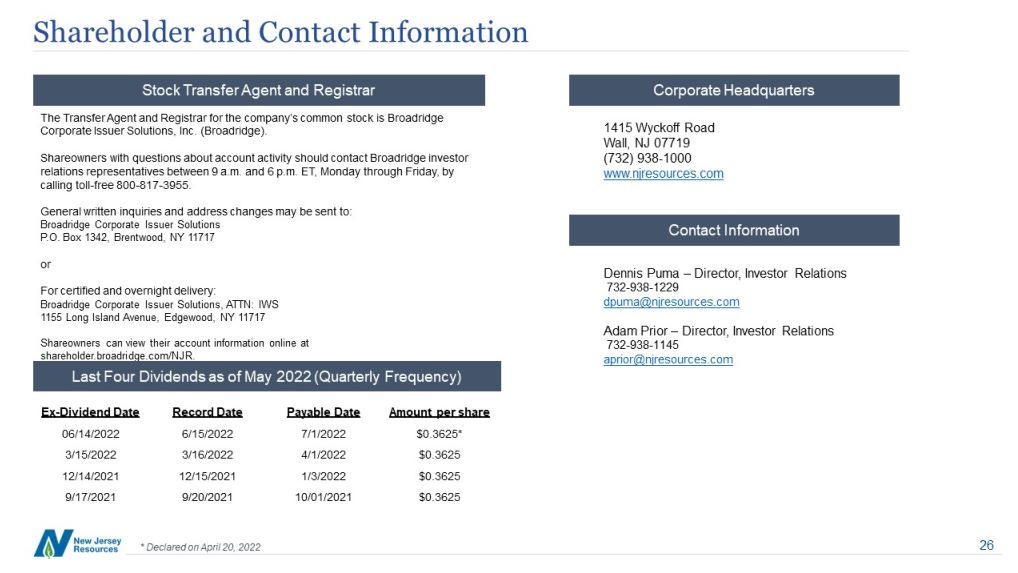
Shareholder and Contact Information 1415 Wyckoff RoadWall, NJ 07719(732)
938-1000www.njresources.com Corporate Headquarters Contact Information The Transfer Agent and Registrar for the company’s common stock is Broadridge Corporate Issuer Solutions, Inc. (Broadridge).Shareowners with questions about account
activity should contact Broadridge investor relations representatives between 9 a.m. and 6 p.m. ET, Monday through Friday, by calling toll-free 800-817-3955.General written inquiries and address changes may be sent to:Broadridge Corporate
Issuer SolutionsP.O. Box 1342, Brentwood, NY 11717orFor certified and overnight delivery:Broadridge Corporate Issuer Solutions, ATTN: IWS 1155 Long Island Avenue, Edgewood, NY 11717Shareowners can view their account information online
atshareholder.broadridge.com/NJR. Stock Transfer Agent and Registrar Dennis Puma – Director, Investor Relations [email protected] Prior – Director, Investor Relations [email protected] Last Four
Dividends as of May 2022 (Quarterly Frequency) Ex-Dividend Date Record Date Payable Date Amount per
share 06/14/2022 6/15/2022 7/1/2022 $0.3625* 3/15/2022 3/16/2022 4/1/2022 $0.3625 12/14/2021 12/15/2021 1/3/2022 $0.3625 9/17/2021 9/20/2021 10/01/2021 $0.3625 * Declared on April 20, 2022