
PANL 8-K
Pangaea Logistics Solutions Ltd. (PANL)
8-K
2020-03-23
For: 2020-03-23
View Original
Added on
April 09, 2026
UNITED STATES
SECURITIES AND EXCHANGE COMMISSION
WASHINGTON, D.C. 20549
______________
FORM 8-K
CURRENT REPORT
PURSUANT TO SECTION 13 OR 15(D) OF THE
SECURITIES EXCHANGE ACT OF 1934
Date of Report (Date of earliest event reported): March 23, 2020
PANGAEA LOGISTICS SOLUTIONS LTD.
(Exact Name of Registrant as Specified in Charter)
Bermuda | 001-36798 | N/A |
(State or Other Jurisdiction | (Commission | (IRS Employer |
of Incorporation) | File Number) | Identification No.) |
c/o Phoenix Bulk Carriers (US) LLC
109 Long Wharf, Newport, Rhode Island 02840
(Address of Principal Executive Offices) (Zip Code)
(401) 846-7790
(Registrant’s Telephone Number, Including Area Code)
Not Applicable
(Former Name or Former Address, if Changed Since Last Report)
Check the appropriate box below if the Form 8-K filing is intended to simultaneously satisfy the filing obligation of the registrant under any of the following provisions (see General Instruction A.2. below):
o | Written communications pursuant to Rule 425 under the Securities Act (17 CFR 230.425) | |
o | Soliciting material pursuant to Rule 14a-12 under the Exchange Act (17 CFR 240.14a-12) | |
o | Pre-commencement communications pursuant to Rule 14d-2(b) under the Exchange Act (17 CFR 240.14d-2(b)) | |
o | Pre-commencement communications pursuant to Rule 13e-4(c) under the Exchange Act (17 CFR 240.13e 4(c)) | |
Securities registered pursuant to Section 12(b) of the Act:
Title of each class | Trading Symbol(s) | Name of exchange on which registered |
Common Stock | PANL | NASDAQ |
Indicate by check mark whether the registrant is an emerging growth company as defined in Rule 405 of the Securities Act of 1933 (17 CFR 230.405) or Rule 12b-2 of the Securities Exchange Act of 1934 (17 CFR 240.12b-2).
Emerging growth company o
If an emerging growth company, indicate by check mark if the registrant has elected not to use the extended transition period for complying with any new or revised financial accounting standards provided pursuant to Section 13(a) of the Exchange Act. o
Item 2.02 | Results of Operations and Financial Condition. |
On March 23, 2020, Registrant issued a press release announcing financial results for the three and twelve months ended December 31, 2019 and 2018. The press release is furnished as Exhibit 99.1, its Quarterly Investor Presentation is attached as Exhibit 99.2.
The information contained in, or incorporated into, this Current Report on Form 8-K is being furnished and shall not be deemed "filed" for purposes of Section 18 of the Securities Exchange Act of 1934, as amended (the "Exchange Act"), or otherwise subject to the liabilities under that section, nor shall it be incorporated by reference in any filing under the Securities Act of 1933, as amended, or the Exchange Act, except as expressly set forth by specific reference in any such filing.
Item 9.01 | Financial Statements, Pro Forma Financial Information and Exhibits. |
(d) | Exhibits |
Exhibit | Description |
99.1 |
99.2 |
SIGNATURE
Pursuant to the requirements of the Securities Exchange Act of 1934, the registrant has duly caused this report to be signed on its behalf by the undersigned hereunto duly authorized.
Dated: March 23, 2020
PANGAEA LOGISTICS SOLUTIONS LTD. | ||
By: | /s/ Gianni Del Signore | |
Name: Gianni Del Signore Title: Chief Financial Officer | ||
Pangaea Logistics Solutions Ltd. Reports Financial Results for the
Three Months and Year Ended December 31, 2019
NEWPORT, RI - March 23, 2020 - Pangaea Logistics Solutions Ltd. (“Pangaea” or the “Company”) (NASDAQ: PANL), a global provider of comprehensive maritime logistics solutions, announced today its results for the three months and year ended December 31, 2019.
2019 Highlights
• | Net income attributable to Pangaea Logistics Solutions Ltd. of $11.7 million, as compared to $17.8 million for the year ended December 31, 2018, |
◦ | Non-GAAP adjusted Net Income attributable to Pangaea Logistics Solutions Ltd. of $18.2 million, as compared to $22.5 million for the year ended December 31, 2018 |
• | Earnings per share of $0.27 as compared to $0.42 for the year ended December 31, 2018. |
◦ | Adjusted earnings per share of $0.43 as compared to $0.53 for the year ended December 31, 2018 |
• | Cash flow from operations of $44.5 million, compared to $40.1 million for the prior year. |
• | Pangaea's TCE rates increased 1% to $14,199 from $14,019 in 2018 while the market average for the year was approximately $10,093 per day, a premium over the market of approximately 41%. |
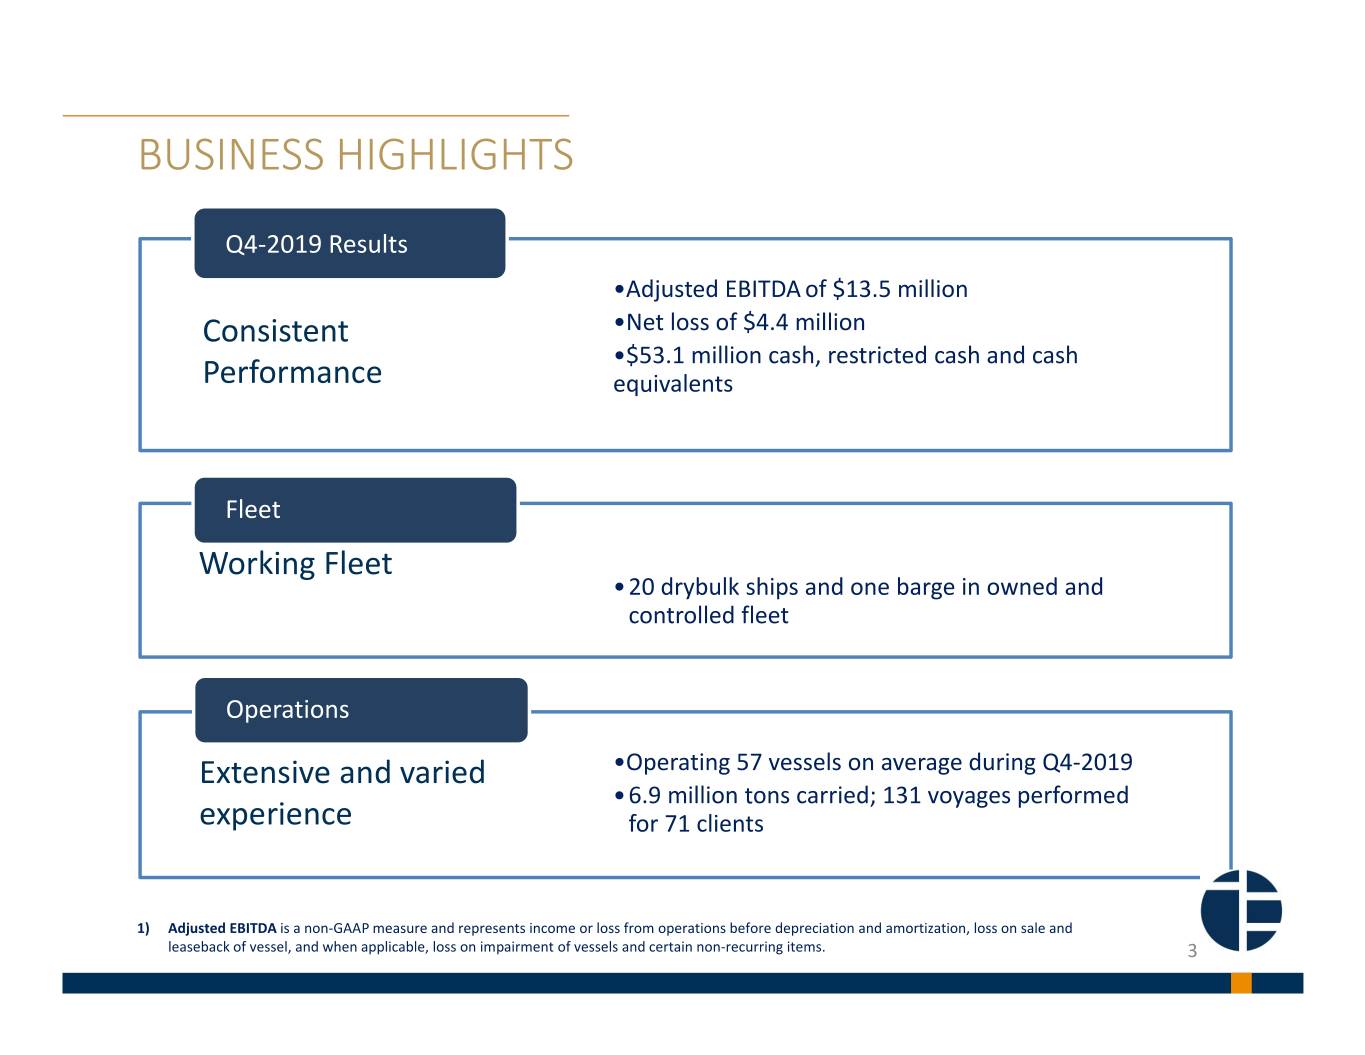
• | Adjusted EBITDA of $51.1 million for the year ended December 31, 2019. |
• | At December 31, 2019, Pangaea had $53.1 million in cash, restricted cash and cash equivalents. |
4th Quarter 2019 Highlights
• | Net loss of $4.4 million, which includes total losses on impairment and sale of vessels of $9.3 million, as compared to a net loss of $0.6 million in the same period of 2018. |
◦ | Non-GAAP adjusted net income attributable to Pangaea Logistics Solutions Ltd. of $4.4 million, as compared to $3.7 million for the same period of 2018. |
◦ | Adjusted Earnings per share of $0.10, as compared to $0.09 for the same period of 2018. |
◦ | . |
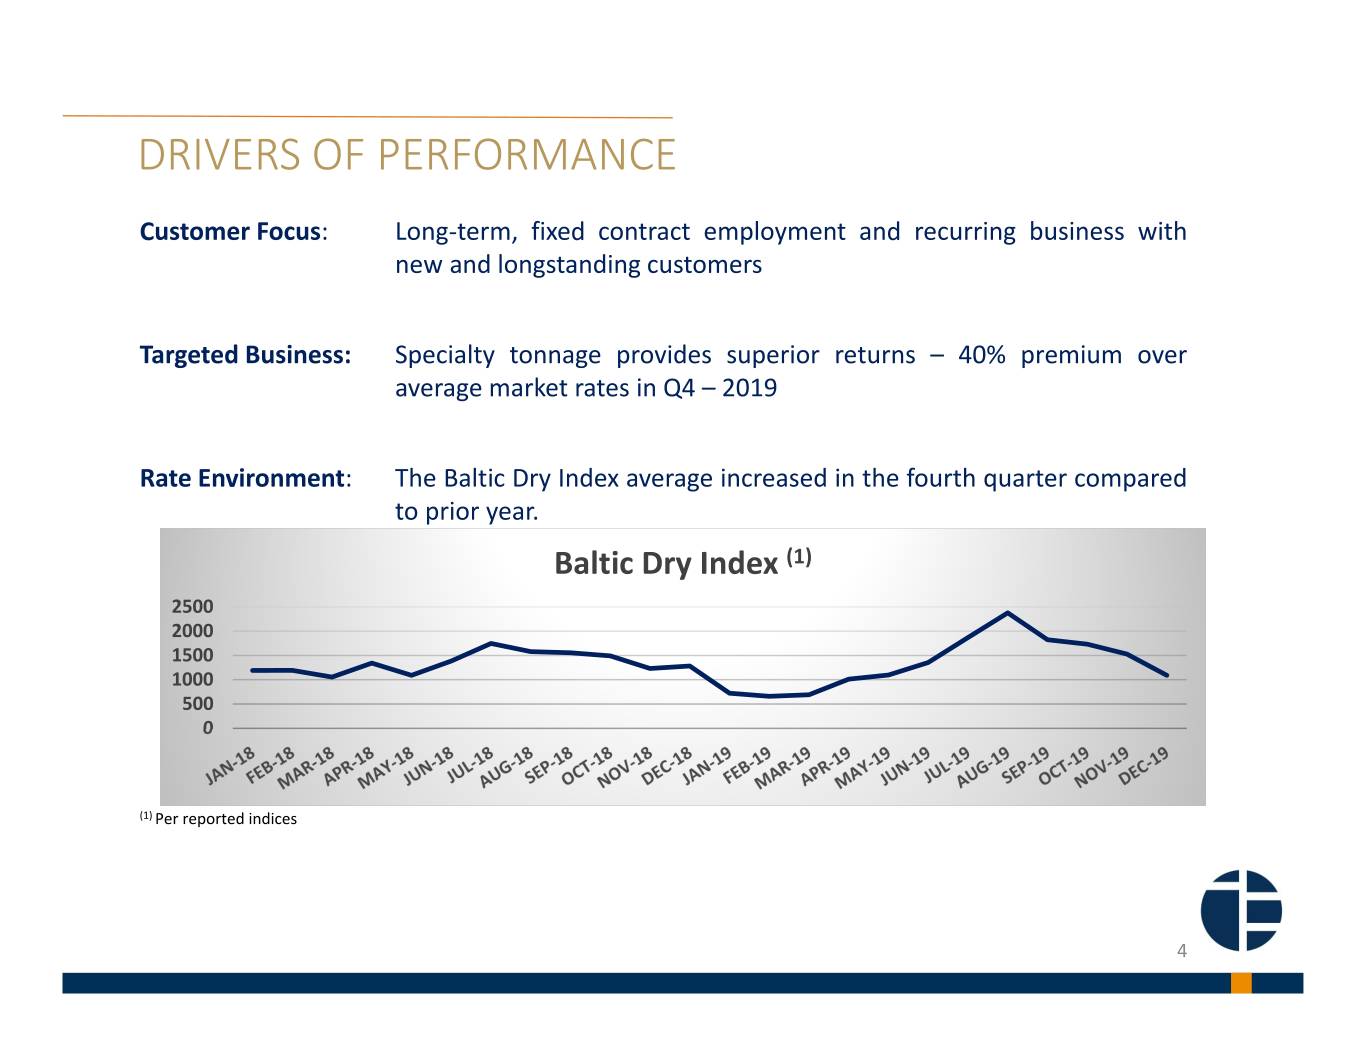
• | Pangaea's TCE rates increased 6% to $15,172 per day for the three months ended December 31, 2019 a premium over the market average of approximately 40%. |
• | Adjusted EBITDA of $13.5 million for the fourth quarter of 2019 versus $12.2 million for the same period in 2018. |
• | Net transportation and service revenue was $18.7 million in the three months ended December 31, 2018 as compared to $16.4 million in the comparable period. |
Ed Coll, Pangaea's Chief Executive Officer, commented;
"We were extremely active in 2019, a year that started and ended with a challenging dry bulk charter market. Despite this environment, we continued to operate profitably. Our $18.2 million of adjusted Net Income and $51.1 million of adjusted EBITDA, adjusted for book losses on sale and impairments, is another strong result for our Company. Our vessel activity increased substantially in the third and fourth quarters, which is traditionally our busiest time of the year. Our premiums were 41% above average market levels for 2019, continuing our industry leading performance. We also pushed forward core strategic initiatives such as our fleet renewal efforts and port logistics. We ordered four new ice class vessels in 2019 to complement our high ice class fleet of vessels that are capable of performing demanding Arctic service, and we built a temporary port and performed a test shipment of valuable ore from Greenland, less than 1,000 miles from the North Pole."
Mr. Coll added, "During the year we purchased some young secondhand vessels and, at the end of the year, we took further steps to renew our fleet by selling some older vessels, putting us in a position to renew when opportunities arise. Strong cash operating income allowed total cash to stay above $50 million at year end, despite aggressive debt amortization, the purchase of new vessels, substantial newbuilding deposits, and payment of dividends to our shareholders. Our plan to reach ashore for cargo-related contract work is moving forward, with the Brayton Point Terminal now in operation, and our stevedoring operations in the Mississippi River started on December 31, 2019. Other logistics projects are in our pipeline as we demonstrate our expertise in handling difficult challenges related to cargo movements. Collectively these efforts solidify our position and we stand ready to expand when opportunities arise."
Results for the three months and year ended December 31, 2019
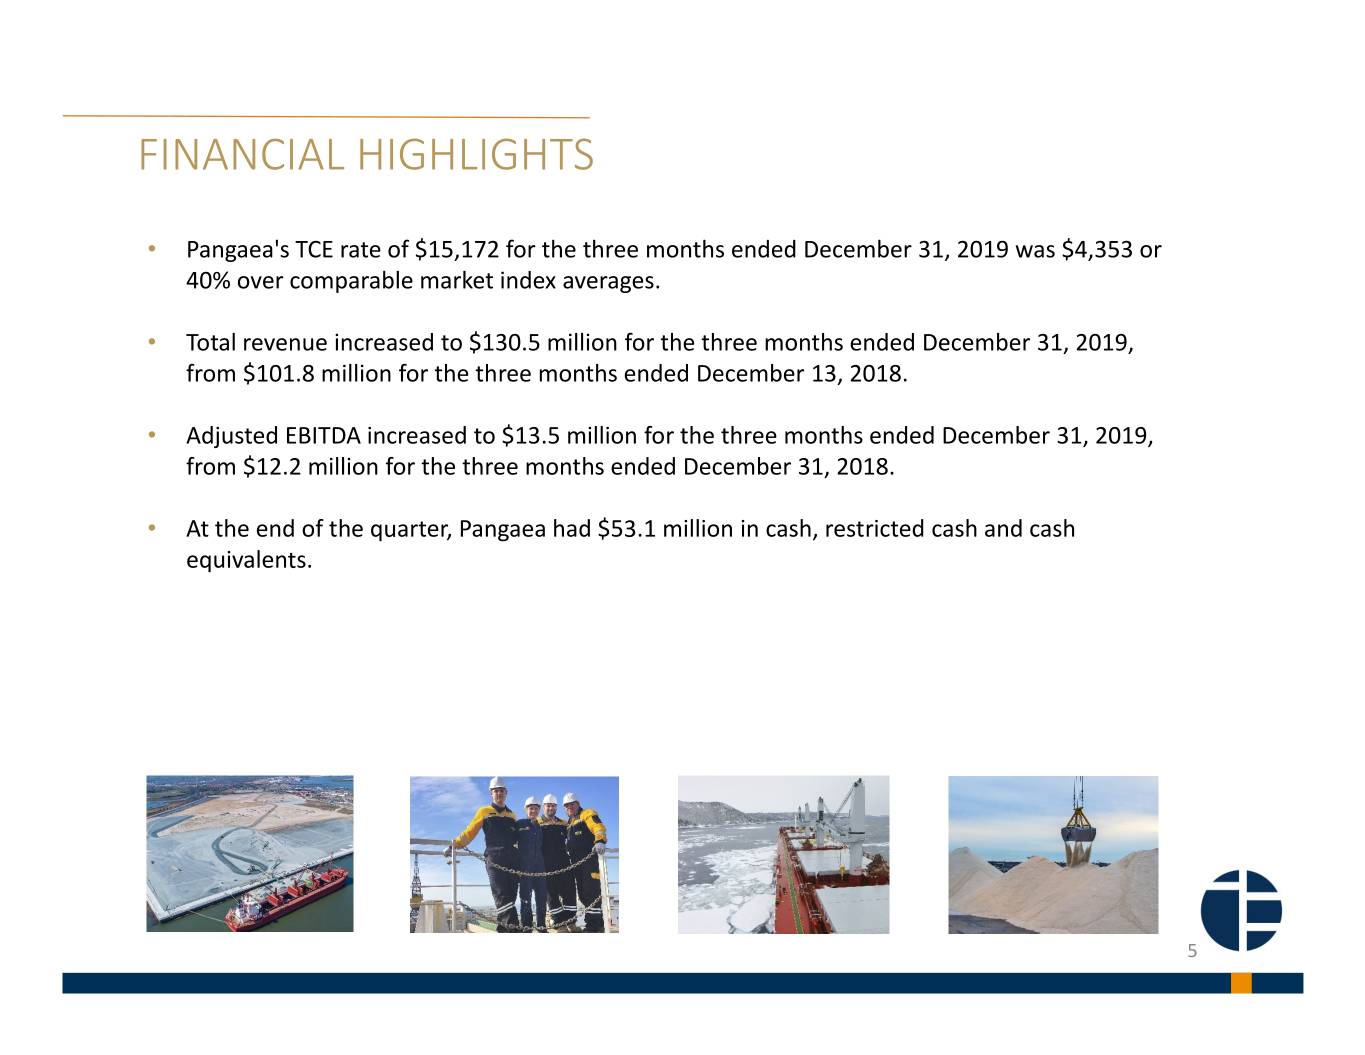
Total revenue was $130.5 million for the three months ended December 31, 2019, compared with $101.8 million for the three months ended December 31, 2018. The total number of shipping days performed increased by 22% to 5,240, compared to 4,287 days during the fourth quarter of 2018 predominantly due to the increase in voyage days.
The average TCE rate achieved was $15,172 per day for the three months ended December 31, 2019, compared to an average of $14,360 per day for the same period in 2018. The achieved premium over the average market increased to $4,353 per day or 40% for the three months ended December 31, 2019.
Total revenue was $412.2 million for the year ended December 31, 2019, compared with $373.0 million for the year ended December 31, 2018. The Company reported net income of $11.7 million or $0.27 per common share compared to net income of 17.8 million, or $0.42 per common share for the previous year. This decrease was largely driven by book loss on sale of vessels and impairments recognized in 2019. Adjusted net income was $18.2 million for 2019 compared to $22.5 million for 2018.
The average TCE rate achieved was $14,199 per day for the year ended December 31, 2019, compared to an average of $14,019 per day for the year ended December 31, 2018. The Baltic Dry Index (“BDI”), a measure of dry bulk market performance, averaged 1,329 for 2019, down from an average of 1,345 for 2018. The Company's average TCE rates increased 1% in 2019 over the average for 2018, and exceeded the published market rates by an average of 41% over the two year period.
Liquidity and Cash Flows
Cash, cash equivalents and restricted cash were $53.1 million as of December 31, 2019, compared to $56.1 million on December 31, 2018.
At December 31, 2019 and December 31, 2018, the Company had working capital of $36.1 million and $34.5 million, respectively. For the twelve months end December 31, 2019, the Company’s net cash provided by operating activities was $44.5 million, compared to $40.1 million for the twelve months ended December 31, 2018.
For the twelve months ended December 31, 2019 and 2018, net cash used in investing activities was $46.6 million and $17.5 million, respectively. For the twelve months ended December 31, 2019 and 2018, net cash used in financing activities was $0.9 million and was $5.0 million, respectively. These changes reflect the Company’s investment in newbuilding vessels, and the purchase of second hand vessels, including the m/v Bulk Spirit and m/v Bulk Friendship which were financed under the finance lease arrangements and the m/v Bulk Independence which was financed under a commercial loan facility. The financing activities also include a dividend paid to our joint venture partners of $4.7 million and dividends paid to the common stockholders of $8.1 million.
Subsequent Event
On March 20, 2020, due to the unprecedented and uncertain conditions caused by the coronavirus (COVID-19) global pandemic, and the potential impact responses might have on the Company's short term earnings and cash flow, the Board of Pangaea Logistics Solutions Ltd., as a precautionary measure, will not declare and pay a dividend for the first quarter of 2020. The Board will continue to consider a dividend on a quarterly basis as negative impacts of the global pandemic on the Company’s operations are more clearly assessed and risks are addressed or dissipate. Separately, the Board authorized a stock repurchase plan which allows for the purchase of up to $3.0 million of its common stock through December 31, 2020. The timing and number of shares repurchased under the program, if any, will be at the sole discretion of the Company subject to certain conditions approved by the board of directors.
Conference Call Details
The Company’s management team will host a conference call to discuss the Company’s financial results on March 24, 2020 at 8:00 a.m., Eastern Time (ET). To access the conference call, please dial (888) 895-3561 (domestic) or (904) 685-6494 (international) approximately ten minutes before the scheduled start time and reference ID# 9578734.
A supplemental slide presentation will accompany this quarter’s conference call and can be found attached to the Current Report on Form 8-K that the Company filed concurrently with this press release. This document will be available at http://www.pangaeals.com/company-filings or at sec.gov.
A recording of the call will also be available for two weeks and can be accessed by calling (800) 585-8367 (domestic) or (404) 537-3406 (international) and referencing ID# 9578734.
Pangaea Logistics Solutions Ltd.
Consolidated Statements of Operation
Three months ended December 31, | Twelve months ended December 31, | ||||||||||||||
2019 | 2018 | 2019 | 2018 | ||||||||||||
(unaudited) | (unaudited) | ||||||||||||||
Revenues: | |||||||||||||||
Voyage revenue | $ | 118,627,059 | $ | 85,773,670 | $ | 365,714,864 | $ | 319,753,056 | |||||||
Charter revenue | 11,850,564 | 16,055,369 | 46,482,955 | 53,217,317 | |||||||||||
Total revenue | 130,477,623 | 101,829,039 | 412,197,819 | 372,970,373 | |||||||||||
Expenses: | |||||||||||||||
Voyage expense | 50,977,508 | 40,265,848 | 165,478,629 | 145,146,359 | |||||||||||
Charter hire expense | 47,705,639 | 35,045,423 | 132,950,418 | 116,958,024 | |||||||||||
Vessel operating expenses | 13,105,772 | 10,070,292 | 45,266,464 | 39,830,110 | |||||||||||
General and administrative | 5,217,757 | 4,272,662 | 17,378,681 | 16,483,991 | |||||||||||
Depreciation and amortization | 5,008,398 | 4,480,491 | 18,529,476 | 17,620,725 | |||||||||||
Loss on impairment of vessels | 4,751,143 | — | 4,751,143 | — | |||||||||||
Loss on sale of vessels | 4,584,796 | — | 4,584,796 | — | |||||||||||
Loss on sale and leaseback of vessels | — | — | — | 860,426 | |||||||||||
Total expenses | 131,351,013 | 94,134,716 | 388,939,607 | 336,899,635 | |||||||||||
(Loss)/income from operations | (873,390 | ) | 7,694,323 | 23,258,212 | 36,070,738 | ||||||||||
Other (expense) income: | |||||||||||||||
Interest expense, net | (2,419,947 | ) | (2,310,167 | ) | (9,227,784 | ) | (8,694,481 | ) | |||||||
Interest expense, related party | (1,303 | ) | (41,414 | ) | (50,241 | ) | (202,748 | ) | |||||||
Unrealized gain/(loss) on derivative instruments | 549,935 | (4,346,456 | ) | 2,753,834 | (3,868,948 | ) | |||||||||
Other (expense)/income | (265,259 | ) | 180,272 | 314,847 | 677,085 | ||||||||||
Total other expense, net | (2,136,574 | ) | (6,517,765 | ) | (6,209,344 | ) | (12,089,092 | ) | |||||||
Net (loss)/income | (3,009,964 | ) | 1,176,558 | 17,048,868 | 23,981,646 | ||||||||||
Income attributable to noncontrolling interests | (1,388,693 | ) | (1,794,506 | ) | (5,390,910 | ) | (6,224,626 | ) | |||||||
Net (loss)/income attributable to Pangaea Logistics Solutions Ltd. | $ | (4,398,657 | ) | $ | (617,948 | ) | $ | 11,657,958 | $ | 17,757,020 | |||||
Earnings per common share: | |||||||||||||||
Basic | $ | (0.10 | ) | $ | (0.01 | ) | $ | 0.27 | $ | 0.42 | |||||
Diluted | $ | — | $ | — | $ | 0.27 | $ | 0.42 | |||||||
Weighted average shares used to compute earnings per common share | |||||||||||||||
Basic | 42,819,589 | 42,369,661 | 42,752,413 | 42,248,776 | |||||||||||
Diluted | 42,819,589 | 42,369,661 | 43,267,178 | 42,783,586 | |||||||||||
Pangaea Logistics Solutions Ltd.
Consolidated Balance Sheets
December 31, 2019 | December 31, 2018 | ||||||
Assets | |||||||
Current Assets | |||||||
Cash and cash equivalents | $ | 50,555,091 | $ | 53,614,735 | |||
Accounts receivable (net of allowance of $1,908,841 and $2,357,130 at December 31, 2019 and 2018, respectively) | 28,309,402 | 28,481,787 | |||||
Bunker inventory | 21,001,010 | 19,222,087 | |||||
Advance hire, prepaid expenses and other current assets | 18,770,825 | 12,187,551 | |||||
Vessels held for sale, net | 8,319,152 | — | |||||
Total current assets | 126,955,480 | 113,506,160 | |||||
Restricted cash | 2,500,000 | 2,500,000 | |||||
Fixed assets, net | 281,474,857 | 281,891,685 | |||||
Investment in newbuildings in-process | 15,357,189 | — | |||||
Finance lease right of use assets, net | 53,615,305 | 55,576,777 | |||||
Total assets | $ | 479,902,831 | $ | 453,474,622 | |||
Liabilities and stockholders' equity | |||||||
Current liabilities | |||||||
Accounts payable, accrued expenses and other current liabilities | $ | 39,973,635 | $ | 31,897,507 | |||
Related party notes payable | 332,987 | 2,877,746 | |||||
Deferred revenue | 14,376,394 | 14,717,072 | |||||
Current portion of long-term debt | 22,990,674 | 20,127,742 | |||||
Current portion of finance lease liabilities | 12,549,208 | 5,364,963 | |||||
Dividends payable | 631,961 | 4,063,598 | |||||
Total current liabilities | 90,854,859 | 79,048,628 | |||||
Secured long-term debt, net | 83,649,717 | 95,374,270 | |||||
Finance lease liabilities | 57,498,217 | 45,684,727 | |||||
Long-term liabilities - other | 4,828,364 | — | |||||
Stockholders' equity: | |||||||
Preferred stock, $0.0001 par value, 1,000,000 shares authorized and no share issued or outstanding | — | — | |||||
Common stock, $0.0001 par value, 100,000,000 shares authorized, 44,886,122 and 43,998,560 shares issued and outstanding at December 31, 2019 and 2018, respectively | 4,489 | 4,400 | |||||
Additional paid-in capital | 157,504,895 | 155,946,452 | |||||
Retained Earnings | 12,736,580 | 5,737,199 | |||||
Total Pangaea Logistics Solutions Ltd. equity | 170,245,964 | 161,688,051 | |||||
Non-controlling interests | 72,825,710 | 71,678,946 | |||||
Total stockholders' equity | 243,071,674 | 233,366,997 | |||||
Total liabilities and stockholders' equity | $ | 479,902,831 | $ | 453,474,622 | |||
Pangaea Logistics Solutions Ltd.
Consolidated Statements of Cash Flows
Years ended December 31, | |||||||
2019 | 2018 | ||||||
Operating activities | |||||||
Net income | $ | 17,048,868 | $ | 23,981,646 | |||
Adjustments to reconcile net income to net cash provided by operations: | |||||||
Depreciation and amortization expense | 18,529,476 | 17,620,725 | |||||
Amortization of deferred financing costs | 727,020 | 693,788 | |||||
Amortization of prepaid rent | 118,597 | 121,937 | |||||
Unrealized (gain)/loss on derivative instruments | (2,753,834 | ) | 3,868,948 | ||||
Income from equity method investee | (156,137 | ) | (224,001 | ) | |||
Earnings attributable to noncontrolling interest recorded as interest expense | 44,950 | — | |||||
Provision for doubtful accounts | 898,357 | 268,990 | |||||
Loss on impairment of vessels | 4,751,143 | — | |||||
Loss on sales of vessels | 4,584,796 | — | |||||
Loss on sales and leaseback of vessels | — | 860,426 | |||||
Drydocking costs | (1,633,771 | ) | (2,135,670 | ) | |||
Recognized cost for restricted stock issued as compensation | 1,737,315 | 1,200,214 | |||||
Change in operating assets and liabilities: | |||||||
Accounts receivable | (725,972 | ) | (7,661,352 | ) | |||
Bunker inventory | (2,425,497 | ) | (3,865,375 | ) | |||
Advance hire, prepaid expenses and other current assets | (6,247,268 | ) | 1,624,441 | ||||
Accounts payable, accrued expenses and other current liabilities | 10,301,367 | (392,160 | ) | ||||
Deferred revenue | (340,678 | ) | 4,172,392 | ||||
Net cash provided by operating activities | 44,458,732 | 40,134,949 | |||||
Investing activities | |||||||
Purchase of vessels and vessel improvements | (41,350,536 | ) | (17,126,213 | ) | |||
Proceeds from sale of vessels | 10,388,723 | — | |||||
Deposits on newbuildings in-process | (15,357,189 | ) | — | ||||
Purchase of building and equipment | (283,244 | ) | (414,922 | ) | |||
Proceeds from sale of equipment | — | 31,594 | |||||
Net cash used in investing activities | (46,602,246 | ) | (17,509,541 | ) | |||
Financing activities | |||||||
Proceeds of related party debt | — | — | |||||
Payments on related party notes payable | (2,595,000 | ) | (4,131,851 | ) | |||
Proceeds from long-term debt | 14,000,000 | — | |||||
Payments of financing and issuance costs | (2,960,899 | ) | (728,041 | ) | |||
Payments of long-term debt | (20,627,742 | ) | (21,058,742 | ) | |||
Proceeds from finance leases | 25,600,000 | 27,750,000 | |||||
Payments on finance lease obligation | (6,602,265 | ) | (3,501,589 | ) | |||
Dividends paid to non-controlling interests | (4,666,665 | ) | (904,803 | ) | |||
Common stock accrued dividends paid | (8,090,213 | ) | (2,270,000 | ) | |||
Cash paid for incentive compensation shares relinquished | (179,279 | ) | (146,647 | ) | |||
Contributions from noncontrolling interests recorded as long-term liability | 4,783,414 | — | |||||
Proceeds from private placement of common stock, net of issuance costs | — | (50,812 | ) | ||||
Net cash used in financing activities | (916,130 | ) | (5,042,485 | ) | |||
Net (decrease)/increase in cash, cash equivalents and restricted cash | (3,059,644 | ) | 17,582,923 | ||||
Cash, cash equivalents and restricted cash at beginning of period | 56,114,735 | 38,531,812 | |||||
Cash, cash equivalents and restricted cash at end of period | $ | 53,055,091 | $ | 56,114,735 | |||
Supplemental cash flow items: | |||||||
Cash paid for interest | $ | 9,250,743 | $ | 8,636,458 | |||
Pangaea Logistics Solutions Ltd.
Reconciliation of Non-GAAP Measures
For the three months ended | For the twelve months ended | ||||||||||||||
December 31, 2019 | December 31, 2018 | December 31, 2019 | December 31, 2018 | ||||||||||||
(unaudited) | (unaudited) | ||||||||||||||
Net Transportation and Service Revenue (1) | |||||||||||||||
Gross Profit | $ | 13,712,008 | $ | 11,996,943 | $ | 50,107,841 | $ | 53,527,602 | |||||||
Add: | |||||||||||||||
Vessel Depreciation and amortization | 4,976,696 | 4,450,533 | 18,394,467 | 17,508,278 | |||||||||||
Net transportation and service revenue | $ | 18,688,704 | $ | 16,447,476 | $ | 68,502,308 | $ | 71,035,880 | |||||||
Adjusted EBITDA (in millions) | |||||||||||||||
(Loss)/income from operations | $ | (873,390 | ) | $ | 7,694,323 | $ | 23,258,212 | $ | 36,070,738 | ||||||
Depreciation and amortization | 5,008,398 | 4,480,491 | 18,529,476 | 17,620,725 | |||||||||||
Loss on impairment of vessels | 4,751,143 | — | 4,751,143 | — | |||||||||||
Loss on sale of vessels | 4,584,796 | — | 4,584,796 | — | |||||||||||
Loss on sale and leaseback of vessel | — | — | — | 860,426 | |||||||||||
Adjusted EBITDA | $ | 13,470,947 | $ | 12,174,814 | $ | 51,123,627 | $ | 54,551,889 | |||||||
Earnings Per Common Share | |||||||||||||||
Net (loss)/Income attributable to Pangaea Logistics Solutions Ltd. | $ | (4,398,657 | ) | $ | (617,948 | ) | $ | 11,657,958 | $ | 17,757,020 | |||||
Weighted average number of common shares - basic | 42,819,589 | 42,369,661 | 42,752,413 | 42,248,776 | |||||||||||
Weighted average number of common shares - diluted | 42,819,589 | 42,369,661 | 43,267,178 | 42,783,586 | |||||||||||
Earnings per common share - basic | $ | (0.10 | ) | $ | (0.01 | ) | $ | 0.27 | $ | 0.42 | |||||
Earnings per common share - diluted | $ | — | $ | — | $ | 0.27 | $ | 0.42 | |||||||
Adjusted EPS | |||||||||||||||
Net Income attributable to Pangaea Logistics Solutions Ltd. | $ | (4,398,657 | ) | $ | (617,948 | ) | $ | 11,657,958 | $ | 17,757,020 | |||||
Non-GAAP | |||||||||||||||
Add: | |||||||||||||||
Loss on impairment of vessels | 4,751,143 | — | 4,751,143 | — | |||||||||||
Loss on sale of vessels | 4,584,796 | — | 4,584,796 | — | |||||||||||
Loss on sale and leaseback of vessels | — | — | — | 860,426 | |||||||||||
Unrealized gain/(loss) on derivative instruments | 549,935 | (4,346,456 | ) | 2,753,834 | (3,868,948 | ) | |||||||||
Non-GAAP adjusted net income attributable to Pangaea Logistics Solutions Ltd. | $ | 4,387,347 | $ | 3,728,508 | $ | 18,240,063 | $ | 22,486,394 | |||||||
Weighted average number of common shares - basic | 42,819,589 | 42,369,661 | 42,752,413 | 42,248,776 | |||||||||||
Weighted average number of common shares - diluted | 42,819,589 | 42,369,661 | 43,267,178 | 42,783,586 | |||||||||||
Adjusted EPS - basic | $ | 0.10 | $ | 0.09 | $ | 0.43 | $ | 0.53 | |||||||
Adjusted EPS - diluted | $ | 0.10 | $ | 0.09 | $ | 0.42 | $ | 0.53 | |||||||
INFORMATION ABOUT NON-GAAP FINANCIAL MEASURES. As used herein, “GAAP” refers to accounting principles generally accepted in the United States of America. To supplement our consolidated financial statements prepared and presented in accordance with GAAP, this earnings release discusses non-GAAP financial measures, including non-GAAP net revenue, non-GAAP adjusted EBITDA and non-GAAP Adjusted EPS. These are considered non-GAAP financial measures as defined in Rule 101 of Regulation G promulgated by the Securities and Exchange Commission. Generally, a non-GAAP financial measure is a numerical measure of a company’s historical or future performance, financial position, or cash flows that either excludes or includes amounts that are not normally excluded or included in the most directly comparable measure calculated and presented in accordance with GAAP. The presentation of this non-GAAP financial information is not intended to be considered in isolation or as a substitute for, or superior to, the financial information prepared and presented in accordance with GAAP.
We use non-GAAP financial measures for internal financial and operational decision making purposes and as a means to evaluate period-to-period comparisons of the performance and results of operations of our core business. Our management believes that non-GAAP financial measures provide meaningful supplemental information regarding the performance of our core business by excluding charges that are not incurred in the normal course of business. Non-GAAP financial measures also facilitate management's internal planning and comparisons to our historical performance and liquidity. We believe certain non-GAAP financial measures are useful to investors as they allow for greater transparency with respect to key metrics used by management in its financial and operational decision making and are used by our institutional investors and the analyst community to help them analyze the performance and operational results of our core business.
Net transportation and service revenue. Net transportation and service revenue represents total revenue less the total direct costs of transportation and services, which includes charter hire, voyage and vessel operating expenses. Net transportation and service revenue is included because it is used by management and certain investors to measure performance by comparison to other logistic service providers. Net transportation and service revenue is not an item recognized by the generally accepted accounting principles in the United States of America, or U.S. GAAP, and should not be considered as an alternative to net income, operating income, or any other indicator of a company's operating performance required by U.S. GAAP. Pangaea’s definition of net transportation and service revenue used here may not be comparable to an operating measure used by other companies.
Adjusted EBITDA and adjusted EPS. Adjusted EBITDA represents income or loss from operations before depreciation, amortization and, when applicable, loss on sale and leaseback of vessel, loss on impairment of vessels and certain non-recurring charges. Earnings per share represents net income divided by the weighted average number of common shares outstanding. Adjusted earnings per share represents net income attributable to Pangaea Logistics Solutions Ltd. plus, when applicable, loss on sale of vessel, loss on sale and leaseback of vessel, loss on impairment of vessel, unrealized gains and losses on derivative instruments, and certain non-recurring charges, divided by the weighted average number of shares of common stock.
There are limitations related to the use of net revenue versus income from operations, adjusted EBITDA versus income from operations, and adjusted EPS versus EPS calculated in accordance with GAAP. In particular, Pangaea’s definition of adjusted EBITDA used here are not comparable to EBITDA.
The table set forth above provides a reconciliation of the non-GAAP financial measures presented to the most directly comparable financial measures prepared in accordance with GAAP.
About Pangaea Logistics Solutions Ltd.
Pangaea Logistics Solutions Ltd. (NASDAQ: PANL) provides logistics services to a broad base of industrial customers who require the transportation of a wide variety of dry bulk cargoes, including grains, pig iron, hot briquetted iron, bauxite, alumina, cement clinker, dolomite, and limestone. The Company addresses the transportation needs of its customers with a comprehensive set of services and activities, including cargo loading, cargo discharge, vessel chartering, and voyage planning. Learn more at www.pangaeals.com.
Investor Relations Contacts
Sean Silva | Tiya Gulanikar | |
Prosek Partners | Prosek Partners | |
646-818-9122 | 646-818-9288 | |
Forward-Looking Statements
Certain statements in this press release are “forward-looking statements” within the meaning of the Private Securities Litigation Act of 1995. These forward-looking statements are based on our current expectations and beliefs and are subject to a number of risk factors and uncertainties that could cause actual results to differ materially from those described in the forward-looking statements. The Company disclaims any obligation to publicly update or revise these statements whether as a result of new information, future events or otherwise, except as required by law. Such risks and uncertainties include, without limitation, the strength of world economies and currencies, general market conditions, including fluctuations in charter rates and vessel values, changes in demand for dry bulk shipping capacity, changes in our operating expenses, including bunker prices, dry-docking and insurance costs, the market for our vessels, availability of financing and refinancing, charter counterparty performance, ability to obtain financing and comply with covenants in such financing arrangements, changes in governmental rules and regulations or actions taken by regulatory authorities, potential liability from pending or future litigation, general domestic and international political conditions, potential disruption of shipping routes due to accidents or political events, vessels breakdowns and instances of off-hires and other factors, as well as other risks that have been included in filings with the Securities and Exchange Commission, all of which are available at www.sec.gov.

FOURTH QUARTER 2019 EARNINGS CONFERENCE CALL PRESENTATION 1
SAFE HARBOR This presentation includes certain forward-looking statements within the meaning of the Private Securities Litigation Reform Act of 1995, including statements regarding future financial performance, future growth and future acquisitions. These statements are based on Pangaea’s and managements’ current expectations or beliefs and are subject to uncertainty and changes in circumstances. Actual results may vary materially from those expressed or implied by the statements herein due to changes in economic, business, competitive and/or regulatory factors, and other risks and uncertainties affecting the operation of Pangaea’s business. These risks, uncertainties and contingencies include: business conditions; weather and natural disasters; changing interpretations of GAAP; outcomes of government reviews; inquiries and investigations and related litigation; continued compliance with government regulations; legislation or regulatory environments; requirements or changes adversely affecting the business in which Pangaea is engaged; fluctuations in customer demand; management of rapid growth; intensity of competition from other providers of logistics and shipping services; general economic conditions; geopolitical events and regulatory changes; and other factors set forth in Pangaea’s filings with the Securities and Exchange Commission and the filings of its predecessors. The information set forth herein should be read in light of such risks. Further, investors should keep in mind that certain of Pangaea’s financial results are unaudited and do not conform to SEC Regulation S-X and as a result such information may fluctuate materially depending on many factors. Accordingly, Pangaea’s financial results in any particular period may not be indicative of future results. Pangaea is not under any obligation to, and expressly disclaims any obligation to, update or alter its forward-looking statements, whether as a result of new information, future events, changes in assumptions or otherwise. 2
BUSINESS HIGHLIGHTS Q4‐2019 Results •Adjusted EBITDA of $13.5 million Consistent •Net loss of $4.4 million •$53.1 million cash, restricted cash and cash Performance equivalents Fleet Working Fleet •20 drybulk ships and one barge in owned and controlled fleet Operations Extensive and varied •Operating 57 vessels on average during Q4‐2019 •6.9 million tons carried; 131 voyages performed experience for 71 clients 1) Adjusted EBITDA is a non‐GAAP measure and represents income or loss from operations before depreciation and amortization, loss on sale and leaseback of vessel, and when applicable, loss on impairment of vessels and certain non‐recurring items. 3
DRIVERS OF PERFORMANCE Customer Focus:Long‐term, fixed contract employment and recurring business with new and longstanding customers Targeted Business: Specialty tonnage provides superior returns – 40% premium over average market rates in Q4 – 2019 Rate Environment: The Baltic Dry Index average increased in the fourth quarter compared to prior year. Baltic Dry Index (1) 2500 2000 1500 1000 500 0 (1) Per reported indices 4
FINANCIAL HIGHLIGHTS • Pangaea's TCE rate of $15,172 for the three months ended December 31, 2019 was $4,353 or 40% over comparable market index averages. • Total revenue increased to $130.5 million for the three months ended December 31, 2019, from $101.8 million for the three months ended December 13, 2018. • Adjusted EBITDA increased to $13.5 million for the three months ended December 31, 2019, from $12.2 million for the three months ended December 31, 2018. • At the end of the quarter, Pangaea had $53.1 million in cash, restricted cash and cash equivalents. 5
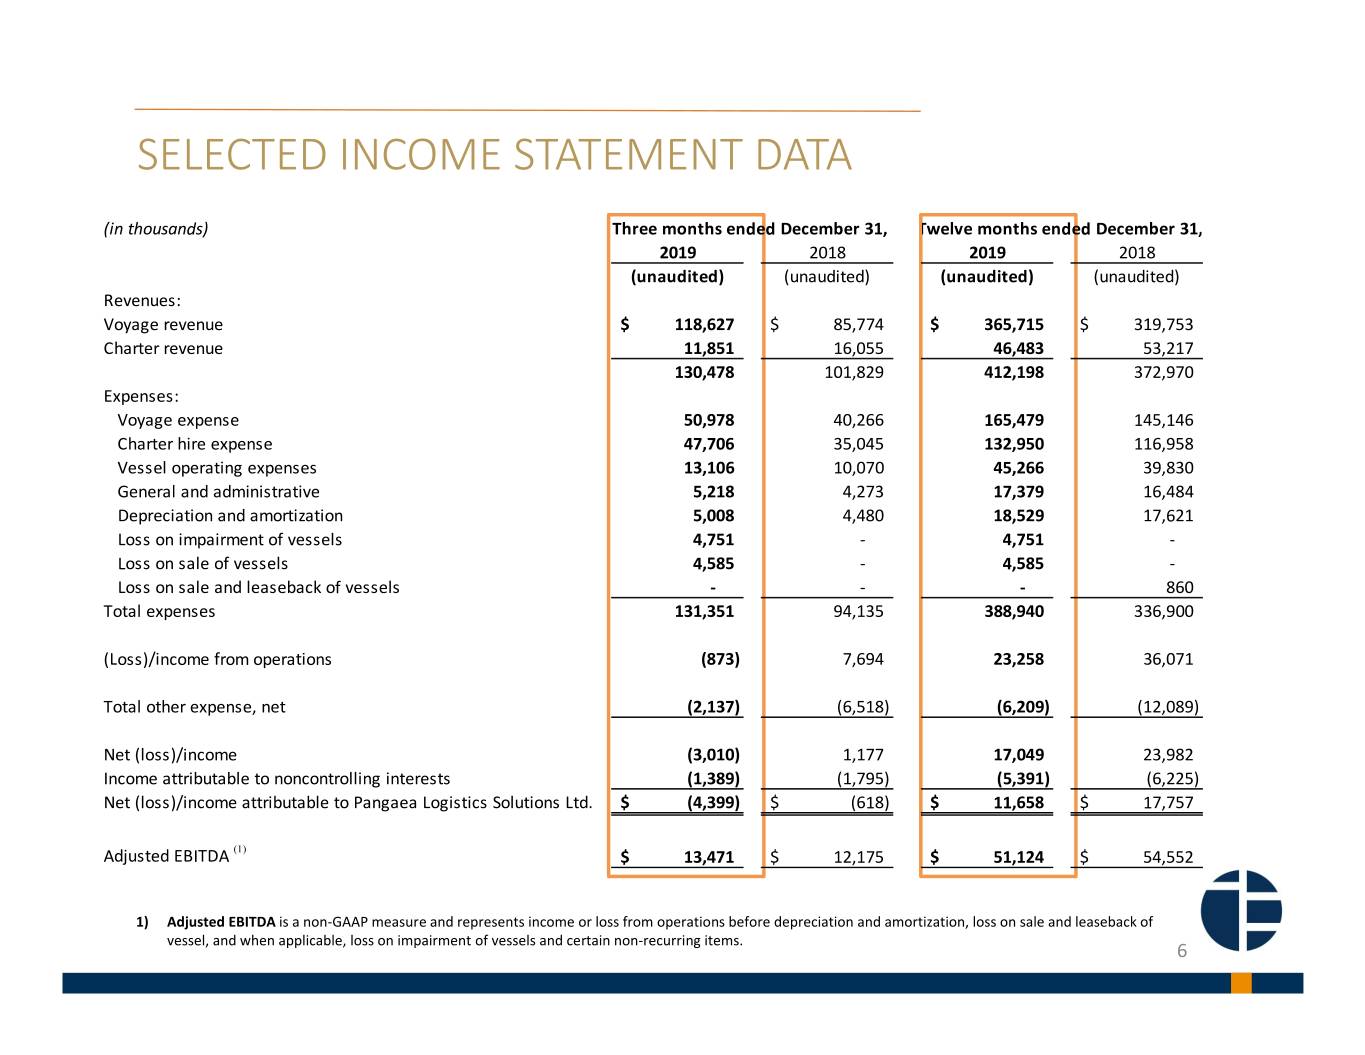
SELECTED INCOME STATEMENT DATA (in thousands) Three months ended December 31, Twelve months ended December 31 , 2019 2018 2019 2018 (unaudited) (unaudited) (unaudited) (unaudited) Revenues: Voyage revenue $ 118,627 $ 85,774 $ 365,715 $ 319,753 Charter revenue 11,851 16,055 46,483 53,217 130,478 101,829 412,198 372,970 Expenses: Voyage expense 50,978 40,266 165,479 145,146 Charter hire expense 47,706 35,045 132,950 116,958 Vessel operating expenses 13,106 10,070 45,266 39,830 General and administrative 5,218 4,273 17,379 16,484 Depreciation and amortization 5,008 4,480 18,529 17,621 Loss on impairment of vessels 4,751 ‐ 4,751 ‐ Loss on sale of vessels 4,585 ‐ 4,585 ‐ Loss on sale and leaseback of vessels ‐ ‐ ‐ 860 Total expenses 131,351 94,135 388,940 336,900 (Loss)/income from operations (873) 7,694 23,258 36,071 Total other expense, net (2,137) (6,518) (6,209) (12,089) Net (loss)/income (3,010) 1,177 17,049 23,982 Income attributable to noncontrolling interests (1,389) (1,795) (5,391) (6,225) Net (loss)/income attributable to Pangaea Logistics Solutions Ltd. $ (4,399) $ (618) $ 11,658 $ 17,757 (1) Adjusted EBITDA $ 13,471 $ 12,175 $ 51,124 $ 54,552 1) Adjusted EBITDA is a non‐GAAP measure and represents income or loss from operations before depreciation and amortization, loss on sale and leaseback of vessel, and when applicable, loss on impairment of vessels and certain non‐recurring items. 6
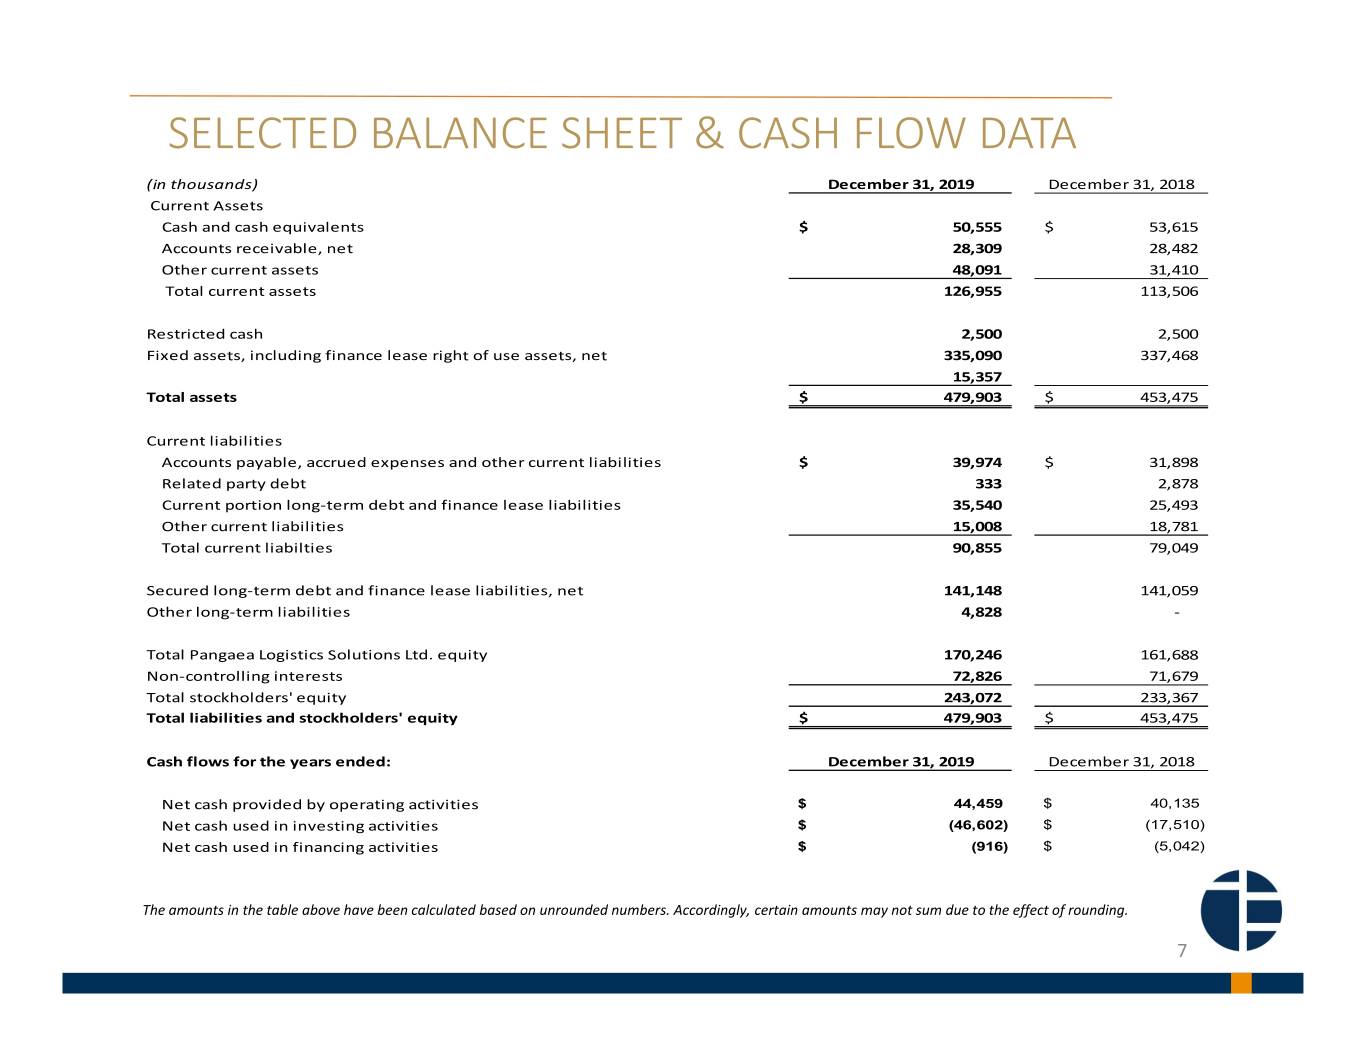
SELECTED BALANCE SHEET & CASH FLOW DATA (in thousands) December 31, 2019 December 31, 2018 Current Assets Cash and cash equivalents $ 50,555 $ 53,615 Accounts receivable, net 28,309 28,482 Other current assets 48,091 31,410 Total current assets 126,955 113,506 Restricted cash 2,500 2,500 Fixed assets, including finance lease right of use assets, net 335,090 337,468 15,357 Total assets Current liabilities $ 479,903 $ 453,475 Accounts payable, accrued expenses and other current liabilities $ 39,974 $ 31,898 Related party debt 333 2,878 Current portion long‐term debt and finance lease liabilities 35,540 25,493 Other current liabilities 15,008 18,781 Total current liabilties 90,855 79,049 4,828 ‐ Secured long‐term debt and finance lease liabilities, net 141,148 141,059 TotalOther Pangaea long ‐Logisticsterm liabilities Solutions Ltd. equity 170,246 161,688 Non‐controlling interests 72,826 71,679 Total stockholders' equity 243,072 233,367 Total liabilities and stockholders' equity$ 479,903 $ 453,475 Cash flows for the years ended:$ December 31, 2019 44,459 $December 31, 40,135 2018 Net cash used in investing activities $ (46,602) $ (17,510) Net cash used in financing activities $ (916) $ (5,042) Net cash provided by operating activities The amounts in the table above have been calculated based on unrounded numbers. Accordingly, certain amounts may not sum due to the effect of rounding. 7
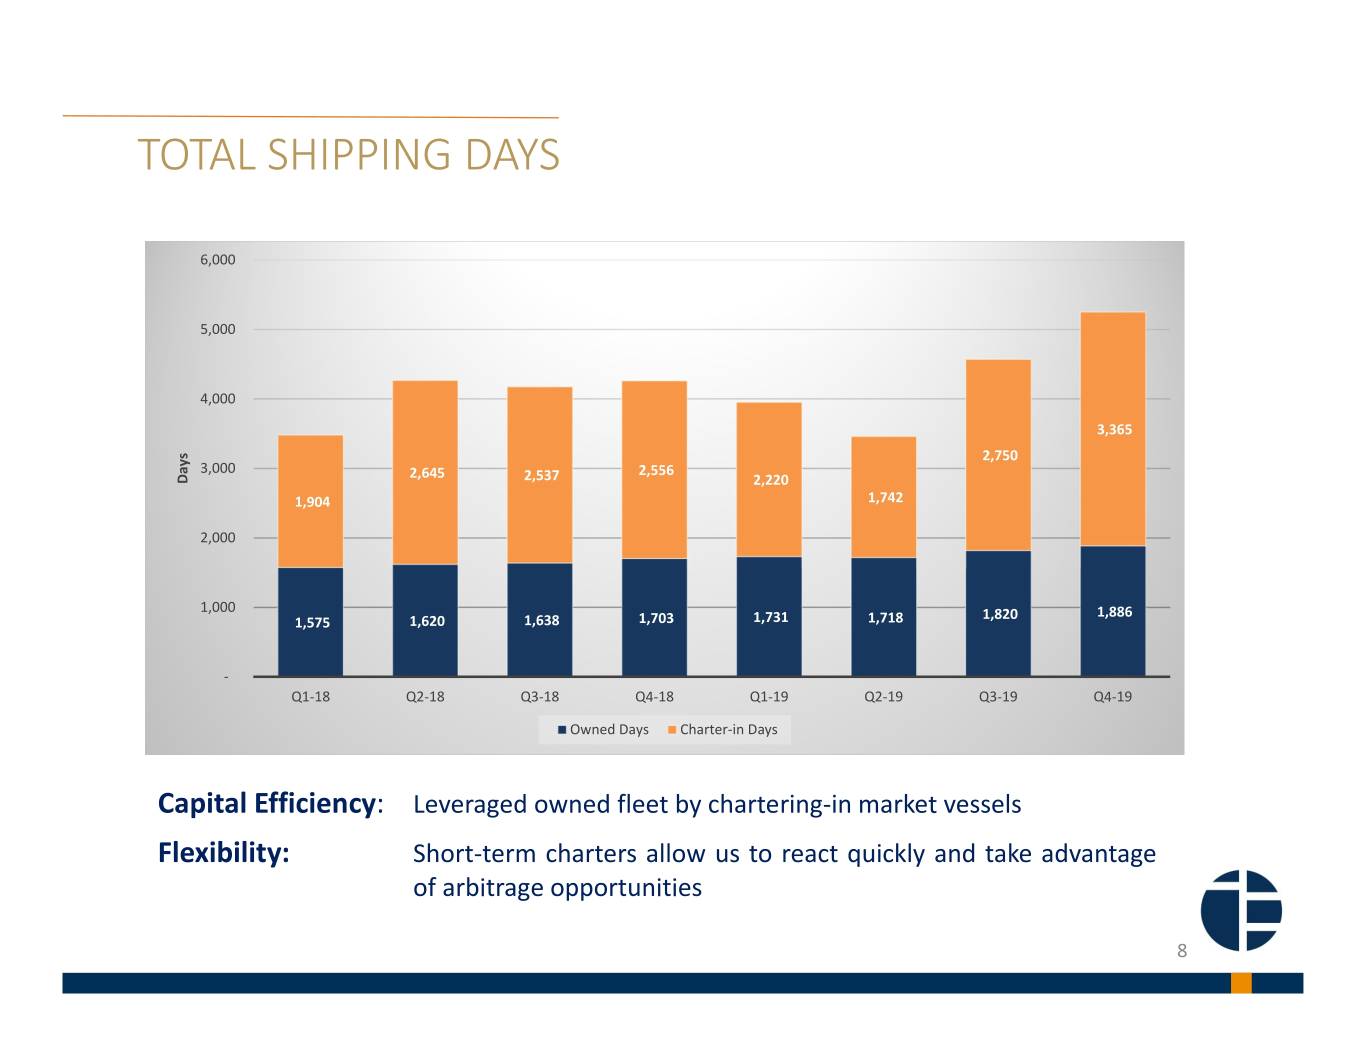
TOTAL SHIPPING DAYS 6,000 5,000 4,000 3,365 2,750 3,000 2,645 2,556 Days 2,537 2,220 1,904 1,742 2,000 1,000 1,820 1,886 1,575 1,620 1,638 1,703 1,731 1,718 ‐ Q1‐18 Q2‐18 Q3‐18 Q4‐18 Q1‐19 Q2‐19 Q3‐19 Q4‐19 Owned Days Charter‐in Days Capital Efficiency: Leveraged owned fleet by chartering‐in market vessels Flexibility: Short‐term charters allow us to react quickly and take advantage of arbitrage opportunities 8
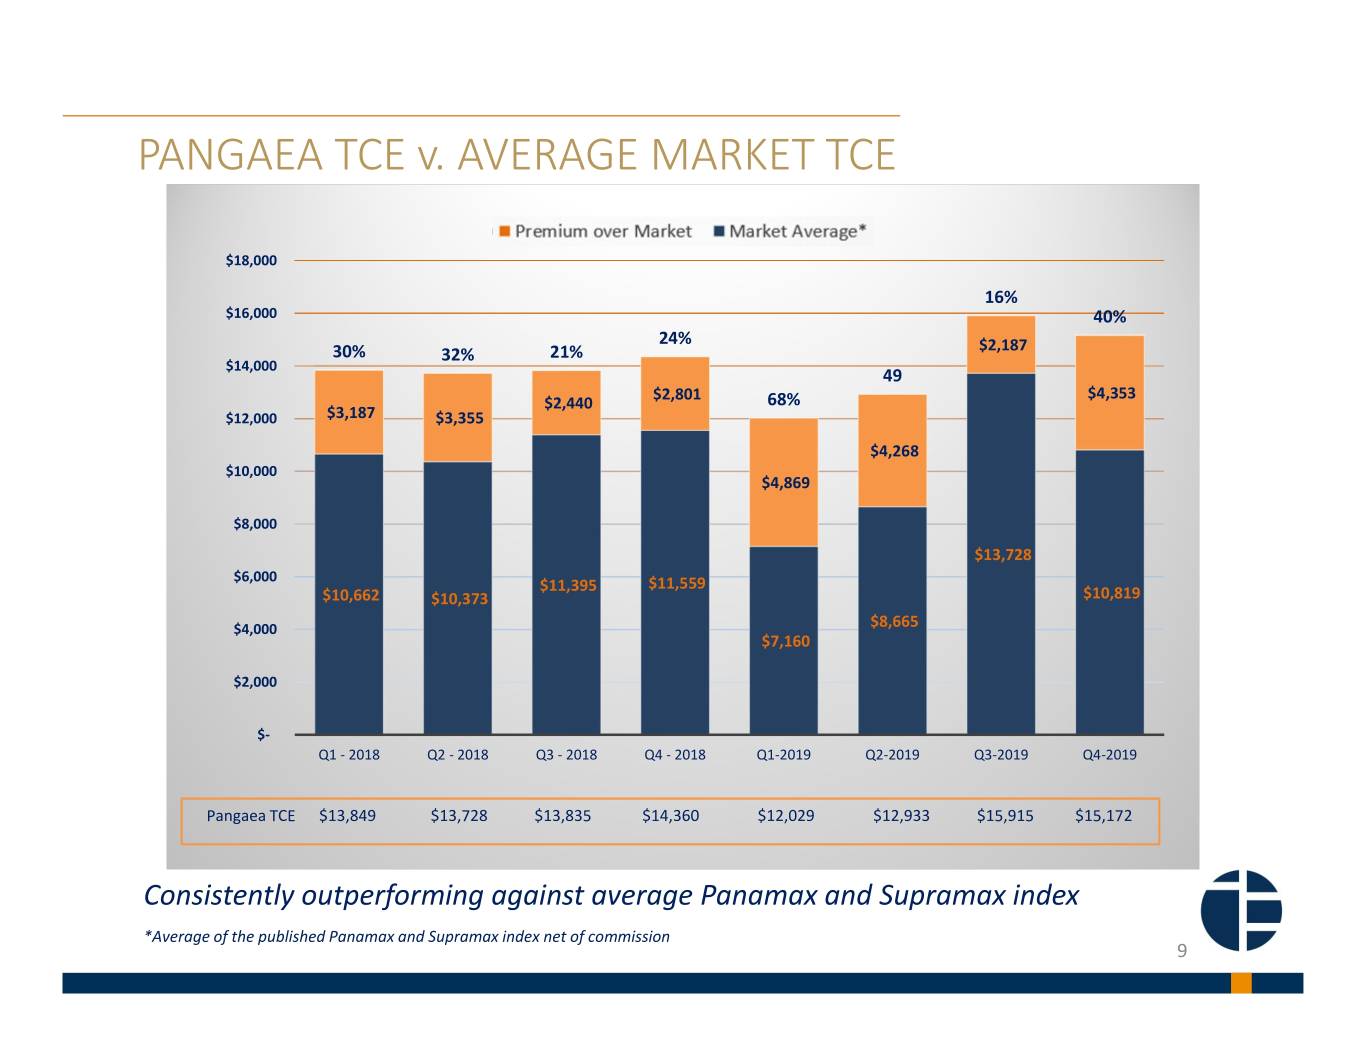
PANGAEA TCE v. AVERAGE MARKET TCE $18,000 16% $16,000 40% 24% $2,187 30% 32% 21% $14,000 49 $2,801 $4,353 $2,440 68% $12,000 $3,187 $3,355 $4,268 $10,000 $4,869 $8,000 $13,728 $6,000 $11,395 $11,559 $10,662 $10,373 $10,819 $4,000 $8,665 $7,160 $2,000 $‐ Q1 ‐ 2018 Q2 ‐ 2018 Q3 ‐ 2018 Q4 ‐ 2018 Q1‐2019 Q2‐2019 Q3‐2019 Q4‐2019 Pangaea TCE $13,849 $13,728 $13,835 $14,360 $12,029 $12,933 $15,915 $15,172 Consistently outperforming against average Panamax and Supramax index *Average of the published Panamax and Supramax index net of commission 9
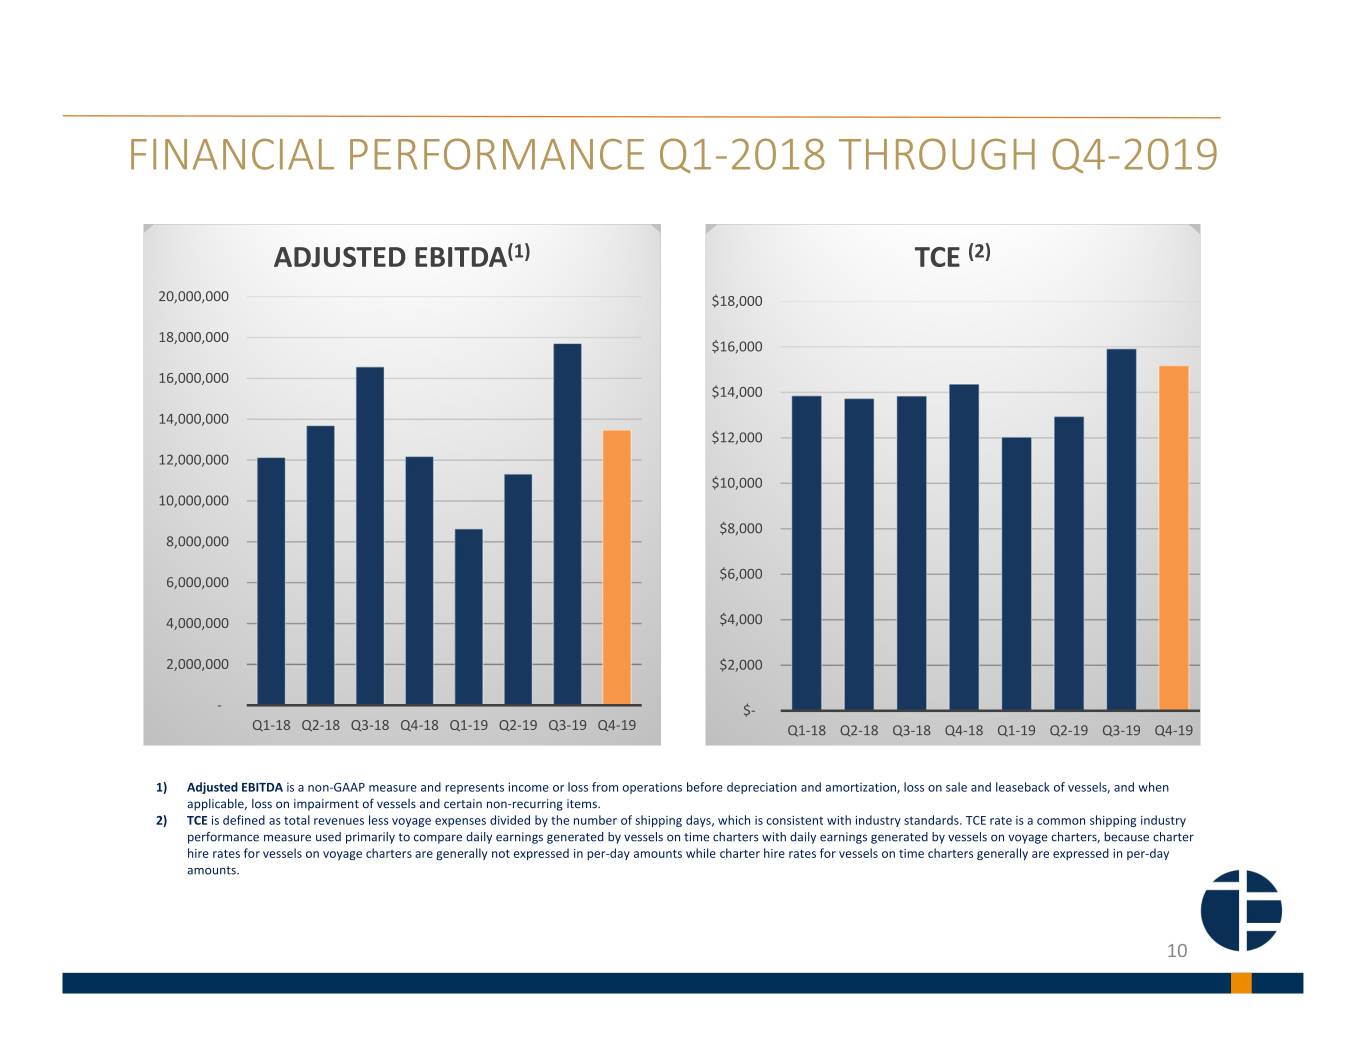
FINANCIAL PERFORMANCE Q1‐2018 THROUGH Q4‐2019 ADJUSTED EBITDA(1) TCE (2) 20,000,000 $18,000 18,000,000 $16,000 16,000,000 $14,000 14,000,000 $12,000 12,000,000 $10,000 10,000,000 $8,000 8,000,000 $6,000 6,000,000 4,000,000 $4,000 2,000,000 $2,000 ‐ $‐ Q1‐18 Q2‐18 Q3‐18 Q4‐18 Q1‐19 Q2‐19 Q3‐19 Q4‐19 Q1‐18 Q2‐18 Q3‐18 Q4‐18 Q1‐19 Q2‐19 Q3‐19 Q4‐19 1) Adjusted EBITDA is a non‐GAAP measure and represents income or loss from operations before depreciation and amortization, loss on sale and leaseback of vessels, and when applicable, loss on impairment of vessels and certain non‐recurring items. 2) TCE is defined as total revenues less voyage expenses divided by the number of shipping days, which is consistent with industry standards. TCE rate is a common shipping industry performance measure used primarily to compare daily earnings generated by vessels on time charters with daily earnings generated by vessels on voyage charters, because charter hire rates for vessels on voyage charters are generally not expressed in per‐day amounts while charter hire rates for vessels on time charters generally are expressed in per‐day amounts. 10
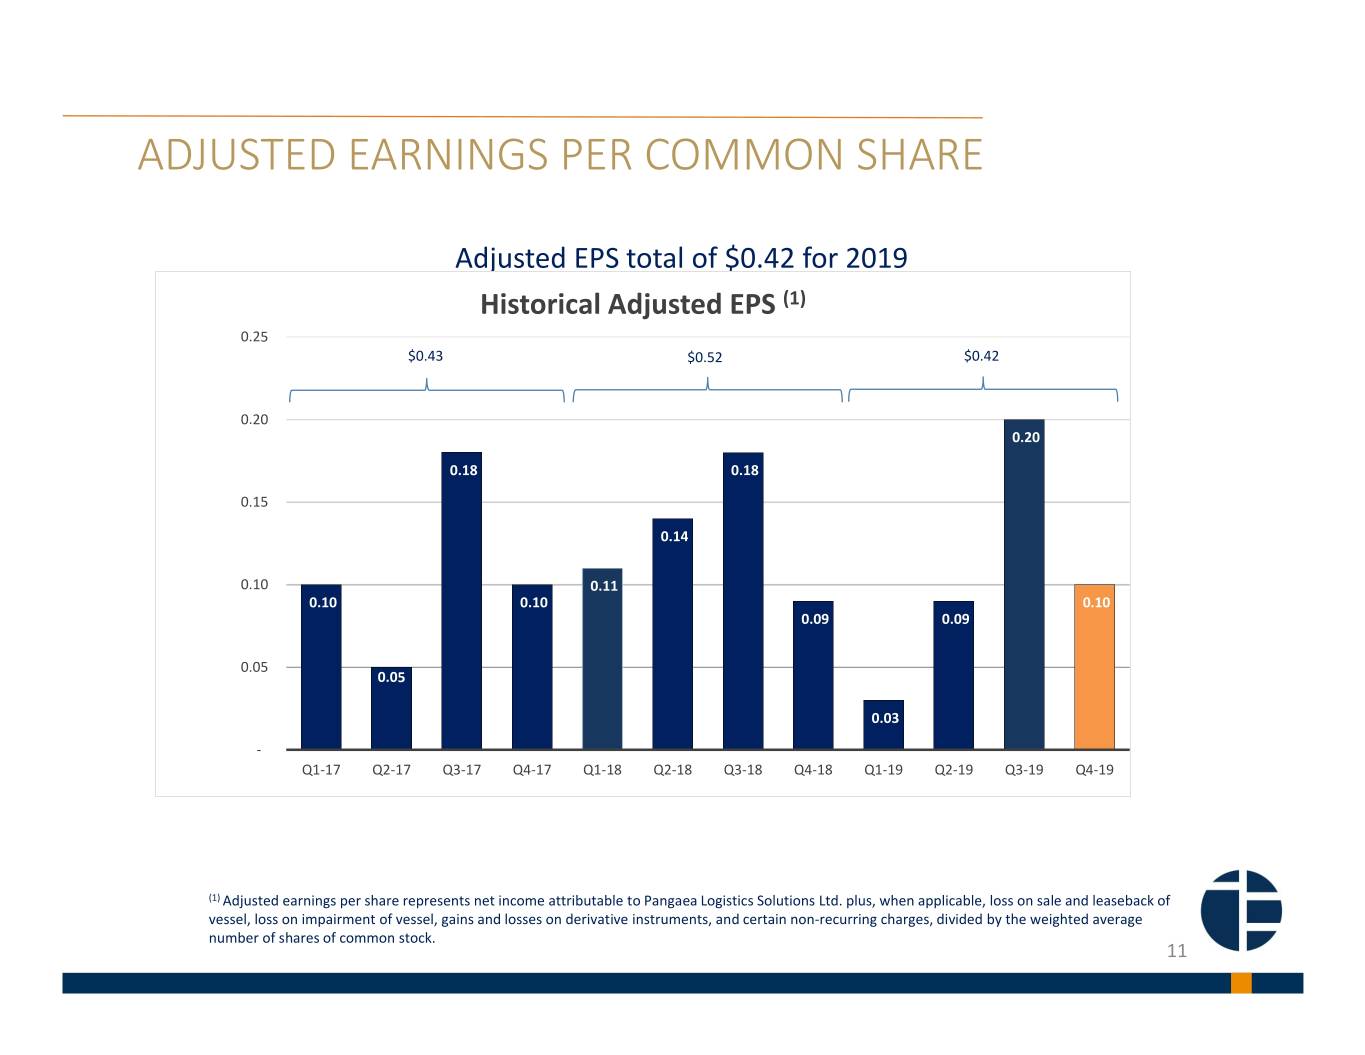
ADJUSTED EARNINGS PER COMMON SHARE Adjusted EPS total of $0.42 for 2019 Historical Adjusted EPS (1) 0.25 $0.43 $0.52 $0.42 0.20 0.20 0.18 0.18 0.15 0.14 0.10 0.11 0.10 0.10 0.10 0.09 0.09 0.05 0.05 0.03 ‐ Q1‐17 Q2‐17 Q3‐17 Q4‐17 Q1‐18 Q2‐18 Q3‐18 Q4‐18 Q1‐19 Q2‐19 Q3‐19 Q4‐19 (1) Adjusted earnings per share represents net income attributable to Pangaea Logistics Solutions Ltd. plus, when applicable, loss on sale and leaseback of vessel, loss on impairment of vessel, gains and losses on derivative instruments, and certain non‐recurring charges, divided by the weighted average number of shares of common stock. 11