
PANL 8-K
Pangaea Logistics Solutions Ltd. (PANL)
8-K
2022-05-10
For: 2022-05-10
View Original
Added on
April 09, 2026
UNITED STATES
SECURITIES AND EXCHANGE COMMISSION
WASHINGTON, D.C. 20549
______________
FORM 8-K
CURRENT REPORT
PURSUANT TO SECTION 13 OR 15(D) OF THE
SECURITIES EXCHANGE ACT OF 1934
Date of Report (Date of earliest event reported): May 10, 2022
(Exact Name of Registrant as Specified in Charter)
| (State or Other Jurisdiction | (Commission | (IRS Employer | ||||||
| of Incorporation) | File Number) | Identification No.) | ||||||
c/o Phoenix Bulk Carriers (US) LLC
(Address of Principal Executive Offices) (Zip Code)
(401 ) 846-7790
(Registrant’s Telephone Number, Including Area Code)
Not Applicable
(Former Name or Former Address, if Changed Since Last Report)
Check the appropriate box below if the Form 8-K filing is intended to simultaneously satisfy the filing obligation of the registrant under any of the following provisions (see General Instruction A.2. below):
| Written communications pursuant to Rule 425 under the Securities Act (17 CFR 230.425) | ||||||||
| Soliciting material pursuant to Rule 14a-12 under the Exchange Act (17 CFR 240.14a-12) | ||||||||
| Pre-commencement communications pursuant to Rule 14d-2(b) under the Exchange Act (17 CFR 240.14d-2(b)) | ||||||||
| Pre-commencement communications pursuant to Rule 13e-4(c) under the Exchange Act (17 CFR 240.13e 4(c)) | ||||||||
Securities registered pursuant to Section 12(b) of the Act:
| Title of each class | Trading Symbol(s) | Name of exchange on which registered | ||||||
Indicate by check mark whether the registrant is an emerging growth company as defined in Rule 405 of the Securities Act of 1933 (17 CFR 230.405) or Rule 12b-2 of the Securities Exchange Act of 1934 (17 CFR 240.12b-2).
Emerging growth company ☐
If an emerging growth company, indicate by check mark if the registrant has elected not to use the extended transition period for complying with any new or revised financial accounting standards provided pursuant to Section 13(a) of the Exchange Act. ☐
| Item 2.02 | Results of Operations and Financial Condition. | ||||
On May 10, 2022 , Registrant issued a press release announcing financial results for the the three months ended March 31, 2022. The press release is furnished as Exhibit 99.1, its Quarterly Investor Presentation is attached as Exhibit 99.2.
The information contained in, or incorporated into, this Current Report on Form 8-K is being furnished and shall not be deemed "filed" for purposes of Section 18 of the Securities Exchange Act of 1934, as amended (the "Exchange Act"), or otherwise subject to the liabilities under that section, nor shall it be incorporated by reference in any filing under the Securities Act of 1933, as amended, or the Exchange Act, except as expressly set forth by specific reference in any such filing.
| Item 9.01 | Financial Statements and Exhibits. | ||||
(d)Exhibits
| Exhibit | Description | ||||
99.1 Press Release of Pangaea Logistics Solutions Ltd., dated May 10, 2022 Reporting Financial Results for the three months ended March 31, 2022 (furnish pursuant to Item 2.02).
104 Cover Page Interactive Data File ( embedded within Inline XBRL document)
SIGNATURE
Pursuant to the requirements of the Securities Exchange Act of 1934, the registrant has duly caused this report to be signed on its behalf by the undersigned hereunto duly authorized.
Dated: May 10, 2022
| PANGAEA LOGISTICS SOLUTIONS LTD. | ||||||||
| By: | /s/ Gianni Del Signore | |||||||
| Name: Gianni Del Signore Title: Chief Financial Officer | ||||||||
Pangaea Logistics Solutions Ltd. Reports Record Financial Results for the Quarter Ended March 31, 2022
NEWPORT, RI - May 10, 2022 - Pangaea Logistics Solutions Ltd. (“Pangaea” or the “Company”) (NASDAQ: PANL), a global provider of comprehensive maritime logistics solutions, announced today its results for the three months ended March 31, 2022.
1st Quarter Highlights
•Net income attributable to Pangaea Logistics Solutions Ltd. was $20.2 million for the three months ended March 31, 2022, as compared to $5.9 million for the same period of 2021.
◦Non-GAAP adjusted net income attributable to Pangaea Logistics Solutions Ltd. was $15.7 million, as compared to non-GAAP adjusted net income of $3.8 million for the three months ended March 31, 2021.
◦Adjusted Earnings per share of $0.35, as compared to $0.09 for the same period of 2021.
•Diluted net income per share was $0.45 for the three months ended March 31, 2022, as compared to diluted net income per share of $0.13 for the same period of 2021.
•Pangaea's TCE rates were $26,472 per day for the three months ended March 31, 2022, as compared to $16,524 per day for the three months ended March 31, 2021.
•Adjusted EBITDA was $31.3 million for the three months ended March 31, 2022, as compared to $12.1 million for the same period of 2021.
•At the end of the quarter, Pangaea had $69.9 million in cash and cash equivalents.
•The Company's Board of Directors declared a quarterly cash dividend of $0.075 per common share, to be paid on June 15, 2022, to all shareholders of record as of June 1, 2022.
Mark Filanowski, Chief Executive Officer of Pangaea Logistics Solutions, commented:
“Improving dry bulk market fundamentals resulted in another strong quarter to start 2022 for Pangaea. We were well positioned entering the year after timely expansion of our fleet in 2021, and an early winter ice season seeing greater demand. We aim to extract as much value out of this market as possible and we remain opportunistic in our approach. With the larger owned fleet, and values of older tonnage continuing to appreciate, we announced the sale of the 1999-built Bulk Pangaea for $8.8 million, with the sale expected to close in June. For the first quarter, we generated adjusted EBITDA of $31.3 million and net income of $20.2 million. We achieved TCE rates of $26,472 per day which was a 17% premium over the prevailing market for the quarter.
In response to sanctions against Russia, we have replaced the technical ship managers on our ice class fleet, and we refocused some commercial efforts from the Baltic Sea to the Pacific and North Atlantic basins as new trade routes developed in response. What geopolitical events and macro-economic factors have in store for future shipping markets is up for debate, but we remain ready to adjust our business model to capitalize on new opportunities from these disruptions, as always. With parts of our owned fleet dedicated to long term industrial contract business, our ships well balanced around the globe, and our chartered-in fleet on short term commitments, we feel we have never been in a stronger position as we turn our attention to our summer Arctic shipping ice season.
We are also focused, more and more, on our ports and terminals businesses, especially in areas of tremendous growth. In Sabine, Texas, we are attracting new breakbulk business in green energy systems, and in Brayton Point, Massachusetts we are focusing on wind energy projects and contracts. We are moving infrastructure commodities in US Gulf ports and terminals, and we are working on projects related to infrastructure commodities with partners in the Northeast United States. The complementary services we offer are gaining appreciation of new and established customers. We have created a separate team within Pangaea to operate this part of our business, and we are pleased to have attracted a seasoned veteran of this part of our industry, Brent Mahana, to help spearhead our efforts with cargo and customers.”
Results for the three months ended March 31, 2022 and 2021
Total revenue was $191.8 million for the three months ended March 31, 2022, compared with $125.0 million for the three months ended March 31, 2021. The 53% increase in revenues was mainly attributed to the increase in the average TCE rates achieved by our vessels during the first quarter of 2022 compared to the same period in 2021.
Time Charter Equivalent rate (TCE) was $26,472 per day for the three months ended March 31, 2022, compared to an average of $16,524 per day for the same period in 2021. The average supramax and panamax market index rates for the first quarter of 2022 were $22,637 per day. The Company's achieved TCE rate for the three months ended March 31, 2022 outperformed the average of the Baltic panamax and supramax market indexes and exceeded the average market rates by approximately 17% due to its long-term contracts of affreightment, ("COAs"), its specialized fleet and its cargo-focused strategy.
Liquidity and Cash Flows
Cash and cash equivalents were $69.9 million as of March 31, 2022, compared with $56.2 million on December 31, 2021.
On March 31, 2022 and December 31, 2021, the Company had working capital of $92.4 million and $72.2 million, respectively. Net cash provided by operating activities during the three months ended March 31, 2022 was $32.1 million compared to net cash provided by operating activities of $4.9 million for the three months ended March 31, 2021.
Net cash used in investing activities during the three months ended March 31, 2022 was $18.2 million compared to net cash used in investing activities of $5.5 million for the same period in 2021. The increase was primarily due to the purchase of a Panamax vessel which was delivered in February 2022.
Net cash used in financing activities during the three months ended March 31, 2022 was $0.1 million compared to net cash used in financing activities of $5.9 million for the same period of 2021. During the three months ended March 31, 2022, the Company received $15.0 million in proceeds from finance leases. The Company repaid $3.4 million of long term debt, $3.8 million of finance leases. The Company also paid $2.3 million of cash dividends.
Subsequent Events
On April 20, 2022, the Company signed a memorandum of agreement to sell the m/v Bulk Pangaea for $8.6 million after brokerage commissions. The Company recorded an impairment charge of $3.0 million, and recorded the carrying amount of the vessel as vessels held for sale in its Consolidated Balance Sheet as of March 31, 2022.
Conference Call Details
The Company’s management team will host a conference call to discuss the Company’s financial results on Wednesday, May 11, 2022 at 8:00 a.m., Eastern Time (ET). To access the teleconference, please dial 866-518-6930 (domestic) or 203-518-9797 (international) approximately ten minutes before the teleconference's scheduled start time and reference Conference ID: PANLQ122.
A supplemental slide presentation will accompany this quarter’s conference call and can be found attached to the Current Report on Form 8-K that the Company filed concurrently with this press release. This document will be available at http://www.pangaeals.com/company-filings or at sec.gov.
A recording of the call will also be available for one week following the teleconference and will be accessible by calling 800-938-1584 (domestic) or 402-220-1542 (international).
Pangaea Logistics Solutions Ltd.
Consolidated Statements of Operations
(unaudited)
| Three Months Ended March 31, | |||||||||||
| 2022 | 2021 | ||||||||||
| Revenues: | |||||||||||
| Voyage revenue | $ | 176,336,751 | $ | 108,817,411 | |||||||
| Charter revenue | 15,425,652 | 16,155,116 | |||||||||
| Total revenue | 191,762,403 | 124,972,527 | |||||||||
| Expenses: | |||||||||||
| Voyage expense | 65,250,467 | 47,838,857 | |||||||||
| Charter hire expense | 77,711,607 | 53,635,342 | |||||||||
| Vessel operating expense | 13,187,833 | 8,495,503 | |||||||||
| General and administrative | 5,281,388 | 4,204,898 | |||||||||
| Depreciation and amortization | 7,301,419 | 4,419,094 | |||||||||
| Loss on impairment of vessels | 3,007,809 | — | |||||||||
| Total expenses | 171,740,523 | 118,593,694 | |||||||||
| Income from operations | 20,021,880 | 6,378,833 | |||||||||
| Other income (expense): | |||||||||||
| Interest expense, net | (3,371,173) | (1,956,806) | |||||||||
Income attributable to Non-controlling interest recorded as long-term liability interest expense | (1,840,333) | (270,665) | |||||||||
| Unrealized gain on derivative instruments, net | 7,500,314 | 2,022,372 | |||||||||
| Other income | 137,207 | 333,458 | |||||||||
| Total other income, net | 2,426,015 | 128,359 | |||||||||
| Net income | 22,447,895 | 6,507,192 | |||||||||
| Income attributable to non-controlling interests | (2,279,930) | (653,021) | |||||||||
| Net income attributable to Pangaea Logistics Solutions Ltd. | $ | 20,167,965 | $ | 5,854,171 | |||||||
| Earnings per common share: | |||||||||||
| Basic | $ | 0.45 | $ | 0.13 | |||||||
| Diluted | $ | 0.45 | $ | 0.13 | |||||||
| Weighted average shares used to compute earnings per common share: | |||||||||||
| Basic | 44,388,960 | 43,971,352 | |||||||||
| Diluted | 45,192,983 | 44,549,286 | |||||||||
Pangaea Logistics Solutions Ltd.
Consolidated Balance Sheets
| March 31, 2022 | December 31, 2021 | ||||||||||
| (unaudited) | |||||||||||
| Assets | |||||||||||
| Current assets | |||||||||||
| Cash and cash equivalents | $ | 69,921,488 | $ | 56,208,902 | |||||||
Accounts receivable (net of allowance of $2,687,328 and $1,990,459 at March 31, 2022 and December 31, 2021, respectively) | 41,365,826 | 54,259,265 | |||||||||
| Bunker inventory | 39,208,774 | 27,147,760 | |||||||||
| Advance hire, prepaid expenses and other current assets | 47,596,006 | 46,347,687 | |||||||||
| Vessel held for sale | 8,575,000 | — | |||||||||
| Total current assets | 206,667,094 | 183,963,614 | |||||||||
| Fixed assets, net | 474,297,275 | 471,912,810 | |||||||||
| Advances for vessel purchases | — | 1,990,000 | |||||||||
| Finance lease right of use assets, net | 45,877,296 | 45,195,759 | |||||||||
| Other non-current Assets | 4,017,535 | 3,961,823 | |||||||||
| Total assets | $ | 730,859,200 | $ | 707,024,006 | |||||||
| Liabilities and stockholders' equity | |||||||||||
| Current liabilities | |||||||||||
| Accounts payable, accrued expenses and other current liabilities | $ | 56,525,277 | $ | 49,154,439 | |||||||
| Related party debt | 242,852 | 242,852 | |||||||||
| Deferred revenue | 25,898,849 | 32,205,312 | |||||||||
| Current portion of secured long-term debt | 15,317,100 | 15,443,115 | |||||||||
| Current portion of finance lease liabilities | 16,057,036 | 14,479,803 | |||||||||
| Dividend payable | 197,741 | 213,765 | |||||||||
| Total current liabilities | 114,238,855 | 111,739,286 | |||||||||
| Secured long-term debt, net | 102,715,922 | 105,836,797 | |||||||||
| Finance lease liabilities, net | 180,364,245 | 170,959,553 | |||||||||
| Long-term liabilities - other | 17,147,309 | 17,806,976 | |||||||||
| Commitments and contingencies | |||||||||||
| Stockholders' equity: | |||||||||||
| Preferred stock, $0.0001 par value, 1,000,000 shares authorized and no shares issued or outstanding | — | — | |||||||||
| Common stock, $0.0001 par value, 100,000,000 shares authorized; 45,991,977 shares issued and outstanding at March 31, 2022; 45,617,840 shares issued and outstanding at December 31, 2021 | 4,599 | 4,562 | |||||||||
| Additional paid-in capital | 162,074,419 | 161,534,280 | |||||||||
| Retained earnings | 103,554,744 | 85,663,375 | |||||||||
| Total Pangaea Logistics Solutions Ltd. equity | 265,633,762 | 247,202,217 | |||||||||
| Non-controlling interests | 50,759,107 | 53,479,177 | |||||||||
| Total stockholders' equity | 316,392,869 | 300,681,394 | |||||||||
| Total liabilities and stockholders' equity | $ | 730,859,200 | $ | 707,024,006 | |||||||
Pangaea Logistics Solutions, Ltd.
Consolidated Statements of Cash Flows
| Three Months Ended March 31, | |||||||||||
| 2022 | 2021 | ||||||||||
| Operating activities | Unaudited | Unaudited | |||||||||
| Net income | $ | 22,447,895 | $ | 6,507,192 | |||||||
| Adjustments to reconcile net income to net cash provided by operations: | |||||||||||
| Depreciation and amortization expense | 7,301,419 | 4,419,094 | |||||||||
| Amortization of deferred financing costs | 256,830 | 163,800 | |||||||||
| Amortization of prepaid rent | 30,484 | 28,814 | |||||||||
| Unrealized gain on derivative instruments | (7,500,314) | (2,022,372) | |||||||||
| Income from equity method investee | (137,207) | (333,458) | |||||||||
| Earnings attributable to non-controlling interest recorded as other long term liability | 1,840,333 | 270,665 | |||||||||
| Provision for doubtful accounts | 696,869 | 176,984 | |||||||||
| Loss on impairment of vessels | 3,007,809 | — | |||||||||
| Drydocking costs | (1,638,364) | (1,110,694) | |||||||||
| Share-based compensation | 827,806 | 947,552 | |||||||||
| Change in operating assets and liabilities: | |||||||||||
| Accounts receivable | 12,196,570 | (278,735) | |||||||||
| Bunker inventory | (12,061,014) | 338,272 | |||||||||
| Advance hire, prepaid expenses and other current assets | 6,255,996 | (2,166,945) | |||||||||
| Accounts payable, accrued expenses and other current liabilities | 4,843,359 | (2,852,717) | |||||||||
| Deferred revenue | (6,306,463) | 852,697 | |||||||||
| Net cash provided by operating activities | 32,062,008 | 4,940,149 | |||||||||
| Investing activities | |||||||||||
| Purchase of vessels and vessel improvements | (18,261,685) | (5,467,178) | |||||||||
| Purchase of fixed assets and equipment | (67,178) | — | |||||||||
| Contribution to non-consolidated subsidiaries | 81,495 | — | |||||||||
| Net cash used in investing activities | (18,247,368) | (5,467,178) | |||||||||
| Financing activities | |||||||||||
| Payments of financing fees and issuance costs | (331,317) | (112,333) | |||||||||
| Payments of long-term debt | (3,353,207) | (2,973,139) | |||||||||
| Proceeds from finance leases | 15,000,000 | — | |||||||||
| Payments of finance lease obligations | (3,837,280) | (1,729,753) | |||||||||
| Dividends paid to non-controlling interests | (5,000,000) | — | |||||||||
| Accrued common stock dividends paid | (2,292,620) | (906,899) | |||||||||
| Cash paid for incentive compensation shares relinquished | (287,630) | (129,190) | |||||||||
| Net cash used in financing activities | (102,054) | (5,851,314) | |||||||||
| Net increase (decrease) in cash and cash equivalents | 13,712,586 | (6,378,343) | |||||||||
| Cash and cash equivalents at beginning of period | 56,208,902 | 48,397,216 | |||||||||
| Cash and cash equivalents at end of period | $ | 69,921,488 | $ | 42,018,873 | |||||||
Pangaea Logistics Solutions Ltd.
Reconciliation of Non-GAAP Measures
(unaudited)
| Three Months Ended March 31, | ||||||||||||||
| 2022 | 2021 | |||||||||||||
| Net Transportation and Service Revenue | ||||||||||||||
| Gross Profit | $ | 28,329,468 | $ | 10,615,433 | ||||||||||
| Add: | ||||||||||||||
| Vessel Depreciation and Amortization | 7,283,028 | 4,387,392 | ||||||||||||
| Net transportation and service revenue | $ | 35,612,496 | $ | 15,002,825 | ||||||||||
| Adjusted EBITDA | ||||||||||||||
| Net Income | 22,447,895 | 6,507,192 | ||||||||||||
| Interest expense, net | 5,211,506 | 2,227,471 | ||||||||||||
| Depreciation and amortization | 7,301,419 | 4,419,094 | ||||||||||||
| EBITDA | 34,960,820 | 13,153,757 | ||||||||||||
| Non-GAAP Adjustments: | ||||||||||||||
| Loss on impairment of vessels | 3,007,809 | — | ||||||||||||
| Share-based compensation | 827,806 | 947,552 | ||||||||||||
| Unrealized gain on derivative instruments, net | (7,500,314) | (2,022,372) | ||||||||||||
| Adjusted EBITDA | $ | 31,296,121 | $ | 12,078,937 | ||||||||||
| Earnings Per Common Share | ||||||||||||||
| Net income attributable to Pangaea Logistics Solutions Ltd. | $ | 20,167,965 | $ | 5,854,171 | ||||||||||
| Weighted average number of common shares outstanding - basic | 44,388,960 | 43,971,352 | ||||||||||||
| Weighted average number of common shares outstanding - diluted | 45,192,983 | 44,549,286 | ||||||||||||
| Earnings per common share - basic | $ | 0.45 | $ | 0.13 | ||||||||||
| Earnings per common share - diluted | $ | 0.45 | $ | 0.13 | ||||||||||
| Adjusted EPS | ||||||||||||||
| Net Income attributable to Pangaea Logistics Solutions Ltd. | $ | 20,167,965 | $ | 5,854,171 | ||||||||||
| Non-GAAP | ||||||||||||||
| Add: loss on impairment of vessels | 3,007,809 | — | ||||||||||||
| Unrealized gain on derivative instruments | (7,500,314) | (2,022,372) | ||||||||||||
| Non-GAAP adjusted net income attributable to Pangaea Logistics Solutions Ltd. | $ | 15,675,460 | $ | 3,831,799 | ||||||||||
| Weighted average number of common shares - basic | 44,388,960 | 43,971,352 | ||||||||||||
| Weighted average number of common shares - diluted | 45,192,983 | 44,549,286 | ||||||||||||
| Adjusted EPS - basic | $ | 0.35 | $ | 0.09 | ||||||||||
| Adjusted EPS - diluted | $ | 0.35 | $ | 0.09 | ||||||||||
INFORMATION ABOUT NON-GAAP FINANCIAL MEASURES. As used herein, “GAAP” refers to accounting principles generally accepted in the United States of America. To supplement our consolidated financial statements prepared and presented in accordance with GAAP, this earnings release discusses non-GAAP financial measures, including non-GAAP net revenue and non-GAAP adjusted EBITDA. This is considered a non-GAAP financial measure as defined in Rule 101 of Regulation G promulgated by the Securities and Exchange Commission. Generally, a non-GAAP financial measure is a numerical measure of a company’s historical or future performance, financial position, or cash flows that either excludes or includes amounts that are not normally excluded or included in the most directly comparable measure calculated and presented in accordance with GAAP. The presentation of this non-GAAP financial information is not intended to be considered in isolation or as a substitute for, or superior to, the financial information prepared and presented in accordance with GAAP.
We use non-GAAP financial measures for internal financial and operational decision making purposes and as a means to evaluate period-to-period comparisons of the performance and results of operations of our core business. Our management believes that non-GAAP financial measures provide meaningful supplemental information regarding the performance of our core business by excluding charges that are not incurred in the normal course of business. Non-GAAP financial measures also facilitate management's internal planning and comparisons to our historical performance and liquidity. We believe certain non-GAAP financial measures are useful to investors as they allow for greater transparency with respect to key metrics used by management in its financial and operational decision making and are used by our institutional investors and the analyst community to help them analyze the performance and operational results of our core business.
Gross Profit. Gross profit represents total revenue less net transportation and service revenue and less vessel depreciation and amortization.
Net transportation and service revenue. Net transportation and service revenue represents total revenue less the total direct costs of transportation and services, which includes charter hire, voyage and vessel operating expenses. Net transportation and service revenue is included because it is used by management and certain investors to measure performance by comparison to other logistic service providers. Net transportation and service revenue is not an item recognized by the generally accepted accounting principles in the United States of America, or U.S. GAAP, and should not be considered as an alternative to net income, operating income, or any other indicator of a company's operating performance required by U.S. GAAP. Pangaea’s definition of net transportation and service revenue used here may not be comparable to an operating measure used by other companies.
Adjusted EBITDA and adjusted EPS. Adjusted EBITDA represents net income (or loss), determined in accordance with U.S. GAAP, excluding interest expense, income taxes, depreciation and amortization, loss on impairment, loss on sale and leaseback of vessels, share-based compensation and other non-operating income and/or expense, if any. Earnings per share represents net income divided by the weighted average number of common shares outstanding. Adjusted earnings per share represents net income attributable to Pangaea Logistics Solutions Ltd. plus, when applicable, loss on sale of vessel, loss on sale and leaseback of vessel, loss on impairment of vessel, unrealized gains and losses on derivative instruments, and certain non-recurring charges, divided by the weighted average number of shares of common stock.
There are limitations related to the use of net revenue versus income from operations, adjusted EBITDA versus income from operations, and adjusted EPS versus EPS calculated in accordance with GAAP. In particular, Pangaea’s definition of adjusted EBITDA used here are not comparable to EBITDA.
The table set forth above provides a reconciliation of the non-GAAP financial measures presented during the period to the most directly comparable financial measures prepared in accordance with GAAP.
About Pangaea Logistics Solutions Ltd.
Pangaea Logistics Solutions Ltd. (NASDAQ: PANL) provides logistics services to a broad base of industrial customers who require the transportation of a wide variety of dry bulk cargoes, including grains, pig iron, hot briquetted iron, bauxite, alumina, cement clinker, dolomite, and limestone. The Company addresses the transportation needs of its customers with a comprehensive set of services and activities, including cargo loading, cargo discharge, vessel chartering, and voyage planning. Learn more at www.pangaeals.com.
Investor Relations Contacts
| Gianni Del Signore | Emily Blum | |||||||
| Chief Financial Officer | Prosek Partners | |||||||
| 401-846-7790 | 973-464-5240 | |||||||
| [email protected] | [email protected] | |||||||
Forward-Looking Statements
Certain statements in this press release are “forward-looking statements” within the meaning of the Private Securities Litigation Act of 1995. These forward-looking statements are based on our current expectations and beliefs and are subject to a number of risk factors and uncertainties that could cause actual results to differ materially from those described in the forward-looking statements. The Company disclaims any obligation to publicly update or revise these statements whether as a result of new information, future events or otherwise, except as required by law. Such risks and uncertainties include, without limitation, the strength of world economies and currencies, general market conditions, including fluctuations in charter rates and vessel values, changes in demand for dry bulk shipping capacity, changes in our operating expenses, including bunker prices, dry-docking and insurance costs, the market for our vessels, availability of financing and refinancing, charter counterparty performance, ability to obtain financing and comply with covenants in such financing arrangements, changes in governmental rules and regulations or actions taken by regulatory authorities, potential liability from pending or future litigation, general domestic and international political conditions, potential disruption of shipping routes due to accidents or political events, vessels breakdowns and instances of off-hires and other factors, as well as other risks that have been included in filings with the Securities and Exchange Commission, all of which are available at www.sec.gov.

FIRST QUARTER 2022 EARNINGS CONFERENCE CALL PRESENTATION 1
SAFE HARBOR This presentation includes certain forward-looking statements within the meaning of the Private Securities Litigation Reform Act of 1995, including statements regarding future financial performance, future growth and future acquisitions. These statements are based on Pangaea’s and managements’ current expectations or beliefs and are subject to uncertainty and changes in circumstances. Actual results may vary materially from those expressed or implied by the statements herein due to changes in economic, business, competitive and/or regulatory factors, and other risks and uncertainties affecting the operation of Pangaea’s business. These risks, uncertainties and contingencies include: business conditions; weather and natural disasters; changing interpretations of GAAP; outcomes of government reviews; inquiries and investigations and related litigation; continued compliance with government regulations; legislation or regulatory environments; requirements or changes adversely affecting the business in which Pangaea is engaged; fluctuations in customer demand; management of rapid growth; intensity of competition from other providers of logistics and shipping services; general economic conditions; geopolitical events and regulatory changes; and other factors set forth in Pangaea’s filings with the Securities and Exchange Commission and the filings of its predecessors. The information set forth herein should be read in light of such risks. Further, investors should keep in mind that certain of Pangaea’s financial results are unaudited and do not conform to SEC Regulation S-X and as a result such information may fluctuate materially depending on many factors. Accordingly, Pangaea’s financial results in any particular period may not be indicative of future results. Pangaea is not under any obligation to, and expressly disclaims any obligation to, update or alter its forward-looking statements, whether as a result of new information, future events, changes in assumptions or otherwise. 2
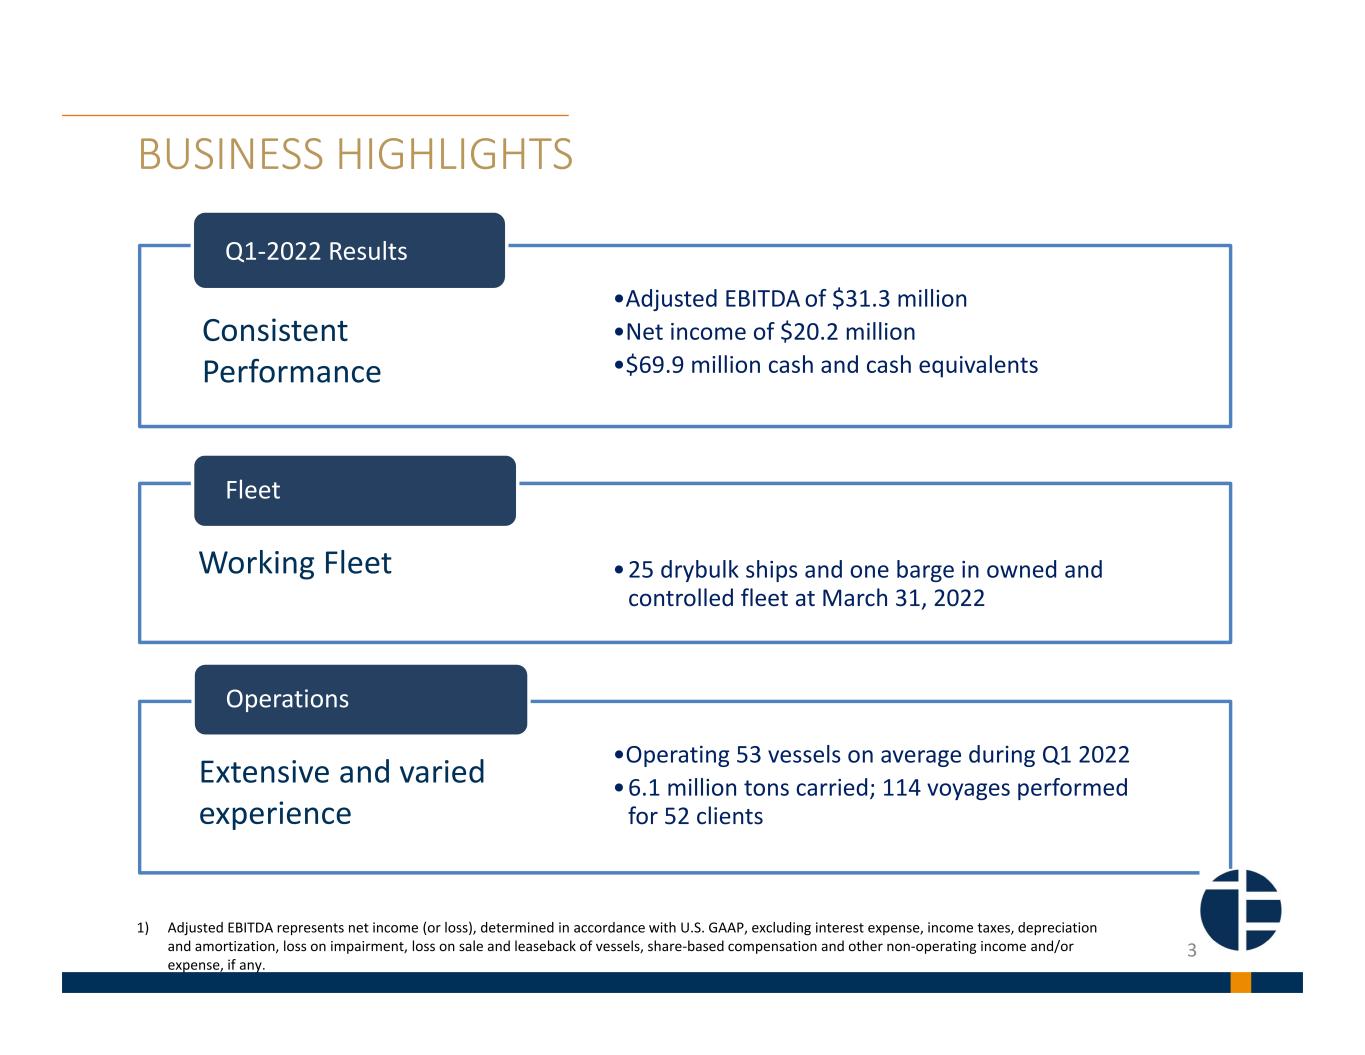
BUSINESS HIGHLIGHTS •Adjusted EBITDAof $31.3 million •Net income of $20.2 million •$69.9 million cash and cash equivalents Q1‐2022 Results •25 drybulk ships and one barge in owned and controlled fleet at March 31, 2022 Fleet •Operating 53 vessels on average during Q1 2022 •6.1 million tons carried; 114 voyages performed for 52 clients Operations 1) Adjusted EBITDA represents net income (or loss), determined in accordance with U.S. GAAP, excluding interest expense, income taxes, depreciation and amortization, loss on impairment, loss on sale and leaseback of vessels, share‐based compensation and other non‐operating income and/or expense, if any. Consistent Performance Working Fleet Extensive and varied experience 3
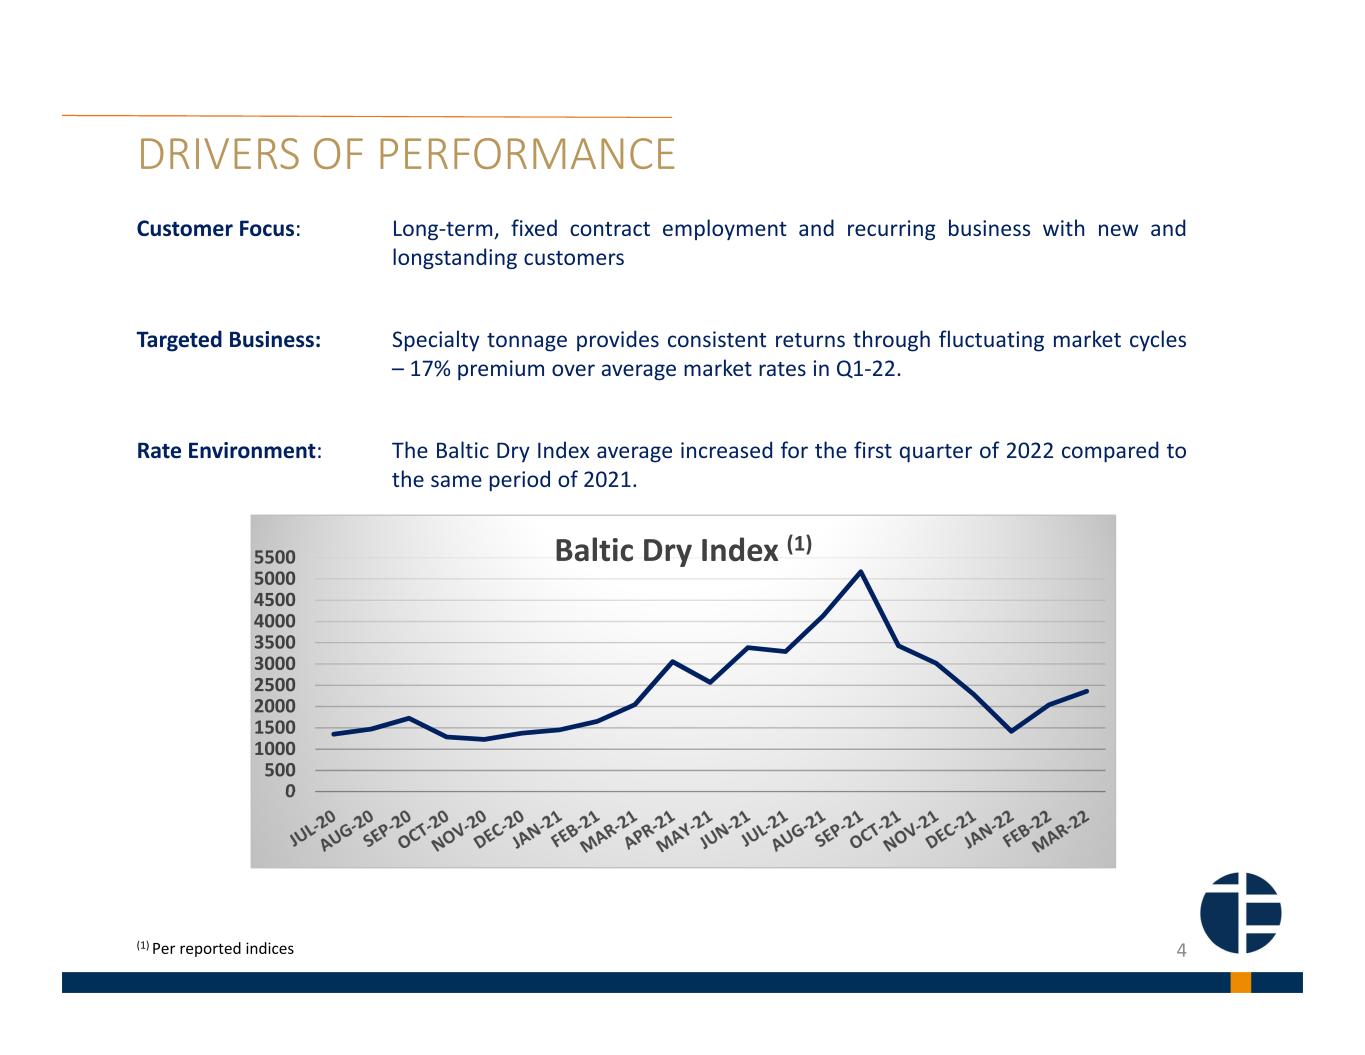
Customer Focus: Long‐term, fixed contract employment and recurring business with new and longstanding customers Targeted Business: Specialty tonnage provides consistent returns through fluctuating market cycles – 17% premium over average market rates in Q1‐22. Rate Environment: The Baltic Dry Index average increased for the first quarter of 2022 compared to the same period of 2021. (1) Per reported indices DRIVERS OF PERFORMANCE 4 0 500 1000 1500 2000 2500 3000 3500 4000 4500 5000 5500 Baltic Dry Index (1)
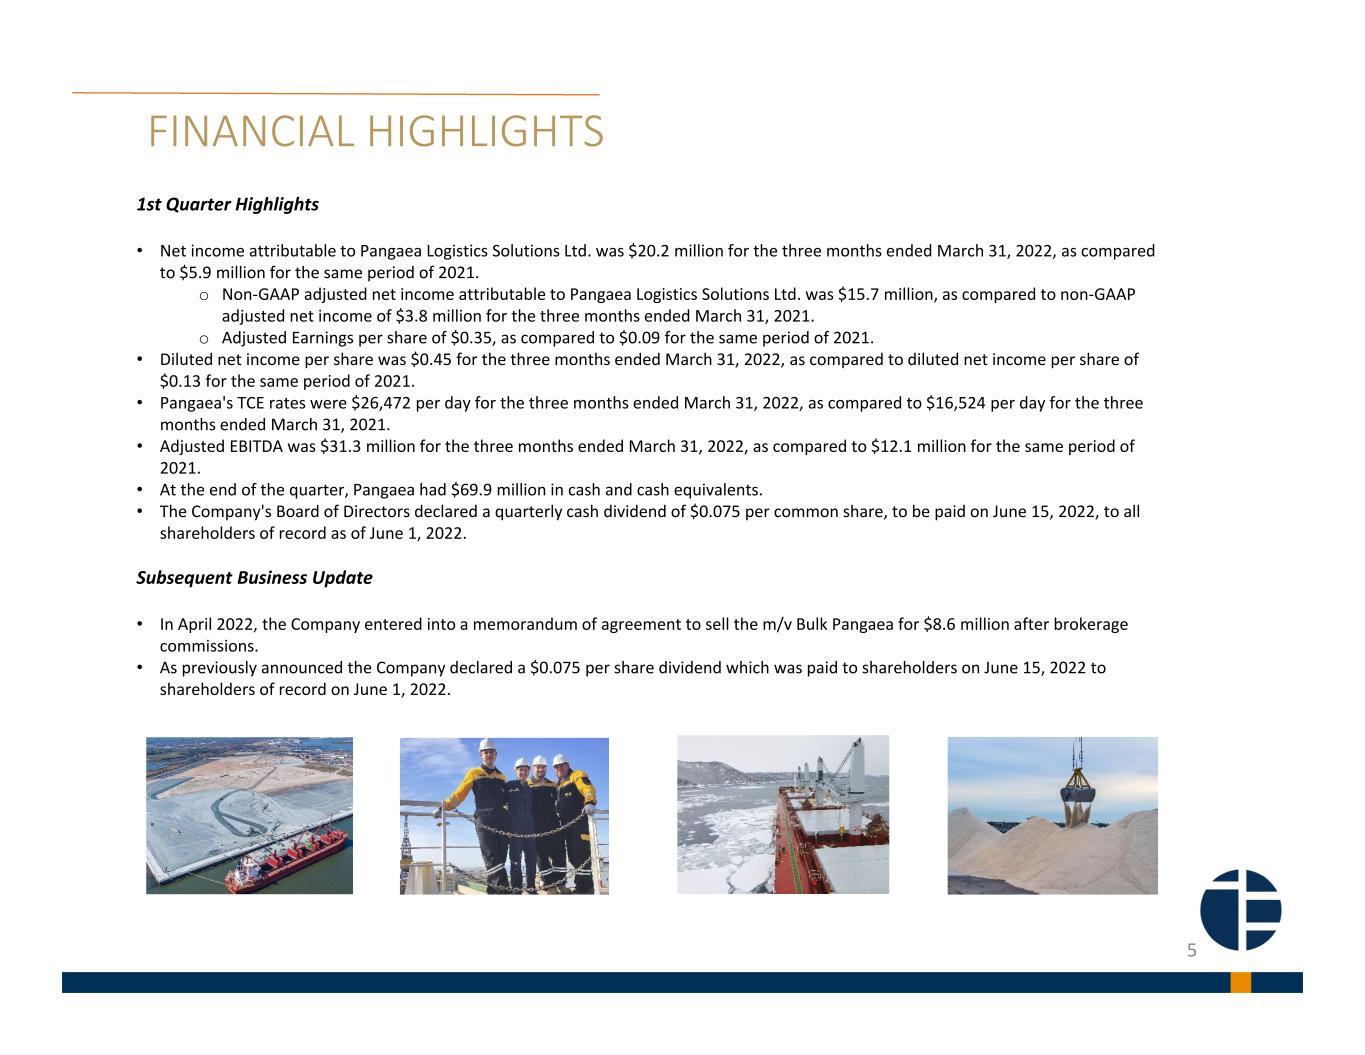
1st Quarter Highlights • Net income attributable to Pangaea Logistics Solutions Ltd. was $20.2 million for the three months ended March 31, 2022, as compared to $5.9 million for the same period of 2021. o Non‐GAAP adjusted net income attributable to Pangaea Logistics Solutions Ltd. was $15.7 million, as compared to non‐GAAP adjusted net income of $3.8 million for the three months ended March 31, 2021. o Adjusted Earnings per share of $0.35, as compared to $0.09 for the same period of 2021. • Diluted net income per share was $0.45 for the three months ended March 31, 2022, as compared to diluted net income per share of $0.13 for the same period of 2021. • Pangaea's TCE rates were $26,472 per day for the three months ended March 31, 2022, as compared to $16,524 per day for the three months ended March 31, 2021. • Adjusted EBITDA was $31.3 million for the three months ended March 31, 2022, as compared to $12.1 million for the same period of 2021. • At the end of the quarter, Pangaea had $69.9 million in cash and cash equivalents. • The Company's Board of Directors declared a quarterly cash dividend of $0.075 per common share, to be paid on June 15, 2022, to all shareholders of record as of June 1, 2022. Subsequent Business Update • In April 2022, the Company entered into a memorandum of agreement to sell the m/v Bulk Pangaea for $8.6 million after brokerage commissions. • As previously announced the Company declared a $0.075 per share dividend which was paid to shareholders on June 15, 2022 to shareholders of record on June 1, 2022. FINANCIAL HIGHLIGHTS 5
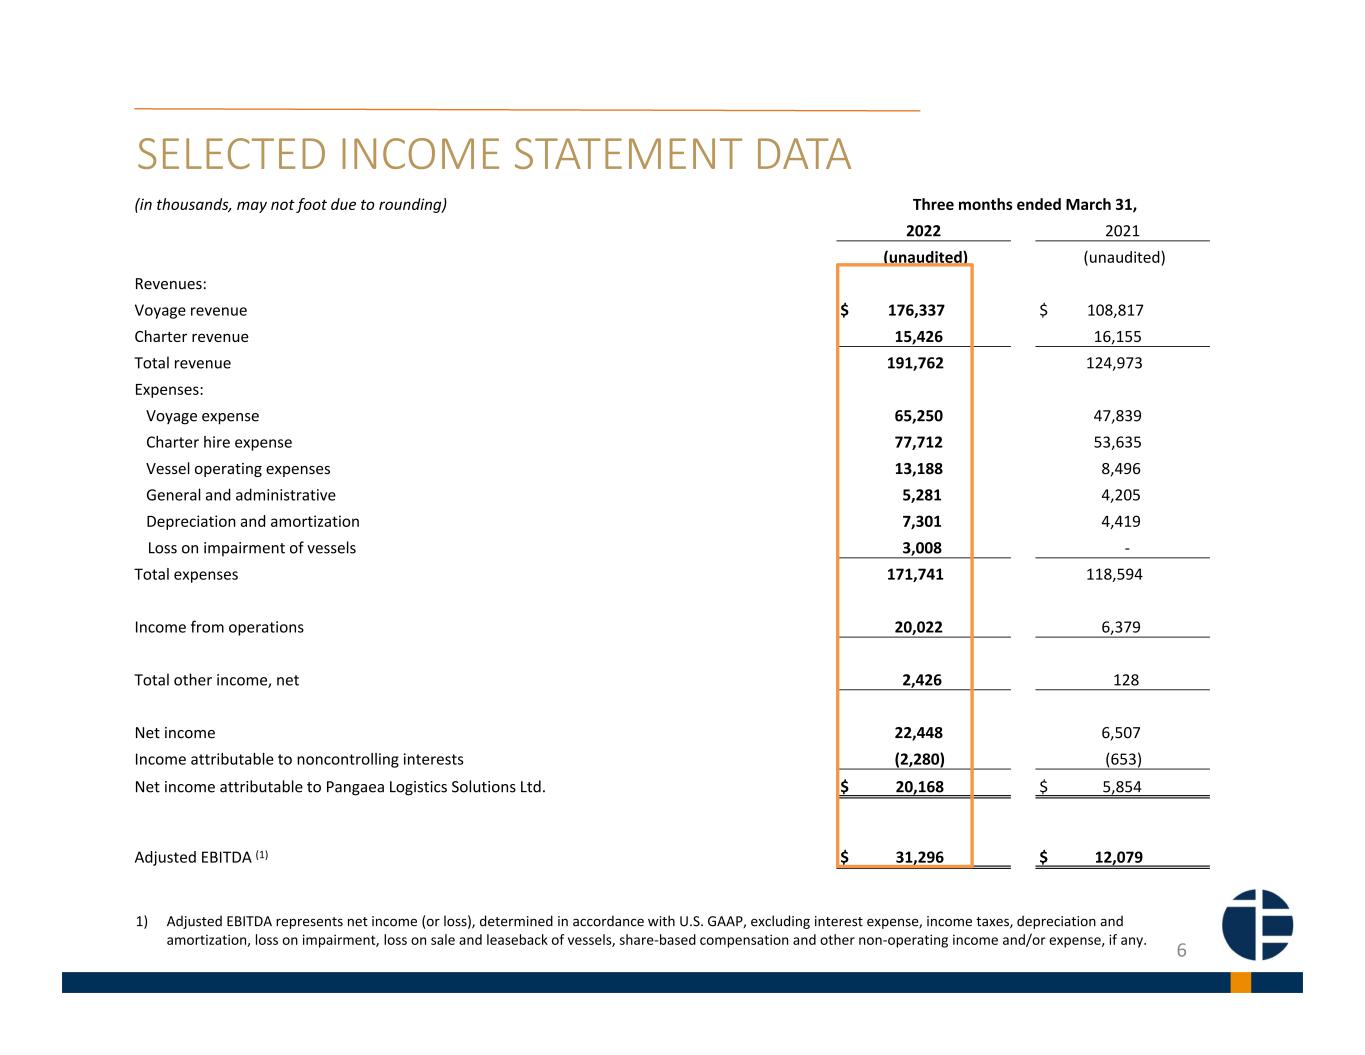
(in thousands, may not foot due to rounding) Three months ended March 31, 2022 2021 (unaudited) (unaudited) Revenues: Voyage revenue $ 176,337 $ 108,817 Charter revenue 15,426 16,155 Total revenue 191,762 124,973 Expenses: Voyage expense 65,250 47,839 Charter hire expense 77,712 53,635 Vessel operating expenses 13,188 8,496 General and administrative 5,281 4,205 Depreciation and amortization 7,301 4,419 Loss on impairment of vessels 3,008 ‐ Total expenses 171,741 118,594 Income from operations 20,022 6,379 Total other income, net 2,426 128 Net income 22,448 6,507 Income attributable to noncontrolling interests (2,280) (653) Net income attributable to Pangaea Logistics Solutions Ltd. $ 20,168 $ 5,854 Adjusted EBITDA (1) $ 31,296 $ 12,079 1) Adjusted EBITDA represents net income (or loss), determined in accordance with U.S. GAAP, excluding interest expense, income taxes, depreciation and amortization, loss on impairment, loss on sale and leaseback of vessels, share‐based compensation and other non‐operating income and/or expense, if any. SELECTED INCOME STATEMENT DATA 6
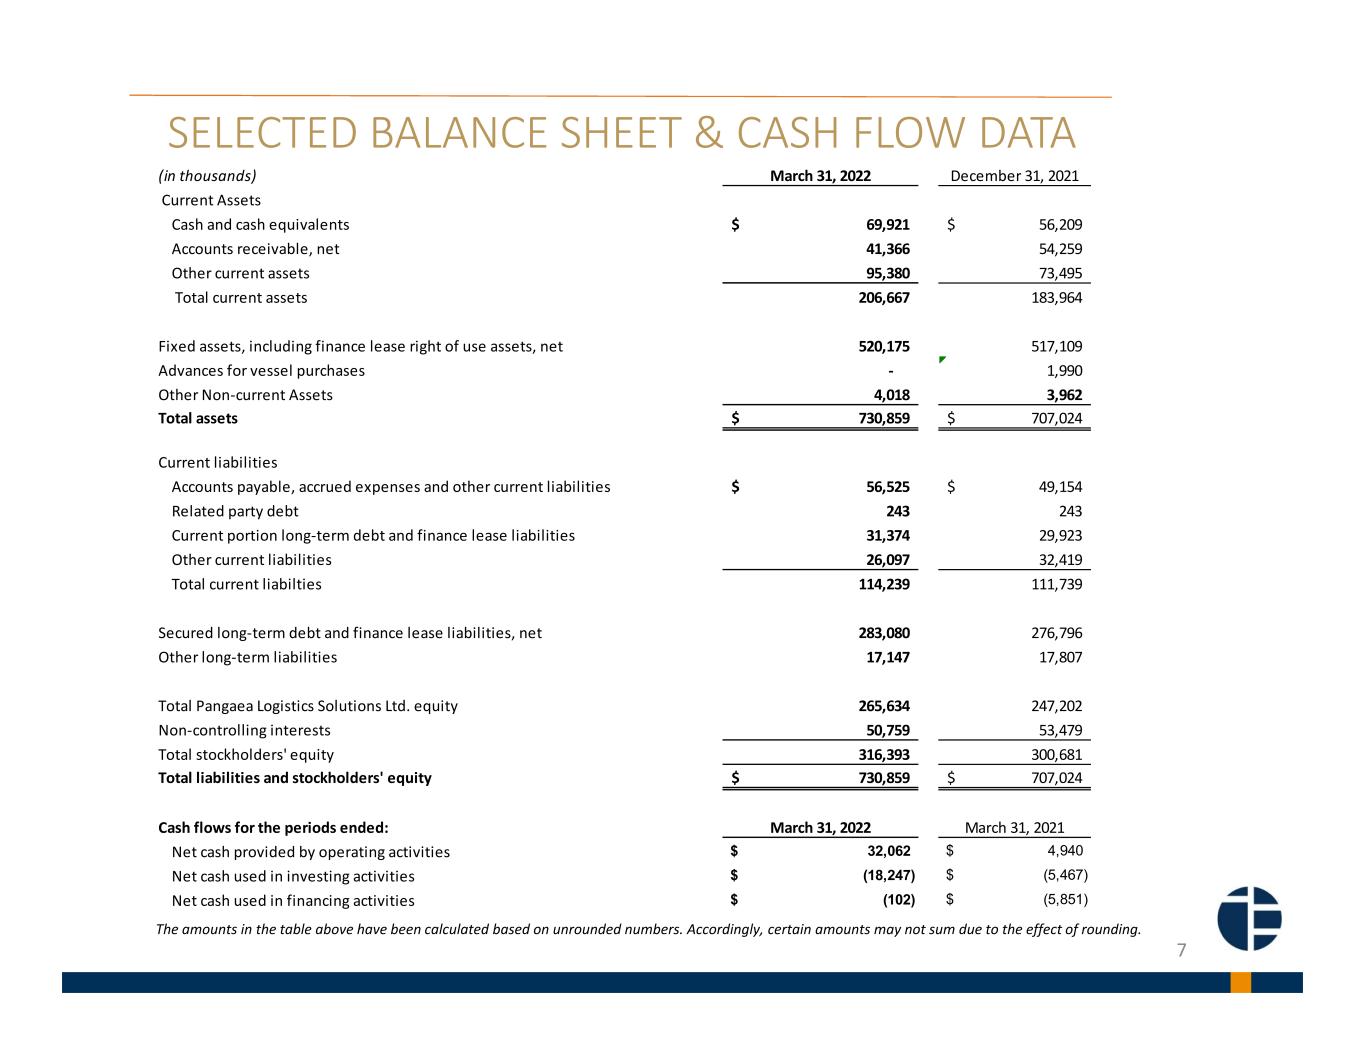
SELECTED BALANCE SHEET & CASH FLOW DATA 7 The amounts in the table above have been calculated based on unrounded numbers. Accordingly, certain amounts may not sum due to the effect of rounding. (in thousands) March 31, 2022 December 31, 2021 Current Assets Cash and cash equivalents 69,921$ 56,209$ Accounts receivable, net 41,366 54,259 Other current assets 95,380 73,495 Total current assets 206,667 183,964 Fixed assets, including finance lease right of use assets, net 520,175 517,109 Advances for vessel purchases ‐ 1,990 Other Non‐current Assets 4,018 3,962 Total assets 730,859$ 707,024$ Current liabilities Accounts payable, accrued expenses and other current liabilities 56,525$ 49,154$ Related party debt 243 243 Current portion long‐term debt and finance lease liabilities 31,374 29,923 Other current liabilities 26,097 32,419 Total current liabilties 114,239 111,739 Secured long‐term debt and finance lease liabilities, net 283,080 276,796 Other long‐term liabilities 17,147 17,807 Total Pangaea Logistics Solutions Ltd. equity 265,634 247,202 Non‐controlling interests 50,759 53,479 Total stockholders' equity 316,393 300,681 Total liabilities and stockholders' equity 730,859$ 707,024$ Cash flows for the periods ended: March 31, 2022 March 31, 2021 Net cash provided by operating activities 32,062$ 4,940$ Net cash used in investing activities (18,247)$ (5,467)$ Net cash used in financing activities (102)$ (5,851)$
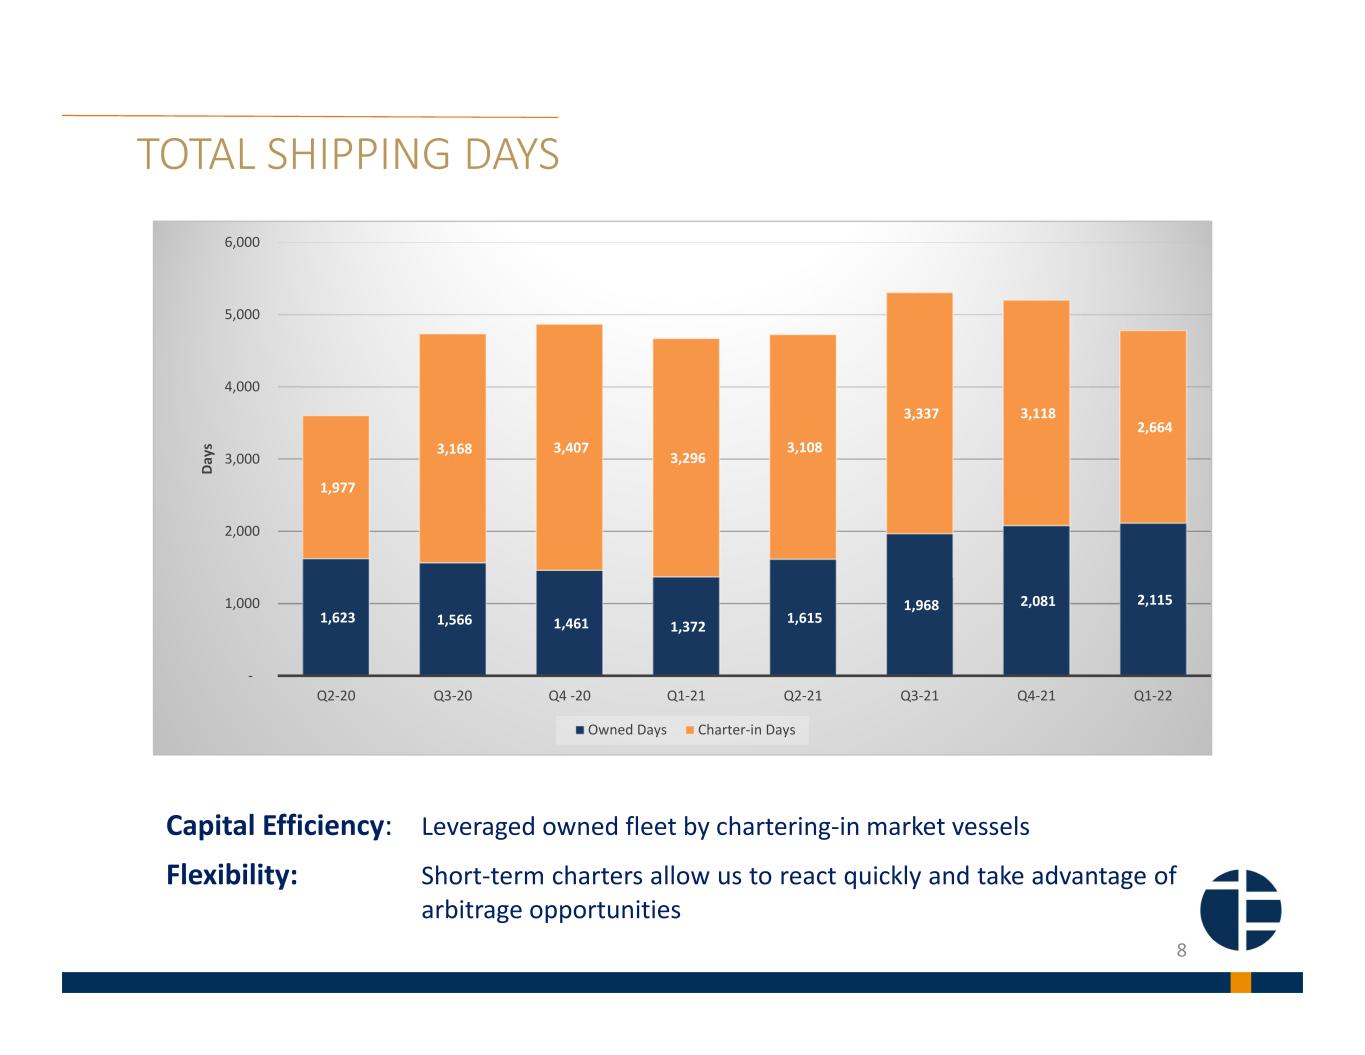
TOTAL SHIPPING DAYS 8 Capital Efficiency: Leveraged owned fleet by chartering‐in market vessels Flexibility: Short‐term charters allow us to react quickly and take advantage of arbitrage opportunities 1,623 1,566 1,461 1,372 1,615 1,968 2,081 2,115 1,977 3,168 3,407 3,296 3,108 3,337 3,118 2,664 ‐ 1,000 2,000 3,000 4,000 5,000 6,000 Q2‐20 Q3‐20 Q4 ‐20 Q1‐21 Q2‐21 Q3‐21 Q4‐21 Q1‐22 D ay s Owned Days Charter‐in Days
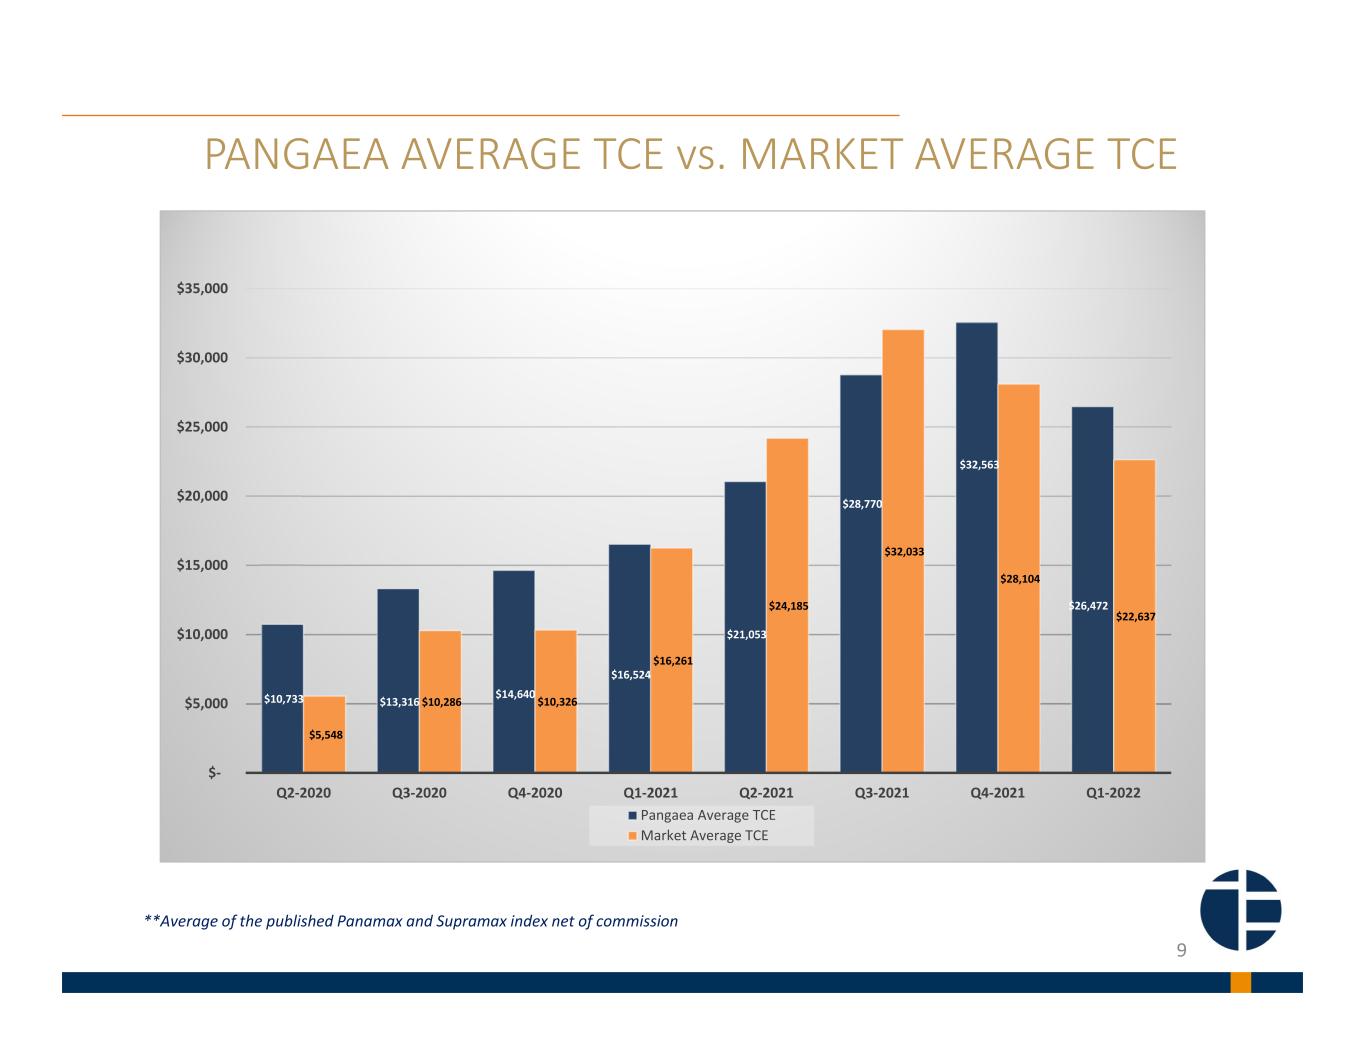
PANGAEA AVERAGE TCE vs. MARKET AVERAGE TCE 9 **Average of the published Panamax and Supramax index net of commission $10,733 $13,316 $14,640 $16,524 $21,053 $28,770 $32,563 $26,472 $5,548 $10,286 $10,326 $16,261 $24,185 $32,033 $28,104 $22,637 $‐ $5,000 $10,000 $15,000 $20,000 $25,000 $30,000 $35,000 Q2‐2020 Q3‐2020 Q4‐2020 Q1‐2021 Q2‐2021 Q3‐2021 Q4‐2021 Q1‐2022 Pangaea Average TCE Market Average TCE
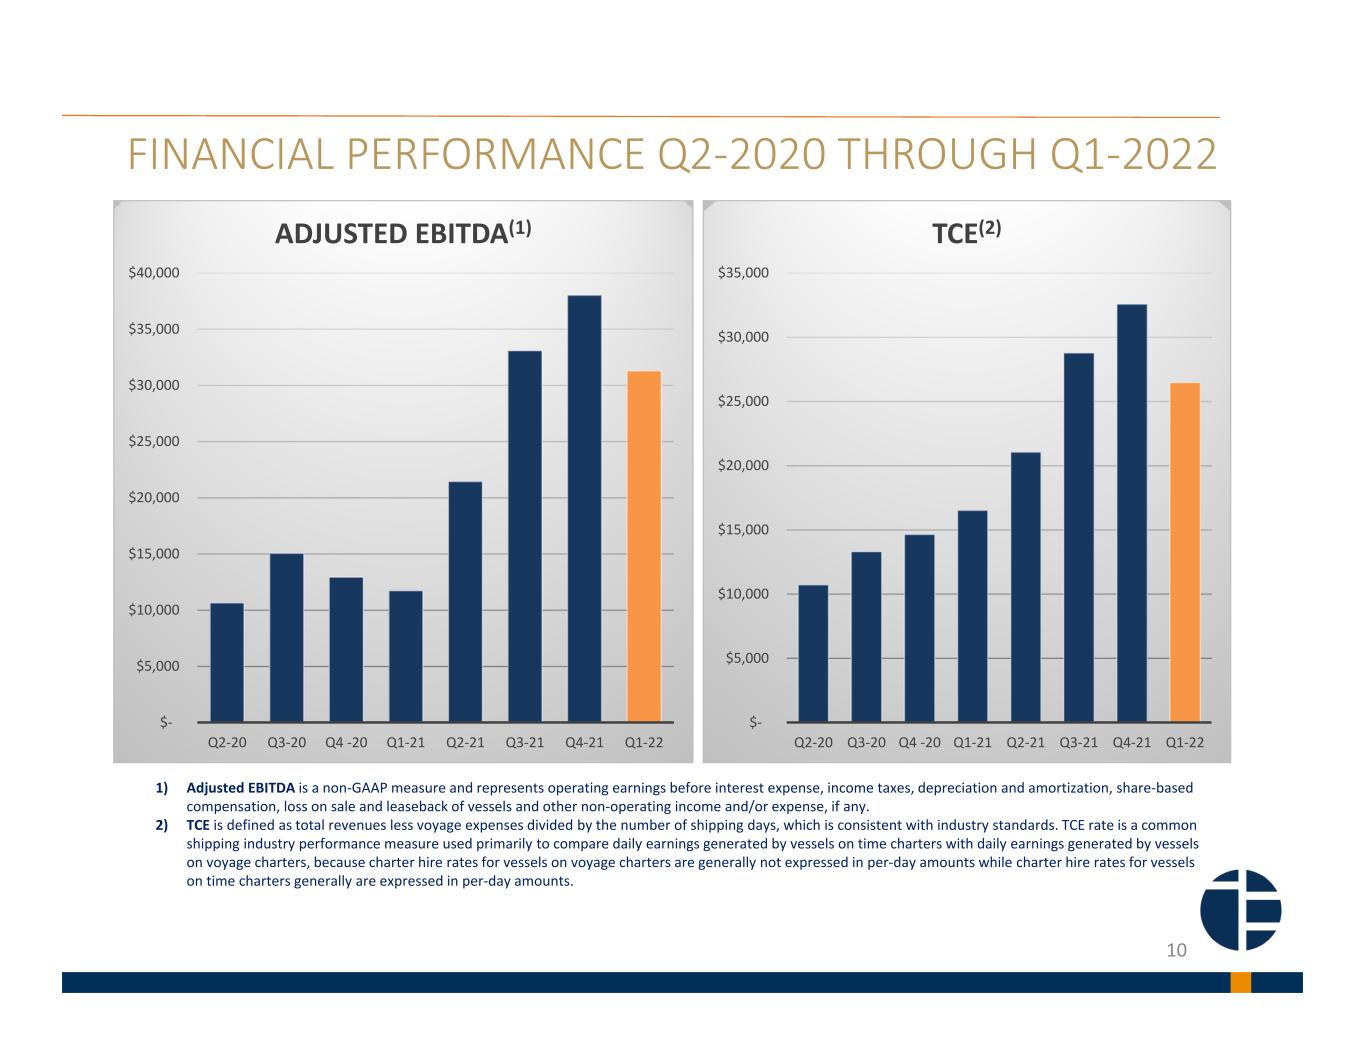
1) Adjusted EBITDA is a non‐GAAP measure and represents operating earnings before interest expense, income taxes, depreciation and amortization, share‐based compensation, loss on sale and leaseback of vessels and other non‐operating income and/or expense, if any. 2) TCE is defined as total revenues less voyage expenses divided by the number of shipping days, which is consistent with industry standards. TCE rate is a common shipping industry performance measure used primarily to compare daily earnings generated by vessels on time charters with daily earnings generated by vessels on voyage charters, because charter hire rates for vessels on voyage charters are generally not expressed in per‐day amounts while charter hire rates for vessels on time charters generally are expressed in per‐day amounts. FINANCIAL PERFORMANCE Q2‐2020 THROUGH Q1‐2022 10 $‐ $5,000 $10,000 $15,000 $20,000 $25,000 $30,000 $35,000 Q2‐20 Q3‐20 Q4 ‐20 Q1‐21 Q2‐21 Q3‐21 Q4‐21 Q1‐22 TCE(2) $‐ $5,000 $10,000 $15,000 $20,000 $25,000 $30,000 $35,000 $40,000 Q2‐20 Q3‐20 Q4 ‐20 Q1‐21 Q2‐21 Q3‐21 Q4‐21 Q1‐22 ADJUSTED EBITDA(1)
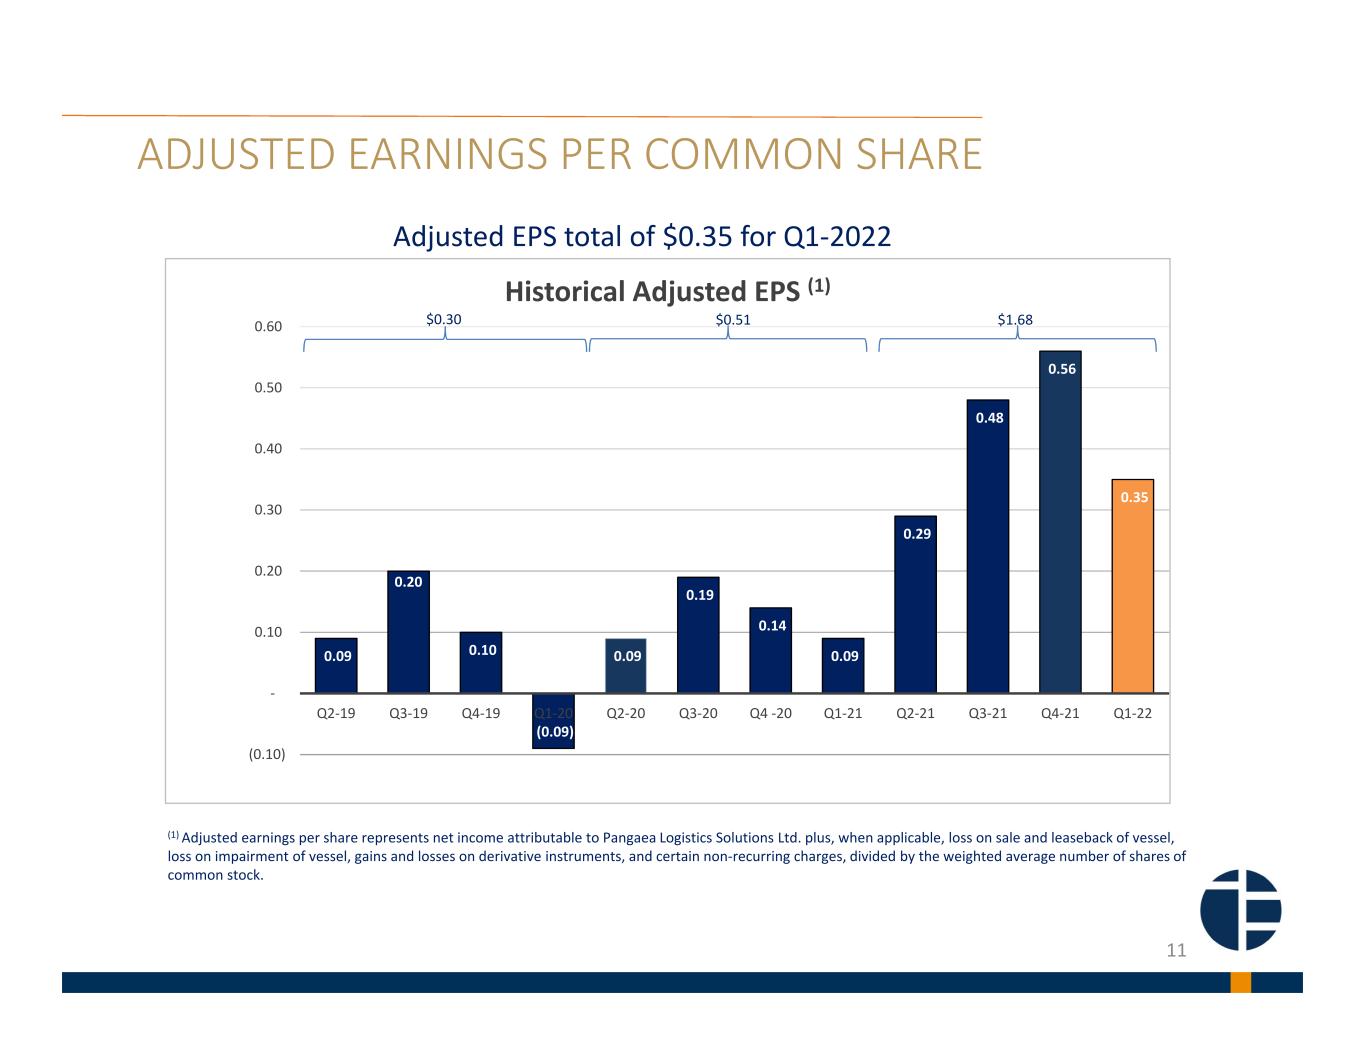
ADJUSTED EARNINGS PER COMMON SHARE 11 (1) Adjusted earnings per share represents net income attributable to Pangaea Logistics Solutions Ltd. plus, when applicable, loss on sale and leaseback of vessel, loss on impairment of vessel, gains and losses on derivative instruments, and certain non‐recurring charges, divided by the weighted average number of shares of common stock. Adjusted EPS total of $0.35 for Q1‐2022 0.09 0.20 0.10 (0.09) 0.09 0.19 0.14 0.09 0.29 0.48 0.56 0.35 (0.10) ‐ 0.10 0.20 0.30 0.40 0.50 0.60 Q2‐19 Q3‐19 Q4‐19 Q1‐20 Q2‐20 Q3‐20 Q4 ‐20 Q1‐21 Q2‐21 Q3‐21 Q4‐21 Q1‐22 Historical Adjusted EPS (1) $0.30 $0.51 $1.68
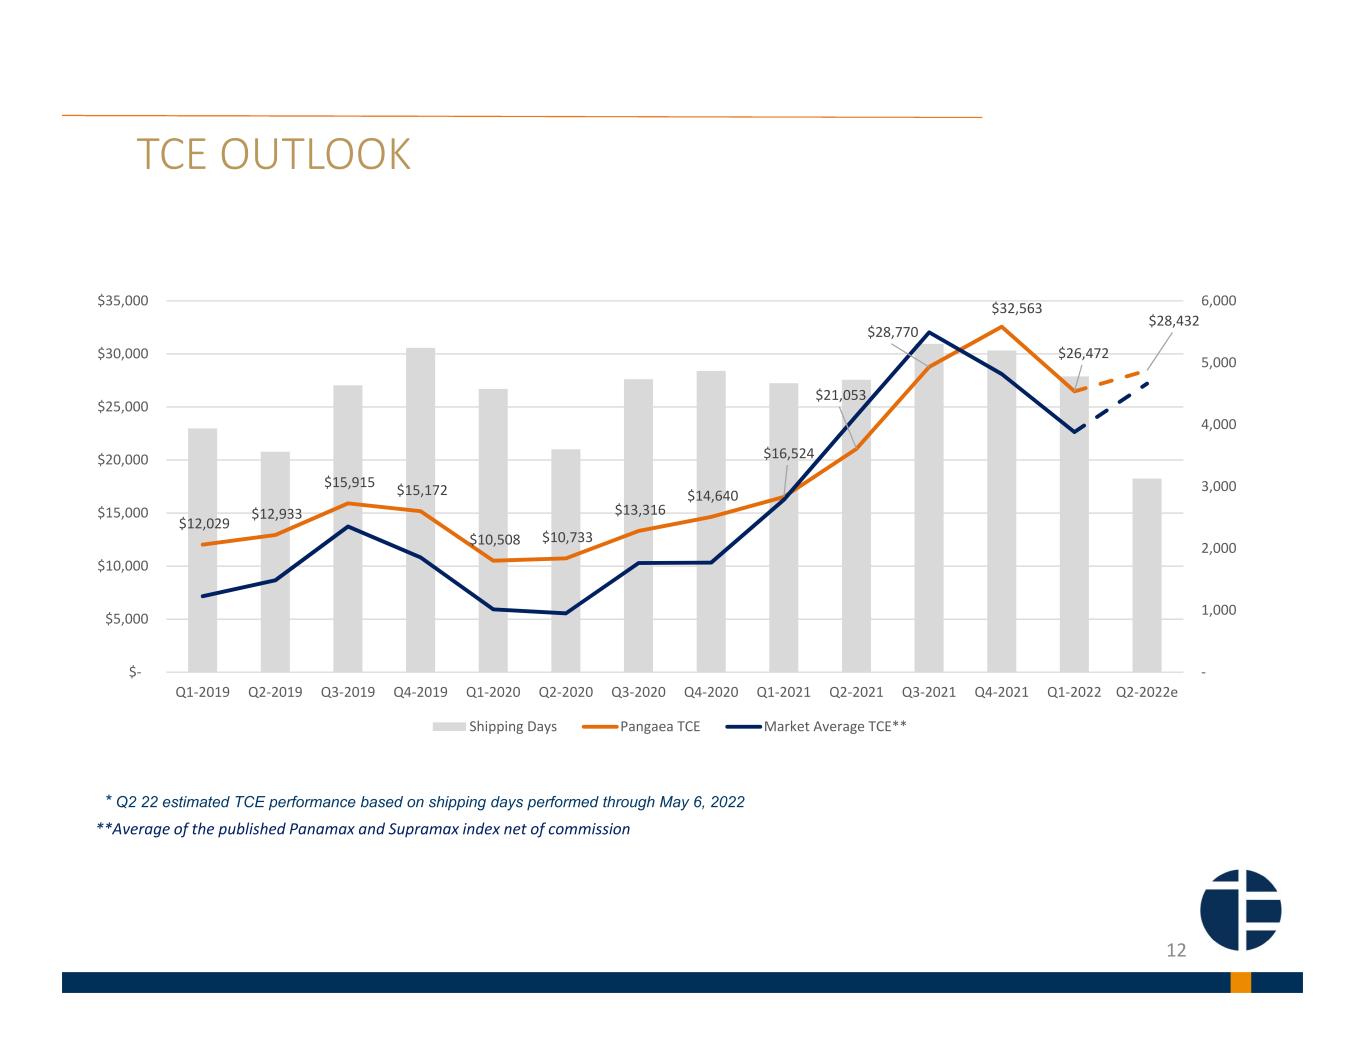
TCE OUTLOOK 12 * Q2 22 estimated TCE performance based on shipping days performed through May 6, 2022 **Average of the published Panamax and Supramax index net of commission $12,029 $12,933 $15,915 $15,172 $10,508 $10,733 $13,316 $14,640 $16,524 $21,053 $28,770 $32,563 $26,472 $28,432 ‐ 1,000 2,000 3,000 4,000 5,000 6,000 $‐ $5,000 $10,000 $15,000 $20,000 $25,000 $30,000 $35,000 Q1‐2019 Q2‐2019 Q3‐2019 Q4‐2019 Q1‐2020 Q2‐2020 Q3‐2020 Q4‐2020 Q1‐2021 Q2‐2021 Q3‐2021 Q4‐2021 Q1‐2022 Q2‐2022e Shipping Days Pangaea TCE Market Average TCE**