
PATK 8-K
Patrick Industries Inc (PATK)
8-K
2020-04-30
For: 2020-04-30
View Original
Added on
April 10, 2026
UNITED STATES
SECURITIES AND EXCHANGE COMMISSION
Washington, D.C. 20549
SECURITIES AND EXCHANGE COMMISSION
Washington, D.C. 20549
FORM
CURRENT REPORT
Pursuant To Section 13 OR 15(d) Of The Securities Exchange Act Of 1934
Date of report (Date of earliest event reported) | |
(Exact name of registrant as specified in its charter) | |
(State or other jurisdiction of incorporation) | (Commission File Number) | (IRS Employer Identification Number) |
(Address of Principal Executive Offices) | (Zip Code) | ||
Registrant’s Telephone Number, including area code | ||
(Former name or former address if changed since last report) | ||
Check the appropriate box below if the Form 8-K filing is intended to simultaneously satisfy the filing obligation of the registrant under any of the following provisions (see General Instruction A.2. below):
Securities registered pursuant to Section 12(b) of the Act:
Title of each class | Trading Symbol | Name of each exchange on which registered |
Indicate by check mark whether the registrant is an emerging growth company as defined in Rule 405 of the Securities Act of 1933 (§230.405 of this chapter) or Rule 12b-2 of the Securities Exchange Act of 1934 (§240.12b-2 of this chapter). Emerging growth company ☐
If an emerging growth company, indicate by check mark if the registrant has elected not to use the extended transition period for complying with any new or revised financial accounting standards provided pursuant to Section 13(a) of the Exchange Act. ¨
Item 2.02 Results of Operations and Financial Condition.
On April 30, 2020, the Company issued a press release announcing operating results for the first quarter ended March 29, 2020. A copy of the press release is furnished herewith as Exhibit 99.1 and incorporated herein by reference.
Item 7.01 Regulation FD Disclosure
The information referenced in this Form 8-K is furnished pursuant to Item 7.01, “Regulation FD Disclosure.” Such information, including the Exhibit attached hereto, shall not be deemed “filed” for purposes of Section 18 of the Securities Exchange Act of 1934, nor shall it be deemed incorporated by reference in any filing under the Securities Act of 1933, except as shall be expressly set forth by specific reference in such filing.
(a) Slides for Earnings Presentation as contained in Exhibit 99.2
Item 9.01 Financial Statements and Exhibits
(d) Exhibits
Exhibit 99.2 - Slides for Earnings Presentation
Exhibit 104 - Cover Page Interactive Date File (embedded within the Inline XBRL document)
SIGNATURES
Pursuant to the requirements of the Securities Exchange Act of 1934, the Registrant has duly caused this report to be signed on its behalf by the undersigned hereunto duly authorized.
PATRICK INDUSTRIES, INC. | ||
(Registrant) | ||
Date: April 30, 2020 | By: | /s/ Joshua A. Boone |
Joshua A. Boone | ||
Vice President - Finance and Chief Financial Officer | ||


Patrick Industries, Inc. Reports First Quarter 2020 Financial Results
First Quarter 2020 Highlights (all metrics compared to First Quarter 2019 unless otherwise noted)
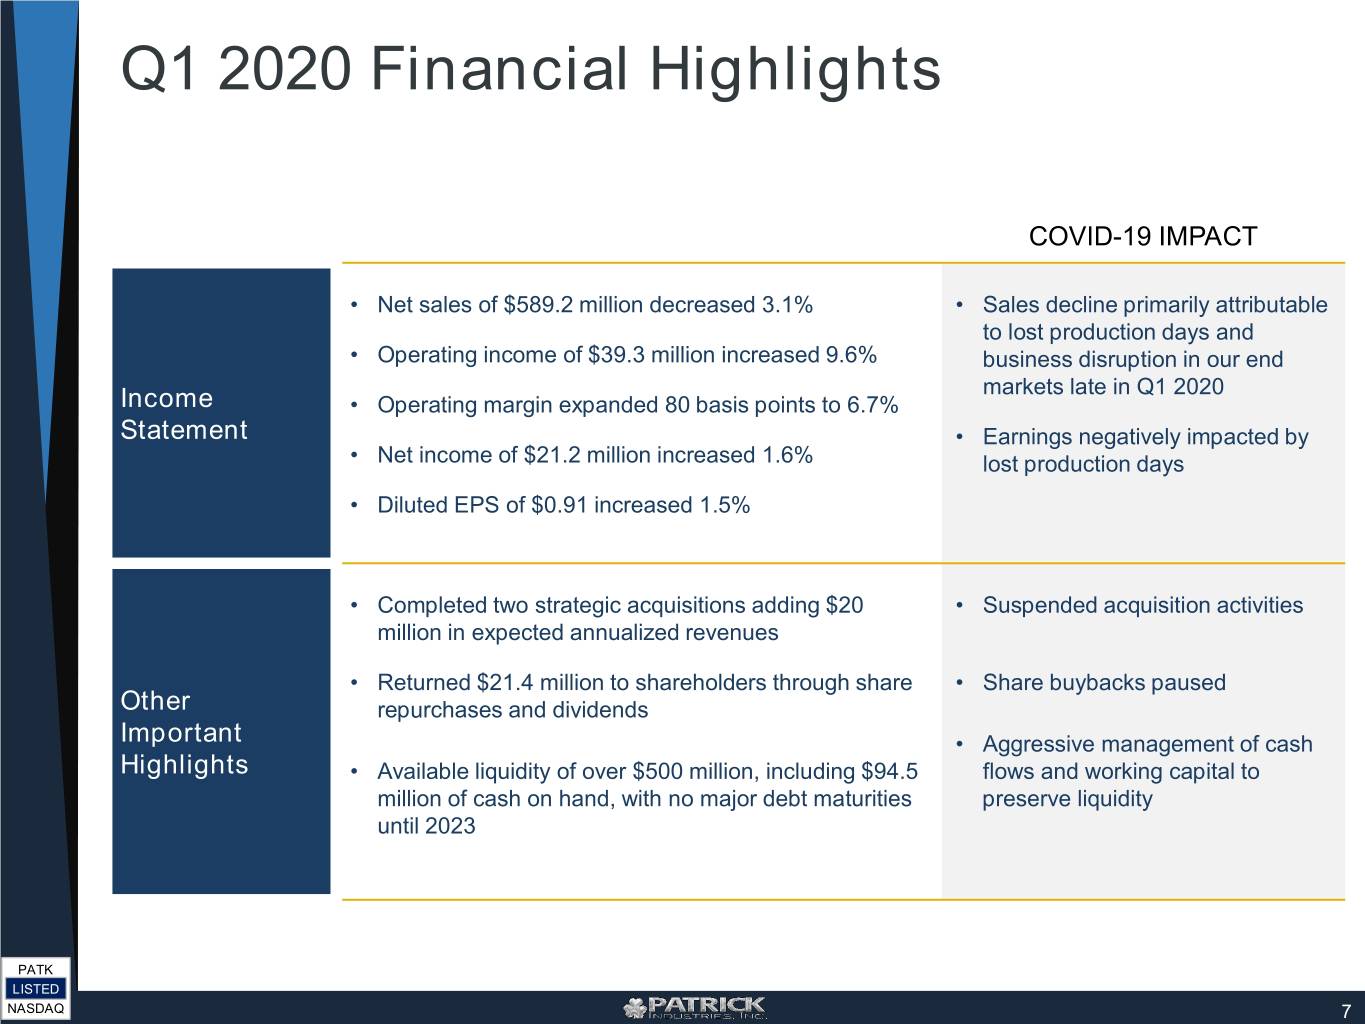
• | Net sales of $589.2 million decreased 3.1%; primarily attributable to lost shipping days and business disruption in our end markets in late March related to the COVID-19 pandemic |
• | Operating income of $39.3 million increased 9.6%; operating margin expanded 80 basis points to 6.7% |
• | Net income of $21.2 million increased 1.6% |
• | Diluted EPS of $0.91 increased 1.5% |
• | Available liquidity, including cash on hand, in excess of $500 million at the end of first quarter 2020 |
ELKHART, IN - April 30, 2020 - Patrick Industries, Inc. (NASDAQ: PATK), a major manufacturer and distributor of component and building products for the recreational vehicle (“RV”), marine, manufactured housing (“MH”), and industrial markets, today reported financial results for the first quarter ended March 29, 2020.
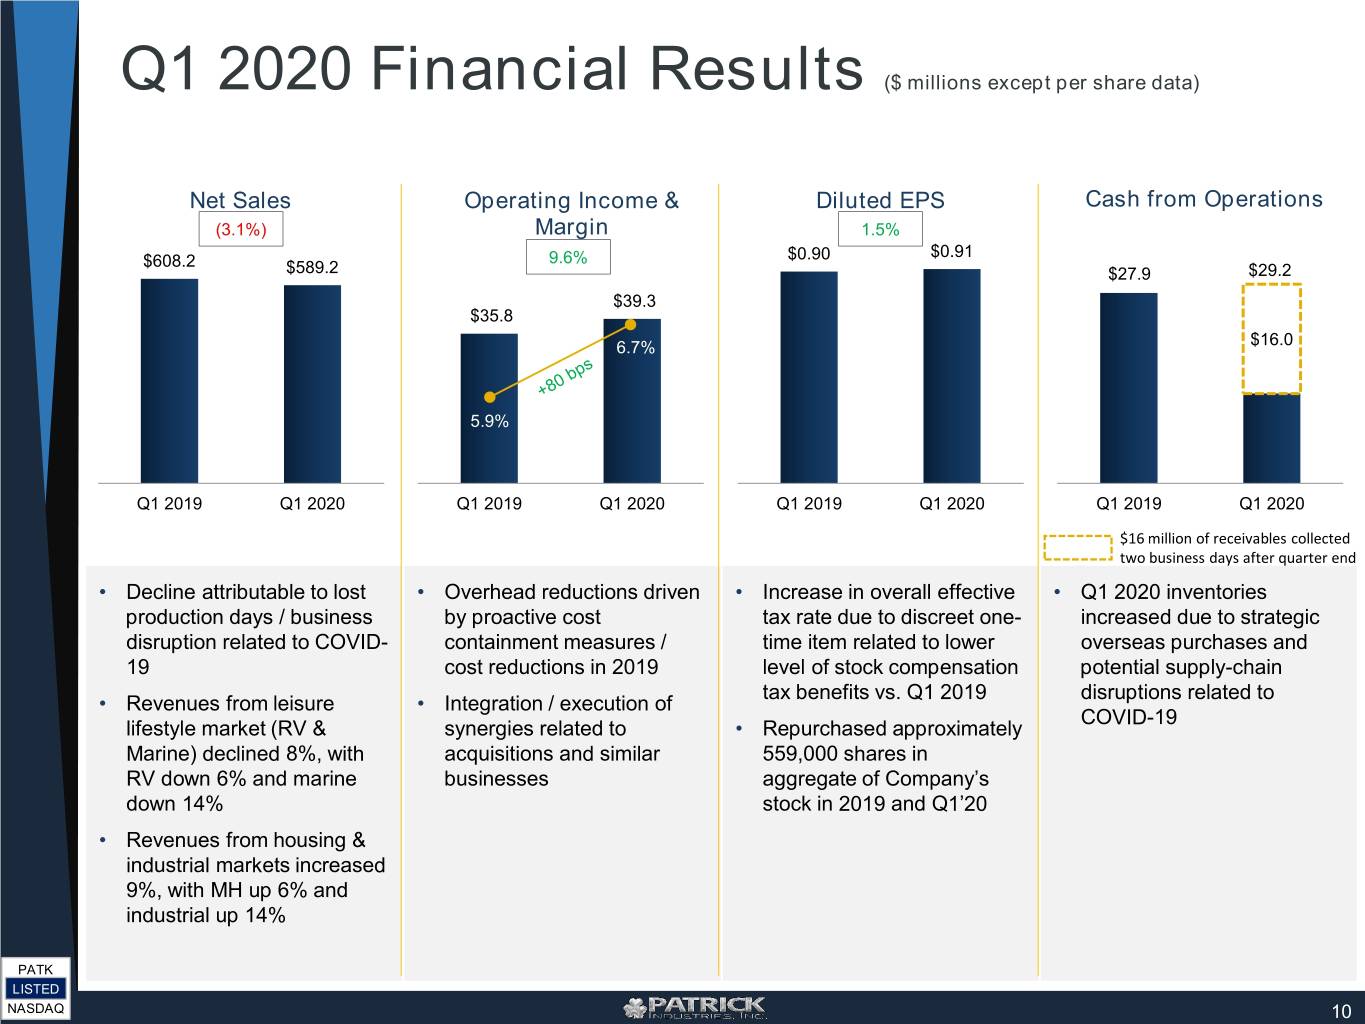
Net sales for the first quarter of 2020 decreased $19.0 million, or 3.1%, to $589.2 million from $608.2 million in the same quarter of 2019. The decrease in the quarter was primarily attributable to lost shipping days and business disruption in our end markets in late March related to the COVID-19 pandemic.
Patrick reported operating income of $39.3 million, an increase of 9.6% or $3.5 million, from $35.8 million reported in the first quarter of 2019. Net income in the first quarter of 2020 was $21.2 million compared to $20.8 million in the first quarter of 2019, and net income per diluted share was $0.91 and $0.90 for the first quarter of 2020 and 2019, respectively.
"Our first quarter results reflect both the momentum and positive traction experienced across all of our end markets in the first two months of the year, followed by business disruptions caused by the unprecedented and sudden COVID-19 pandemic, as many of our customers reduced production levels and purchases of our products which impacted our operations in late March,” said Andy Nemeth, President and Chief Executive Officer. “Despite the impact of COVID-19 on our business, we are encouraged by our first quarter performance and are exceptionally proud of our talented and dedicated team members who immediately adjusted to the rapidly changing environment.”
“Additionally, the diversification of our end markets and geographic regions in which we operate have helped to lessen the impact of COVID-19 on our results, as certain plants in various parts of the country remained operational throughout March. The actions that we have taken over the past twelve months have continued to drive operational efficiencies and further optimize our cost structure, including the $10 million annualized fixed cost reduction implemented in the third quarter of 2019. The integration of acquisitions and execution of synergies across our business units has also helped to partially offset the financial impacts of COVID-19 and position our organization to be nimble in the current environment,” Mr. Nemeth continued.
First Quarter 2020 Sales by Market Sector
RV (55% of Sales)
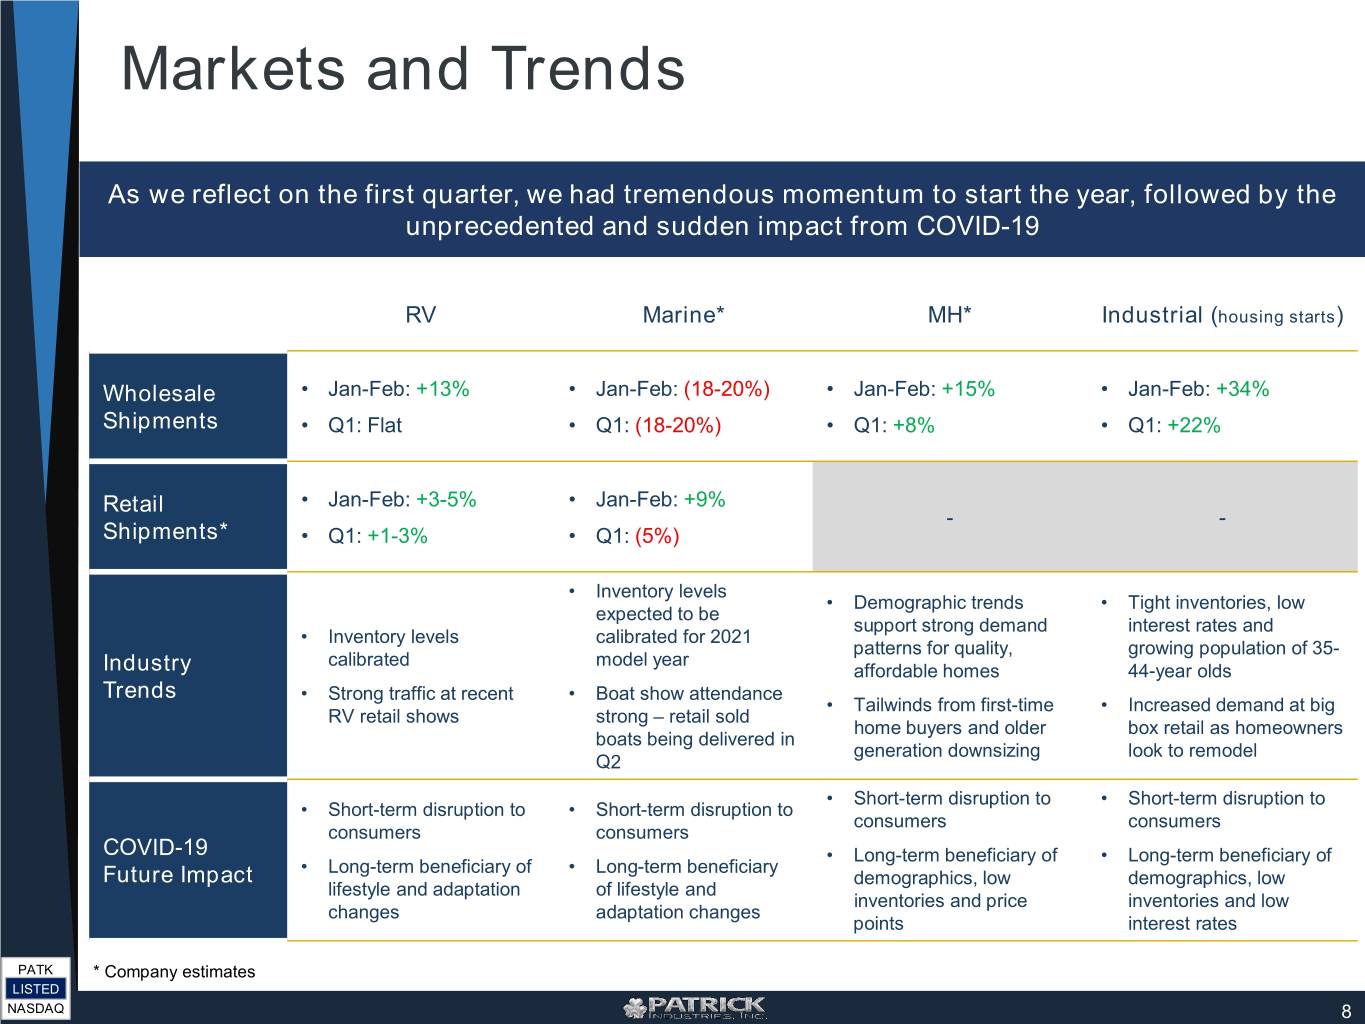
• | Revenues of $320.2 million decreased 6%, compared to flat RV industry wholesale unit shipments for the quarter; |
• | RV content per wholesale unit (on a trailing twelve-month basis) decreased 1% to $3,112 from $3,131 for the first quarter of 2019. |
1
Marine (13% of Sales)
• | Revenues of $78.0 million decreased 14%, while marine powerboat industry wholesale unit shipments decreased between 18% and 20%, according to Company estimates; |
• | Marine powerboat content per retail unit (on a trailing twelve-month basis) increased 3% to an estimated $1,531 from $1,484 for the first quarter of 2019. |
MH (19% of Sales)
• | Revenues of $112.4 million increased 6% compared to the prior year, with an 8% increase in MH industry wholesale unit shipments, according to Company estimates; |
• | MH content per wholesale unit (on a trailing twelve-month basis) for the first quarter of 2020 increased 35% to an estimated $4,596 from $3,415 for the first quarter of 2019. |
Industrial (13% of Sales)
• | Revenues of $78.6 million increased 14% compared to the prior year; |
• | In residential housing, the Company’s primary industrial market, new housing starts in the first quarter of 2020 increased 22% compared to the first quarter of 2019. |
The Company’s content per unit in the RV, marine and MH market sectors was negatively impacted in the quarter as manufacturers curtailed production in late March while continuing to ship finished product and reduce inventory levels in preparation for the short-term suspension of their operations related to COVID-19.
COVID-19 Business Continuity and Operations Update
As previously communicated, the COVID-19 pandemic caused a disruption to the Company’s operations during the latter half of March and through the month of April. In order to prioritize the safety and well-being of Patrick team members, continue to balance production levels with customer demand, and comply with government mandates while maximizing cash flows and liquidity, the Company temporarily suspended operations at certain facilities over the last five weeks and furloughed affected team members with benefits. Additionally, the Company proactively took the following cost containment and financial management measures:
• | Voluntary compensation reduction by the executive team |
• | Voluntary reduction in quarterly compensation for the Board of Directors |
• | Compensation reduction for salaried team members |
• | Freeze on all non-essential hiring |
• | Reduction of all non-essential spending |
• | Prioritization of critical maintenance capital expenditures |
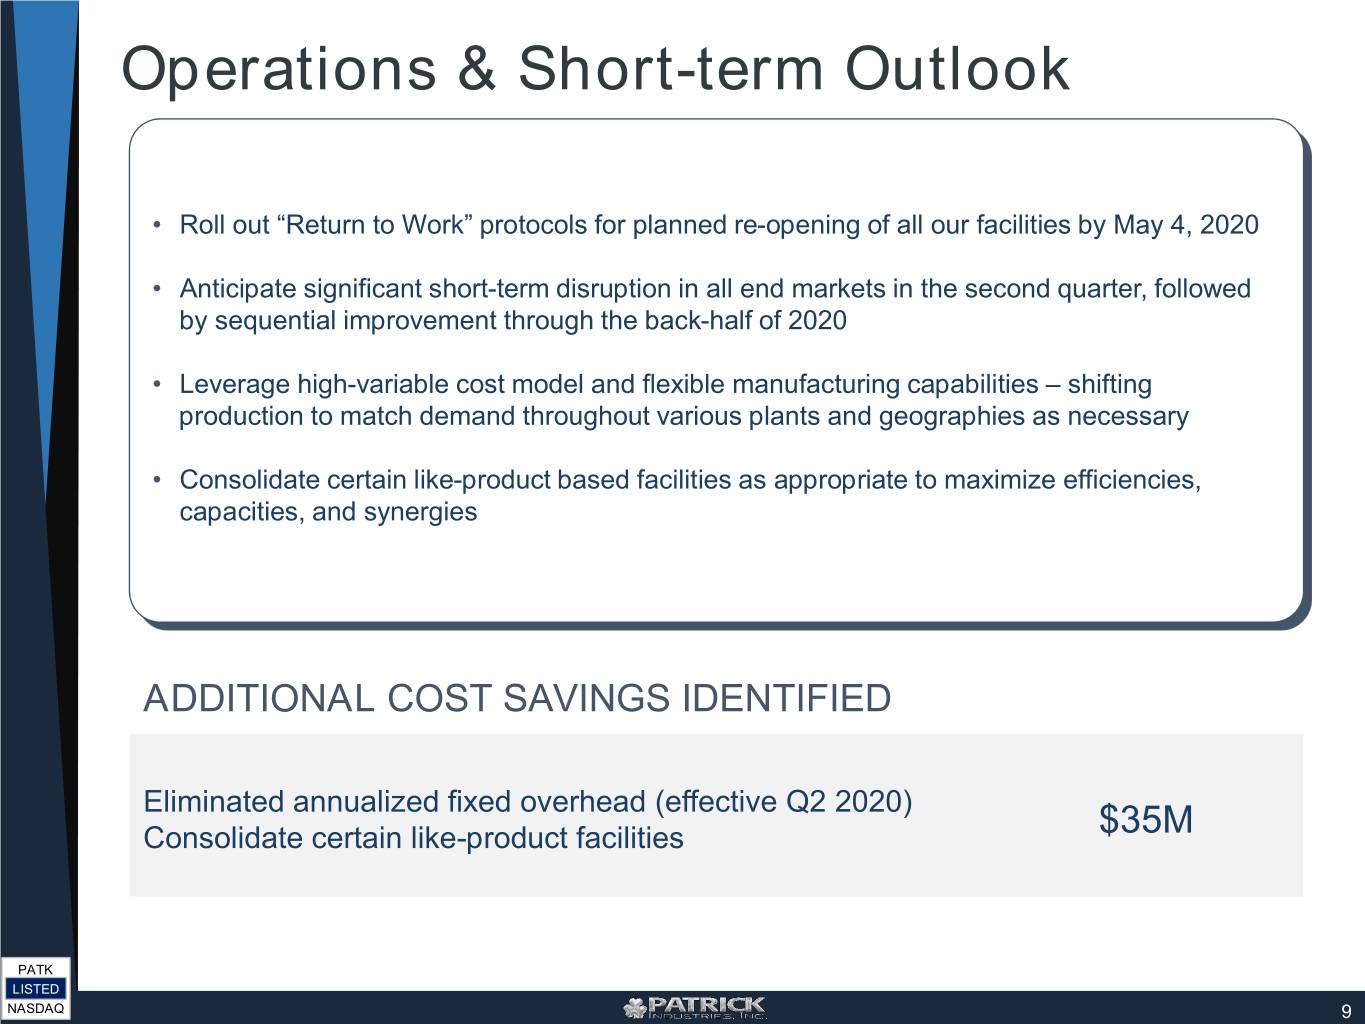
The Company has certain facilities across the country that have remained operational throughout this time, and the majority of its other facilities either have re-opened already or are expected to return to operation by May 4, 2020. As plants resume operations, the Company has implemented specific policies and procedures across the organization in conjunction with guidelines established by the Centers for Disease Control to ensure Patrick maintains a safe work environment for all team members, which is the Company’s highest priority.
Balance Sheet, Cash Flow and Capital Allocation
Patrick generated cash flow from operations of $13.2 million in the quarter, a decrease of 53% compared to the prior year, which excludes $16 million of receivables collected within two business days following the quarter end. Inclusive of the $16 million collection of receivables, cash flow from operations would be $29 million, consistent with the prior year. Capital expenditures during the quarter were $7.6 million, a decrease of 24% due to a higher level of strategic project spending in the first quarter of 2019 and the Company’s efforts to reduce non-essential capital expenditures during March 2020 as a result of COVID-19.
The Company returned $21.4 million to shareholders during the quarter including $5.8 million in the form of quarterly dividends and $15.6 million in share repurchases and completed two strategic acquisitions with $20 million in expected annual revenues. While there is $43.5 million remaining under the current repurchase authorization, the Company has decided to pause its share buyback program at this time. In addition, the Company will continue to curtail strategic capital expenditures and has suspended acquisition activities until there is greater visibility into the macro environment. Given the current environment, and out of an abundance of caution, the Company remains focused on maintaining liquidity and maximizing cash flow.
2
The Company’s net debt at the end of the quarter was approximately $610 million. Available liquidity, comprised of borrowing availability under the Company’s credit facility and inclusive of $94.5 million of cash on hand, was approximately $505 million, with no major debt maturities until 2023.
2020 Outlook
“As we progress through the second quarter, our cost reduction and financial management measures that were implemented late in the first quarter remain in place,” added Mr. Nemeth. “We have recently taken additional steps to further reduce our fixed cost structure to align with projected revenues, consolidating certain like-product facilities as appropriate to maximize efficiencies, and have eliminated approximately $35 million of annualized fixed overhead, which will take effect in the second quarter of 2020. We have developed detailed, tiered execution plans, and as we continue to assess the macro environment and related demand levels within our market sectors, we will enact further measures as deemed necessary to adapt to the rapidly changing environment. Furthermore, in September 2019, we amended and extended our credit facility in conjunction with the issuance of senior notes to both support our long-term strategic plan and for defensive purposes for unanticipated situations such as this pandemic. Our capital structure and financial position remain strong and provide ample liquidity, which together with the flexibility of our highly variable cost model, will help us to manage through the economic turmoil and be able to quickly pivot and execute on our strategic growth initiatives once stability and visibility in the markets improve.”
Mr. Nemeth continued, “I am extremely proud of all of our passionate and dedicated team members throughout the organization who have worked diligently and tirelessly as we manage through these unprecedented times. Their commitment to our Company, each other, and our communities has been truly inspiring. Our organization, team members, and business units have continued to donate and manufacture personal protective equipment for front line COVID-19 workers in our local communities, volunteer their time, and sponsor lunches for medical professionals and staff at several local hospitals. As we look to the second quarter of 2020 and the remainder of the year, our organization remains extremely focused on short-term planning and execution with a commitment to our long-term goals of executing our strategic plan, driving shareholder value, reinvesting in our team members and communities, dealing responsibly with our business partners, and servicing our customers at the highest level.”
Conference Call Webcast
As previously announced, Patrick Industries will host an online webcast of its first quarter 2020 earnings conference call that can be accessed on the Company’s website, www.patrickind.com, under “Investor Relations,” on Thursday, April 30, 2020 at 10:00 a.m. Eastern time. In addition, a supplemental earnings presentation can be accessed on the Company’s website, www.patrickind.com under “Investor Relations - Presentations.”
About Patrick Industries, Inc.
Patrick Industries, Inc. is a major manufacturer and distributor of component products and building products serving the recreational vehicle, marine, manufactured housing, residential housing, high-rise, hospitality, kitchen cabinet, office and household furniture, fixtures and commercial furnishings, and other industrial markets and operates coast-to-coast in various locations throughout the United States and in Canada, China and the Netherlands. Patrick’s major manufactured products include decorative vinyl and paper laminated panels, countertops, fabricated aluminum products, wrapped profile mouldings, slide-out trim and fascia, cabinet doors and components, hardwood furniture, fiberglass bath fixtures and tile systems, thermoformed shower surrounds, specialty bath and closet building products, fiberglass and plastic helm systems and component products, wiring and wire harnesses, boat covers, towers, tops and frames, electrical systems components including instrument and dash panels, softwoods lumber, interior passage doors, air handling products, RV painting, slotwall panels
and components, aluminum fuel tanks, and CNC molds and composite parts and other products. The Company also distributes drywall and drywall finishing products, electronics and audio systems components, wiring, electrical and plumbing products, appliances, cement siding, raw and processed lumber, FRP products, interior passage doors, roofing products, tile, laminate and ceramic flooring, shower doors, furniture, fireplaces and surrounds, interior and exterior lighting products, and other miscellaneous products, in addition to providing transportation and logistics services.
3
Use of Financial Metrics
In addition to reporting financial results in accordance with U.S. GAAP, the Company also provides financial metrics, such as RV, marine and MH content per unit, net debt and available liquidity, which we believe are important measures of the Company's business performance. These metrics should not be considered alternatives to U.S. GAAP. Our computations of content per unit, net debt and available liquidity may differ from similarly titled measures used by others. You should not consider these metrics in isolation or as substitutes for an analysis of our results as reported under U.S. GAAP.
Cautionary Statement Regarding Forward-Looking Statements
This press release contains certain statements related to future results, our intentions, beliefs and expectations or predictions for the future, which are forward-looking statements as that term is defined in the Private Securities Litigation Reform Act of 1995. These forward-looking statements involve a number of risks and uncertainties that could cause actual results to differ materially from either historical or anticipated results depending on a variety of factors. Potential factors that could impact results include: the impact of the continuing financial and operational uncertainty due to the COVID-19 pandemic, including its impact on the overall economy, our sales, customers, operations, team members, suppliers, and the countries where we have operations or from which we source products and raw materials, such as China; adverse economic and business conditions, including cyclicality and seasonality in the industries we sell our products; the deterioration of the financial condition of our customers or suppliers; the loss of a significant customer; changes in consumer preferences; pricing pressures due to competition; conditions in the credit market limiting the ability of consumers and wholesale customers to obtain retail and wholesale financing for RVs, manufactured homes, and marine products; the imposition of restrictions and taxes on imports of raw materials and components used in our products; information technology performance and security; any increased cost or limited availability of certain raw materials; the impact of governmental and environmental regulations, and our inability to comply with them; our level of indebtedness; the ability to remain in compliance with our credit agreement covenants; the availability and costs of labor and production facilities; inventory levels of retailers and manufacturers; the ability to generate cash flow or obtain financing to fund growth; future growth rates in the Company's core businesses; realization and impact of efficiency improvements and cost reductions; the successful integration of acquisitions and other growth initiatives; increases in interest rates and oil and gasoline prices; the ability to retain key executive and management personnel; the disruption of business resulting from natural disasters or other unforeseen events, and adverse weather conditions impacting retail sales.
There can be no assurance that any forward-looking statement will be realized or that actual results will not be significantly different from that set forth in such forward-looking statement. The Company does not undertake to publicly update or revise any forward-looking statements except as required by law. Information about certain risks that could affect our business and cause actual results to differ from those expressed or implied in the forward-looking statements are contained in the section entitled “Risk Factors” in the Company’s Annual Report on Form 10-K for the year ended December 31, 2019, which is filed with the Securities and Exchange Commission (“SEC”) and is available on the SEC’s website at www.sec.gov. Each forward-looking statement speaks only as of the date of this press release, and we undertake no obligation to update any forward-looking statement to reflect events or circumstances occurring after the date on which it is made.
Contact:
Julie Ann Kotowski
Investor Relations
574.294.7511
4
PATRICK INDUSTRIES, INC. | |||||||
CONDENSED CONSOLIDATED STATEMENTS OF INCOME (Unaudited) | |||||||
First Quarter Ended | |||||||
(thousands except per share data) | March 29, 2020 | March 31, 2019 | |||||
NET SALES | $ | 589,232 | $ | 608,218 | |||
Cost of goods sold | 479,751 | 501,670 | |||||
GROSS PROFIT | 109,481 | 106,548 | |||||
Operating Expenses: | |||||||
Warehouse and delivery | 24,732 | 24,041 | |||||
Selling, general and administrative | 35,869 | 37,692 | |||||
Amortization of intangible assets | 9,601 | 8,989 | |||||
Total operating expenses | 70,202 | 70,722 | |||||
OPERATING INCOME | 39,279 | 35,826 | |||||
Interest expense, net | 10,492 | 8,983 | |||||
Income before income taxes | 28,787 | 26,843 | |||||
Income taxes | 7,600 | 5,994 | |||||
NET INCOME | $ | 21,187 | $ | 20,849 | |||
BASIC NET INCOME PER COMMON SHARE | $ | 0.92 | $ | 0.90 | |||
DILUTED NET INCOME PER COMMON SHARE | $ | 0.91 | $ | 0.90 | |||
Weighted average shares outstanding - Basic | 23,016 | 23,039 | |||||
Weighted average shares outstanding - Diluted | 23,267 | 23,248 | |||||
5
PATRICK INDUSTRIES, INC. | |||||||
CONDENSED CONSOLIDATED STATEMENTS OF FINANCIAL POSITION (Unaudited) | |||||||
As of | |||||||
(thousands) | March 29, 2020 | December 31, 2019 | |||||
ASSETS | |||||||
Current Assets | |||||||
Cash and cash equivalents | $ | 94,523 | $ | 139,390 | |||
Trade receivables, net | 154,571 | 87,536 | |||||
Inventories | 273,545 | 253,870 | |||||
Prepaid expenses and other | 26,275 | 36,038 | |||||
Total current assets | 548,914 | 516,834 | |||||
Property, plant and equipment, net | 189,129 | 180,849 | |||||
Operating lease right-of-use assets | 98,291 | 93,546 | |||||
Goodwill and intangible assets, net | 682,549 | 676,363 | |||||
Deferred financing costs, net | 2,868 | 2,978 | |||||
Other non-current assets | 407 | 423 | |||||
TOTAL ASSETS | $ | 1,522,158 | $ | 1,470,993 | |||
LIABILITIES AND SHAREHOLDERS’ EQUITY | |||||||
Current Liabilities | |||||||
Current maturities of long-term debt | $ | 5,000 | $ | 5,000 | |||
Current operating lease liabilities | 28,168 | 27,694 | |||||
Accounts payable | 138,146 | 96,208 | |||||
Accrued liabilities | 64,889 | 58,033 | |||||
Total current liabilities | 236,203 | 186,935 | |||||
Long-term debt, less current maturities, net | 672,235 | 670,354 | |||||
Long-term operating lease liabilities | 70,831 | 66,467 | |||||
Deferred tax liabilities, net | 26,546 | 27,284 | |||||
Other long-term liabilities | 20,967 | 22,472 | |||||
TOTAL LIABILITIES | 1,026,782 | 973,512 | |||||
SHAREHOLDERS’ EQUITY | |||||||
Common stock | 170,626 | 172,662 | |||||
Additional paid-in-capital | 24,534 | 25,014 | |||||
Accumulated other comprehensive loss | (8,741 | ) | (5,698 | ) | |||
Retained earnings | 308,957 | 305,503 | |||||
TOTAL SHAREHOLDERS’ EQUITY | 495,376 | 497,481 | |||||
TOTAL LIABILITIES AND SHAREHOLDERS’ EQUITY | $ | 1,522,158 | $ | 1,470,993 | |||
6
PATRICK INDUSTRIES, INC.
CONDENSED CONSOLIDATED STATEMENTS OF CASH FLOWS (Unaudited)
Three Months Ended | |||||||
(thousands) | March 29, | March 31, | |||||
2020 | 2019 | ||||||
CASH FLOWS FROM OPERATING ACTIVITIES | |||||||
Net income | $ | 21,187 | $ | 20,849 | |||
Depreciation and amortization | 17,175 | 15,543 | |||||
Stock-based compensation expense | 4,311 | 3,947 | |||||
Amortization of convertible notes debt discount | 1,723 | 1,671 | |||||
Other adjustments to reconcile net income to net cash provided by operating activities | 750 | 1,048 | |||||
Change in operating assets and liabilities, net of acquisitions of businesses | (31,982 | ) | (15,174 | ) | |||
Net cash provided by operating activities | 13,164 | 27,884 | |||||
CASH FLOWS FROM INVESTING ACTIVITIES | |||||||
Capital expenditures | (7,580 | ) | (10,005 | ) | |||
Other investing activities | (24,260 | ) | 150 | ||||
Net cash used by investing activities | (31,840 | ) | (9,855 | ) | |||
NET CASH FLOWS USED BY FINANCING ACTIVITIES | (26,191 | ) | (16,470 | ) | |||
Increase (decrease) in cash and cash equivalents | (44,867 | ) | 1,559 | ||||
Cash and cash equivalents at beginning of period | 139,390 | 6,895 | |||||
Cash and cash equivalents at end of period | $ | 94,523 | $ | 8,454 | |||
7

Q1 2020 Earnings Presentation April 30, 2020

Forward-Looking Statements This presentation contains certain statements related to future results, our intentions, beliefs and expectations or predictions for the future which are forward-looking statements as that term is defined in the Private Securities Litigation Reform Act of 1995. These forward-looking statements involve a number of risks and uncertainties that could cause actual results to differ materially from either historical or anticipated results depending on a variety of factors. These risks and uncertainties include, but are not limited to, the impact of the continuing financial and operational uncertainty due to the COVID-19 pandemic, including its impact on the overall economy, our sales, customers, operations, team members and suppliers. Further information concerning the Company and its business, including factors that potentially could materially affect the Company’s financial results, is contained in the Company’s filings with the Securities and Exchange Commission. This presentation includes market and industry data, forecasts and valuations that have been obtained from independent consultant reports, publicly available information, various industry publications and other published industry sources. Although we believe these sources are reliable, we have not independently verified the information and cannot make any representation as to the accuracy or completeness of such information. We disclaim any obligation or undertaking to disseminate any updates or revisions to any forward- looking statements contained in this presentation or to reflect any change in our expectations after the date of this presentation or any change in events, conditions or circumstances on which any statement is based. Use of Non-GAAP Financial Measures This presentation contains non-GAAP financial measures. These measures, the purposes for which management uses them, why management believes they are useful to investors, and a reconciliation to the most directly comparable GAAP financial measures can be found in the Appendix of this presentation. All references to profit measures and earnings per share on a comparable basis exclude items that affect comparability. PATK LISTED NASDAQ 2
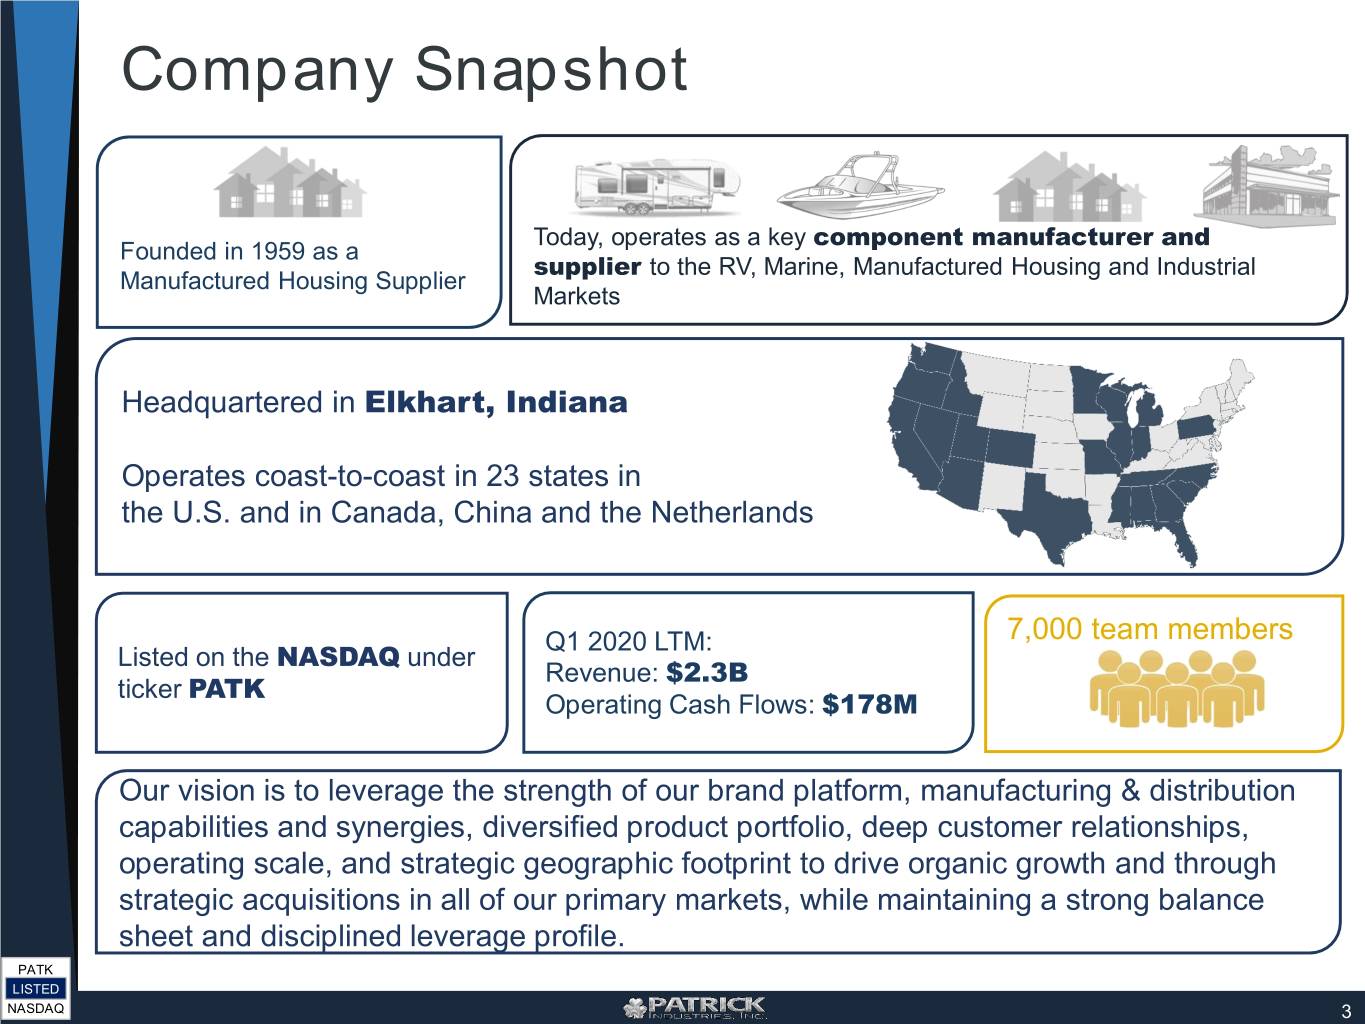
Company Snapshot Today, operates as a key component manufacturer and Founded in 1959 as a supplier to the RV, Marine, Manufactured Housing and Industrial Manufactured Housing Supplier Markets Headquartered in Elkhart, Indiana Operates coast-to-coast in 23 states in the U.S. and in Canada, China and the Netherlands Q1 2020 LTM: 7,000 team members Listed on the NASDAQ under Revenue: $2.3B ticker PATK Operating Cash Flows: $178M Our vision is to leverage the strength of our brand platform, manufacturing & distribution capabilities and synergies, diversified product portfolio, deep customer relationships, operating scale, and strategic geographic footprint to drive organic growth and through strategic acquisitions in all of our primary markets, while maintaining a strong balance sheet and disciplined leverage profile. PATK LISTED NASDAQ 3
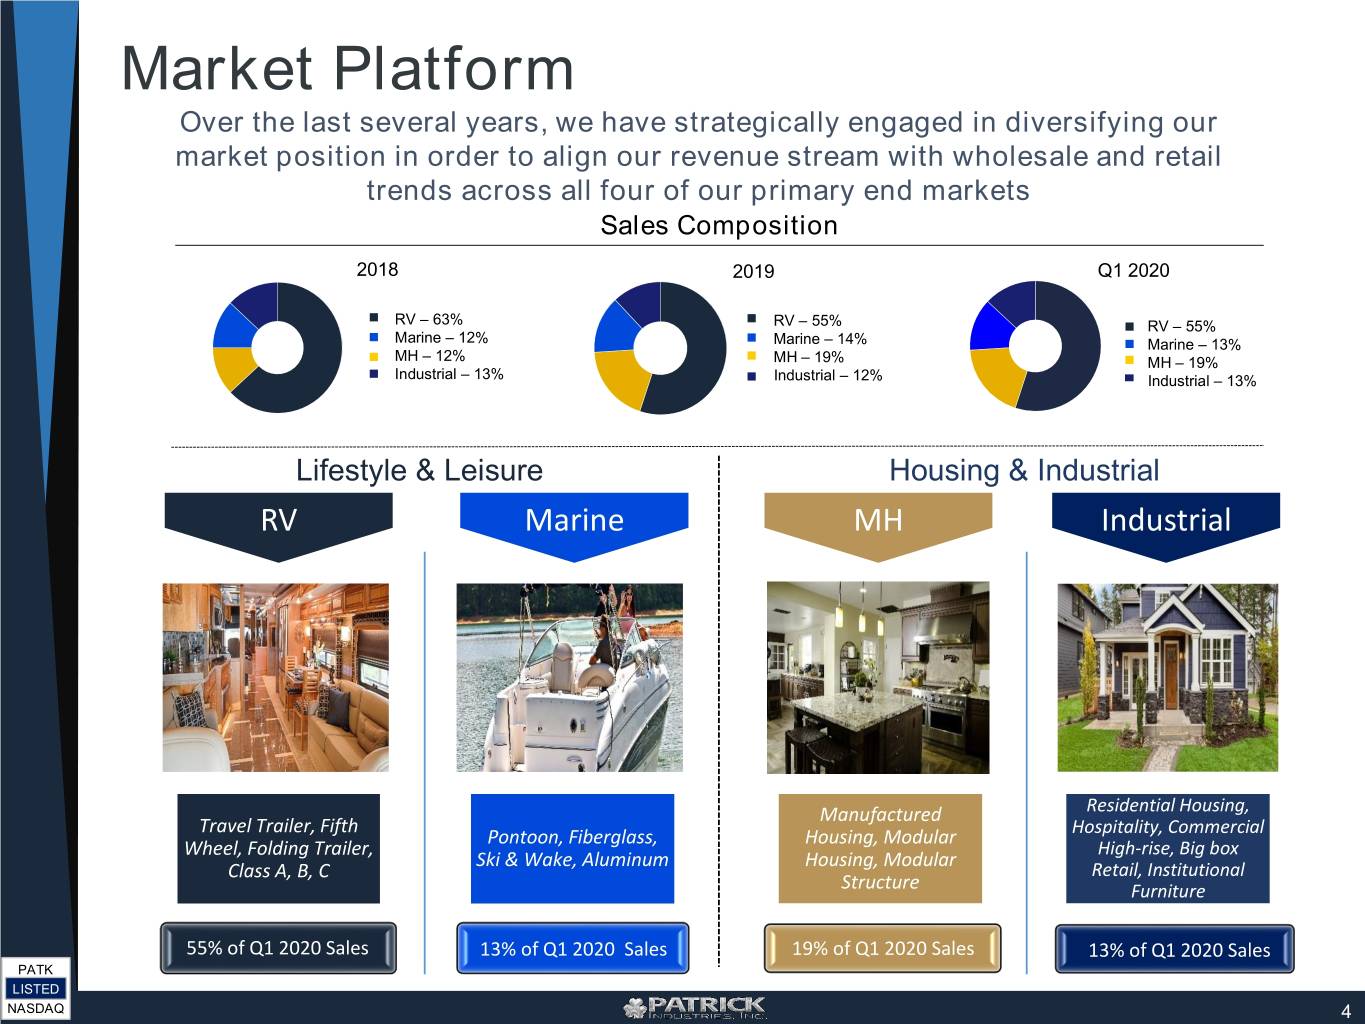
Market Platform Over the last several years, we have strategically engaged in diversifying our market position in order to align our revenue stream with wholesale and retail trends across all four of our primary end markets Sales Composition 2018 2019 Q1 2020 RV – 63% RV – 55% RV – 55% Marine – 12% Marine – 14% Marine – 13% MH – 12% MH – 19% MH – 19% Industrial – 13% Industrial – 12% Industrial – 13% Lifestyle & Leisure Housing & Industrial RV Marine MH Industrial Manufactured Residential Housing, Travel Trailer, Fifth Pontoon, Fiberglass, Housing, Modular Hospitality, Commercial Wheel, Folding Trailer, High-rise, Big box Ski & Wake, Aluminum Housing, Modular Class A, B, C Retail, Institutional Structure Furniture 55% of Q1 2020 Sales 13% of Q1 2020 Sales 19% of Q1 2020 Sales 13% of Q1 2020 Sales PATK LISTED NASDAQ 4
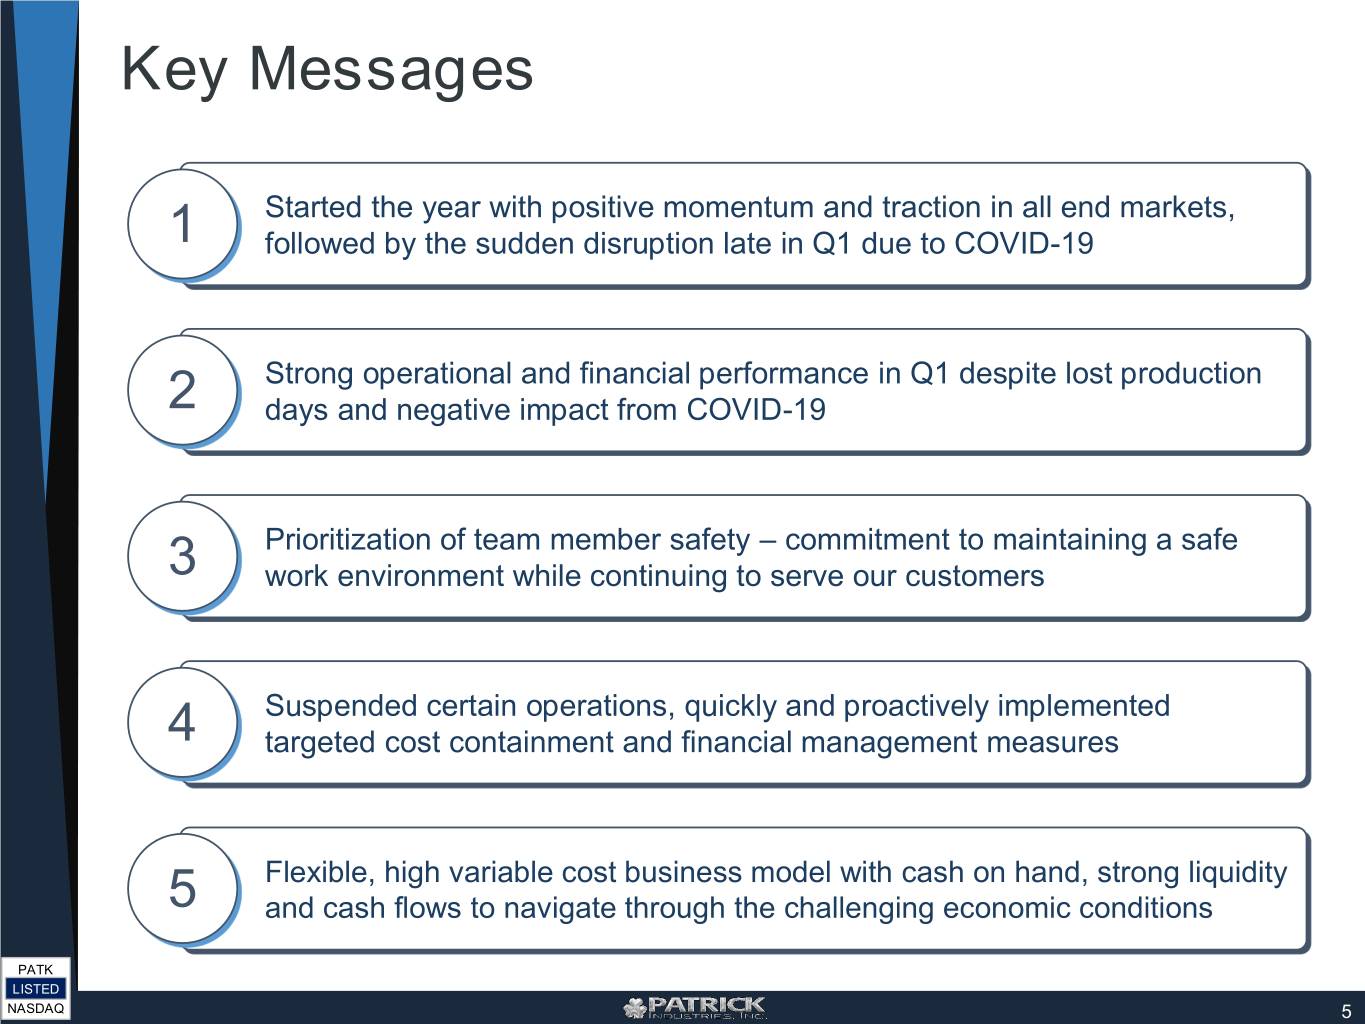
Key Messages Started the year with positive momentum and traction in all end markets, 1 followed by the sudden disruption late in Q1 due to COVID-19 Strong operational and financial performance in Q1 despite lost production 2 days and negative impact from COVID-19 Prioritization of team member safety – commitment to maintaining a safe 3 work environment while continuing to serve our customers Suspended certain operations, quickly and proactively implemented 4 targeted cost containment and financial management measures Flexible, high variable cost business model with cash on hand, strong liquidity 5 and cash flows to navigate through the challenging economic conditions PATK LISTED NASDAQ 5
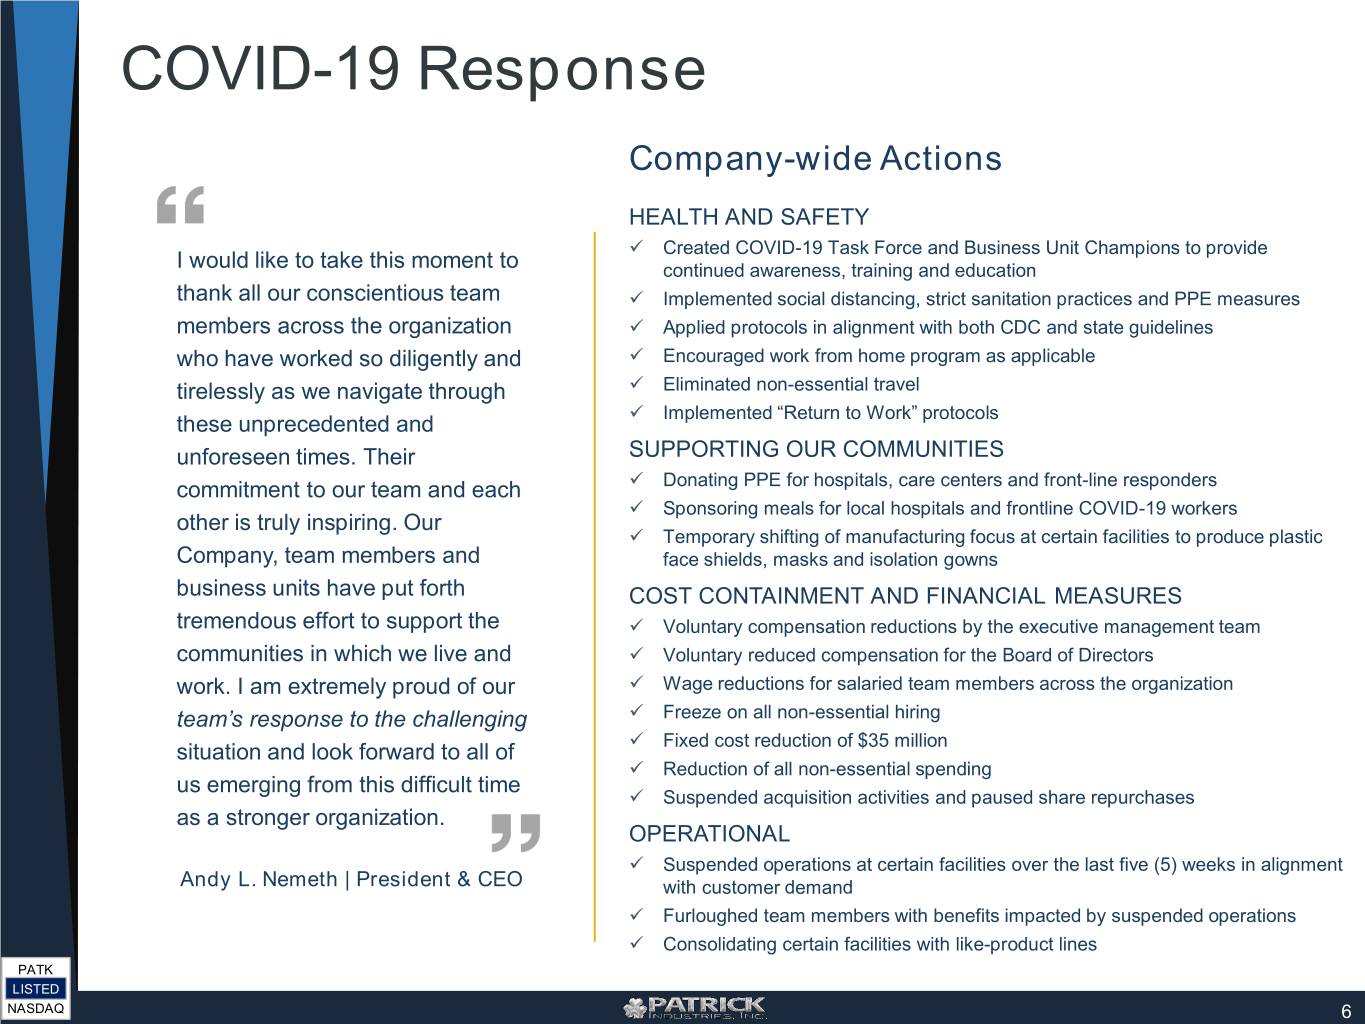
COVID-19 Response Company-wide Actions HEALTH AND SAFETY Created COVID-19 Task Force and Business Unit Champions to provide I would like to take this moment to continued awareness, training and education thank all our conscientious team Implemented social distancing, strict sanitation practices and PPE measures members across the organization Applied protocols in alignment with both CDC and state guidelines who have worked so diligently and Encouraged work from home program as applicable tirelessly as we navigate through Eliminated non-essential travel Implemented “Return to Work” protocols these unprecedented and unforeseen times. Their SUPPORTING OUR COMMUNITIES commitment to our team and each Donating PPE for hospitals, care centers and front-line responders Sponsoring meals for local hospitals and frontline COVID-19 workers other is truly inspiring. Our Temporary shifting of manufacturing focus at certain facilities to produce plastic Company, team members and face shields, masks and isolation gowns business units have put forth COST CONTAINMENT AND FINANCIAL MEASURES tremendous effort to support the Voluntary compensation reductions by the executive management team communities in which we live and Voluntary reduced compensation for the Board of Directors work. I am extremely proud of our Wage reductions for salaried team members across the organization team’s response to the challenging Freeze on all non-essential hiring Fixed cost reduction of $35 million situation and look forward to all of Reduction of all non-essential spending us emerging from this difficult time Suspended acquisition activities and paused share repurchases as a stronger organization. OPERATIONAL Suspended operations at certain facilities over the last five (5) weeks in alignment Andy L. Nemeth | President & CEO with customer demand Furloughed team members with benefits impacted by suspended operations Consolidating certain facilities with like-product lines PATK LISTED NASDAQ 6
Q1 2020 Financial Highlights COVID-19 IMPACT • Net sales of $589.2 million decreased 3.1% • Sales decline primarily attributable to lost production days and • Operating income of $39.3 million increased 9.6% business disruption in our end markets late in Q1 2020 Income • Operating margin expanded 80 basis points to 6.7% Statement • Earnings negatively impacted by • Net income of $21.2 million increased 1.6% lost production days • Diluted EPS of $0.91 increased 1.5% • Completed two strategic acquisitions adding $20 • Suspended acquisition activities million in expected annualized revenues • Returned $21.4 million to shareholders through share • Share buybacks paused Other repurchases and dividends Important • Aggressive management of cash Highlights • Available liquidity of over $500 million, including $94.5 flows and working capital to million of cash on hand, with no major debt maturities preserve liquidity until 2023 PATK LISTED NASDAQ 7
Markets and Trends As we reflect on the first quarter, we had tremendous momentum to start the year, followed by the unprecedented and sudden impact from COVID-19 RV Marine* MH* Industrial (housing starts) Wholesale • Jan-Feb: +13% • Jan-Feb: (18-20%) • Jan-Feb: +15% • Jan-Feb: +34% Shipments • Q1: Flat • Q1: (18-20%) • Q1: +8% • Q1: +22% Retail • Jan-Feb: +3-5% • Jan-Feb: +9% - - Shipments* • Q1: +1-3% • Q1: (5%) • Inventory levels • Demographic trends • Tight inventories, low expected to be support strong demand interest rates and • Inventory levels calibrated for 2021 patterns for quality, growing population of 35- calibrated model year Industry affordable homes 44-year olds Trends • Strong traffic at recent • Boat show attendance • Tailwinds from first-time • Increased demand at big RV retail shows strong – retail sold home buyers and older box retail as homeowners boats being delivered in generation downsizing look to remodel Q2 • Short-term disruption to • Short-term disruption to • Short-term disruption to • Short-term disruption to consumers consumers consumers consumers COVID-19 • Long-term beneficiary of • Long-term beneficiary of • Long-term beneficiary of • Long-term beneficiary Future Impact demographics, low demographics, low lifestyle and adaptation of lifestyle and inventories and price inventories and low changes adaptation changes points interest rates PATK * Company estimates LISTED NASDAQ 8
Operations & Short-term Outlook • Roll out “Return to Work” protocols for planned re-opening of all our facilities by May 4, 2020 • Anticipate significant short-term disruption in all end markets in the second quarter, followed by sequential improvement through the back-half of 2020 • Leverage high-variable cost model and flexible manufacturing capabilities – shifting production to match demand throughout various plants and geographies as necessary • Consolidate certain like-product based facilities as appropriate to maximize efficiencies, capacities, and synergies ADDITIONAL COST SAVINGS IDENTIFIED Eliminated annualized fixed overhead (effective Q2 2020) Consolidate certain like-product facilities $35M PATK LISTED NASDAQ 9
Q1 2020 Financial Results ($ millions except per share data) Net Sales Operating Income & Diluted EPS Cash from Operations (3.1%) Margin 1.5% $0.91 $608.2 9.6% $0.90 $589.2 $27.9 $29.2 $39.3 $35.8 6.7% $16.0 5.9% Q1 2019 Q1 2020 Q1 2019 Q1 2020 Q1 2019 Q1 2020 Q1 2019 Q1 2020 $16 million of receivables collected two business days after quarter end • Decline attributable to lost • Overhead reductions driven • Increase in overall effective • Q1 2020 inventories production days / business by proactive cost tax rate due to discreet one- increased due to strategic disruption related to COVID- containment measures / time item related to lower overseas purchases and 19 cost reductions in 2019 level of stock compensation potential supply-chain tax benefits vs. Q1 2019 disruptions related to • Revenues from leisure • Integration / execution of COVID-19 lifestyle market (RV & synergies related to • Repurchased approximately Marine) declined 8%, with acquisitions and similar 559,000 shares in RV down 6% and marine businesses aggregate of Company’s down 14% stock in 2019 and Q1’20 • Revenues from housing & industrial markets increased 9%, with MH up 6% and industrial up 14% PATK LISTED NASDAQ 10
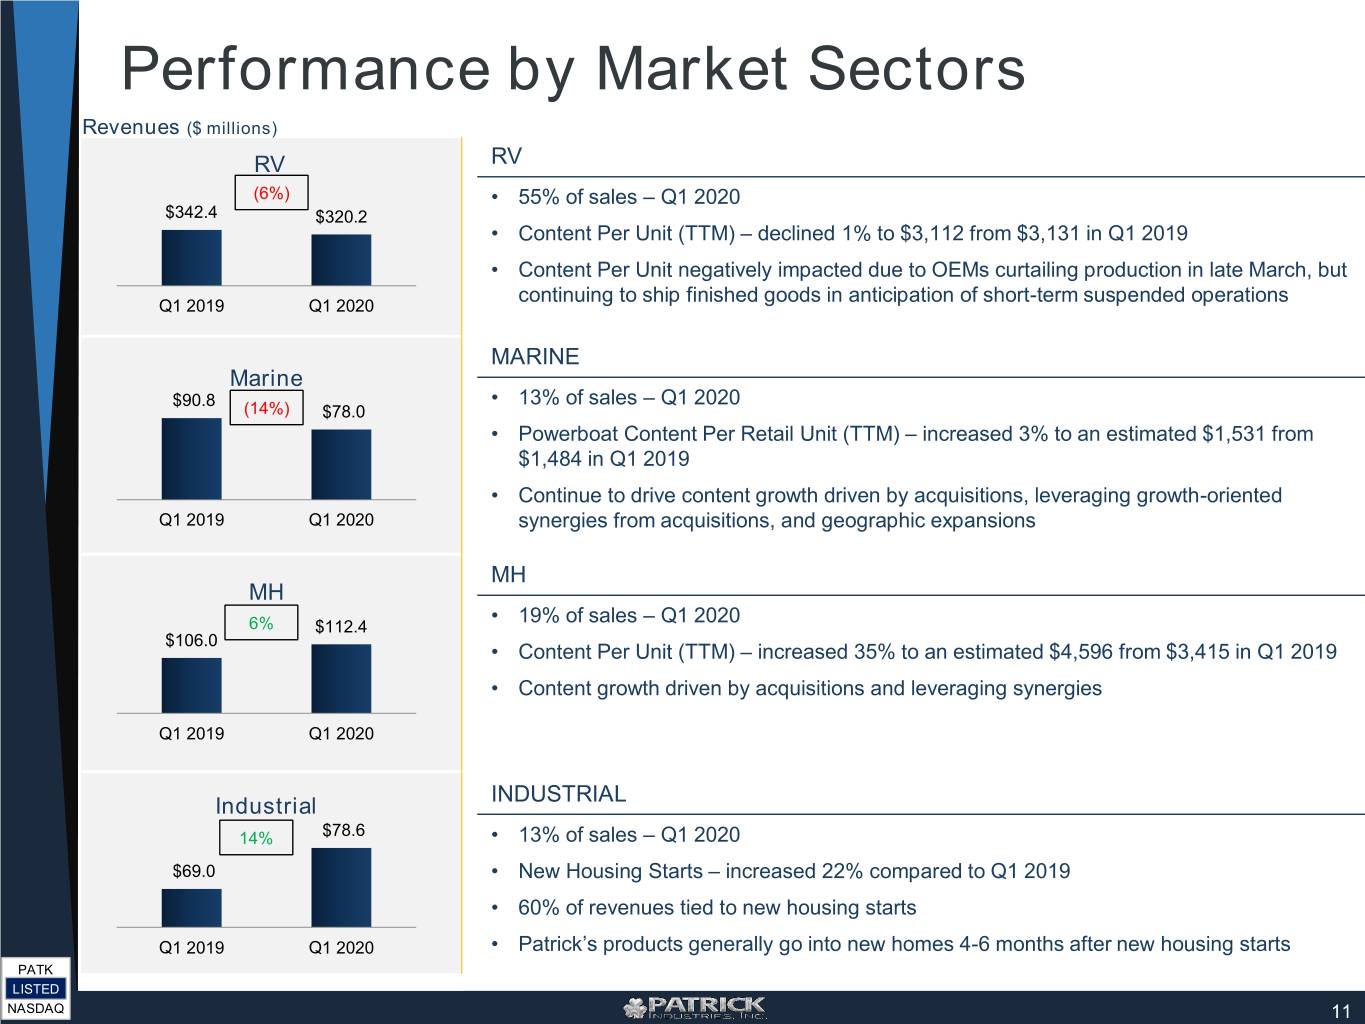
Performance by Market Sectors Revenues ($ millions) RV RV (6%) • 55% of sales – Q1 2020 $342.4 $320.2 • Content Per Unit (TTM) – declined 1% to $3,112 from $3,131 in Q1 2019 • Content Per Unit negatively impacted due to OEMs curtailing production in late March, but continuing to ship finished goods in anticipation of short-term suspended operations Q1 2019 Q1 2020 MARINE Marine $90.8 • 13% of sales – Q1 2020 (14%) $78.0 • Powerboat Content Per Retail Unit (TTM) – increased 3% to an estimated $1,531 from $1,484 in Q1 2019 • Continue to drive content growth driven by acquisitions, leveraging growth-oriented Q1 2019 Q1 2020 synergies from acquisitions, and geographic expansions MH MH • 19% of sales – Q1 2020 6% $112.4 $106.0 • Content Per Unit (TTM) – increased 35% to an estimated $4,596 from $3,415 in Q1 2019 • Content growth driven by acquisitions and leveraging synergies Q1 2019 Q1 2020 INDUSTRIAL Industrial 14% $78.6 • 13% of sales – Q1 2020 $69.0 • New Housing Starts – increased 22% compared to Q1 2019 • 60% of revenues tied to new housing starts Q1 2019 Q1 2020 • Patrick’s products generally go into new homes 4-6 months after new housing starts PATK LISTED NASDAQ 11
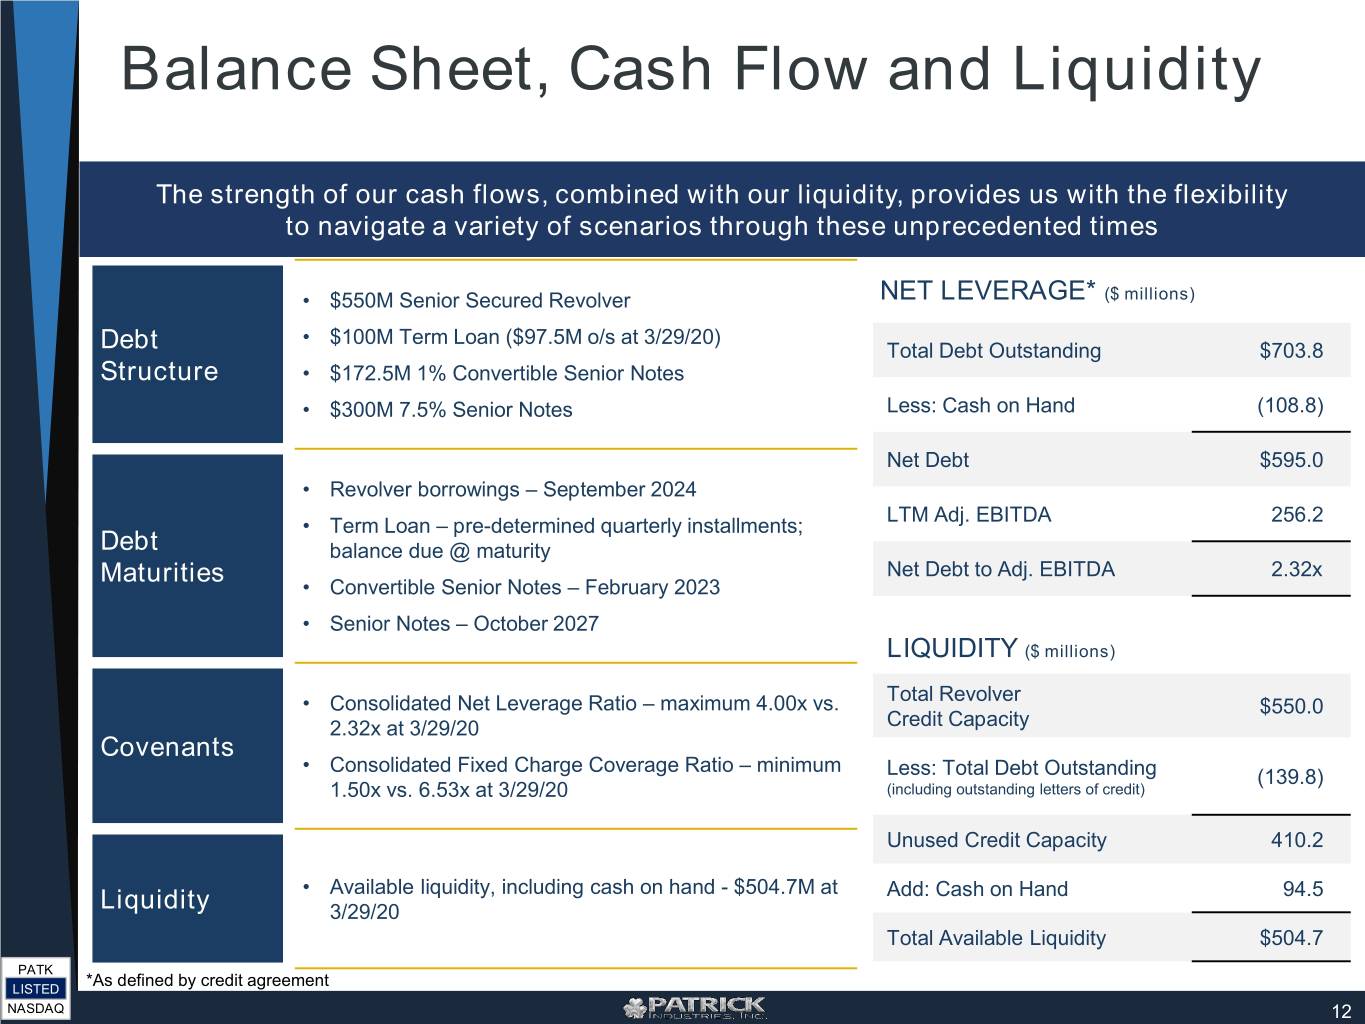
Balance Sheet, Cash Flow and Liquidity The strength of our cash flows, combined with our liquidity, provides us with the flexibility to navigate a variety of scenarios through these unprecedented times • $550M Senior Secured Revolver NET LEVERAGE* ($ millions) • $100M Term Loan ($97.5M o/s at 3/29/20) Debt Total Debt Outstanding $703.8 Structure • $172.5M 1% Convertible Senior Notes • $300M 7.5% Senior Notes Less: Cash on Hand (108.8) Net Debt $595.0 • Revolver borrowings – September 2024 LTM Adj. EBITDA 256.2 • Term Loan – pre-determined quarterly installments; Debt balance due @ maturity Maturities Net Debt to Adj. EBITDA 2.32x • Convertible Senior Notes – February 2023 • Senior Notes – October 2027 LIQUIDITY ($ millions) Total Revolver • Consolidated Net Leverage Ratio – maximum 4.00x vs. $550.0 2.32x at 3/29/20 Credit Capacity Covenants • Consolidated Fixed Charge Coverage Ratio – minimum Less: Total Debt Outstanding (139.8) 1.50x vs. 6.53x at 3/29/20 (including outstanding letters of credit) Unused Credit Capacity 410.2 • Available liquidity, including cash on hand - $504.7M at Add: Cash on Hand 94.5 Liquidity 3/29/20 Total Available Liquidity $504.7 PATK *As defined by credit agreement LISTED NASDAQ 12
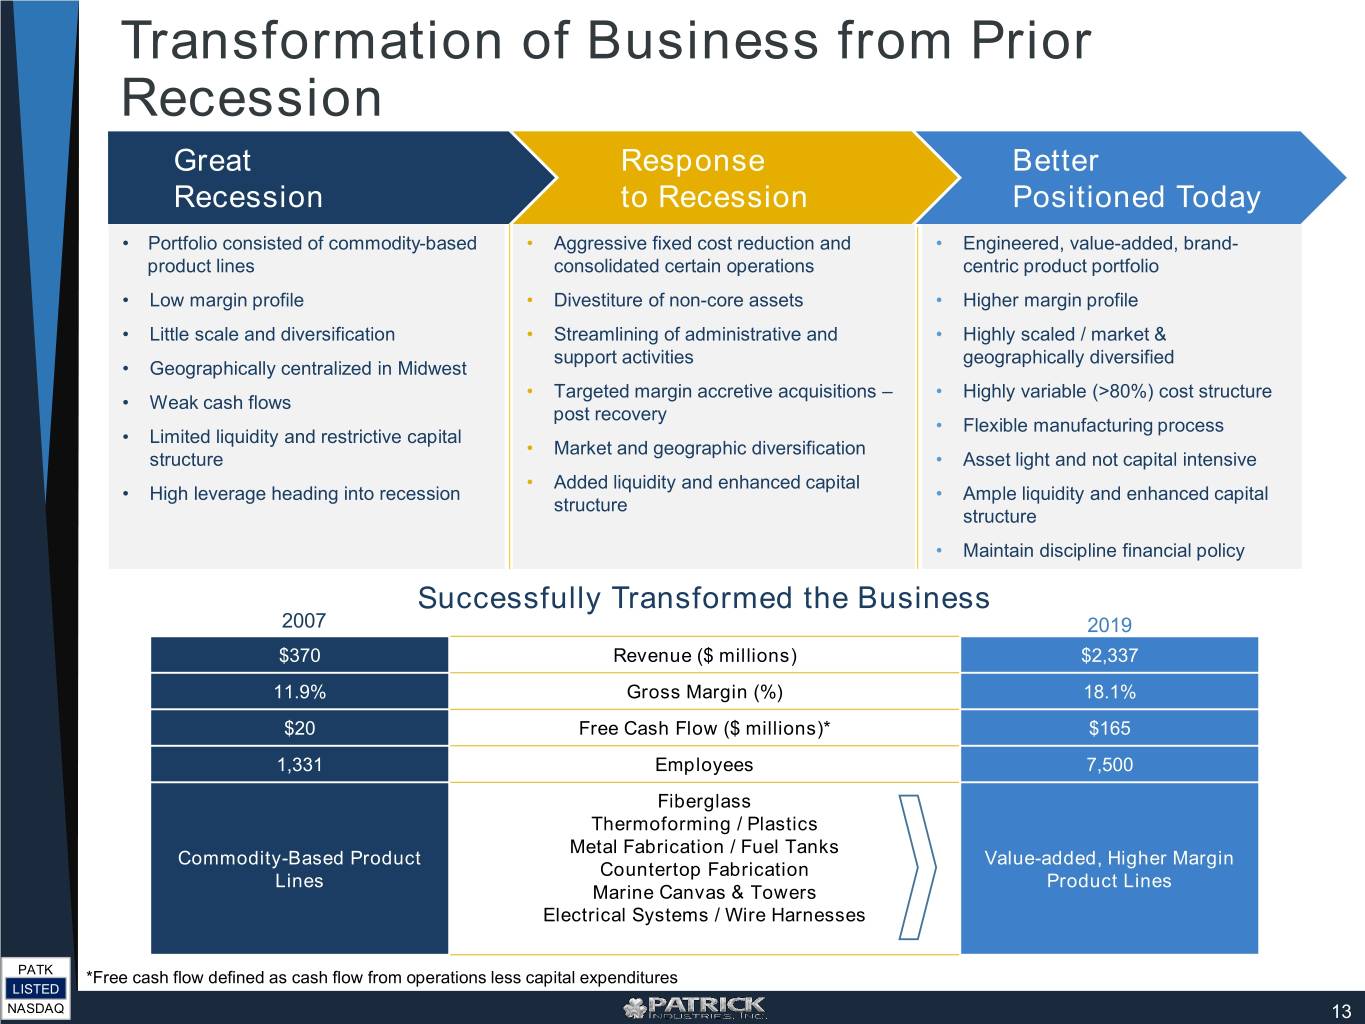
Transformation of Business from Prior Recession Great Response Better Recession to Recession Positioned Today • Portfolio consisted of commodity-based • Aggressive fixed cost reduction and • Engineered, value-added, brand- product lines consolidated certain operations centric product portfolio • Low margin profile • Divestiture of non-core assets • Higher margin profile • Little scale and diversification • Streamlining of administrative and • Highly scaled / market & support activities geographically diversified • Geographically centralized in Midwest • Targeted margin accretive acquisitions – • Highly variable (>80%) cost structure • Weak cash flows post recovery • Flexible manufacturing process • Limited liquidity and restrictive capital • Market and geographic diversification structure • Asset light and not capital intensive • Added liquidity and enhanced capital • High leverage heading into recession • Ample liquidity and enhanced capital structure structure • Maintain discipline financial policy Successfully Transformed the Business 2007 2019 $370 Revenue ($ millions) $2,337 11.9% Gross Margin (%) 18.1% $20 Free Cash Flow ($ millions)* $165 1,331 Employees 7,500 Fiberglass Thermoforming / Plastics Metal Fabrication / Fuel Tanks Commodity-Based Product Value-added, Higher Margin Countertop Fabrication Lines Product Lines Marine Canvas & Towers Electrical Systems / Wire Harnesses PATK *Free cash flow defined as cash flow from operations less capital expenditures LISTED NASDAQ 13
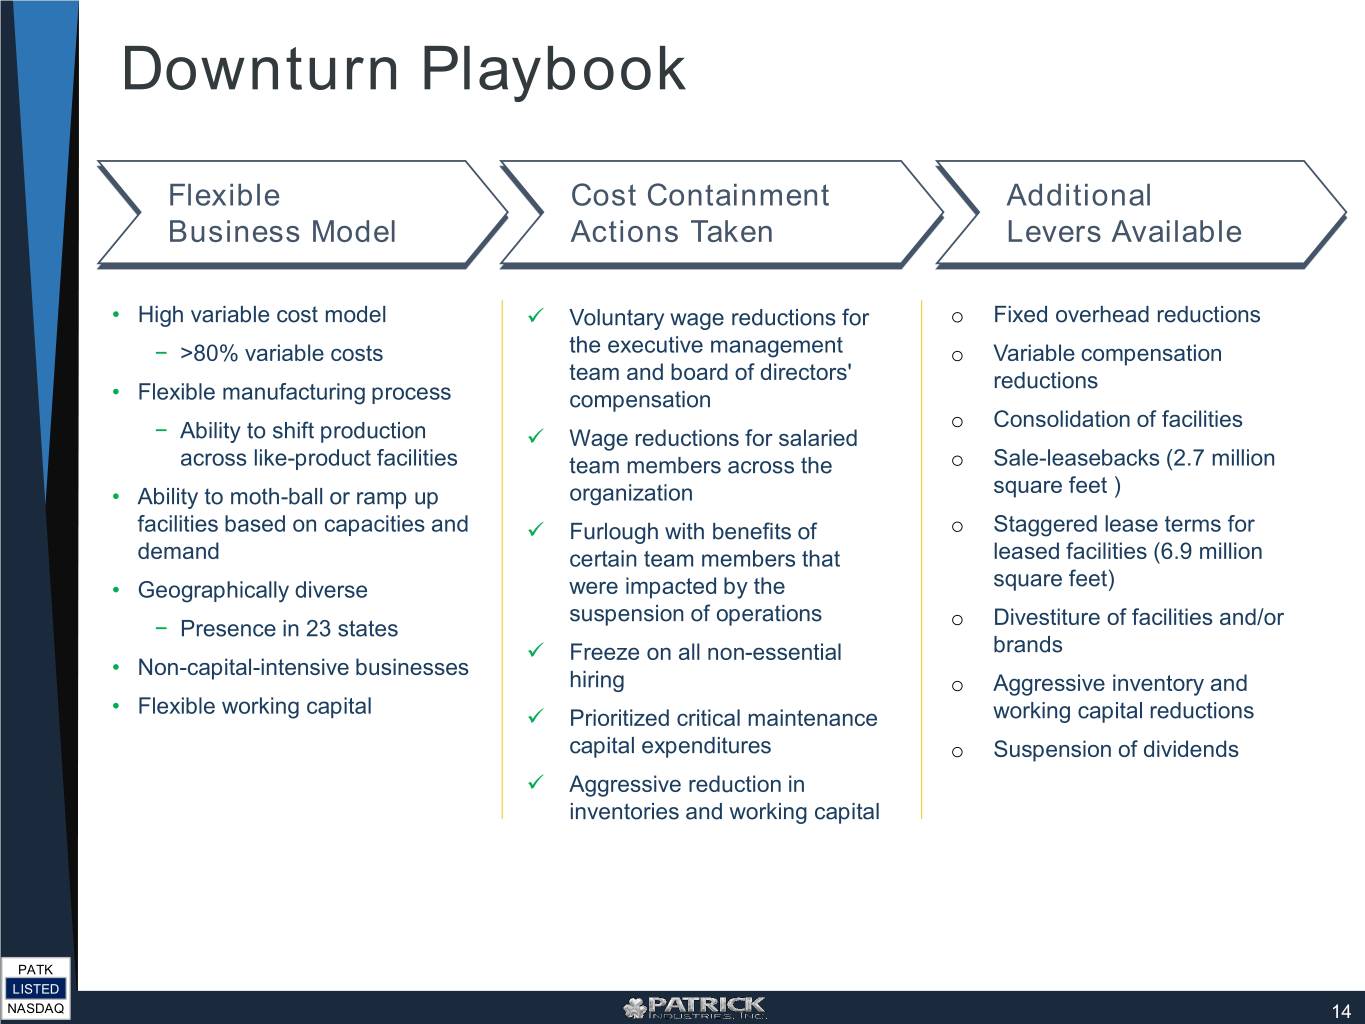
Downturn Playbook Flexible Cost Containment Additional Business Model Actions Taken Levers Available • High variable cost model Voluntary wage reductions for o Fixed overhead reductions − >80% variable costs the executive management o Variable compensation team and board of directors' reductions • Flexible manufacturing process compensation o Consolidation of facilities − Ability to shift production Wage reductions for salaried across like-product facilities team members across the o Sale-leasebacks (2.7 million • Ability to moth-ball or ramp up organization square feet ) facilities based on capacities and Furlough with benefits of o Staggered lease terms for demand certain team members that leased facilities (6.9 million • Geographically diverse were impacted by the square feet) suspension of operations o − Presence in 23 states Divestiture of facilities and/or Freeze on all non-essential brands • Non-capital-intensive businesses hiring o Aggressive inventory and • Flexible working capital Prioritized critical maintenance working capital reductions capital expenditures o Suspension of dividends Aggressive reduction in inventories and working capital PATK LISTED NASDAQ 14
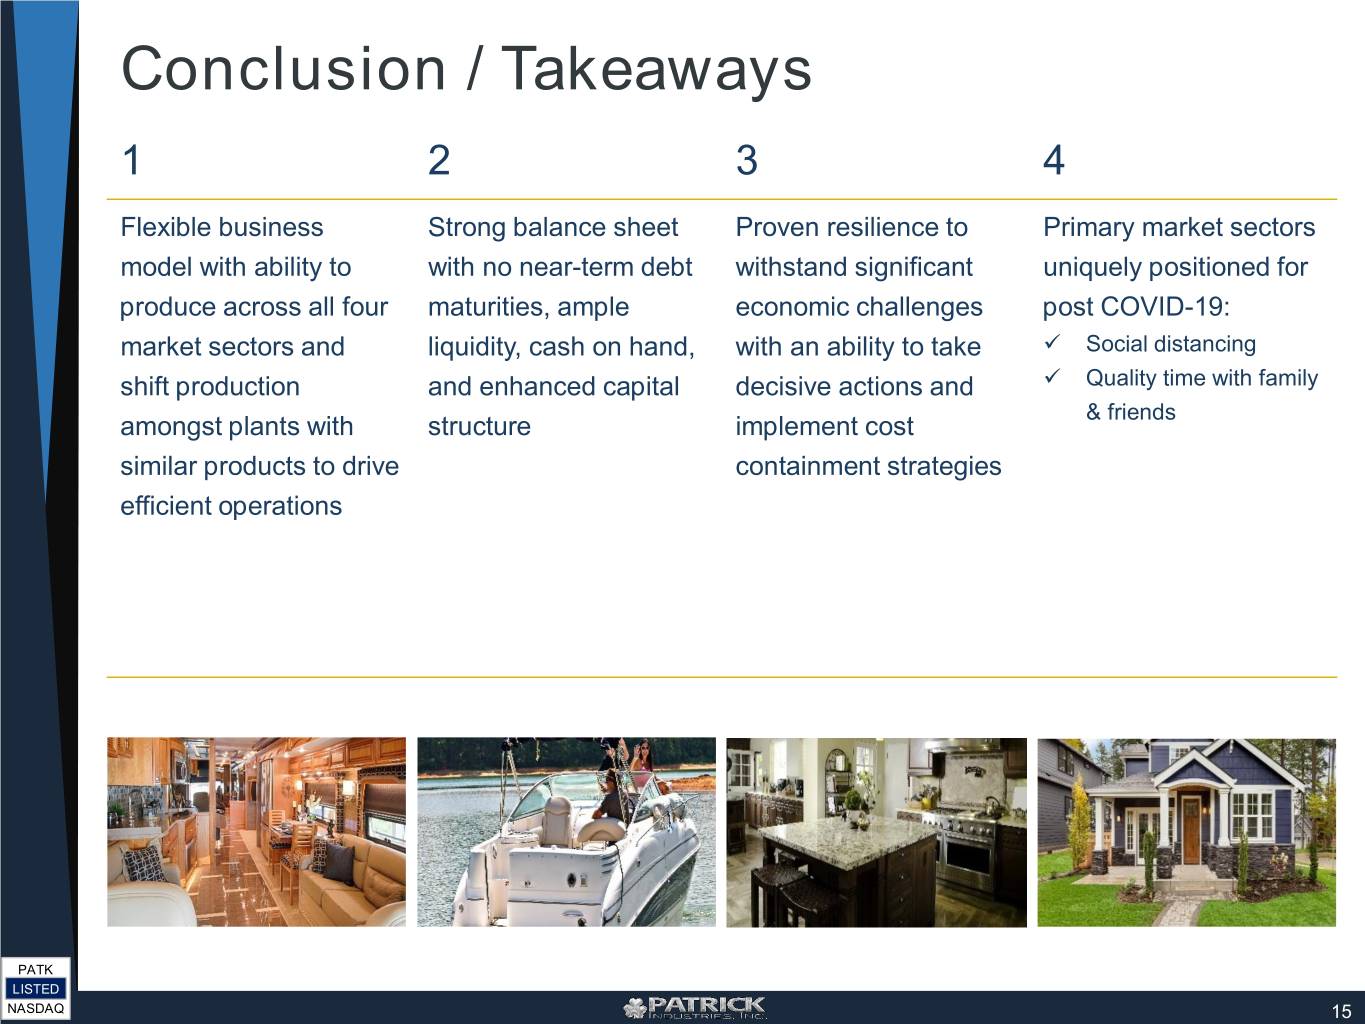
Conclusion / Takeaways 1 2 3 4 Flexible business Strong balance sheet Proven resilience to Primary market sectors model with ability to with no near-term debt withstand significant uniquely positioned for produce across all four maturities, ample economic challenges post COVID-19: market sectors and liquidity, cash on hand, with an ability to take Social distancing shift production and enhanced capital decisive actions and Quality time with family & friends amongst plants with structure implement cost similar products to drive containment strategies efficient operations PATK LISTED NASDAQ 15
Appendix PATK LISTED NASDAQ
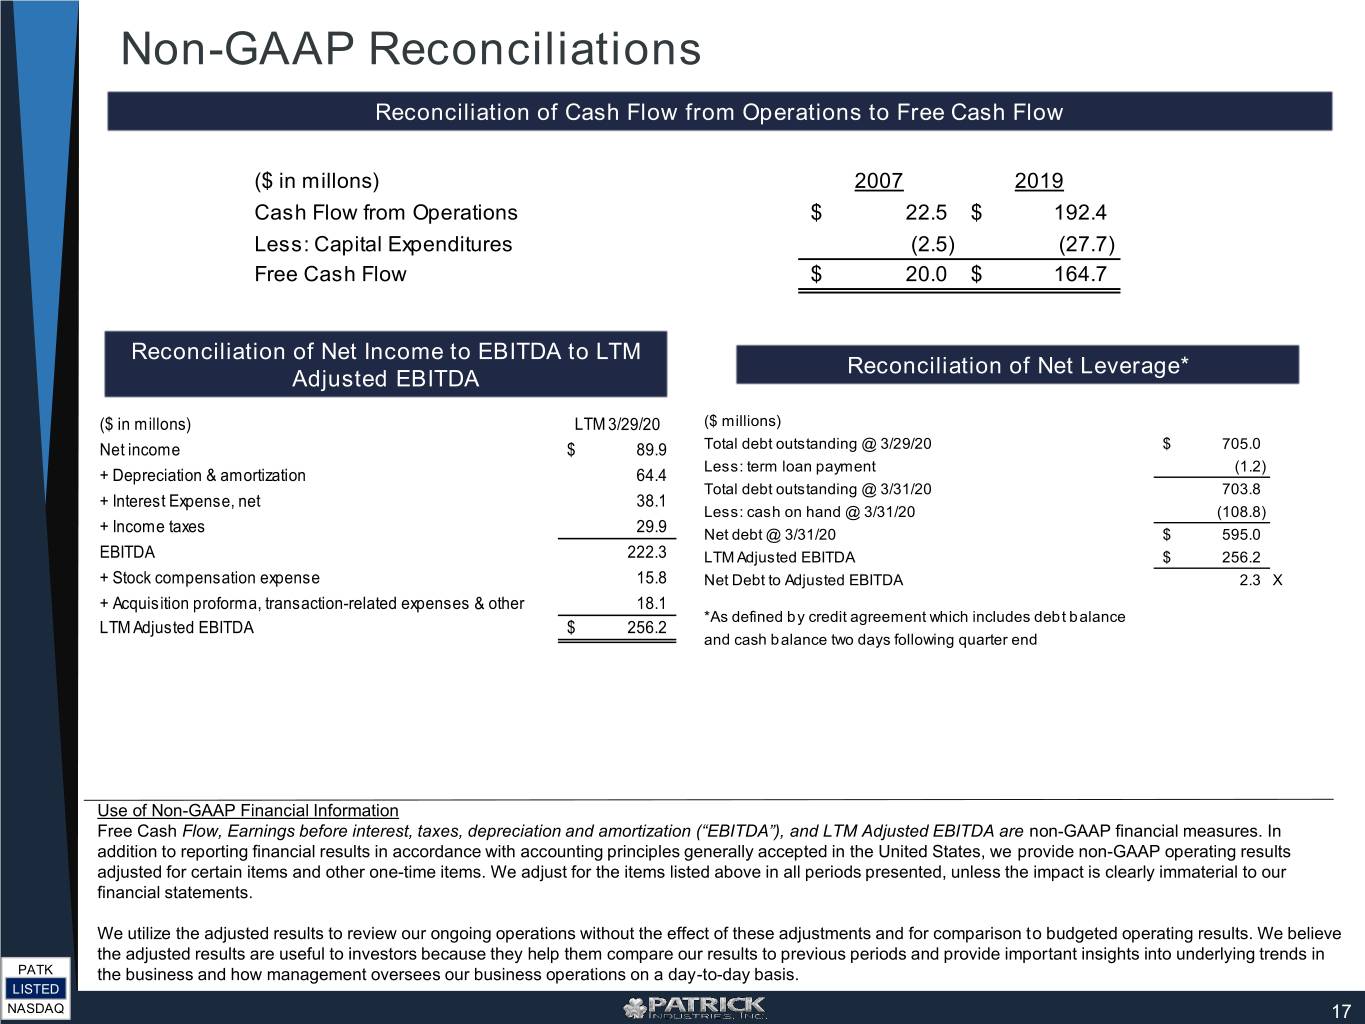
Non-GAAP Reconciliations Reconciliation of Cash Flow from Operations to Free Cash Flow ($ in millons) 2007 2019 Cash Flow from Operations $ 22.5 $ 192.4 Less: Capital Expenditures (2.5) (27.7) Free Cash Flow $ 20.0 $ 164.7 Reconciliation of Net Income to EBITDA to LTM Reconciliation of Net Leverage* Adjusted EBITDA ($ in millons) LTM 3/29/20 ($ millions) Net income $ 89.9 Total debt outstanding @ 3/29/20 $ 705.0 Less: term loan payment (1.2) + Depreciation & amortization 64.4 Total debt outstanding @ 3/31/20 703.8 + Interest Expense, net 38.1 Less: cash on hand @ 3/31/20 (108.8) + Income taxes 29.9 Net debt @ 3/31/20 $ 595.0 EBITDA 222.3 LTM Adjusted EBITDA $ 256.2 + Stock compensation expense 15.8 Net Debt to Adjusted EBITDA 2.3 X + Acquisition proforma, transaction-related expenses & other 18.1 *As defined by credit agreement which includes debt balance LTM Adjusted EBITDA $ 256.2 and cash balance two days following quarter end Use of Non-GAAP Financial Information Free Cash Flow, Earnings before interest, taxes, depreciation and amortization (“EBITDA”), and LTM Adjusted EBITDA are non-GAAP financial measures. In addition to reporting financial results in accordance with accounting principles generally accepted in the United States, we provide non-GAAP operating results adjusted for certain items and other one-time items. We adjust for the items listed above in all periods presented, unless the impact is clearly immaterial to our financial statements. We utilize the adjusted results to review our ongoing operations without the effect of these adjustments and for comparison to budgeted operating results. We believe the adjusted results are useful to investors because they help them compare our results to previous periods and provide important insights into underlying trends in PATK the business and how management oversees our business operations on a day-to-day basis. LISTED NASDAQ 17