
PCG 8-K
PG&E Corp (PCG)
8-K
2020-07-30
For: 2020-07-30
View Original
Added on
April 03, 2026
| UNITED STATES | ||
| SECURITIES AND EXCHANGE COMMISSION | ||
| Washington, D.C. 20549 | ||
FORM 8-K
CURRENT REPORT
Pursuant to Section 13 or 15(d) of the Securities Exchange Act of 1934
Date of Report: July 30, 2020
(Date of earliest event reported)
| Commission File Number | Exact Name of Registrant as specified in its charter | State or Other Jurisdiction of Incorporation or Organization | IRS Employer Identification Number | |||||||||||||||||
| PG&E CORPORATION | ||||||||||||||||||||
| PACIFIC GAS AND ELECTRIC COMPANY | ||||||||||||||||||||
 |  | |||||||||||||||||||
| (Address of principal executive offices) (Zip Code) | (Address of principal executive offices) (Zip Code) | |||||||||||||||||||
| (Registrant’s telephone number, including area code) | (Registrant’s telephone number, including area code) | |||||||||||||||||||
Check the appropriate box below if the Form 8-K filing is intended to simultaneously satisfy the filing obligation of the registrant under any of the following provisions (see General Instruction A.2. below):
| Written communications pursuant to Rule 425 under the Securities Act (17 CFR 230.425) | ||||||||
| Soliciting material pursuant to Rule 14a-12 under the Exchange Act (17 CFR 240.14a-12) | ||||||||
| Pre-commencement communications pursuant to Rule 14d-2(b) under the Exchange Act (17 CFR 240.14d-2(b) | ||||||||
| Pre-commencement communications pursuant to Rule 13e-4(c) under the Exchange Act (17 CFR 240.13e-4(c)) | ||||||||
| Securities registered pursuant to Section 12(b) of the Act: | ||||||||||||||||||||||||||
| Title of each class | Trading Symbol(s) | Name of each exchange on which registered | ||||||||||||||||||||||||
Indicate by check mark whether the registrant is an emerging growth company as defined in Rule 405 of the Securities Act of 1933 (§230.405 of this chapter) or Rule 12b-2 of the Securities Exchange Act of 1934 (§240.12b-2 of this chapter).
| Emerging growth company | PG&E Corporation | |||||||
| Emerging growth company | Pacific Gas and Electric Company | |||||||
If an emerging growth company, indicate by check mark if the registrant has elected not to use the extended transition period for complying with any new or revised financial accounting standards provided pursuant to Section 13(a) of the Exchange Act.
| PG&E Corporation | ¨ | ||||
| Pacific Gas and Electric Company | ¨ | ||||
Item 2.02 Results of Operations and Financial Condition
On July 30, 2020, PG&E Corporation issued a press release reporting its financial results and the financial results of its subsidiary, Pacific Gas and Electric Company (the “Utility”), for the quarter ended June 30, 2020. The press release is attached as Exhibit 99.1 to this report. PG&E Corporation also will hold a webcast conference call to discuss financial results and management’s business outlook. The press release contains information about how to access the webcast. The slide presentation, which includes supplemental information relating to PG&E Corporation and the Utility, will be used by management during the webcast and is attached as Exhibit 99.2 to this report. The Exhibits will be posted on PG&E Corporation’s website at http://investor.pgecorp.com.
The information included in Items 2.02, 7.01 and 9.01 of this Current Report on Form 8-K is being furnished, and shall not be deemed to be “filed” for purposes of Section 18 of the Securities Exchange Act of 1934, as amended (the “Exchange Act”), or otherwise subject to the liabilities of that section, nor shall it be deemed to be incorporated by reference in any filing under the Securities Act of 1933, as amended (the “Securities Act”).
Item 7.01 Regulation FD Disclosure
Exhibits
The information included in the Exhibits to this report is incorporated by reference in response to this Item 7.01, is being “furnished” and shall not be deemed to be “filed” for purposes of Section 18 of the Exchange Act or otherwise subject to the liabilities of that section, nor shall it be deemed to be incorporated by reference in any filing under the Securities Act.
Public Dissemination of Certain Information
PG&E Corporation and the Utility routinely provide links to the Utility’s principal regulatory proceedings before the California Public Utility Commission and the Federal Energy Regulatory Commission (FERC) at http://investor.pgecorp.com, under the “Regulatory Filings” tab, so that such filings are available to investors upon filing with the relevant agency. PG&E Corporation and the Utility also routinely post or provide direct links to presentations, documents, and other information that may be of interest to investors at http://investor.pgecorp.com, under the “PG&E Progress,” “Chapter 11,” “Wildfire Updates” and “News & Events: Events & Presentations” tabs, respectively, in order to publicly disseminate such information. It is possible that any of these filings or information included therein could be deemed to be material information. The information contained on such website is not part of this or any other report that PG&E Corporation or the Utility files with, or furnishes to, the Securities and Exchange Commission.
Item 9.01 Financial Statements and Exhibits
(d) Exhibits
The following Exhibits are being furnished, and are not deemed to be filed:
| Exhibit 99.1 | |||||
| Exhibit 99.2 | |||||
| Exhibit 104 | Cover Page Interactive Data File - the cover page XBRL tags are embedded within the Inline XBRL document | ||||
Cautionary Statement Concerning Forward-Looking Statements
This current report on Form 8-K contains forward-looking statements that are not historical facts, including statements about the beliefs, expectations, estimates, future plans and strategies of PG&E Corporation and the Utility, as well as forecasts and estimates regarding PG&E Corporation’s earnings guidance for 2020 and 2021 and the 2020 Wildfire Mitigation Plan. These statements are based on current expectations and assumptions, which management believes are reasonable, and on information currently available to management, but are necessarily subject to various risks and uncertainties. In addition to the risk that these assumptions prove to be inaccurate, factors that could cause actual results to differ materially from those contemplated by the forward-looking statements include factors disclosed in PG&E Corporation’s and the Utility’s annual report on Form 10-K for the year ended December 31, 2019, their joint quarterly reports on Form 10-Q for the quarters ended March 31, 2020 and June 30, 2020 other reports filed with the SEC, which are available on PG&E Corporation’s website at www.pgecorp.com and
on the SEC website at www.sec.gov. Additional factors include, but are not limited to, those associated with the Plan of Reorganization of PG&E Corporation and the Utility that became effective on July 1, 2020. PG&E Corporation and the Utility undertake no obligation to publicly update or revise any forward-looking statements, whether due to new information, future events or otherwise, except to the extent required by law.
| SIGNATURES | ||||||||
| Pursuant to the requirements of the Securities Exchange Act of 1934, the registrants have duly caused this report to be signed on their behalf by the undersigned thereunto duly authorized. | ||||||||
| PG&E CORPORATION | ||||||||
| By: | /s/ JASON P. WELLS | |||||||
| Dated: | July 30, 2020 | Jason P. Wells Executive Vice President and Chief Financial Officer | ||||||
| PACIFIC GAS AND ELECTRIC COMPANY | ||||||||
| By: | /s/ DAVID S. THOMASON | |||||||
| Dated: | July 30, 2020 | David S. Thomason Vice President, Chief Financial Officer and Controller | ||||||

| Investor Relations Contact: 415.972.7080 | Media Inquiries Contact: 415.973.5930 | www.pgecorp.com | |||||
| July 30, 2020 | |||||
PG&E Corporation Reports Second-Quarter 2020 Financial Results,
Initiates 2020 and 2021 Earnings and EPS Guidance
•Recorded GAAP losses were $3.73 per share for the second quarter of 2020, compared to losses of $4.83 per share for the same period in 2019.
•Non-GAAP core earnings were $1.03 per share for the second quarter of 2020, compared to $1.10 per share for the same period in 2019.
•2020 EPS guidance initiated for GAAP losses in the range of $0.99 to $1.05 and non-GAAP core earnings of $1.60 to $1.63 per share.
•2021 EPS guidance initiated for GAAP earnings in the range of $0.17 to 0.29 and non-GAAP core earnings of $0.95 to $1.05 per share.
SAN FRANCISCO — PG&E Corporation (NYSE: PCG) recorded second-quarter 2020 losses attributable to common shareholders of $1,972 million, or $3.73 per share, as reported in accordance with generally accepted accounting principles (GAAP). This compares with losses attributable to common shareholders of $2,553 million, or $4.83 per share, for the second quarter of 2019.
GAAP results include non-core items that management does not consider representative of ongoing earnings, which totaled $2.5 billion after-tax, or $4.75 per share, for the quarter. These results were primarily driven by costs related to PG&E Corporation’s and Pacific Gas and Electric Company’s (Utility) reorganization cases under Chapter 11 of the U.S. Bankruptcy Code (Chapter 11). PG&E also recorded charges related to the 2019 Kincade fire as a non-core item in the second quarter, which includes estimated third-party claims, net of probable insurance recoveries, Utility clean-up and repair costs, and legal and other costs. Other non-core items include the amortization of wildfire insurance fund contributions under Assembly Bill (AB) 1054 and investigation remedies and delayed cost recovery, partially offset by the recovery of capital expenditures in excess of adopted amounts from the 2011 Gas Transmission & Storage (GT&S) rate case.
PG&E Corporation and Pacific Gas and Electric Company emerged from Chapter 11 on July 1, 2020 after successfully completing the restructuring process and achieving approval for its Plan of Reorganization confirmed by the United States Bankruptcy Court.
PG&E enters the second half of 2020 having:
•Implemented the settlement and resolution of all prepetition wildfire claims pursuant to the Plan;
•Contributed to the State of California's go-forward wildfire fund, providing for full eligibility of its protections;
•Seated its new Board of Directors and Interim CEO; and
•Retired expensive, high-coupon debt and replaced it with lower-cost debt, yielding significant annual savings for customers over the duration of the debt, estimated to be approximately $250 million annually.
PG&E is also moving forward with commitments to the Governor's Office and the President of the California Public Utilities Commission (CPUC) regarding its governance, operations, and financial structure to further prioritize safety.
“With our Chapter 11 cases now behind us, we're on track to become a stronger company,” said Bill Smith, Interim Chief Executive Officer, PG&E Corporation. "Our focus now will be building on the many changes we put in place during the bankruptcy, which set the foundation for this new era at PG&E. Our mandate is to rebuild the trust of our customers and stakeholders while delivering safety performance and operational excellence across our business. We’ll do that by making targeted investments in our systems and achieving positive local results day in and day out."
Wildfire Mitigation Update
To further reduce the potential for wildfires associated with its electrical equipment in high fire-threat areas, PG&E is executing its 2020 Wildfire Mitigation Plan as submitted to the CPUC. The company is on track to meet its goals for each of the four categories of the 2020 Plan, which builds on the significant work completed in 2019.
•System hardening has exceeded 50 percent of the 2020 goal, with 122 circuit miles either relocated underground or replaced with stronger poles and covered conductor, making PG&E's system more resilient.
•Enhanced vegetation management progress is at 70 percent. PG&E has reviewed more than 1,200 miles of distribution and lower-voltage transmission lines and taken necessary action to trim or remove hazards and expand rights-of-way.
•Situational awareness completion exceeds 30 percent, with 144 weather stations and 60 high definition cameras installed, despite some initial supply chain issues due to COVID-19 disruptions.
•Enhanced inspections are 51 percent complete. PG&E continues to inspect all assets in Tier Three miles and a third of the Tier Two miles annually, which gives greater insight into the health of the company's assets and information to act on for equipment requiring maintenance.
In addition, PG&E is making foundational investments in new technologies to help reduce wildfire risk. Early stage efforts include:
•Advanced data analytics that will use information collected from drone and visual inspection tools to enable predictive maintenance of equipment and assets;
•Machine-learning tools and computer models designed to identify components which may require repair or replacement; and
•Sensor technology adopted from Australia that can detect failure and de-energize a falling overhead line before it reaches the ground, potentially avoiding ignition.
"All of us at PG&E recognize that no apology, no settlement, no sentencing can undo the damage from the wildfires of recent years, and no passage of time can lessen the anguish of the victims," Smith said. "We know that what's needed now is action. We will continue to work
tirelessly to combat the growing threat of wildfires and keep our customers and communities safe."
Non-GAAP Core Earnings
PG&E Corporation’s non-GAAP core earnings, which exclude non-core items, were $542 million, or $1.03 per share, in the second quarter of 2020, compared with $581 million, or $1.10 per share, during the same period in 2019.
The decrease in quarter-over-quarter non-GAAP core earnings per share was primarily driven by interest on pre-petition payables and short-term debt, the timing of 2020 General Rate Case cost recovery, and incremental wildfire mitigation, partially offset by the growth in rate base earnings and timing of taxes.
PG&E Corporation uses “non-GAAP core earnings,” which is a non-GAAP financial measure, in order to provide a measure that allows investors to compare the underlying financial performance of the business from one period to another, exclusive of non-core items. See the accompanying tables for a reconciliation of non-GAAP core earnings to consolidated earnings (loss) attributable to common shareholders.
2020 Guidance
PG&E Corporation is initiating 2020 guidance for consolidated GAAP losses in the range of $0.99 to $1.05 per share, which includes non-core items. PG&E is updating 2020 non-core items guidance of approximately $3.3 billion for after-tax for bankruptcy and legal costs, the amortization of wildfire insurance fund contributions, Kincade fire-related costs, investigation remedies and delayed cost recovery, partially offset by the 2011 GT&S capital audit.
On a non-GAAP basis, the guidance range for projected 2020 core earnings is $1.60 to $1.63 per share. Factors driving non-GAAP core earnings include net below the line and spend above authorized items of $200 million to $225 million after tax and unrecoverable interest expense of $125 million after tax.
Guidance is based on various assumptions and forecasts, including those relating to future authorized revenues, expenses, capital expenditures, rate base, and certain other factors.
2021 Guidance
PG&E Corporation is initiating 2021 GAAP earnings guidance in the range of $0.17 to $0.29 per share, which includes non-core items. PG&E is providing 2021 non-core items guidance of approximately $1.7 billion after-tax for a net securitization inception charge, amortization of wildfire insurance fund contributions, bankruptcy and legal costs, and investigation remedies and delayed cost recovery, partially offset by the 2011 GT&S capital audit.
On a non-GAAP basis, the guidance range for projected 2021 core earnings is $0.95 to $1.05 per share. Factors driving non-GAAP core earnings include net below the line and spend above authorized of up to $100 million after tax and unrecoverable interest expense of $275 million to $325 million after tax.
Guidance is based on various assumptions and forecasts, including those relating to authorized revenues, future expenses, capital expenditures, rate base, equity issuances, the potential Net Operating Loss (NOL) securitization, and certain other factors.
Update on Ownership Restrictions in PG&E Corporation Charter
PG&E's Chapter 11 Plan contemplates that the Fire Victim Trust will be treated as a “qualified settlement fund” for U.S. federal income tax purposes, subject to PG&E Corporation’s ability to elect to treat the Fire Victim Trust as a “grantor trust” for U.S. federal income tax purposes instead. Based on the facts known to date, PG&E Corporation believes that it may be beneficial to elect to treat the Fire Victim Trust as a "grantor trust" for U.S. federal income tax purposes, subject to receipt of certain favorable determinations from the Internal Revenue Service regarding such election.
If PG&E Corporation were to make such a “grantor trust” election with respect to the Fire Victim Trust, then any shares owned by the Fire Victim Trust would effectively be excluded from the total number of outstanding equity securities when calculating a person’s percentage ownership for purposes of the 4.75 percent ownership limitation in PG&E Corporation's charter. For example, although PG&E had 1,941,473,377 shares outstanding as of July 27, 2020 for corporate purposes, only 1,464,478,202 shares (the number of outstanding shares of common stock less the number of shares held by the Fire Victim Trust) would count as outstanding for purposes of the ownership restrictions in the charter.
PG&E Corporation will publicly announce its determination on whether it will elect to treat the Fire Victim Trust as a “grantor trust” no later than April 1, 2021. If PG&E Corporation decides to make a “grantor trust” election with respect to the Fire Victim Trust, PG&E Corporation intends to enforce the ownership restrictions in the charter accordingly (i.e. by excluding any shares owned by the Fire Victim Trust from the total number of outstanding equity securities), including with respect to transfers occurring before such announcement. However, PG&E Corporation anticipates that any transfers of PG&E Corporation common stock occurring prior to July 30, 2020 will be exempted from the application of the ownership restrictions in the charter solely to the extent that such transfers would have complied with the ownership restrictions if they were applied on the basis that the shares owned by the Fire Victim Trust were treated as outstanding equity securities. To facilitate compliance by investors, PG&E Corporation will periodically make available information about the number of shares of common stock held by the Fire Victim Trust on a specified date for purposes of the ownership restrictions, including in its quarterly and annual reports filed with the SEC.
All current and prospective investors are advised to consider the foregoing in determining their ownership of PG&E common stock.
Additional information is available regarding the ownership limitations under the headings "Risk Factors" in Part II Item 1A of the second quarter's 10-Q.
Supplemental Financial Information
In addition to the financial information accompanying this release, presentation slides have been furnished to the Securities and Exchange Commission (SEC) and are available on PG&E Corporation’s website at: http://investor.pgecorp.com/financials/quarterly-earnings-reports/default.aspx.
Earnings Conference Call
PG&E Corporation will also hold a conference call on July 30, 2020, at 11:00 a.m. Eastern Time (8:00 a.m. Pacific Time) to discuss its second quarter 2020 results. The public can access the conference call through a simultaneous webcast. The link is provided below and will also be available from the PG&E Corporation website.
What: Second Quarter 2020 Earnings Call
When: Thursday, July 30, 2020 at 11:00 a.m. Eastern Time
Where: http://investor.pgecorp.com/news-events/events-and-presentations/default.aspx
How: Live over the Internet – log on at the address above
Participants are encouraged to pre-register for the conference call at http://www.directeventreg.com/registration/event/7187556. Participants who pre-register will receive dial-in information, conference passcode and registrant ID. At the time of the call, participants will dial in using the information provided in the confirmation email. Participants may pre-register at any time, up to and including after the conference call has started.
The public can access the conference call through a simultaneous webcast.
A replay of the conference call will be archived through August 6, 2020 at http://investor.pgecorp.com/news-events/events-and-presentations/default.aspx.
Alternatively, a toll-free replay of the conference call may be accessed shortly after the live call through August 6, 2020, by dialing (800) 585-8367. International callers may dial (416) 621- 4642. For both domestic and international callers, the confirmation code 7187556 will be required to access the replay.
Public Dissemination of Certain Information
PG&E Corporation and the Utility routinely provide links to the Utility’s principal regulatory proceedings with the CPUC and the Federal Energy Regulatory Commission (FERC) at http://investor.pgecorp.com, under the “Regulatory Filings” tab, so that such filings are available to investors upon filing with the relevant agency. PG&E Corporation and the Utility also routinely post, or provide direct links to, presentations, documents, and other information that may be of interest to investors at http://investor.pgecorp.com, under the “Chapter 11,” “Wildfire Updates” and “News & Events: Events & Presentations” tabs, respectively, in order to publicly disseminate such information. It is possible that any of these filings or information included therein could be deemed to be material information.
About PG&E Corporation
PG&E Corporation (NYSE: PCG) is a holding company headquartered in San Francisco. It is the parent company of Pacific Gas and Electric Company, an energy company that serves 16 million Californians across a 70,000-square-mile service area in Northern and Central California.
For more information, visit http://www.pgecorp.com. In this press release, they are together referred to as “PG&E.”
Forward-Looking Statements
This press release contains forward-looking statements that are not historical facts, including statements about the beliefs, expectations, estimates, future plans and strategies of PG&E Corporation and the Utility, as well as forecasts and estimates regarding PG&E Corporation’s earnings guidance for 2020 and 2021 and the 2020 Wildfire Mitigation Plan. These statements are based on current expectations and assumptions, which management believes are reasonable, and on information currently available to management, but are necessarily subject to various risks and uncertainties. In addition to the risk that these assumptions prove to be inaccurate, factors that could cause actual results to differ materially from those contemplated by the forward-looking statements include factors disclosed in PG&E Corporation’s and the Utility’s joint annual report on Form 10-K for the year ended December 31, 2019, their joint quarterly reports on Form 10-Q for the quarters ended March 31, 2020 and June 30, 2020, and other reports filed with the SEC, which are available on PG&E Corporation’s website at www.pgecorp.com and on the SEC website at www.sec.gov. Additional factors include, but are not limited to, those associated with the Plan of Reorganization of PG&E Corporation and the Utility that became effective on July 1, 2020. PG&E Corporation and the Utility undertake no obligation to publicly update or revise any forward-looking statements, whether due to new information, future events or otherwise, except to the extent required by law.
PG&E CORPORATION
CONDENSED CONSOLIDATED STATEMENTS OF INCOME
| (Unaudited) | |||||||||||||||||||||||
| Three Months Ended June 30, | Six Months Ended June 30, | ||||||||||||||||||||||
| (in millions, except per share amounts) | 2020 | 2019 | 2020 | 2019 | |||||||||||||||||||
| Operating Revenues | |||||||||||||||||||||||
| Electric | $ | 3,435 | $ | 2,946 | $ | 6,475 | $ | 5,738 | |||||||||||||||
| Natural gas | 1,098 | 997 | 2,364 | 2,216 | |||||||||||||||||||
| Total operating revenues | 4,533 | 3,943 | 8,839 | 7,954 | |||||||||||||||||||
| Operating Expenses | |||||||||||||||||||||||
| Cost of electricity | 759 | 837 | 1,304 | 1,436 | |||||||||||||||||||
| Cost of natural gas | 134 | 108 | 418 | 447 | |||||||||||||||||||
| Operating and maintenance | 2,141 | 1,942 | 4,108 | 4,029 | |||||||||||||||||||
| Wildfire-related claims, net of insurance recoveries | 170 | 3,900 | 170 | 3,900 | |||||||||||||||||||
| Wildfire fund expense | 173 | — | 173 | — | |||||||||||||||||||
| Depreciation, amortization, and decommissioning | 874 | 796 | 1,729 | 1,593 | |||||||||||||||||||
| Total operating expenses | 4,251 | 7,583 | 7,902 | 11,405 | |||||||||||||||||||
| Operating Income (Loss) | 282 | (3,640) | 937 | (3,451) | |||||||||||||||||||
| Interest income | 12 | 22 | 28 | 44 | |||||||||||||||||||
| Interest expense | (199) | (60) | (453) | (163) | |||||||||||||||||||
| Other income, net | 100 | 66 | 197 | 137 | |||||||||||||||||||
| Reorganization items, net | (1,624) | (56) | (1,800) | (183) | |||||||||||||||||||
| Loss Before Income Taxes | (1,429) | (3,668) | (1,091) | (3,616) | |||||||||||||||||||
| Income tax provision (benefit) | 539 | (1,119) | 503 | (1,203) | |||||||||||||||||||
| Net Loss | (1,968) | (2,549) | (1,594) | (2,413) | |||||||||||||||||||
| Preferred stock dividend requirement of subsidiary | 4 | 4 | 7 | 7 | |||||||||||||||||||
| Loss Attributable to Common Shareholders | $ | (1,972) | $ | (2,553) | $ | (1,601) | $ | (2,420) | |||||||||||||||
| Weighted Average Common Shares Outstanding, Basic | 529 | 529 | 529 | 528 | |||||||||||||||||||
| Weighted Average Common Shares Outstanding, Diluted | 529 | 529 | 529 | 528 | |||||||||||||||||||
| Net Loss Per Common Share, Basic | $ | (3.73) | $ | (4.83) | $ | (3.03) | $ | (4.58) | |||||||||||||||
| Net Loss Per Common Share, Diluted | $ | (3.73) | $ | (4.83) | $ | (3.03) | $ | (4.58) | |||||||||||||||
Reconciliation of PG&E Corporation’s Consolidated Earnings (Loss) Attributable to Common Shareholders in Accordance with Generally Accepted Accounting Principles (“GAAP”) to Non-GAAP Core Earnings
Second Quarter, 2020 vs. 2019
(in millions, except per share amounts)
| Three Months Ended June 30, | Six Months Ended June 30, | ||||||||||||||||||||||||||||||||||||||||||||||
| Earnings | Earnings per Common Share (Diluted) | Earnings | Earnings per Common Share (Diluted) | ||||||||||||||||||||||||||||||||||||||||||||
| (in millions, except per share amounts) | 2020 | 2019 | 2020 | 2019 | 2020 | 2019 | 2020 | 2019 | |||||||||||||||||||||||||||||||||||||||
| PG&E Corporation's Loss on a GAAP basis | $ | (1,972) | $ | (2,553) | $ | (3.73) | $ | (4.83) | $ | (1,601) | $ | (2,420) | $ | (3.03) | $ | (4.58) | |||||||||||||||||||||||||||||||
Non-core items: (1) | |||||||||||||||||||||||||||||||||||||||||||||||
Bankruptcy and legal costs (2) | 2,275 | 58 | 4.30 | 0.11 | 2,452 | 155 | 4.64 | 0.29 | |||||||||||||||||||||||||||||||||||||||
2019 Kincade fire-related costs, net of insurance (3) | 148 | — | 0.28 | — | 148 | — | 0.28 | — | |||||||||||||||||||||||||||||||||||||||
Amortization of wildfire fund contribution (4) | 125 | — | 0.24 | — | 125 | — | 0.24 | — | |||||||||||||||||||||||||||||||||||||||
Investigation remedies and delayed cost recovery (5) | 45 | — | 0.08 | — | 73 | — | 0.14 | — | |||||||||||||||||||||||||||||||||||||||
2011 GT&S capital audit (6) | (78) | — | (0.15) | — | (78) | — | (0.15) | — | |||||||||||||||||||||||||||||||||||||||
Wildfire-related costs (7) | — | 2,878 | — | 5.44 | — | 3,041 | — | 5.76 | |||||||||||||||||||||||||||||||||||||||
Electric asset inspections (8) | — | 198 | — | 0.37 | — | 349 | — | 0.66 | |||||||||||||||||||||||||||||||||||||||
PG&E Corporation’s Non-GAAP Core Earnings (9) | $ | 542 | $ | 581 | $ | 1.03 | $ | 1.10 | $ | 1,119 | $ | 1,125 | $ | 2.11 | $ | 2.13 | |||||||||||||||||||||||||||||||
(1) “Non-core items” include items that management does not consider representative of ongoing earnings and affect comparability of financial results between periods, consisting of the items listed in the table above. See Exhibit G: Use of Non-GAAP Financial Measures.
All amounts presented in the table above are tax adjusted at PG&E Corporation’s statutory tax rate of 27.98% for 2019 and 2020, except for certain costs that are not tax deductible, as identified in the following footnotes. Amounts may not sum due to rounding.
(2) PG&E Corporation and the Utility recorded costs of $2.3 billion (before the tax impact of $42 million) and $2.5 billion (before the tax impact of $84 million) during the three and six months ended June 30, 2020, respectively, associated with bankruptcy and legal costs. This includes $1.5 billion (before the tax impact of $5 million) and $1.6 billion (before the tax impact of $20 million) during the three and six months ended June 30, 2020, respectively, related to exit financing costs ($1.5 billion of exit financing costs during the three and six months ended June 30, 2020 are not tax deductible). Also during the three and six months ended June 30, 2020, the Utility recorded a $619 million reduction to the deferred tax asset related to the value of PG&E Corporation's common stock transferred to the Fire Victim Trust. The Utility also incurred legal and other costs of $179 million (before the tax impact of $37 million) and $347 million (before the tax impact of $64 million) during the three and six months ended June 30, 2020, respectively ($48 million and $118 million of legal and other costs during the three and six months ended June 30, 2020, respectively, are not tax deductible).
| (in millions, pre-tax) | Three Months Ended June 30, 2020 | Six Months Ended June 30, 2020 | |||||||||
| Exit financing | $ | 1,519 | $ | 1,570 | |||||||
| Fire Victim Trust tax valuation | 619 | 619 | |||||||||
| Legal and other costs | 179 | 347 | |||||||||
| Bankruptcy and legal costs | $ | 2,317 | $ | 2,536 | |||||||
(3) The Utility incurred costs, net of probable insurance recoveries, of $206 million (before the tax impact of $58 million) during the three and six months ended June 30, 2020 associated with the 2019 Kincade fire. This includes accrued charges of $600 million (before the tax impact of $168 million) during the three and six months ended June 30, 2020 for third-party claims. The Utility also incurred costs of $35 million (before the tax impact of $10 million) during the three and six months ended June 30, 2020 for clean-up and repair costs. In addition, the Utility incurred legal and other costs of $2 million (before the tax impact of $0.4 million) during the three and six months ended June 30, 2020. These costs were partially offset by $430 million (before the tax impact of $120 million) recorded during the three and six months ended June 30, 2020 for probable insurance recoveries.
| (in millions, pre-tax) | Three Months Ended June 30, 2020 | Six Months Ended June 30, 2020 | |||||||||
| Third-party claims | $ | 600 | $ | 600 | |||||||
| Utility clean-up and repairs | 35 | 35 | |||||||||
| Legal and other costs | 2 | 2 | |||||||||
| Insurance recoveries | (430) | (430) | |||||||||
| 2019 Kincade fire-related costs, net of insurance | $ | 206 | $ | 206 | |||||||
(4) The Utility recorded costs of $173 million (before the tax impact of $48 million) during the three and six months ended June 30, 2020 associated with the amortization of wildfire fund contributions related to Assembly Bill ("AB") 1054.
(5) PG&E Corporation and the Utility recorded costs of $58 million (before the tax impact of $13 million) and $97 million (before the tax impact of $24 million) during the three and six months ended June 30, 2020, respectively, associated with investigation remedies and delayed cost recovery. This includes $45 million (before the tax impact of $12 million) and $61 million (before the tax impact of $17 million) during the three and six months ended June 30, 2020, respectively, related to the Wildfire Order Instituting Investigation ("OII") settlement, as modified by the Decision Different dated April 20, 2020 ($2 million of Wildfire OII system enhancement costs during the three and six months ended June 30, 2020 are not tax deductible at the federal statutory rate of 21%). The Utility also incurred restoration and rebuild costs of $7 million (before the tax impact of $2 million) and $20 million (before the tax impact of $6 million) during the three and six months ended June 30, 2020, respectively, associated with the town of Paradise (2018 Camp fire). The Utility also recorded costs of $6 million (before the tax detriment of $1 million) and $15 million (before the tax impact of $1 million) during the three and six months ended June 30, 2020, respectively, for system enhancements related to the Locate and Mark OII ($13 million of Locate and Mark OII system enhancement costs during the three and six months ended June 30, 2020 are not tax deductible at the federal statutory rate of 21%).
| (in millions, pre-tax) | Three Months Ended June 30, 2020 | Six Months Ended June 30, 2020 | |||||||||
| Wildfire OII disallowance and system enhancements | $ | 45 | $ | 61 | |||||||
| Paradise restoration and rebuild | 7 | 20 | |||||||||
| Locate and Mark OII system enhancements | 6 | 15 | |||||||||
| Investigation remedies and delayed cost recovery | $ | 58 | $ | 97 | |||||||
(6) As a result of the 2011-2014 Gas Transmission and Storage ("GT&S") capital audit, the Utility recorded revenues of $108 million (before the tax impact of $30 million) during the three and six months ended June 30, 2020 related to the recovery of capital expenditures from 2011 through 2014 above amounts adopted in the 2011 GT&S rate case.
(7) The Utility incurred $4.0 billion (before the tax impact of $1.1 billion) and $4.2 billion (before the tax impact of $1.2 billion) during the three and six months ended June 30, 2019, respectively, associated with wildfire-related costs. This includes accrued charges of $3.9 billion (before the tax impact of $1.1 billion) during the three and six months ended June 30, 2019 related to an increase in the recorded liability related to third-party claims. The Utility also incurred costs of $71 million (before the tax impact of $20 million) and $250 million (before the tax impact of $70 million) during the three and six months ended June 30, 2019 for clean-up and repair costs related to the 2018 Camp fire. In addition, the Utility incurred legal and other costs of $26 million (before the tax impact of $7 million) and $73 million (before the tax impact of $20 million) related to the 2018 Camp fire and 2017 Northern California wildfires.
| (in millions, pre-tax) | Three Months Ended June 30, 2019 | Six Months Ended June 30, 2019 | |||||||||
| Third-party claims | $ | 3,900 | $ | 3,900 | |||||||
| Utility clean-up and repair | 71 | 250 | |||||||||
| Legal and other costs | 26 | 73 | |||||||||
| Wildfire-related costs | $ | 3,997 | $ | 4,222 | |||||||
(8) The Utility incurred costs of $275 million (before the tax impact of $77 million) and $485 million (before the tax impact of $136 million) during the three and six months ended June 30, 2019, respectively, for incremental operating expenses related to enhanced and accelerated inspections of electric transmission and distribution assets, and certain resulting repairs that are not probable of recovery.
(9) “Non-GAAP core earnings” is a non-GAAP financial measure. See Exhibit G: Use of Non-GAAP Financial Measures.
PG&E Corporation's 2020 and 2021 Earnings Guidance
| 2020 | 2021 | ||||||||||||||||||||||||||||||||||
| EPS Guidance | Low | High | Low | High | |||||||||||||||||||||||||||||||
| Estimated Earnings (Loss) on a GAAP basis | $ | (1.05) | $ | (0.99) | $ | 0.17 | $ | 0.29 | |||||||||||||||||||||||||||
Estimated Non-Core Items: (1) | |||||||||||||||||||||||||||||||||||
Bankruptcy and legal costs (2) | ~ | 2.12 | ~ | 2.09 | ~ | 0.04 | ~ | 0.02 | |||||||||||||||||||||||||||
Investigation remedies and delayed cost recovery (3) | ~ | 0.24 | ~ | 0.24 | ~ | 0.04 | ~ | 0.04 | |||||||||||||||||||||||||||
Amortization of wildfire fund contribution (4) | ~ | 0.23 | ~ | 0.23 | 0.15 | 0.15 | |||||||||||||||||||||||||||||
2019 Kincade fire-related costs, net of insurance (5) | ~ | 0.12 | ~ | 0.12 | — | — | |||||||||||||||||||||||||||||
Net securitization inception charge (6) | — | — | ~ | 0.62 | ~ | 0.62 | |||||||||||||||||||||||||||||
2011 GT&S capital audit (7) | ~ | (0.06) | ~ | (0.06) | ~ | (0.07) | ~ | (0.07) | |||||||||||||||||||||||||||
| Estimated EPS on a non-GAAP Core Earnings basis | $ | 1.60 | $ | 1.63 | $ | 0.95 | $ | 1.05 | |||||||||||||||||||||||||||
All amounts presented in the table above are tax adjusted at PG&E Corporation’s statutory tax rate of 27.98% for 2020, except for certain costs that are not tax deductible, as identified in the following footnotes.
(1) “Non-core items” include items that management does not consider representative of ongoing earnings and affect comparability of financial results between periods. See Exhibit G: Use of Non-GAAP Financial Measures.
(2) “Bankruptcy and legal costs" consists of exit financing costs including backstop fees and interest on temporary Utility debt, a reduction of the deferred tax asset related to the value of PG&E Corporation's common stock transferred to the Fire Victim Trust, and legal and other costs associated with PG&E Corporation and the Utility's Chapter 11 filing. The Fire Victim Trust is subject to future revaluations. The total offsetting tax impact for the low and high non-core guidance range is $139 million and $130 million, respectively, for 2020 and $31 million and $17 million, respectively, for 2021.
| 2020 | 2021 | ||||||||||||||||||||||||||||||||||
| (in millions, pre-tax) | Low guidance range | High guidance range | Low guidance range | High guidance range | |||||||||||||||||||||||||||||||
| Exit financing | ~ | $ | 1,640 | ~ | $ | 1,640 | ~ | $ | 35 | ~ | $ | 35 | |||||||||||||||||||||||
| Fire Victim Trust tax valuation | ~ | 620 | ~ | 620 | — | — | |||||||||||||||||||||||||||||
| Legal and other costs | 550 | 500 | ~ | 75 | ~ | 25 | |||||||||||||||||||||||||||||
| Bankruptcy and legal costs | ~ | $ | 2,810 | ~ | $ | 2,760 | ~ | $ | 110 | ~ | $ | 60 | |||||||||||||||||||||||
(3) “Investigation remedies and delayed cost recovery" includes costs related to the Wildfire OII Decision Different, Paradise restoration and rebuild, and Locate and Mark OII system enhancements. The total offsetting tax impact for the low and high non-core guidance range is $100 million for 2020 and $12 million for 2021.
| 2020 | 2021 | ||||||||||||||||||||||||||||||||||
| (in millions, pre-tax) | Low guidance range | High guidance range | Low guidance range | High guidance range | |||||||||||||||||||||||||||||||
| Wildfire OII disallowance and system enhancements | ~ | $ | 325 | ~ | $ | 325 | ~ | $ | 40 | ~ | $ | 40 | |||||||||||||||||||||||
| Paradise restoration and rebuild | ~ | 50 | ~ | 50 | ~ | 25 | ~ | 25 | |||||||||||||||||||||||||||
| Locate and Mark OII system enhancements | ~ | 25 | ~ | 25 | ~ | 25 | ~ | 25 | |||||||||||||||||||||||||||
| Investigation remedies and delayed cost recovery | ~ | $ | 400 | ~ | $ | 400 | ~ | $ | 90 | ~ | $ | 90 | |||||||||||||||||||||||
(4) "Amortization of wildfire fund contribution” represents the amortization of wildfire fund contributions related to AB 1054. The total offsetting tax impact for the low and high non-core guidance range is $115 million for 2020 and $130 million for 2021.
| 2020 | 2021 | ||||||||||||||||||||||||||||||||||
| (in millions, pre-tax) | Low guidance range | High guidance range | Low guidance range | High guidance range | |||||||||||||||||||||||||||||||
| Amortization of wildfire fund contribution | ~ | $ | 410 | ~ | $ | 410 | ~ | $ | 465 | ~ | $ | 465 | |||||||||||||||||||||||
(5) “2019 Kincade fire-related costs, net of insurance" includes estimated third-party claims, Utility clean-up and repair costs, and legal and other costs associated with the 2019 Kincade fire, net of probable insurance recoveries. The total offsetting tax impact for the low and high non-core guidance range is $59 million for 2020.
| 2020 | 2021 | ||||||||||||||||||||||||||||||||||
| (in millions, pre-tax) | Low guidance range | High guidance range | Low guidance range | High guidance range | |||||||||||||||||||||||||||||||
| Third-party claims | ~ | $ | 600 | ~ | $ | 600 | $ | — | $ | — | |||||||||||||||||||||||||
| Utility clean-up and repairs | ~ | 35 | ~ | 35 | — | — | |||||||||||||||||||||||||||||
| Legal and other costs | ~ | 5 | ~ | 5 | — | — | |||||||||||||||||||||||||||||
| Insurance recoveries | ~ | (430) | ~ | (430) | — | — | |||||||||||||||||||||||||||||
| 2019 Kincade fire-related costs, net of insurance | ~ | $ | 210 | ~ | $ | 210 | $ | — | $ | — | |||||||||||||||||||||||||
(6) “Net securitization inception charge" represents a charge upon inception of securitization and is the result of an undiscounted regulatory liability associated with the revenue credits funded by the Net Operating Loss (NOL) monetization. This reflects the assumption that the CPUC will authorize the securitization of $7.5 billion of wildfire-related claims by March 31, 2021 that is contemplated to be neutral on average to customers. The total offsetting tax impact for the low and high non-core guidance range is $529 million for 2021.
| 2020 | 2021 | ||||||||||||||||||||||||||||||||||
| (in millions, pre-tax) | Low guidance range | High guidance range | Low guidance range | High guidance range | |||||||||||||||||||||||||||||||
| Net securitization inception charge | $ | — | $ | — | ~ | $ | 1,890 | ~ | $ | 1,890 | |||||||||||||||||||||||||
(7) “2011 GT&S capital audit" represents the recovery of capital expenditures from 2011 through 2014 above amounts adopted in the 2011 GT&S rate case. 2020 guidance reflects the completion of the CPUC audit, and 2021 guidance is pending CPUC decision. The total offsetting tax impact for the low and high non-core guidance range is $31 million for 2020 and $56 million for 2021.
| 2020 | 2021 | ||||||||||||||||||||||||||||||||||
| (in millions, pre-tax) | Low guidance range | High guidance range | Low guidance range | High guidance range | |||||||||||||||||||||||||||||||
| 2011 GT&S capital audit | ~ | $ | (110) | ~ | $ | (110) | ~ | $ | (200) | ~ | $ | (200) | |||||||||||||||||||||||
| Use of Non-GAAP Financial Measures PG&E Corporation and Pacific Gas and Electric Company | ||
PG&E Corporation discloses historical financial results and provides guidance based on “non-GAAP core earnings” and “non-GAAP core EPS” in order to provide a measure that allows investors to compare the underlying financial performance of the business from one period to another, exclusive of non-core items.
Beginning with the quarter and full year periods ended December 31, 2019, PG&E Corporation and the Utility changed the name of their principal non-GAAP earnings metric from "non-GAAP earnings from operations" to "non-GAAP core earnings" in order to align more closely with the terminology used by their industry peers. Likewise, PG&E Corporation and the Utility will now refer to adjustments as "non-core items" rather than "items impacting comparability."
“Non-GAAP core earnings” is a non-GAAP financial measure and is calculated as income available for common shareholders less non-core items. “Non-core items” include items that management does not consider representative of ongoing earnings and affect comparability of financial results between periods, consisting of the items listed in "Reconciliation of PG&E Corporation’s Consolidated Earnings (Loss) Attributable to Common Shareholders in Accordance with Generally Accepted Accounting Principles (“GAAP”) to Non-GAAP Earnings from Operations." “Non-GAAP core EPS” also referred to as “non-GAAP core earnings per share” is a non-GAAP financial measure and is calculated as non-GAAP core earnings divided by common shares outstanding (diluted). PG&E Corporation uses non-GAAP core earnings and non-GAAP core EPS to understand and compare operating results across reporting periods for various purposes including internal budgeting and forecasting, short- and long-term operating planning, and employee incentive compensation. PG&E Corporation believes that non-GAAP core earnings and non-GAAP core EPS provide additional insight into the underlying trends of the business, allowing for a better comparison against historical results and expectations for future performance.
Non-GAAP core earnings and non-GAAP core EPS are not substitutes or alternatives for GAAP measures such as consolidated income available for common shareholders and may not be comparable to similarly titled measures used by other companies.

2020 SECOND QUARTER EARNINGS July 30, 2020
® Forward-Looking Statements This presentation contains statements regarding management’s expectations and objectives for future periods (including key factors affecting 2020 non-GAAP core earnings) as well as forecasts and estimates regarding PG&E Corporation’s and Pacific Gas and Electric Company’s (the “Utility”) 2020-2022 Wildfire Mitigation Plan. These statements and other statements that are not purely historical constitute forward-looking statements that are necessarily subject to various risks and uncertainties. Actual results may differ materially from those described in forward-looking statements. PG&E Corporation and the Utility are not able to predict all the factors that may affect future results. Factors that could cause actual results to differ materially include, but are not limited to: • PG&E Corporation’s and the Utility’s historical financial information not being indicative of future financial performance as a result of the Chapter 11 Cases and the financial and other restructuring recently undergone by PG&E Corporation and the Utility in connection with emergence from Chapter 11; • the ability of PG&E Corporation and the Utility to raise financing for operations and investment; • the risks and uncertainties associated with the 2019 Kincade fire, including the extent of the Utility’s liability in connection with the Kincade fire and whether the Utility will be able to timely recover costs incurred therewith in excess of insurance; the timing of the insurance recoveries; the timing and outcome of the referral of the Cal Fire report in connection therewith to the Sonoma District Attorney; and potential liabilities in connection with fines or penalties that could be imposed on the Utility if the CPUC and any other enforcement agency were to bring an enforcement action; • the timing and outcome of the remaining wildfire investigations and the extent to which the Utility will have liabilities associated with these fires; and the timing and amount of insurance recoveries; • whether the Utility can obtain wildfire insurance at a reasonable cost in the future, or at all, and whether insurance coverage is adequate for future losses or claims; and whether the Utility will be able to obtain full recovery of its significantly increased insurance premiums, and the timing of any such recovery; • restrictions on PG&E Corporation’s and the Utility’s ability to pursue strategic and operational initiatives upon emergence from the voluntary cases commenced by each of PG&E Corporation and the Utility under chapter 11 of title 11 of the U.S. Code; • the ability of PG&E Corporation and the Utility to securitize $7.5 billion of costs related to the 2017 Northern California wildfires in a financing transaction that is designed to be rate neutral to customers; • the timing and outcome of future regulatory and legislative developments in connection with the potential financing of the Utility’s wildfire-related liabilities, SB 901, future wildfire reforms, inverse condemnation reform, and other wildfire mitigation measures or other reforms targeted at the Utility; • the occurrence, timing and extent of damages in connection with future wildfires, the associated financial impact on the Utility and the potential for AB 1054 to mitigate such impact (if at all) and the risks and uncertainties associated with the requirements under AB1054 that the Utility maintain a valid certification pursuant to Section 8389(e) of the Public Utilities Code and the potential unavailability of the Wildfire Fund in the event the Utility fails to maintain a valid safety certification; • the severity, extent and duration of the global COVID-19 pandemic and its impact on PG&E Corporation’s and the Utility’s financial condition, results of operations, liquidity and cash flows, as well as on energy demand in the Utility’s service territory, the ability of the Utility to collect on customer invoices, the ability of the Utility’s customers to pay their utility bills in full and in a timely manner, the ability of the Utility to offset these effects with spending reductions and the ability of the Utility to recover any losses incurred in connection with the COVID-19 pandemic through cost recovery, and the impact of workforce disruptions, if any; • the outcome of the Utility’s CWSP, including the Utility’s ability to comply with the targets and metrics set forth in its 2020-2022 Wildfire Mitigation Plan; the cost of the program; and the timing and outcome of any proceeding to recover such cost through rates; • the impact of the Utility’s implementation of its PSPS program, including the timing and outcome of the PSPS OII and whether any fines or penalties will be imposed on the Utility as a result; and the costs in connection with PSPS events; • the timing and outcomes of the 2020 GRC, FERC TO18, TO19, and TO20 rate cases, 2018 and 2019 CEMA applications, WEMA application, future applications for FHPMA, FRMMA, and WMPMA, future cost of capital proceedings, and other ratemaking and regulatory proceedings; • the timing and outcomes of CPUC OIIs that remain open; • the Utility’s ability to efficiently manage capital expenditures and its operating and maintenance expenses within the authorized levels of spending and timely recover its costs through rates, and the extent to which the Utility incurs unrecoverable costs that are higher than the forecasts of such costs; • the outcome of future legislative developments in connection with SB 350; • the outcome of the probation and the monitorship, and the costs that the Utility may incur as a result, including the costs of complying with any additional conditions of probation, including expenses associated with any material expansion of the Utility’s vegetation management program; • whether PG&E Corporation or the Utility undergoes an “ownership change” within the meaning of Section 382 of the Internal Revenue Code of 1986, as amended (the “Internal Revenue Code”), as a result of the implementation of the Plan and in subsequent years; • the ability of PG&E Corporation and the Utility to continue as going concerns; and • the other factors disclosed in PG&E Corporation and the Utility’s joint annual report on Form 10-K for the year ended December 31, 2019, as updated by their joint quarterly report on Form 10-Q for the quarter ended March 31, 2020 and June 30, 2020 and other reports filed with the SEC, which are available on PG&E Corporation’s website at www.pgecorp.com and on the SEC website at www.sec.gov. Unless otherwise indicated, the statements in this presentation are made as of July 30, 2020. PG&E Corporation and the Utility undertake no obligation to update information contained herein. This presentation was attached to PG&E Corporation and the Utility’s joint current report on Form 8-K that was furnished to the SEC on July 30, 2020 and is also available on PG&E Corporation’s 2 website at www.pgecorp.com.
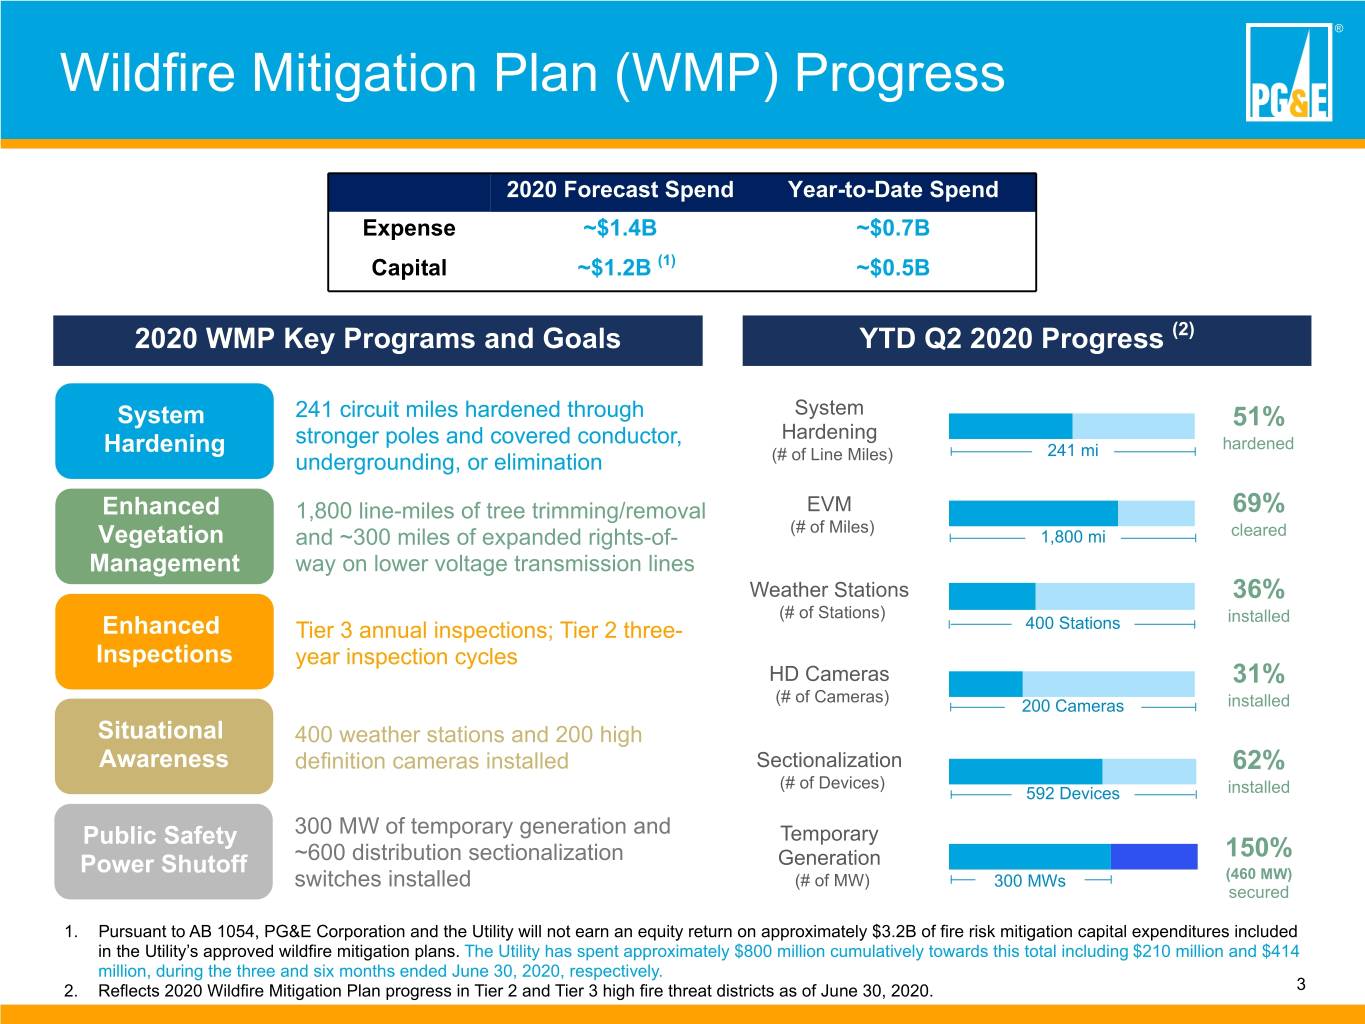
® Wildfire Mitigation Plan (WMP) Progress 2020 Forecast Spend Year-to-Date Spend Expense ~$1.4B ~$0.7B Capital ~$1.2B (1) ~$0.5B 2020 WMP Key Programs and Goals YTD Q2 2020 Progress (2) System 241 circuit miles hardened through System 51% stronger poles and covered conductor, Hardening Hardening 241 mi hardened undergrounding, or elimination (# of Line Miles) Enhanced 1,800 line-miles of tree trimming/removal EVM 69% (# of Miles) Vegetation and ~300 miles of expanded rights-of- 1,800 mi cleared Management way on lower voltage transmission lines Weather Stations 36% (# of Stations) installed Enhanced Tier 3 annual inspections; Tier 2 three- 400 Stations Inspections year inspection cycles HD Cameras 31% (# of Cameras) 200 Cameras installed Situational 400 weather stations and 200 high Awareness definition cameras installed Sectionalization 62% (# of Devices) 592 Devices installed 300 MW of temporary generation and Temporary Public Safety 150% Power Shutoff ~600 distribution sectionalization Generation switches installed (# of MW) 300 MWs (460 MW) secured 1. Pursuant to AB 1054, PG&E Corporation and the Utility will not earn an equity return on approximately $3.2B of fire risk mitigation capital expenditures included in the Utility’s approved wildfire mitigation plans. The Utility has spent approximately $800 million cumulatively towards this total including $210 million and $414 million, during the three and six months ended June 30, 2020, respectively. 2. Reflects 2020 Wildfire Mitigation Plan progress in Tier 2 and Tier 3 high fire threat districts as of June 30, 2020. 3
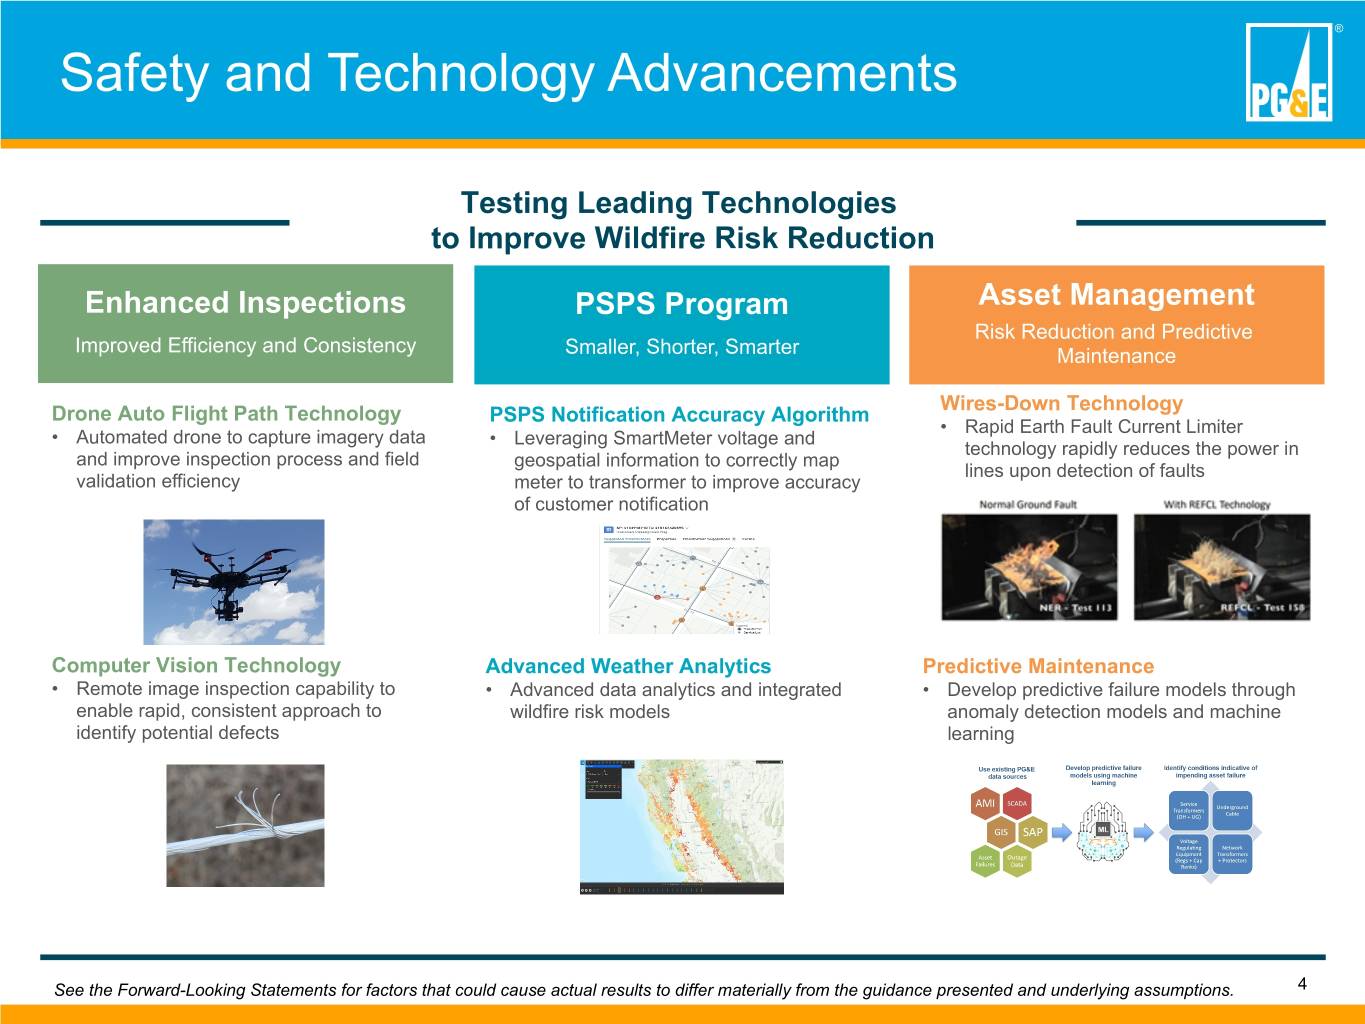
® Safety and Technology Advancements Testing Leading Technologies to Improve Wildfire Risk Reduction Enhanced Inspections PSPS Program Asset Management Risk Reduction and Predictive Improved Efficiency and Consistency Smaller, Shorter, Smarter Maintenance Wires-Down Technology Drone Auto Flight Path Technology PSPS Notification Accuracy Algorithm • Rapid Earth Fault Current Limiter • Automated drone to capture imagery data • Leveraging SmartMeter voltage and technology rapidly reduces the power in and improve inspection process and field geospatial information to correctly map lines upon detection of faults validation efficiency meter to transformer to improve accuracy of customer notification Computer Vision Technology Advanced Weather Analytics Predictive Maintenance • Remote image inspection capability to • Advanced data analytics and integrated • Develop predictive failure models through enable rapid, consistent approach to wildfire risk models anomaly detection models and machine identify potential defects learning See the Forward-Looking Statements for factors that could cause actual results to differ materially from the guidance presented and underlying assumptions. 4
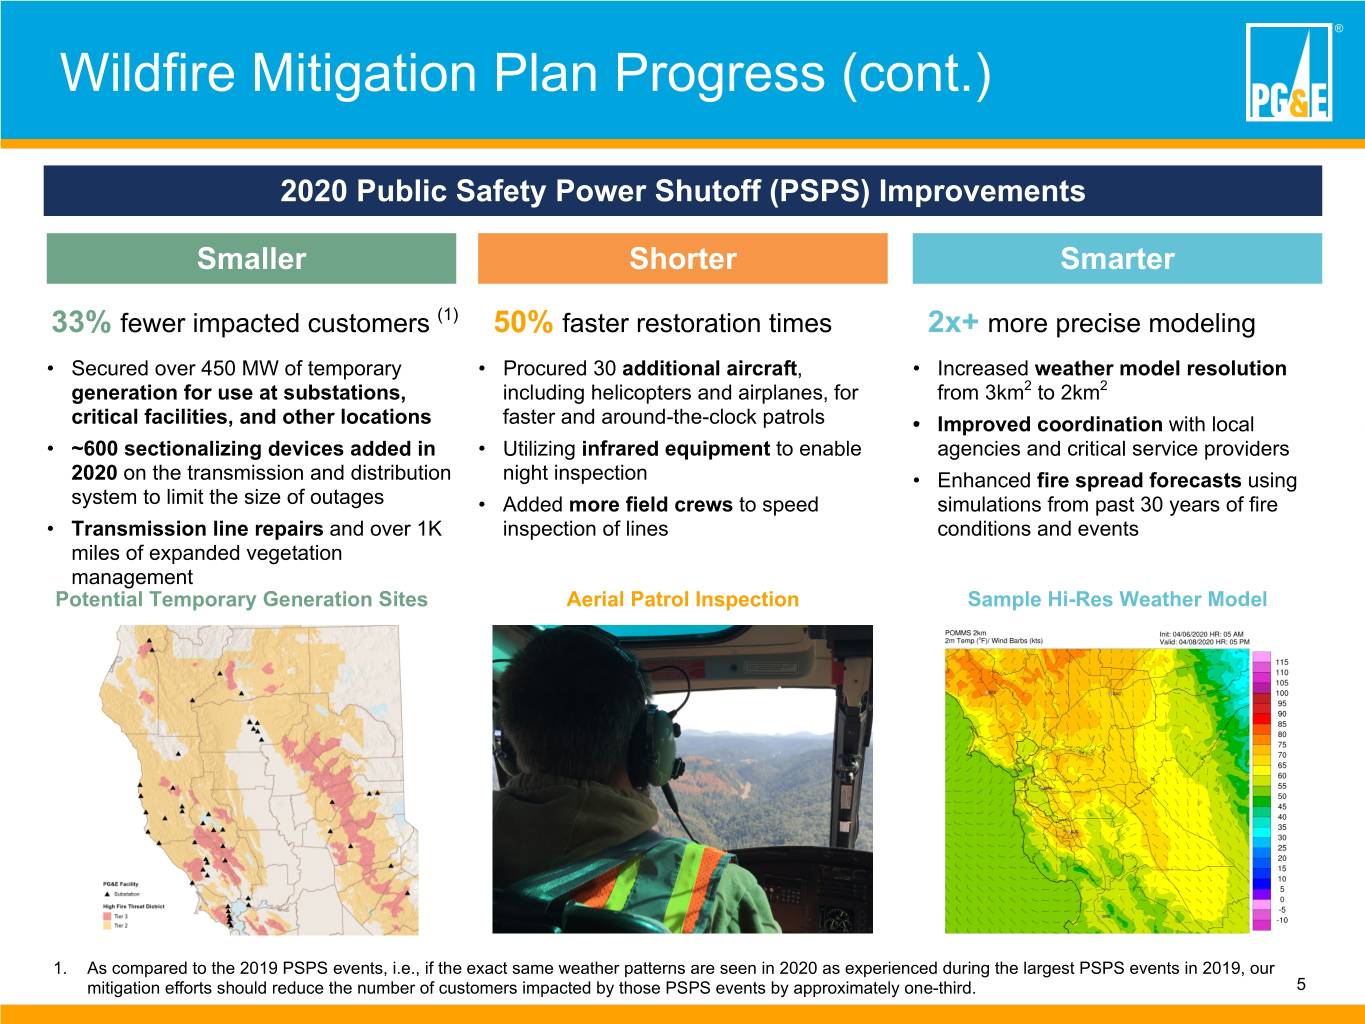
® Wildfire Mitigation Plan Progress (cont.) 2020 Public Safety Power Shutoff (PSPS) Improvements Smaller Shorter Smarter 33% fewer impacted customers (1) 50% faster restoration times 2x+ more precise modeling • Secured over 450 MW of temporary • Procured 30 additional aircraft, • Increased weather model resolution generation for use at substations, including helicopters and airplanes, for from 3km2 to 2km2 critical facilities, and other locations faster and around-the-clock patrols • Improved coordination with local • ~600 sectionalizing devices added in • Utilizing infrared equipment to enable agencies and critical service providers 2020 on the transmission and distribution night inspection • Enhanced fire spread forecasts using system to limit the size of outages • Added more field crews to speed simulations from past 30 years of fire • Transmission line repairs and over 1K inspection of lines conditions and events miles of expanded vegetation management Potential Temporary Generation Sites Aerial Patrol Inspection Sample Hi-Res Weather Model 1. As compared to the 2019 PSPS events, i.e., if the exact same weather patterns are seen in 2020 as experienced during the largest PSPS events in 2019, our mitigation efforts should reduce the number of customers impacted by those PSPS events by approximately one-third. 5
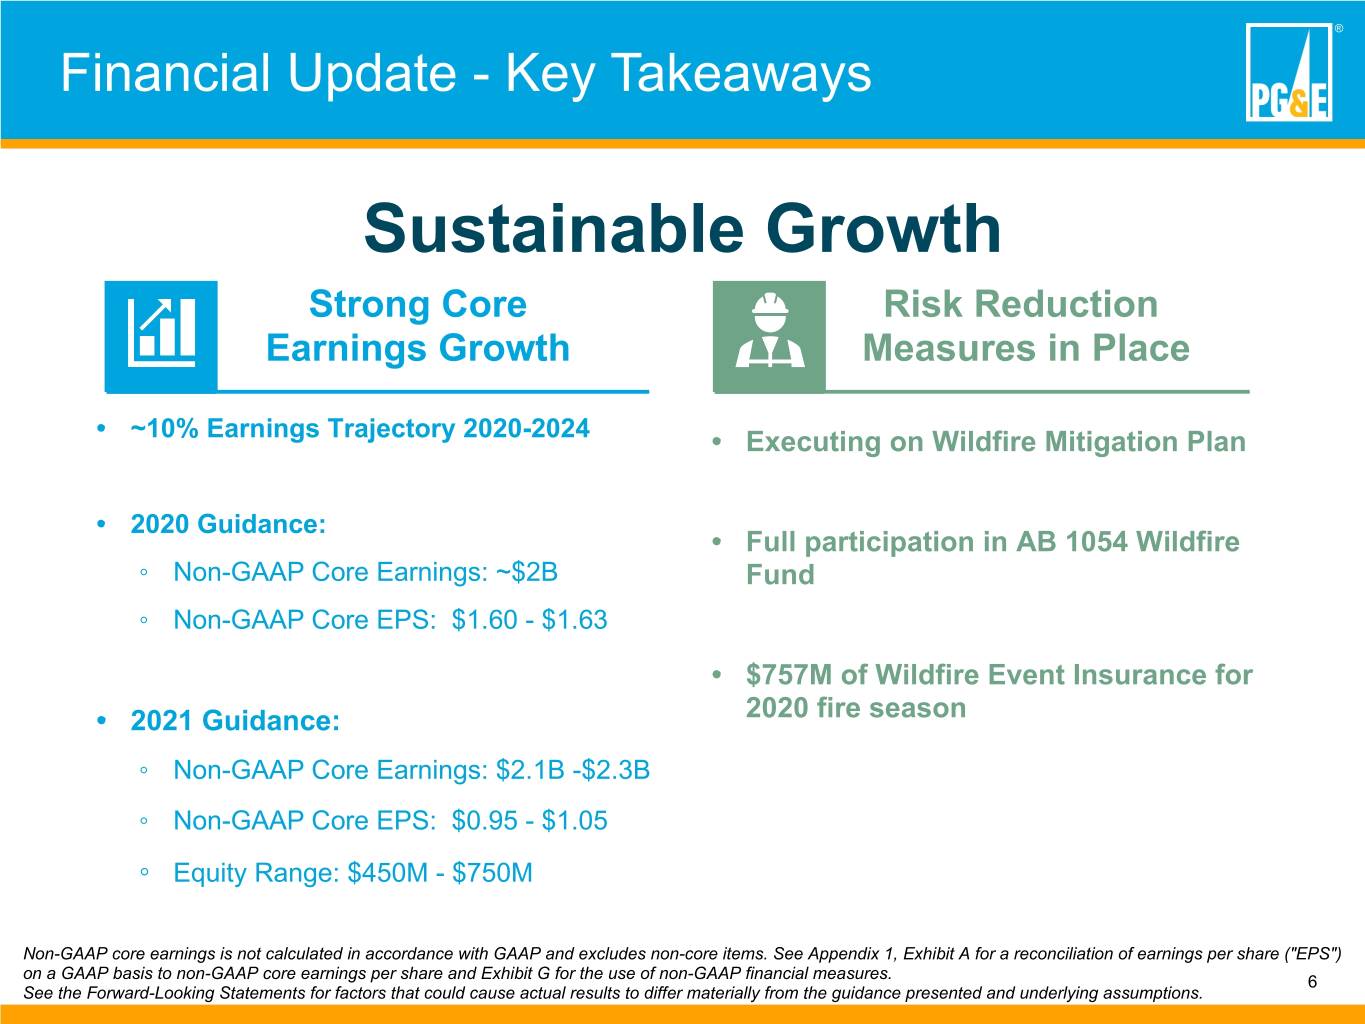
® Financial Update - Key Takeaways Sustainable Growth Strong Core Risk Reduction Earnings Growth Measures in Place • ~10% Earnings Trajectory 2020-2024 • Executing on Wildfire Mitigation Plan • 2020 Guidance: • Full participation in AB 1054 Wildfire ◦ Non-GAAP Core Earnings: ~$2B Fund ◦ Non-GAAP Core EPS: $1.60 - $1.63 • $757M of Wildfire Event Insurance for • 2021 Guidance: 2020 fire season ◦ Non-GAAP Core Earnings: $2.1B -$2.3B ◦ Non-GAAP Core EPS: $0.95 - $1.05 ◦ Equity Range: $450M - $750M Non-GAAP core earnings is not calculated in accordance with GAAP and excludes non-core items. See Appendix 1, Exhibit A for a reconciliation of earnings per share ("EPS") on a GAAP basis to non-GAAP core earnings per share and Exhibit G for the use of non-GAAP financial measures. 6 See the Forward-Looking Statements for factors that could cause actual results to differ materially from the guidance presented and underlying assumptions.
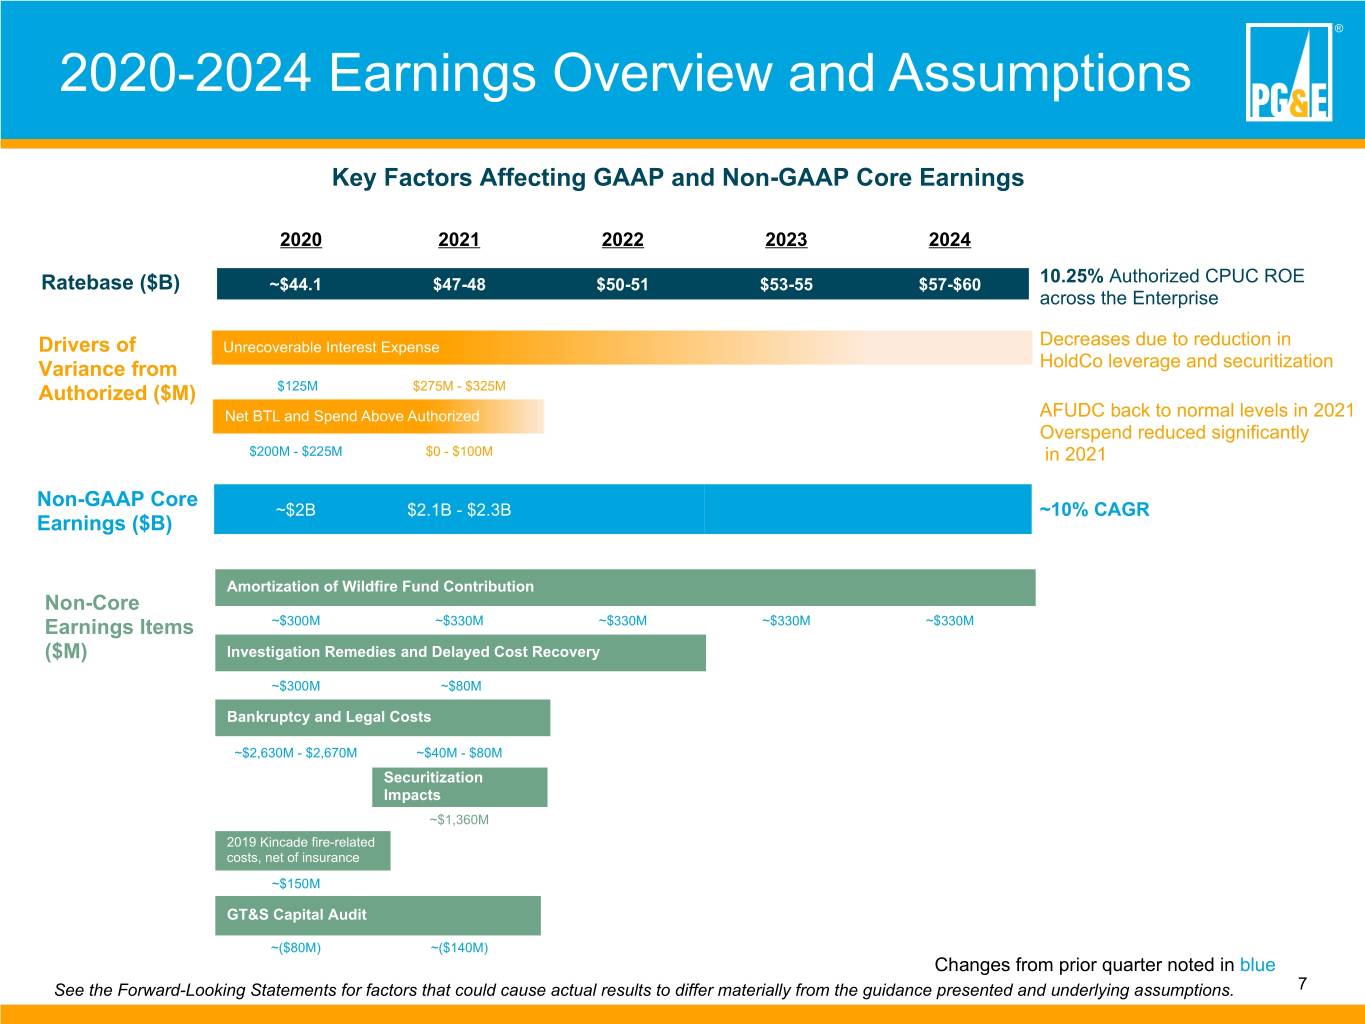
® 2020-2024 Earnings Overview and Assumptions Key Factors Affecting GAAP and Non-GAAP Core Earnings 2020 2021 2022 2023 2024 Ratebase ($B) ~$44.1 $47-48 $50-51 $53-55 $57-$60 10.25% Authorized CPUC ROE across the Enterprise Drivers of Unrecoverable Interest Expense Decreases due to reduction in Variance from HoldCo leverage and securitization Authorized ($M) $125M $275M - $325M Net BTL and Spend Above Authorized AFUDC back to normal levels in 2021 Overspend reduced significantly $200M - $225M $0 - $100M in 2021 Non-GAAP Core ~$2B $2.1B - $2.3B ~10% CAGR Earnings ($B) Amortization of Wildfire Fund Contribution Non-Core Earnings Items ~$300M ~$330M ~$330M ~$330M ~$330M ($M) Investigation Remedies and Delayed Cost Recovery ~$300M ~$80M Bankruptcy and Legal Costs ~$2,630M - $2,670M ~$40M - $80M Securitization Impacts ~$1,360M 2019 Kincade fire-related costs, net of insurance ~$150M GT&S Capital Audit ~($80M) ~($140M) Changes from prior quarter noted in blue See the Forward-Looking Statements for factors that could cause actual results to differ materially from the guidance presented and underlying assumptions. 7
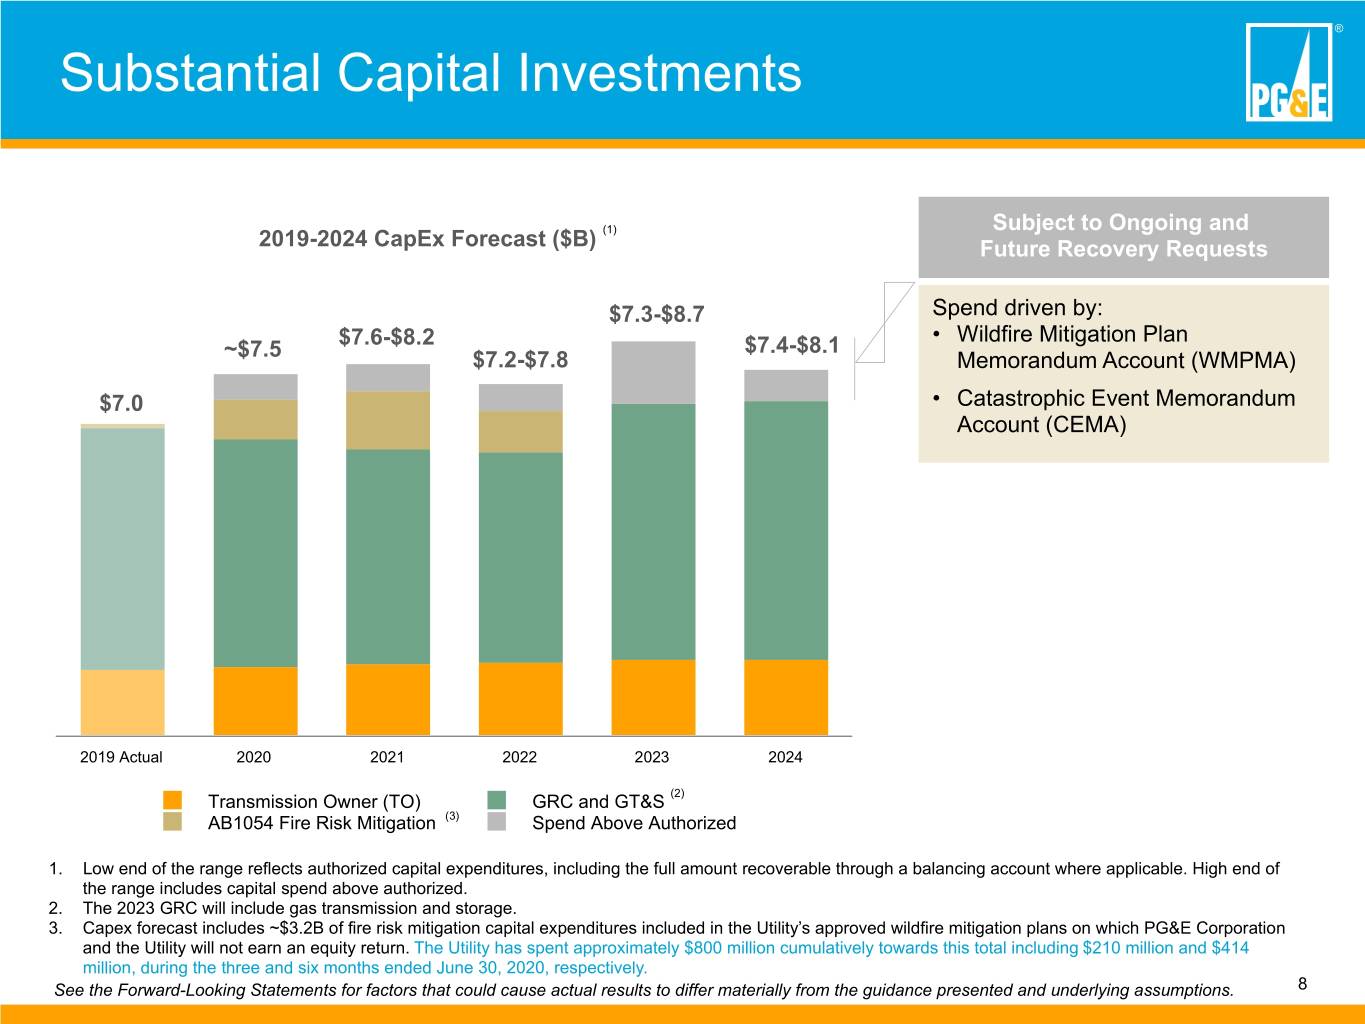
® Substantial Capital Investments (1) Subject to Ongoing and 2019-2024 CapEx Forecast ($B) Future Recovery Requests $7.3-$8.7 Spend driven by: $7.6-$8.2 $7.4-$8.1 • Wildfire Mitigation Plan ~$7.5 $7.2-$7.8 Memorandum Account (WMPMA) $7.0 • Catastrophic Event Memorandum Account (CEMA) 2019 Actual 2020 2021 2022 2023 2024 Transmission Owner (TO) GRC and GT&S (2) AB1054 Fire Risk Mitigation (3) Spend Above Authorized 1. Low end of the range reflects authorized capital expenditures, including the full amount recoverable through a balancing account where applicable. High end of the range includes capital spend above authorized. 2. The 2023 GRC will include gas transmission and storage. 3. Capex forecast includes ~$3.2B of fire risk mitigation capital expenditures included in the Utility’s approved wildfire mitigation plans on which PG&E Corporation and the Utility will not earn an equity return. The Utility has spent approximately $800 million cumulatively towards this total including $210 million and $414 million, during the three and six months ended June 30, 2020, respectively. See the Forward-Looking Statements for factors that could cause actual results to differ materially from the guidance presented and underlying assumptions. 8
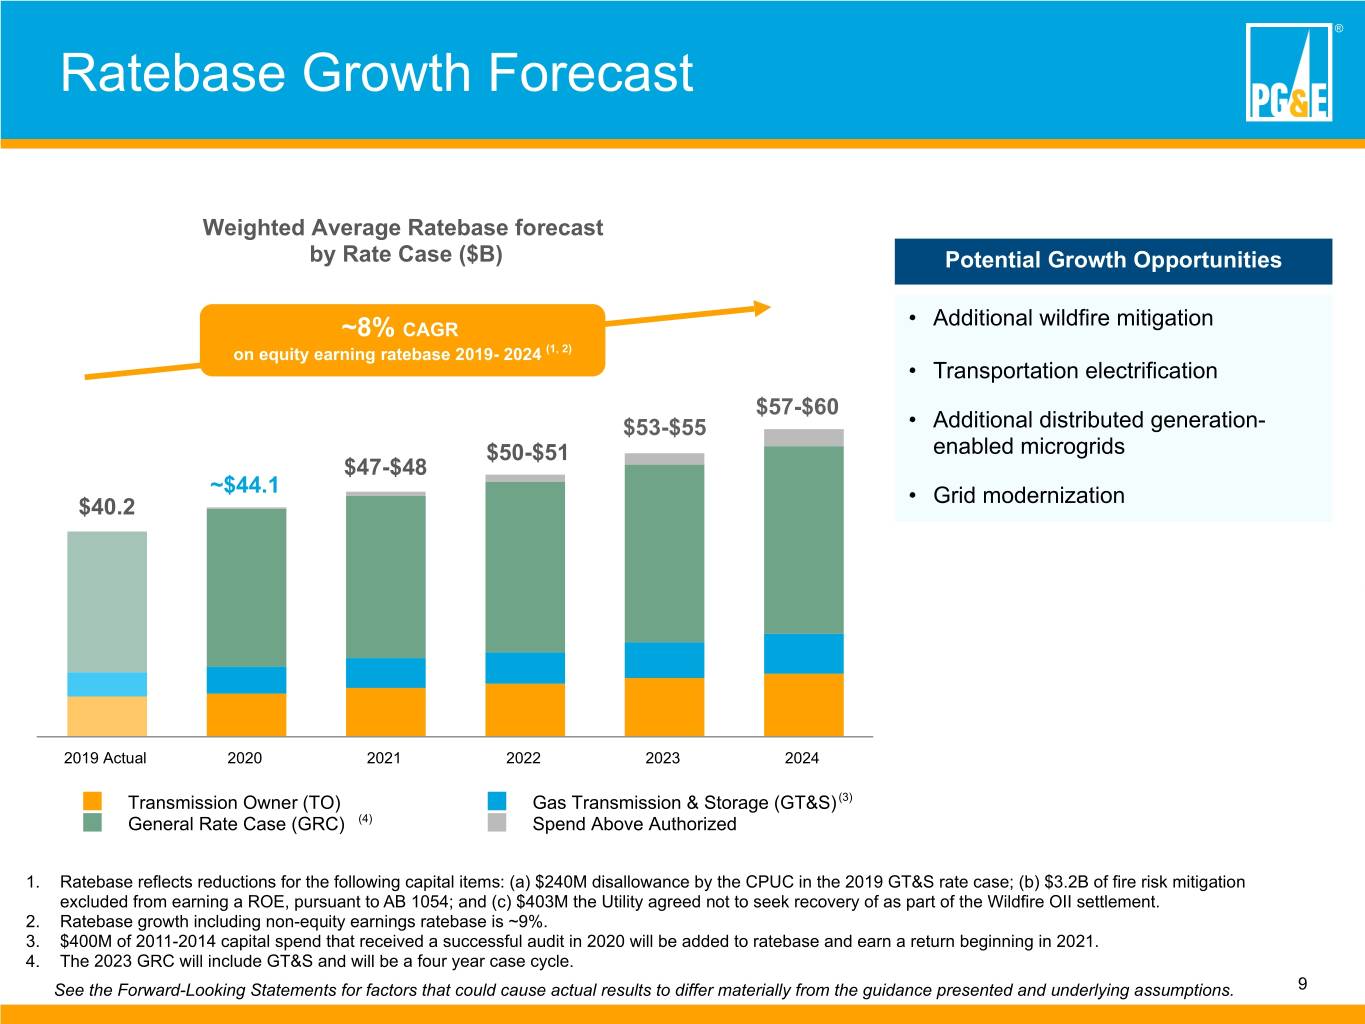
® Ratebase Growth Forecast Weighted Average Ratebase forecast by Rate Case ($B) Potential Growth Opportunities • Additional wildfire mitigation ~8% CAGR on equity earning ratebase 2019- 2024 (1, 2) • Transportation electrification $57-$60 $53-$55 • Additional distributed generation- $50-$51 enabled microgrids $47-$48 ~$44.1 • Grid modernization $40.2 2019 Actual 2020 2021 2022 2023 2024 Transmission Owner (TO) Gas Transmission & Storage (GT&S) (3) General Rate Case (GRC) (4) Spend Above Authorized 1. Ratebase reflects reductions for the following capital items: (a) $240M disallowance by the CPUC in the 2019 GT&S rate case; (b) $3.2B of fire risk mitigation excluded from earning a ROE, pursuant to AB 1054; and (c) $403M the Utility agreed not to seek recovery of as part of the Wildfire OII settlement. 2. Ratebase growth including non-equity earnings ratebase is ~9%. 3. $400M of 2011-2014 capital spend that received a successful audit in 2020 will be added to ratebase and earn a return beginning in 2021. 4. The 2023 GRC will include GT&S and will be a four year case cycle. See the Forward-Looking Statements for factors that could cause actual results to differ materially from the guidance presented and underlying assumptions. 9
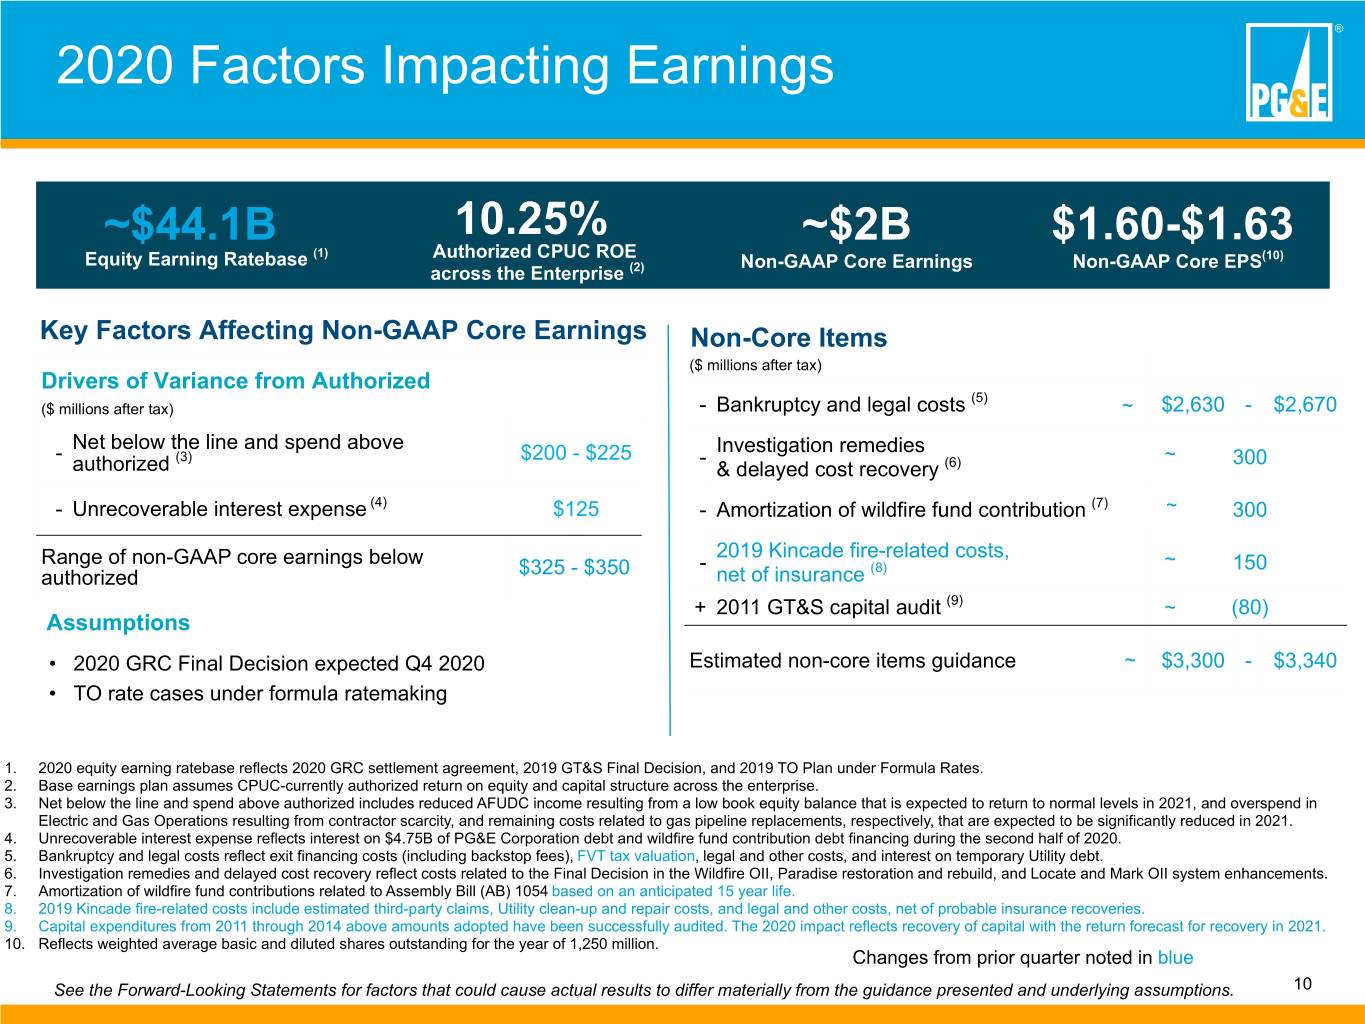
® 2020 Factors Impacting Earnings ~$44.1B2020 Key $44.5B10.25% ~$2B 10.25%$1.60-$1.63 (1) Authorized CPUC ROE(1) (2) EquityAssumptions Earning Ratebase Equity Earning Ratebase Non-GAAPAuthorized Core CPUC Earnings ROE across theNon-GAAP Enterprise Core EPS(10) across the Enterprise (2) Key Factors Affecting Non-GAAP Core Earnings Non-Core Items ($ millions after tax) Drivers of Variance from Authorized (5) ($ millions after tax) - Bankruptcy and legal costs ~ $2,630 - $2,670 Net below the line and spend above Investigation remedies - (3) $200 - $225 - ~ 300 authorized & delayed cost recovery (6) - Unrecoverable interest expense (4) $125 - Amortization of wildfire fund contribution (7) ~ 300 2019 Kincade fire-related costs, Range of non-GAAP core earnings below - (8) ~ 150 authorized $325 - $350 net of insurance + 2011 GT&S capital audit (9) ~ (80) Assumptions • 2020 GRC Final Decision expected Q4 2020 Estimated non-core items guidance ~ $3,300 - $3,340 • TO rate cases under formula ratemaking 1. 2020 equity earning ratebase reflects 2020 GRC settlement agreement, 2019 GT&S Final Decision, and 2019 TO Plan under Formula Rates. 2. Base earnings plan assumes CPUC-currently authorized return on equity and capital structure across the enterprise. 3. Net below the line and spend above authorized includes reduced AFUDC income resulting from a low book equity balance that is expected to return to normal levels in 2021, and overspend in Electric and Gas Operations resulting from contractor scarcity, and remaining costs related to gas pipeline replacements, respectively, that are expected to be significantly reduced in 2021. 4. Unrecoverable interest expense reflects interest on $4.75B of PG&E Corporation debt and wildfire fund contribution debt financing during the second half of 2020. 5. Bankruptcy and legal costs reflect exit financing costs (including backstop fees), FVT tax valuation, legal and other costs, and interest on temporary Utility debt. 6. Investigation remedies and delayed cost recovery reflect costs related to the Final Decision in the Wildfire OII, Paradise restoration and rebuild, and Locate and Mark OII system enhancements. 7. Amortization of wildfire fund contributions related to Assembly Bill (AB) 1054 based on an anticipated 15 year life. 8. 2019 Kincade fire-related costs include estimated third-party claims, Utility clean-up and repair costs, and legal and other costs, net of probable insurance recoveries. 9. Capital expenditures from 2011 through 2014 above amounts adopted have been successfully audited. The 2020 impact reflects recovery of capital with the return forecast for recovery in 2021. 10. Reflects weighted average basic and diluted shares outstanding for the year of 1,250 million. Changes from prior quarter noted in blue See the Forward-Looking Statements for factors that could cause actual results to differ materially from the guidance presented and underlying assumptions. 10
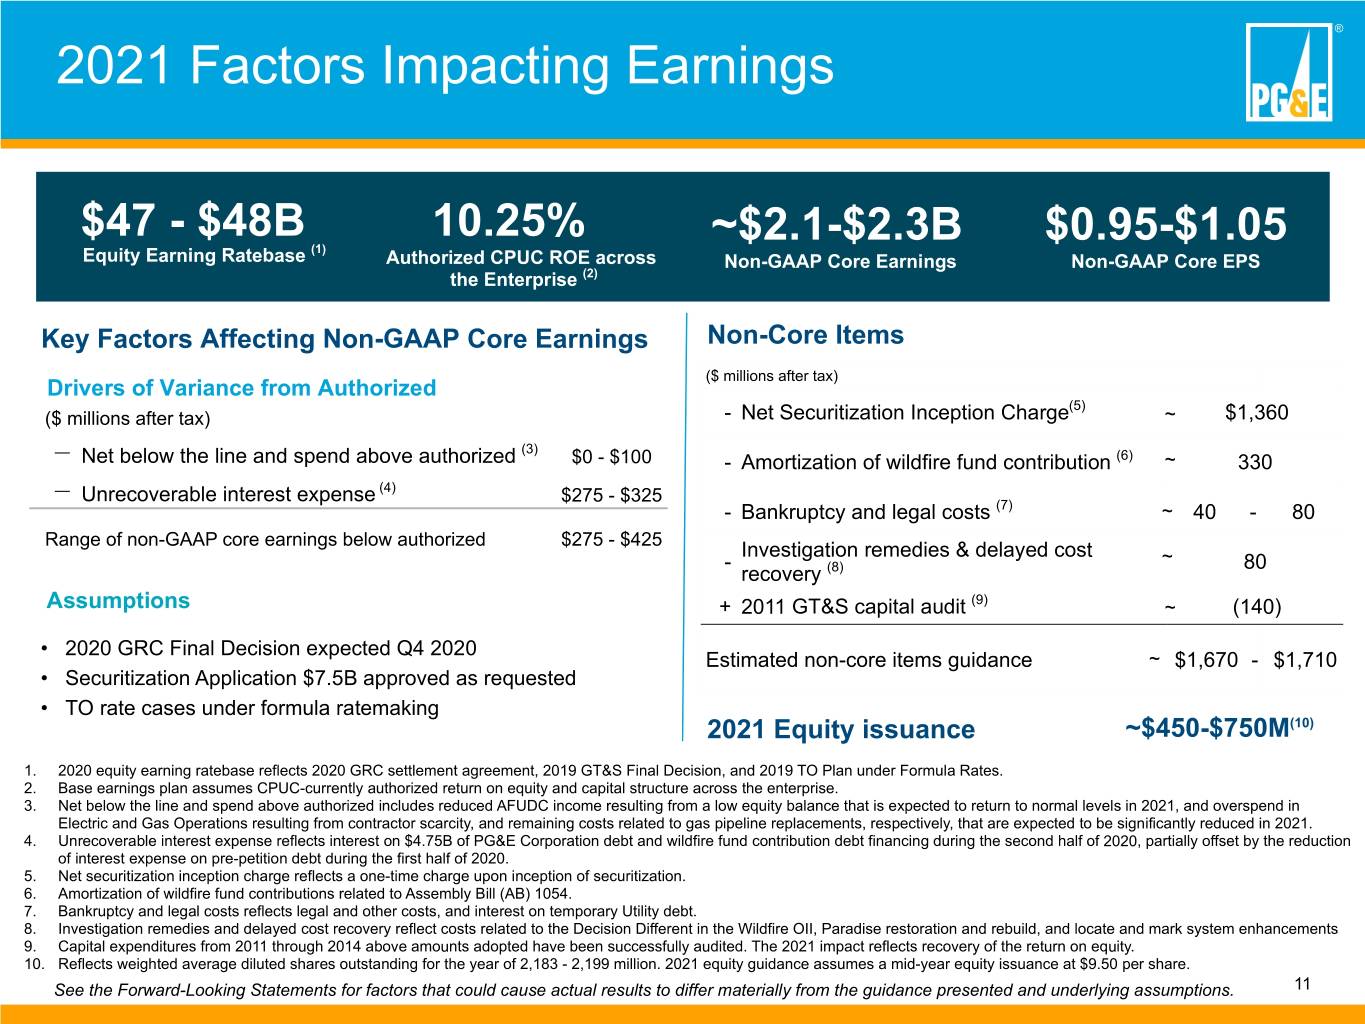
® 2021 Factors Impacting Earnings $47~$44.5B - $48B 10.25% ~$2.1-$2.3B $0.95-$1.05 (1) EquityEquity Earning Earning Ratebase Ratebase (1) Authorized CPUC ROE across Non-GAAP Core Earnings Non-GAAP Core EPS the Enterprise (2) Key Factors Affecting Non-GAAP Core Earnings Non-Core Items ($ millions after tax) Drivers of Variance from Authorized (5) ($ millions after tax) - Net Securitization Inception Charge ~ $1,360 — (3) Net below the line and spend above authorized $0 - $100 - Amortization of wildfire fund contribution (6) ~ 330 — Unrecoverable interest expense (4) $275 - $325 - Bankruptcy and legal costs (7) ~ 40 - 80 Range of non-GAAP core earnings below authorized $275 - $425 Investigation remedies & delayed cost - ~ 80 recovery (8) Assumptions + 2011 GT&S capital audit (9) ~ (140) • 2020 GRC Final Decision expected Q4 2020 Estimated non-core items guidance ~ $1,670 - $1,710 • Securitization Application $7.5B approved as requested • TO rate cases under formula ratemaking 2021 Equity issuance ~$450-$750M(10) 1. 2020 equity earning ratebase reflects 2020 GRC settlement agreement, 2019 GT&S Final Decision, and 2019 TO Plan under Formula Rates. 2. Base earnings plan assumes CPUC-currently authorized return on equity and capital structure across the enterprise. 3. Net below the line and spend above authorized includes reduced AFUDC income resulting from a low equity balance that is expected to return to normal levels in 2021, and overspend in Electric and Gas Operations resulting from contractor scarcity, and remaining costs related to gas pipeline replacements, respectively, that are expected to be significantly reduced in 2021. 4. Unrecoverable interest expense reflects interest on $4.75B of PG&E Corporation debt and wildfire fund contribution debt financing during the second half of 2020, partially offset by the reduction of interest expense on pre-petition debt during the first half of 2020. 5. Net securitization inception charge reflects a one-time charge upon inception of securitization. 6. Amortization of wildfire fund contributions related to Assembly Bill (AB) 1054. 7. Bankruptcy and legal costs reflects legal and other costs, and interest on temporary Utility debt. 8. Investigation remedies and delayed cost recovery reflect costs related to the Decision Different in the Wildfire OII, Paradise restoration and rebuild, and locate and mark system enhancements 9. Capital expenditures from 2011 through 2014 above amounts adopted have been successfully audited. The 2021 impact reflects recovery of the return on equity. 10. Reflects weighted average diluted shares outstanding for the year of 2,183 - 2,199 million. 2021 equity guidance assumes a mid-year equity issuance at $9.50 per share. See the Forward-Looking Statements for factors that could cause actual results to differ materially from the guidance presented and underlying assumptions. 11
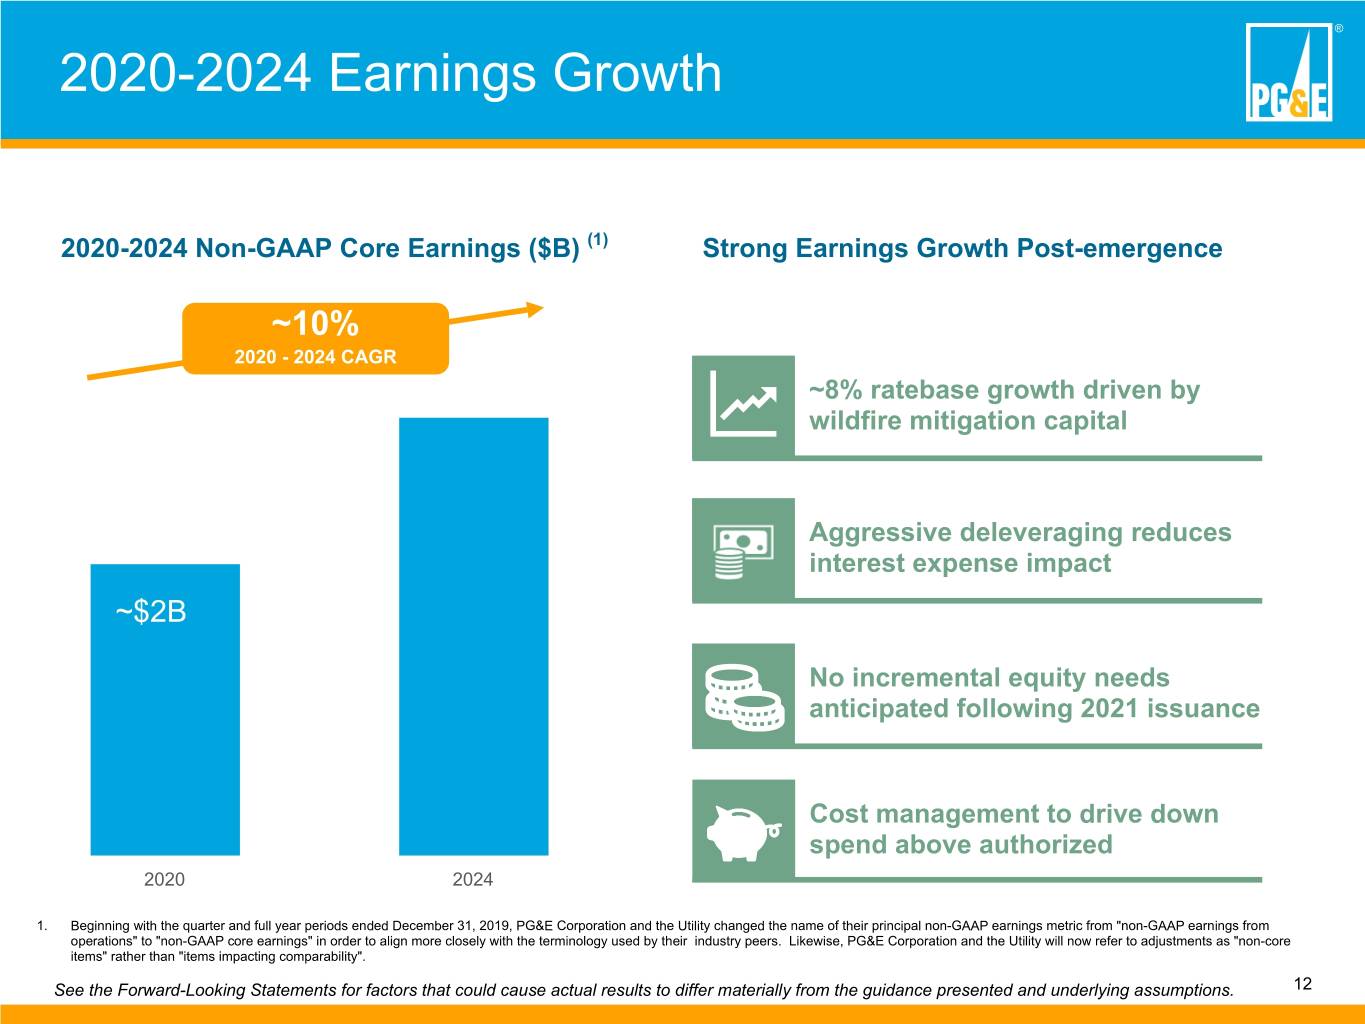
® 2020-2024 Earnings Growth 2020-2024 Non-GAAP Core Earnings ($B) (1) Strong Earnings Growth Post-emergence ~10% 2020 - 2024 CAGR ~8% ratebase growth driven by wildfire mitigation capital Aggressive deleveraging reduces interest expense impact ~$2B~$2 No incremental equity needs anticipated following 2021 issuance Cost management to drive down spend above authorized 2020 2024 1. Beginning with the quarter and full year periods ended December 31, 2019, PG&E Corporation and the Utility changed the name of their principal non-GAAP earnings metric from "non-GAAP earnings from operations" to "non-GAAP core earnings" in order to align more closely with the terminology used by their industry peers. Likewise, PG&E Corporation and the Utility will now refer to adjustments as "non-core items" rather than "items impacting comparability". See the Forward-Looking Statements for factors that could cause actual results to differ materially from the guidance presented and underlying assumptions. 12
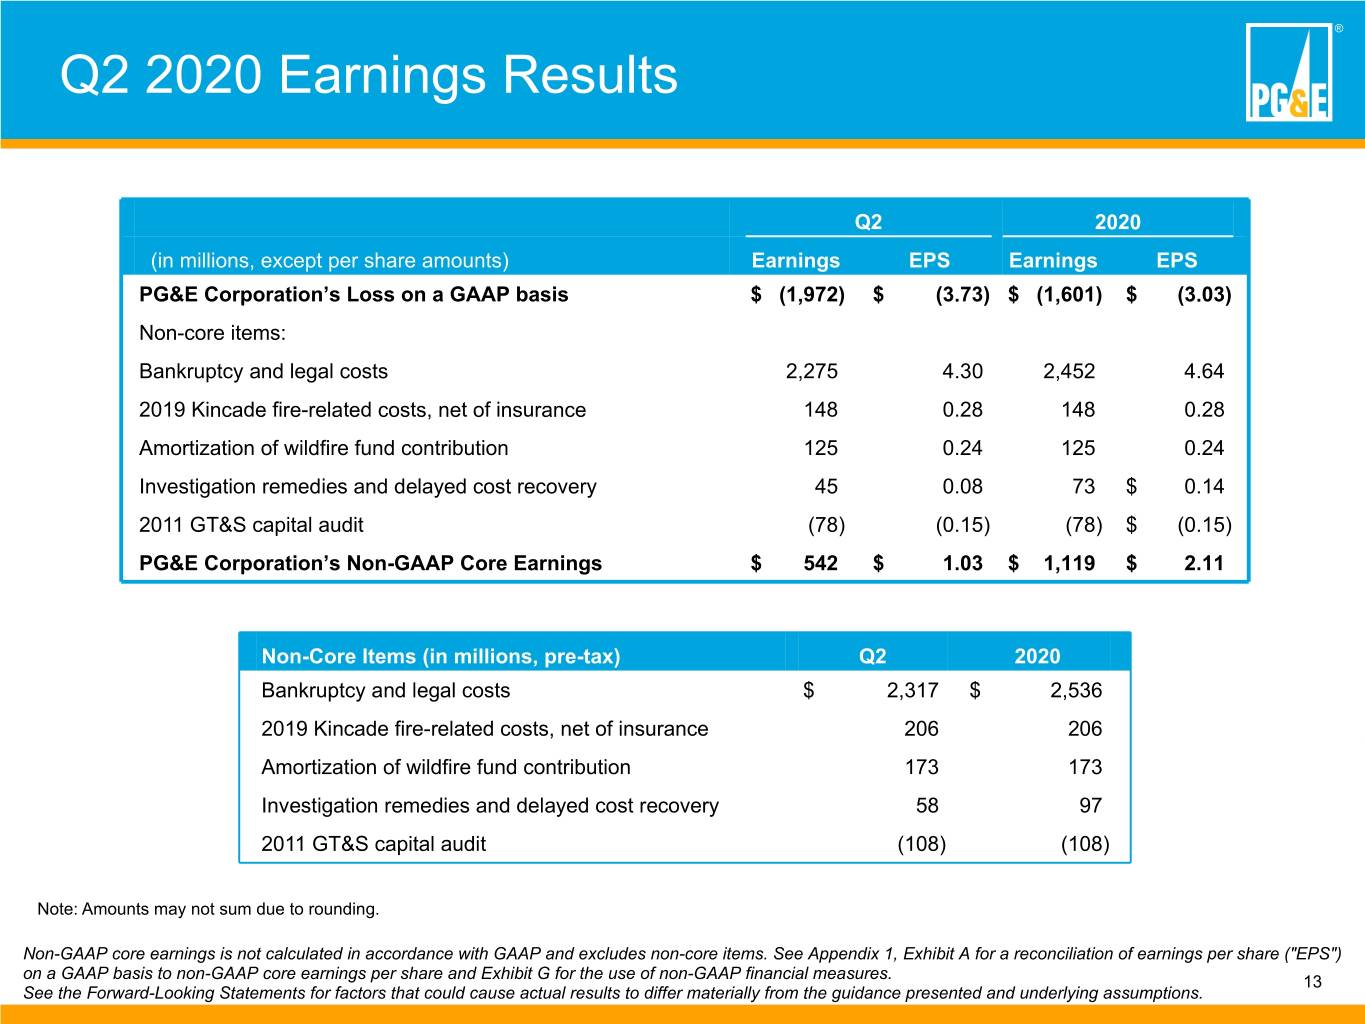
® Q2 2020 Earnings Results Q2 2020 (in millions, except per share amounts) Earnings EPS Earnings EPS PG&E Corporation’s Loss on a GAAP basis $ (1,972) $ (3.73) $ (1,601) $ (3.03) Non-core items: Bankruptcy and legal costs 2,275 4.30 2,452 4.64 2019 Kincade fire-related costs, net of insurance 148 0.28 148 0.28 Amortization of wildfire fund contribution 125 0.24 125 0.24 Investigation remedies and delayed cost recovery 45 0.08 73 $ 0.14 2011 GT&S capital audit (78) (0.15) (78) $ (0.15) PG&E Corporation’s Non-GAAP Core Earnings $ 542 $ 1.03 $ 1,119 $ 2.11 Non-Core Items (in millions, pre-tax) Q2 2020 Bankruptcy and legal costs $ 2,317 $ 2,536 2019 Kincade fire-related costs, net of insurance 206 206 Amortization of wildfire fund contribution 173 173 Investigation remedies and delayed cost recovery 58 97 2011 GT&S capital audit (108) (108) Note: Amounts may not sum due to rounding. Non-GAAP core earnings is not calculated in accordance with GAAP and excludes non-core items. See Appendix 1, Exhibit A for a reconciliation of earnings per share ("EPS") on a GAAP basis to non-GAAP core earnings per share and Exhibit G for the use of non-GAAP financial measures. 13 See the Forward-Looking Statements for factors that could cause actual results to differ materially from the guidance presented and underlying assumptions.
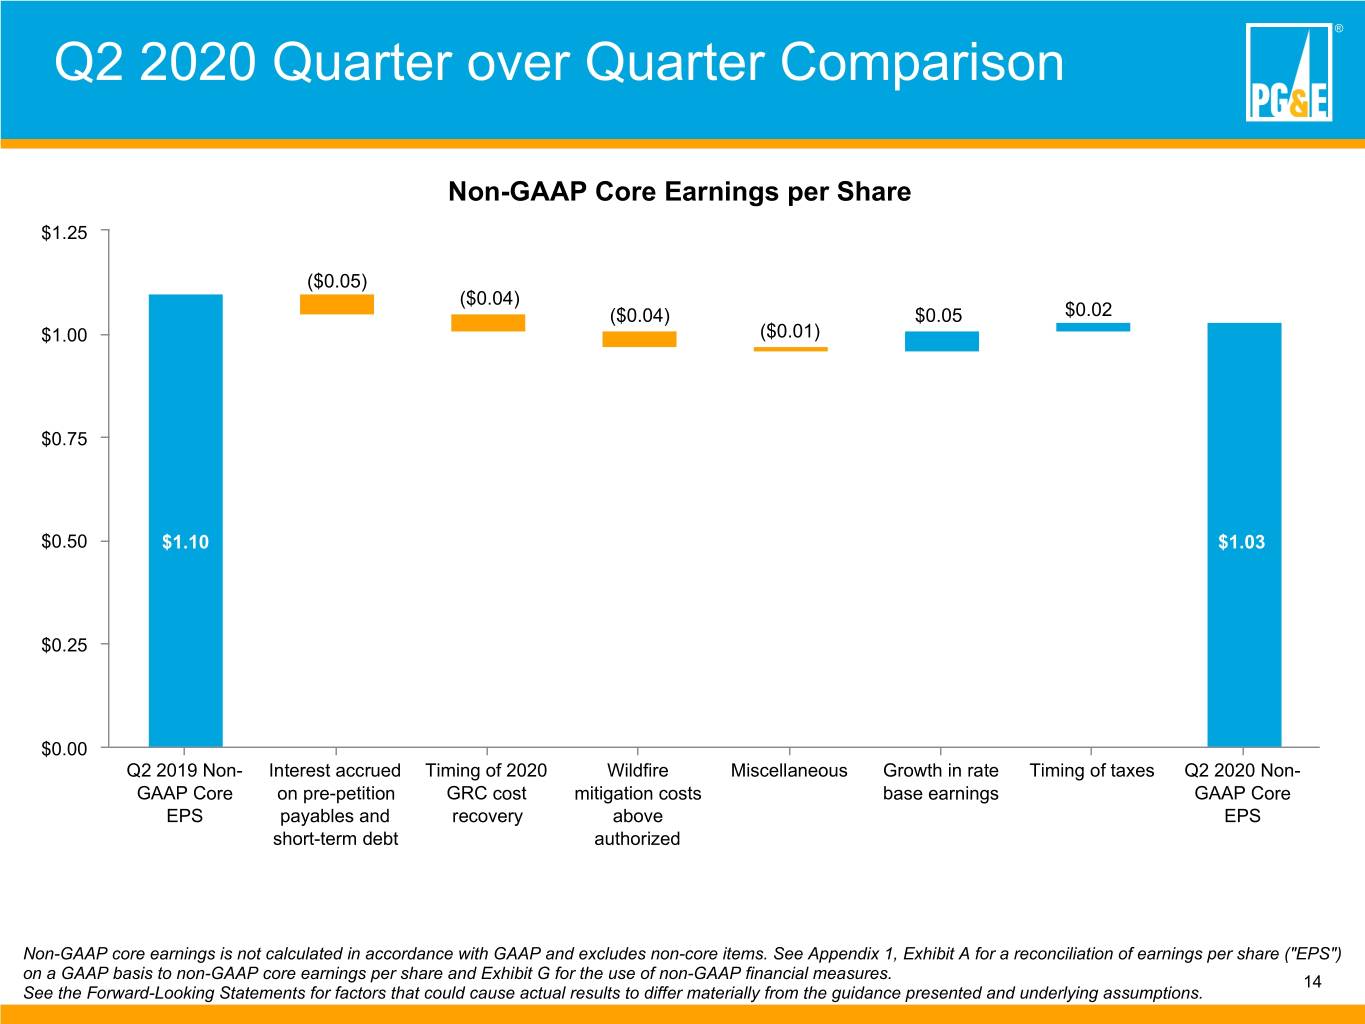
® Q2 2020 Quarter over Quarter Comparison Non-GAAP Core Earnings per Share $1.25 ($0.05) ($0.04) ($0.04) $0.05 $0.02 $1.00 ($0.01) $0.75 $0.50 $1.10 $1.03 $0.25 $0.00 Q2 2019 Non- Interest accrued Timing of 2020 Wildfire Miscellaneous Growth in rate Timing of taxes Q2 2020 Non- GAAP Core on pre-petition GRC cost mitigation costs base earnings GAAP Core EPS payables and recovery above EPS short-term debt authorized Non-GAAP core earnings is not calculated in accordance with GAAP and excludes non-core items. See Appendix 1, Exhibit A for a reconciliation of earnings per share ("EPS") on a GAAP basis to non-GAAP core earnings per share and Exhibit G for the use of non-GAAP financial measures. 14 See the Forward-Looking Statements for factors that could cause actual results to differ materially from the guidance presented and underlying assumptions.

Appendix
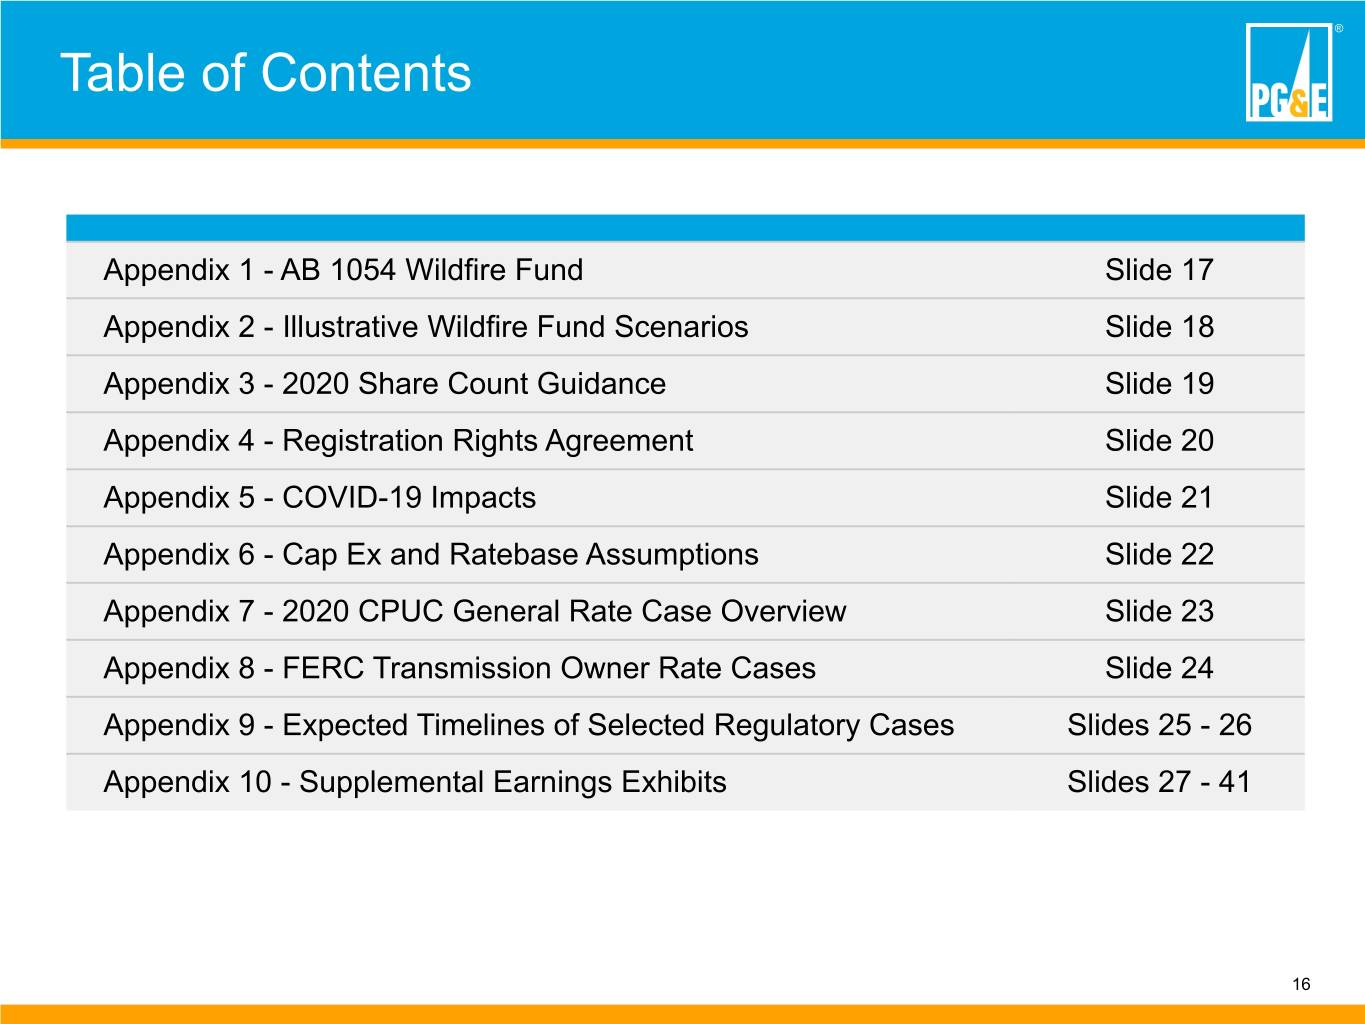
® Table of Contents Appendix 1 - AB 1054 Wildfire Fund Slide 17 Appendix 2 - Illustrative Wildfire Fund Scenarios Slide 18 Appendix 3 - 2020 Share Count Guidance Slide 19 Appendix 4 - Registration Rights Agreement Slide 20 Appendix 5 - COVID-19 Impacts Slide 21 Appendix 6 - Cap Ex and Ratebase Assumptions Slide 22 Appendix 7 - 2020 CPUC General Rate Case Overview Slide 23 Appendix 8 - FERC Transmission Owner Rate Cases Slide 24 Appendix 9 - Expected Timelines of Selected Regulatory Cases Slides 25 - 26 Appendix 10 - Supplemental Earnings Exhibits Slides 27 - 41 16
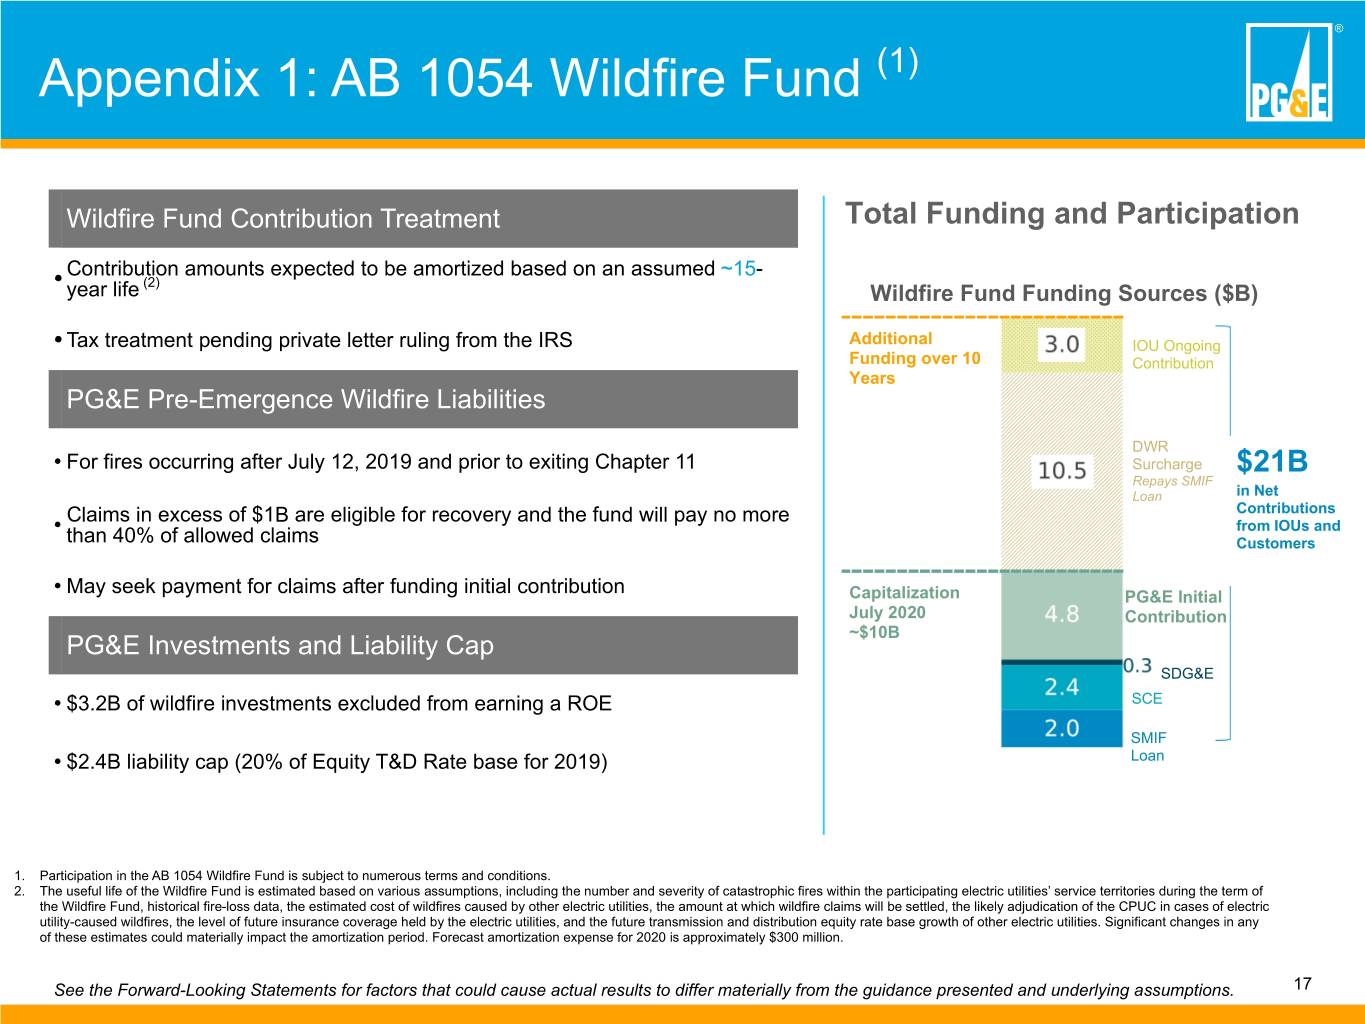
® Appendix 1: AB 1054 Wildfire Fund (1) Wildfire Fund Contribution Treatment Total Funding and Participation Contribution amounts expected to be amortized based on an assumed ~15- • (2) year life Wildfire Fund Funding Sources ($B) • Tax treatment pending private letter ruling from the IRS Additional IOU Ongoing Funding over 10 Contribution Years PG&E Pre-Emergence Wildfire Liabilities DWR • For fires occurring after July 12, 2019 and prior to exiting Chapter 11 Surcharge $21B Repays SMIF Loan in Net Claims in excess of $1B are eligible for recovery and the fund will pay no more Contributions • from IOUs and than 40% of allowed claims Customers May seek payment for claims after funding initial contribution • Capitalization PG&E Initial July 2020 Contribution ~$10B PG&E Investments and Liability Cap SDG&E • $3.2B of wildfire investments excluded from earning a ROE SCE SMIF • $2.4B liability cap (20% of Equity T&D Rate base for 2019) Loan 1. Participation in the AB 1054 Wildfire Fund is subject to numerous terms and conditions. 2. The useful life of the Wildfire Fund is estimated based on various assumptions, including the number and severity of catastrophic fires within the participating electric utilities’ service territories during the term of the Wildfire Fund, historical fire-loss data, the estimated cost of wildfires caused by other electric utilities, the amount at which wildfire claims will be settled, the likely adjudication of the CPUC in cases of electric utility-caused wildfires, the level of future insurance coverage held by the electric utilities, and the future transmission and distribution equity rate base growth of other electric utilities. Significant changes in any of these estimates could materially impact the amortization period. Forecast amortization expense for 2020 is approximately $300 million. See the Forward-Looking Statements for factors that could cause actual results to differ materially from the guidance presented and underlying assumptions. 17
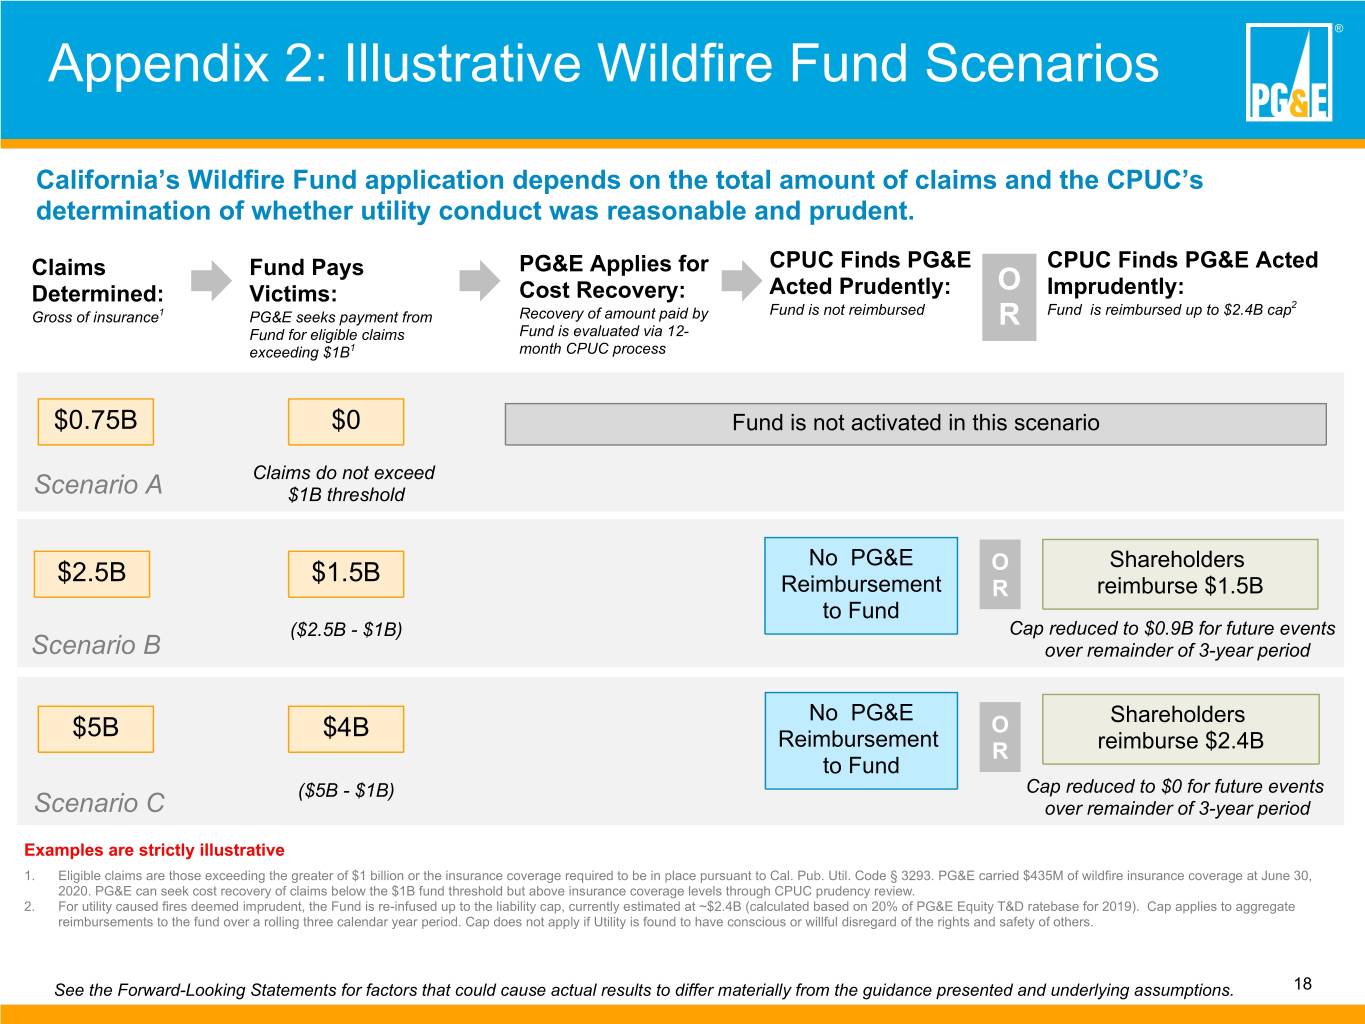
® Appendix 2: Illustrative Wildfire Fund Scenarios California’s Wildfire Fund application depends on the total amount of claims and the CPUC’s determination of whether utility conduct was reasonable and prudent. Claims Fund Pays PG&E Applies for CPUC Finds PG&E CPUC Finds PG&E Acted Cost Recovery: Acted Prudently: O Imprudently: Determined: Victims: 2 Gross of insurance1 PG&E seeks payment from Recovery of amount paid by Fund is not reimbursed R Fund is reimbursed up to $2.4B cap Fund for eligible claims Fund is evaluated via 12- exceeding $1B1 month CPUC process $0.75B $0 Fund is not activated in this scenario Claims do not exceed Scenario A $1B threshold No PG&E $2.5B $1.5B O Shareholders Reimbursement R reimburse $1.5B to Fund ($2.5B - $1B) Cap reduced to $0.9B for future events Scenario B over remainder of 3-year period No PG&E O Shareholders $5B $4B Reimbursement R reimburse $2.4B to Fund ($5B - $1B) Cap reduced to $0 for future events Scenario C over remainder of 3-year period Examples are strictly illustrative 1. Eligible claims are those exceeding the greater of $1 billion or the insurance coverage required to be in place pursuant to Cal. Pub. Util. Code § 3293. PG&E carried $435M of wildfire insurance coverage at June 30, 2020. PG&E can seek cost recovery of claims below the $1B fund threshold but above insurance coverage levels through CPUC prudency review. 2. For utility caused fires deemed imprudent, the Fund is re-infused up to the liability cap, currently estimated at ~$2.4B (calculated based on 20% of PG&E Equity T&D ratebase for 2019). Cap applies to aggregate reimbursements to the fund over a rolling three calendar year period. Cap does not apply if Utility is found to have conscious or willful disregard of the rights and safety of others. See the Forward-Looking Statements for factors that could cause actual results to differ materially from the guidance presented and underlying assumptions. 18
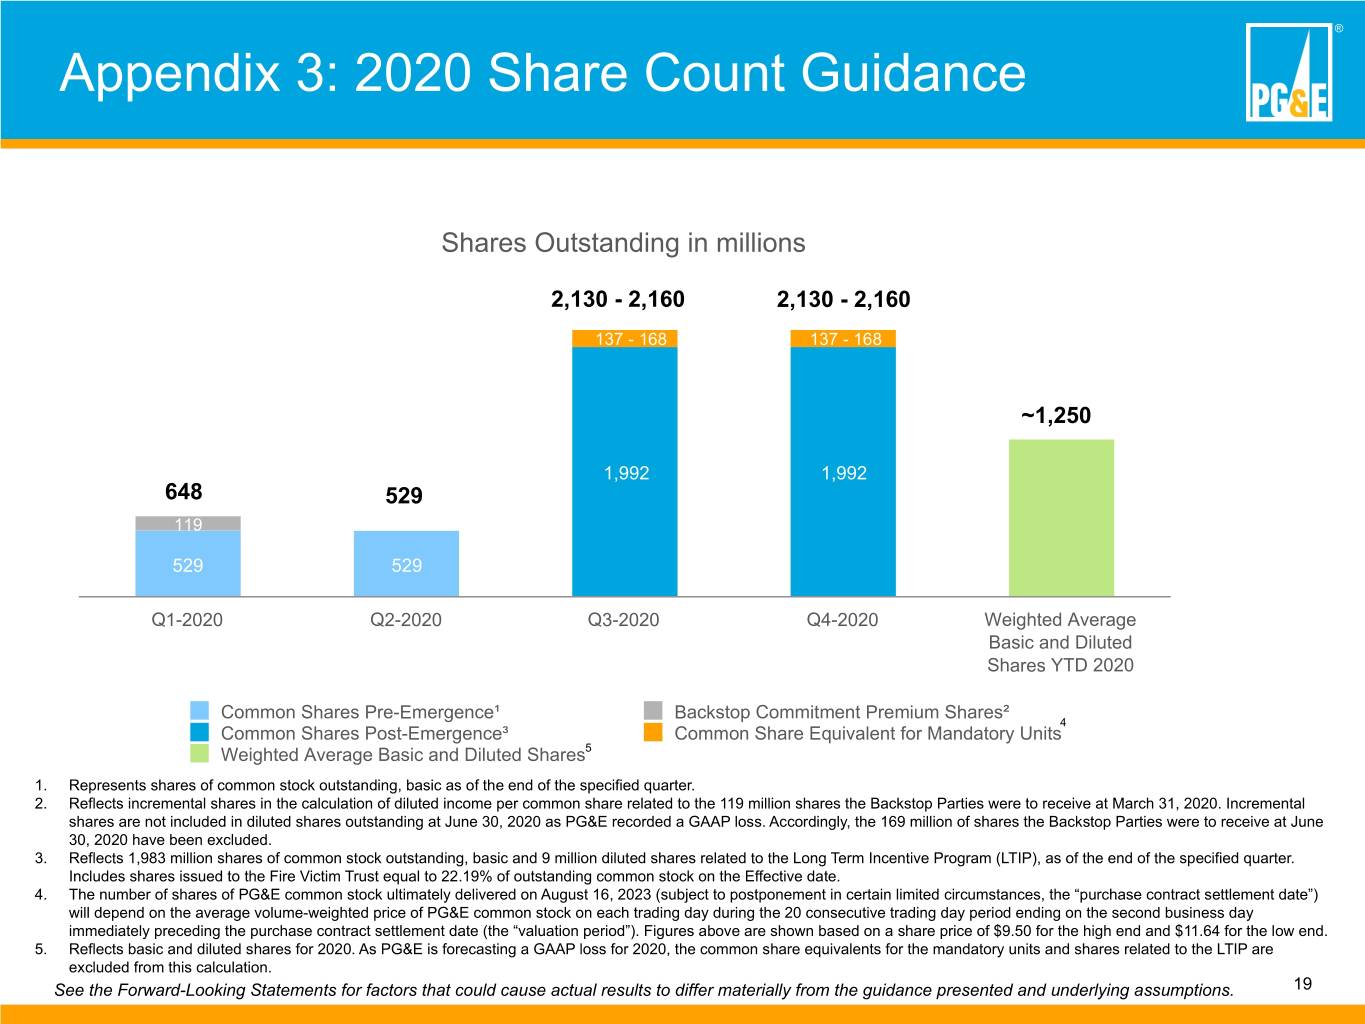
® Appendix 3: 2020 Share Count Guidance Shares Outstanding in millions 2,130 - 2,160 2,130 - 2,160 137 - 168 137 - 168 ~1,250 1,992 1,992 648 529 119 529 529 Q1-2020 Q2-2020 Q3-2020 Q4-2020 Weighted Average Basic and Diluted Shares YTD 2020 Common Shares Pre-Emergence¹ Backstop Commitment Premium Shares² 4 Common Shares Post-Emergence³ Common Share Equivalent for Mandatory Units Weighted Average Basic and Diluted Shares5 1. Represents shares of common stock outstanding, basic as of the end of the specified quarter. 2. Reflects incremental shares in the calculation of diluted income per common share related to the 119 million shares the Backstop Parties were to receive at March 31, 2020. Incremental shares are not included in diluted shares outstanding at June 30, 2020 as PG&E recorded a GAAP loss. Accordingly, the 169 million of shares the Backstop Parties were to receive at June 30, 2020 have been excluded. 3. Reflects 1,983 million shares of common stock outstanding, basic and 9 million diluted shares related to the Long Term Incentive Program (LTIP), as of the end of the specified quarter. Includes shares issued to the Fire Victim Trust equal to 22.19% of outstanding common stock on the Effective date. 4. The number of shares of PG&E common stock ultimately delivered on August 16, 2023 (subject to postponement in certain limited circumstances, the “purchase contract settlement date”) will depend on the average volume-weighted price of PG&E common stock on each trading day during the 20 consecutive trading day period ending on the second business day immediately preceding the purchase contract settlement date (the “valuation period”). Figures above are shown based on a share price of $9.50 for the high end and $11.64 for the low end. 5. Reflects basic and diluted shares for 2020. As PG&E is forecasting a GAAP loss for 2020, the common share equivalents for the mandatory units and shares related to the LTIP are excluded from this calculation. See the Forward-Looking Statements for factors that could cause actual results to differ materially from the guidance presented and underlying assumptions. 19
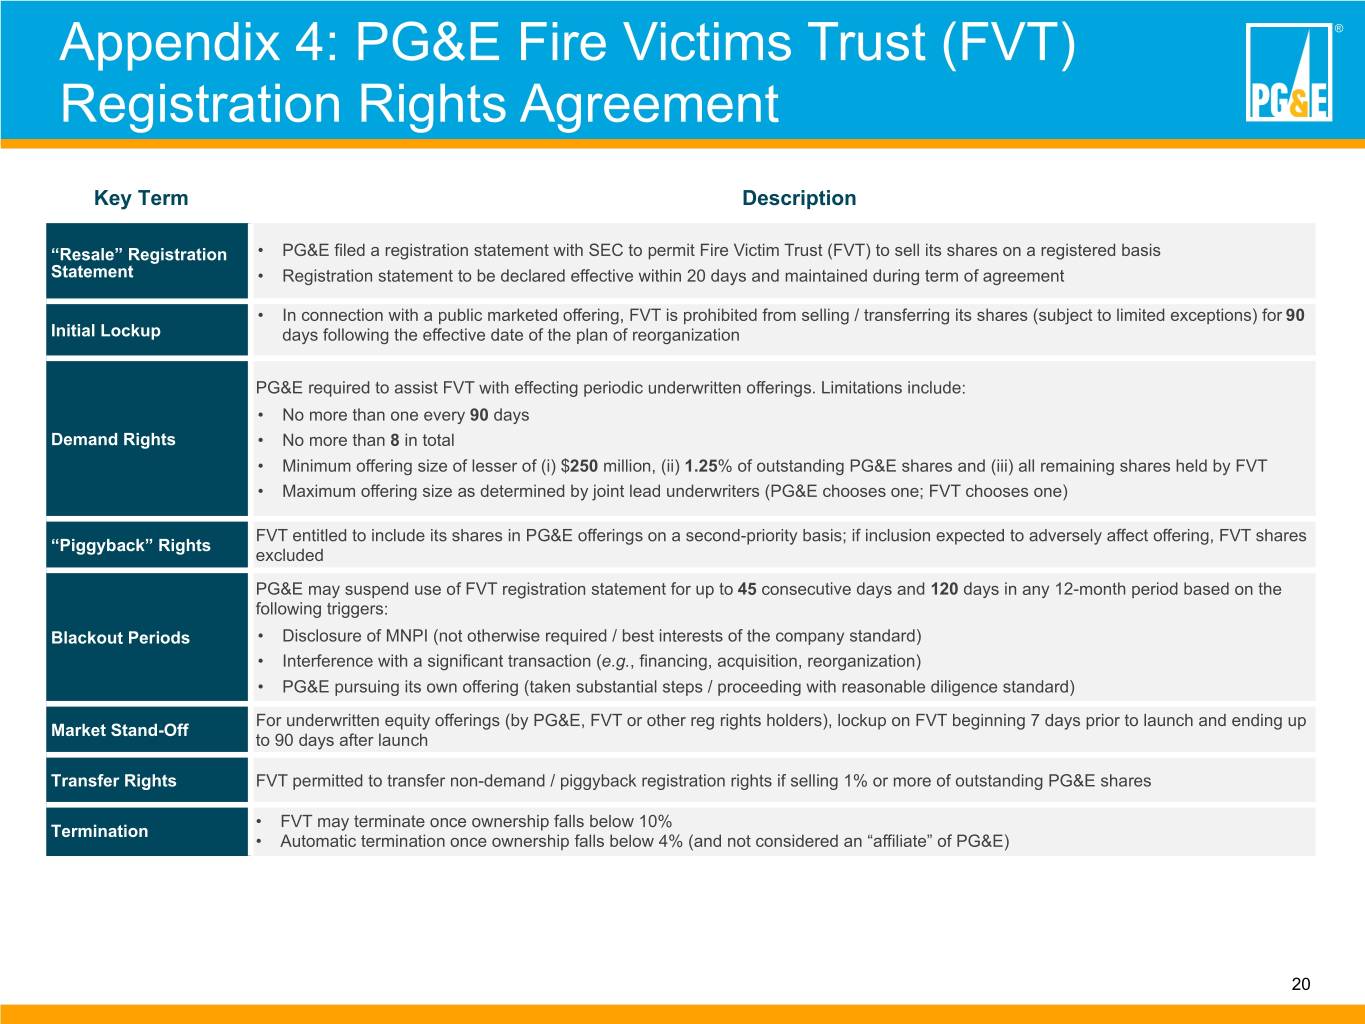
Appendix 4: PG&E Fire Victims Trust (FVT) ® Registration Rights Agreement Key Term Description “Resale” Registration • PG&E filed a registration statement with SEC to permit Fire Victim Trust (FVT) to sell its shares on a registered basis Statement • Registration statement to be declared effective within 20 days and maintained during term of agreement • In connection with a public marketed offering, FVT is prohibited from selling / transferring its shares (subject to limited exceptions) for 90 Initial Lockup days following the effective date of the plan of reorganization PG&E required to assist FVT with effecting periodic underwritten offerings. Limitations include: • No more than one every 90 days Demand Rights • No more than 8 in total • Minimum offering size of lesser of (i) $250 million, (ii) 1.25% of outstanding PG&E shares and (iii) all remaining shares held by FVT • Maximum offering size as determined by joint lead underwriters (PG&E chooses one; FVT chooses one) FVT entitled to include its shares in PG&E offerings on a second-priority basis; if inclusion expected to adversely affect offering, FVT shares “Piggyback” Rights excluded PG&E may suspend use of FVT registration statement for up to 45 consecutive days and 120 days in any 12-month period based on the following triggers: Blackout Periods • Disclosure of MNPI (not otherwise required / best interests of the company standard) • Interference with a significant transaction (e.g., financing, acquisition, reorganization) • PG&E pursuing its own offering (taken substantial steps / proceeding with reasonable diligence standard) For underwritten equity offerings (by PG&E, FVT or other reg rights holders), lockup on FVT beginning 7 days prior to launch and ending up Market Stand-Off to 90 days after launch Transfer Rights FVT permitted to transfer non-demand / piggyback registration rights if selling 1% or more of outstanding PG&E shares • FVT may terminate once ownership falls below 10% Termination • Automatic termination once ownership falls below 4% (and not considered an “affiliate” of PG&E) 20
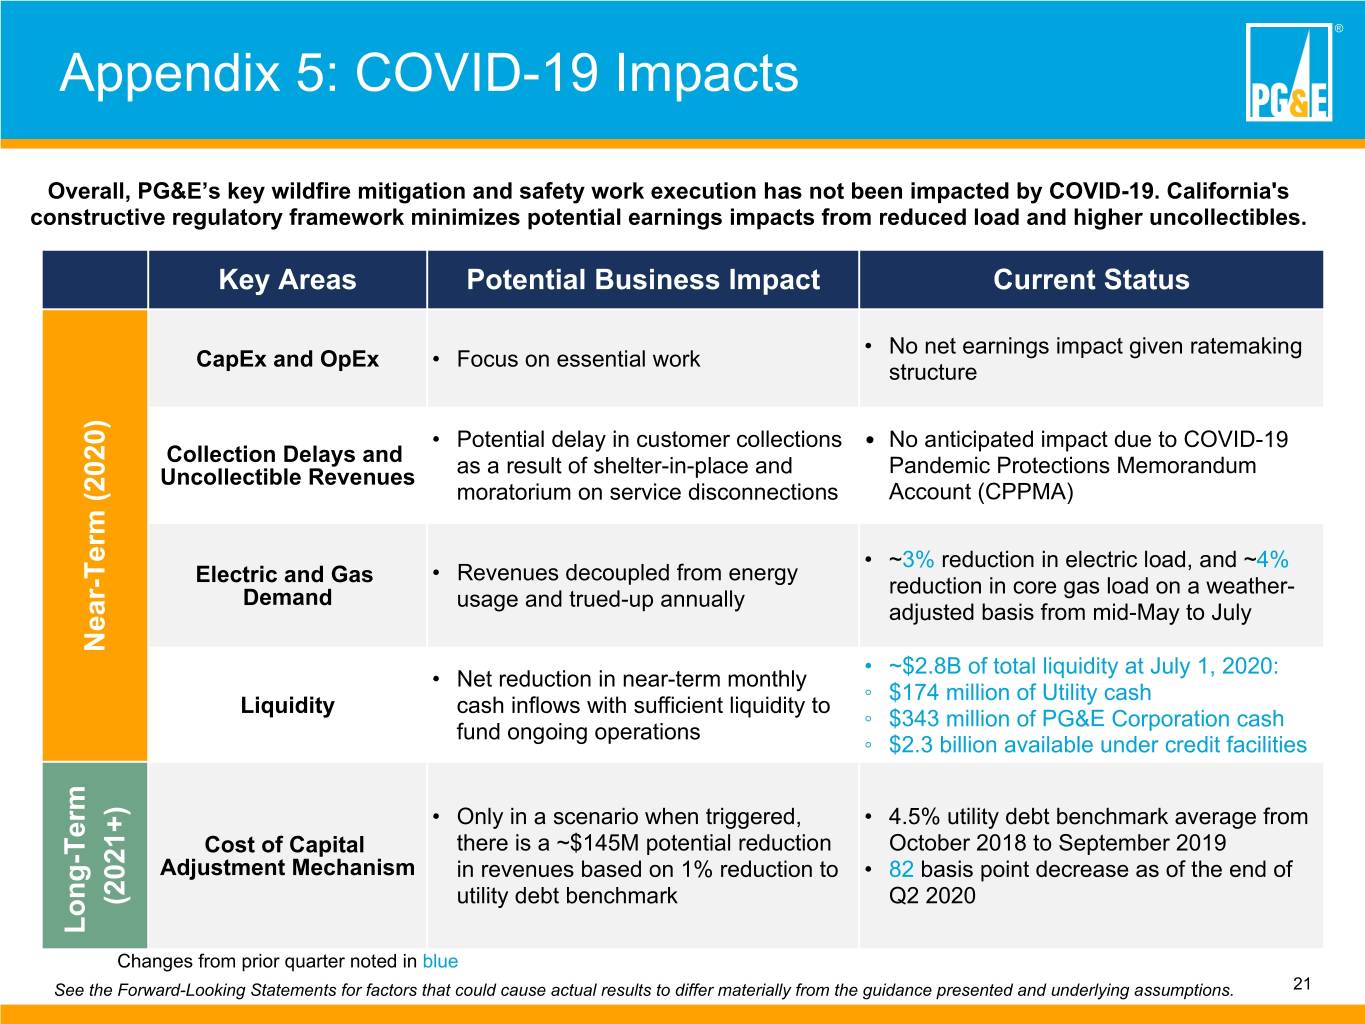
® Appendix 5: COVID-19 Impacts Overall, PG&E’s key wildfire mitigation and safety work execution has not been impacted by COVID-19. California's constructive regulatory framework minimizes potential earnings impacts from reduced load and higher uncollectibles. Key Areas Potential Business Impact Current Status • No net earnings impact given ratemaking CapEx and OpEx • Focus on essential work structure • Potential delay in customer collections • No anticipated impact due to COVID-19 Collection Delays and Pandemic Protections Memorandum Uncollectible Revenues as a result of shelter-in-place and moratorium on service disconnections Account (CPPMA) • ~3% reduction in electric load, and ~4% • Revenues decoupled from energy Electric and Gas reduction in core gas load on a weather- Demand usage and trued-up annually adjusted basis from mid-May to July Near-Term (2020) • ~$2.8B of total liquidity at July 1, 2020: • Net reduction in near-term monthly ◦ $174 million of Utility cash Liquidity cash inflows with sufficient liquidity to ◦ $343 million of PG&E Corporation cash fund ongoing operations ◦ $2.3 billion available under credit facilities • Only in a scenario when triggered, • 4.5% utility debt benchmark average from Cost of Capital there is a ~$145M potential reduction October 2018 to September 2019 Adjustment Mechanism in revenues based on 1% reduction to • 82 basis point decrease as of the end of (2021+) utility debt benchmark Q2 2020 Long-Term Changes from prior quarter noted in blue See the Forward-Looking Statements for factors that could cause actual results to differ materially from the guidance presented and underlying assumptions. 21
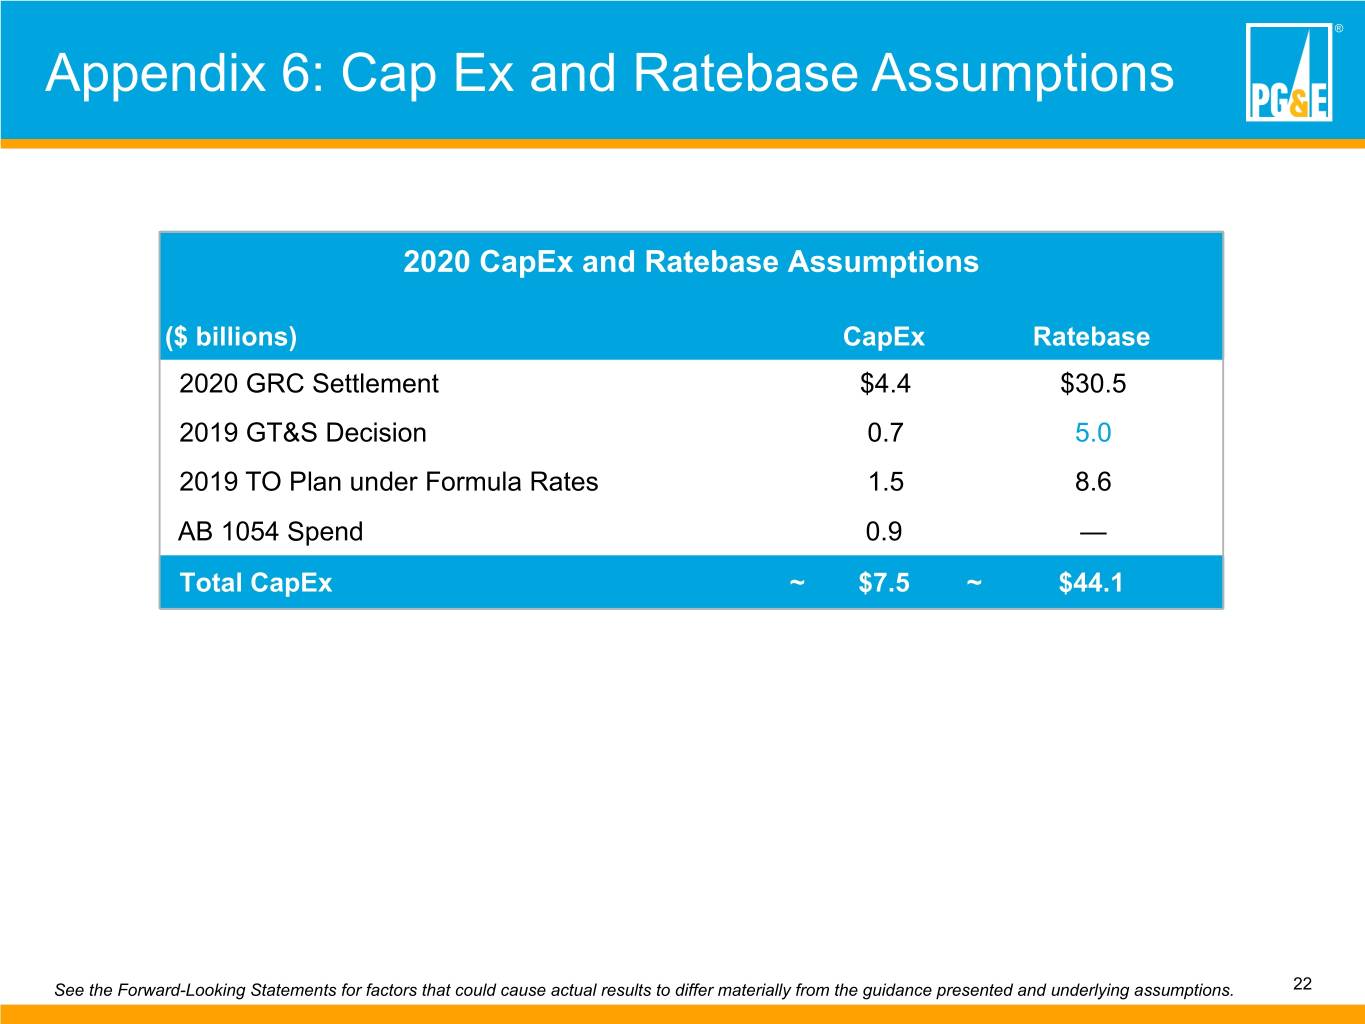
® Appendix 6: Cap Ex and Ratebase Assumptions 2020 CapEx and Ratebase Assumptions ($ billions) CapEx Ratebase 2020 GRC Settlement $4.4 $30.5 2019 GT&S Decision 0.7 5.0 2019 TO Plan under Formula Rates 1.5 8.6 AB 1054 Spend 0.9 — Total CapEx ~ $7.5 ~ $44.1 See the Forward-Looking Statements for factors that could cause actual results to differ materially from the guidance presented and underlying assumptions. 22
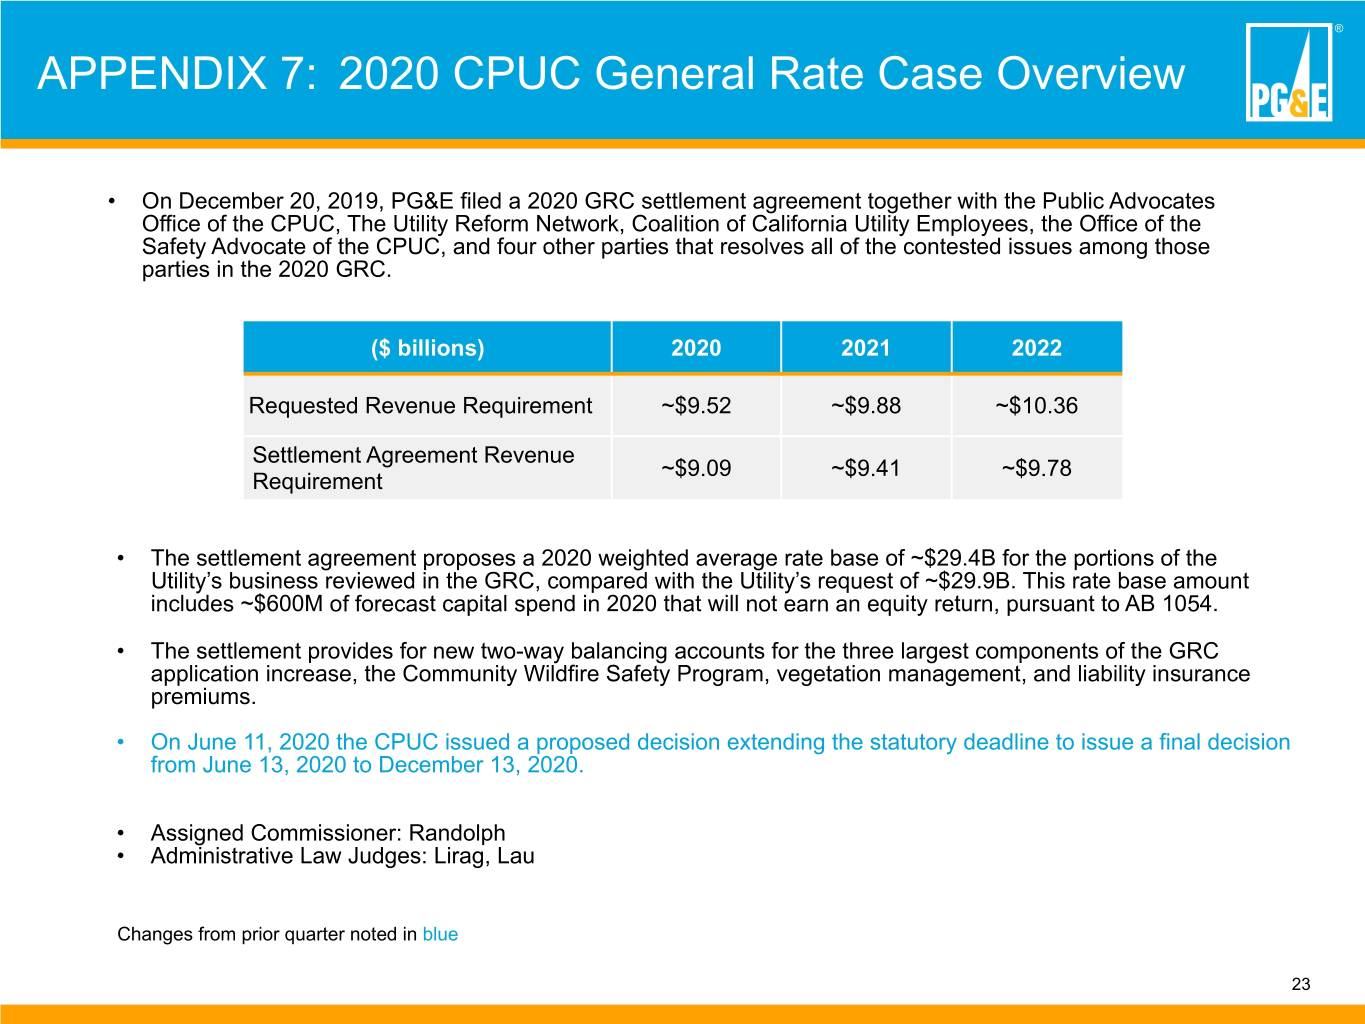
® APPENDIX 7: 2020 CPUC General Rate Case Overview • On December 20, 2019, PG&E filed a 2020 GRC settlement agreement together with the Public Advocates Office of the CPUC, The Utility Reform Network, Coalition of California Utility Employees, the Office of the Safety Advocate of the CPUC, and four other parties that resolves all of the contested issues among those parties in the 2020 GRC. ($ billions) 2020 2021 2022 Requested Revenue Requirement ~$9.52 ~$9.88 ~$10.36 Settlement Agreement Revenue ~$9.09 ~$9.41 ~$9.78 Requirement • The settlement agreement proposes a 2020 weighted average rate base of ~$29.4B for the portions of the Utility’s business reviewed in the GRC, compared with the Utility’s request of ~$29.9B. This rate base amount includes ~$600M of forecast capital spend in 2020 that will not earn an equity return, pursuant to AB 1054. • The settlement provides for new two-way balancing accounts for the three largest components of the GRC application increase, the Community Wildfire Safety Program, vegetation management, and liability insurance premiums. • On June 11, 2020 the CPUC issued a proposed decision extending the statutory deadline to issue a final decision from June 13, 2020 to December 13, 2020. • Assigned Commissioner: Randolph • Administrative Law Judges: Lirag, Lau Changes from prior quarter noted in blue 23
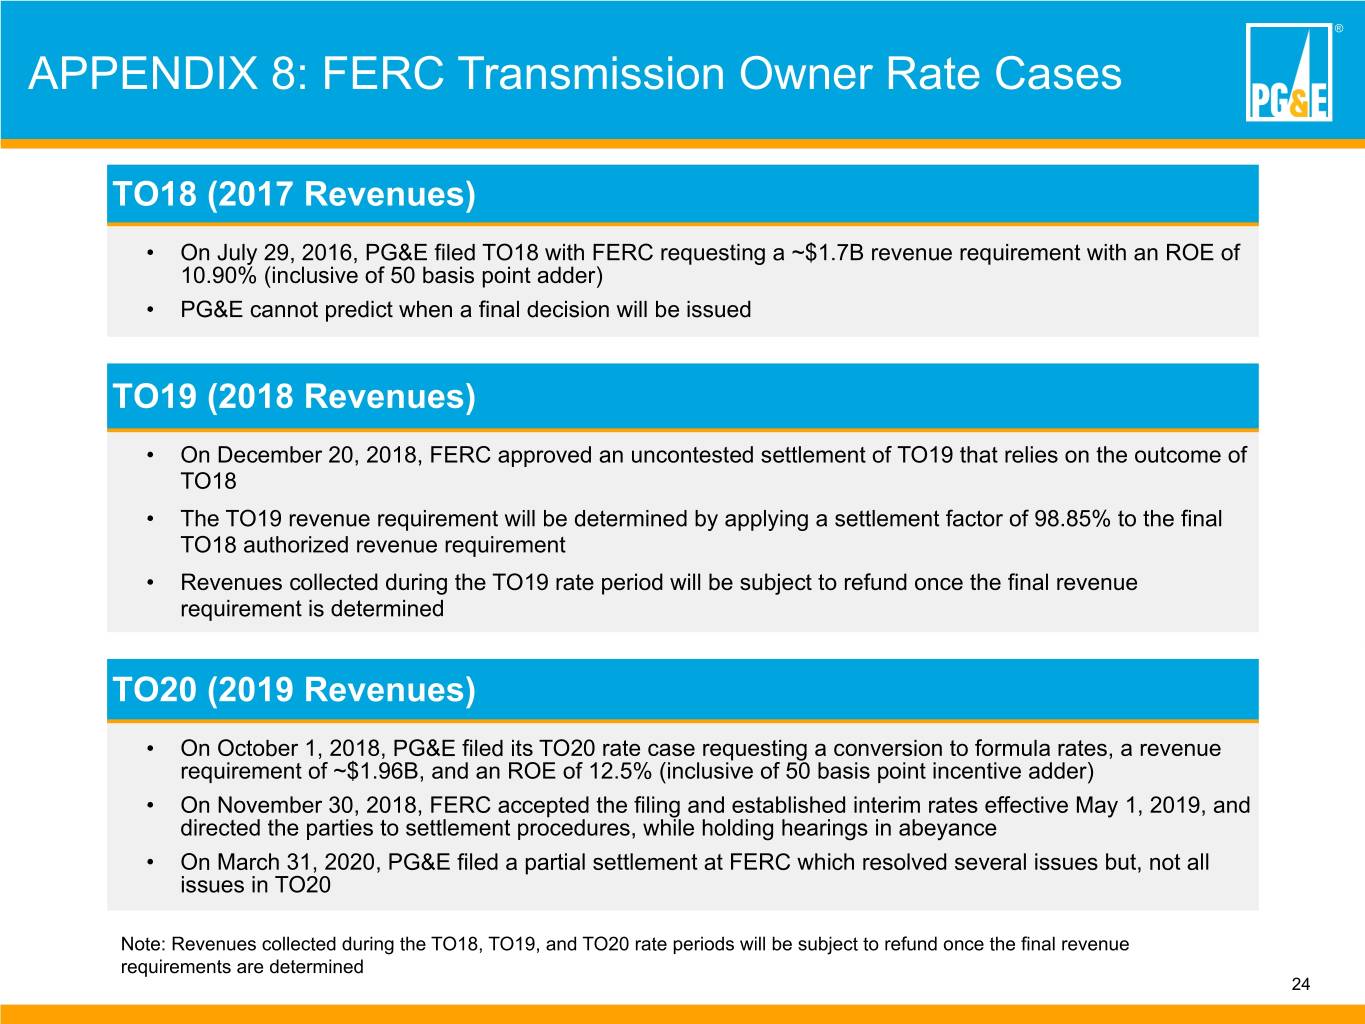
® APPENDIX 8: FERC Transmission Owner Rate Cases TO18 (2017 Revenues) • On July 29, 2016, PG&E filed TO18 with FERC requesting a ~$1.7B revenue requirement with an ROE of 10.90% (inclusive of 50 basis point adder) • PG&E cannot predict when a final decision will be issued TO19 (2018 Revenues) • On December 20, 2018, FERC approved an uncontested settlement of TO19 that relies on the outcome of TO18 • The TO19 revenue requirement will be determined by applying a settlement factor of 98.85% to the final TO18 authorized revenue requirement • Revenues collected during the TO19 rate period will be subject to refund once the final revenue requirement is determined TO20 (2019 Revenues) • On October 1, 2018, PG&E filed its TO20 rate case requesting a conversion to formula rates, a revenue requirement of ~$1.96B, and an ROE of 12.5% (inclusive of 50 basis point incentive adder) • On November 30, 2018, FERC accepted the filing and established interim rates effective May 1, 2019, and directed the parties to settlement procedures, while holding hearings in abeyance • On March 31, 2020, PG&E filed a partial settlement at FERC which resolved several issues but, not all issues in TO20 Note: Revenues collected during the TO18, TO19, and TO20 rate periods will be subject to refund once the final revenue requirements are determined 24
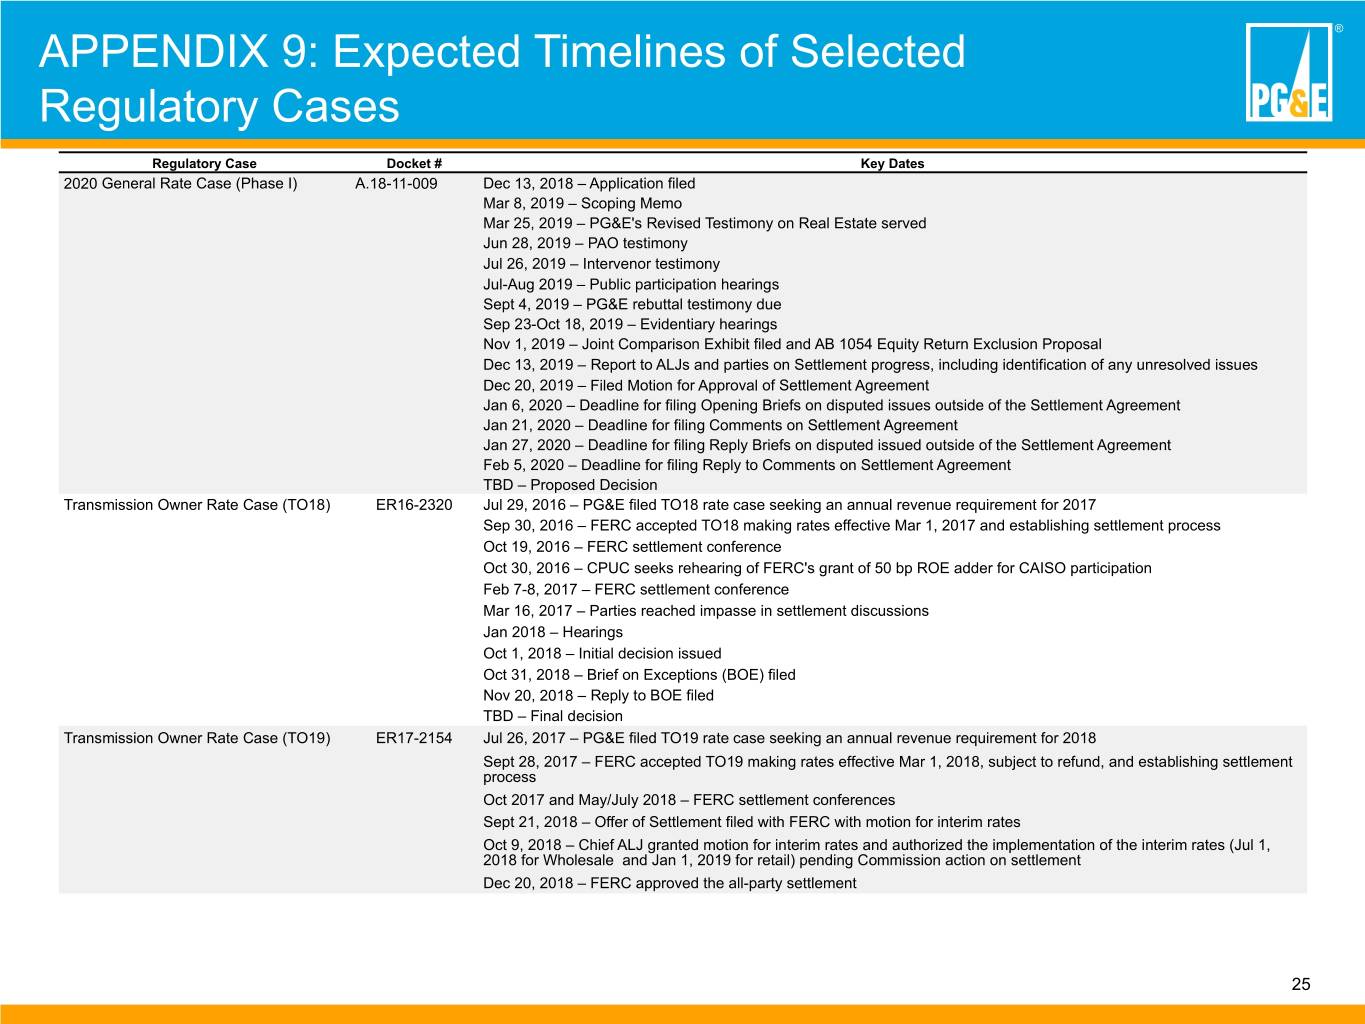
® APPENDIX 9: Expected Timelines of Selected Regulatory Cases Regulatory Case Docket # Key Dates 2020 General Rate Case (Phase I) A.18-11-009 Dec 13, 2018 – Application filed Mar 8, 2019 – Scoping Memo Mar 25, 2019 – PG&E's Revised Testimony on Real Estate served Jun 28, 2019 – PAO testimony Jul 26, 2019 – Intervenor testimony Jul-Aug 2019 – Public participation hearings Sept 4, 2019 – PG&E rebuttal testimony due Sep 23-Oct 18, 2019 – Evidentiary hearings Nov 1, 2019 – Joint Comparison Exhibit filed and AB 1054 Equity Return Exclusion Proposal Dec 13, 2019 – Report to ALJs and parties on Settlement progress, including identification of any unresolved issues Dec 20, 2019 – Filed Motion for Approval of Settlement Agreement Jan 6, 2020 – Deadline for filing Opening Briefs on disputed issues outside of the Settlement Agreement Jan 21, 2020 – Deadline for filing Comments on Settlement Agreement Jan 27, 2020 – Deadline for filing Reply Briefs on disputed issued outside of the Settlement Agreement Feb 5, 2020 – Deadline for filing Reply to Comments on Settlement Agreement TBD – Proposed Decision Transmission Owner Rate Case (TO18) ER16-2320 Jul 29, 2016 – PG&E filed TO18 rate case seeking an annual revenue requirement for 2017 Sep 30, 2016 – FERC accepted TO18 making rates effective Mar 1, 2017 and establishing settlement process Oct 19, 2016 – FERC settlement conference Oct 30, 2016 – CPUC seeks rehearing of FERC's grant of 50 bp ROE adder for CAISO participation Feb 7-8, 2017 – FERC settlement conference Mar 16, 2017 – Parties reached impasse in settlement discussions Jan 2018 – Hearings Oct 1, 2018 – Initial decision issued Oct 31, 2018 – Brief on Exceptions (BOE) filed Nov 20, 2018 – Reply to BOE filed TBD – Final decision Transmission Owner Rate Case (TO19) ER17-2154 Jul 26, 2017 – PG&E filed TO19 rate case seeking an annual revenue requirement for 2018 Sept 28, 2017 – FERC accepted TO19 making rates effective Mar 1, 2018, subject to refund, and establishing settlement process Oct 2017 and May/July 2018 – FERC settlement conferences Sept 21, 2018 – Offer of Settlement filed with FERC with motion for interim rates Oct 9, 2018 – Chief ALJ granted motion for interim rates and authorized the implementation of the interim rates (Jul 1, 2018 for Wholesale and Jan 1, 2019 for retail) pending Commission action on settlement Dec 20, 2018 – FERC approved the all-party settlement 25
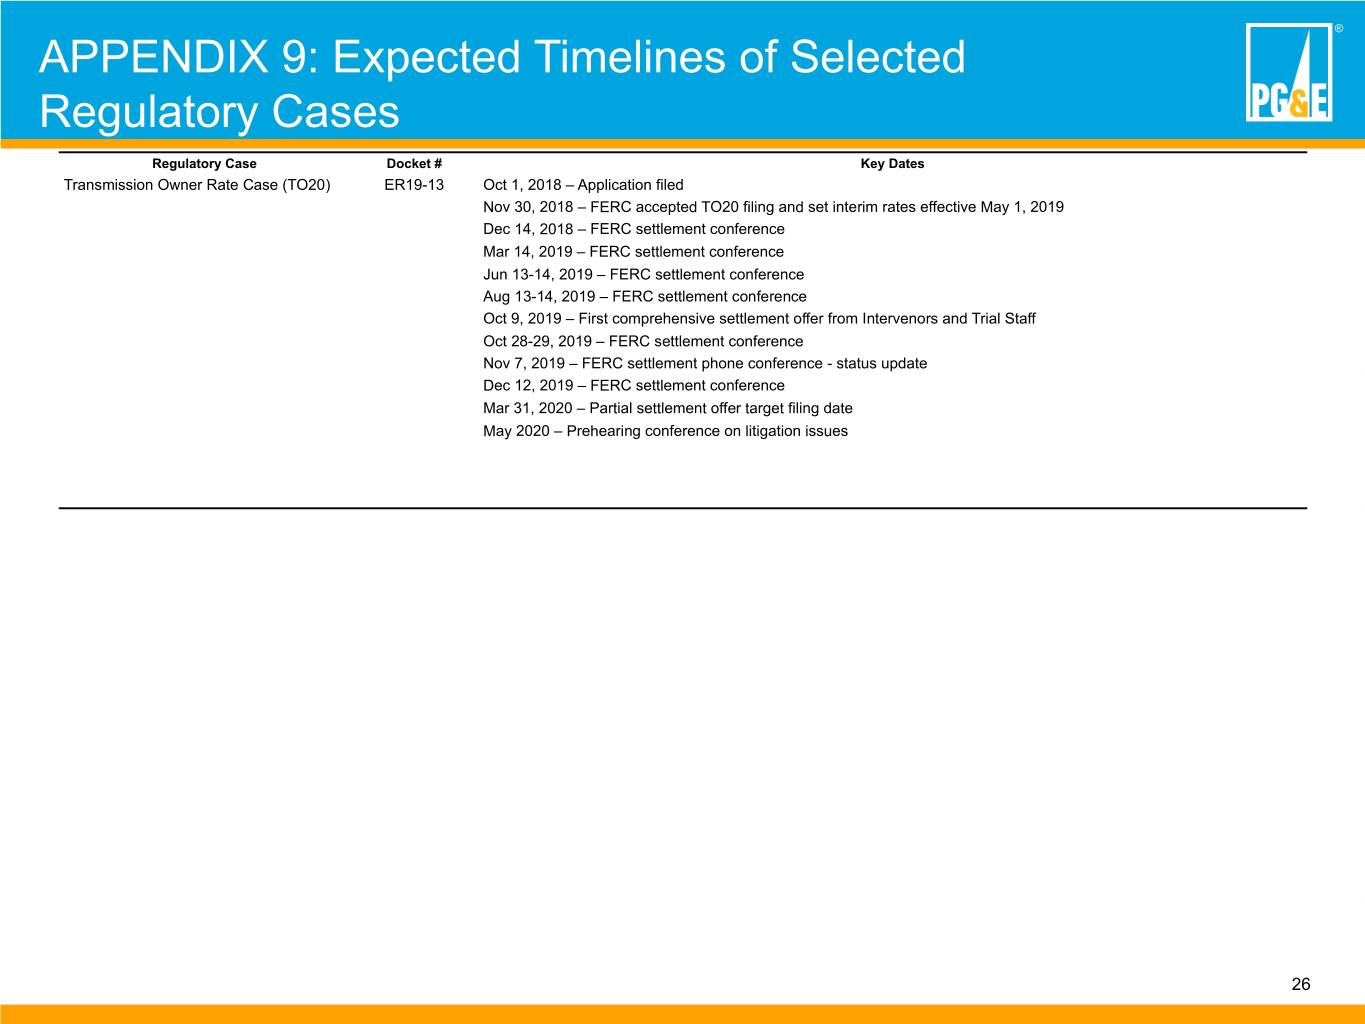
® APPENDIX 9: Expected Timelines of Selected Regulatory Cases Regulatory Case Docket # Key Dates Transmission Owner Rate Case (TO20) ER19-13 Oct 1, 2018 – Application filed Nov 30, 2018 – FERC accepted TO20 filing and set interim rates effective May 1, 2019 Dec 14, 2018 – FERC settlement conference Mar 14, 2019 – FERC settlement conference Jun 13-14, 2019 – FERC settlement conference Aug 13-14, 2019 – FERC settlement conference Oct 9, 2019 – First comprehensive settlement offer from Intervenors and Trial Staff Oct 28-29, 2019 – FERC settlement conference Nov 7, 2019 – FERC settlement phone conference - status update Dec 12, 2019 – FERC settlement conference Mar 31, 2020 – Partial settlement offer target filing date May 2020 – Prehearing conference on litigation issues 26
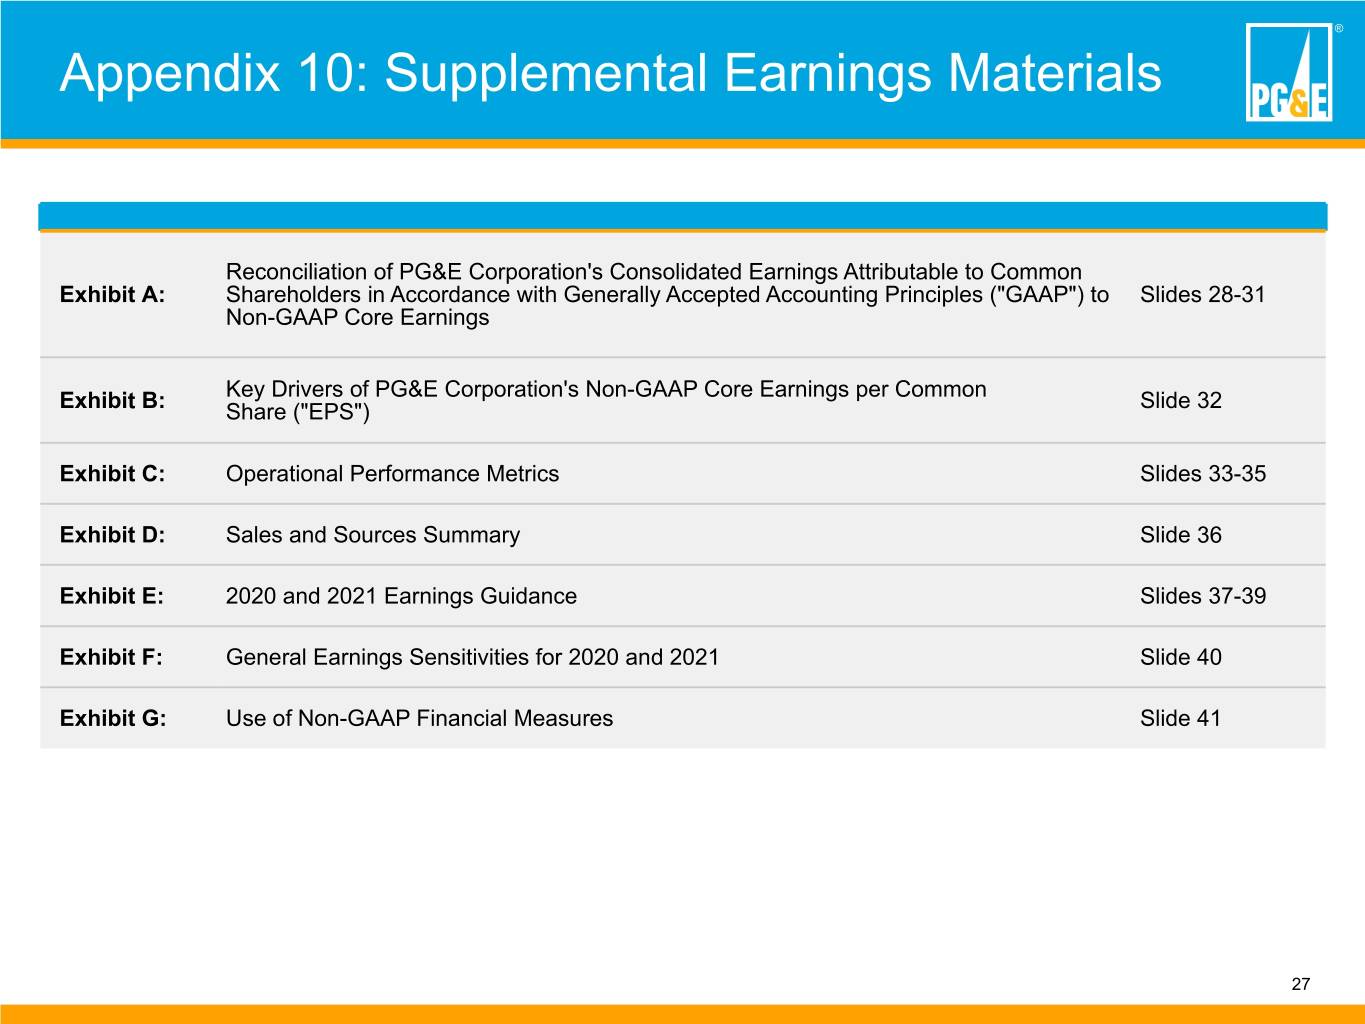
® Appendix 10: Supplemental Earnings Materials Reconciliation of PG&E Corporation's Consolidated Earnings Attributable to Common Exhibit A: Shareholders in Accordance with Generally Accepted Accounting Principles ("GAAP") to Slides 28-31 Non-GAAP Core Earnings Key Drivers of PG&E Corporation's Non-GAAP Core Earnings per Common Exhibit B: Share ("EPS") Slide 32 Exhibit C: Operational Performance Metrics Slides 33-35 Exhibit D: Sales and Sources Summary Slide 36 Exhibit E: 2020 and 2021 Earnings Guidance Slides 37-39 Exhibit F: General Earnings Sensitivities for 2020 and 2021 Slide 40 Exhibit G: Use of Non-GAAP Financial Measures Slide 41 27
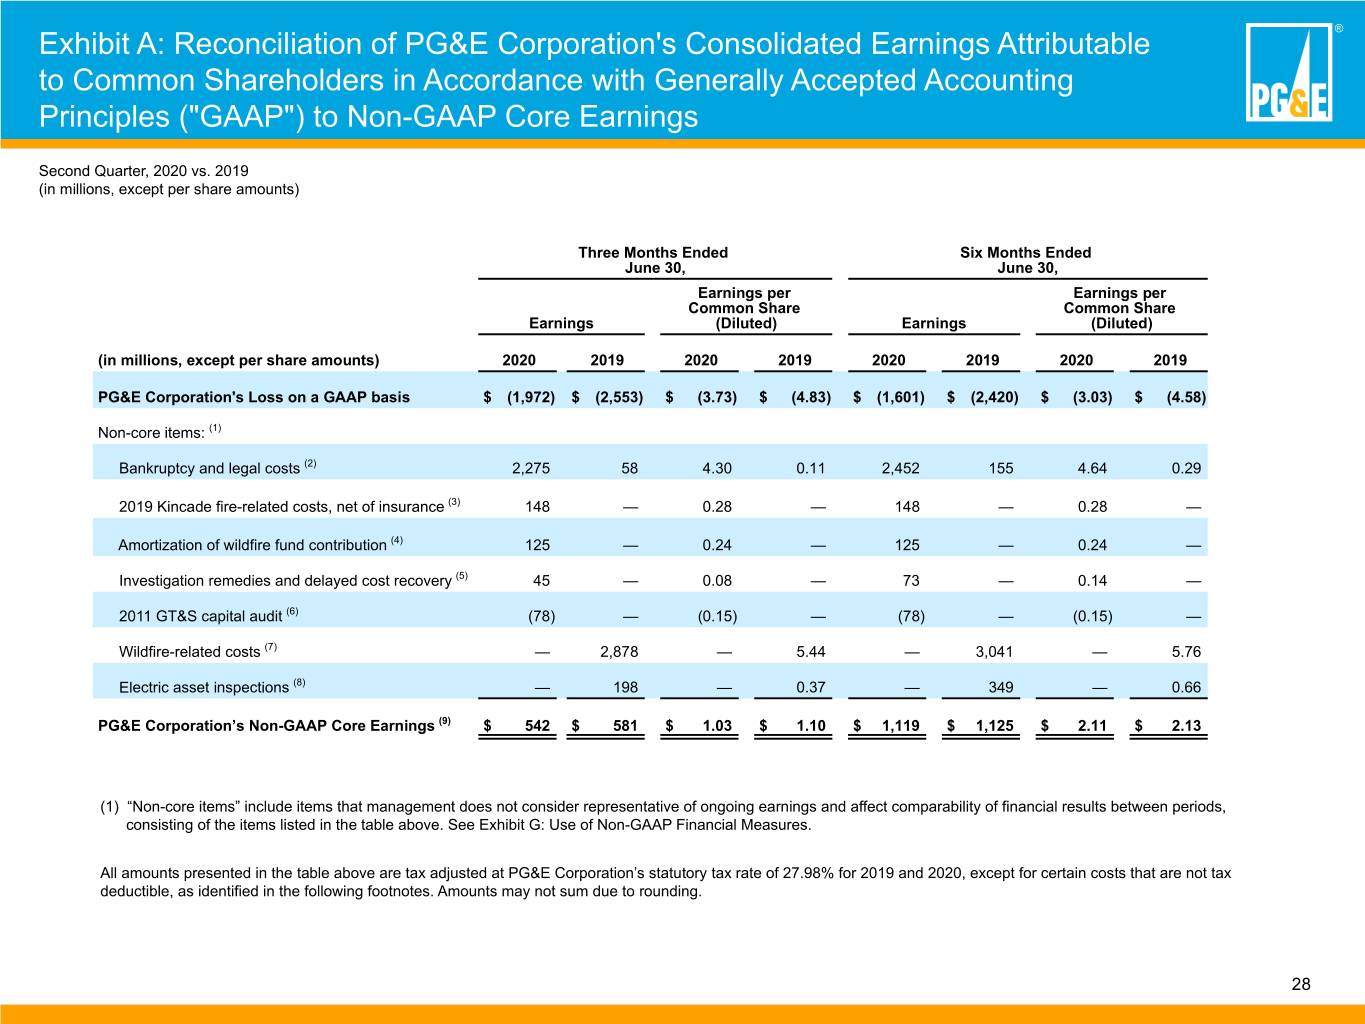
® Exhibit A: Reconciliation of PG&E Corporation's Consolidated Earnings Attributable to Common Shareholders in Accordance with Generally Accepted Accounting Principles ("GAAP") to Non-GAAP Core Earnings Second Quarter, 2020 vs. 2019 (in millions, except per share amounts) Three Months Ended Six Months Ended June 30, June 30, Earnings per Earnings per Common Share Common Share Earnings (Diluted) Earnings (Diluted) (in millions, except per share amounts) 2020 2019 2020 2019 2020 2019 2020 2019 PG&E Corporation's Loss on a GAAP basis $ (1,972) $ (2,553) $ (3.73) $ (4.83) $ (1,601) $ (2,420) $ (3.03) $ (4.58) Non-core items: (1) Bankruptcy and legal costs (2) 2,275 58 4.30 0.11 2,452 155 4.64 0.29 2019 Kincade fire-related costs, net of insurance (3) 148 — 0.28 — 148 — 0.28 — Amortization of wildfire fund contribution (4) 125 — 0.24 — 125 — 0.24 — Investigation remedies and delayed cost recovery (5) 45 — 0.08 — 73 — 0.14 — 2011 GT&S capital audit (6) (78) — (0.15) — (78) — (0.15) — Wildfire-related costs (7) — 2,878 — 5.44 — 3,041 — 5.76 Electric asset inspections (8) — 198 — 0.37 — 349 — 0.66 PG&E Corporation’s Non-GAAP Core Earnings (9) $ 542 $ 581 $ 1.03 $ 1.10 $ 1,119 $ 1,125 $ 2.11 $ 2.13 (1) “Non-core items” include items that management does not consider representative of ongoing earnings and affect comparability of financial results between periods, consisting of the items listed in the table above. See Exhibit G: Use of Non-GAAP Financial Measures. All amounts presented in the table above are tax adjusted at PG&E Corporation’s statutory tax rate of 27.98% for 2019 and 2020, except for certain costs that are not tax deductible, as identified in the following footnotes. Amounts may not sum due to rounding. 28
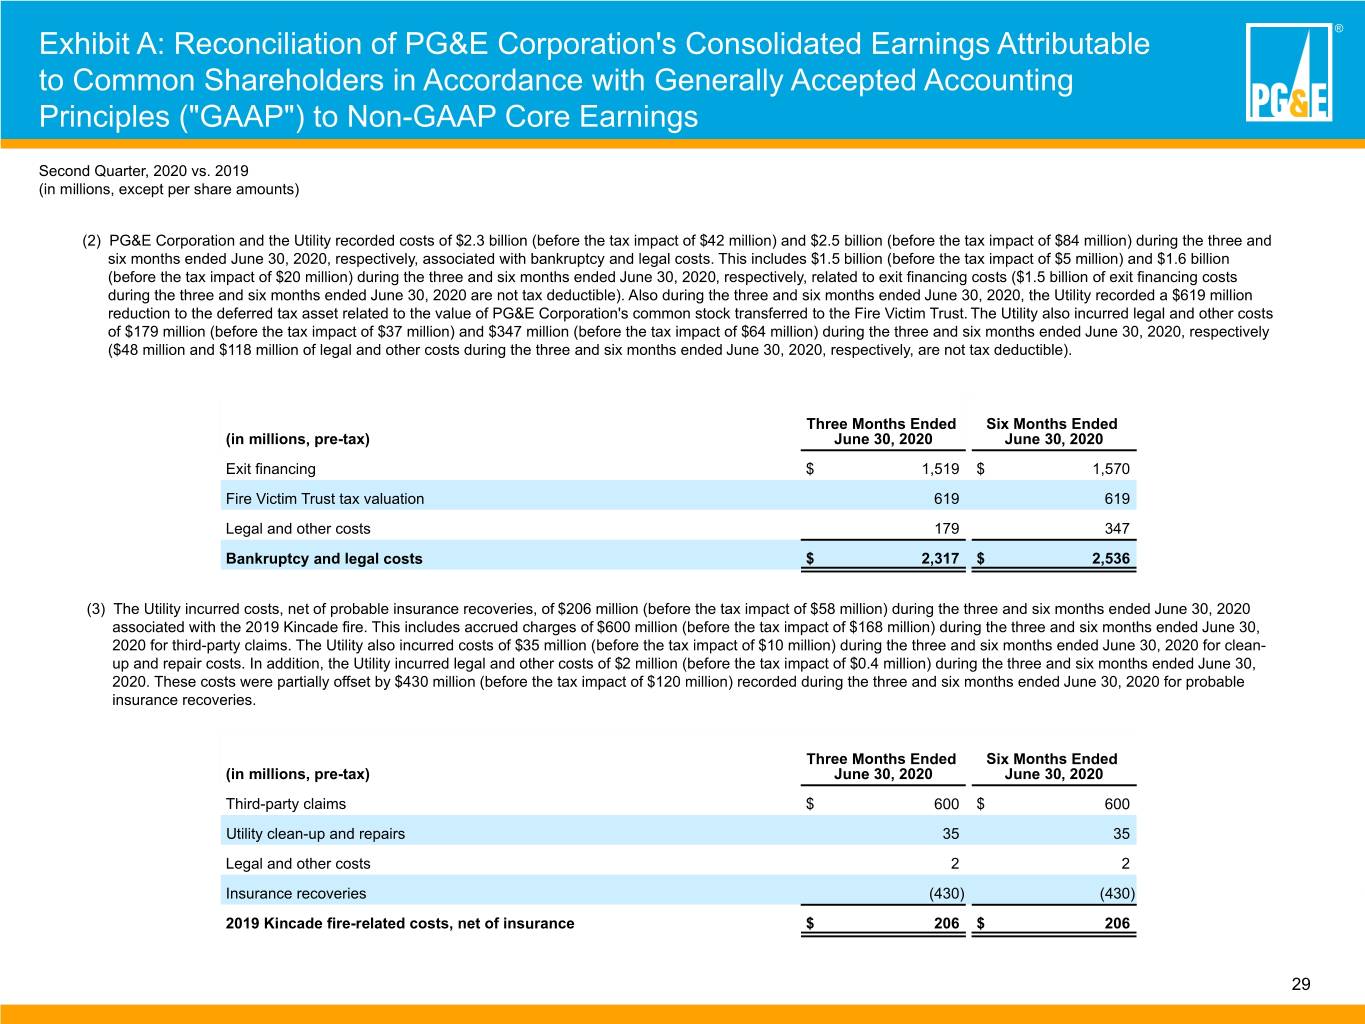
® Exhibit A: Reconciliation of PG&E Corporation's Consolidated Earnings Attributable to Common Shareholders in Accordance with Generally Accepted Accounting Principles ("GAAP") to Non-GAAP Core Earnings Second Quarter, 2020 vs. 2019 (in millions, except per share amounts) (2) PG&E Corporation and the Utility recorded costs of $2.3 billion (before the tax impact of $42 million) and $2.5 billion (before the tax impact of $84 million) during the three and six months ended June 30, 2020, respectively, associated with bankruptcy and legal costs. This includes $1.5 billion (before the tax impact of $5 million) and $1.6 billion (before the tax impact of $20 million) during the three and six months ended June 30, 2020, respectively, related to exit financing costs ($1.5 billion of exit financing costs during the three and six months ended June 30, 2020 are not tax deductible). Also during the three and six months ended June 30, 2020, the Utility recorded a $619 million reduction to the deferred tax asset related to the value of PG&E Corporation's common stock transferred to the Fire Victim Trust. The Utility also incurred legal and other costs of $179 million (before the tax impact of $37 million) and $347 million (before the tax impact of $64 million) during the three and six months ended June 30, 2020, respectively ($48 million and $118 million of legal and other costs during the three and six months ended June 30, 2020, respectively, are not tax deductible). Three Months Ended Six Months Ended (in millions, pre-tax) June 30, 2020 June 30, 2020 Exit financing $ 1,519 $ 1,570 Fire Victim Trust tax valuation 619 619 Legal and other costs 179 347 Bankruptcy and legal costs $ 2,317 $ 2,536 (3) The Utility incurred costs, net of probable insurance recoveries, of $206 million (before the tax impact of $58 million) during the three and six months ended June 30, 2020 associated with the 2019 Kincade fire. This includes accrued charges of $600 million (before the tax impact of $168 million) during the three and six months ended June 30, 2020 for third-party claims. The Utility also incurred costs of $35 million (before the tax impact of $10 million) during the three and six months ended June 30, 2020 for clean- up and repair costs. In addition, the Utility incurred legal and other costs of $2 million (before the tax impact of $0.4 million) during the three and six months ended June 30, 2020. These costs were partially offset by $430 million (before the tax impact of $120 million) recorded during the three and six months ended June 30, 2020 for probable insurance recoveries. Three Months Ended Six Months Ended (in millions, pre-tax) June 30, 2020 June 30, 2020 Third-party claims $ 600 $ 600 Utility clean-up and repairs 35 35 Legal and other costs 2 2 Insurance recoveries (430) (430) 2019 Kincade fire-related costs, net of insurance $ 206 $ 206 29
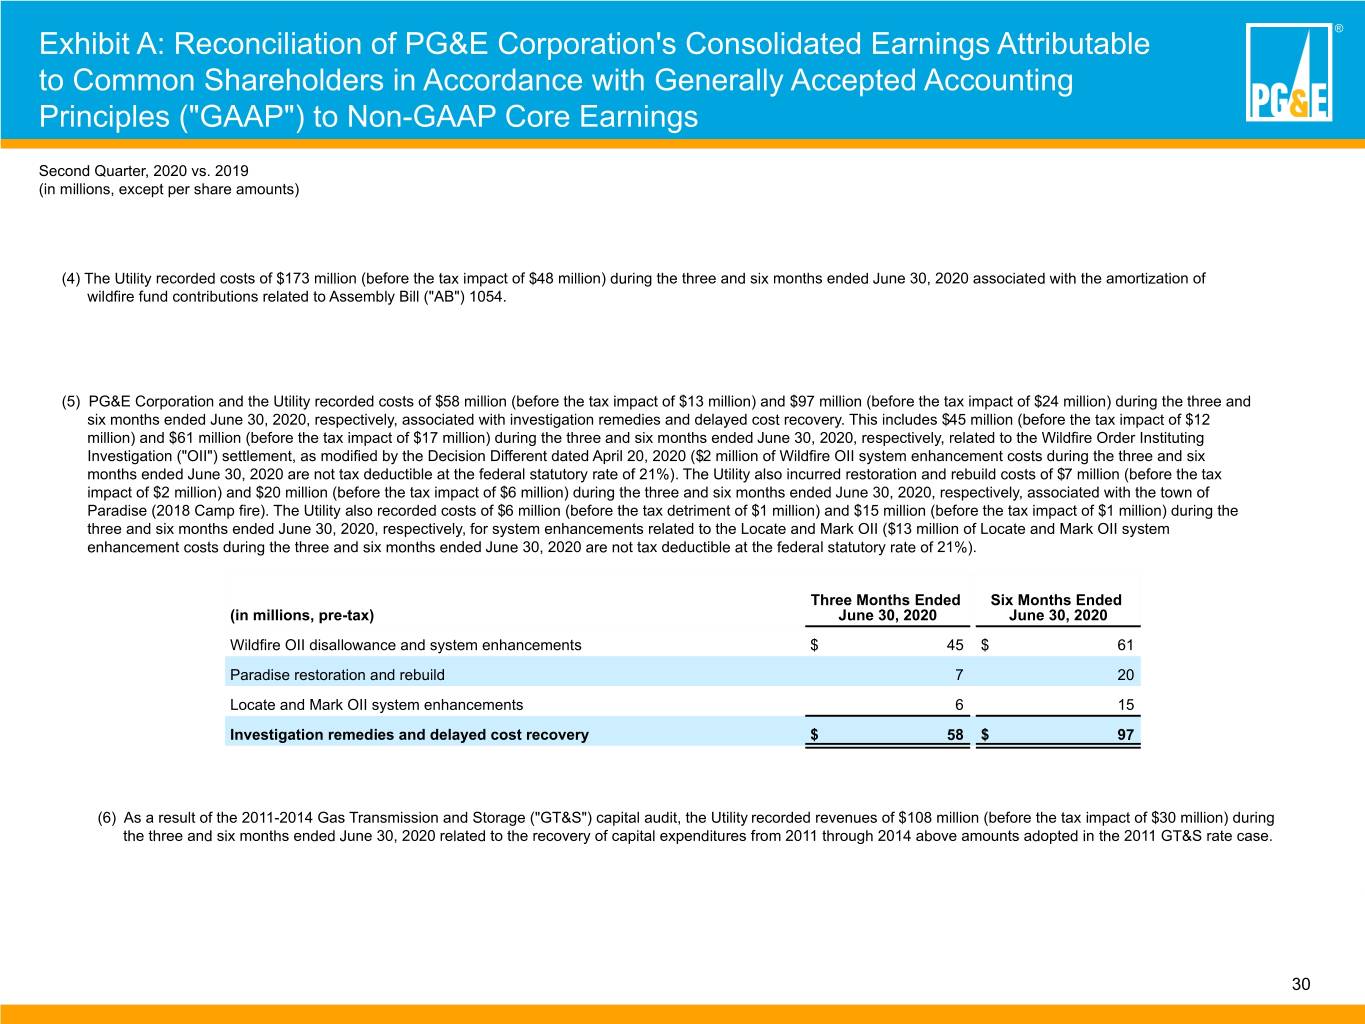
® Exhibit A: Reconciliation of PG&E Corporation's Consolidated Earnings Attributable to Common Shareholders in Accordance with Generally Accepted Accounting Principles ("GAAP") to Non-GAAP Core Earnings Second Quarter, 2020 vs. 2019 (in millions, except per share amounts) (4) The Utility recorded costs of $173 million (before the tax impact of $48 million) during the three and six months ended June 30, 2020 associated with the amortization of wildfire fund contributions related to Assembly Bill ("AB") 1054. (5) PG&E Corporation and the Utility recorded costs of $58 million (before the tax impact of $13 million) and $97 million (before the tax impact of $24 million) during the three and six months ended June 30, 2020, respectively, associated with investigation remedies and delayed cost recovery. This includes $45 million (before the tax impact of $12 million) and $61 million (before the tax impact of $17 million) during the three and six months ended June 30, 2020, respectively, related to the Wildfire Order Instituting Investigation ("OII") settlement, as modified by the Decision Different dated April 20, 2020 ($2 million of Wildfire OII system enhancement costs during the three and six months ended June 30, 2020 are not tax deductible at the federal statutory rate of 21%). The Utility also incurred restoration and rebuild costs of $7 million (before the tax impact of $2 million) and $20 million (before the tax impact of $6 million) during the three and six months ended June 30, 2020, respectively, associated with the town of Paradise (2018 Camp fire). The Utility also recorded costs of $6 million (before the tax detriment of $1 million) and $15 million (before the tax impact of $1 million) during the three and six months ended June 30, 2020, respectively, for system enhancements related to the Locate and Mark OII ($13 million of Locate and Mark OII system enhancement costs during the three and six months ended June 30, 2020 are not tax deductible at the federal statutory rate of 21%). Three Months Ended Six Months Ended (in millions, pre-tax) June 30, 2020 June 30, 2020 Wildfire OII disallowance and system enhancements $ 45 $ 61 Paradise restoration and rebuild 7 20 Locate and Mark OII system enhancements 6 15 Investigation remedies and delayed cost recovery $ 58 $ 97 (6) As a result of the 2011-2014 Gas Transmission and Storage ("GT&S") capital audit, the Utility recorded revenues of $108 million (before the tax impact of $30 million) during the three and six months ended June 30, 2020 related to the recovery of capital expenditures from 2011 through 2014 above amounts adopted in the 2011 GT&S rate case. 30
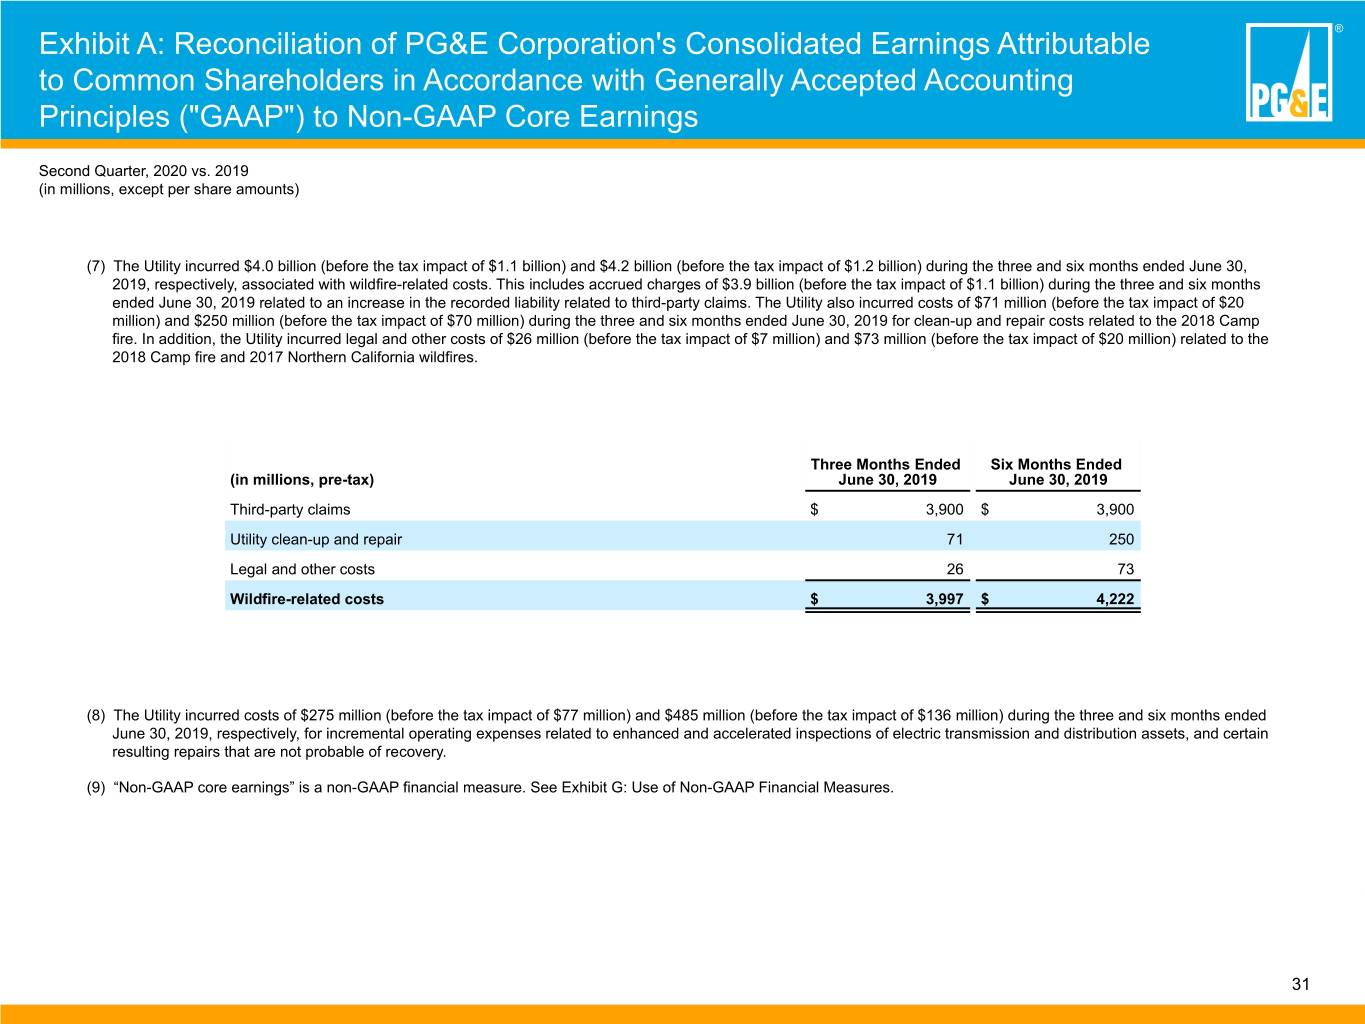
® Exhibit A: Reconciliation of PG&E Corporation's Consolidated Earnings Attributable to Common Shareholders in Accordance with Generally Accepted Accounting Principles ("GAAP") to Non-GAAP Core Earnings Second Quarter, 2020 vs. 2019 (in millions, except per share amounts) (7) The Utility incurred $4.0 billion (before the tax impact of $1.1 billion) and $4.2 billion (before the tax impact of $1.2 billion) during the three and six months ended June 30, 2019, respectively, associated with wildfire-related costs. This includes accrued charges of $3.9 billion (before the tax impact of $1.1 billion) during the three and six months ended June 30, 2019 related to an increase in the recorded liability related to third-party claims. The Utility also incurred costs of $71 million (before the tax impact of $20 million) and $250 million (before the tax impact of $70 million) during the three and six months ended June 30, 2019 for clean-up and repair costs related to the 2018 Camp fire. In addition, the Utility incurred legal and other costs of $26 million (before the tax impact of $7 million) and $73 million (before the tax impact of $20 million) related to the 2018 Camp fire and 2017 Northern California wildfires. Three Months Ended Six Months Ended (in millions, pre-tax) June 30, 2019 June 30, 2019 Third-party claims $ 3,900 $ 3,900 Utility clean-up and repair 71 250 Legal and other costs 26 73 Wildfire-related costs $ 3,997 $ 4,222 (8) The Utility incurred costs of $275 million (before the tax impact of $77 million) and $485 million (before the tax impact of $136 million) during the three and six months ended June 30, 2019, respectively, for incremental operating expenses related to enhanced and accelerated inspections of electric transmission and distribution assets, and certain resulting repairs that are not probable of recovery. (9) “Non-GAAP core earnings” is a non-GAAP financial measure. See Exhibit G: Use of Non-GAAP Financial Measures. 31
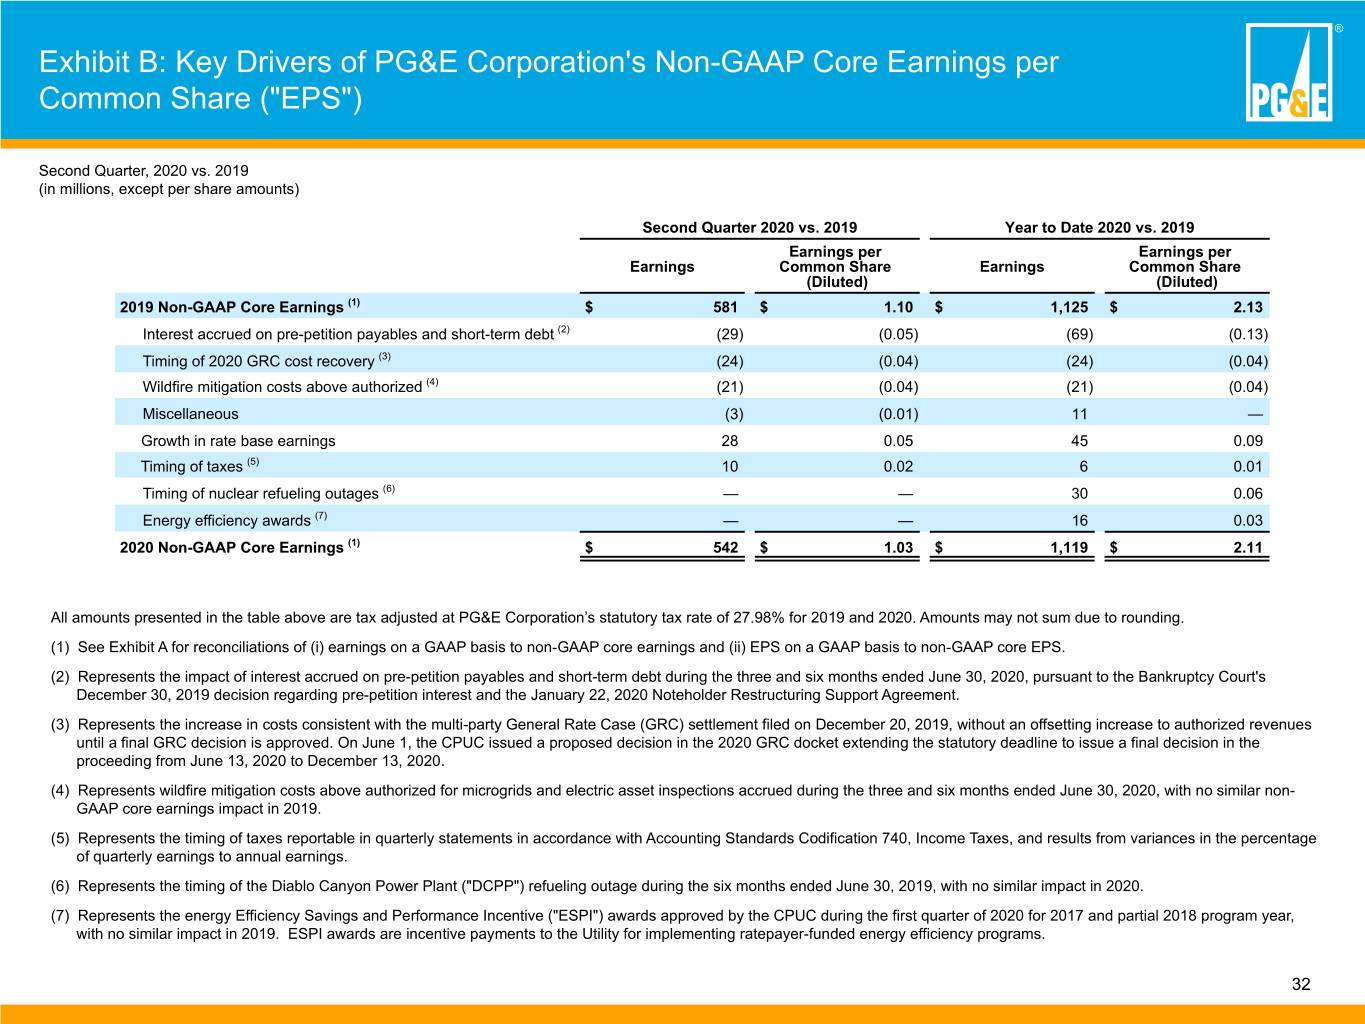
® Exhibit B: Key Drivers of PG&E Corporation's Non-GAAP Core Earnings per Common Share ("EPS") Second Quarter, 2020 vs. 2019 (in millions, except per share amounts) Second Quarter 2020 vs. 2019 Year to Date 2020 vs. 2019 Earnings per Earnings per Earnings Common Share Earnings Common Share (Diluted) (Diluted) 2019 Non-GAAP Core Earnings (1) $ 581 $ 1.10 $ 1,125 $ 2.13 Interest accrued on pre-petition payables and short-term debt (2) (29) (0.05) (69) (0.13) Timing of 2020 GRC cost recovery (3) (24) (0.04) (24) (0.04) Wildfire mitigation costs above authorized (4) (21) (0.04) (21) (0.04) Miscellaneous (3) (0.01) 11 — Growth in rate base earnings 28 0.05 45 0.09 Timing of taxes (5) 10 0.02 6 0.01 Timing of nuclear refueling outages (6) — — 30 0.06 Energy efficiency awards (7) — — 16 0.03 2020 Non-GAAP Core Earnings (1) $ 542 $ 1.03 $ 1,119 $ 2.11 All amounts presented in the table above are tax adjusted at PG&E Corporation’s statutory tax rate of 27.98% for 2019 and 2020. Amounts may not sum due to rounding. (1) See Exhibit A for reconciliations of (i) earnings on a GAAP basis to non-GAAP core earnings and (ii) EPS on a GAAP basis to non-GAAP core EPS. (2) Represents the impact of interest accrued on pre-petition payables and short-term debt during the three and six months ended June 30, 2020, pursuant to the Bankruptcy Court's December 30, 2019 decision regarding pre-petition interest and the January 22, 2020 Noteholder Restructuring Support Agreement. (3) Represents the increase in costs consistent with the multi-party General Rate Case (GRC) settlement filed on December 20, 2019, without an offsetting increase to authorized revenues until a final GRC decision is approved. On June 1, the CPUC issued a proposed decision in the 2020 GRC docket extending the statutory deadline to issue a final decision in the proceeding from June 13, 2020 to December 13, 2020. (4) Represents wildfire mitigation costs above authorized for microgrids and electric asset inspections accrued during the three and six months ended June 30, 2020, with no similar non- GAAP core earnings impact in 2019. (5) Represents the timing of taxes reportable in quarterly statements in accordance with Accounting Standards Codification 740, Income Taxes, and results from variances in the percentage of quarterly earnings to annual earnings. (6) Represents the timing of the Diablo Canyon Power Plant ("DCPP") refueling outage during the six months ended June 30, 2019, with no similar impact in 2020. (7) Represents the energy Efficiency Savings and Performance Incentive ("ESPI") awards approved by the CPUC during the first quarter of 2020 for 2017 and partial 2018 program year, with no similar impact in 2019. ESPI awards are incentive payments to the Utility for implementing ratepayer-funded energy efficiency programs. 32
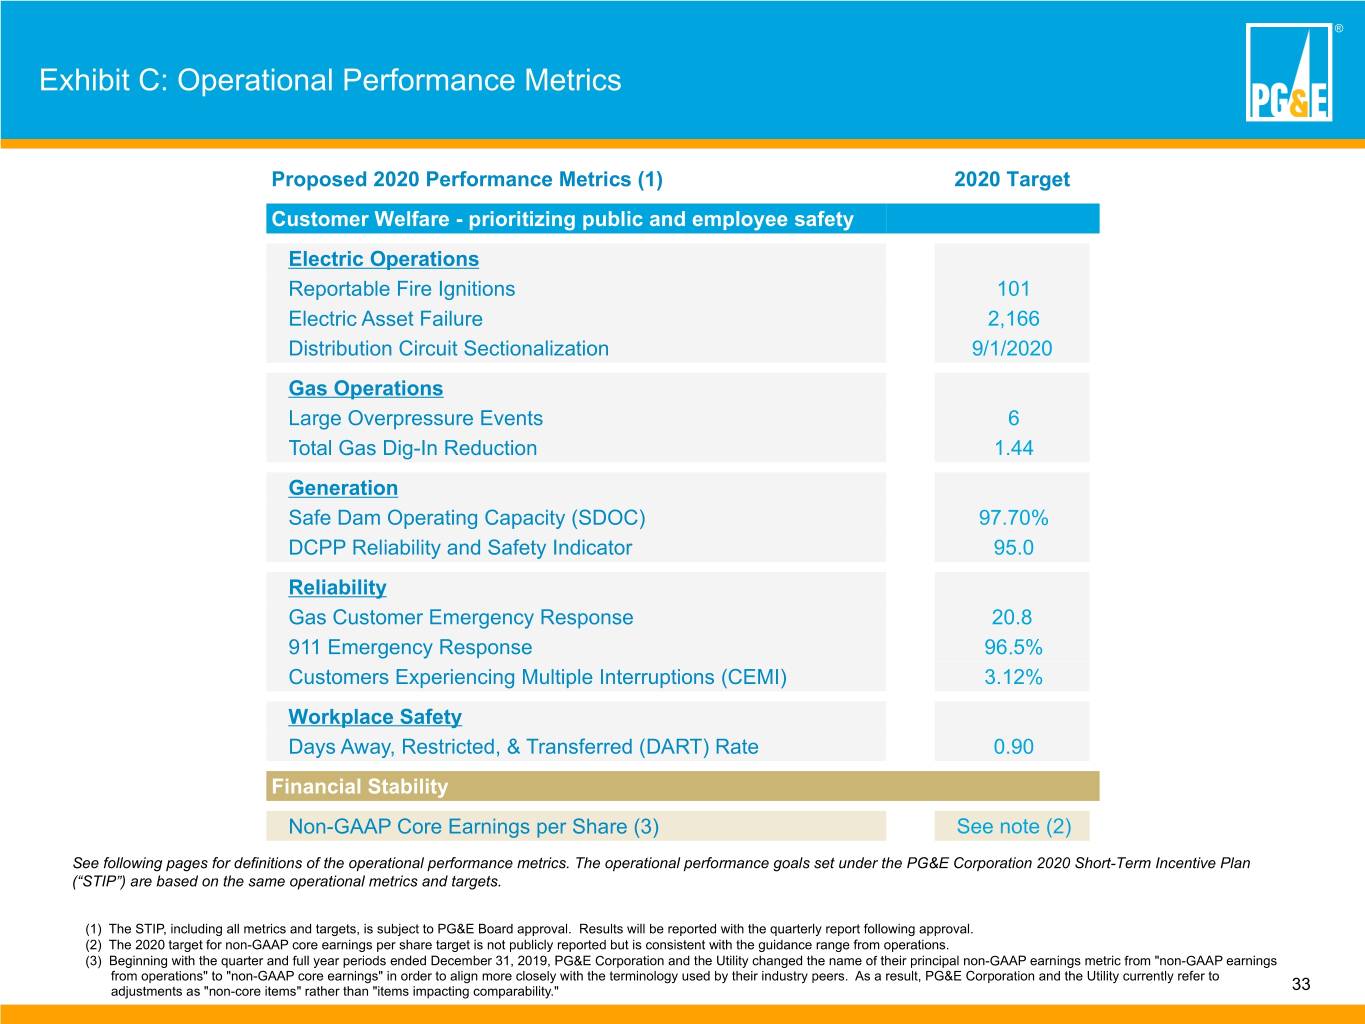
® Exhibit C: Operational Performance Metrics Proposed 2020 Performance Metrics (1) 2020 Target Customer Welfare - prioritizing public and employee safety Electric Operations Reportable Fire Ignitions 101 Electric Asset Failure 2,166 Distribution Circuit Sectionalization 9/1/2020 Gas Operations Large Overpressure Events 6 Total Gas Dig-In Reduction 1.44 Generation Safe Dam Operating Capacity (SDOC) 97.70% DCPP Reliability and Safety Indicator 95.0 Reliability Gas Customer Emergency Response 20.8 911 Emergency Response 96.5% Customers Experiencing Multiple Interruptions (CEMI) 3.12% Workplace Safety Days Away, Restricted, & Transferred (DART) Rate 0.90 Financial Stability Non-GAAP Core Earnings per Share (3) See note (2) See following pages for definitions of the operational performance metrics. The operational performance goals set under the PG&E Corporation 2020 Short-Term Incentive Plan (“STIP”) are based on the same operational metrics and targets. (1) The STIP, including all metrics and targets, is subject to PG&E Board approval. Results will be reported with the quarterly report following approval. (2) The 2020 target for non-GAAP core earnings per share target is not publicly reported but is consistent with the guidance range from operations. (3) Beginning with the quarter and full year periods ended December 31, 2019, PG&E Corporation and the Utility changed the name of their principal non-GAAP earnings metric from "non-GAAP earnings from operations" to "non-GAAP core earnings" in order to align more closely with the terminology used by their industry peers. As a result, PG&E Corporation and the Utility currently refer to adjustments as "non-core items" rather than "items impacting comparability." 33
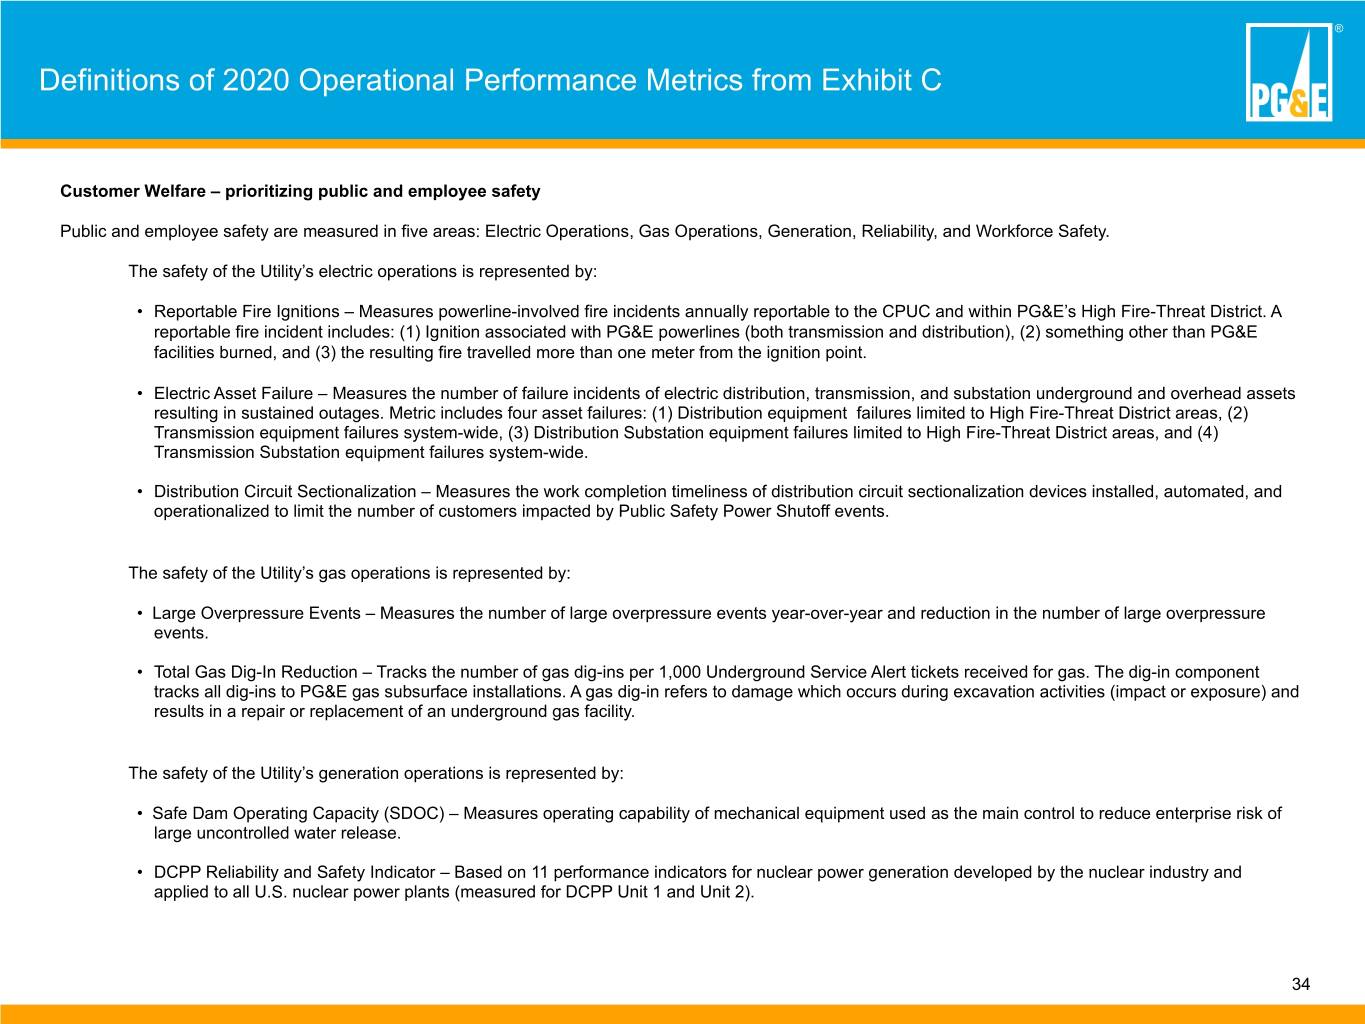
® Definitions of 2020 Operational Performance Metrics from Exhibit C Customer Welfare – prioritizing public and employee safety Public and employee safety are measured in five areas: Electric Operations, Gas Operations, Generation, Reliability, and Workforce Safety. The safety of the Utility’s electric operations is represented by: • Reportable Fire Ignitions – Measures powerline-involved fire incidents annually reportable to the CPUC and within PG&E’s High Fire-Threat District. A reportable fire incident includes: (1) Ignition associated with PG&E powerlines (both transmission and distribution), (2) something other than PG&E facilities burned, and (3) the resulting fire travelled more than one meter from the ignition point. • Electric Asset Failure – Measures the number of failure incidents of electric distribution, transmission, and substation underground and overhead assets resulting in sustained outages. Metric includes four asset failures: (1) Distribution equipment failures limited to High Fire-Threat District areas, (2) Transmission equipment failures system-wide, (3) Distribution Substation equipment failures limited to High Fire-Threat District areas, and (4) Transmission Substation equipment failures system-wide. • Distribution Circuit Sectionalization – Measures the work completion timeliness of distribution circuit sectionalization devices installed, automated, and operationalized to limit the number of customers impacted by Public Safety Power Shutoff events. The safety of the Utility’s gas operations is represented by: • Large Overpressure Events – Measures the number of large overpressure events year-over-year and reduction in the number of large overpressure events. • Total Gas Dig-In Reduction – Tracks the number of gas dig-ins per 1,000 Underground Service Alert tickets received for gas. The dig-in component tracks all dig-ins to PG&E gas subsurface installations. A gas dig-in refers to damage which occurs during excavation activities (impact or exposure) and results in a repair or replacement of an underground gas facility. The safety of the Utility’s generation operations is represented by: • Safe Dam Operating Capacity (SDOC) – Measures operating capability of mechanical equipment used as the main control to reduce enterprise risk of large uncontrolled water release. • DCPP Reliability and Safety Indicator – Based on 11 performance indicators for nuclear power generation developed by the nuclear industry and applied to all U.S. nuclear power plants (measured for DCPP Unit 1 and Unit 2). 34
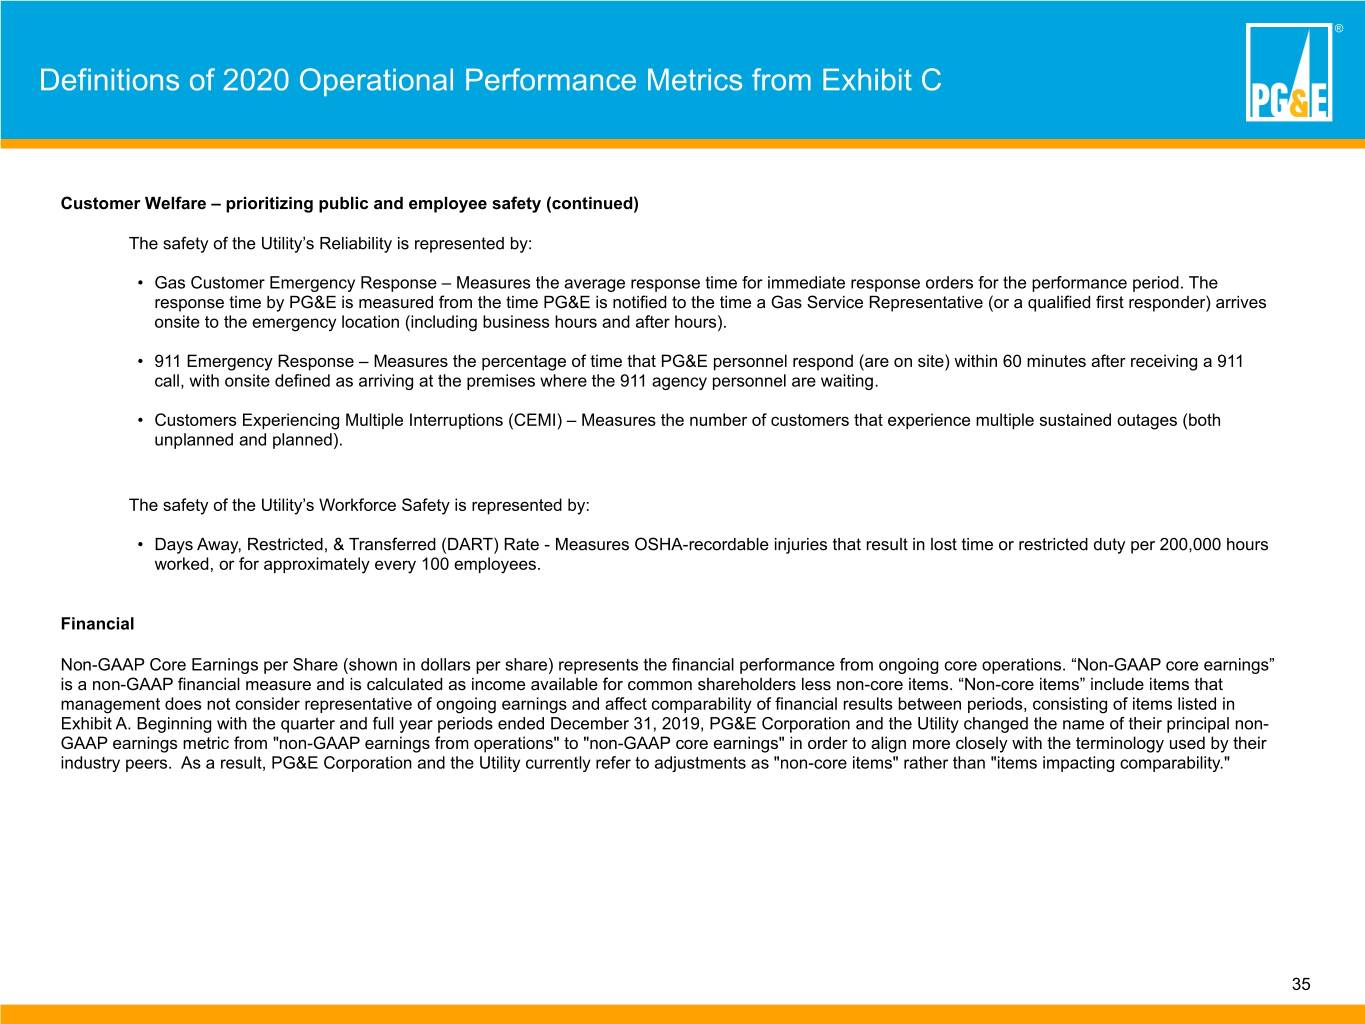
® Definitions of 2020 Operational Performance Metrics from Exhibit C Customer Welfare – prioritizing public and employee safety (continued) The safety of the Utility’s Reliability is represented by: • Gas Customer Emergency Response – Measures the average response time for immediate response orders for the performance period. The response time by PG&E is measured from the time PG&E is notified to the time a Gas Service Representative (or a qualified first responder) arrives onsite to the emergency location (including business hours and after hours). • 911 Emergency Response – Measures the percentage of time that PG&E personnel respond (are on site) within 60 minutes after receiving a 911 call, with onsite defined as arriving at the premises where the 911 agency personnel are waiting. • Customers Experiencing Multiple Interruptions (CEMI) – Measures the number of customers that experience multiple sustained outages (both unplanned and planned). The safety of the Utility’s Workforce Safety is represented by: • Days Away, Restricted, & Transferred (DART) Rate - Measures OSHA-recordable injuries that result in lost time or restricted duty per 200,000 hours worked, or for approximately every 100 employees. Financial Non-GAAP Core Earnings per Share (shown in dollars per share) represents the financial performance from ongoing core operations. “Non-GAAP core earnings” is a non-GAAP financial measure and is calculated as income available for common shareholders less non-core items. “Non-core items” include items that management does not consider representative of ongoing earnings and affect comparability of financial results between periods, consisting of items listed in Exhibit A. Beginning with the quarter and full year periods ended December 31, 2019, PG&E Corporation and the Utility changed the name of their principal non- GAAP earnings metric from "non-GAAP earnings from operations" to "non-GAAP core earnings" in order to align more closely with the terminology used by their industry peers. As a result, PG&E Corporation and the Utility currently refer to adjustments as "non-core items" rather than "items impacting comparability." 35
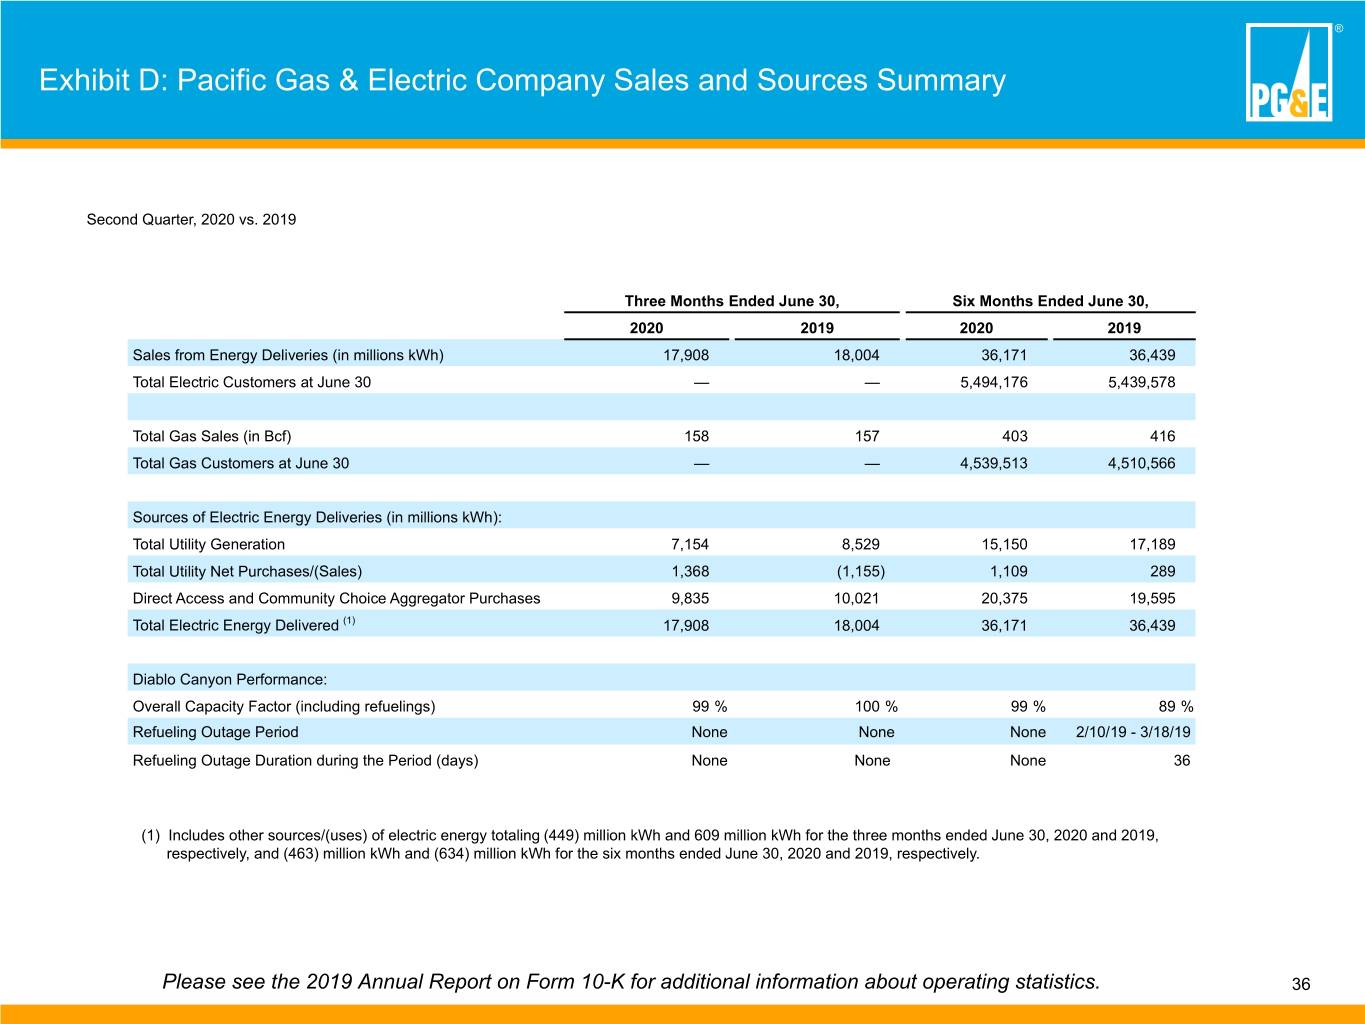
® Exhibit D: Pacific Gas & Electric Company Sales and Sources Summary Second Quarter, 2020 vs. 2019 Three Months Ended June 30, Six Months Ended June 30, 2020 2019 2020 2019 Sales from Energy Deliveries (in millions kWh) 17,908 18,004 36,171 36,439 Total Electric Customers at June 30 — — 5,494,176 5,439,578 Total Gas Sales (in Bcf) 158 157 403 416 Total Gas Customers at June 30 — — 4,539,513 4,510,566 Sources of Electric Energy Deliveries (in millions kWh): Total Utility Generation 7,154 8,529 15,150 17,189 Total Utility Net Purchases/(Sales) 1,368 (1,155) 1,109 289 Direct Access and Community Choice Aggregator Purchases 9,835 10,021 20,375 19,595 Total Electric Energy Delivered (1) 17,908 18,004 36,171 36,439 Diablo Canyon Performance: Overall Capacity Factor (including refuelings) 99 % 100 % 99 % 89 % Refueling Outage Period None None None 2/10/19 - 3/18/19 Refueling Outage Duration during the Period (days) None None None 36 (1) Includes other sources/(uses) of electric energy totaling (449) million kWh and 609 million kWh for the three months ended June 30, 2020 and 2019, respectively, and (463) million kWh and (634) million kWh for the six months ended June 30, 2020 and 2019, respectively. Please see the 2019 Annual Report on Form 10-K for additional information about operating statistics. 36
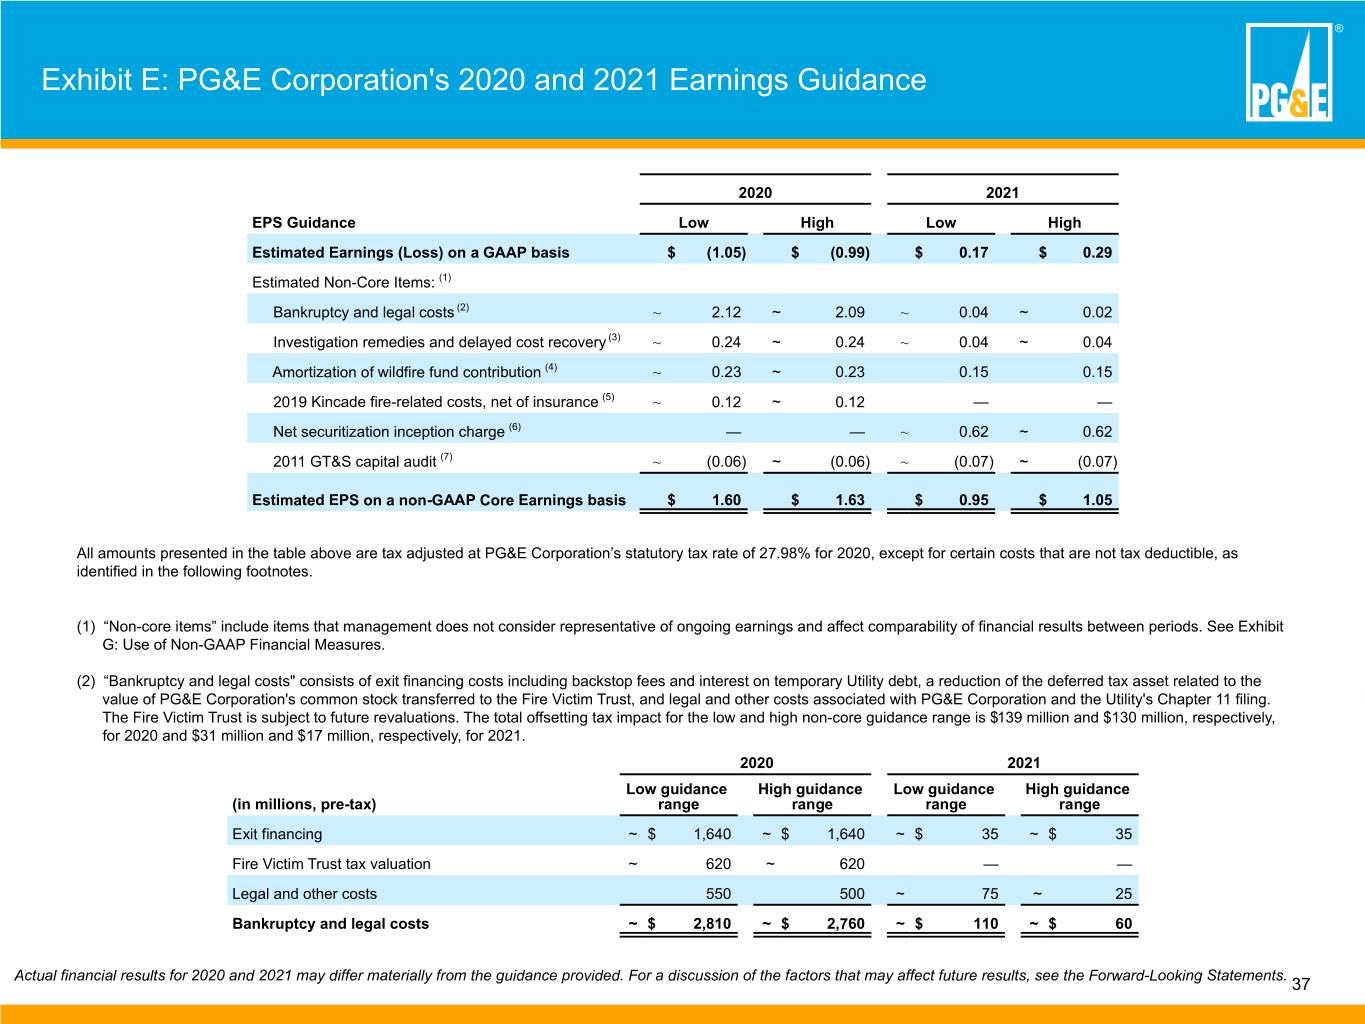
® Exhibit E: PG&E Corporation's 2020 and 2021 Earnings Guidance 2020 2021 EPS Guidance Low High Low High Estimated Earnings (Loss) on a GAAP basis $ (1.05) $ (0.99) $ 0.17 $ 0.29 Estimated Non-Core Items: (1) Bankruptcy and legal costs (2) ~ 2.12 ~ 2.09 ~ 0.04 ~ 0.02 Investigation remedies and delayed cost recovery (3) ~ 0.24 ~ 0.24 ~ 0.04 ~ 0.04 Amortization of wildfire fund contribution (4) ~ 0.23 ~ 0.23 0.15 0.15 2019 Kincade fire-related costs, net of insurance (5) ~ 0.12 ~ 0.12 — — Net securitization inception charge (6) — — ~ 0.62 ~ 0.62 2011 GT&S capital audit (7) ~ (0.06) ~ (0.06) ~ (0.07) ~ (0.07) Estimated EPS on a non-GAAP Core Earnings basis $ 1.60 $ 1.63 $ 0.95 $ 1.05 All amounts presented in the table above are tax adjusted at PG&E Corporation’s statutory tax rate of 27.98% for 2020, except for certain costs that are not tax deductible, as identified in the following footnotes. (1) “Non-core items” include items that management does not consider representative of ongoing earnings and affect comparability of financial results between periods. See Exhibit G: Use of Non-GAAP Financial Measures. (2) “Bankruptcy and legal costs" consists of exit financing costs including backstop fees and interest on temporary Utility debt, a reduction of the deferred tax asset related to the value of PG&E Corporation's common stock transferred to the Fire Victim Trust, and legal and other costs associated with PG&E Corporation and the Utility's Chapter 11 filing. The Fire Victim Trust is subject to future revaluations. The total offsetting tax impact for the low and high non-core guidance range is $139 million and $130 million, respectively, for 2020 and $31 million and $17 million, respectively, for 2021. 2020 2021 Low guidance High guidance Low guidance High guidance (in millions, pre-tax) range range range range Exit financing ~ $ 1,640 ~ $ 1,640 ~ $ 35 ~ $ 35 Fire Victim Trust tax valuation ~ 620 ~ 620 — — Legal and other costs 550 500 ~ 75 ~ 25 Bankruptcy and legal costs ~ $ 2,810 ~ $ 2,760 ~ $ 110 ~ $ 60 Actual financial results for 2020 and 2021 may differ materially from the guidance provided. For a discussion of the factors that may affect future results, see the Forward-Looking Statements. 37
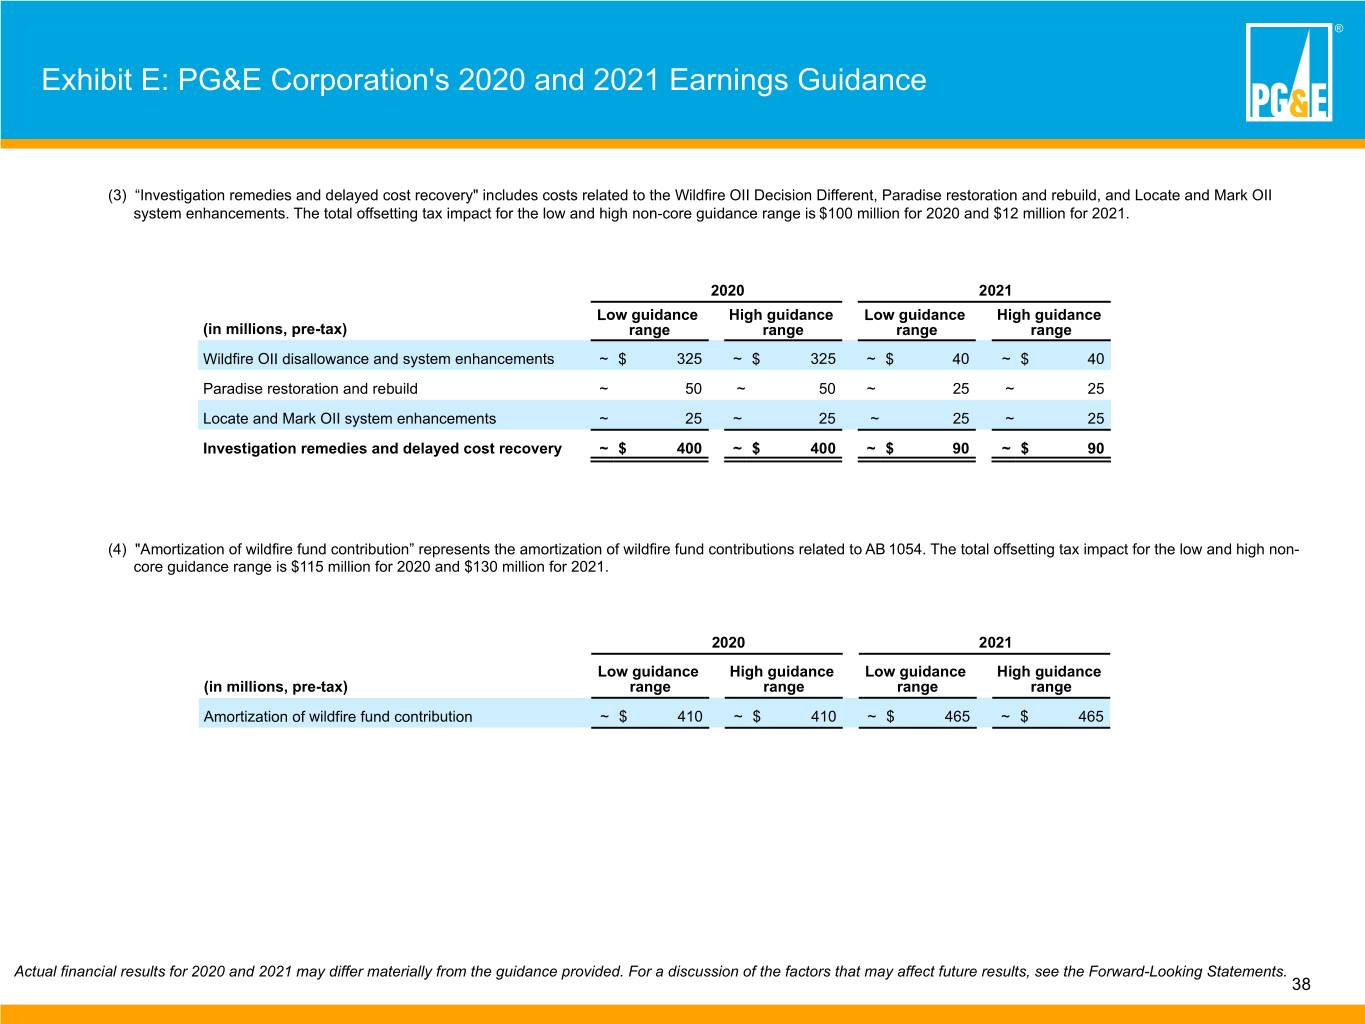
® Exhibit E: PG&E Corporation's 2020 and 2021 Earnings Guidance (3) “InvestigationExhibit remedies and E: delayed PG&E cost recovery" Corporation's includes costs related to2020 the Wildfire and OII Decision 2021 Different, Earnings Paradise restoration Guidance and rebuild, and Locate and Mark OII system enhancements. The total offsetting tax impact for the low and high non-core guidance range is $100 million for 2020 and $12 million for 2021. 2020 2021 Low guidance High guidance Low guidance High guidance (in millions, pre-tax) range range range range Wildfire OII disallowance and system enhancements ~ $ 325 ~ $ 325 ~ $ 40 ~ $ 40 Paradise restoration and rebuild ~ 50 ~ 50 ~ 25 ~ 25 Locate and Mark OII system enhancements ~ 25 ~ 25 ~ 25 ~ 25 Investigation remedies and delayed cost recovery ~ $ 400 ~ $ 400 ~ $ 90 ~ $ 90 (4) "Amortization of wildfire fund contribution” represents the amortization of wildfire fund contributions related to AB 1054. The total offsetting tax impact for the low and high non- core guidance range is $115 million for 2020 and $130 million for 2021. 2020 2021 Low guidance High guidance Low guidance High guidance (in millions, pre-tax) range range range range Amortization of wildfire fund contribution ~ $ 410 ~ $ 410 ~ $ 465 ~ $ 465 Actual financial results for 2020 and 2021 may differ materially from the guidance provided. For a discussion of the factors that may affect future results, see the Forward-Looking Statements. 38
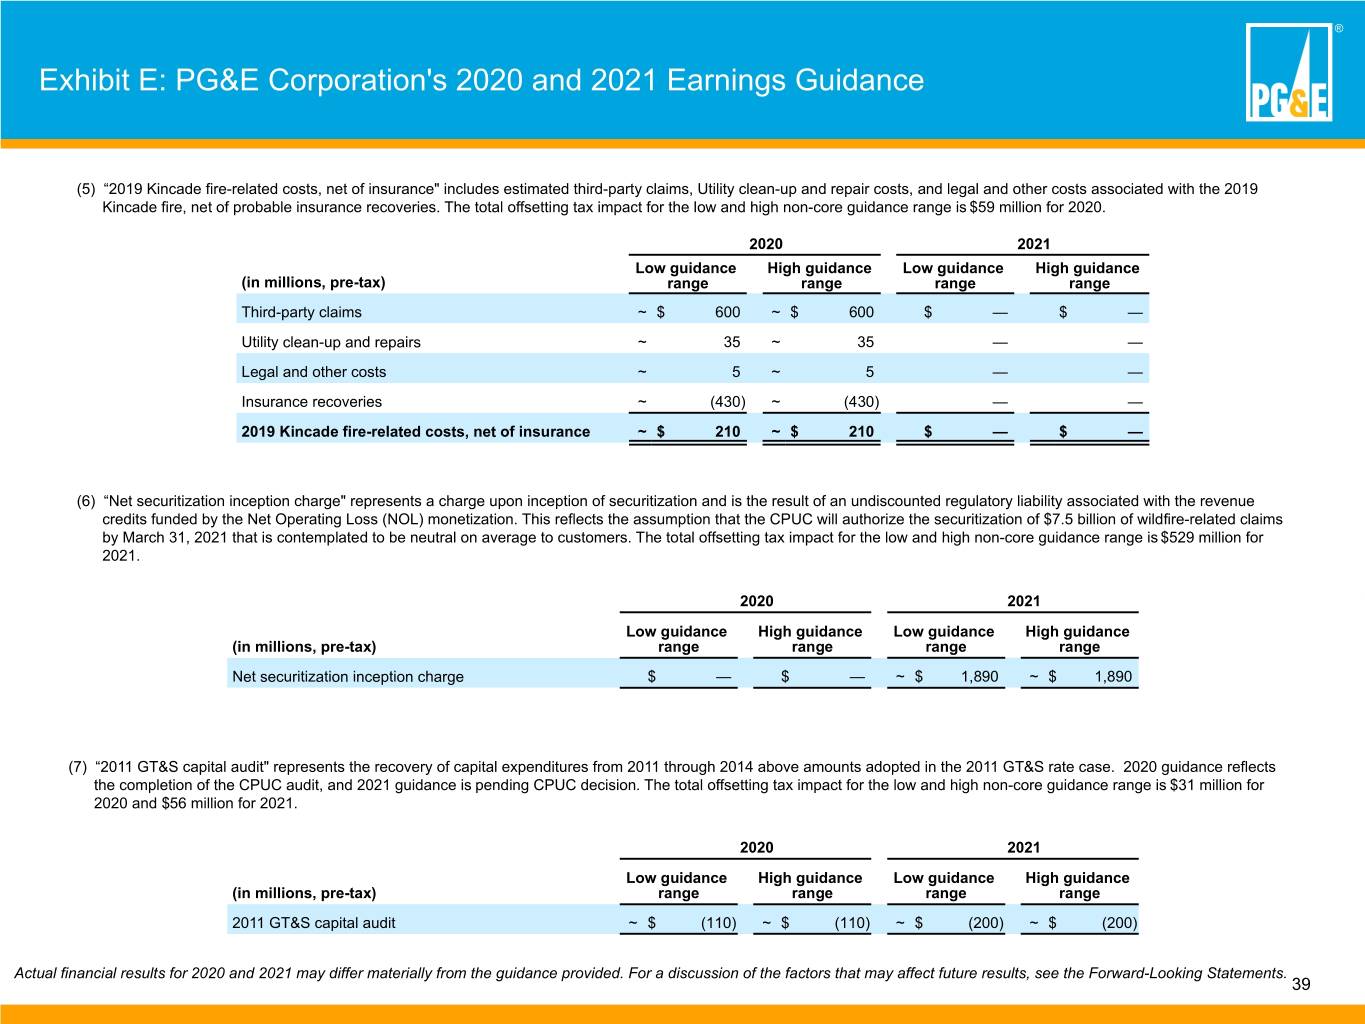
® Exhibit E: PG&E Corporation's 2020 and 2021 Earnings Guidance (5) “2019 Kincade fire-related costs, net of insurance" includes estimated third-party claims, Utility clean-up and repair costs, and legal and other costs associated with the 2019 Kincade fire, net of probable insurance recoveries. The total offsetting tax impact for the low and high non-core guidance range is $59 million for 2020. 2020 2021 Low guidance High guidance Low guidance High guidance (in millions, pre-tax) range range range range Third-party claims ~ $ 600 ~ $ 600 $ — $ — Utility clean-up and repairs ~ 35 ~ 35 — — Legal and other costs ~ 5 ~ 5 — — Insurance recoveries ~ (430) ~ (430) — — 2019 Kincade fire-related costs, net of insurance ~ $ 210 ~ $ 210 $ — $ — (6) “Net securitization inception charge" represents a charge upon inception of securitization and is the result of an undiscounted regulatory liability associated with the revenue credits funded by the Net Operating Loss (NOL) monetization. This reflects the assumption that the CPUC will authorize the securitization of $7.5 billion of wildfire-related claims by March 31, 2021 that is contemplated to be neutral on average to customers. The total offsetting tax impact for the low and high non-core guidance range is $529 million for 2021. 2020 2021 Low guidance High guidance Low guidance High guidance (in millions, pre-tax) range range range range Net securitization inception charge $ — $ — ~ $ 1,890 ~ $ 1,890 (7) “2011 GT&S capital audit" represents the recovery of capital expenditures from 2011 through 2014 above amounts adopted in the 2011 GT&S rate case. 2020 guidance reflects the completion of the CPUC audit, and 2021 guidance is pending CPUC decision. The total offsetting tax impact for the low and high non-core guidance range is $31 million for 2020 and $56 million for 2021. 2020 2021 Low guidance High guidance Low guidance High guidance (in millions, pre-tax) range range range range 2011 GT&S capital audit ~ $ (110) ~ $ (110) ~ $ (200) ~ $ (200) Actual financial results for 2020 and 2021 may differ materially from the guidance provided. For a discussion of the factors that may affect future results, see the Forward-Looking Statements. 39
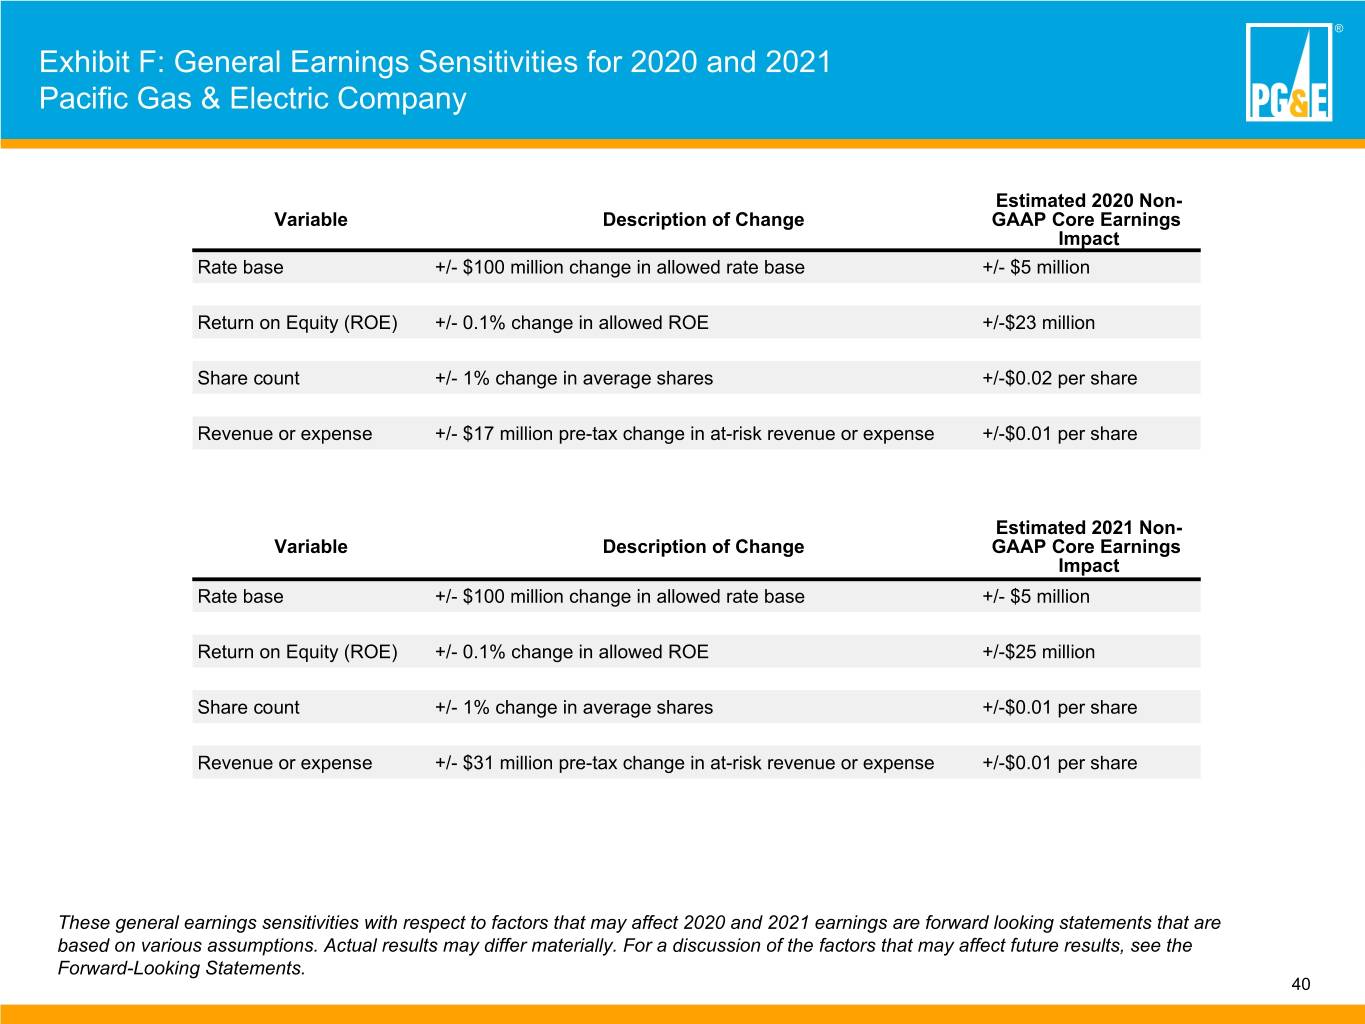
® Exhibit F: General Earnings Sensitivities for 2020 and 2021 Pacific Gas & Electric Company Estimated 2020 Non- Variable Description of Change GAAP Core Earnings Impact Rate base +/- $100 million change in allowed rate base +/- $5 million Return on Equity (ROE) +/- 0.1% change in allowed ROE +/-$23 million Share count +/- 1% change in average shares +/-$0.02 per share Revenue or expense +/- $17 million pre-tax change in at-risk revenue or expense +/-$0.01 per share Estimated 2021 Non- Variable Description of Change GAAP Core Earnings Impact Rate base +/- $100 million change in allowed rate base +/- $5 million Return on Equity (ROE) +/- 0.1% change in allowed ROE +/-$25 million Share count +/- 1% change in average shares +/-$0.01 per share Revenue or expense +/- $31 million pre-tax change in at-risk revenue or expense +/-$0.01 per share These general earnings sensitivities with respect to factors that may affect 2020 and 2021 earnings are forward looking statements that are based on various assumptions. Actual results may differ materially. For a discussion of the factors that may affect future results, see the Forward-Looking Statements. 40

® Exhibit G: Use of Non-GAAP Financial Measures PG&E Corporation and Pacific Gas and Electric Company: Use of Non-GAAP Financial Measures PG&E Corporation discloses historical financial results and provides guidance based on “non-GAAP core earnings” and “non-GAAP core EPS” in order to provide a measure that allows investors to compare the underlying financial performance of the business from one period to another, exclusive of items impacting comparability. Beginning with the quarter and full year periods ended December 31, 2019, PG&E Corporation and the Utility changed the name of their principal non-GAAP earnings metric from "non-GAAP earnings from operations" to "non-GAAP core earnings" in order to align more closely with the terminology used by their industry peers. As a result, PG&E Corporation and the Utility currently refer to adjustments as "non-core items" rather than "items impacting comparability." “Non-GAAP core earnings” is a non-GAAP financial measure and is calculated as income available for common shareholders less items non- core items. “Non-core Items” include items that management does not consider representative of ongoing earnings and affect comparability of financial results between periods, consisting of the items listed in Exhibit A. “Non-GAAP core EPS,” also referred to as “non-GAAP core earnings per share,” is a non-GAAP financial measure and is calculated as non-GAAP core earnings divided by common shares outstanding (diluted). PG&E Corporation and the Utility use non-GAAP core earnings and non-GAAP core EPS to understand and compare operating results across reporting periods for various purposes including internal budgeting and forecasting, short- and long-term operating planning, and employee incentive compensation. PG&E Corporation and the Utility believe that non-GAAP core earnings and non-GAAP core EPS provide additional insight into the underlying trends of the business, allowing for a better comparison against historical results and expectations for future performance. Non-GAAP core earnings and non-GAAP core EPS are not substitutes or alternatives for GAAP measures such as consolidated income available for common shareholders and may not be comparable to similarly titled measures used by other companies. 41