PRSU 8-K
Pursuit Attractions & Hospitality, Inc. (PRSU)
8-K
2024-02-08
For: 2024-02-08
View Original
Added on
April 12, 2026
UNITED
STATES
SECURITIES AND EXCHANGE COMMISSION
WASHINGTON, D.C. 20549
FORM 8-K
CURRENT REPORT
Pursuant to Section 13 or 15(d) of the Securities Exchange Act of 1934
Date of Report (Date of earliest event reported): February 8, 2024

(Exact name of registrant as specified in its charter)
|
|
|
|
|
(State or other jurisdiction
of incorporation)
|
(Commission File Number)
|
(IRS Employer
Identification No.)
|
|
|
|
|
|
(Address of principal executive offices)
|
(Zip Code)
|
Registrant’s telephone number, including area code: (602 ) 207-1000
Not Applicable
(Former name or former address, if changed since last report)
Check the appropriate box below if the Form 8-K filing is intended to simultaneously satisfy the filing obligation of the registrant under any of the
following provisions (see General Instruction A.2. below):
|
Written communications pursuant to Rule 425 under the Securities Act (17 CFR 230.425)
|
|
|
|
Soliciting material pursuant to Rule 14a-12 under the Exchange Act (17 CFR 240.14a-12)
|
|
|
Pre-commencement communications pursuant to Rule 14d-2(b) under the Exchange Act (17 CFR 240.14d-2(b))
|
|
|
Pre-commencement communications pursuant to Rule 13e-4(c) under the Exchange Act (17 CFR 240.13e-4(c))
|
Securities registered pursuant to Section 12(b) of the Act:
|
Title of each class
|
Trading
Symbol(s)
|
Name of each exchange on which registered
|
||
|
|
|
|
Indicate by check mark whether the registrant is an emerging growth company as defined in Rule 405 of the Securities Act of 1933 (§ 230.405 of this chapter)
or Rule 12b-2 of the Securities Exchange Act of 1934 (§ 240.12b-2 of this chapter).
Emerging growth company ☐
If an emerging growth company, indicate by check mark if the registrant has elected not to use the extended transition period for complying with any new or
revised financial accounting standards provided pursuant to Section 13(a) of the Exchange Act. ☐
Item 2.02 Results of Operations and Financial Condition.
On February 8, 2024, we issued a press release announcing our earnings for the fourth quarter and full year ended December
31, 2023. A copy of the earnings press release is furnished as Exhibit 99.1 to this current report.
This press release, including Exhibit 99.1, will not be deemed “filed” for purposes of Section 18 of the Securities
Exchange Act of 1934, as amended (the “Exchange Act”), or otherwise subject to the liabilities of that section and it will not be incorporated by reference in any filing under the Securities Act of 1933, as amended (the “Securities Act”), or the
Exchange Act, except as expressly set forth by specific reference in such a filing.
Item 7.01 Regulation FD Disclosure
On February 8, 2024, we posted an investor presentation to our website at www.viad.com. The information found on, or
otherwise accessible through, our website is not incorporated by reference herein. A copy of the investor presentation is furnished as Exhibit 99.2 to this current report.
This investor presentation, including Exhibit 99.2, will not be deemed “filed” for purposes of Section 18 of the Exchange
Act, or otherwise subject to the liabilities of that section and it will not be incorporated by reference in any filing under the Securities Act or the Exchange Act, except as expressly set forth by specific reference in such a filing.
Item 9.01 Financial Statements and Exhibits
(d) Exhibits
|
Exhibit
Number
|
Description
|
|
|
104
|
Cover Page Interactive Data File (embedded within the Inline XBRL document)
|
SIGNATURES
Pursuant to the requirements of the Securities Exchange Act of 1934, the registrant has duly caused this report to be
signed on its behalf by the undersigned hereunto duly authorized.
|
Viad Corp
|
||
|
(Registrant)
|
||
|
February 8, 2024
|
By:
|
/s/ Leslie S. Striedel
|
|
Leslie S. Striedel
|
||
|
Chief Accounting Officer
|
||
Exhibit 99.1

NEWS FOR IMMEDIATE RELEASE
Viad Corp Reports 2023 Fourth Quarter and Full Year Results
|
•
|
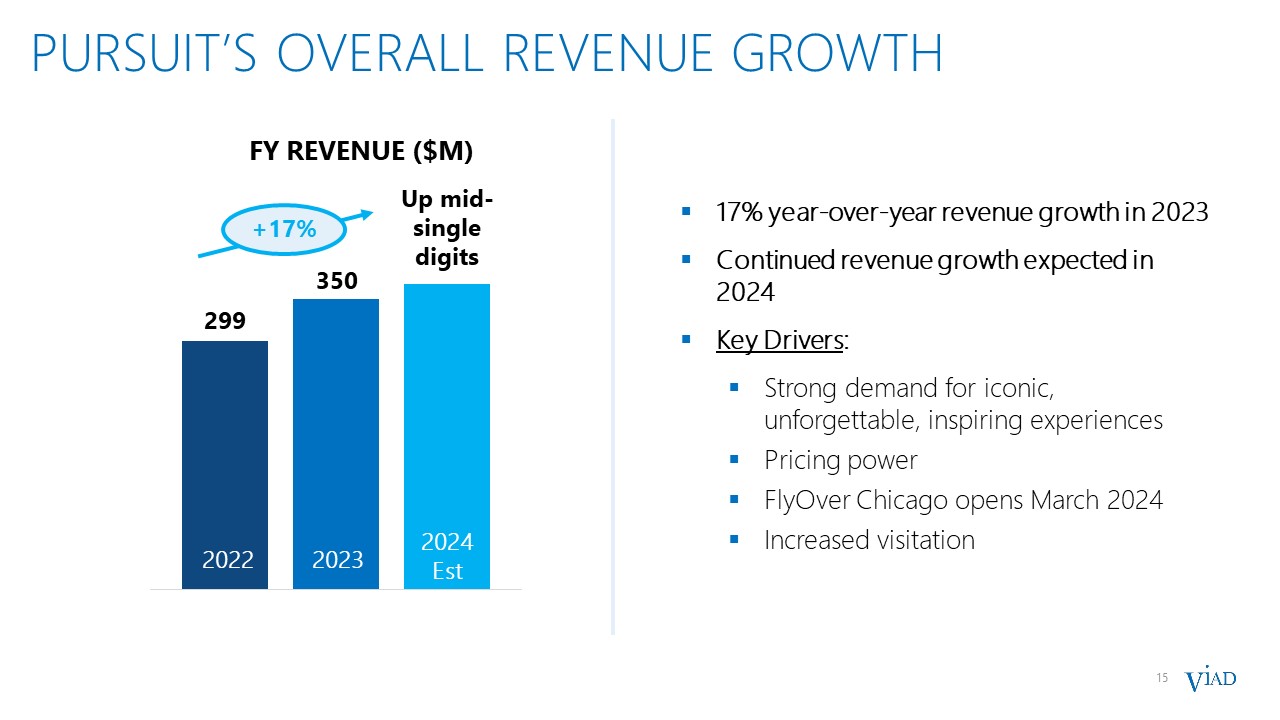
Pursuit delivered record results with 17% full year revenue growth and continued margin expansion
|
|
•
|
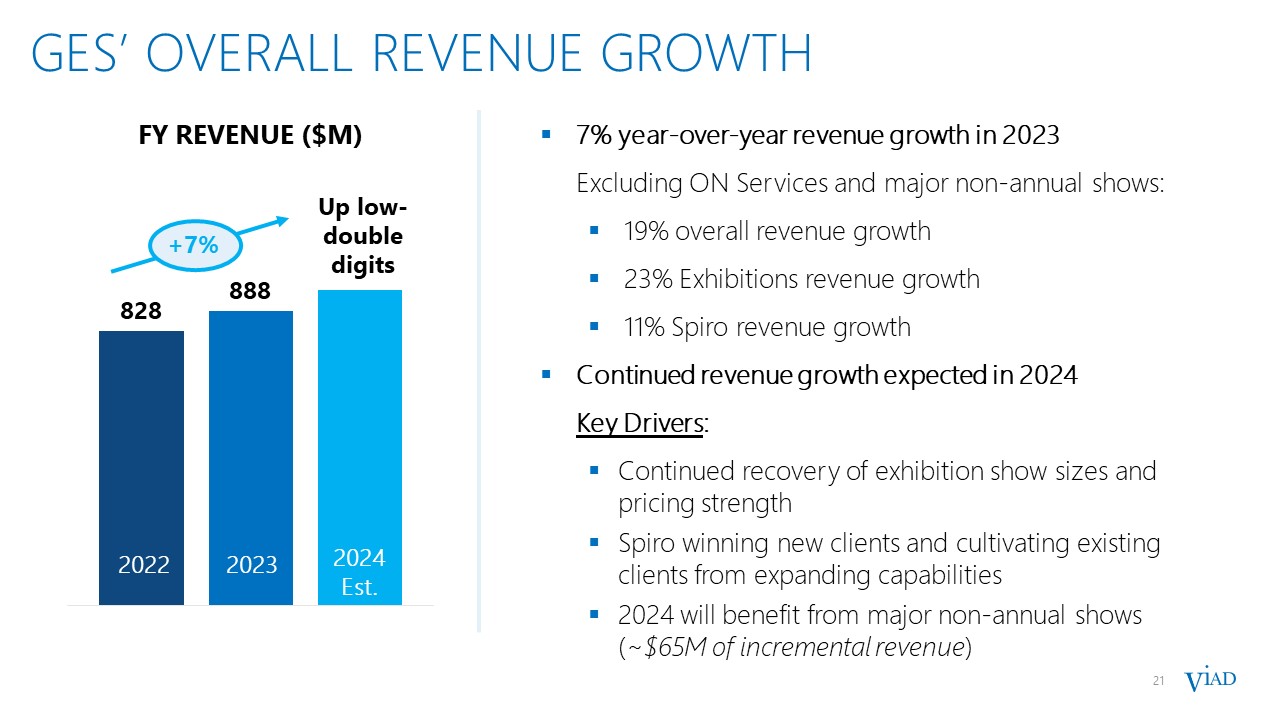
GES substantially outperformed expectations with 7% full year revenue growth and healthy margins
|
|
•
|
Strong growth and margin improvement expected again in 2024
|
SCOTTSDALE,
February 8, 2024 -- Viad Corp (NYSE: VVI), a leading global provider of extraordinary experiences, including attractions, hospitality, exhibition management
services, and experiential marketing, today reported results for the 2023 fourth quarter and full year.
Steve Moster, Viad’s President and Chief Executive Officer, commented, “We delivered
strong fourth quarter and full year results, with consolidated revenue and adjusted EBITDA exceeding the high-end of our guidance. GES’ results significantly surpassed our expectations due to increased corporate client spending on high-margin
experiential marketing services. Pursuit posted record revenue and benefited from increased demand for our inspiring and unforgettable attractions and hotels.”
Moster continued, “We are entering 2024 with great momentum as we see robust demand
for our extraordinary experiences at both Pursuit and GES. We expect to deliver full year consolidated adjusted EBITDA year-over-year growth of approximately 16% to 30% in 2024 with strong free cash flow.”
Financial Highlights
|
Three months ended
December 31,
|
Year ended
December 31,
|
|||||||||||||||||||||||
|
(in millions, except per share data)
|
2023
|
2022
|
% Change
|
2023
|
2022
|
% Change
|
||||||||||||||||||
|
Revenue
|
$
|
291.7
|
$
|
248.0
|
17.6
|
%
|
$
|
1,238.7
|
$
|
1,127.3
|
9.9
|
%
|
||||||||||||
|
Pursuit Revenue
|
42.2
|
34.1
|
23.6
|
%
|
350.3
|
299.3
|
17.0
|
%
|
||||||||||||||||
|
GES Revenue
|
249.5
|
213.9
|
16.6
|
%
|
888.4
|
828.0
|
7.3
|
%
|
||||||||||||||||
|
Net Income (Loss) Attributable to Viad
|
$
|
(15.3
|
)
|
$
|
(5.7
|
)
|
** |
|
$
|
16.0
|
$
|
23.2
|
-31.0
|
%
|
||||||||||
|
Net Income (Loss) Before Other Items* (Adjusted Net Income (Loss))
|
$
|
(14.6
|
)
|
$
|
(25.5
|
)
|
42.8
|
%
|
$
|
18.6
|
$
|
12.3
|
50.9
|
%
|
||||||||||
|
Income (Loss) Per Common Share Attributable to Viad (Diluted EPS)
|
$
|
(0.83
|
)
|
$
|
(0.37
|
)
|
** |
|
$
|
0.30
|
$
|
0.53
|
-43.4
|
%
|
||||||||||
|
Income (Loss) Before Other Items Per Common Share* (Adjusted Diluted EPS)
|
$
|
(0.79
|
)
|
$
|
(1.33
|
)
|
40.6
|
%
|
$
|
0.39
|
$
|
0.16
|
** |
|
||||||||||
|
Consolidated Adjusted EBITDA*
|
$
|
14.5
|
$
|
(2.0
|
)
|
** |
|
$
|
147.0
|
$
|
116.1
|
26.6
|
%
|
|||||||||||
|
Pursuit Adjusted EBITDA*
|
(8.3
|
)
|
(11.3
|
)
|
25.9
|
%
|
92.6
|
67.9
|
36.3
|
%
|
||||||||||||||
|
GES Adjusted EBITDA*
|
26.6
|
12.7
|
** |
|
68.2
|
61.3
|
11.3
|
%
|
||||||||||||||||
|
Corporate Adjusted EBITDA*
|
(3.7
|
)
|
(3.5
|
)
|
-6.9
|
%
|
(13.8
|
)
|
(13.1
|
)
|
-5.1
|
%
|
||||||||||||
* Refer to Table Two of this press release for a discussion and reconciliation of this
non-GAAP financial measure to its most directly comparable GAAP financial measure.
** Change is greater than +/- 100 percent.
-more-
-page 2-
In addition to the commentary below, further information regarding our financial results, trends, and outlook
are available in a supplemental earnings presentation, which can be accessed on the “Investors” section of our website, and in the financial tables accompanying this press release.
Full Year Results
|
•
|
Revenue of $1.2 billion increased $111.4 million (9.9%) from the 2022 full year.
|
|
o
|
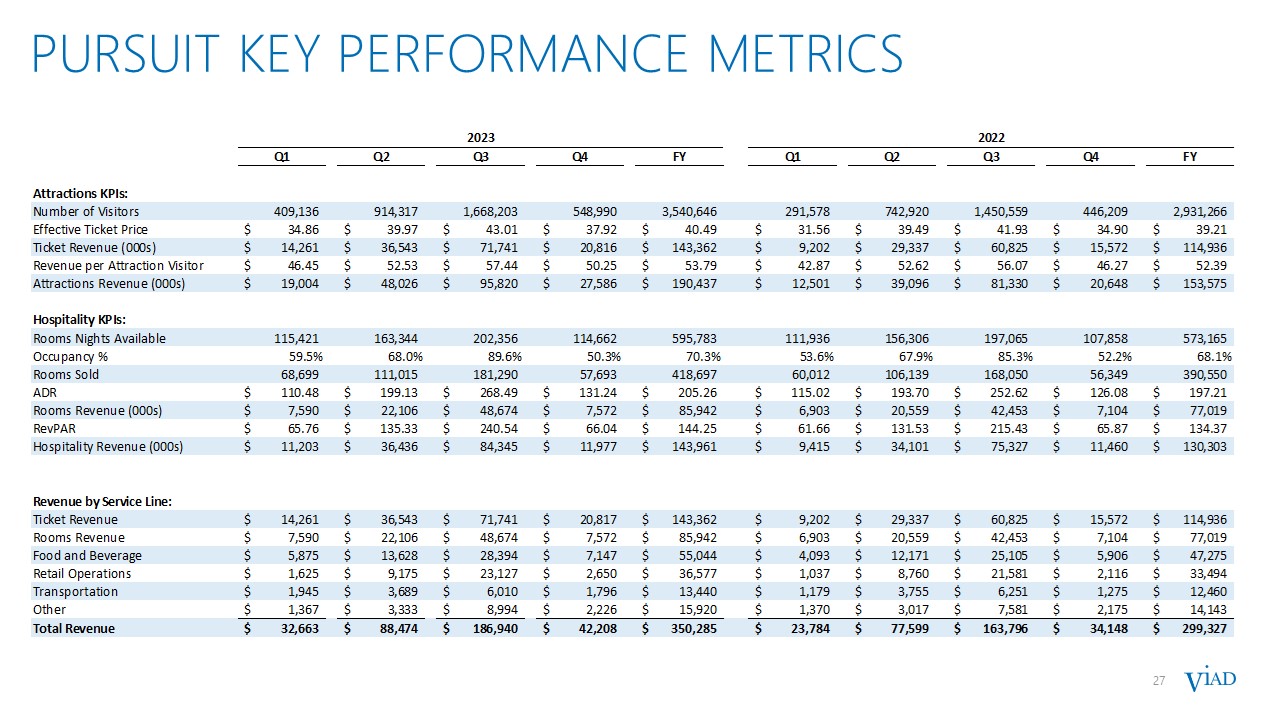
Pursuit revenue of $350.3 million increased $51.0 million (17.0%) year-over-year, primarily driven by stronger international tourism to Western Canada and
Iceland, as well as revenue management efforts to capture higher revenue per guest.
|
|
o
|
GES revenue of $888.4 million increased $60.4 million (7.3%) year-over-year, primarily due to improved demand for exhibition management and experiential
marketing services, which more than offset a $74 million year-over-year revenue impact from the sale of a non-core audio visual services business in 2022 and the timing of major non-annual shows.
|
|
•
|
Net income attributable to Viad of $16.0 million decreased $7.2 million from the 2022 full year primarily due to a $19.6 million gain on the sale of a
non-core audio visual business in the prior year, as well as higher interest expense and income tax expense, partially offset by improved business performance.
|
|
o
|
Net income before other items* (adjusted net income) of $18.6 million increased $6.3 million (50.9%) primarily due to higher adjusted EBITDA, partially
offset by increased interest expense and income tax expense.
|
|
•
|
Consolidated adjusted EBITDA* of $147.0 million increased $30.9 million (26.6%) from the 2022 full year.
|
|
o
|
Pursuit adjusted EBITDA* of $92.6 million increased $24.7 million (36.3%) year-over-year primarily driven by higher revenue and improved margin.
|
|
o
|
GES adjusted EBITDA of $68.2 million increased $6.9 million (11.3%) year-over-year primarily driven by higher revenue and improved margin.
|
Fourth Quarter Results
|
•
|
Revenue of $291.7 million increased $43.7 million (17.6%) from the 2022 fourth quarter.
|
|
o
|
Pursuit revenue of $42.2 million increased $8.1 million (23.6%) year-over-year primarily due to higher visitation and improved revenue per guest.
|
|
o
|
GES revenue of $249.5 million increased $35.6 million (16.6%) year-over-year primarily due to continued underlying growth and about $9 million of
incremental revenue from non-annual shows, partially offset by the loss of $13 million in revenue from a non-core audio visual services business that was sold in 2022.
|
|
•
|
Net loss attributable to Viad of $15.3 million increased $9.6 million from the 2022 fourth quarter primarily due to a $19.6 million gain on the sale of a
non-core audio visual business in 2022 and higher income tax expense, partially offset by improved business performance.
|
|
o
|
Net loss before other items* (adjusted net loss) of $14.6 million improved by $10.9 million primarily due to higher adjusted EBITDA, partially offset by
higher income tax expense.
|
|
•
|
Consolidated adjusted EBITDA* of $14.5 million increased $16.5 million from the 2022 fourth quarter.
|
|
o
|
Pursuit negative adjusted EBITDA* of $8.3 million improved by $2.9 million year-over-year primarily driven by higher revenue during the seasonally slow
quarter.
|
|
o
|
GES adjusted EBITDA of $26.6 million increased $13.9 million year-over-year primarily due to higher revenue and improved margin.
|
-more-
-page 3-
Cash Flow and Balance Sheet Highlights
|
•
|
Our cash flow from operations was an outflow of $9.8 million for the fourth quarter and an inflow of $106.7 million for the full year.
|
|
•
|
Our capital expenditures for the fourth quarter totaled $23.6 million, comprising $20.3 million for Pursuit and $3.2 million for GES. For the full year, our
capital expenditures totaled $78.3 million, comprising $64.6 million for Pursuit (inclusive of about $39 million for growth projects) and $13.6 million for GES.
|
|
•
|
Our debt principal payments (net) totaled $17.1 million for the fourth quarter and $22.3 million for the full year. We paid cash dividends on our
convertible preferred equity of approximately $2.0 million for the fourth quarter and $7.8 million for the full year.
|
|
•
|
Our total liquidity was $160.7 million, comprising cash and cash equivalents of $52.7 million and $108.0 million of capacity available on our revolving
credit facility ($170 million total facility size, less $57 million outstanding balance and $5 million in letters of credit) at the end of the year.
|
|
•
|
Our debt was $462.1 million, and our net leverage ratio was 2.6 at the end of the year.
|
2024 Outlook
Our guidance for Viad consolidated, Pursuit, and GES is as follows:
|
(in millions)
|
First Quarter
|
Full Year
|
|
|
Viad Consolidated
|
|||
|
Revenue
|
$260 to $284
|
Up high-single to
low-double digits
|
|
|
Adjusted EBITDA
|
$(0.5) to $7.5
|
$171 to $191
|
|
|
Cash flow from Operations
|
$5 to $15
|
$120 to $140
|
|
|
Capital Expenditures
|
$25 to $30
(including
growth capex of ~$10)
|
$65 to $70
(including
growth capex of ~$20)
|
|
|
Pursuit
|
|||
|
Revenue
|
$35 to $39
|
Up mid-single digits
|
|
|
Adjusted EBITDA
|
$(12) to $(8)
|
$105 to $115
|
|
|
Key Assumptions
|
• FlyOver Chicago opens in March 2024
• Strong demand for Pursuit’s iconic, unforgettable, inspiring experiences
• Continued growth of international leisure travel
|
||
-more-
-page 4-
|
(in millions)
|
First Quarter
|
Full Year
|
|
|
GES
|
|||
|
Revenue
|
$225 to $245
|
Up low-double digits
|
|
|
Adjusted EBITDA
|
$15 to $19
|
$80 to $90
|
|
|
Key Assumptions
|
• Major non-annual shows (~$65M of incremental revenue vs. 2023, primarily in the
third quarter)
• Strong demand for GES’ experiential marketing and exhibition management services
• Increased exhibition and event show sizes
|
||
Conference Call Details
Management will host a conference call to review fourth quarter and full year 2023
results on Thursday, February 8, 2024, at 5 p.m. (Eastern Time).
The conference call can be accessed with operator assistance by calling (404) 975-4839 or (833) 470-1428 and entering the access code 092660.
To avoid wait time and bypass speaking with an operator to join the call, participants can
pre-register using the following registration link: https://www.netroadshow.com/events/login?show=0de1640f&confId=59653.
After registering, a calendar invitation will be sent that includes dial-in information as well as unique codes for entry into the live call. We recommend that you register in advance to ensure access for the full call.
A live audio webcast of the call will also be available in listen-only mode through the “Investors” section of our website. A replay of the webcast will be available on our website shortly after the call and, for a
limited time, by calling (929) 458-6194 or (866) 813-9403 and entering the access code 706058.
Additionally, we posted a supplemental earnings presentation, containing our financial
results, trends and outlook, on the “Investors” section of our
website prior to the conference call. We will refer to this presentation during the call.
About Viad
Viad (NYSE: VVI), is a leading global provider of extraordinary experiences, including attractions, hospitality, exhibition management services, and experiential marketing through two businesses: Pursuit
and GES. Our business strategy focuses on delivering extraordinary experiences for our teams, clients and guests, and significant and sustainable growth and above-market returns for our shareholders. Viad is an S&P SmallCap 600 company.
Pursuit is a global attractions and hospitality company that owns and operates a
collection of inspiring and unforgettable experiences in iconic destinations. Pursuit’s elevated hospitality experiences enable visitors to discover and connect with world-class attractions, distinctive lodges, and engaging tours in stunning
national parks and renowned global travel locations, in addition to experiencing our collection of Flyover Attractions in the vibrant cities of Vancouver, Reykjavik, Las Vegas, and Chicago (opening March 2024).
GES is a global exhibition management and experiential marketing company offering a
comprehensive range of services to the world’s leading event organizers and brands through two reportable segments, GES Exhibitions and Spiro. GES Exhibitions is a global exhibition and trade show management business that partners with
leading exhibition and conference organizers as a full-service provider of strategic and logistics solutions to manage the complexity of their shows with teams throughout North America, Europe, and the Middle East. Spiro is a global
experiential marketing agency that partners with leading brands around the world to manage and elevate their experiential marketing activities, bonding brand and customer.
-more-
-page 5-
For more information, visit www.viad.com.
Forward-Looking Statements
This press release contains a number of forward-looking statements. Words, and
variations of words, such as “will,” “may,” “expect,” “would,” “could,” “might,” “intend,” “plan,” “believe,” “estimate,” “anticipate,” “deliver,” “seek,” “aim,” “potential,” “target,” “outlook,” and similar expressions are intended to
identify our forward-looking statements. Similarly, statements that describe our business strategy, outlook, objectives, plans, intentions, or goals also are forward-looking statements. These forward-looking statements are not historical
facts and are subject to a host of risks and uncertainties, many of which are beyond our control, which could cause actual results to differ materially from those in the forward-looking statements.
Important factors that could cause actual results to differ materially from those
described in our forward-looking statements include, but are not limited to, the following:
|
•
|
general economic uncertainty in key global markets and a worsening of global economic conditions;
|
|
•
|
travel industry disruptions;
|
|
•
|
the impact of our overall level of indebtedness, as well as our financial covenants, on our operational and financial flexibility;
|
|
•
|
identified material weaknesses in our internal control over financial reporting;
|
|
•
|
seasonality of our businesses;
|
|
•
|
the impact of the COVID-19 pandemic on our financial condition, liquidity, and cash flow;
|
|
•
|
our ability to anticipate and adjust for new and emerging challenges presented by the ramifications of the COVID-19 pandemic on our
businesses;
|
|
•
|
unanticipated delays and cost overruns of our capital projects, and our ability to achieve established financial and strategic goals for
such projects;
|
|
•
|
our exposure to labor shortages, turnover, and labor cost increases;
|
|
•
|
the importance of key members of our account teams to our business relationships;
|
|
•
|
our ability to manage our business and continue our growth if we lose any of our key personnel;
|
|
•
|
the competitive nature of the industries in which we operate;
|
|
•
|
our dependence on large exhibition event clients;
|
|
•
|
adverse effects of show rotation on our periodic results and operating margins;
|
|
•
|
transportation disruptions and increases in transportation costs;
|
|
•
|
natural disasters, weather conditions, accidents, and other catastrophic events;
|
|
•
|
our exposure to labor cost increases and work stoppages related to unionized employees;
|
|
•
|
our multi-employer pension plan funding obligations;
|
|
•
|
our ability to successfully integrate and achieve established financial and strategic goals from acquisitions;
|
|
•
|
our exposure to cybersecurity attacks and threats;
|
|
•
|
our exposure to currency exchange rate fluctuations;
|
|
•
|
liabilities relating to prior and discontinued operations; and
|
|
•
|
compliance with laws governing the storage, collection, handling, and transfer of personal data and our exposure to legal claims and
fines for data breaches or improper handling of such data.
|
-more-
-page 6-
For a more complete discussion of the risks and uncertainties that may affect our
business or financial results, please see Item 1A, “Risk Factors,” of our most recent annual report on Form 10-K filed with the SEC. We disclaim and do not undertake any obligation to update or revise any forward-looking statement in this
press release except as required by applicable law or regulation.
Forward-Looking Non-GAAP Measures
The company has not quantitatively reconciled its guidance for adjusted EBITDA to its
respective most comparable GAAP financial measure because certain reconciling items that impact this metric, including provision for income taxes, interest expense, restructuring or impairment charges, acquisition-related costs, and
attraction start-up costs have not occurred, are out of the company’s control, or cannot be reasonably predicted. Accordingly, reconciliations to the nearest GAAP financial measure are not available without unreasonable effort. Please note
that the unavailable reconciling items could significantly impact the company’s results as reported under GAAP.
Contact
Carrie Long or Michelle Porhola
Investor Relations
(602) 207-2681
###
|
VIAD CORP AND SUBSIDIARIES
TABLE ONE - QUARTERLY AND FULL YEAR RESULTS
(UNAUDITED)
|
||||||||||||||||||||||||||||||||
|
Three months ended December 31,
|
Year ended December 31,
|
|||||||||||||||||||||||||||||||
|
(in thousands, except per share data)
|
2023
|
2022
|
$ Change
|
% Change
|
2023
|
2022
|
$ Change
|
% Change
|
||||||||||||||||||||||||
|
Revenue:
|
||||||||||||||||||||||||||||||||
|
Pursuit
|
$
|
42,208
|
$
|
34,148
|
$
|
8,060
|
23.6
|
%
|
$
|
350,285
|
$
|
299,327
|
$
|
50,958
|
17.0
|
%
|
||||||||||||||||
|
GES:
|
||||||||||||||||||||||||||||||||
|
Spiro
|
83,554
|
72,123
|
11,431
|
15.8
|
%
|
283,171
|
277,641
|
5,530
|
2.0
|
%
|
||||||||||||||||||||||
|
GES Exhibitions
|
168,272
|
143,577
|
24,695
|
17.2
|
%
|
614,418
|
557,880
|
56,538
|
10.1
|
%
|
||||||||||||||||||||||
|
Inter-segment eliminations
|
(2,355
|
)
|
(1,821
|
)
|
(534
|
)
|
-29.3
|
%
|
(9,194
|
)
|
(7,537
|
)
|
(1,657
|
)
|
-22.0
|
%
|
||||||||||||||||
|
Total GES
|
249,471
|
213,879
|
35,592
|
16.6
|
%
|
888,395
|
827,984
|
60,411
|
7.3
|
%
|
||||||||||||||||||||||
|
Total revenue
|
$
|
291,679
|
$
|
248,027
|
$
|
43,652
|
17.6
|
%
|
$
|
1,238,680
|
$
|
1,127,311
|
$
|
111,369
|
9.9
|
%
|
||||||||||||||||
|
Segment operating income (loss):
|
||||||||||||||||||||||||||||||||
|
Pursuit
|
$
|
(18,693
|
)
|
$
|
(20,091
|
)
|
$
|
1,398
|
7.0
|
%
|
$
|
53,381
|
$
|
24,031
|
$
|
29,350
|
** |
|
||||||||||||||
|
GES:
|
||||||||||||||||||||||||||||||||
|
Spiro
|
12,091
|
4,805
|
7,286
|
** |
|
23,723
|
23,133
|
590
|
2.6
|
%
|
||||||||||||||||||||||
|
GES Exhibitions
|
11,104
|
3,992
|
7,112
|
** |
|
31,339
|
21,780
|
9,559
|
43.9
|
%
|
||||||||||||||||||||||
|
Total GES
|
23,195
|
8,797
|
14,398
|
** |
|
55,062
|
44,913
|
10,149
|
22.6
|
%
|
||||||||||||||||||||||
|
Segment operating income (loss)
|
$
|
4,502
|
$
|
(11,294
|
)
|
$
|
15,796
|
** |
|
$
|
108,443
|
$
|
68,944
|
$
|
39,499
|
57.3
|
%
|
|||||||||||||||
|
Corporate eliminations
|
10
|
16
|
(6
|
)
|
-37.5
|
%
|
59
|
67
|
(8
|
)
|
-11.9
|
%
|
||||||||||||||||||||
|
Corporate activities
|
(3,785
|
)
|
(3,537
|
)
|
(248
|
)
|
-7.0
|
%
|
(14,040
|
)
|
(13,418
|
)
|
(622
|
)
|
-4.6
|
%
|
||||||||||||||||
|
Gain on sale of ON Services (Note A)
|
-
|
19,637
|
(19,637
|
)
|
-100.0
|
%
|
(204
|
)
|
19,637
|
(19,841
|
)
|
** |
|
|||||||||||||||||||
|
Restructuring (charges) recoveries (Note B)
|
(49
|
)
|
408
|
(457
|
)
|
** |
|
(1,174
|
)
|
(3,059
|
)
|
1,885
|
61.6
|
%
|
||||||||||||||||||
|
Impairment charges
|
-
|
-
|
-
|
** |
|
-
|
(583
|
)
|
583
|
-100.0
|
%
|
|||||||||||||||||||||
|
Other expense, net
|
(500
|
)
|
(547
|
)
|
47
|
8.6
|
%
|
(2,033
|
)
|
(2,077
|
)
|
44
|
2.1
|
%
|
||||||||||||||||||
|
Net interest expense (Note C)
|
(10,897
|
)
|
(11,001
|
)
|
104
|
0.9
|
%
|
(47,978
|
)
|
(34,891
|
)
|
(13,087
|
)
|
-37.5
|
%
|
|||||||||||||||||
|
Income (loss) from continuing operations before income taxes
|
(10,719
|
)
|
(6,318
|
)
|
(4,401
|
)
|
-69.7
|
%
|
43,073
|
34,620
|
8,453
|
24.4
|
%
|
|||||||||||||||||||
|
Income tax expense (Note D)
|
(5,176
|
)
|
(386
|
)
|
(4,790
|
)
|
** |
|
(18,799
|
)
|
(9,973
|
)
|
(8,826
|
)
|
-88.5
|
%
|
||||||||||||||||
|
Income (loss) from continuing operations
|
(15,895
|
)
|
(6,704
|
)
|
(9,191
|
)
|
** |
|
24,274
|
24,647
|
(373
|
)
|
-1.5
|
%
|
||||||||||||||||||
|
Income (loss) from discontinued operations (Note E)
|
33
|
(137
|
)
|
170
|
** |
|
(822
|
)
|
148
|
(970
|
)
|
** |
|
|||||||||||||||||||
|
Net income (loss)
|
(15,862
|
)
|
(6,841
|
)
|
(9,021
|
)
|
** |
|
23,452
|
24,795
|
(1,343
|
)
|
-5.4
|
%
|
||||||||||||||||||
|
Net (income) loss attributable to noncontrolling interest
|
385
|
708
|
(323
|
)
|
-45.6
|
%
|
(7,836
|
)
|
(2,323
|
)
|
(5,513
|
)
|
** |
|
||||||||||||||||||
|
Net loss attributable to redeemable noncontrolling interest
|
131
|
394
|
(263
|
)
|
-66.8
|
%
|
401
|
748
|
(347
|
)
|
-46.4
|
%
|
||||||||||||||||||||
|
Net income (loss) attributable to Viad
|
$
|
(15,346
|
)
|
$
|
(5,739
|
)
|
$
|
(9,607
|
)
|
** |
|
$
|
16,017
|
$
|
23,220
|
$
|
(7,203
|
)
|
-31.0
|
%
|
||||||||||||
|
Amounts Attributable to Viad:
|
||||||||||||||||||||||||||||||||
|
Income (loss) from continuing operations
|
$
|
(15,379
|
)
|
$
|
(5,602
|
)
|
$
|
(9,777
|
)
|
** |
|
$
|
16,839
|
$
|
23,072
|
$
|
(6,233
|
)
|
-27.0
|
%
|
||||||||||||
|
Income (loss) from discontinued operations (Note E)
|
33
|
(137
|
)
|
170
|
** |
|
(822
|
)
|
148
|
(970
|
)
|
** |
|
|||||||||||||||||||
|
Net income (loss)
|
$
|
(15,346
|
)
|
$
|
(5,739
|
)
|
$
|
(9,607
|
)
|
** |
|
$
|
16,017
|
$
|
23,220
|
$
|
(7,203
|
)
|
-31.0
|
%
|
||||||||||||
|
Income (loss) per common share attributable to Viad (Note F):
|
||||||||||||||||||||||||||||||||
|
Basic income (loss) per common share
|
$
|
(0.83
|
)
|
$
|
(0.37
|
)
|
$
|
(0.46
|
)
|
** |
|
$
|
0.30
|
$
|
0.54
|
$
|
(0.24
|
)
|
-44.4
|
%
|
||||||||||||
|
Diluted income (loss) per common share
|
$
|
(0.83
|
)
|
$
|
(0.37
|
)
|
$
|
(0.46
|
)
|
** |
|
$
|
0.30
|
$
|
0.53
|
$
|
(0.23
|
)
|
-43.4
|
%
|
||||||||||||
|
Weighted-average common shares outstanding:
|
||||||||||||||||||||||||||||||||
|
Basic weighted-average outstanding common shares
|
20,942
|
20,656
|
286
|
1.4
|
%
|
20,855
|
20,589
|
266
|
1.3
|
%
|
||||||||||||||||||||||
|
Additional dilutive shares related to share-based compensation
|
-
|
-
|
-
|
** |
|
242
|
223
|
19
|
8.5
|
%
|
||||||||||||||||||||||
|
Diluted weighted-average outstanding common shares
|
20,942
|
20,656
|
286
|
1.4
|
%
|
21,097
|
20,812
|
285
|
1.4
|
%
|
||||||||||||||||||||||
|
Adjusted EBITDA* by Reportable Segment:
|
||||||||||||||||||||||||||||||||
|
Pursuit
|
$
|
(8,332
|
)
|
$
|
(11,251
|
)
|
$
|
2,919
|
25.9
|
%
|
$
|
92,623
|
$
|
67,949
|
$
|
24,674
|
36.3
|
%
|
||||||||||||||
|
GES:
|
||||||||||||||||||||||||||||||||
|
Spiro
|
12,451
|
5,795
|
6,656
|
** |
|
25,903
|
26,975
|
(1,072
|
)
|
-4.0
|
%
|
|||||||||||||||||||||
|
GES Exhibitions
|
14,140
|
6,926
|
7,214
|
** |
|
42,273
|
34,282
|
7,991
|
23.3
|
%
|
||||||||||||||||||||||
|
Total GES
|
26,591
|
12,721
|
13,870
|
** |
|
68,176
|
61,257
|
6,919
|
11.3
|
%
|
||||||||||||||||||||||
|
Corporate
|
(3,717
|
)
|
(3,476
|
)
|
(241
|
)
|
-6.9
|
%
|
(13,754
|
)
|
(13,089
|
)
|
(665
|
)
|
-5.1
|
%
|
||||||||||||||||
|
Consolidated Adjusted EBITDA
|
$
|
14,542
|
$
|
(2,006
|
)
|
$
|
16,548
|
** |
|
$
|
147,045
|
$
|
116,117
|
$
|
30,928
|
26.6
|
%
|
|||||||||||||||
|
As of December 31,
|
||||||||||||||||||||||||||||||||
|
Capitalization Data:
|
2023
|
2022
|
$ Change
|
% Change
|
||||||||||||||||||||||||||||
|
Cash and cash equivalents
|
$
|
52,704
|
$
|
59,719
|
$
|
(7,015
|
)
|
-11.7
|
%
|
|||||||||||||||||||||||
|
Total debt
|
462,128
|
481,792
|
(19,664
|
)
|
-4.1
|
%
|
||||||||||||||||||||||||||
|
Viad shareholders' equity
|
41,392
|
14,530
|
26,862
|
** |
|
|||||||||||||||||||||||||||
|
Non-controlling interests (redeemable and non-redeemable)
|
93,921
|
87,266
|
6,655
|
7.6
|
%
|
|||||||||||||||||||||||||||
|
Convertible Series A Preferred Stock (Note G):
|
||||||||||||||||||||||||||||||||
|
Convertible preferred stock (including accumulated dividends paid in kind)***
|
141,827
|
141,827
|
-
|
0.0
|
%
|
|||||||||||||||||||||||||||
|
Equivalent number of common shares
|
6,674
|
6,674
|
-
|
0.0
|
%
|
|||||||||||||||||||||||||||
|
* Refer to Table Two for a discussion and reconciliation of this non-GAAP financial measure to its most directly
comparable GAAP financial measure.
|
|
** Change is greater than +/- 100 percent
|
|
*** Amount shown excludes transaction costs, which are netted against the value of the preferred shares when presented on
Viad's balance sheet.
|
|
VIAD CORP AND SUBSIDIARIES
TABLE ONE - NOTES TO QUARTERLY AND FULL YEAR RESULTS
(UNAUDITED)
|
|
|
(A)
|
Gain on Sale of ON Services — On December 15, 2022, we completed the sale of substantially all of the assets of GES’
United States audio-visual production business, ON Services. We recognized a gain on sale of approximately $19.6 million.
|
|
(B)
|
Restructuring (Charges) Recoveries – Restructuring charges during the years ended 2023 and 2022 were primarily related
to our 2022 transformation and streamlining efforts at GES to significantly reduce costs and create a lower and more flexible cost structure focused on servicing our more profitable market segments.
|
|
(C)
|
Net Interest Expense – The increase in interest expense during the year ended 2023 relative to 2022 was primarily due to
higher interest rates in 2023.
|
|
(D)
|
Income Tax Expense – The effective tax rate was 43.6% for the year ended December 31, 2023 and 28.8% for the year ended
December 31, 2022. We generated higher income in 2023 than 2022 in our tax jurisdictions without a valuation allowance (VA) and were not able to recognize a benefit on losses in our jurisdictions with a VA. The effective tax
rate was negative 48.3% for the three months ended December 31, 2023 and 6.1% for the three months ended December 31, 2022. In the fourth quarter of 2023, we generated higher income in our tax jurisdictions without a VA than in
2022 and were not able to recognize a benefit on losses in our jurisdictions with a VA.
|
|
(E)
|
Income (Loss) from Discontinued Operations — The loss from discontinued operations during the year ended 2023 was
primarily due to legal matters related to previously sold operations.
|
|
(F)
|
Income (Loss) per Common Share — We apply the two-class method in calculating income (loss) per common share as
preferred stock and unvested share-based payment awards that contain nonforteitable rights to dividends are considered participating securities. Accordingly, such securities are included in the earnings allocation in calculating
income per share.
|
|
Diluted income (loss) per common share is calculated using the more dilutive of the two-class method or as-converted
method. The two-class method uses net income (loss) available to common stockholders and assumes conversion of all potential shares other than participating securities. The as-converted method uses net income (loss) available to
common shareholders and assumes conversion of all potential shares including participating securities. Dilutive potential common shares include outstanding stock options, unvested restricted share units and convertible preferred
stock.
|
|
|
Additionally, the adjustment to the carrying value of redeemable non-controlling interests is reflected in income (loss)
per common share.
|
|
|
The components of basic and diluted income (loss) per share are as follows:
|
|
|
Three months ended December 31,
|
Year ended December 31,
|
|||||||||||||||||||||||||||||||
|
(in thousands)
|
2023
|
2022
|
$ Change
|
% Change
|
2023
|
2022
|
$ Change
|
% Change
|
||||||||||||||||||||||||
|
Net income (loss) attributable to Viad
|
$
|
(15,346
|
)
|
$
|
(5,739
|
)
|
$
|
(9,607
|
)
|
** |
|
$
|
16,017
|
$
|
23,220
|
$
|
(7,203
|
)
|
-31.0
|
%
|
||||||||||||
|
Convertible preferred stock dividends paid in cash
|
(1,950
|
)
|
(1,950
|
)
|
-
|
0.0
|
%
|
(7,801
|
)
|
(7,801
|
)
|
-
|
0.0
|
%
|
||||||||||||||||||
|
Adjustment to the redemption value of redeemable noncontrolling interest
|
-
|
-
|
-
|
** |
|
-
|
(763
|
)
|
763
|
-100.0
|
%
|
|||||||||||||||||||||
|
Undistributed income (loss) attributable to Viad
|
(17,296
|
)
|
(7,689
|
)
|
(9,607
|
)
|
** |
|
8,216
|
14,656
|
(6,440
|
)
|
-43.9
|
%
|
||||||||||||||||||
|
Less: Allocation to participating securities
|
-
|
-
|
-
|
** |
|
(1,993
|
)
|
(3,600
|
)
|
1,607
|
44.6
|
%
|
||||||||||||||||||||
|
Net income (loss) allocated to Viad common shareholders (basic)
|
$
|
(17,296
|
)
|
$
|
(7,689
|
)
|
$
|
(9,607
|
)
|
** |
|
$
|
6,223
|
$
|
11,056
|
$
|
(4,833
|
)
|
-43.7
|
%
|
||||||||||||
|
Add: Allocation to participating securities
|
-
|
-
|
-
|
** |
|
18
|
30
|
-
|
-40.0
|
%
|
||||||||||||||||||||||
|
Net income (loss) allocated to Viad common shareholders (diluted)
|
$
|
(17,296
|
)
|
$
|
(7,689
|
)
|
$
|
(9,607
|
)
|
** |
|
$
|
6,241
|
$
|
11,086
|
$
|
(4,833
|
)
|
-43.7
|
%
|
||||||||||||
|
Basic weighted-average outstanding common shares
|
20,942
|
20,656
|
286
|
1.4
|
%
|
20,855
|
20,589
|
266
|
1.3
|
%
|
||||||||||||||||||||||
|
Additional dilutive shares related to share-based compensation
|
-
|
-
|
-
|
** |
|
242
|
223
|
19
|
8.5
|
%
|
||||||||||||||||||||||
|
Diluted weighted-average outstanding common shares
|
20,942
|
20,656
|
286
|
1.4
|
%
|
21,097
|
20,812
|
285
|
1.4
|
%
|
||||||||||||||||||||||
|
(G)
|
Convertible Series A Preferred Stock — On August 5, 2020, we entered into an Investment Agreement with funds managed by
private equity firm Crestview Partners, relating to the issuance of 135,000 shares of newly issued Convertible Series A Preferred Stock, par value $0.01 per share, for an aggregate purchase price of $135 million or $1,000 per
share. The Convertible Series A Preferred Stock carries a 5.5% cumulative quarterly dividend, which is payable in cash or in-kind at Viad’s option and is convertible into shares of our common stock at a conversion price of $21.25
per share.
|
|
VIAD CORP AND SUBSIDIARIES
TABLE TWO - NON-GAAP FINANCIAL MEASURES
(UNAUDITED)
|
|||||||||||||||||
|
IMPORTANT DISCLOSURES REGARDING NON-GAAP FINANCIAL MEASURES
|
|||||||||||||||||
|
This document includes the presentation of "Income (Loss) Before Other Items", "Adjusted EBITDA", "Segment Operating
Income (Loss)", and "Adjusted Segment Operating Income (Loss)", which are supplemental to results presented under accounting principles generally accepted in the United States of America (“GAAP”) and may not be comparable to
similarly titled measures presented by other companies. These non-GAAP measures are utilized by management to facilitate period-to-period comparisons and analysis of Viad’s operating performance and should be considered in addition
to, but not as substitutes for, other similar measures reported in accordance with GAAP. The use of these non-GAAP financial measures is limited, compared to the GAAP measure of net income attributable to Viad, because they do not
consider a variety of items affecting Viad’s consolidated financial performance as reconciled below. Because these non-GAAP measures do not consider all items affecting Viad’s consolidated financial performance, a user of Viad’s
financial information should consider net income attributable to Viad as an important measure of financial performance because it provides a more complete measure of the Company’s performance.
|
|||||||||||||||||
|
Income (Loss) Before Other Items, Segment Operating Income (Loss), and Adjusted Segment Operating Income (Loss) are
considered useful operating metrics, in addition to net income attributable to Viad, as potential variations arising from non-operational expenses/income are eliminated, thus resulting in additional measures considered to be
indicative of Viad’s performance. Management believes that the presentation of Adjusted EBITDA provides useful information to investors regarding Viad’s results of operations for trending, analyzing and benchmarking the performance
and value of Viad’s business. Management also believes that the presentation of Adjusted EBITDA for acquisitions and other major capital projects enables investors to assess how effectively management is investing capital into major
corporate development projects, both from a valuation and return perspective.
|
|
Three months ended December 31,
|
Year ended December 31,
|
|||||||||||||||||||||||||||||||
|
(in thousands, except per share data)
|
2023
|
2022
|
$ Change
|
% Change
|
2023
|
2022
|
$ Change
|
% Change
|
||||||||||||||||||||||||
|
Net income (loss) before other items (adjusted net income (loss)):
|
||||||||||||||||||||||||||||||||
|
Net income (loss) attributable to Viad
|
$
|
(15,346
|
)
|
$
|
(5,739
|
)
|
$
|
(9,607
|
)
|
** |
|
$
|
16,017
|
$
|
23,220
|
$
|
(7,203
|
)
|
-31.0
|
%
|
||||||||||||
|
(Income) loss from discontinued operations attributable to Viad
|
(33
|
)
|
137
|
(170
|
)
|
** |
|
822
|
(148
|
)
|
970
|
** |
|
|||||||||||||||||||
|
Income (loss) from continuing operations attributable to Viad
|
(15,379
|
)
|
(5,602
|
)
|
(9,777
|
)
|
** |
|
16,839
|
23,072
|
(6,233
|
)
|
-27.0
|
%
|
||||||||||||||||||
|
Gain on sale of ON Services, pre-tax
|
-
|
(19,637
|
)
|
19,637
|
-100.0
|
%
|
204
|
(19,637
|
)
|
19,841
|
** |
|
||||||||||||||||||||
|
Restructuring charges (recoveries), pre-tax
|
49
|
(408
|
)
|
457
|
** |
|
1,174
|
3,059
|
(1,885
|
)
|
-61.6
|
%
|
||||||||||||||||||||
|
Impairment charges, pre-tax
|
-
|
-
|
-
|
** |
|
-
|
583
|
(583
|
)
|
-100.0
|
%
|
|||||||||||||||||||||
|
Acquisition-related costs and other non-recurring expenses, pre-tax (Note A)
|
1,002
|
572
|
430
|
75.2
|
%
|
3,237
|
3,884
|
(647
|
)
|
-16.7
|
%
|
|||||||||||||||||||||
|
Remeasurement of finance lease obligation attributable to Viad, pre-tax (Note B)
|
(267
|
)
|
(410
|
)
|
143
|
34.9
|
%
|
(865
|
)
|
2,120
|
(2,985
|
)
|
** |
|
||||||||||||||||||
|
Tax expense (benefit) on above items
|
20
|
16
|
4
|
25.0
|
%
|
113
|
(755
|
)
|
868
|
** |
|
|||||||||||||||||||||
|
Favorable tax matters
|
-
|
-
|
-
|
** |
|
(2,103
|
)
|
-
|
(2,103
|
)
|
** |
|
||||||||||||||||||||
|
Net income (loss) before other items (adjusted net income (loss))
|
$
|
(14,575
|
)
|
$
|
(25,469
|
)
|
$
|
10,894
|
42.8
|
%
|
$
|
18,599
|
$
|
12,326
|
$
|
6,273
|
50.9
|
%
|
||||||||||||||
|
The components of net income (loss) before other items per common share (adjusted diluted EPS) are as follows:
|
||||||||||||||||||||||||||||||||
|
Net income (loss) before other items (adjusted
net income (loss)) (as reconciled above)
|
$
|
(14,575
|
)
|
$
|
(25,469
|
)
|
$
|
10,894
|
42.8
|
%
|
$
|
18,599
|
$
|
12,326
|
$
|
6,273
|
50.9
|
%
|
||||||||||||||
|
Convertible preferred stock dividends paid in cash
|
(1,950
|
)
|
(1,950
|
)
|
-
|
0.0
|
%
|
(7,801
|
)
|
(7,801
|
)
|
-
|
0.0
|
%
|
||||||||||||||||||
|
Undistributed income (loss) before other items attributable to Viad (Note C)
|
(16,525
|
)
|
(27,419
|
)
|
10,894
|
39.7
|
%
|
10,798
|
4,525
|
6,273
|
** |
|
||||||||||||||||||||
|
Less: Allocation to participating securities (Note D)
|
-
|
-
|
-
|
** |
|
(2,596
|
)
|
(1,102
|
)
|
(1,494
|
)
|
** |
|
|||||||||||||||||||
|
Diluted income (loss) before other items allocated to Viad common shareholders
|
$
|
(16,525
|
)
|
$
|
(27,419
|
)
|
$
|
10,894
|
39.7
|
%
|
$
|
8,202
|
$
|
3,423
|
$
|
4,779
|
** |
|
||||||||||||||
|
Diluted weighted-average outstanding common shares
|
20,942
|
20,656
|
286
|
1.4
|
%
|
21,097
|
20,812
|
285
|
1.4
|
%
|
||||||||||||||||||||||
|
Income (loss) before other items per common share (adjusted diluted EPS)
|
$
|
(0.79
|
)
|
$
|
(1.33
|
)
|
$
|
0.54
|
40.6
|
%
|
$
|
0.39
|
$
|
0.16
|
$
|
0.23
|
** |
|
||||||||||||||
|
(A) Acquisition-related costs and other non-recurring expenses include:
|
||||||||||||||||||||||||||||||||
|
Three months ended December 31,
|
Year ended December 31,
|
|||||||||||||||||||||||||||||||
|
(in thousands)
|
2023
|
2022
|
2023
|
2022
|
||||||||||||||||||||||||||||
|
Acquisition integration costs - Pursuit1
|
$
|
-
|
$
|
101
|
$
|
30
|
$
|
237
|
||||||||||||||||||||||||
|
Acquisition transaction-related costs - Pursuit1
|
158
|
24
|
342
|
1,259
|
||||||||||||||||||||||||||||
|
Acquisition transaction-related costs - Corporate2
|
26
|
29
|
43
|
68
|
||||||||||||||||||||||||||||
|
Attraction start-up costs1, 3
|
814
|
418
|
2,723
|
2,169
|
||||||||||||||||||||||||||||
|
Other non-recurring expenses2, 4
|
4
|
-
|
99
|
151
|
||||||||||||||||||||||||||||
|
Acquisition-related and other non-recurring expenses, pre-tax
|
$
|
1,002
|
$
|
572
|
$
|
3,237
|
$
|
3,884
|
||||||||||||||||||||||||
|
1 Included in segment operating loss
|
|
|
2 Included in corporate activities
|
|
|
3 Includes costs related to the development of Pursuit's new FlyOver attractions in Chicago and Toronto, and
Forest Park Hotel in Canada.
|
|
|
4 Includes non-capitalizable fees and expenses related to Viad’s credit facility refinancing efforts.
|
|
(B)
|
Remeasurement of finance lease obligation attributable to Viad represents the non-cash foreign exchange loss/(gain)
included within Cost of Services related to the periodic remeasurement of the Sky Lagoon finance lease obligation that is attributed to Viad’s 51% interest in Sky Lagoon.
|
|
(C)
|
We exclude the adjustment to the redemption value of redeemable noncontrolling interest from the calculation of income
before other items per share as it is a non-cash adjustment that does not affect net income or loss attributable to Viad.
|
|
(D)
|
Preferred stock and unvested share-based payment awards that contain nonforteitable rights to dividends are considered
participating securities. Accordingly, such securities are included in the earnings allocation in calculating income (loss) before other items per common share unless the effect of such inclusion is anti-dilutive. The following
table provides the share data used for calculating the allocation to participating securities if applicable:
|
|
Three months ended December 31,
|
Year ended December 31,
|
|||||||||||||||||||||||||||||||
|
(in thousands)
|
2023
|
2022
|
2023
|
2022
|
||||||||||||||||||||||||||||
|
Weighted-average outstanding common shares
|
20,942
|
20,656
|
21,097
|
20,812
|
||||||||||||||||||||||||||||
|
Effect of participating convertible preferred shares (if applicable)
|
-
|
-
|
6,674
|
6,674
|
||||||||||||||||||||||||||||
|
Effect of participating non-vested shares (if applicable)
|
-
|
-
|
2
|
29
|
||||||||||||||||||||||||||||
|
Weighted-average shares including effect of participating interests (if applicable)
|
20,942
|
20,656
|
27,773
|
27,515
|
||||||||||||||||||||||||||||
|
** Change is greater than +/- 100 percent
|
|
VIAD CORP AND SUBSIDIARIES
TABLE TWO - NON-GAAP FINANCIAL MEASURES (CONTINUED)
(UNAUDITED)
|
||||||||||||||||||||||||||||||||
|
Three months ended December 31,
|
Year ended December 31,
|
|||||||||||||||||||||||||||||||
|
($ in thousands)
|
2023
|
2022
|
$ Change
|
% Change
|
2023
|
2022
|
$ Change
|
% Change
|
||||||||||||||||||||||||
|
Viad Consolidated:
|
||||||||||||||||||||||||||||||||
|
Revenue
|
$
|
291,679
|
$
|
248,027
|
$
|
43,652
|
17.6
|
%
|
$
|
1,238,680
|
$
|
1,127,311
|
$
|
111,369
|
9.9
|
%
|
||||||||||||||||
|
Net income (loss) attributable to Viad
|
$
|
(15,346
|
)
|
$
|
(5,739
|
)
|
$
|
(9,607
|
)
|
** |
|
$
|
16,017
|
$
|
23,220
|
$
|
(7,203
|
)
|
-31.0
|
%
|
||||||||||||
|
Net income (loss) attributable to noncontrolling interest
|
(385
|
)
|
(708
|
)
|
323
|
45.6
|
%
|
7,836
|
2,323
|
5,513
|
** |
|
||||||||||||||||||||
|
Net loss attributable to redeemable noncontrolling interest
|
(131
|
)
|
(394
|
)
|
263
|
66.8
|
%
|
(401
|
)
|
(748
|
)
|
347
|
46.4
|
%
|
||||||||||||||||||
|
(Income) loss from discontinued operations
|
(33
|
)
|
137
|
(170
|
)
|
** |
|
822
|
(148
|
)
|
970
|
** |
|
|||||||||||||||||||
|
Net interest expense
|
10,897
|
11,001
|
(104
|
)
|
-0.9
|
%
|
47,978
|
34,891
|
13,087
|
37.5
|
%
|
|||||||||||||||||||||
|
Income tax expense
|
5,176
|
386
|
4,790
|
** |
|
18,799
|
9,973
|
8,826
|
88.5
|
%
|
||||||||||||||||||||||
|
Depreciation and amortization
|
13,336
|
13,041
|
295
|
2.3
|
%
|
51,043
|
52,483
|
(1,440
|
)
|
-2.7
|
%
|
|||||||||||||||||||||
|
Gain on sale of ON Services
|
-
|
(19,637
|
)
|
19,637
|
-100.0
|
%
|
204
|
(19,637
|
)
|
19,841
|
** |
|
||||||||||||||||||||
|
Restructuring charges (recoveries)
|
49
|
(408
|
)
|
457
|
** |
|
1,174
|
3,059
|
(1,885
|
)
|
-61.6
|
%
|
||||||||||||||||||||
|
Impairment charges
|
-
|
-
|
-
|
** |
|
-
|
583
|
(583
|
)
|
-100.0
|
%
|
|||||||||||||||||||||
|
Other expense, net
|
500
|
547
|
(47
|
)
|
-8.6
|
%
|
2,033
|
2,077
|
(44
|
)
|
-2.1
|
%
|
||||||||||||||||||||
|
Start-up costs (A)
|
814
|
418
|
396
|
94.7
|
%
|
2,723
|
2,169
|
554
|
25.5
|
%
|
||||||||||||||||||||||
|
Acquisition transaction-related costs
|
184
|
53
|
131
|
** |
|
385
|
1,327
|
(942
|
)
|
-71.0
|
%
|
|||||||||||||||||||||
|
Integration costs
|
-
|
101
|
(101
|
)
|
-100.0
|
%
|
30
|
237
|
(207
|
)
|
-87.3
|
%
|
||||||||||||||||||||
|
Other non-recurring expenses
|
4
|
-
|
4
|
** |
|
99
|
151
|
(52
|
)
|
-34.4
|
%
|
|||||||||||||||||||||
|
Remeasurement of finance lease obligation (B)
|
(523
|
)
|
(804
|
)
|
281
|
35.0
|
%
|
(1,697
|
)
|
4,157
|
(5,854
|
)
|
** |
|
||||||||||||||||||
|
Consolidated Adjusted EBITDA
|
$
|
14,542
|
$
|
(2,006
|
)
|
$
|
16,548
|
** |
|
$
|
147,045
|
$
|
116,117
|
$
|
30,928
|
26.6
|
%
|
|||||||||||||||
|
Adjusted EBITDA attributable to noncontrolling interest
|
(1,131
|
)
|
(246
|
)
|
(885
|
)
|
** |
|
(15,904
|
)
|
(10,950
|
)
|
(4,954
|
)
|
-45.2
|
%
|
||||||||||||||||
|
Consolidated Adjusted EBITDA attributable to Viad
|
$
|
13,411
|
$
|
(2,252
|
)
|
$
|
15,663
|
** |
|
$
|
131,141
|
$
|
105,167
|
$
|
25,974
|
24.7
|
%
|
|||||||||||||||
|
Consolidated Adjusted EBITDA by Business:
|
||||||||||||||||||||||||||||||||
|
Pursuit
|
$
|
(8,332
|
)
|
$
|
(11,251
|
)
|
$
|
2,919
|
25.9
|
%
|
$
|
92,623
|
$
|
67,949
|
$
|
24,674
|
36.3
|
%
|
||||||||||||||
|
Total GES
|
26,591
|
12,721
|
13,870
|
** |
|
68,176
|
61,257
|
6,919
|
11.3
|
%
|
||||||||||||||||||||||
|
Total Segment EBITDA
|
18,259
|
1,470
|
16,789
|
** |
|
160,799
|
129,206
|
31,593
|
24.5
|
%
|
||||||||||||||||||||||
|
Corporate EBITDA
|
(3,717
|
)
|
(3,476
|
)
|
(241
|
)
|
-6.9
|
%
|
(13,754
|
)
|
(13,089
|
)
|
(665
|
)
|
-5.1
|
%
|
||||||||||||||||
|
Consolidated Adjusted EBITDA
|
$
|
14,542
|
$
|
(2,006
|
)
|
$
|
16,548
|
** |
|
$
|
147,045
|
$
|
116,117
|
$
|
30,928
|
26.6
|
%
|
|||||||||||||||
|
Pursuit Adjusted EBITDA:
|
||||||||||||||||||||||||||||||||
|
Revenue
|
$
|
42,208
|
$
|
34,148
|
$
|
8,060
|
23.6
|
%
|
$
|
350,285
|
$
|
299,327
|
$
|
50,958
|
17.0
|
%
|
||||||||||||||||
|
Cost of services and products
|
(60,901
|
)
|
(54,239
|
)
|
(6,662
|
)
|
-12.3
|
%
|
(296,904
|
)
|
(275,296
|
)
|
(21,608
|
)
|
-7.8
|
%
|
||||||||||||||||
|
Segment operating income (loss)
|
(18,693
|
)
|
(20,091
|
)
|
1,398
|
7.0
|
%
|
53,381
|
24,031
|
29,350
|
** |
|
||||||||||||||||||||
|
Depreciation
|
8,816
|
7,926
|
890
|
11.2
|
%
|
32,937
|
31,075
|
1,862
|
6.0
|
%
|
||||||||||||||||||||||
|
Amortization
|
1,096
|
1,175
|
(79
|
)
|
-6.7
|
%
|
4,907
|
5,021
|
(114
|
)
|
-2.3
|
%
|
||||||||||||||||||||
|
Start-up costs (A)
|
814
|
418
|
396
|
94.7
|
%
|
2,723
|
2,169
|
554
|
25.5
|
%
|
||||||||||||||||||||||
|
Acquisition transaction-related costs
|
158
|
24
|
134
|
** |
|
342
|
1,259
|
(917
|
)
|
-72.8
|
%
|
|||||||||||||||||||||
|
Integration costs
|
-
|
101
|
(101
|
)
|
-100.0
|
%
|
30
|
237
|
(207
|
)
|
-87.3
|
%
|
||||||||||||||||||||
|
Remeasurement of finance lease obligation (B)
|
(523
|
)
|
(804
|
)
|
281
|
35.0
|
%
|
(1,697
|
)
|
4,157
|
(5,854
|
)
|
** |
|
||||||||||||||||||
|
Adjusted EBITDA
|
$
|
(8,332
|
)
|
$
|
(11,251
|
)
|
$
|
2,919
|
25.9
|
%
|
$
|
92,623
|
$
|
67,949
|
$
|
24,674
|
36.3
|
%
|
||||||||||||||
|
Adjusted EBITDA attributable to noncontrolling interest
|
(1,131
|
)
|
(246
|
)
|
(885
|
)
|
** |
|
(15,904
|
)
|
(10,950
|
)
|
(4,954
|
)
|
-45.2
|
%
|
||||||||||||||||
|
Adjusted EBITDA attributable to Viad
|
$
|
(9,463
|
)
|
$
|
(11,497
|
)
|
$
|
2,034
|
17.7
|
%
|
$
|
76,719
|
$
|
56,999
|
$
|
19,720
|
34.6
|
%
|
||||||||||||||
|
Pursuit Operating margin
|
-44.3
|
%
|
-58.8
|
%
|
14.5
|
%
|
15.2
|
%
|
8.0
|
%
|
7.2
|
%
|
||||||||||||||||||||
|
Pursuit Adjusted EBITDA margin
|
-19.7
|
%
|
-32.9
|
%
|
13.2
|
%
|
26.4
|
%
|
22.7
|
%
|
3.7
|
%
|
||||||||||||||||||||
|
Total GES Adjusted EBITDA:
|
||||||||||||||||||||||||||||||||
|
Revenue
|
$
|
249,471
|
$
|
213,879
|
$
|
35,592
|
16.6
|
%
|
$
|
888,395
|
$
|
827,984
|
$
|
60,411
|
7.3
|
%
|
||||||||||||||||
|
Cost of services and products
|
(226,276
|
)
|
(205,082
|
)
|
(21,194
|
)
|
-10.3
|
%
|
(833,333
|
)
|
(783,071
|
)
|
(50,262
|
)
|
-6.4
|
%
|
||||||||||||||||
|
Segment operating income
|
23,195
|
8,797
|
14,398
|
** |
|
55,062
|
44,913
|
10,149
|
22.6
|
%
|
||||||||||||||||||||||
|
Depreciation
|
2,427
|
2,802
|
(375
|
)
|
-13.4
|
%
|
9,202
|
11,914
|
(2,712
|
)
|
-22.8
|
%
|
||||||||||||||||||||
|
Amortization
|
969
|
1,122
|
(153
|
)
|
-13.6
|
%
|
3,912
|
4,430
|
(518
|
)
|
-11.7
|
%
|
||||||||||||||||||||
|
Total GES Adjusted EBITDA
|
$
|
26,591
|
$
|
12,721
|
$
|
13,870
|
** |
|
$
|
68,176
|
$
|
61,257
|
$
|
6,919
|
11.3
|
%
|
||||||||||||||||
|
Total GES Operating margin
|
9.3
|
%
|
4.1
|
%
|
5.2
|
%
|
6.2
|
%
|
5.4
|
%
|
0.8
|
%
|
||||||||||||||||||||
|
Total GES Adjusted EBITDA margin
|
10.7
|
%
|
5.9
|
%
|
4.7
|
%
|
7.7
|
%
|
7.4
|
%
|
0.3
|
%
|
||||||||||||||||||||
|
GES Adjusted EBITDA by Reportable Segment:
|
||||||||||||||||||||||||||||||||
|
Spiro
|
$
|
12,451
|
$
|
5,795
|
$
|
6,656
|
** |
|
$
|
25,903
|
$
|
26,975
|
$
|
(1,072
|
)
|
-4.0
|
%
|
|||||||||||||||
|
GES Exhibitions
|
14,140
|
6,926
|
7,214
|
** |
|
42,273
|
34,282
|
7,991
|
23.3
|
%
|
||||||||||||||||||||||
|
Total GES
|
$
|
26,591
|
$
|
12,721
|
$
|
13,870
|
** |
|
$
|
68,176
|
$
|
61,257
|
$
|
6,919
|
11.3
|
%
|
||||||||||||||||
|
Spiro Revenue
|
$
|
83,554
|
$
|
72,123
|
$
|
11,431
|
15.8
|
%
|
$
|
283,171
|
$
|
277,641
|
$
|
5,530
|
2.0
|
%
|
||||||||||||||||
|
Spiro Adjusted EBITDA Margin
|
14.9
|
%
|
8.0
|
%
|
6.9
|
%
|
9.1
|
%
|
9.7
|
%
|
-0.6
|
%
|
||||||||||||||||||||
|
GES Exhibitions Revenue
|
$
|
168,272
|
$
|
143,577
|
$
|
24,695
|
17.2
|
%
|
$
|
614,418
|
$
|
557,880
|
$
|
56,538
|
10.1
|
%
|
||||||||||||||||
|
GES Exhibitions Adjusted EBITDA Margin
|
8.4
|
%
|
4.8
|
%
|
3.6
|
%
|
6.9
|
%
|
6.1
|
%
|
0.7
|
%
|
||||||||||||||||||||
|
(A) Includes costs related to the development of Pursuit's new FlyOver attractions in Chicago and Toronto, and Forest
Park Hotel in Canada.
|
||||||||||||||||||||||||||||||||
|
(B) Remeasurement of finance lease obligation represents the non-cash foreign exchange loss/(gain) included within Cost
of Services related to the periodic remeasurement of the Sky Lagoon finance lease obligation.
|
||||||||||||||||||||||||||||||||
| Exhibit 99.2 |