REI 8-K
Ring Energy, Inc. (REI)
UNITED STATES
SECURITIES AND EXCHANGE COMMISSION
Washington, D.C. 20549
| FORM
|
CURRENT REPORT
Pursuant to Section 13 or 15(d)
of the Securities Exchange Act of 1934
Date of Report :
(Date of earliest event reported)
| (Exact name of registrant as specified in its charter) |
(State or other jurisdiction of |
(Commission File Number) |
(IRS Employer Identification No.) |
(Address of principal executive offices) (Zip Code)
(
(Registrant’s telephone number, including area code)
Not Applicable.
(Former name or former address, if changed since last report)
Check the appropriate box below if the Form 8-K filing is intended to simultaneously satisfy the filing obligation of the registrant under any of the following provisions:
| Written communications pursuant to Rule 425 under the Securities Act (17 CFR 230.425) |
| Soliciting material pursuant to Rule 14a-12 under the Exchange Act (17 CFR 240.14a-12) |
| Pre-commencement communications pursuant to Rule 14d-2(b) under the Exchange Act (17 CFR 240.14d-2(b)) |
Pre-commencement communications pursuant to Rule 13e-4(c) under the Exchange Act (17 CFR 240.13e-4(c)) |
Securities registered pursuant to Section 12(b) of the Act:
| Title of each class | Trading Symbol(s) | Name of each exchange on which registered |
Indicate by check mark whether the registrant is an emerging growth company as defined in Rule 405 of the Securities Act of 1933 (§230.405 of this chapter) or Rule 12b-2 of the Securities Exchange Act of 1934 (§240.12b-2 of this chapter).
Emerging growth company
If an emerging growth company, indicate by check mark if the registrant has elected not to use the extended transition period for complying with any new or revised financial accounting standards provided pursuant to Section 13(a) of the Exchange Act. ¨
Item 2.02 Results of Operations and Financial Condition.
On August 9, 2021, Ring Energy, Inc. (the “Company”) issued a press release announcing its financial and operating results for the quarter ended June 30, 2021. A copy of the press release is furnished herewith as Exhibit 99.1.
The information in this Current Report on Form 8-K furnished pursuant to Item 2.02, including Exhibit 99.1, shall not be deemed to be “filed” for the purposes of Section 18 of the Securities Exchange Act of 1934, as amended (the “Exchange Act”), or otherwise subject to liability under that section, and they shall not be deemed incorporated by reference in any filing under the Securities Act of 1933, as amended, or the Exchange Act, except as shall be expressly set forth by specific reference in such filing.
Item 7.01 Regulation FD Disclosure.
On August 10, 2021, the Company posted to its website a company presentation (the “Presentation Materials”) that management intends to use from time to time. The Company may use the Presentation Materials, possibly with modifications, in presentations to current and potential investors, lenders, creditors, vendors, customers and others with an interest in the Company and its business.
The information contained in the Presentation Materials is summary information that should be considered in the context of the Company’s filings with the Securities and Exchange Commission and other public announcements that the Company may make by press release or otherwise from time to time. The Presentation Materials speak as of the date of this Current Report on Form 8-K. While the Company may elect to update the Presentation Materials in the future or reflect events and circumstances occurring or existing after the date of this Current Report on Form 8-K, the Company specifically disclaims any obligation to do so. The Presentation Materials are furnished herewith as Exhibit 99.2 to this Current Report on Form 8-K and are incorporated herein by reference.
The information in this Current Report on Form 8-K furnished pursuant to Item 7.01, including Exhibit 99.2, shall not be deemed to be “filed” for the purposes of Section 18 of the Exchange Act, or otherwise subject to liability under that section, and they shall not be deemed incorporated by reference in any filing under the Securities Act or the Exchange Act, except as shall be expressly set forth by specific reference in such filing. By filing this Current Report on Form 8-K and furnishing this information pursuant to Item 7.01, the Company makes no admission as to the materiality of any information in this Current Report on Form 8-K, including Exhibit 99.2, that is required to be disclosed solely by Regulation FD.
Item 9.01 Financial Statements and Exhibits.
(d) Exhibits.
The following exhibits are included with this Current Report on Form 8-K:
| Exhibit No. | Description | ||
| 99.1 | Press Release dated August 9, 2021. | ||
| 99.2 | Presentation Materials dated August 10, 2021. | ||
| 104 | Cover Page Interactive Data File (embedded within the Inline XBRL document). | ||
SIGNATURE
Pursuant to the requirements of the Securities Exchange Act of 1934, the registrant has duly caused this report to be signed on its behalf by the undersigned hereunto duly authorized.
|
RING ENERGY, INC. | |||
| Date: | August 12, 2021 | By: | /s/ Travis T. Thomas |
| Travis T. Thomas | |||
| Chief Financial Officer | |||
Exhibit 99.1

| FOR IMMEDIATE RELEASE | NYSE American – REI |
RING ENERGY
ANNOUNCES SECOND QUARTER 2021 RESULTS AND
INCREASED DRILLING PLANS FOR SECOND HALF 2021
~ Continued to Generate Free Cash Flow and Pay Down Debt in Q2 ~
The Woodlands, TX – August 9, 2021 – Ring Energy, Inc. (NYSE American: REI) (“Ring” or the “Company”) today reported operational and financial results for the second quarter 2021. In addition, the Company announced drilling plans for the second half of 2021 that include three or more wells in each of Ring’s Northwest Shelf (“NWS”) and the Central Basin Platform (“CBP”) areas.
Highlights and Recent Key Items
| · | Sold 8,709 barrels of oil equivalent per day (“Boe/d”), or 792,551 barrels of oil equivalent (“Boe”) (89% oil), in the second quarter of 2021, up 11% from the first quarter of 2021; |
| · | Reported a net loss of $15.9 million, or $0.16 per share, and Adjusted Net Income1 of $7.3 million, or $0.07 per share, in the second quarter of 2021; |
| · | Generated Adjusted EBITDA1 of $20.6 million for the second quarter of 2021; |
| o | Adjusted EBITDA for the first half of 2021 totaled $39.6 million; |
| · | Produced Net Cash Provided by Operating Activities of $16.3 million and Free Cash Flow1 of $5.6 million in the second quarter of 2021; |
| o | Net Cash Provided by Operating Activities and Free Cash Flow for the first six months of 2021 totaled $32.0 million and $8.6 million, respectively; |
| · | Further reduced debt on the Company’s revolving credit facility by $5.0 million during the second quarter 2021; |
| o | Reduced long-term debt by $12.5 million in the first half of 2021; |
| · | Successfully reaffirmed Ring’s borrowing base at $350 million, while easing the minimum required oil hedges for calendar 2022; |
1 A non-GAAP financial measure; see “Non-GAAP Information” section in this release for more information including reconciliations to the most comparable GAAP measures.
1
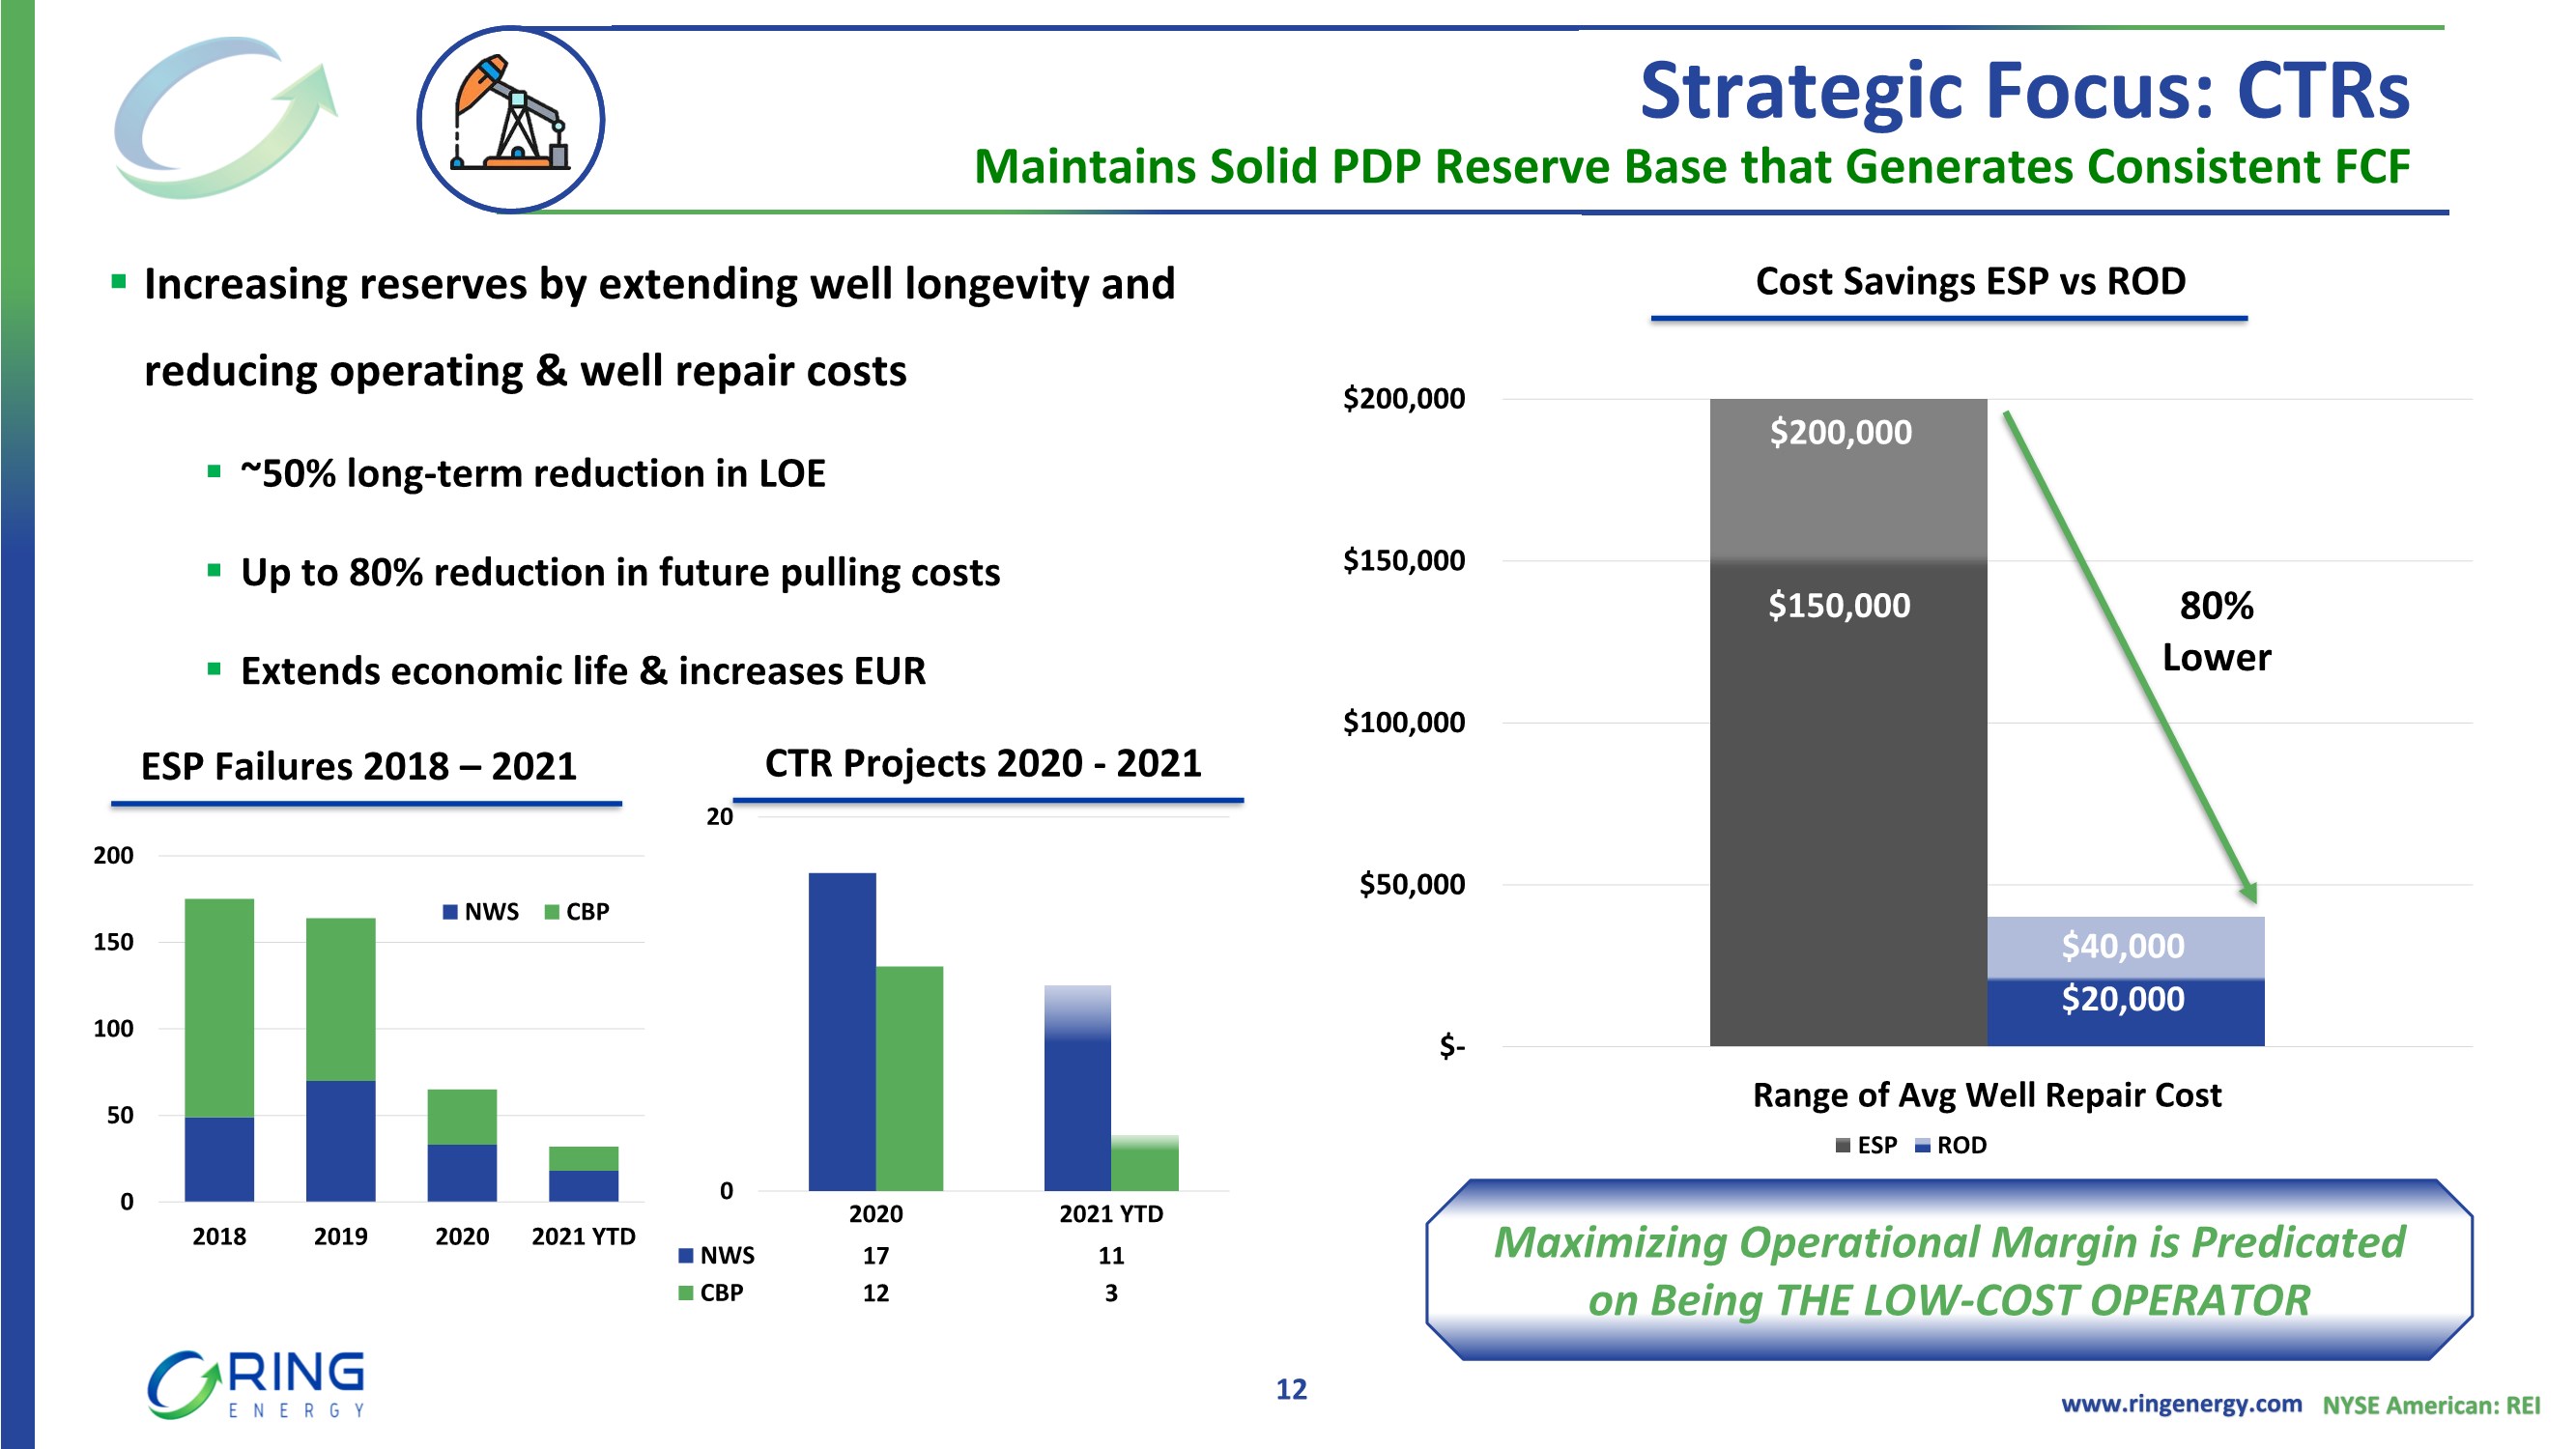
| · | Reduced future operating costs and costly workovers through the conversion of five wells from downhole electrical submersible pumps to rod pumps (“CTRs”) in the second quarter, including four in the NWS and one in the CBP; |
| o | Performed 14 CTRs in the first six months of 2021, including 11 in the NWS and three in the CBP; |
| · | Drilled, completed and placed on production all three Phase II wells (all in NWS and 74% working interest) by early June, on schedule and within budget. Production results to date are meeting or exceeding expectations; |
| · | Exchanged calendar 2021 calls for calendar 2022 swaps, thereby increasing the opportunity for near-term cash flow which will be used to accelerate debt repayment; and |
| · | In response to a higher crude oil price environment, the Company initiated a four-well Phase III drilling program in early August that will be followed by a Phase IV drilling program of two or more additional wells to begin early in the fourth quarter. |
Mr. Paul D. McKinney, Chairman of the Board and Chief Executive Officer, commented, “We were pleased with our overall results for the second quarter, including another period of generating free cash flow and further paying down long-term debt. Supporting our second quarter and 2021 year-to-date performance was a continued emphasis on driving operational efficiencies and the ongoing benefits afforded from our successful development program. Our targeted efforts have generated $39.6 million in Adjusted EBITDA in the first half of 2021, which allowed us to invest $26.0 million in capital expenditures and pay down $12.5 million in debt. Partially offsetting our solid results for the second quarter were certain unanticipated third-party facility processing and pipeline capacity constraints that affected our natural gas sales volumes. We also had lightning strike-related damage to several of our facilities in late May and early June that impacted oil sales volumes for the period, with repairs completed and related production brought back online by mid-July.”
“During the second quarter, all three wells included in our Phase II drilling program were placed online, within budget, and we have been pleased with their production results to date. When considering these results and that the economic returns of our Phase I and Phase II wells are being improved by current commodity prices, the Company approved an increase to its original drilling plans for the rest of the year. We picked up two rigs last week and initiated the drilling of the first two wells of a four-well Phase III drilling program. We intend to follow up these four wells with an additional two or more wells early in the fourth quarter, all of which target high rate-of-return drilling prospects in our NWS and CBP acreage. We anticipate the payback on invested capital in these wells to be approximately one year or less, which places us in a strong position as we enter 2022.”
2
“Supported by our strategic development efforts as an operator with proven expertise at lowering costs and increasing production efficiencies, we believe Ring is positioned for continued success. We also remain encouraged by the M&A prospects we are seeing in the marketplace and continue to actively evaluate potential accretive transactions that can add value for our shareholders. Over the longer term, we believe the ongoing successful execution of our internal and external efforts will continue to further differentiate Ring in the marketplace.”
For the second quarter of 2021, the Company reported a net loss of $15.9 million, or $0.16 per share, which included before tax adjustments of $22.8 million for a non-cash unrealized commodity derivative loss and $0.4 million for share-based compensation. Excluding the estimated after-tax impact of the adjustments, the Company’s Adjusted Net Income was $7.3 million, or $0.07 per share. In the first quarter of 2021, the Company reported a net loss of $19.1 million, or $0.19 per share, which included before tax adjustments of $25.7 million for a non-cash unrealized commodity derivative loss and $0.4 million for share-based compensation. Excluding the estimated after-tax impact of these adjustments, the Company’s Adjusted Net Income was $7.0 million, or $0.07 per share. In the second quarter of 2020, Ring reported a net loss of $135.0 million, or $1.99 per share, which included before tax adjustments of $147.9 million for a non-cash ceiling test impairment primarily due to lower oil pricing, $26.8 million for a non-cash unrealized commodity derivative loss and $1.3 million for share-based compensation. Excluding the estimated after-tax impact of these adjustments, Adjusted Net Income in the second quarter of 2020 was $1.5 million, or $0.02 per share.
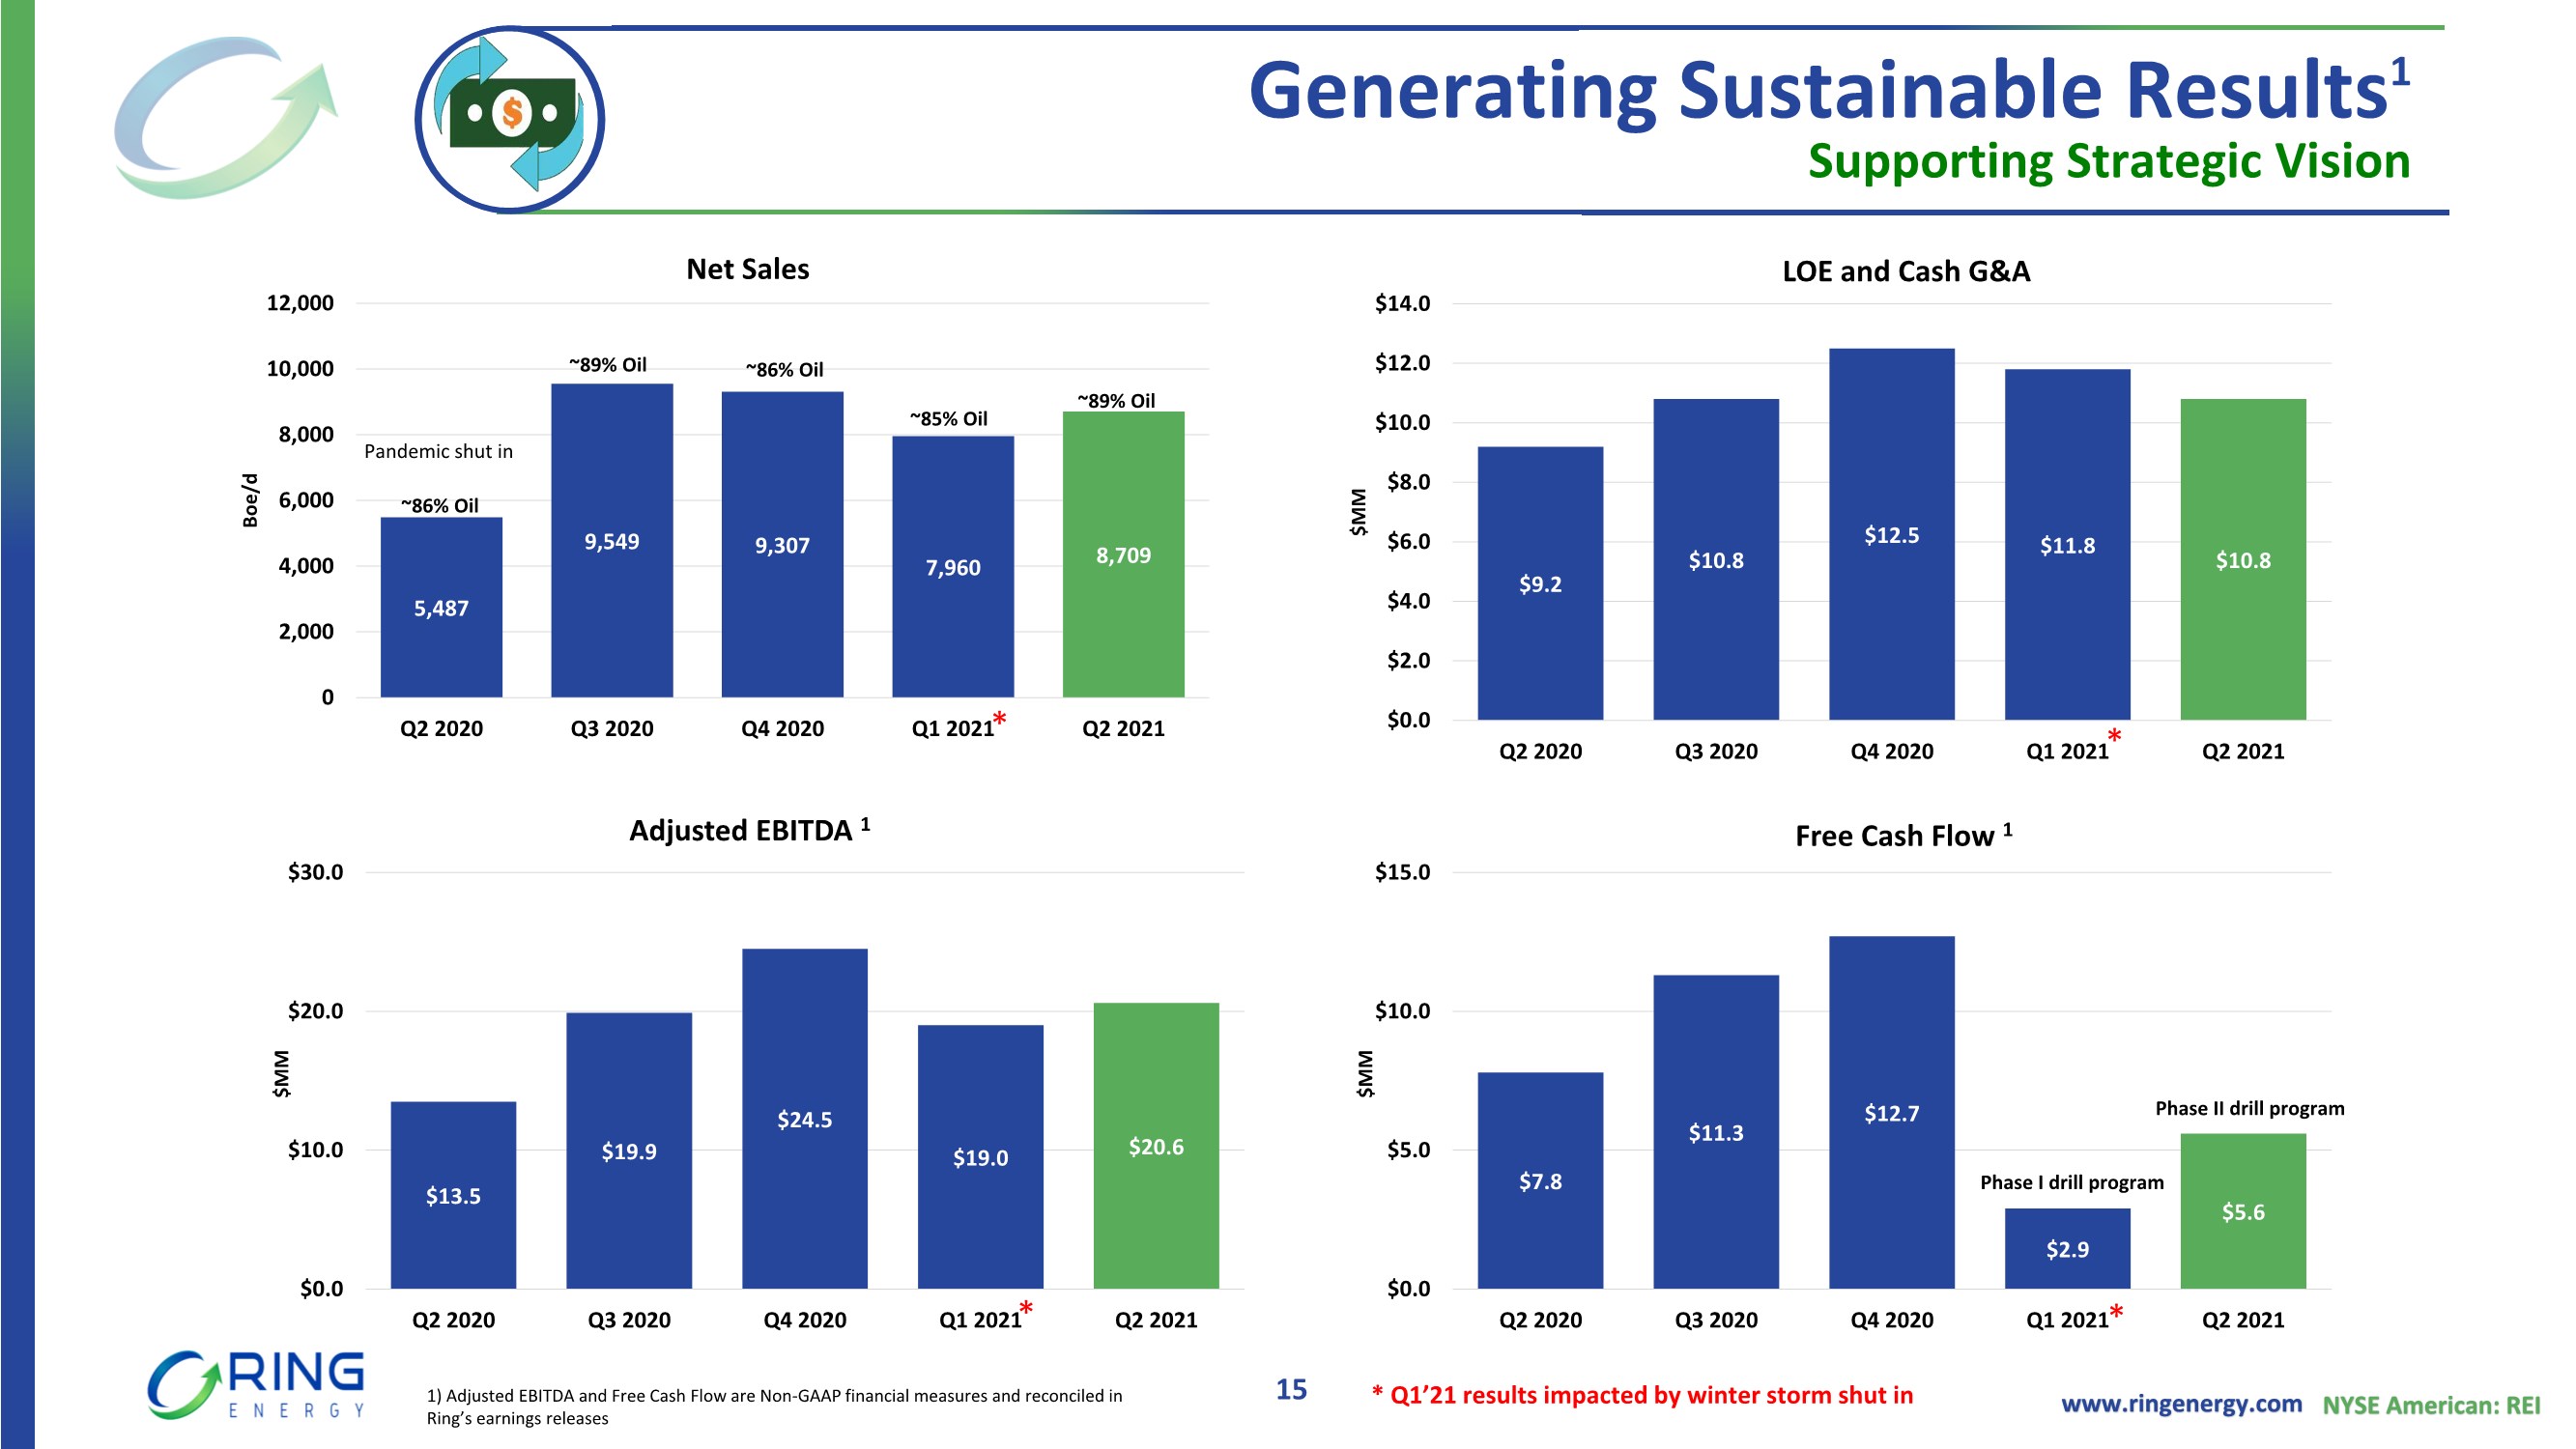
Adjusted EBITDA increased to $20.6 million for the second quarter of 2021 from $19.0 million in the first quarter of 2021 and $13.7 million in the second quarter of 2020. The increase in Adjusted EBITDA compared to both prior periods was primarily due to higher oil prices and sales volumes.
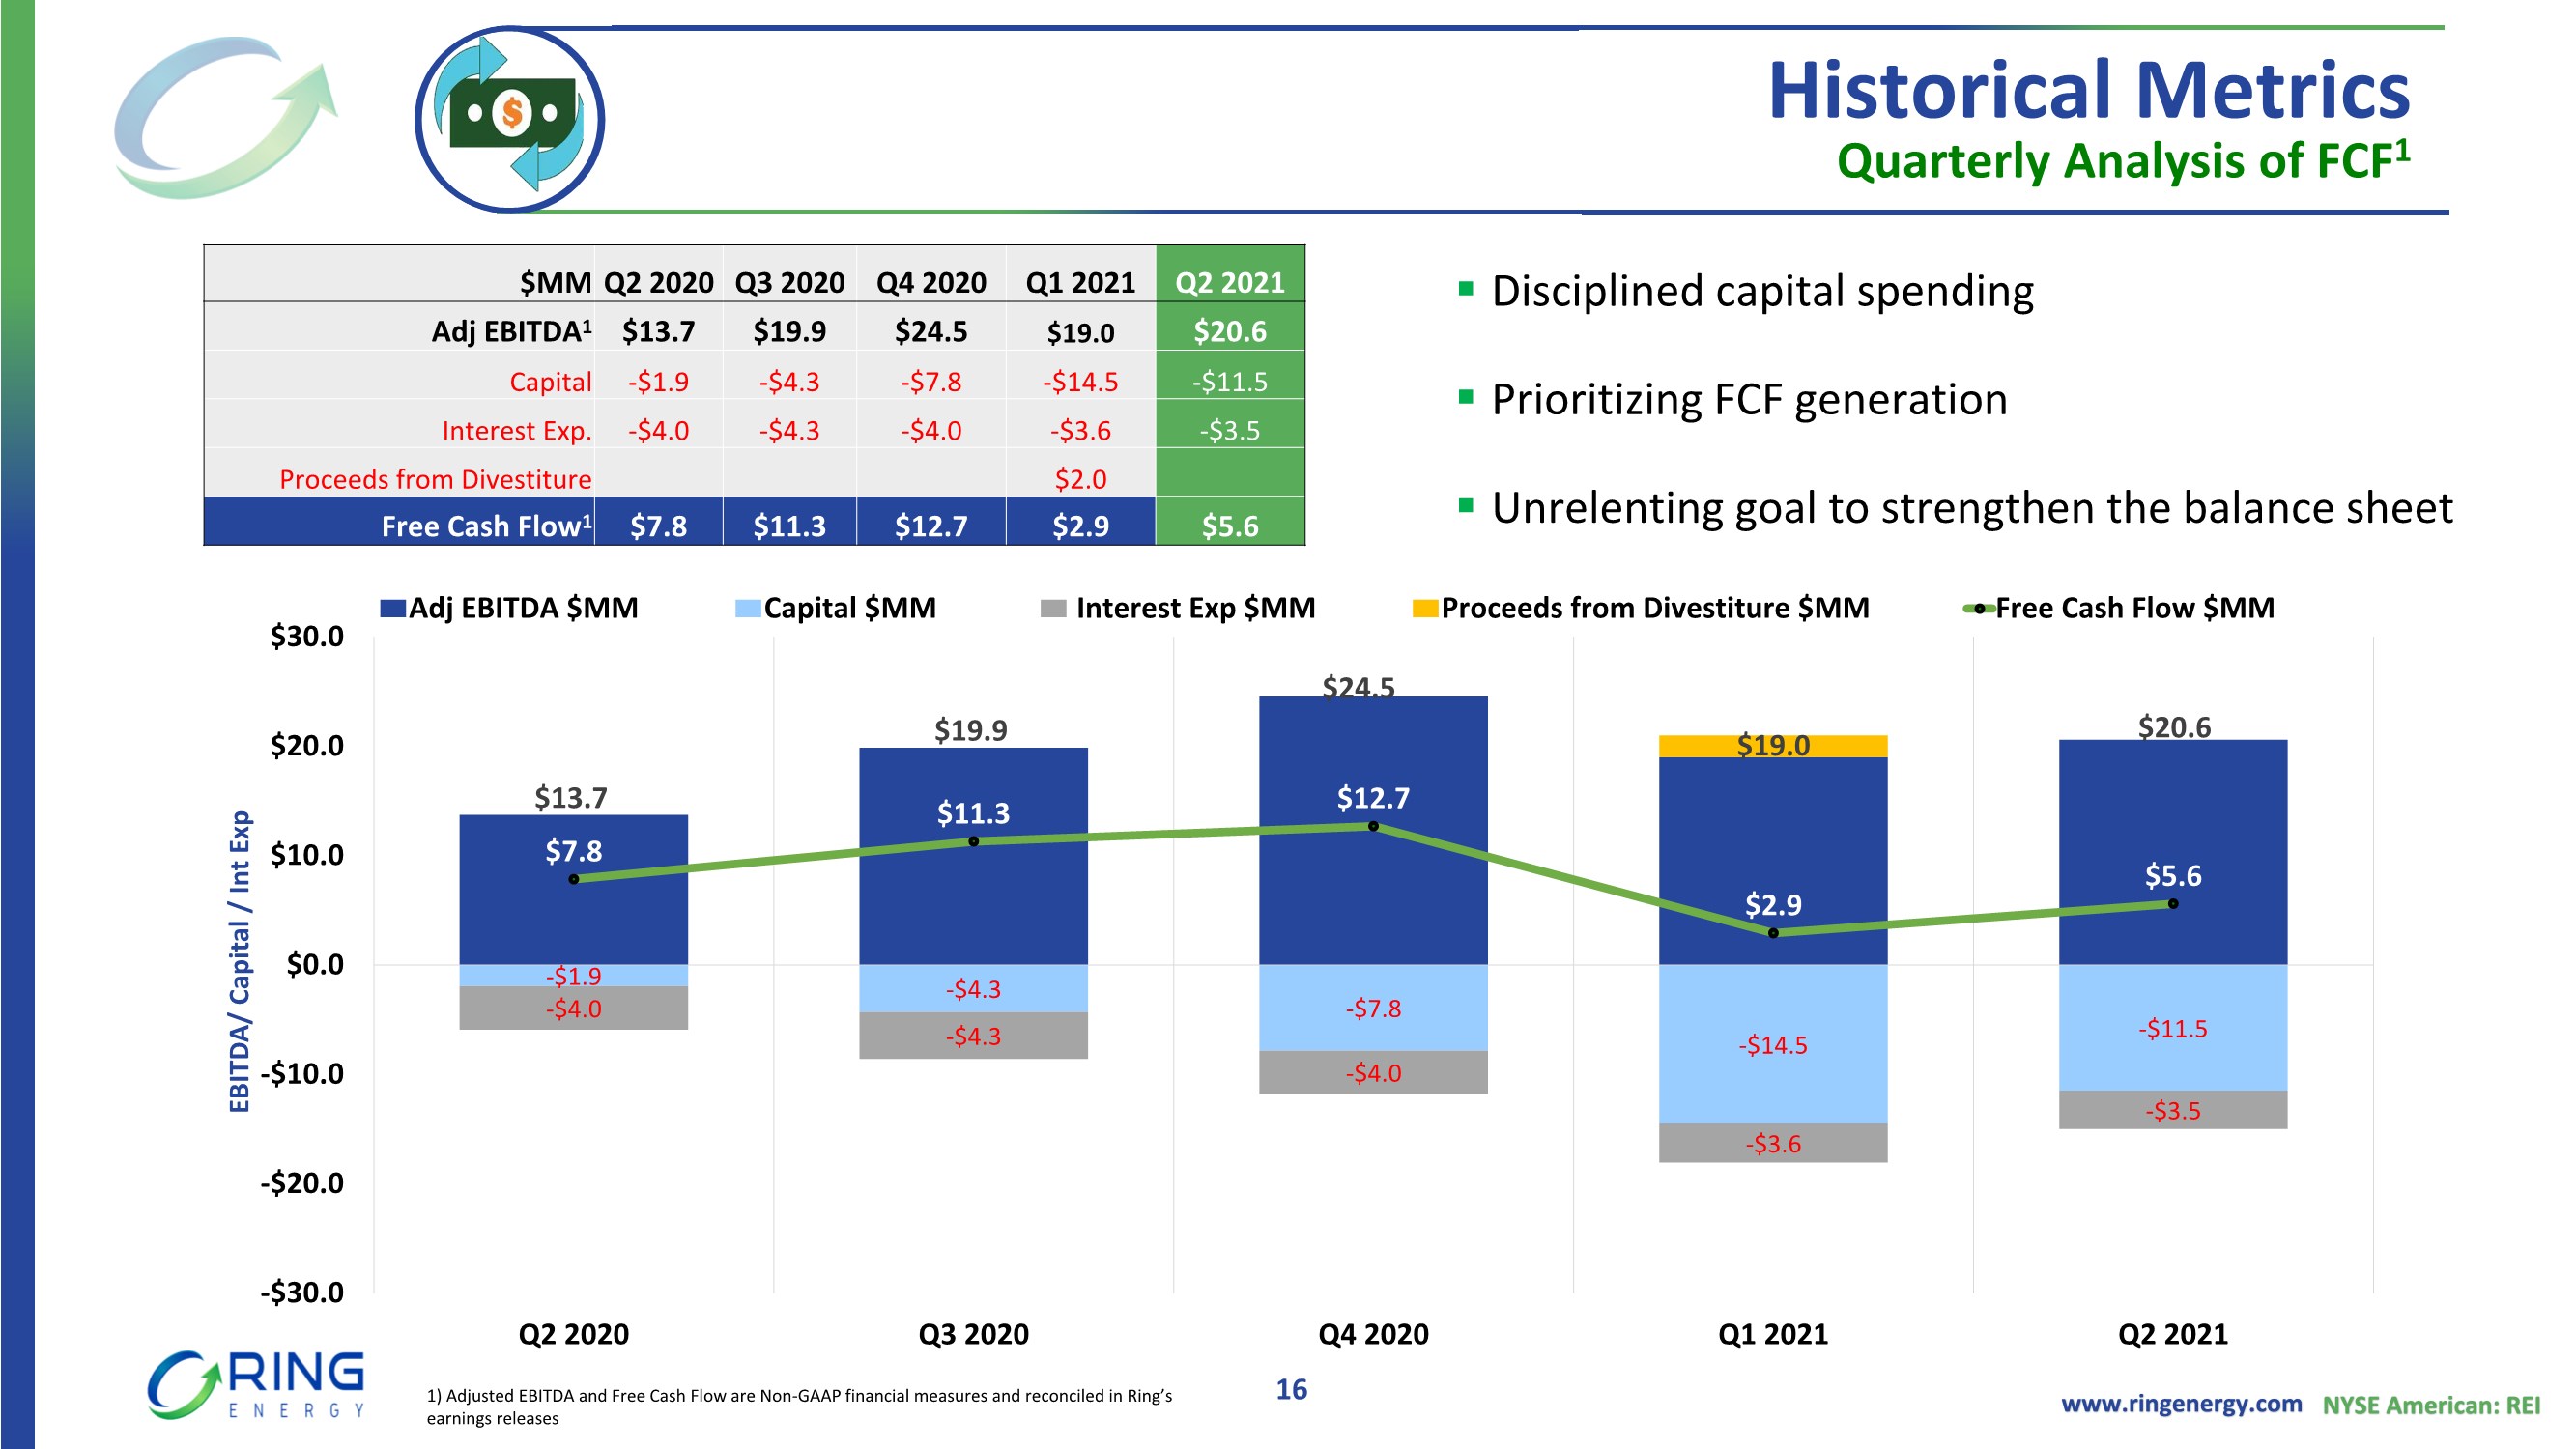
Free Cash Flow for the second quarter of 2021 increased to $5.6 million from $2.9 million in the first quarter of 2021 due to higher oil prices and sales volumes and lower capital expenditures. Second quarter 2021 Free Cash Flow decreased $2.2 million compared to $7.8 million for the second quarter of 2020 primarily driven by higher capital expenditures in 2021.
Adjusted Net Income, Adjusted EBITDA and Free Cash Flow are non-GAAP financial measures, which are described in more detail and reconciled to the most comparable GAAP measures, in the tables shown later in this release under “Non-GAAP Information.”
3
Sales Volumes, Prices and Revenues: Sales volumes for the second quarter of 2021 were 8,709 Boe/d (89% oil), or 792,551 Boe, an increase of 11% compared to 7,960 Boe/d (85% oil), or 716,422 Boe, for the first quarter of 2021, and an increase of 59% compared to 5,487 Boe/d (86% oil), or 499,333 Boe, in the second quarter of 2020. Second quarter 2021 sales volumes were comprised of 702,408 barrels (“Bbls”) of oil and 540,857 thousand cubic feet (“Mcf”) of natural gas.
Sales volumes for the second quarter of 2021 were positively impacted by the Company’s successful NWS Phase I and Phase II development programs. Partially offsetting the overall increase, a significant portion of the Company’s CBP gas sales volumes were reduced by the unexpected and ongoing disruption associated with the previously announced third-party gas processing facilities damaged during the February winter storm. Also impacting the second quarter was lower-than-anticipated NWS natural gas sales due to third-party upgrades to its processing facility and pipeline constraints that began in May and have continued into the third quarter. Lastly, the Company incurred additional deferred production in May and June due to lightning strikes that damaged Company equipment at two tank batteries. Repairs were completed and the associated production was brought back online in the middle of July.
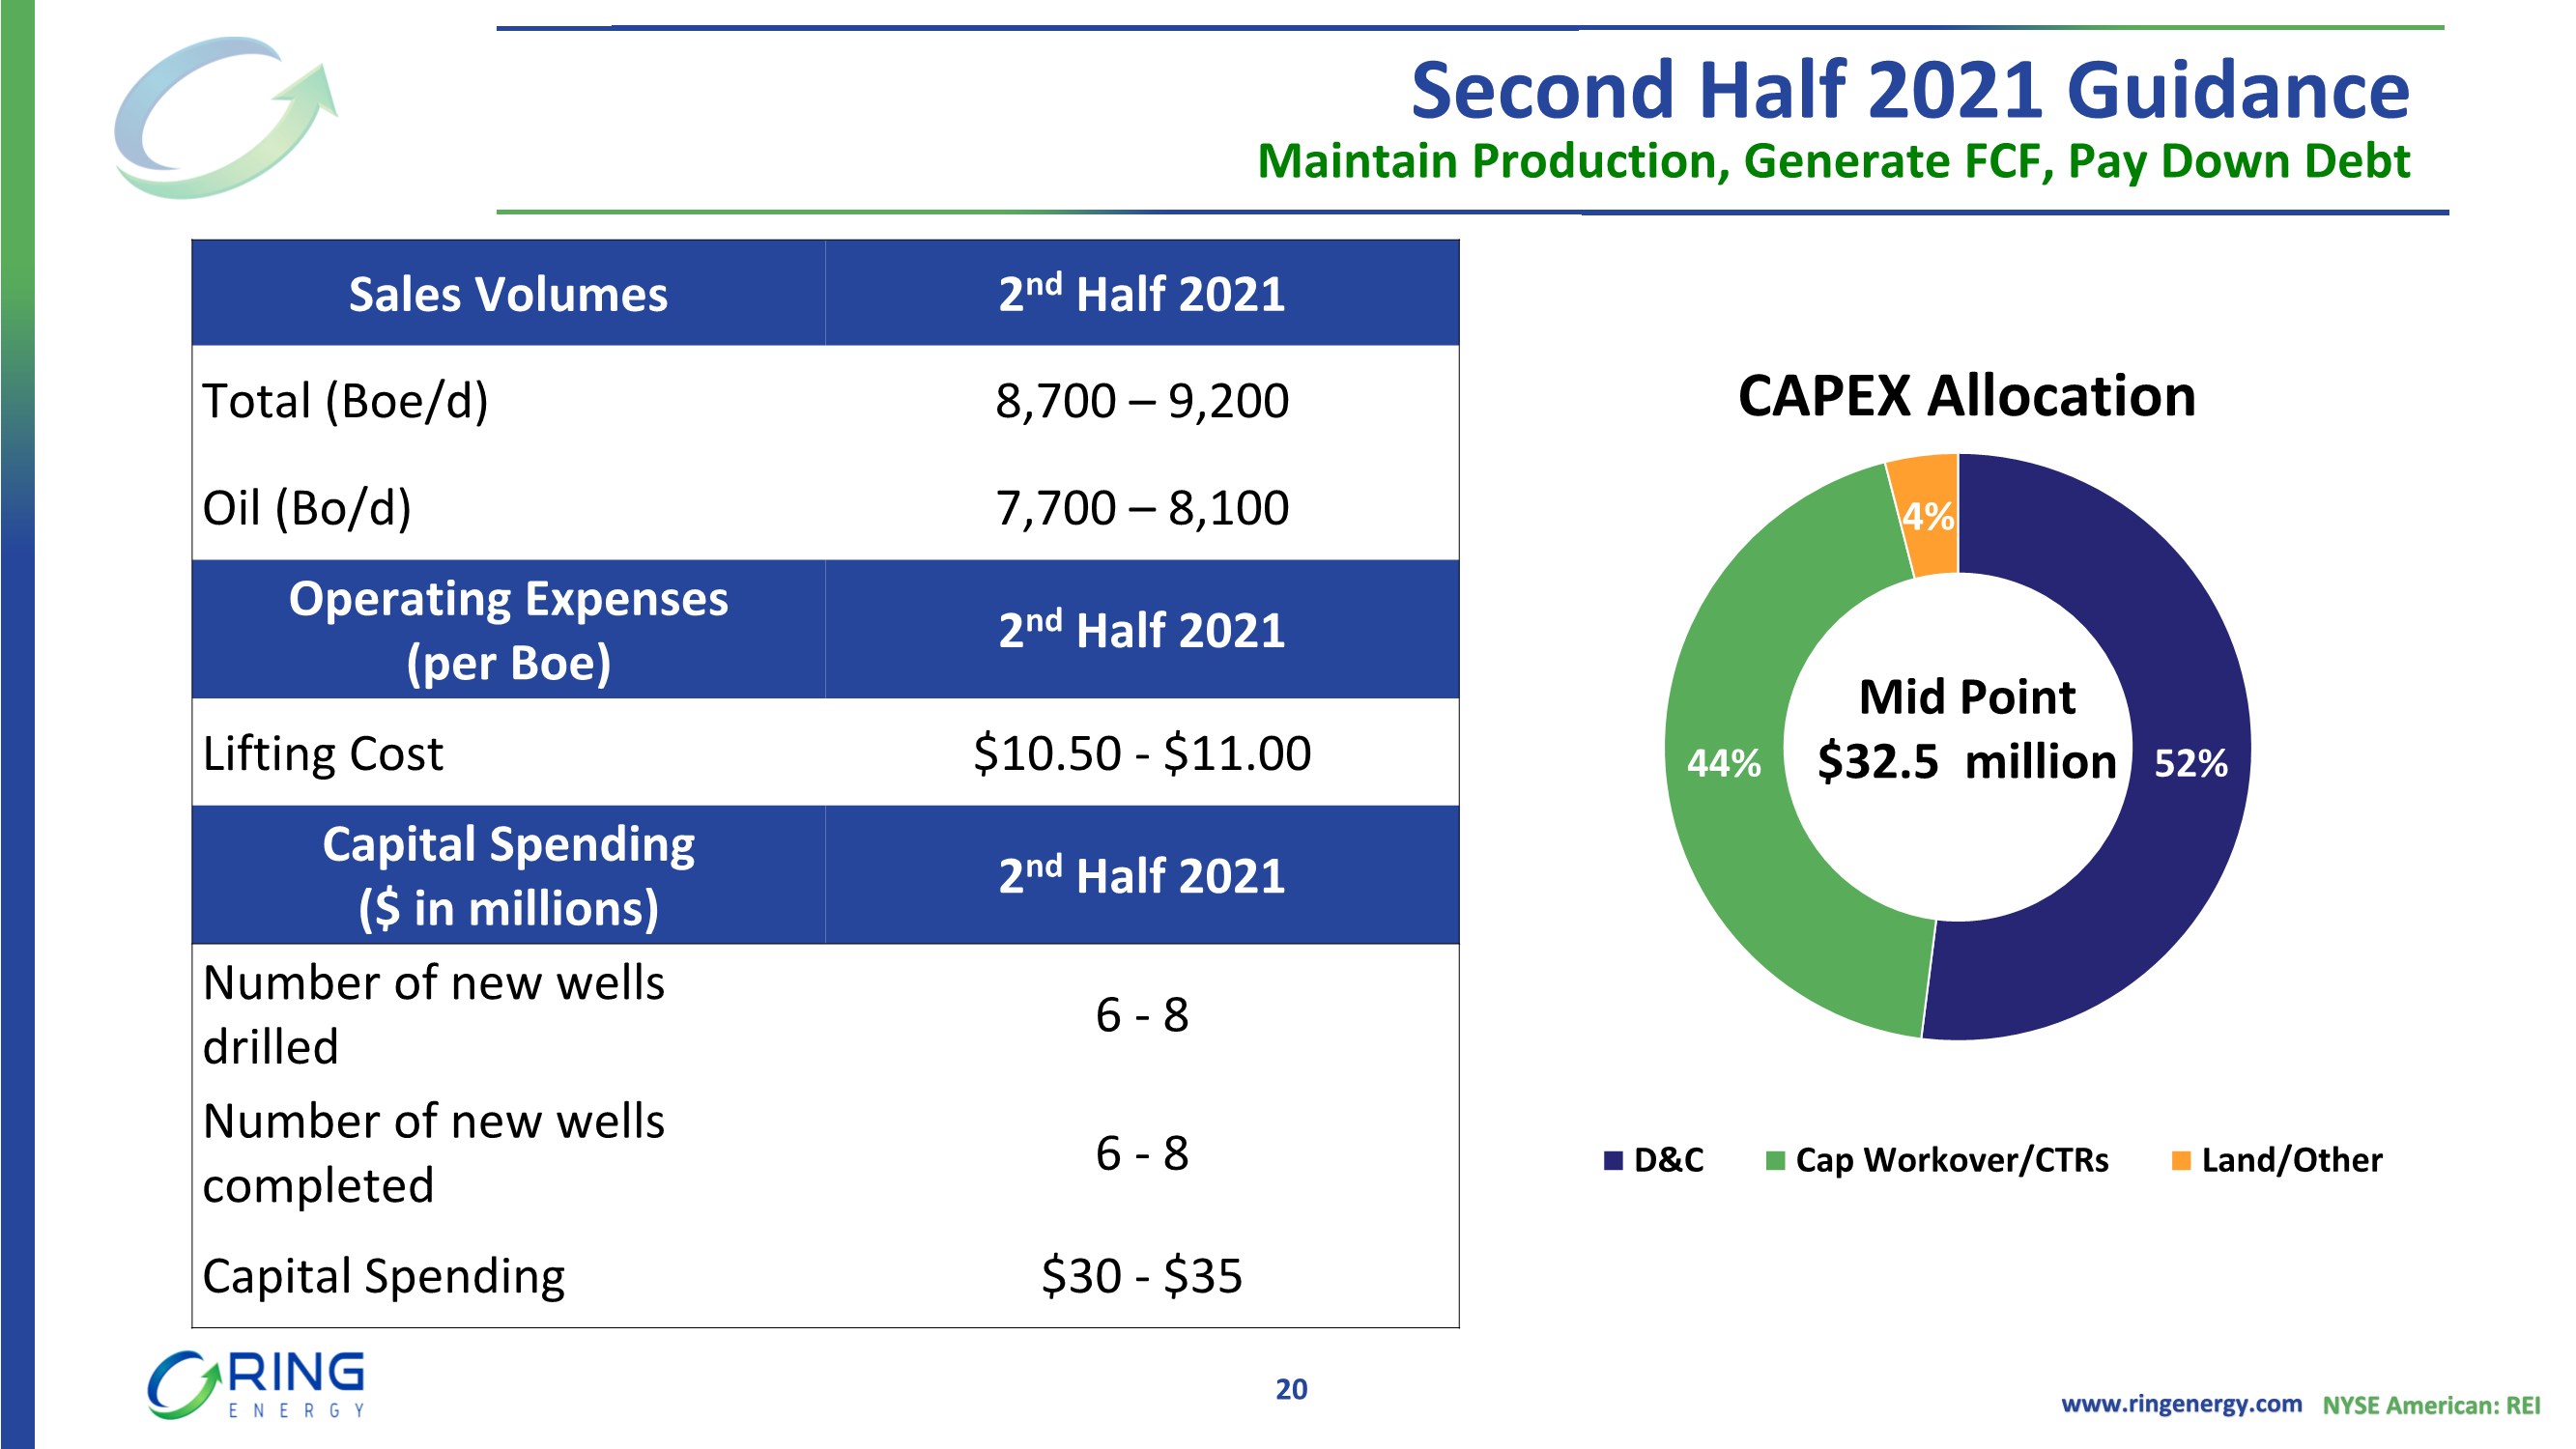
Ring expects second half 2021 sales of 8,700 to 9,200 Boe/d (7,700 to 8,100 Bopd). Assuming the successful completion and timing of the Company’s Phase III and Phase IV drilling programs, Ring expects to exit 2021 with sales volumes in excess of the high-end of second half guidance.
For the second quarter of 2021, the Company realized an average sales price of $65.00 per barrel for crude oil and $3.90 per Mcf for natural gas. The combined average realized sales price for the period was $60.26 per Boe, up 9% versus $55.14 per Boe for the first quarter of 2021, and up 183% from $21.30 per Boe in the second quarter of 2020. The average price differential the Company experienced from WTI posting2 price in the second quarter of 2021 was approximately ($0.99) per barrel of crude oil.
Revenues were $47.8 million for the second quarter of 2021 compared to $39.5 million for the first quarter of 2021 and $10.6 million for the second quarter of 2020. The 21% increase in second quarter 2021 revenues from this year’s first quarter and the 350% improvement from the second quarter of 2020 were both driven by higher oil sales volumes and improved oil prices.
Lease Operating Expense (“LOE”): LOE, which includes expense workovers and facilities maintenance, was $7.4 million, or $9.37 per Boe, in the second quarter of 2021 versus $8.2 million, or $11.48 per Boe, in the first quarter of 2021 and $5.6 million, or $11.31 per Boe, for the second quarter of 2020.
2 WTI posting price per Bbl of oil is based on NYMEX.
4
Gathering, Transportation and Processing (“GTP”) Costs: GTP costs were $1.13 per Boe in the second quarter of 2021 versus $1.31 per Boe in the first quarter of 2021 and $1.25 per Boe in the second quarter of 2020.
Ad Valorem Taxes: Ad valorem taxes were $0.89 per Boe for the second quarter of 2021 compared to $1.03 per Boe in the first quarter of 2021 and $1.60 per Boe for the second quarter of 2020.
Production Taxes: Production taxes were $2.77 per Boe in the second quarter of 2021 compared to $2.59 per Boe in the first quarter of 2021 and $0.87 per Boe in second quarter of 2020. Production taxes remained steady at 4-5% of revenue for all three periods.
Depreciation, Depletion and Amortization (“DD&A”) and Asset Retirement Obligation Accretion: DD&A was $11.70 per Boe in the second quarter of 2021 versus $11.32 per Boe for the first quarter of 2021 and $14.70 in the second quarter of 2020. The lower second quarter 2021 depletion rate compared with the same period in 2020 was primarily the result of the ceiling test write-down during 2020. Asset retirement obligation accretion was $0.23 per Boe in the second quarter of 2021 compared to $0.27 per Boe for the first quarter of 2021 and $0.46 per Boe in the second quarter of 2020.
Operating Lease Expense: Operating lease expense was $84,790 for the second quarter of 2021 versus $271,517 for the first quarter of 2021 and $292,207 in the second quarter of 2020. These expenses are primarily associated with the Company’s office leases.
General and Administrative Expenses (“G&A”): G&A, excluding share-based compensation, was $3.4 million, or $4.30 per Boe, for the second quarter 2021 versus $2.6 million, or $3.57 per Boe, for the first quarter of 2021 and $2.9 million, or $5.73 per Boe, in the second quarter of 2020.
Derivative (Loss) Gain: In the second quarter of 2021, Ring recorded a loss of $35.3 million on its commodity derivative contracts, including a realized $12.5 million cash commodity derivative loss and an unrealized $22.8 million non-cash commodity derivative loss, largely due to higher quarter-end oil prices compared to first quarter of 2021. This compared to a net loss of $31.6 million in the first quarter of 2021, of which $25.7 million was unrealized, and a net loss of $13.0 million in the second quarter of 2020, of which $26.8 million was unrealized.
5
In the second quarter of 2021, Ring added the following derivative positions:
| Average | Weighted Avg. | |||||||||||
| Date Entered Into | Production Period | Instrument | Daily Volumes | Swap Price | ||||||||
| Crude Oil - WTI | (Bbls) | (per Bbl) | ||||||||||
| 05/11/2021 | Calendar year 2022 | Swaps | 879 | (1) | $ | 49.03 | ||||||
(1) The notional quantity per the swap contract entered into on May 11, 2021 is for 26,750 barrels of oil per month. The 879 represents the daily amount on an annual basis.
In addition to adding the above derivative position, the Company bought back a 1,500 Bbl/d call option for June 1 through December 31, 2021, in the second quarter of 2021. A full listing of the Company’s current outstanding derivative positions is included in the tables shown later in this release.
Interest Expense: Interest expense was $3.7 million in both the second and first quarters of 2021 and $4.3 million for the second quarter of 2020. Interest expense declined year-over-year due to a $72.3 million lower average daily balance of long-term debt and a lower margin rate for the three months ended June 30, 2021. The lower margin rate was associated with a reduced percentage utilization of the borrowing base.
Income Tax: The Company recorded a non-cash income tax provision of $190,644 in the second quarter of 2021 and $39.1 million for the second quarter of 2020. There was no non-cash income tax benefit or provision recorded in the first quarter of 2021. The large tax benefit in the second quarter of 2020 was primarily related to the ceiling test write-down during that period.
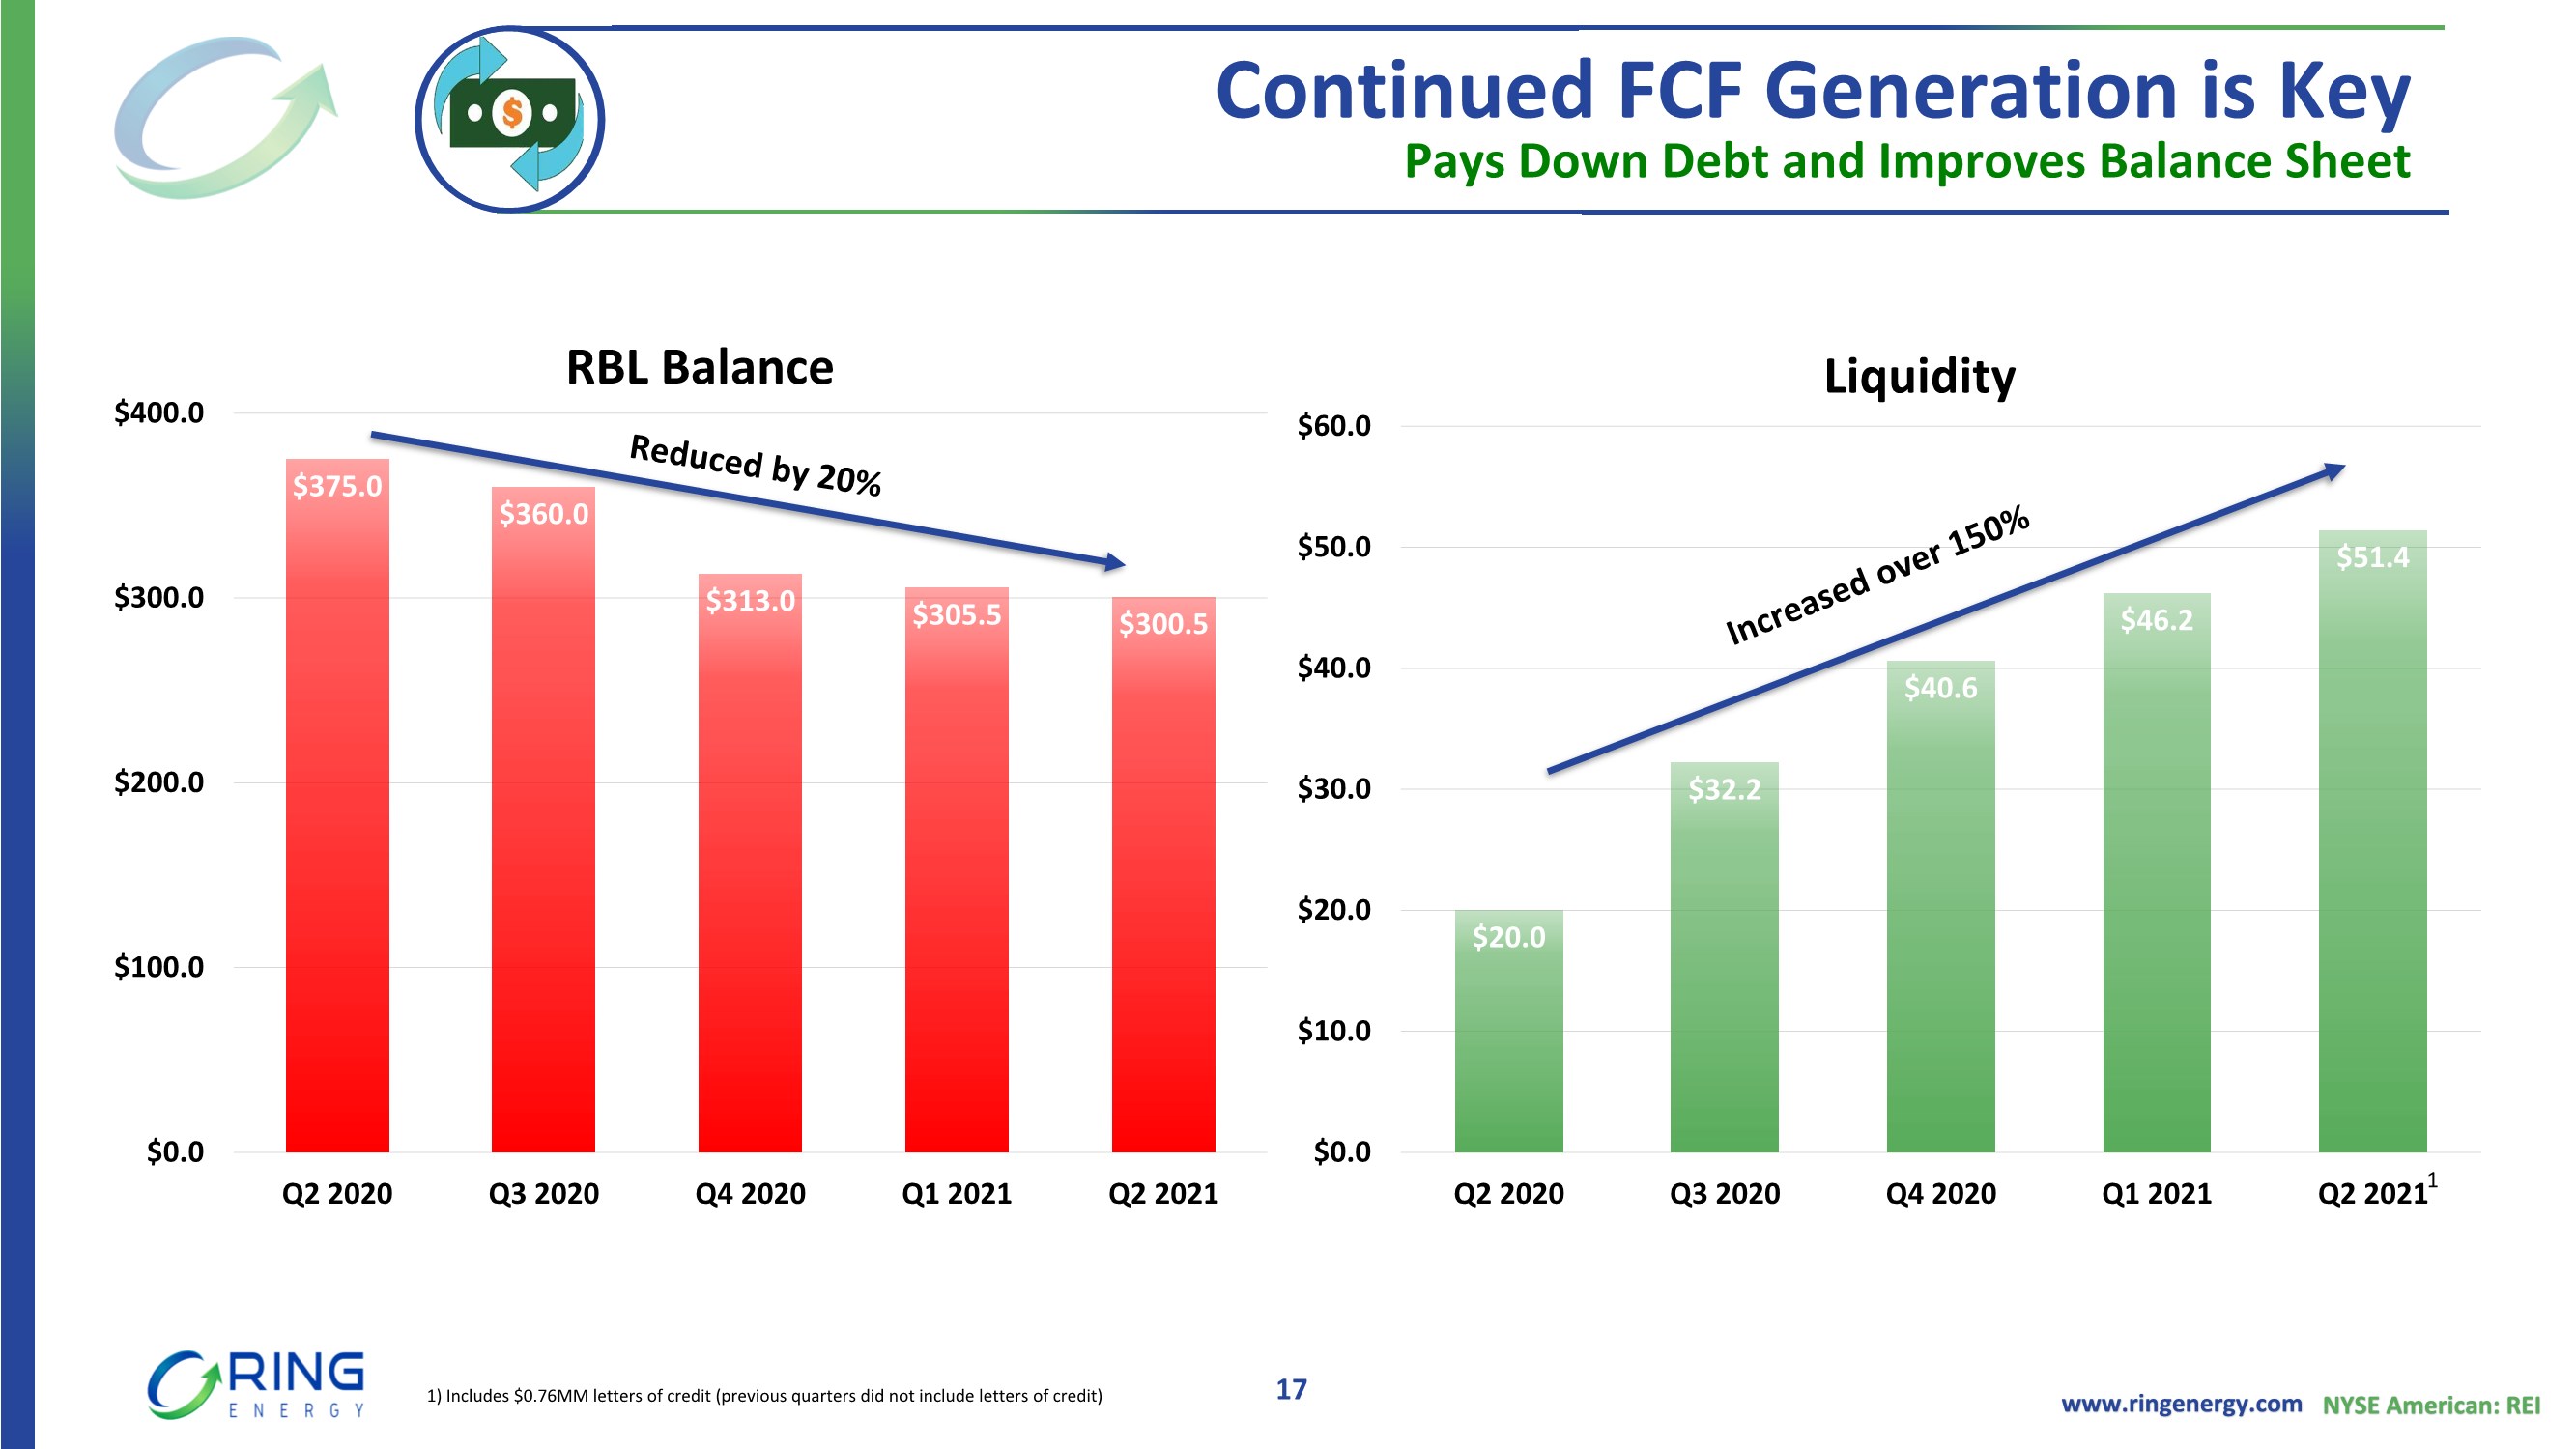
Balance Sheet and Liquidity: Total liquidity at the end of the second quarter of 2021 was $51.4 million, an increase of 13% from March 31, 2021. Liquidity consisted of cash and cash equivalents of $2.7 million and $48.7 million of availability under Ring’s revolving bank credit facility, which includes a reduction of $0.8 million for letters of credit. On June 30, 2021, the Company had $300.5 million in borrowings on its revolving credit facility. Ring paid down $5.0 million of debt during the second quarter of 2021, and is targeting further debt reduction during the balance of 2021.
6
On June 10, 2021, Ring announced the successful results of the spring redetermination of its revolving credit facility, including:
| · | Reaffirmation of the borrowing base at $350 million; |
| · | Easing of the minimum required oil hedges for calendar 2022 from 4,000 Bbls/d to 3,100 Bbls/d, which is fully covered by oil hedges currently in place; and |
| · | Enhanced price optionality and opportunity for higher forecasted 2021 cash flow generation. |
The next regularly scheduled bank redetermination will be on or around November 1, 2021, and Ring is currently in compliance with all applicable covenants of its revolving credit facility agreement.
Capital Expenditures and Asset Transfers: During the second quarter of 2021, capital expenditures were $11.5 million as the Company drilled, completed and placed on production the three wells of its NWS Phase II program and also performed five CTR projects. In the first quarter of 2021, capital expenditures were $14.5 million, which included costs to finish drilling, completing and placing on production the four wells of its NWS Phase I program and perform nine CTR projects. During the first quarter of 2021, Ring also received net value consideration in cash of $2.0 million for the sale and exchange of certain oil and gas interests in Andrews County, Texas.
Second Half 2021 Phase III and Phase IV Drilling Programs
In response to a higher crude oil price environment, Ring recently contracted two rigs and commenced a Phase III drilling program of four wells, including two in the NWS and two in the CBP (all 100% working interest). Ring will retain one rig to commence a Phase IV drilling program of two or more wells in the NWS and CBP areas, beginning early in the fourth quarter. The wells in the NWS are expected to be one-mile laterals while the ones in the CBP are expected to be 1.5-mile laterals.
Second Half 2021 Capital Investment Program
Incorporating the Company’s expanded drilling plans designed to capitalize on a higher crude oil price environment, Ring anticipates capital spending for the second half of 2021 of $30 million to $35 million, which includes the estimated cost to drill and complete six to eight horizontal wells. The capital spending outlook includes targeted well reactivations, workovers, infrastructure upgrades, lease costs and continuing the successful CTR program in its NWS and CBP areas. Capital expenditures are expected to be fully funded by cash on hand and cash from operations, with excess free cash flow allocated to debt reduction.
As previously announced, Ring launched a sales process during the second quarter of 2021 to divest of its Delaware Basin assets. The Company anticipates using the net proceeds from the potential sale to further reduce its debt position.
7
Second Half 2021 Sales Volumes, Operating Expense and Capital Spending Guidance
The guidance for the second half of 2021 in the table below represents the Company's current best estimate of the range of likely future results. Guidance could be affected by the factors described below in "Safe Harbor Statement".
| Second Half | ||||
| 2021 | ||||
| Sales Volumes: | ||||
| Total (Boe/d) | 8,700 - 9,200 | |||
| Oil (Bo/d) | 7,700 - 8,100 | |||
| Operating Expenses: | ||||
| Lifting cost(1) (per Boe) | $10.50 - $11.00 | |||
| Capital Program: | ||||
| Number of new wells drilled | 6 - 8 | |||
| Number of new wells completed | 6 - 8 | |||
| Capital spending(2) (millions) | $30 - $35 |
| (1) Lifting cost equals lease operating expenses and gathering, transportation and processing costs divided by the total barrels of oil equivalent (6 Mcf = 1 Boe) sold during the same period. |
| (2) In addition to Company-directed drilling and completion activities, the capital spending outlook includes funds for targeted well reactivations, workovers, infrastructure upgrades, and continuing the Company's successful CTR program in its Northwest Shelf and Central Basin Platform areas. Also included is anticipated spending for lease costs, contractural drilling obligations and non-operated drilling, completion and capital workovers. |
Conference Call Information
Ring will hold a conference call on Tuesday, August 10, 2021 at 10:00 a.m. ET (9:00 a.m. CT) to discuss its second quarter 2021 operational and financial results. To participate, interested parties should dial 833-953-2433 at least five minutes before the call is to begin. Please reference the “Ring Energy Second Quarter 2021 Earnings Conference Call.” International callers may participate by dialing 412-317-5762. The call will also be webcast and available on Ring’s website at www.ringenergy.com under “Investors” on the “Events” page. An audio replay will also be available on the Company’s website following the call.
An updated investor presentation prepared in conjunction with second quarter results will be posted to the Company’s website prior to the conference call.
About Ring Energy, Inc.
Ring Energy, Inc. is an oil and gas exploration, development, and production company with current operations focused on the conventional development of its Permian Basin assets in West Texas and New Mexico. For additional information, please visit www.ringenergy.com.
8
Safe Harbor Statement
This release contains forward-looking statements within the meaning of Section 27A of the Securities Act of 1933 and Section 21E of the Securities Exchange Act of 1934. Forward-looking statements involve a wide variety of risks and uncertainties, and include, without limitations, statements with respect to the Company’s strategy and prospects. Such statements are subject to certain risks and uncertainties which are disclosed in the Company’s reports filed with the SEC, including its Form 10-K for the fiscal year ended December 31, 2020, and its other filings with the SEC. Readers and investors are cautioned that the Company’s actual results may differ materially from those described in the forward-looking statements due to a number of factors, including, but not limited to, the Company’s ability to acquire productive oil and/or gas properties or to successfully drill and complete oil and/or gas wells on such properties, general economic conditions both domestically and abroad, and the conduct of business by the Company, and other factors that may be more fully described in additional documents set forth by the Company.
Contact Information
Al Petrie Advisors
Al Petrie, Senior Partner
Phone: 281-975-2146
Email: [email protected]
9
RING ENERGY, INC.
Condensed Statements of Operations
(Unaudited)
| Three Months Ended | Six Months Ended | |||||||||||||||||||
| June 30, | March 31, | June 30, | June 30, | June 30, | ||||||||||||||||
| 2021 | 2021 | 2020 | 2021 | 2020 | ||||||||||||||||
| Oil and Natural Gas Revenues | $ | 47,760,102 | $ | 39,502,532 | $ | 10,636,593 | $ | 87,262,634 | $ | 50,206,921 | ||||||||||
| Costs and Operating Expenses | ||||||||||||||||||||
| Lease operating expenses | 7,424,488 | 8,226,575 | 5,646,330 | 15,651,063 | 14,067,717 | |||||||||||||||
| Gathering, transportation and processing costs | 897,166 | 935,019 | 625,966 | 1,832,185 | 1,775,585 | |||||||||||||||
| Ad valorem taxes | 703,775 | 737,251 | 800,000 | 1,441,026 | 1,607,455 | |||||||||||||||
| Oil and natural gas production taxes | 2,198,339 | 1,852,762 | 433,760 | 4,051,101 | 2,304,005 | |||||||||||||||
| Depreciation, depletion and amortization | 9,275,126 | 8,108,158 | 7,338,108 | 17,383,284 | 21,021,104 | |||||||||||||||
| Ceiling test impairment | - | - | 147,937,943 | - | 147,937,943 | |||||||||||||||
| Asset retirement obligation accretion | 184,013 | 193,744 | 231,367 | 377,757 | 463,329 | |||||||||||||||
| Operating lease expense | 84,790 | 271,517 | 292,207 | 356,307 | 581,258 | |||||||||||||||
| General and administrative expense (including share-based compensation) | 3,757,152 | 2,912,991 | 4,176,609 | 6,670,143 | 7,212,504 | |||||||||||||||
| Total Costs and Operating Expenses | 24,524,849 | 23,238,017 | 167,482,290 | 47,762,866 | 196,970,900 | |||||||||||||||
| Income (Loss) Income from Operations | 23,235,253 | 16,264,515 | (156,845,697 | ) | 39,499,768 | (146,763,979 | ) | |||||||||||||
| Other Income (Expense) | ||||||||||||||||||||
| Interest income | 1 | - | 1 | 1 | 6 | |||||||||||||||
| Interest (expense) | (3,654,529 | ) | (3,741,969 | ) | (4,253,040 | ) | (7,396,498 | ) | (8,501,538 | ) | ||||||||||
| (Loss) gain on derivative contracts | (35,277,240 | ) | (31,588,639 | ) | (13,017,962 | ) | (66,865,879 | ) | 37,402,847 | |||||||||||
| Deposit forfeiture income | - | - | - | - | - | |||||||||||||||
| Net Other Income (Expense) | (38,931,768 | ) | (35,330,608 | ) | (17,271,001 | ) | (74,262,376 | ) | 28,901,315 | |||||||||||
| (Loss) Income Before Tax Provision | (15,696,515 | ) | (19,066,093 | ) | (174,116,698 | ) | (34,762,608 | ) | (117,862,664 | ) | ||||||||||
| Benefit from (Provision for) Income Taxes | (190,644 | ) | - | 39,116,632 | (190,644 | ) | 26,666,716 | |||||||||||||
| Net (Loss) Income | $ | (15,887,159 | ) | $ | (19,066,093 | ) | $ | (135,000,066 | ) | $ | (34,953,252 | ) | $ | (91,195,948 | ) | |||||
| Basic (Loss) Earnings per Share | $ | (0.16 | ) | $ | (0.19 | ) | $ | (1.99 | ) | $ | (0.35 | ) | $ | (1.34 | ) | |||||
| Diluted (Loss) Earnings per Share | $ | (0.16 | ) | $ | (0.19 | ) | $ | (1.99 | ) | $ | (0.35 | ) | $ | (1.34 | ) | |||||
| Basic Weighted-Average Shares Outstanding | 99,300,458 | 99,092,715 | 67,980,794 | 99,197,160 | 67,987,295 | |||||||||||||||
| Diluted Weighted-Average Shares Outstanding | 99,300,458 | 99,092,715 | 67,980,794 | 99,197,160 | 67,987,295 | |||||||||||||||
10
RING ENERGY, INC.
Condensed Operating Data
(Unaudited)
| Three Months Ended | Six Months Ended | |||||||||||||||||||
| June 30, | March 31, | June 30, | June 30, | June 30, | ||||||||||||||||
| 2021 | 2021 | 2020 | 2021 | 2020 | ||||||||||||||||
| Net sales volumes: | ||||||||||||||||||||
| Oil (Bbls) | 702,408 | 610,121 | (2) | 429,751 | 1,312,529 | (2) | 1,285,354 | |||||||||||||
| Natural gas (Mcf) | 540,857 | 637,808 | 417,491 | 1,178,666 | 1,183,042 | |||||||||||||||
| Total oil and natural gas (Boe) (1) | 792,551 | 716,422 | 499,333 | 1,508,973 | 1,482,528 | |||||||||||||||
| % Oil | 89 | % | 85 | % | 86 | % | 87 | % | 87 | % | ||||||||||
| Average daily equivalent sales (Boe/d) | 8,709 | 7,960 | 5,487 | 8,337 | 8,146 | |||||||||||||||
| Average realized sales prices: | ||||||||||||||||||||
| Oil ($/Bbl) | $ | 65.00 | $ | 58.00 | $ | 24.23 | $ | 61.74 | $ | 38.16 | ||||||||||
| Natural gas ($/Mcf) | 3.90 | 6.46 | 0.53 | 5.28 | 0.98 | |||||||||||||||
| Barrel of oil equivalent ($/Boe) | $ | 60.26 | $ | 55.14 | $ | 21.30 | $ | 57.83 | $ | 33.87 | ||||||||||
| Average costs and expenses per Boe ($/Boe): | ||||||||||||||||||||
| Lease operating expenses | $ | 9.37 | $ | 11.48 | $ | 11.31 | $ | 10.37 | $ | 9.49 | ||||||||||
| Gathering, transportation and processing costs | 1.13 | 1.31 | 1.25 | 1.21 | 1.20 | |||||||||||||||
| Ad valorem taxes | 0.89 | 1.03 | 1.60 | 0.95 | 1.08 | |||||||||||||||
| Oil and natural gas production taxes | 2.77 | 2.59 | 0.87 | 2.68 | 1.55 | |||||||||||||||
| Depreciation, depletion and amortization | 11.70 | 11.32 | 14.70 | 11.52 | 14.18 | |||||||||||||||
| Asset retirement obligation accretion | 0.23 | 0.27 | 0.46 | 0.25 | 0.31 | |||||||||||||||
| Operating lease expense | 0.11 | 0.38 | 0.59 | 0.24 | 0.39 | |||||||||||||||
| General and administrative expense (including share-based compensation) | 4.74 | 4.07 | 8.36 | 4.42 | 4.87 | |||||||||||||||
| General and administrative expense (excluding share-based compensation) | 4.30 | 3.57 | 5.73 | 3.95 | 3.52 | |||||||||||||||
(1) Boe is determined using the ratio of six Mcf of natural gas to one Bbl of oil (totals may not compute due to rounding). The conversion ratio does not assume price equivalency and the price on an equivalent basis for oil and natural gas may differ significantly.
(2) Includes 379 barrels of skim oil.
11
| RING ENERGY, INC. | ||||||||
| Condenced Balance Sheets | ||||||||
| (Unaudited) | ||||||||
| June 30, | December 31, | |||||||
| 2021 | 2020 | |||||||
| ASSETS | ||||||||
| Current Assets | ||||||||
| Cash and cash equivalents | $ | 2,670,242 | $ | 3,578,634 | ||||
| Accounts receivable | 21,679,567 | 14,997,979 | ||||||
| Joint interest billing receivable | 1,909,804 | 1,327,262 | ||||||
| Derivative receivable | - | 499,906 | ||||||
| Prepaid expenses and other assets | 1,577,671 | 396,109 | ||||||
| Total Current Assets | 27,837,284 | 20,799,890 | ||||||
| Properties and Equipment | ||||||||
| Oil and natural gas properties subject to amortization | 858,427,028 | 836,514,815 | ||||||
| Financing lease asset subject to depreciation | 819,784 | 858,513 | ||||||
| Fixed assets subject to depreciation | 1,741,902 | 1,520,890 | ||||||
| Total Properties and Equipment | 860,988,714 | 838,894,218 | ||||||
| Accumulated depreciation, depletion and amortization | (216,589,422 | ) | (200,111,658 | ) | ||||
| Net Properties and Equipment | 644,399,292 | 638,782,560 | ||||||
| Operating Lease Asset | 1,411,150 | 1,494,399 | ||||||
| Properties and Equipment | 2,049,096 | 2,379,348 | ||||||
| TOTAL ASSETS | $ | 675,696,822 | $ | 663,456,197 | ||||
| LIABILITIES AND STOCKHOLDERS' EQUITY | ||||||||
| Current Liabilities | ||||||||
| Accounts payable | $ | 44,128,214 | $ | 32,500,081 | ||||
| Financing lease liability | 259,261 | 295,311 | ||||||
| Operating lease liability | 216,730 | 859,017 | ||||||
| Derivative liabilities | 42,517,473 | 3,287,328 | ||||||
| Notes payable | 758,150 | - | ||||||
| Total Current Liabilities | 87,879,828 | 36,941,737 | ||||||
| Deferred income taxes | 190,644 | - | ||||||
| Revolving line of credit | 300,500,000 | 313,000,000 | ||||||
| Financing lease liability, less current portion | 4,183 | 126,857 | ||||||
| Operating lease liability, less current portion | 1,285,335 | 635,382 | ||||||
| Derivative liabilities | 10,147,883 | 869,273 | ||||||
| Asset retirement obligations | 14,992,850 | 17,117,135 | ||||||
| Total Liabilities | 415,000,723 | 368,690,384 | ||||||
| Stockholders' Equity | ||||||||
| Preferred stock - $0.001 par value; 50,000,000 shares authorized; no shares issued or outstanding | - | - | ||||||
| Common stock - $0.001 par value; 150,000,000 shares authorized; 99,351,145 shares and 85,568,287 shares issued and outstanding, respectively | 99,351 | 85,568 | ||||||
| Additional paid-in capital | 551,821,170 | 550,951,415 | ||||||
| Accumulated deficit | (291,224,422 | ) | (256,271,170 | ) | ||||
| Total Stockholders' Equity | 260,696,099 | 294,765,813 | ||||||
| TOTAL LIABILITIES AND STOCKHOLDERS' EQUITY | $ | 675,696,822 | $ | 663,456,197 | ||||
12
| RING ENERGY, INC. | ||||||||||||||||||||
| Condensed Statements of Cash Flows | ||||||||||||||||||||
| (Unaudited) | ||||||||||||||||||||
| Three Months Ended | Six Months Ended | |||||||||||||||||||
| June 30, | March 31, | June 30, | June 30, | June 30, | ||||||||||||||||
| 2021 | 2021 | 2020 | 2021 | 2020 | ||||||||||||||||
| Cash Flows From Operating Activities | ||||||||||||||||||||
| Net (loss) income | $ | (15,887,159 | ) | $ | (19,066,093 | ) | $ | (135,000,066 | ) | $ | (34,953,252 | ) | $ | (91,195,948 | ) | |||||
| Adjustments to reconcile net (loss) income to net cash provided by operating activities: | ||||||||||||||||||||
| Depreciation, depletion and amortization | 9,275,126 | 8,108,158 | 7,338,108 | 17,383,284 | 21,021,104 | |||||||||||||||
| Ceiling test impairment | - | - | 147,937,943 | - | 147,937,943 | |||||||||||||||
| Accretion expense | 184,013 | 193,744 | 231,367 | 377,757 | 463,329 | |||||||||||||||
| Amortization of deferred financing costs | 147,224 | 183,027 | 189,083 | 330,251 | 378,165 | |||||||||||||||
| Share-based compensation | 351,775 | 355,494 | 1,317,542 | 707,269 | 1,991,337 | |||||||||||||||
| Shares issued for services | - | - | - | - | - | |||||||||||||||
| Deferred income tax (benefit) expense | 47,967 | (1,792,142 | ) | (37,077,082 | ) | (1,744,175 | ) | (25,048,702 | ) | |||||||||||
| Excess tax expense (benefit) related to share-based compensation | 142,677 | 1,792,142 | (2,039,550 | ) | 1,934,819 | (1,618,014 | ) | |||||||||||||
| Change in fair value of derivative instruments | 35,277,240 | 31,588,639 | 13,017,962 | 66,865,879 | (37,402,847 | ) | ||||||||||||||
| Cash (paid) received for derivative settlements, net | (12,436,333 | ) | (5,920,791 | ) | 13,753,567 | (18,357,124 | ) | 17,087,695 | ||||||||||||
| Changes in assets and liabilities: | ||||||||||||||||||||
| Accounts receivable | (704,568 | ) | (5,968,739 | ) | 8,630,061 | (6,673,307 | ) | 15,545,418 | ||||||||||||
| Prepaid expenses and retainers | (1,346,762 | ) | 165,200 | (186,593 | ) | (1,181,562 | ) | 3,397,860 | ||||||||||||
| Accounts payable | 2,365,612 | 6,293,506 | (15,436,648 | ) | 8,659,118 | (22,050,677 | ) | |||||||||||||
| Settlement of asset retirement obligation | (1,093,816 | ) | (244,461 | ) | (27,368 | ) | (1,338,277 | ) | (320,580 | ) | ||||||||||
| Net Cash Provided by Operating Activities | 16,322,996 | 15,687,684 | 2,648,326 | 32,010,680 | 30,186,083 | |||||||||||||||
| Cash Flows From Investing Activities | ||||||||||||||||||||
| Payments to purchase oil and natural gas properties | (178,718 | ) | (258,970 | ) | (537,386 | ) | (437,688 | ) | (1,017,434 | ) | ||||||||||
| Payments to develop oil and natural gas properties | (10,824,079 | ) | (11,898,939 | ) | (5,839,641 | ) | (22,723,018 | ) | (30,302,779 | ) | ||||||||||
| Payments to acquire or improve fixed assets | (41,442 | ) | (19,461 | ) | - | (60,903 | ) | - | ||||||||||||
| Proceeds from divestiture of oil and natural gas properties | - | 2,000,000 | - | 2,000,000 | - | |||||||||||||||
| Purchase of fixed assets subject to depreciation | - | - | - | - | - | |||||||||||||||
| Net Cash Used in Investing Activities | (11,044,239 | ) | (10,177,370 | ) | (6,377,027 | ) | (21,221,609 | ) | (31,320,213 | ) | ||||||||||
| Cash Flows From Financing Activities | ||||||||||||||||||||
| Proceeds from revolving line of credit | 6,900,000 | 13,000,000 | 21,500,000 | 19,900,000 | 21,500,000 | |||||||||||||||
| Payments on revolving line of credit | (11,900,000 | ) | (20,500,000 | ) | (13,000,000 | ) | (32,400,000 | ) | (13,000,000 | ) | ||||||||||
| Proceeds from issuance of common stock and warrants | 80,000 | 161,269 | - | 241,269 | - | |||||||||||||||
| Proceeds from notes payable | 909,467 | - | - | 909,467 | - | |||||||||||||||
| Payments on notes payable | (151,317 | ) | - | - | (151,317 | ) | - | |||||||||||||
| Payment of deferred financing costs | (76,887 | ) | - | - | (76,887 | ) | - | |||||||||||||
| Reduction of financing lease liabilities | (70,288 | ) | (49,707 | ) | (72,906 | ) | (119,995 | ) | (140,712 | ) | ||||||||||
| Net Cash Used in (Provided by) Investing Activities | (4,309,025 | ) | (7,388,438 | ) | 8,427,094 | (11,697,463 | ) | 8,359,288 | ||||||||||||
| Net (Decrease) Increase in Cash | 969,732 | (1,878,124 | ) | 4,698,393 | (908,392 | ) | 7,225,158 | |||||||||||||
| Cash at Beginning of Period | 1,700,510 | 3,578,634 | 12,531,387 | 3,578,634 | 10,004,622 | |||||||||||||||
| Cash at End of Period | $ | 2,670,242 | $ | 1,700,510 | $ | 17,229,780 | $ | 2,670,242 | $ | 17,229,780 | ||||||||||
13
| RING ENERGY, INC. | ||||||||||||||||||||
| Financial Commodity Derivative Positions | ||||||||||||||||||||
| As of August 9, 2021 | ||||||||||||||||||||
| Average | Weighted Avg. | Weighted Avg. | Weighted Avg. | |||||||||||||||||
| Date Entered Into | Production Period | Instrument | Daily Volumes | Put Price | Call Price | Swap Price | ||||||||||||||
| Crude Oil - WTI | (Bbls) | (per Bbl) | (per Bbl) | (per Bbl) | ||||||||||||||||
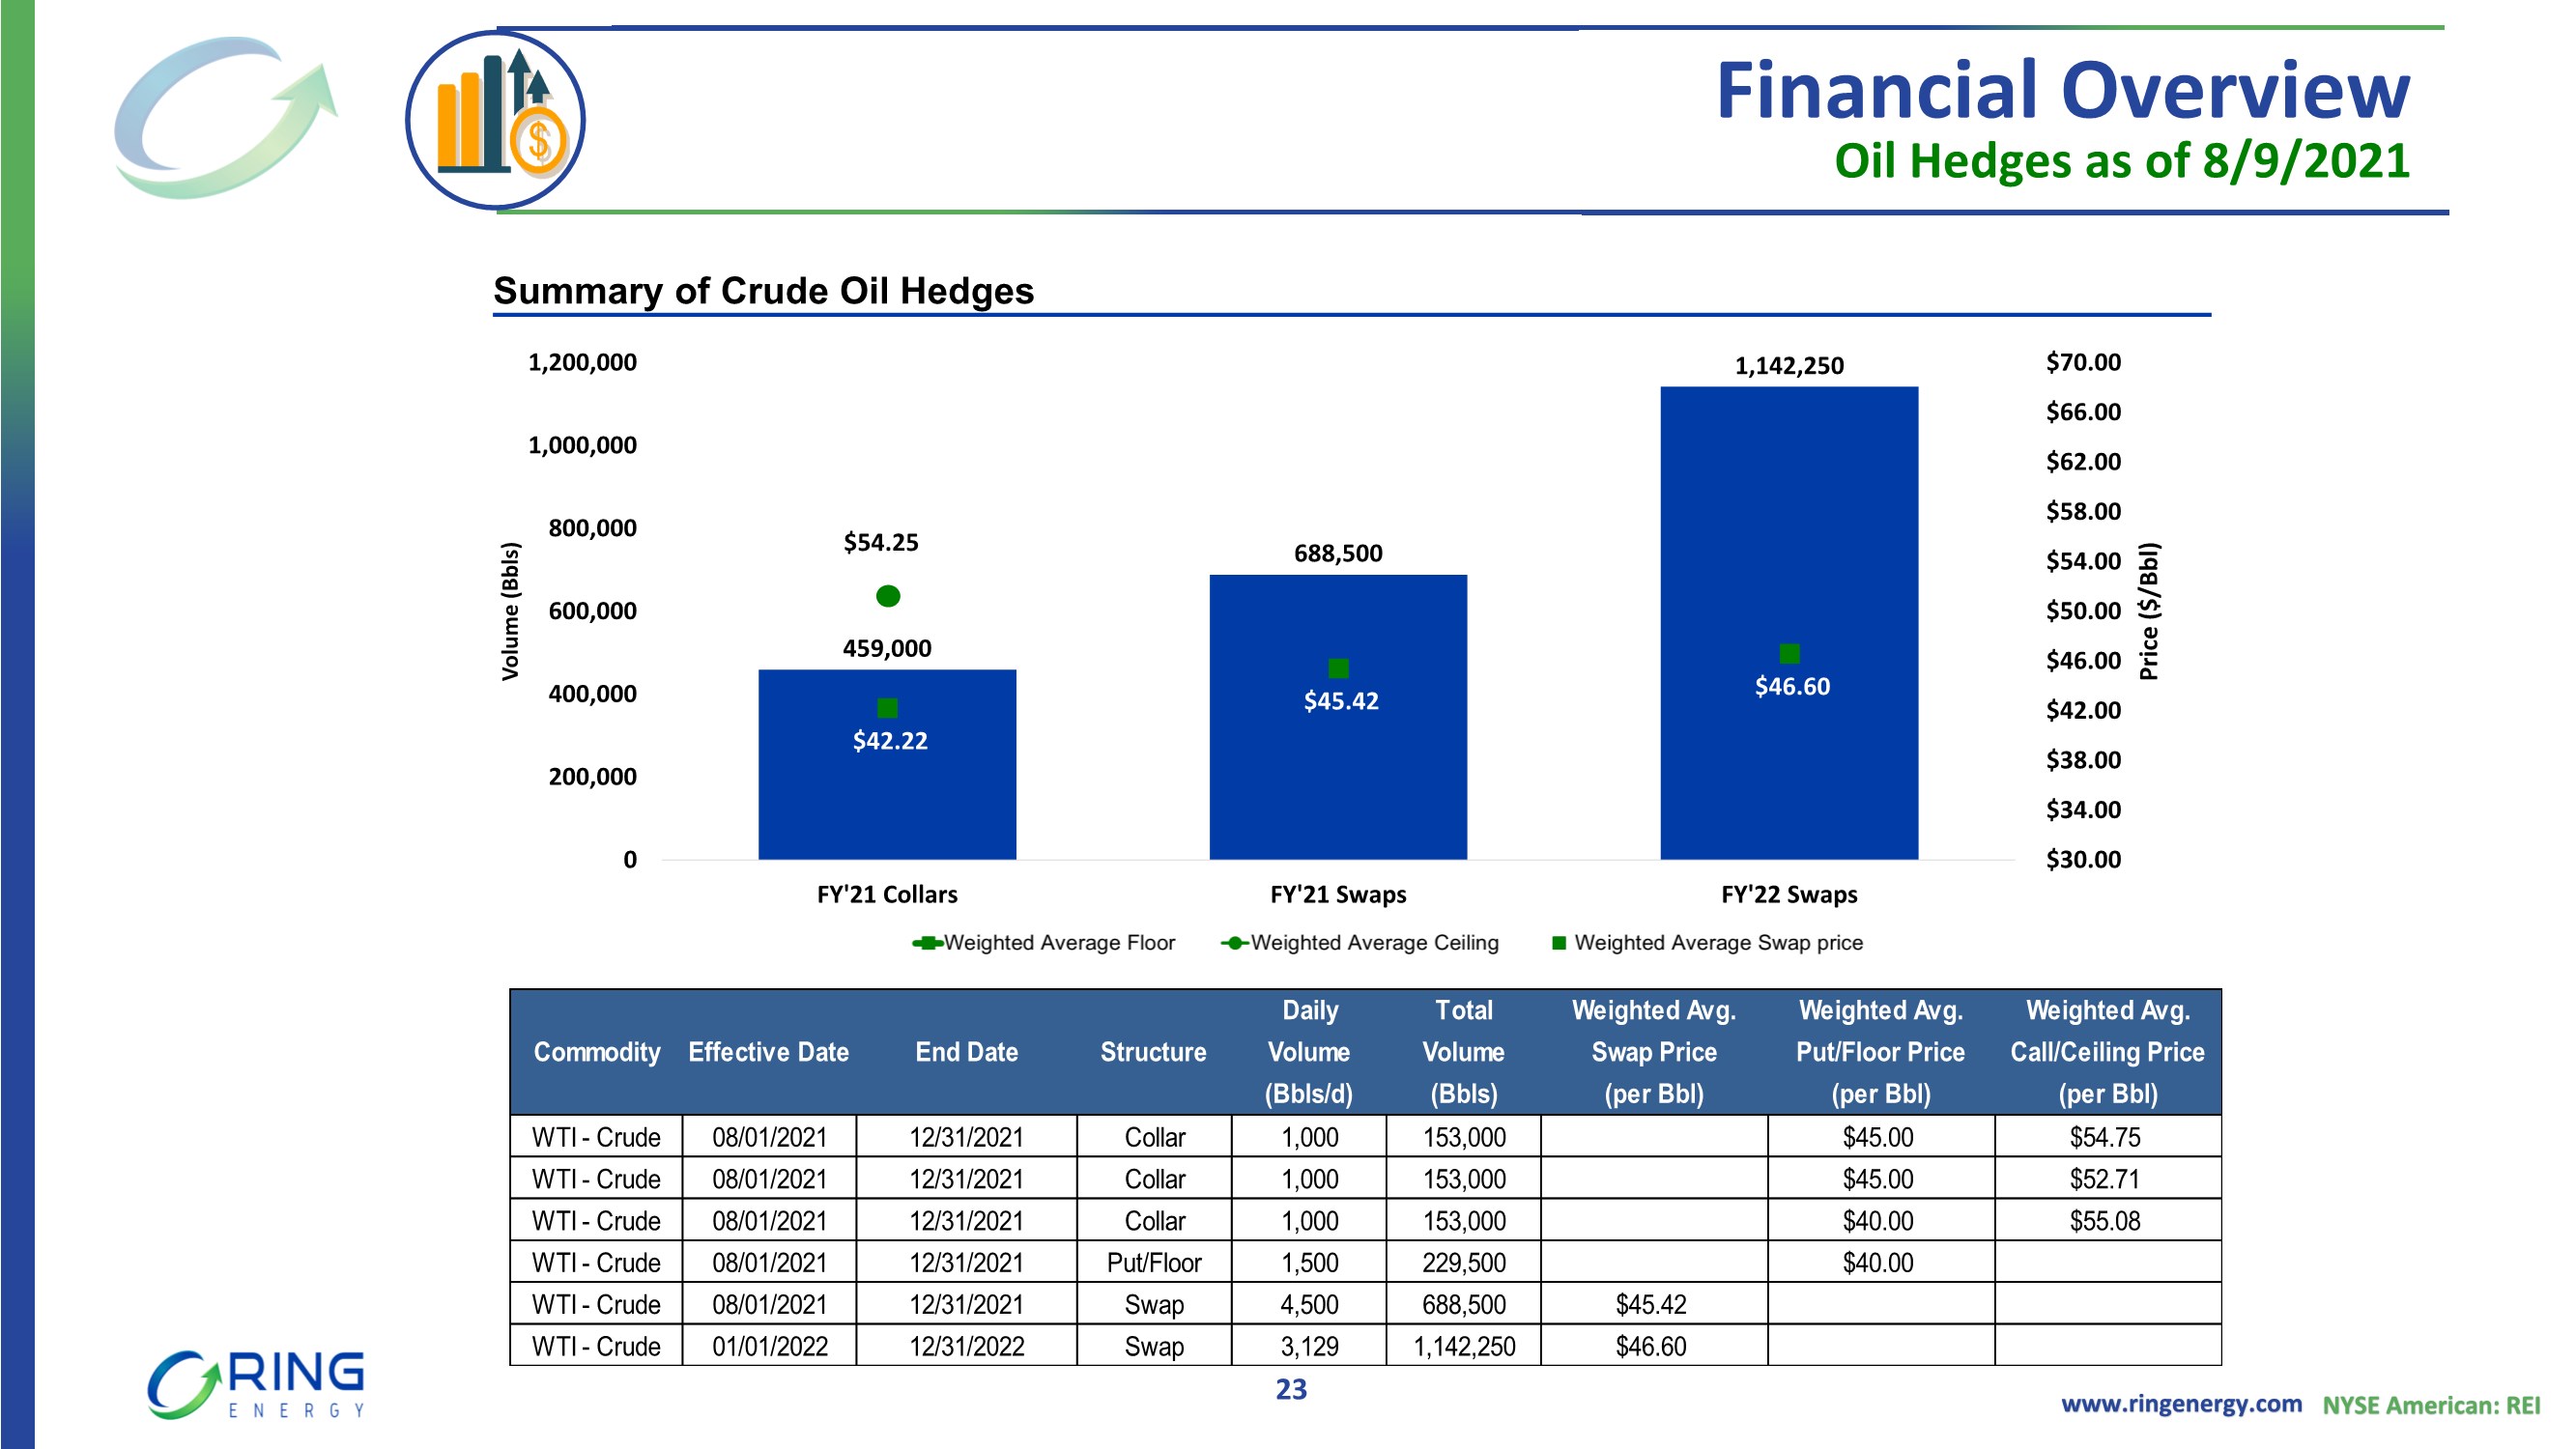
| 02/25/2020 | Calendar year 2021 | Costless Collars | 1,000 | $ | 45.00 | $ | 54.75 | |||||||||||||
| 02/25/2020 | Calendar year 2021 | Costless Collars | 1,000 | $ | 45.00 | $ | 52.71 | |||||||||||||
| 02/27/2020 | Calendar year 2021 | Costless Collars | 1,000 | $ | 40.00 | $ | 55.08 | |||||||||||||
| 03/02/2020 | Calendar year 2021 | Put | 1,500 | $ | 40.00 | |||||||||||||||
| 11/25/2020 | Calendar year 2021 | Swaps | 2,000 | $ | 45.37 | |||||||||||||||
| 12/02/2020 | Calendar year 2021 | Swaps | 500 | $ | 45.38 | |||||||||||||||
| 12/03/2020 | Calendar year 2021 | Swaps | 500 | $ | 45.00 | |||||||||||||||
| 12/04/2020 | Calendar year 2021 | Swaps | 500 | $ | 45.40 | |||||||||||||||
| 12/04/2020 | Calendar year 2021 | Swaps | 500 | $ | 45.60 | |||||||||||||||
| 12/07/2020 | Calendar year 2021 | Swaps | 500 | $ | 45.96 | |||||||||||||||
| 12/04/2020 | Calendar year 2022 | Swaps | 500 | $ | 44.22 | |||||||||||||||
| 12/07/2020 | Calendar year 2022 | Swaps | 500 | $ | 44.75 | |||||||||||||||
| 12/10/2020 | Calendar year 2022 | Swaps | 500 | $ | 44.97 | |||||||||||||||
| 12/17/2020 | Calendar year 2022 | Swaps | 250 | $ | 45.98 | |||||||||||||||
| 01/04/2021 | Calendar year 2022 | Swaps | 250 | $ | 47.00 | |||||||||||||||
| 02/04/2021 | Calendar year 2022 | Swaps | 250 | $ | 50.05 | |||||||||||||||
| 05/11/2021 | Calendar year 2022 | Swaps | 879 | (1) | $ | 49.03 | ||||||||||||||
| (1) The notional quantity per the swap contract entered into on May 11, 2021 is for 26,750 barrels of oil per month. The 879 represents the daily amount on an annual basis. | ||||||||||||||||||||
14
RING ENERGY, INC.
Non-GAAP Information
Certain financial information included in Ring’s financial results are not measures of financial performance recognized by accounting principles generally accepted in the United States, or GAAP. These non-GAAP financial measures are “Adjusted Net Income”, “Adjusted EBITDA”, “Free Cash Flow” and “Cash Flow from Operations”. Management uses these non-GAAP financial measures in its analysis of performance. In addition, Adjusted EBITDA is a key metric used to determine the Company’s incentive compensation awards. These disclosures may not be viewed as a substitute for results determined in accordance with GAAP and are not necessarily comparable to non-GAAP performance measures which may be reported by other companies.
Reconciliation of Net (Loss) Income to Adjusted Net Income
Adjusted Net Income does not include the estimated after-tax impact of share-based compensation, ceiling test impairment, and unrealized loss (gain) on change in fair value of derivatives. Adjusted Net Income is presented because the timing and amount of these items cannot be reasonably estimated and affect the comparability of operating results from period to period, and current periods to prior periods.
| Three Months Ended | Six Months Ended | |||||||||||||||||||
| June 30, | March 31, | June 30, | June 30, | June 30, | ||||||||||||||||
| 2021 | 2021 | 2020 | 2021 | 2020 | ||||||||||||||||
| (Unaudited for All Periods) | ||||||||||||||||||||
| Net (Loss) Income | $ | (15,887,159 | ) | $ | (19,066,093 | ) | $ | (135,000,066 | ) | $ | (34,953,252 | ) | $ | (91,195,948 | ) | |||||
| Share-based compensation | 351,775 | 355,494 | 1,317,542 | 707,269 | 1,991,337 | |||||||||||||||
| Ceiling test write impairment | - | - | 147,937,943 | - | 147,937,943 | |||||||||||||||
| Unrealized loss (gain) on change in fair value of derivatives | 22,840,907 | 25,667,848 | 26,771,529 | 48,508,755 | (20,315,152 | ) | ||||||||||||||
| Tax impact of adjusted items | - | - | (39,545,799 | ) | - | (29,274,627 | ) | |||||||||||||
| Adjusted Net Income | $ | 7,305,523 | $ | 6,957,249 | $ | 1,481,149 | $ | 14,262,772 | $ | 9,143,553 | ||||||||||
| Weighted-Average Shares Outstanding | 99,300,458 | 99,092,715 | 67,980,794 | 99,197,160 | 67,987,295 | |||||||||||||||
| Adjusted Net Income per Share | $ | 0.07 | $ | 0.07 | $ | 0.02 | $ | 0.14 | $ | 0.13 | ||||||||||
15
RING ENERGY, INC.
Non-GAAP Information
Reconciliations of Adjusted EBITDA, Free Cash Flow and Cash Flow from Operations
The Company also presents the non-GAAP financial measures Adjusted EBITDA and Free Cash Flow. The Company defines Adjusted EBITDA as net (loss) income plus net interest expense, unrealized loss on change in fair value of derivatives, ceiling test impairment, income tax (benefit) expense, depreciation, depletion and amortization and accretion, asset retirement obligation accretion and share-based compensation. Company management believes this presentation is relevant and useful because it helps investors understand Ring’s operating performance and makes it easier to compare its results with those of other companies that have different financing, capital and tax structures. Adjusted EBITDA should not be considered in isolation from or as a substitute for net income, as an indication of operating performance or cash flows from operating activities or as a measure of liquidity. Adjusted EBITDA, as Ring calculates it, may not be comparable to Adjusted EBITDA measures reported by other companies. In addition, Adjusted EBITDA does not represent funds available for discretionary use.
The Company defines Free Cash Flow as Adjusted EBITDA (defined above) less net interest expense (excluding amortization of deferred financing cost) and capital expenditures. For this purpose, the Company’s definition of capital expenditures includes costs incurred related to oil and natural gas properties (such as drilling and infrastructure costs and the lease maintenance costs) and equipment, furniture and fixtures, but excludes acquisition costs of oil and gas properties from third parties that are not included in the Company’s capital expenditures guidance provided to investors. Company management believes that Free Cash Flow is an important financial performance measure for use in evaluating the performance and efficiency of its current operating activities after the impact of accrued capital expenditures and net interest expense and without being impacted by items such as changes associated with working capital, which can vary substantially from one period to another. There is no commonly accepted definition Free Cash Flow within the industry. Accordingly, Free Cash Flow, as defined and calculated by the Company, may not be comparable to Free Cash Flow or other similarly named non-GAAP measures reported by other companies. While the Company includes net interest expense in the calculation of Free Cash Flow, other mandatory debt service requirements of future payments of principal at maturity (if such debt is not refinanced) are excluded from the calculation of Free Cash Flow. These and other non-discretionary expenditures that are not deducted from Free Cash Flow would reduce cash available for other uses.
The following tables present (i) a reconciliation of the Company’s net (loss) income, a GAAP measure, to Adjusted EBITDA and (ii) a reconciliation of Adjusted EBITDA, a non-GAAP measure, to Free Cash Flow, as both Adjusted EBITDA and Free Cash Flow are defined by the Company. In addition, a reconciliation of cash flow from operations is presented.
16
| Three Months Ended | Six Months Ended | |||||||||||||||||||
| June 30, | March 31, | June 30, | June 30, | June 30, | ||||||||||||||||
| 2021 | 2021 | 2020 | 2021 | 2020 | ||||||||||||||||
| (Unaudited for All Periods) | ||||||||||||||||||||
| Net (Loss) Income | $ | (15,887,159 | ) | $ | (19,066,093 | ) | $ | (135,000,066 | ) | $ | (34,953,252 | ) | $ | (91,195,948 | ) | |||||
| Interest expense, net | 3,654,528 | 3,741,969 | 4,253,039 | 7,396,497 | 8,501,532 | |||||||||||||||
| Unrealized loss (gain) on change in fair value of derivatives | 22,840,907 | 25,667,848 | 26,771,529 | 48,508,755 | (20,315,152 | ) | ||||||||||||||
| Ceiling test impairment | - | - | 147,937,943 | - | 147,937,943 | |||||||||||||||
| Income tax (benefit) expense | 190,644 | - | (39,116,632 | ) | 190,644 | (26,666,716 | ) | |||||||||||||
| Depreciation, depletion and amortization | 9,275,126 | 8,108,158 | 7,338,108 | 17,383,284 | 21,021,104 | |||||||||||||||
| Asset retirement obligation accretion | 184,013 | 193,744 | 231,367 | 377,757 | 463,329 | |||||||||||||||
| Share-based compensation | 351,775 | 355,494 | 1,317,542 | 707,269 | 1,991,337 | |||||||||||||||
| Adjusted EBITDA | $ | 20,609,834 | $ | 19,001,120 | $ | 13,732,830 | $ | 39,610,954 | $ | 41,737,429 | ||||||||||
| Adjusted EBITDA Margin | 43 | % | 48 | % | 129 | % | 45 | % | 83 | % | ||||||||||
| Weighted-Average Shares Outstanding | 99,300,458 | 99,092,715 | 67,980,794 | 99,197,160 | 67,987,295 | |||||||||||||||
| Adjusted EBITDA per Share | $ | 0.21 | $ | 0.19 | $ | 0.20 | $ | 0.40 | $ | 0.61 | ||||||||||
| Three Months Ended | Six Months Ended | |||||||||||||||||||
| June 30, | March 31, | June 30, | June 30, | June 30, | ||||||||||||||||
| 2021 | 2021 | 2020 | 2021 | 2020 | ||||||||||||||||
| (Unaudited for All Periods) | ||||||||||||||||||||
| Adjusted EBITDA | $ | 20,609,834 | $ | 19,001,120 | $ | 13,732,830 | $ | 39,610,954 | $ | 41,737,429 | ||||||||||
| Net interest expense (excluding amortization of deferred financing costs) | (3,507,304 | ) | (3,558,942 | ) | (4,063,956 | ) | (7,066,246 | ) | (8,123,367 | ) | ||||||||||
| Capital expenditures | (11,456,062 | ) | (14,525,436 | ) | (1,823,642 | ) | (25,981,498 | ) | (17,796,828 | ) | ||||||||||
| Proceeds from divestiture of oil and natural gas properties | - | 2,000,000 | - | 2,000,000 | - | |||||||||||||||
| Free Cash Flow | $ | 5,646,468 | $ | 2,916,742 | $ | 7,845,232 | $ | 8,563,210 | $ | 15,817,234 | ||||||||||
| Three Months Ended | Six Months Ended | |||||||||||||||||||
| June 30, | March 31, | June 30, | June 30, | June 30, | ||||||||||||||||
| 2021 | 2021 | 2020 | 2021 | 2020 | ||||||||||||||||
| (Unaudited for All Periods) | ||||||||||||||||||||
| Net Cash Provided by Operating Activities | $ | 16,322,996 | $ | 15,687,684 | $ | 2,648,326 | $ | 32,010,680 | $ | 30,186,083 | ||||||||||
| Changes in operating assets and liabilities | 779,534 | (245,506 | ) | 7,020,548 | 534,028 | 3,427,979 | ||||||||||||||
| Cash Flow from Operations | $ | 17,102,530 | $ | 15,442,178 | $ | 9,668,874 | $ | 32,544,708 | $ | 33,614,062 | ||||||||||
17
Exhibit 99.2
| www.ringenergy.com NYSE American: REI www.ringenergy.com NYSE American: REI FRESH PERSPECTIVE PROVEN STRATEGY |
| www.ringenergy.com NYSE American: REI Forward-Looking Statements and Cautionary Note Regarding Hydrocarbon Disclosures 2 Forward –Looking Statements This Presentation includes "forward-looking statements" within the meaning of the Private Securities Litigation Reform Act of 1995, the Securities Act of 1933, as amended, and the Securities Exchange Act of 1934, as amended. All statements, other than statements of strictly historical facts included in this Presentation constitute forward-looking statements and may often, but not always, be identified by the use of such words as “may,” “will,” “should,” “could,” “intends,” “estimates,” “expects,” “anticipates,” “plans,” “guidance,” “target,” “potential,” “possible,” “probably,” and “believes” or the negative variations thereof or comparable terminology. These forward-looking statements include statements regarding the Company's financial position, future revenues, net income, potential evaluations, business strategy and plans and objectives for future operations. Forward-looking statements are subject to numerous assumptions, risks and uncertainties that may cause actual results to be materially different than any future results expressed or implied in those statements. However, whether actual results and developments will conform to expectations is subject to a number of material risks and uncertainties, including but not limited to: declines in oil, natural gas liquids or natural gas prices; the level of success in exploration, development and production activities; the timing of exploration and development expenditures; inaccuracies of reserve estimates or assumptions underlying them; revisions to reserve estimates as a result of changes in commodity prices; impacts to financial statements as a result of impairment write-downs; risks related to level of indebtedness and periodic redeterminations of the borrowing base under the Company’s credit facility; the impacts of hedging on results of operations; the Company’s ability to replace oil and natural gas reserves; any loss of senior management or technical personnel; and the direct and indirect impact on most or all of the foregoing on the evolving COVID-19 pandemic. Some of the factors that could cause actual results to differ materially from expected results are described under “Risk Factors” in our 2020 annual report on Form 10-K filed with the U.S. Securities and Exchange Commission (“SEC”) on March 16, 2021, and in our subsequent quarterly reports on Form 10-Q and current reports on Form 8-K. Although the Company believes that the assumptions upon which such forward-looking statements are based are reasonable, it can give no assurance that such assumptions will prove to be correct. All forward-looking statements in this Presentation are expressly qualified by the cautionary statements and by reference to the underlying assumptions that may prove to be incorrect. The Company undertakes no obligation to publicly revise these forward-looking statements to reflect events or circumstances that arise after the date hereof, except as required by applicable law. The financial and operating projections contained in this presentation represent our reasonable estimates as of the date of this presentation. Neither our auditors nor any other third party has examined, reviewed or compiled the projections and, accordingly, none of the foregoing expresses an opinion or other form of assurance with respect thereto. The assumptions upon which the projections are based are described in more detail herein. Some of these assumptions inevitably will not materialize, and unanticipated events may occur that could affect our results. Therefore, our actual results achieved during the periods covered by the projections will vary from the projected results. Prospective investors are cautioned not to place undue reliance on the projections included herein. Cautionary Note regarding Hydrocarbon Disclosures The SEC has generally permitted oil and natural gas companies, in their filings with the SEC, to disclose proved reserves, which are reserve estimates that geological and engineering data demonstrate with reasonable certainty to be recoverable in future years from known reservoirs under existing economic and operating conditions, and certain probable and possible reserves that meet the SEC’s definitions for such terms. We use the terms “estimated ultimate recovery,” or “EURs,” “probable,” “possible,” and “non-proven” reserves, reserve “potential” or “upside” or other descriptions of volumes of reserves potentially recoverable through additional drilling or recovery techniques that the SEC’s guidelines prohibit us from including in filings with the SEC. Reference to EURs (estimated ultimate recovery) of natural gas and oil includes amounts that are not yet classified as proved reserves under SEC definitions, but that we believe will ultimately be produced and are based on previous operating experience in a given area and publicly available information relating to the operations of producers who are conducting operations in these areas. These estimates are by their nature more speculative than estimates of proved reserves and accordingly are subject to substantially greater risk of being actually realized by us. Factors affecting the ultimate recovery of reserves that may be recovered include the scope of our drilling program, which will be directly affected by capital availability, drilling and production costs, commodity prices, availability of services and equipment, permit expirations, transportation constraints, regulatory approvals and other factors, and actual drilling results, including geological and mechanical factors affecting recovery rates. Accordingly, actual quantities that may be recovered from our interests will differ from our estimates and could be significantly less than our targeted recovery rate. In addition, our estimates may change significantly as we receive additional data. Supplemental Non-GAAP Financial Measures This Presentation includes financial measures that are not in accordance with generally accepted accounting principles (“GAAP”), such as “Adjusted Net Income,” “Adjusted EBITDA,” “PV-10,” “Free Cash Flow,” or “FCF,” and “Cash Flow from Operations.” While management believes that such measures are useful for investors, they should not be used as a replacement for financial measures that are in accordance with GAAP. For definitions of such non-GAAP financial measures, please see the Appendix. |
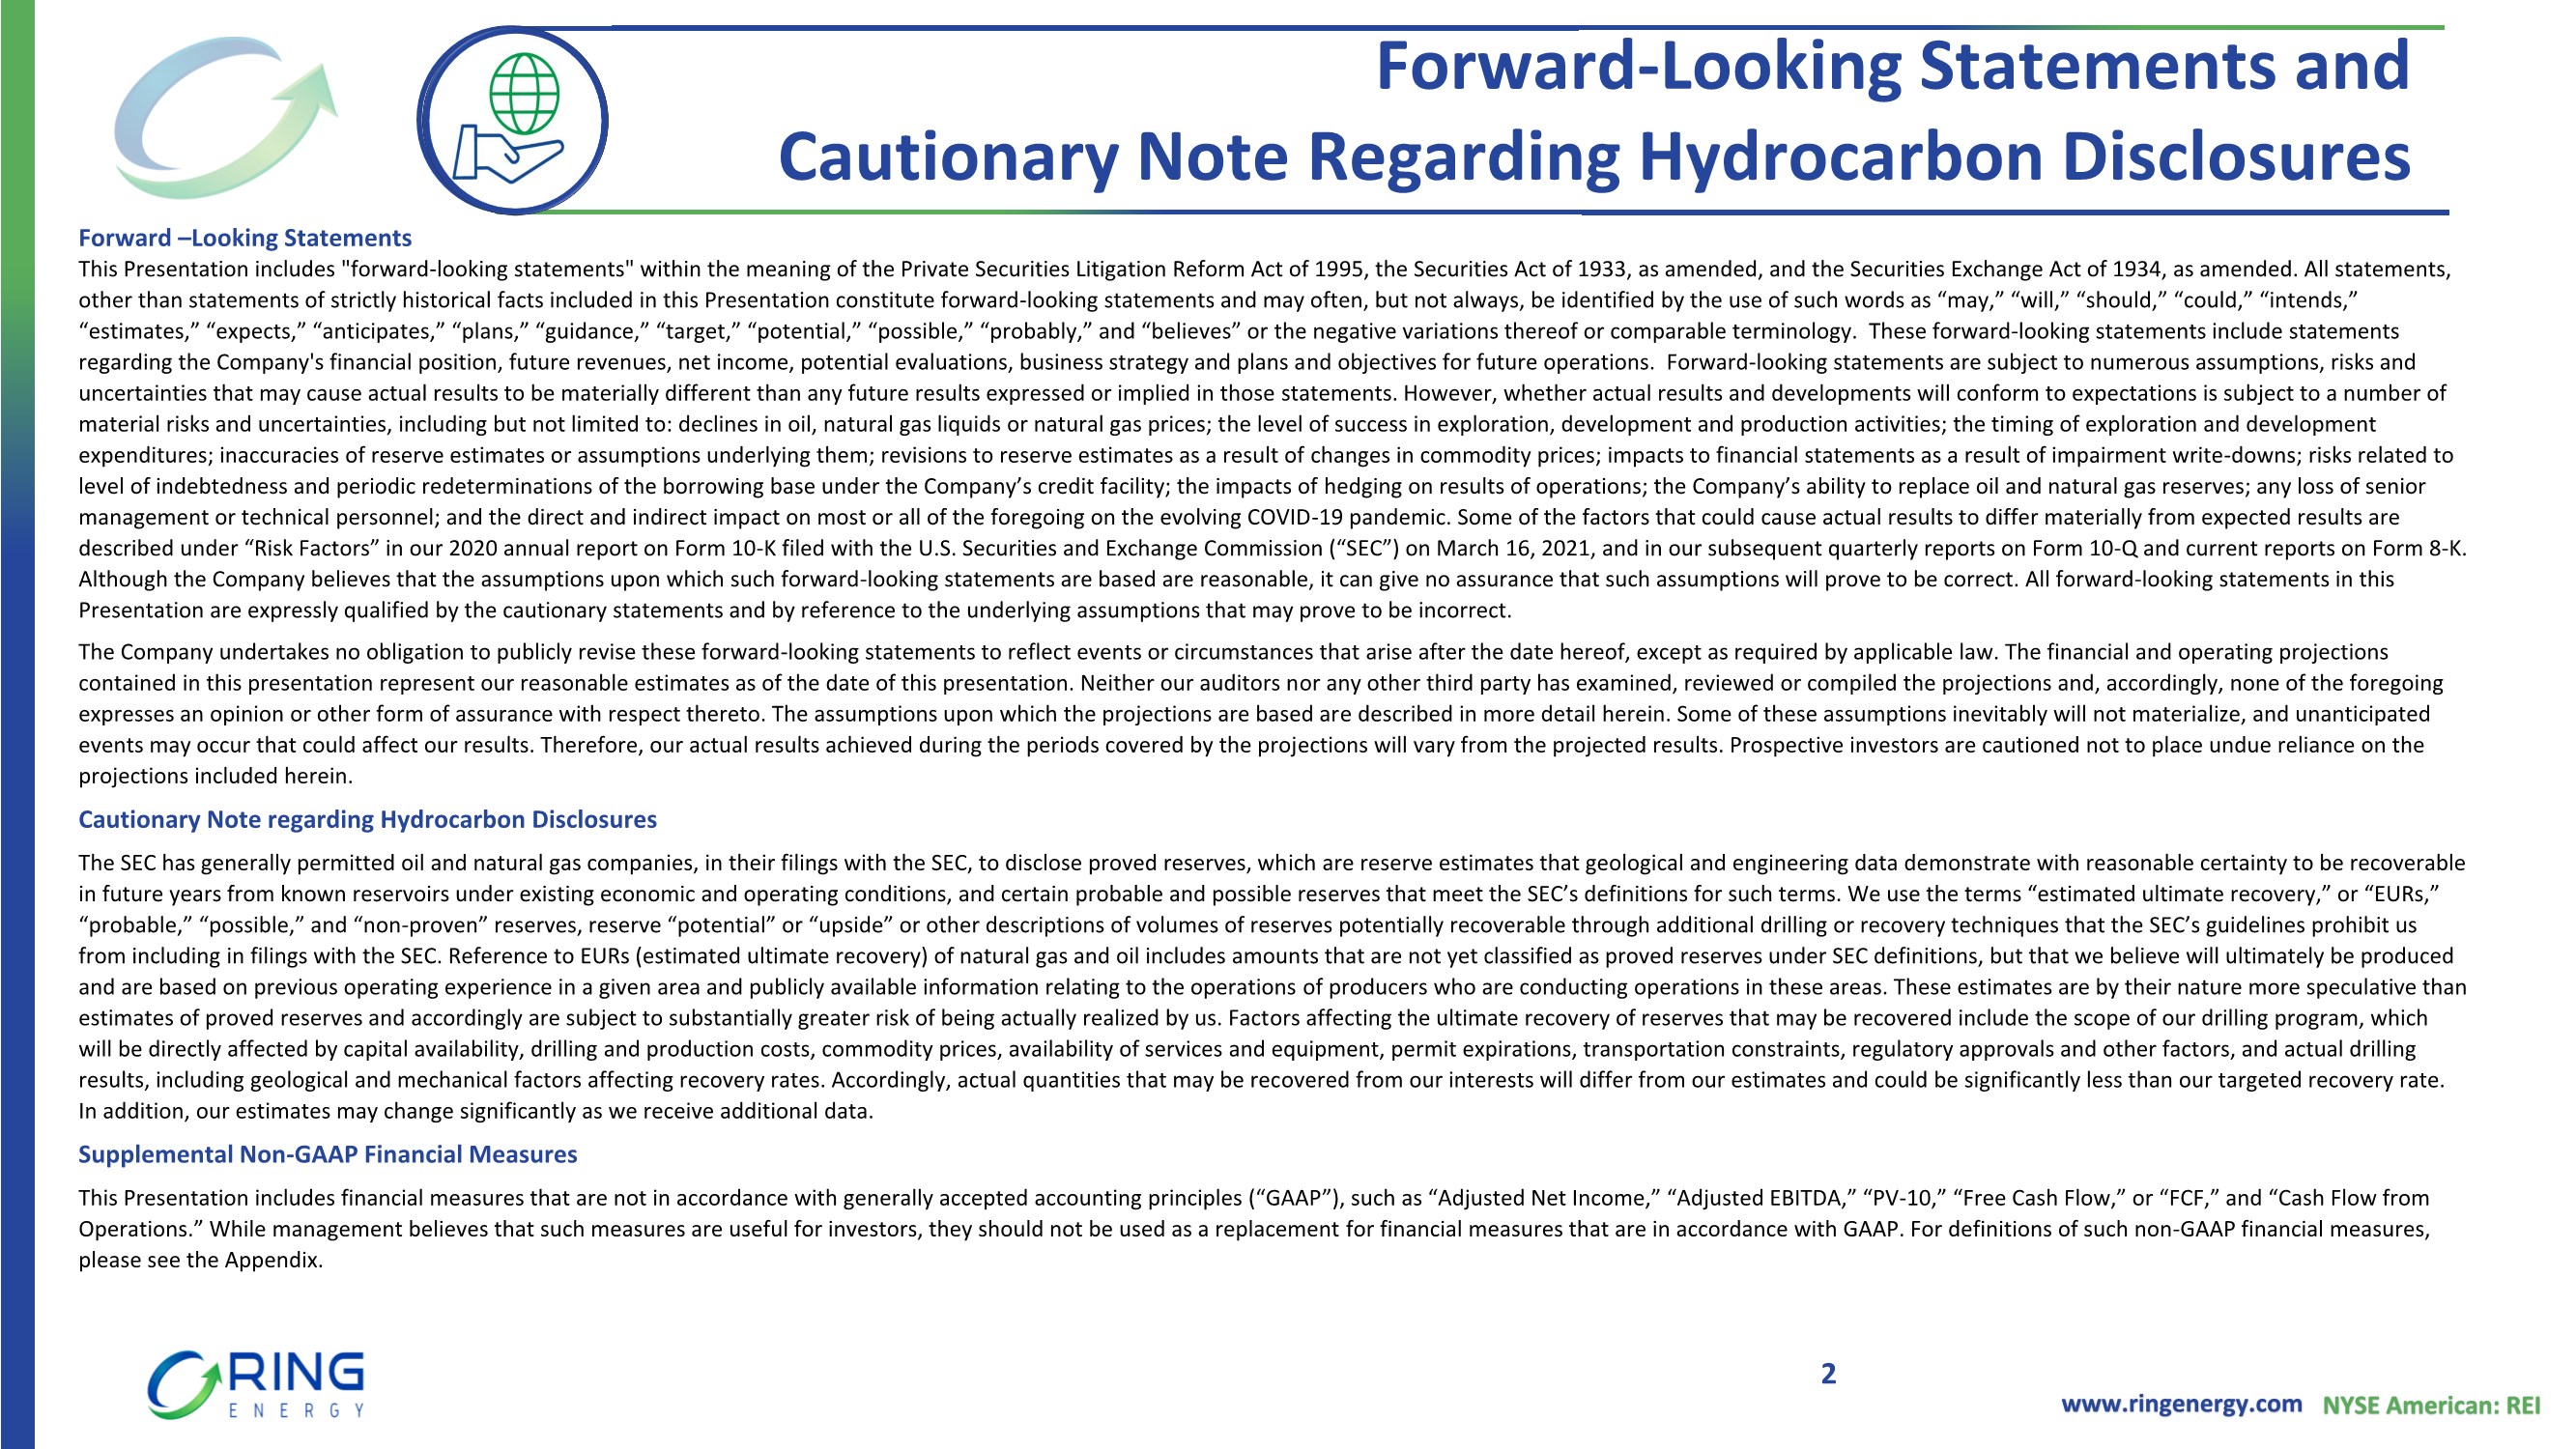
| www.ringenergy.com NYSE American: REI Currently Focused on Conventional Permian Assets in Texas & New Mexico 2020 SEC Proved Reserves 76.5 MMBoe/PV10 $638MM 87% Oil 2Q21 EBITDA / FCF1 $20.6 MM / $5.6 MM 2Q21 Avg Net Sales 8,709 Boe/d 89% oil 2Q21 Capital Projects2 ~$6.0 MM 5 CTR’s3, 13 Cap Workovers & Cap Maintenance 2Q21 D&C Capex ~ $5.4 MM 2Q21 3 Hz wells Gross / Net Acres 104,455 / 76,745 Ring Energy – Independent Oil & Gas Company Deliver competitive and sustainable returns by developing, acquiring, exploring for, and commercializing oil and natural gas resources VITAL TO THE WORLD’S HEALTH AND WELFARE 1. FCF = Adj EBITDA – net interest expense – capital + divestiture proceeds 2. Capital projects include: CTR’s, re-activations, re-completions, leasing costs, and workovers that add proved reserves. 3. CTR is convert to rod pump from ESP 4. Adjusted EBITDA and Free Cash Flow are Non-GAAP financial measures and reconciled in Ring’s earnings releases 3 Market Cap $259 million (as of August 6,2021) Consistently Generating Positive Cash Flow NWS CBP DB NEW MEXICO “NWS” North West Shelf “CBP” Central Basin Platform “DB” Delaware Basin Core Areas Non-Core Area |
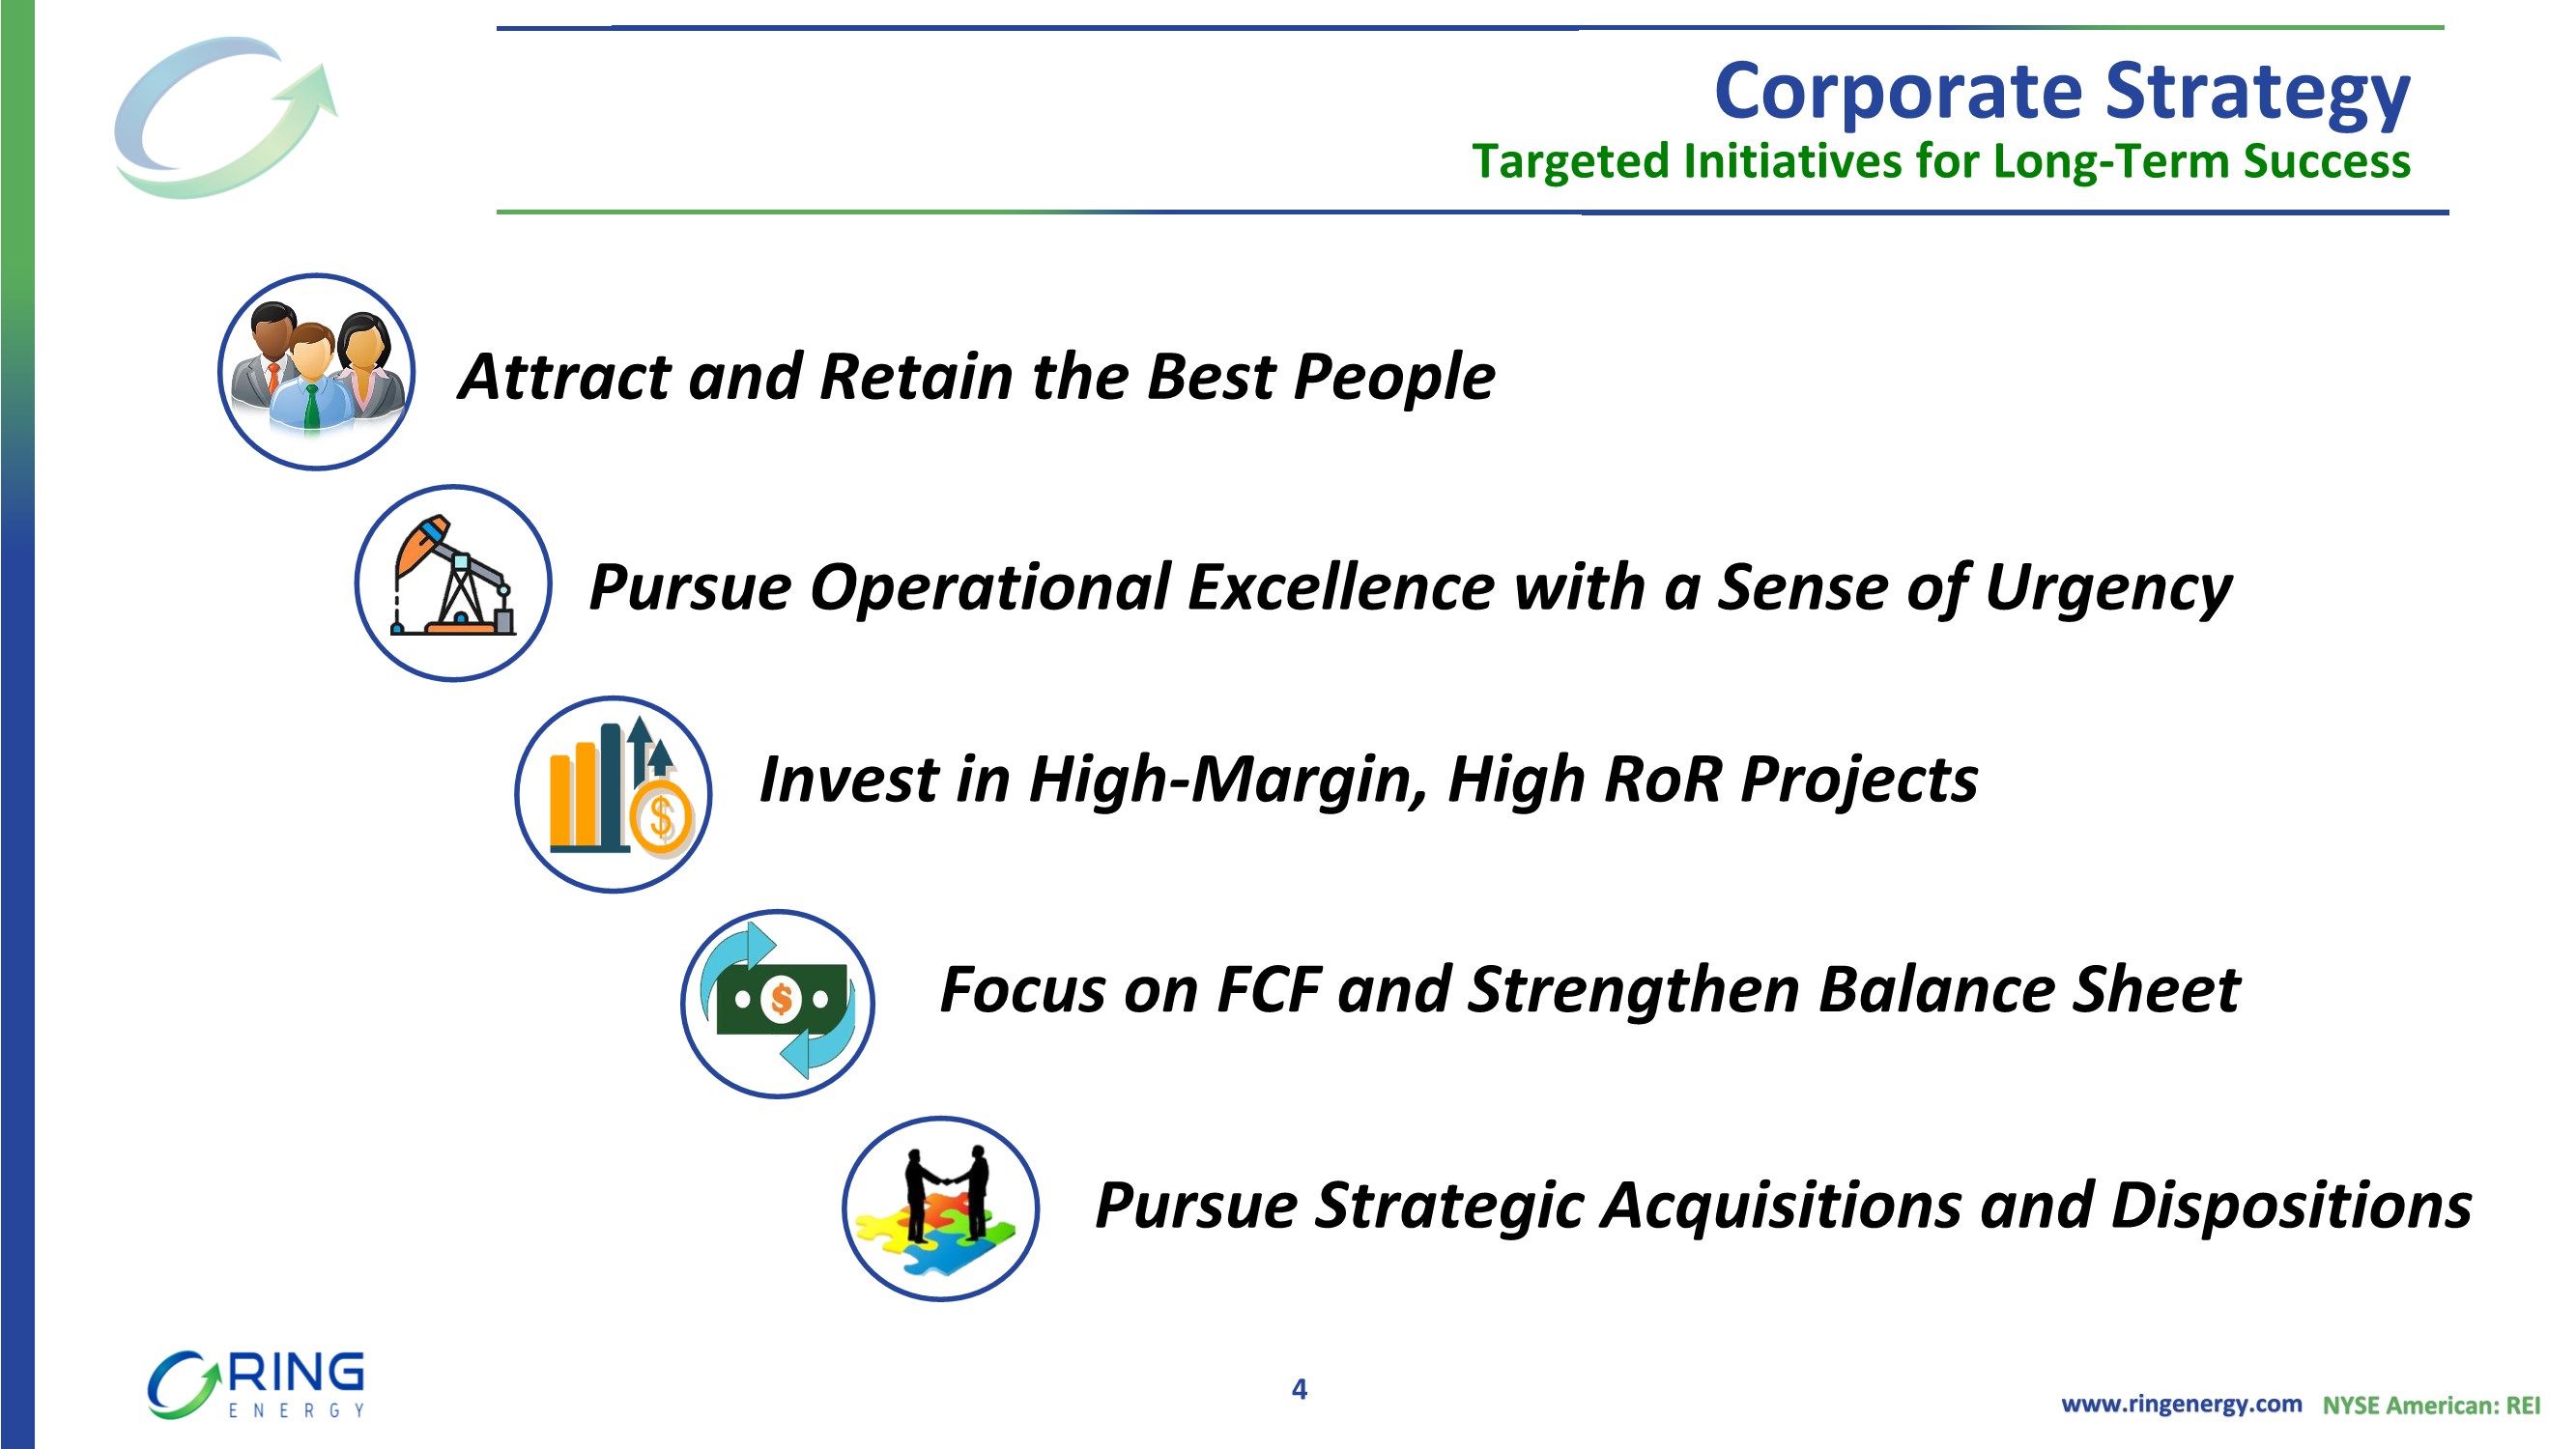
| www.ringenergy.com NYSE American: REI Corporate Strategy Targeted Initiatives for Long-Term Success Attract and Retain the Best People Pursue Operational Excellence with a Sense of Urgency Invest in High-Margin, High RoR Projects Focus on FCF and Strengthen Balance Sheet Pursue Strategic Acquisitions and Dispositions 4 |
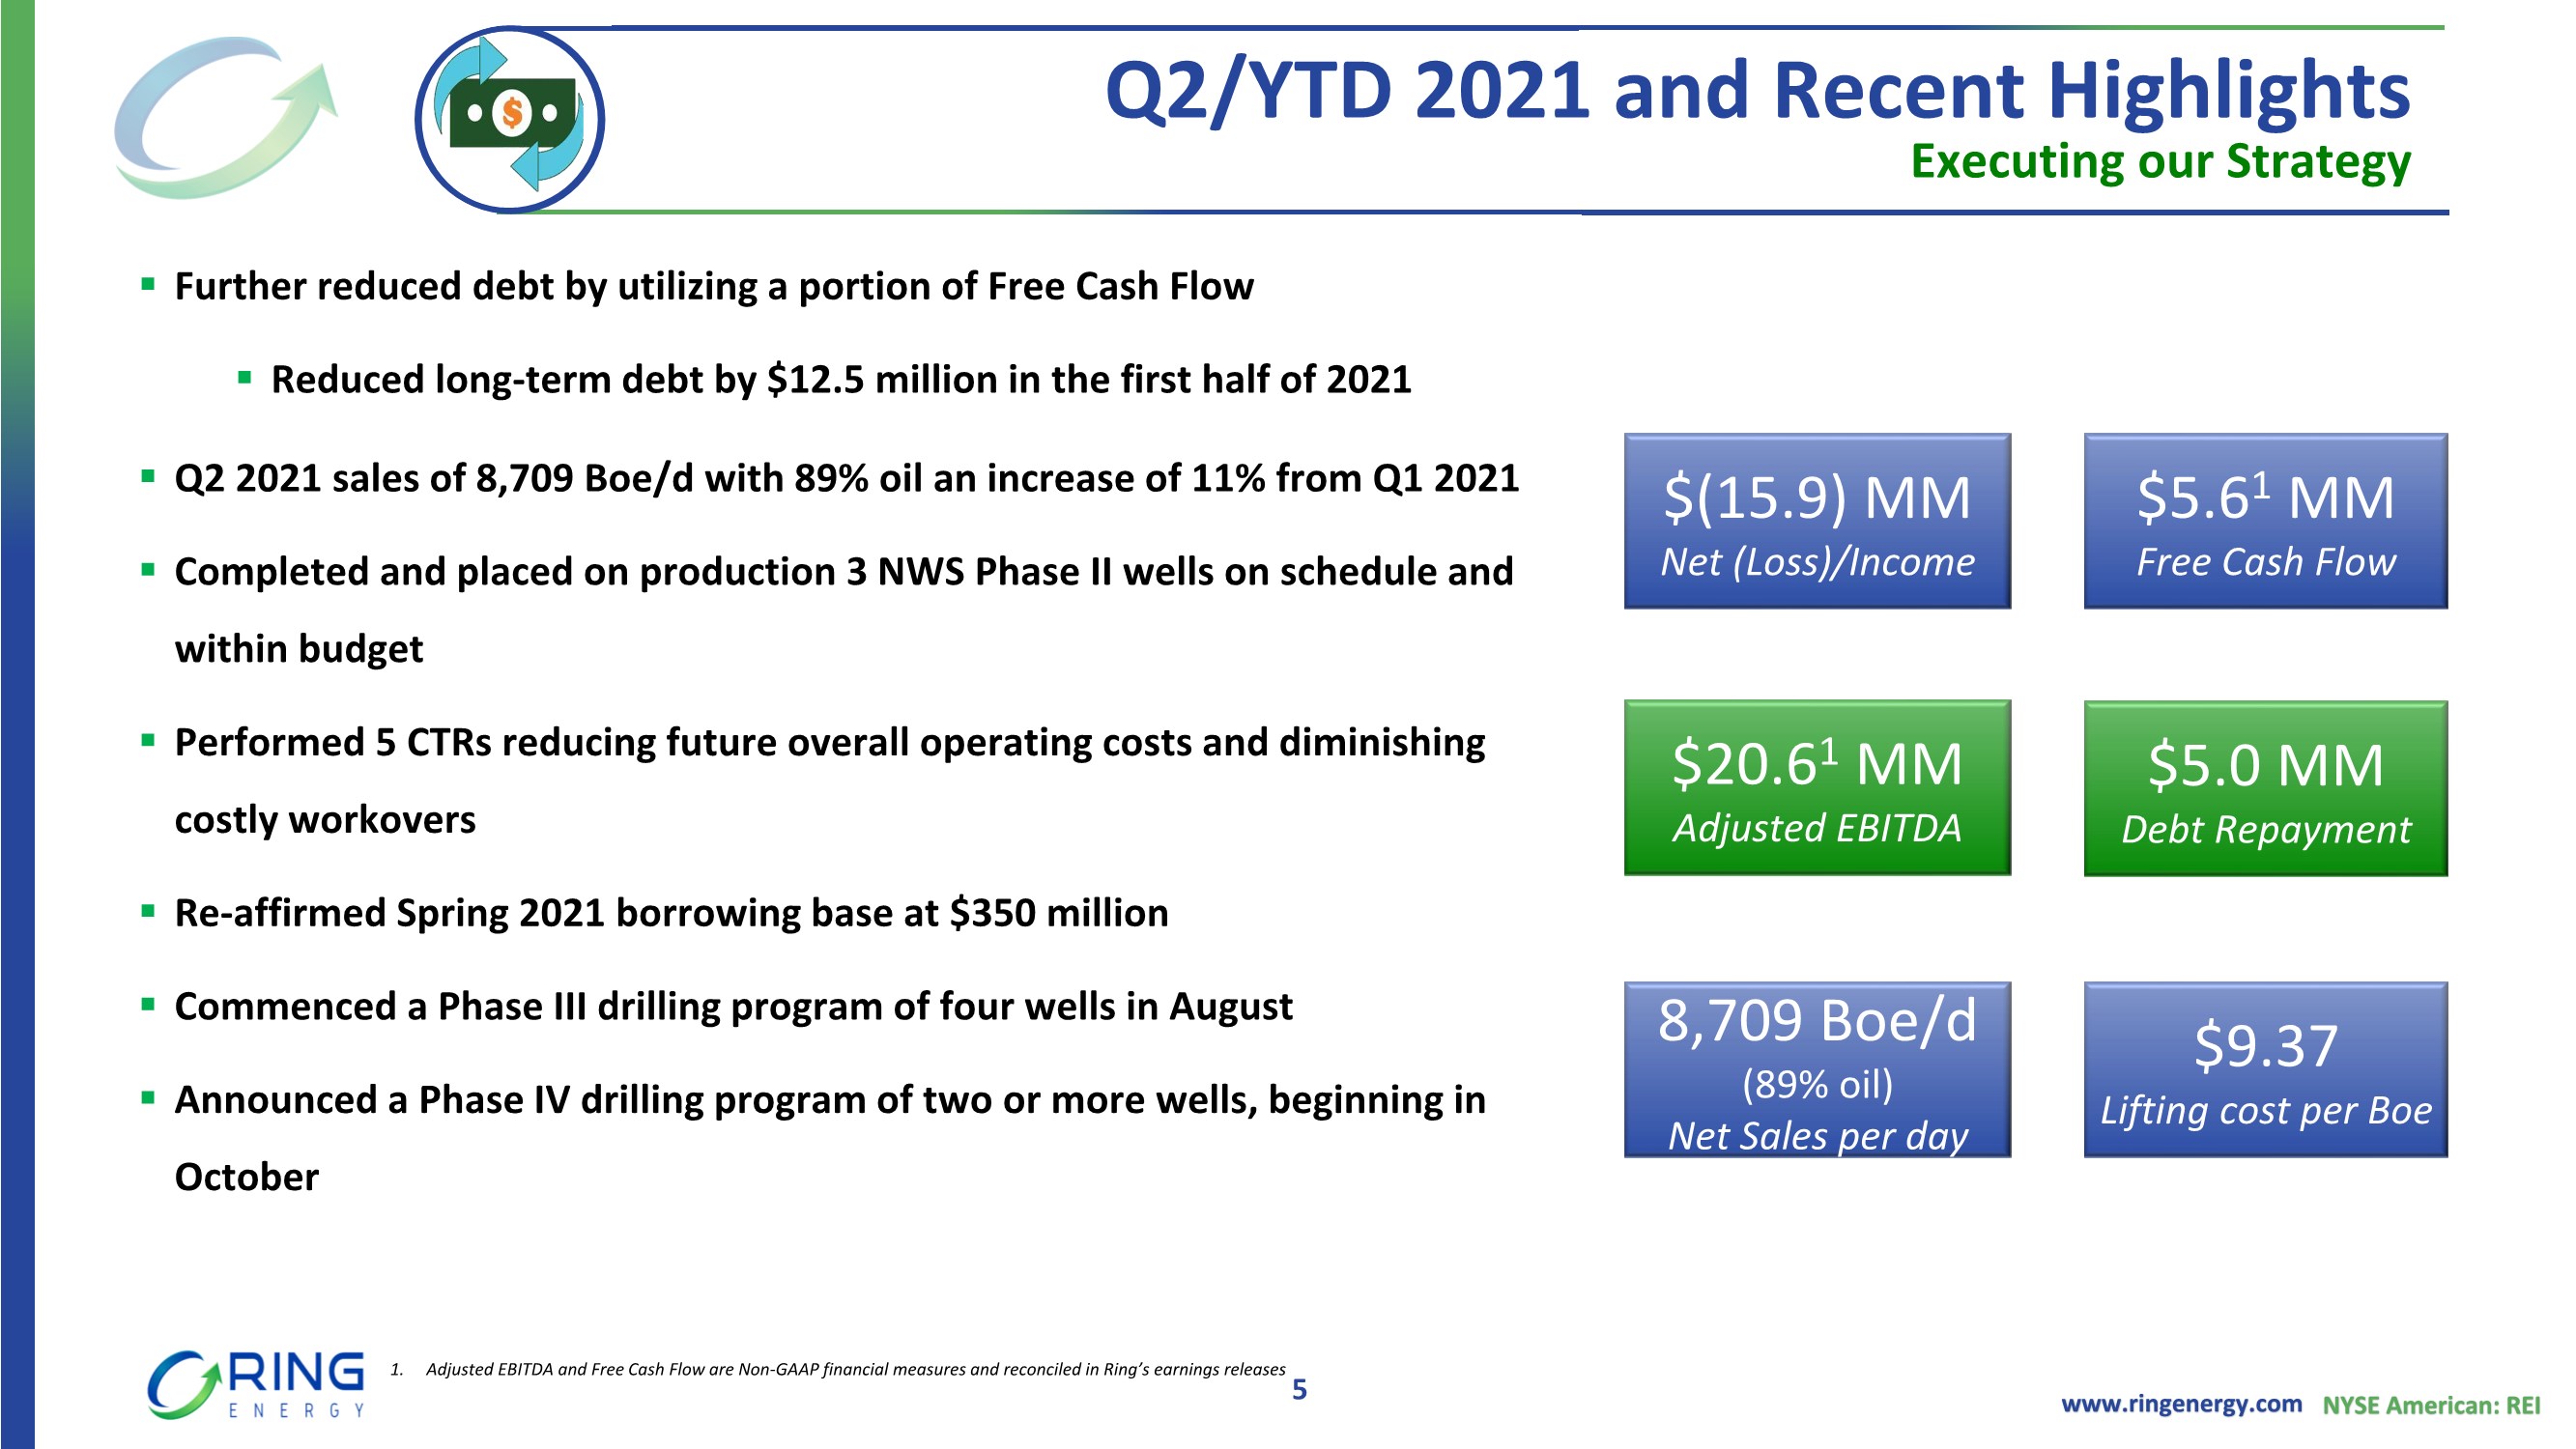
| www.ringenergy.com NYSE American: REI Q2/YTD 2021 and Recent Highlights Executing our Strategy 5 ▪ Further reduced debt by utilizing a portion of Free Cash Flow ▪ Reduced long-term debt by $12.5 million in the first half of 2021 ▪ Q2 2021 sales of 8,709 Boe/d with 89% oil an increase of 11% from Q1 2021 ▪ Completed and placed on production 3 NWS Phase II wells on schedule and within budget ▪ Performed 5 CTRs reducing future overall operating costs and diminishing costly workovers ▪ Re-affirmed Spring 2021 borrowing base at $350 million ▪ Commenced a Phase III drilling program of four wells in August ▪ Announced a Phase IV drilling program of two or more wells, beginning in October $5.61 MM Free Cash Flow $20.61 MM Adjusted EBITDA $(15.9) MM Net (Loss)/Income $5.0 MM Debt Repayment 8,709 Boe/d (89% oil) Net Sales per day $9.37 Lifting cost per Boe 1. Adjusted EBITDA and Free Cash Flow are Non-GAAP financial measures and reconciled in Ring’s earnings releases |
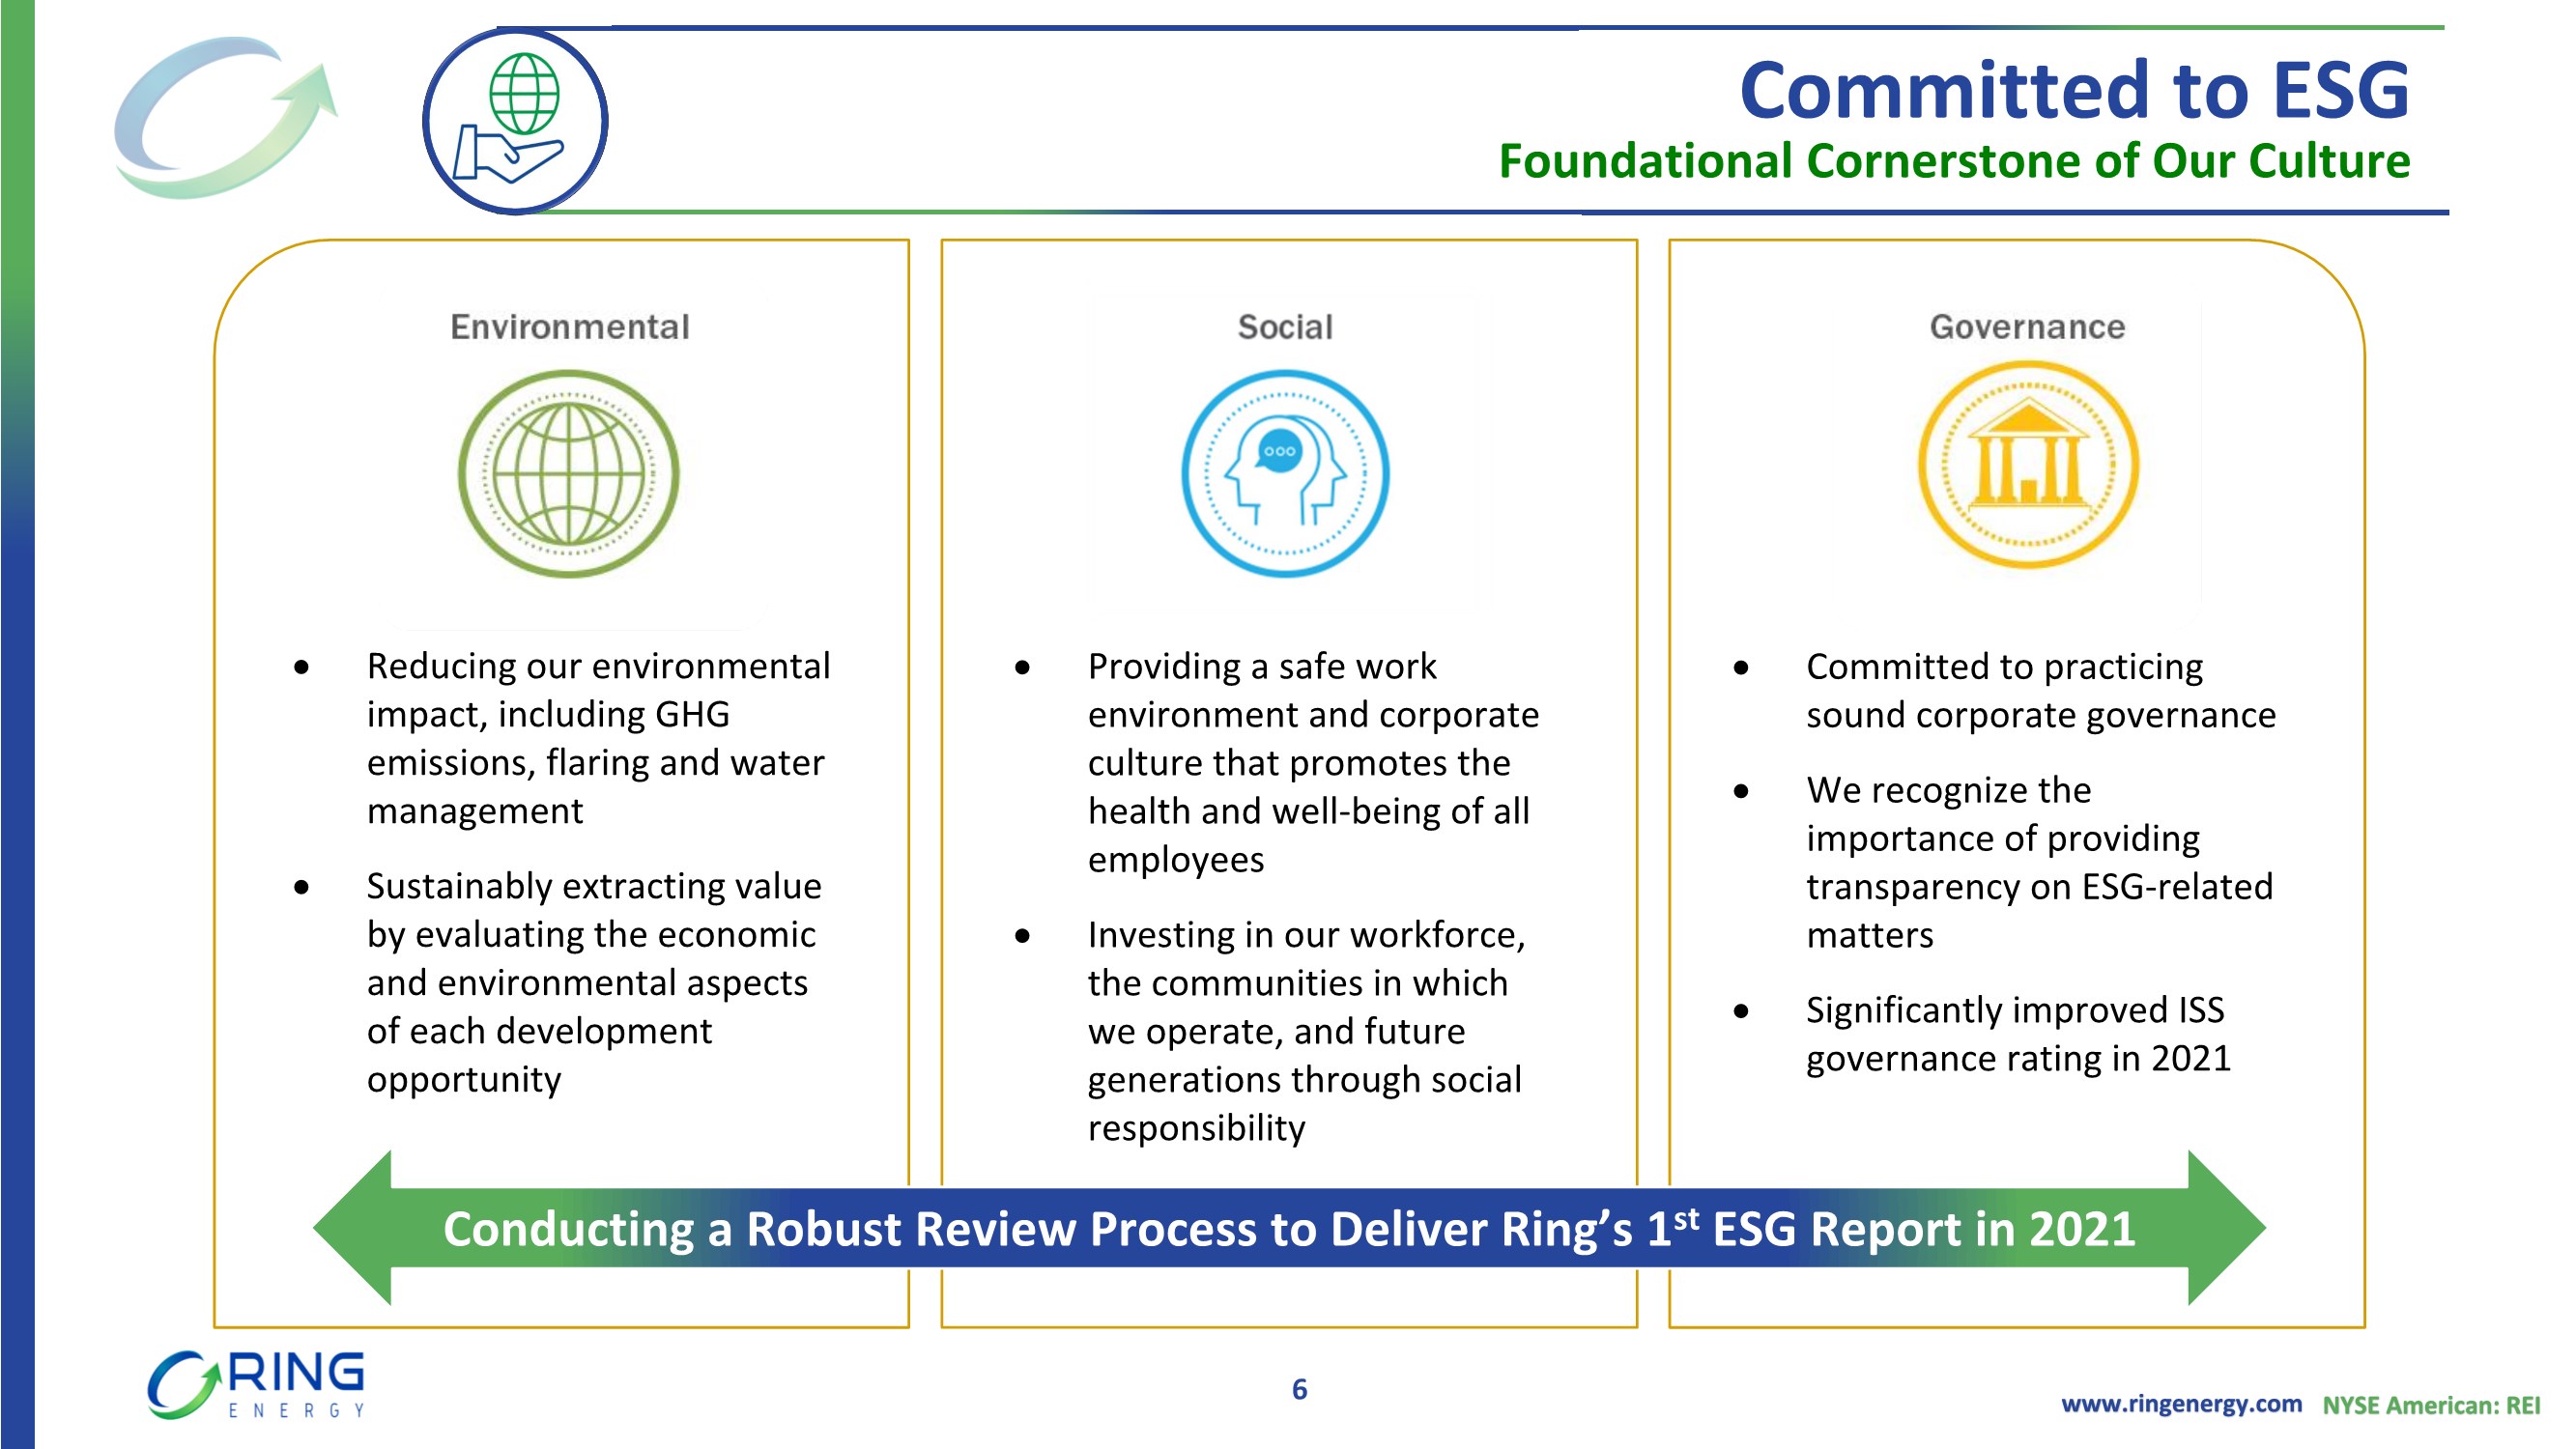
| www.ringenergy.com NYSE American: REI Committed to ESG Foundational Cornerstone of Our Culture 6 • Providing a safe work environment and corporate culture that promotes the health and well-being of all employees • Investing in our workforce, the communities in which we operate, and future generations through social responsibility • Committed to practicing sound corporate governance • We recognize the importance of providing transparency on ESG-related matters • Significantly improved ISS governance rating in 2021 • Reducing our environmental impact, including GHG emissions, flaring and water management • Sustainably extracting value by evaluating the economic and environmental aspects of each development opportunity Conducting a Robust Review Process to Deliver Ring’s 1st ESG Report in 2021 |
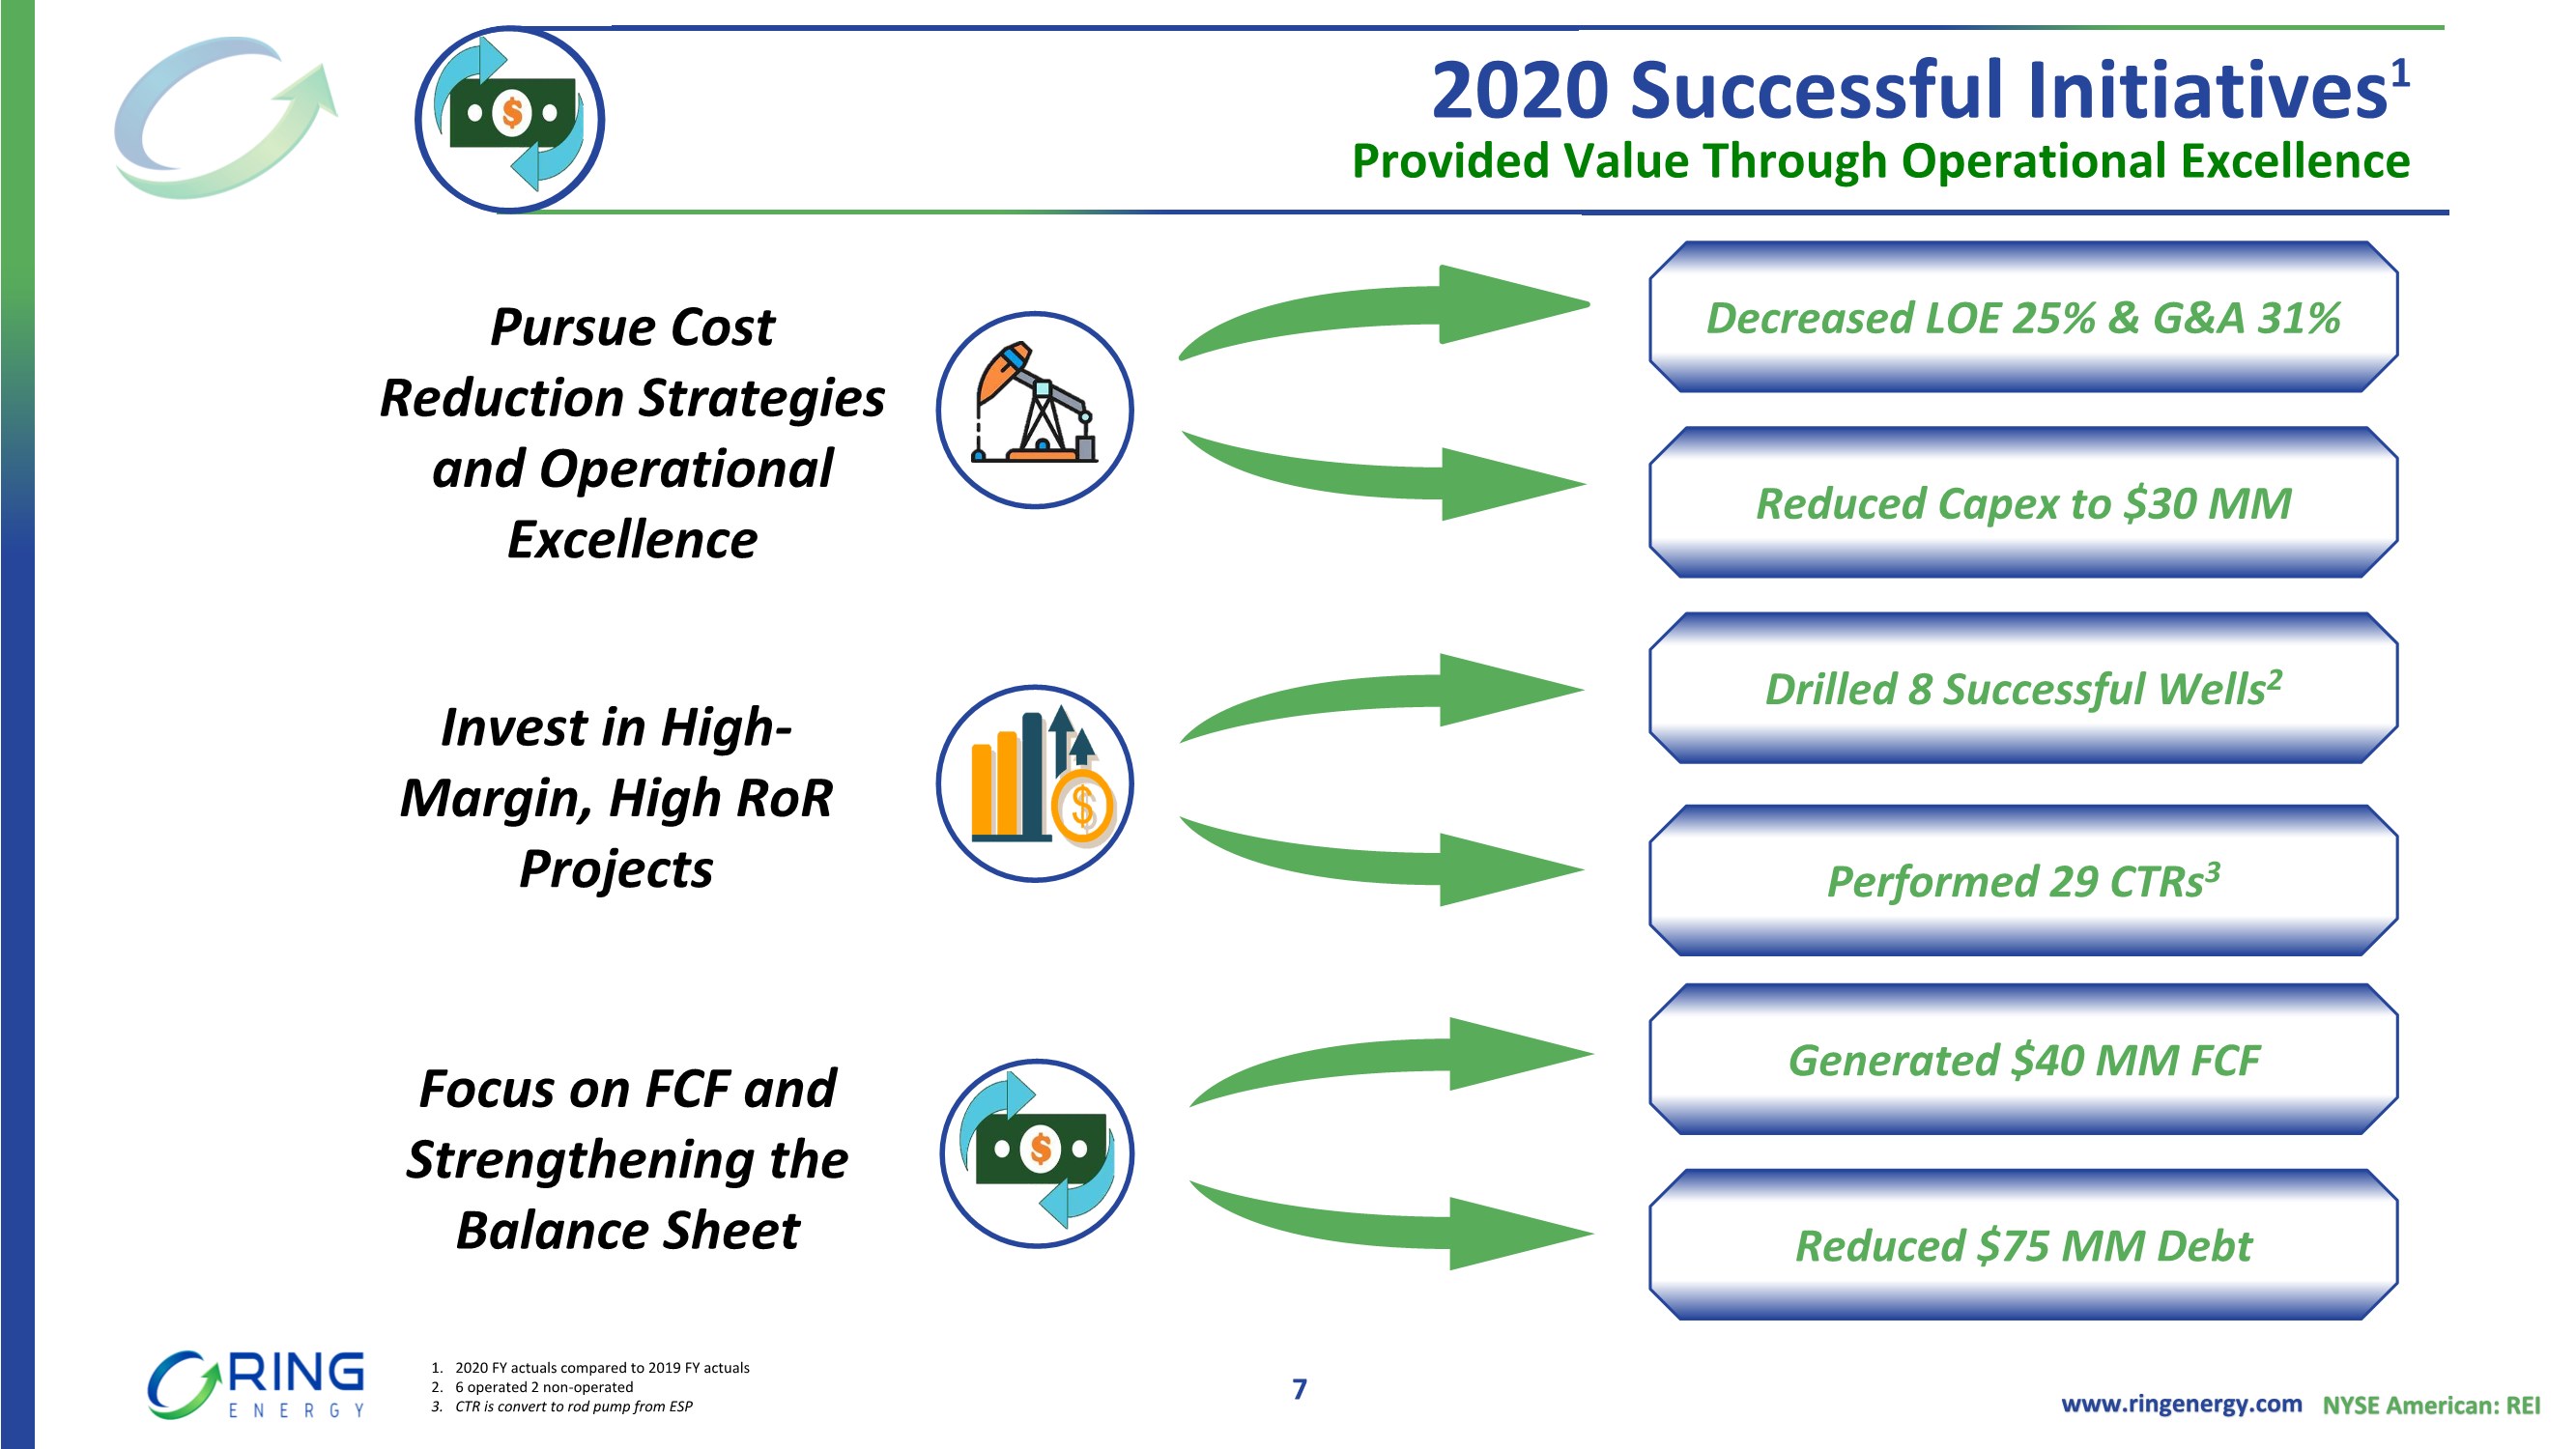
| www.ringenergy.com NYSE American: REI Focus on FCF and Strengthening the Balance Sheet Invest in High- Margin, High RoR Projects Drilled 8 Successful Wells2 Reduced Capex to $30 MM Decreased LOE 25% & G&A 31% Generated $40 MM FCF Reduced $75 MM Debt 7 Performed 29 CTRs3 Provided Value Through Operational Excellence 2020 Successful Initiatives1 1. 2020 FY actuals compared to 2019 FY actuals 2. 6 operated 2 non-operated 3. CTR is convert to rod pump from ESP Pursue Cost Reduction Strategies and Operational Excellence |
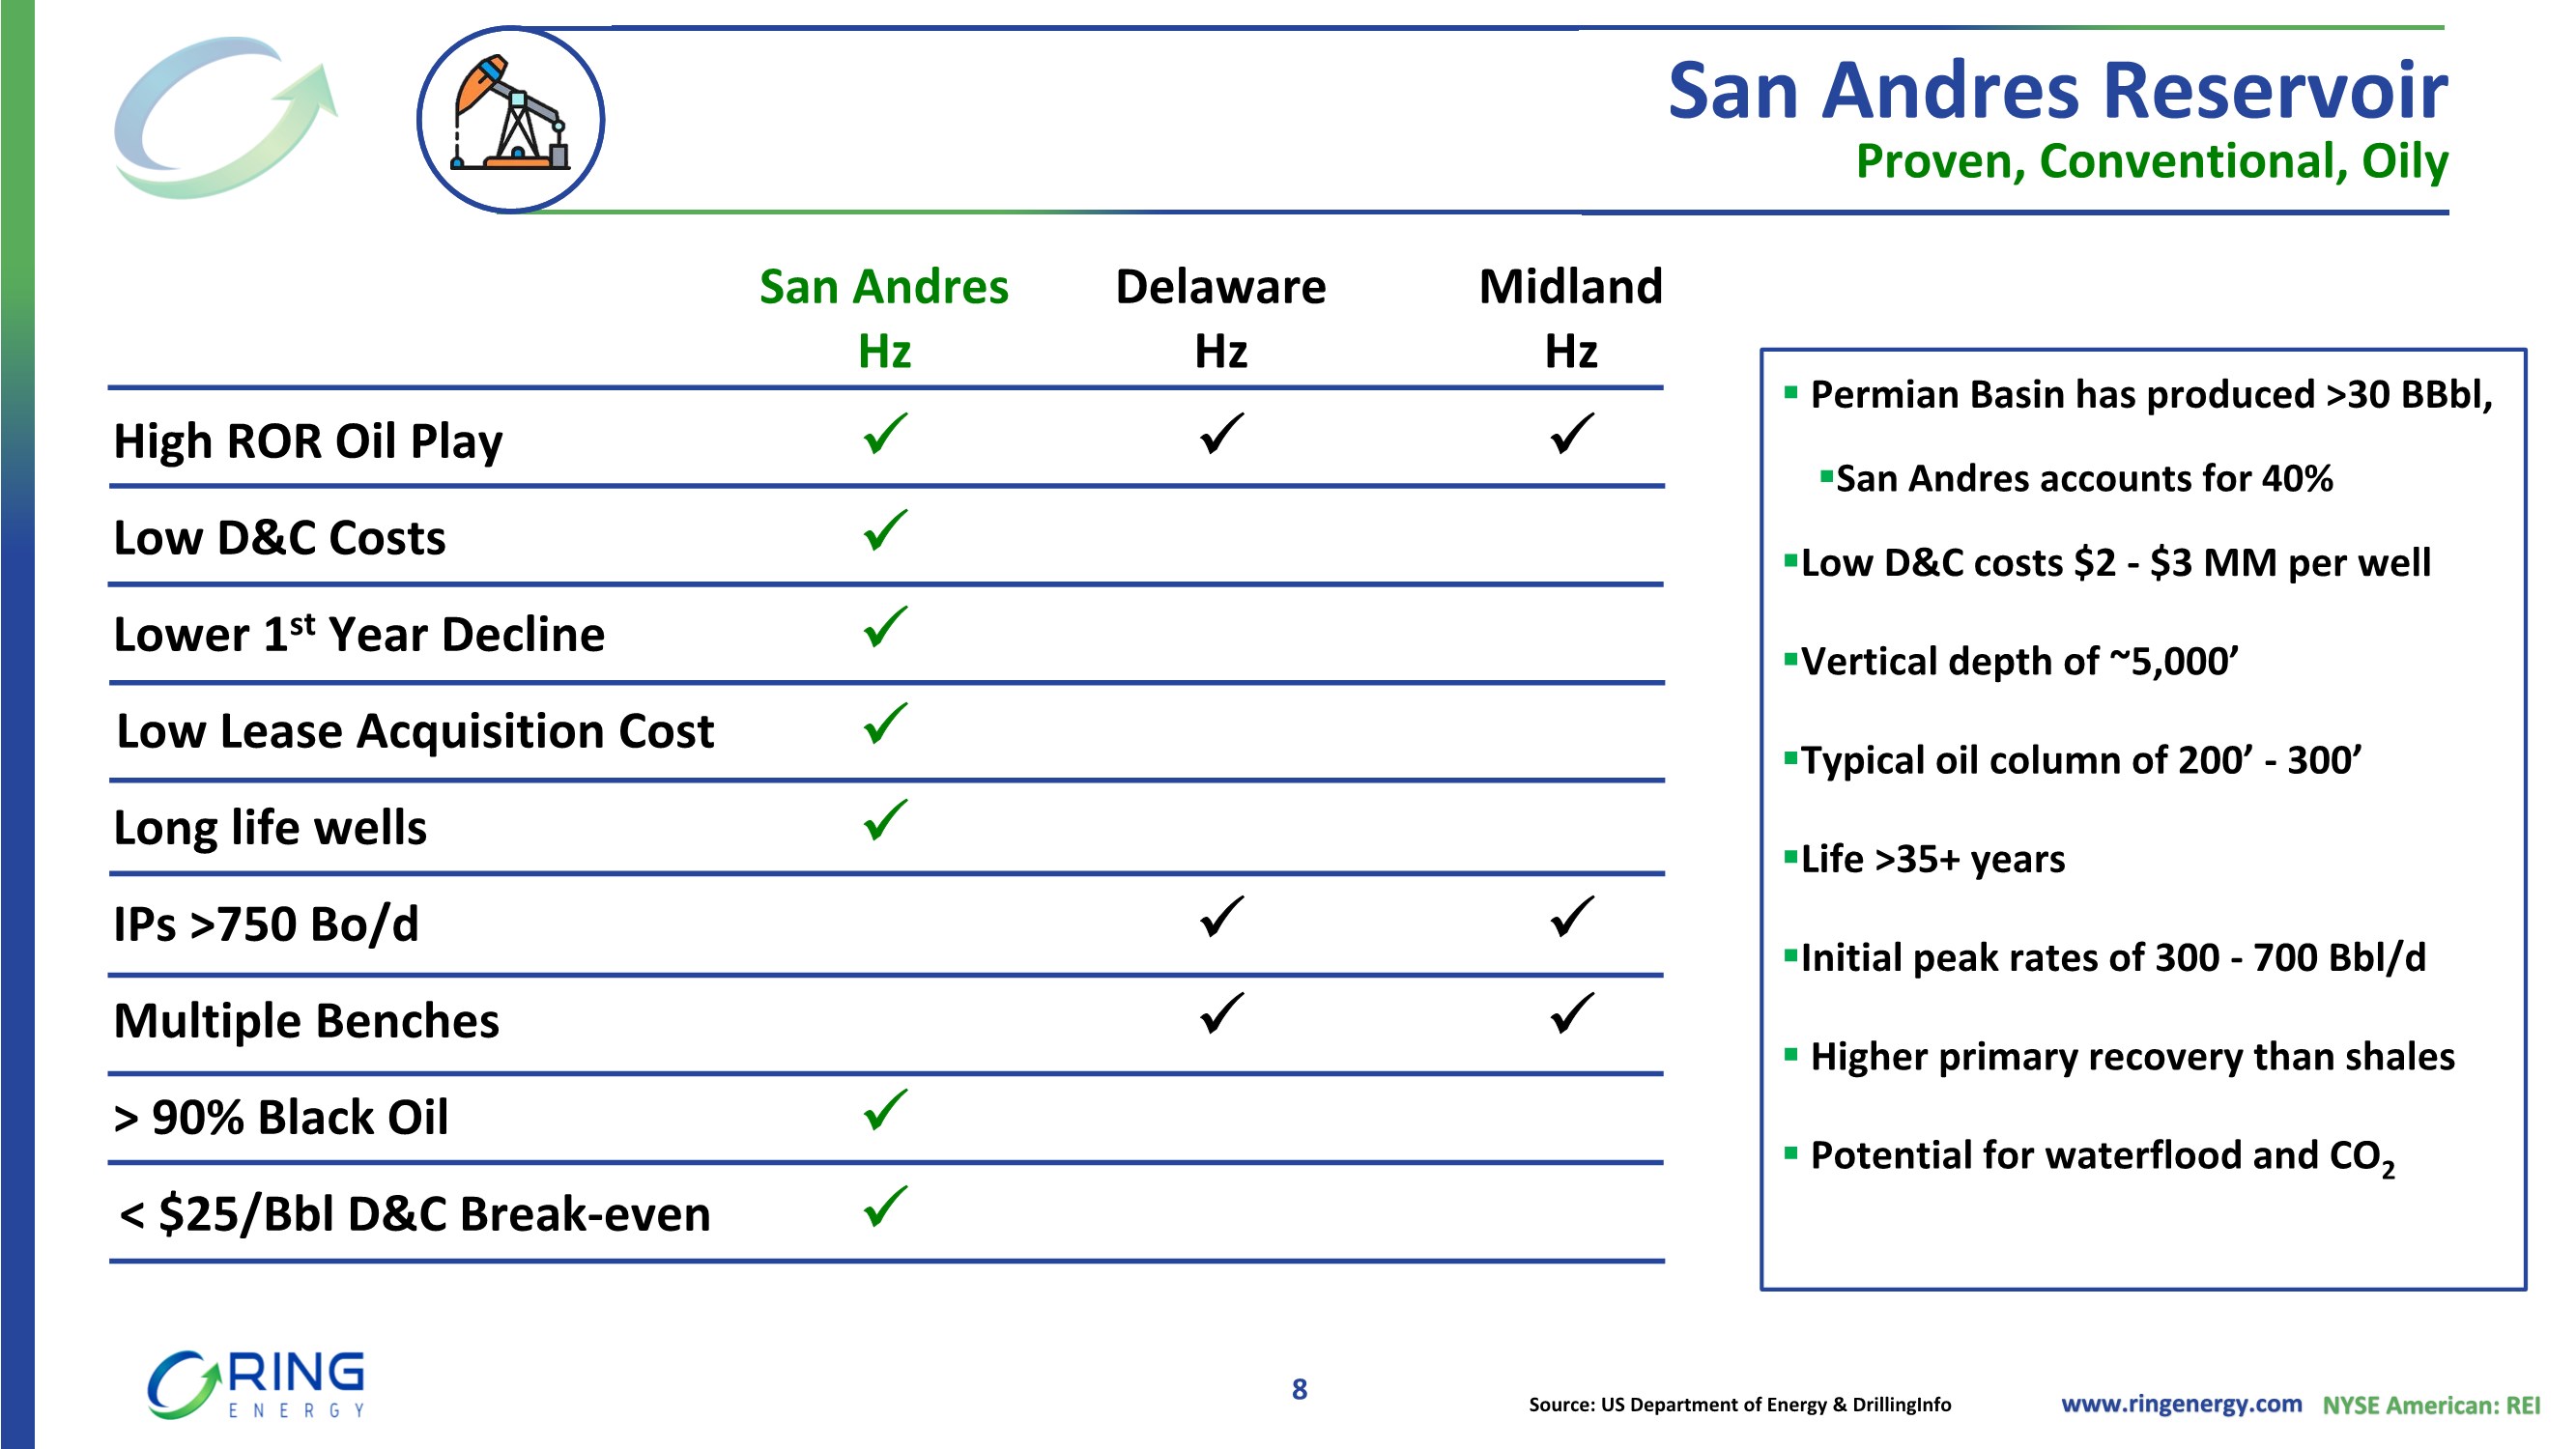
| www.ringenergy.com NYSE American: REI Proven, Conventional, Oily San Andres Hz Delaware Hz Midland Hz High ROR Oil Play ✓ ✓ ✓ Low D&C Costs ✓ Lower 1st Year Decline ✓ Low Lease Acquisition Cost ✓ Long life wells ✓ IPs >750 Bo/d ✓ ✓ Multiple Benches ✓ ✓ > 90% Black Oil ✓ < $25/Bbl D&C Break-even ✓ ▪ Permian Basin has produced >30 BBbl, ▪San Andres accounts for 40% ▪Low D&C costs $2 - $3 MM per well ▪Vertical depth of ~5,000’ ▪Typical oil column of 200’ - 300’ ▪Life >35+ years ▪Initial peak rates of 300 - 700 Bbl/d ▪ Higher primary recovery than shales ▪ Potential for waterflood and CO2 Source: US Department of Energy & DrillingInfo 8 San Andres Reservoir |
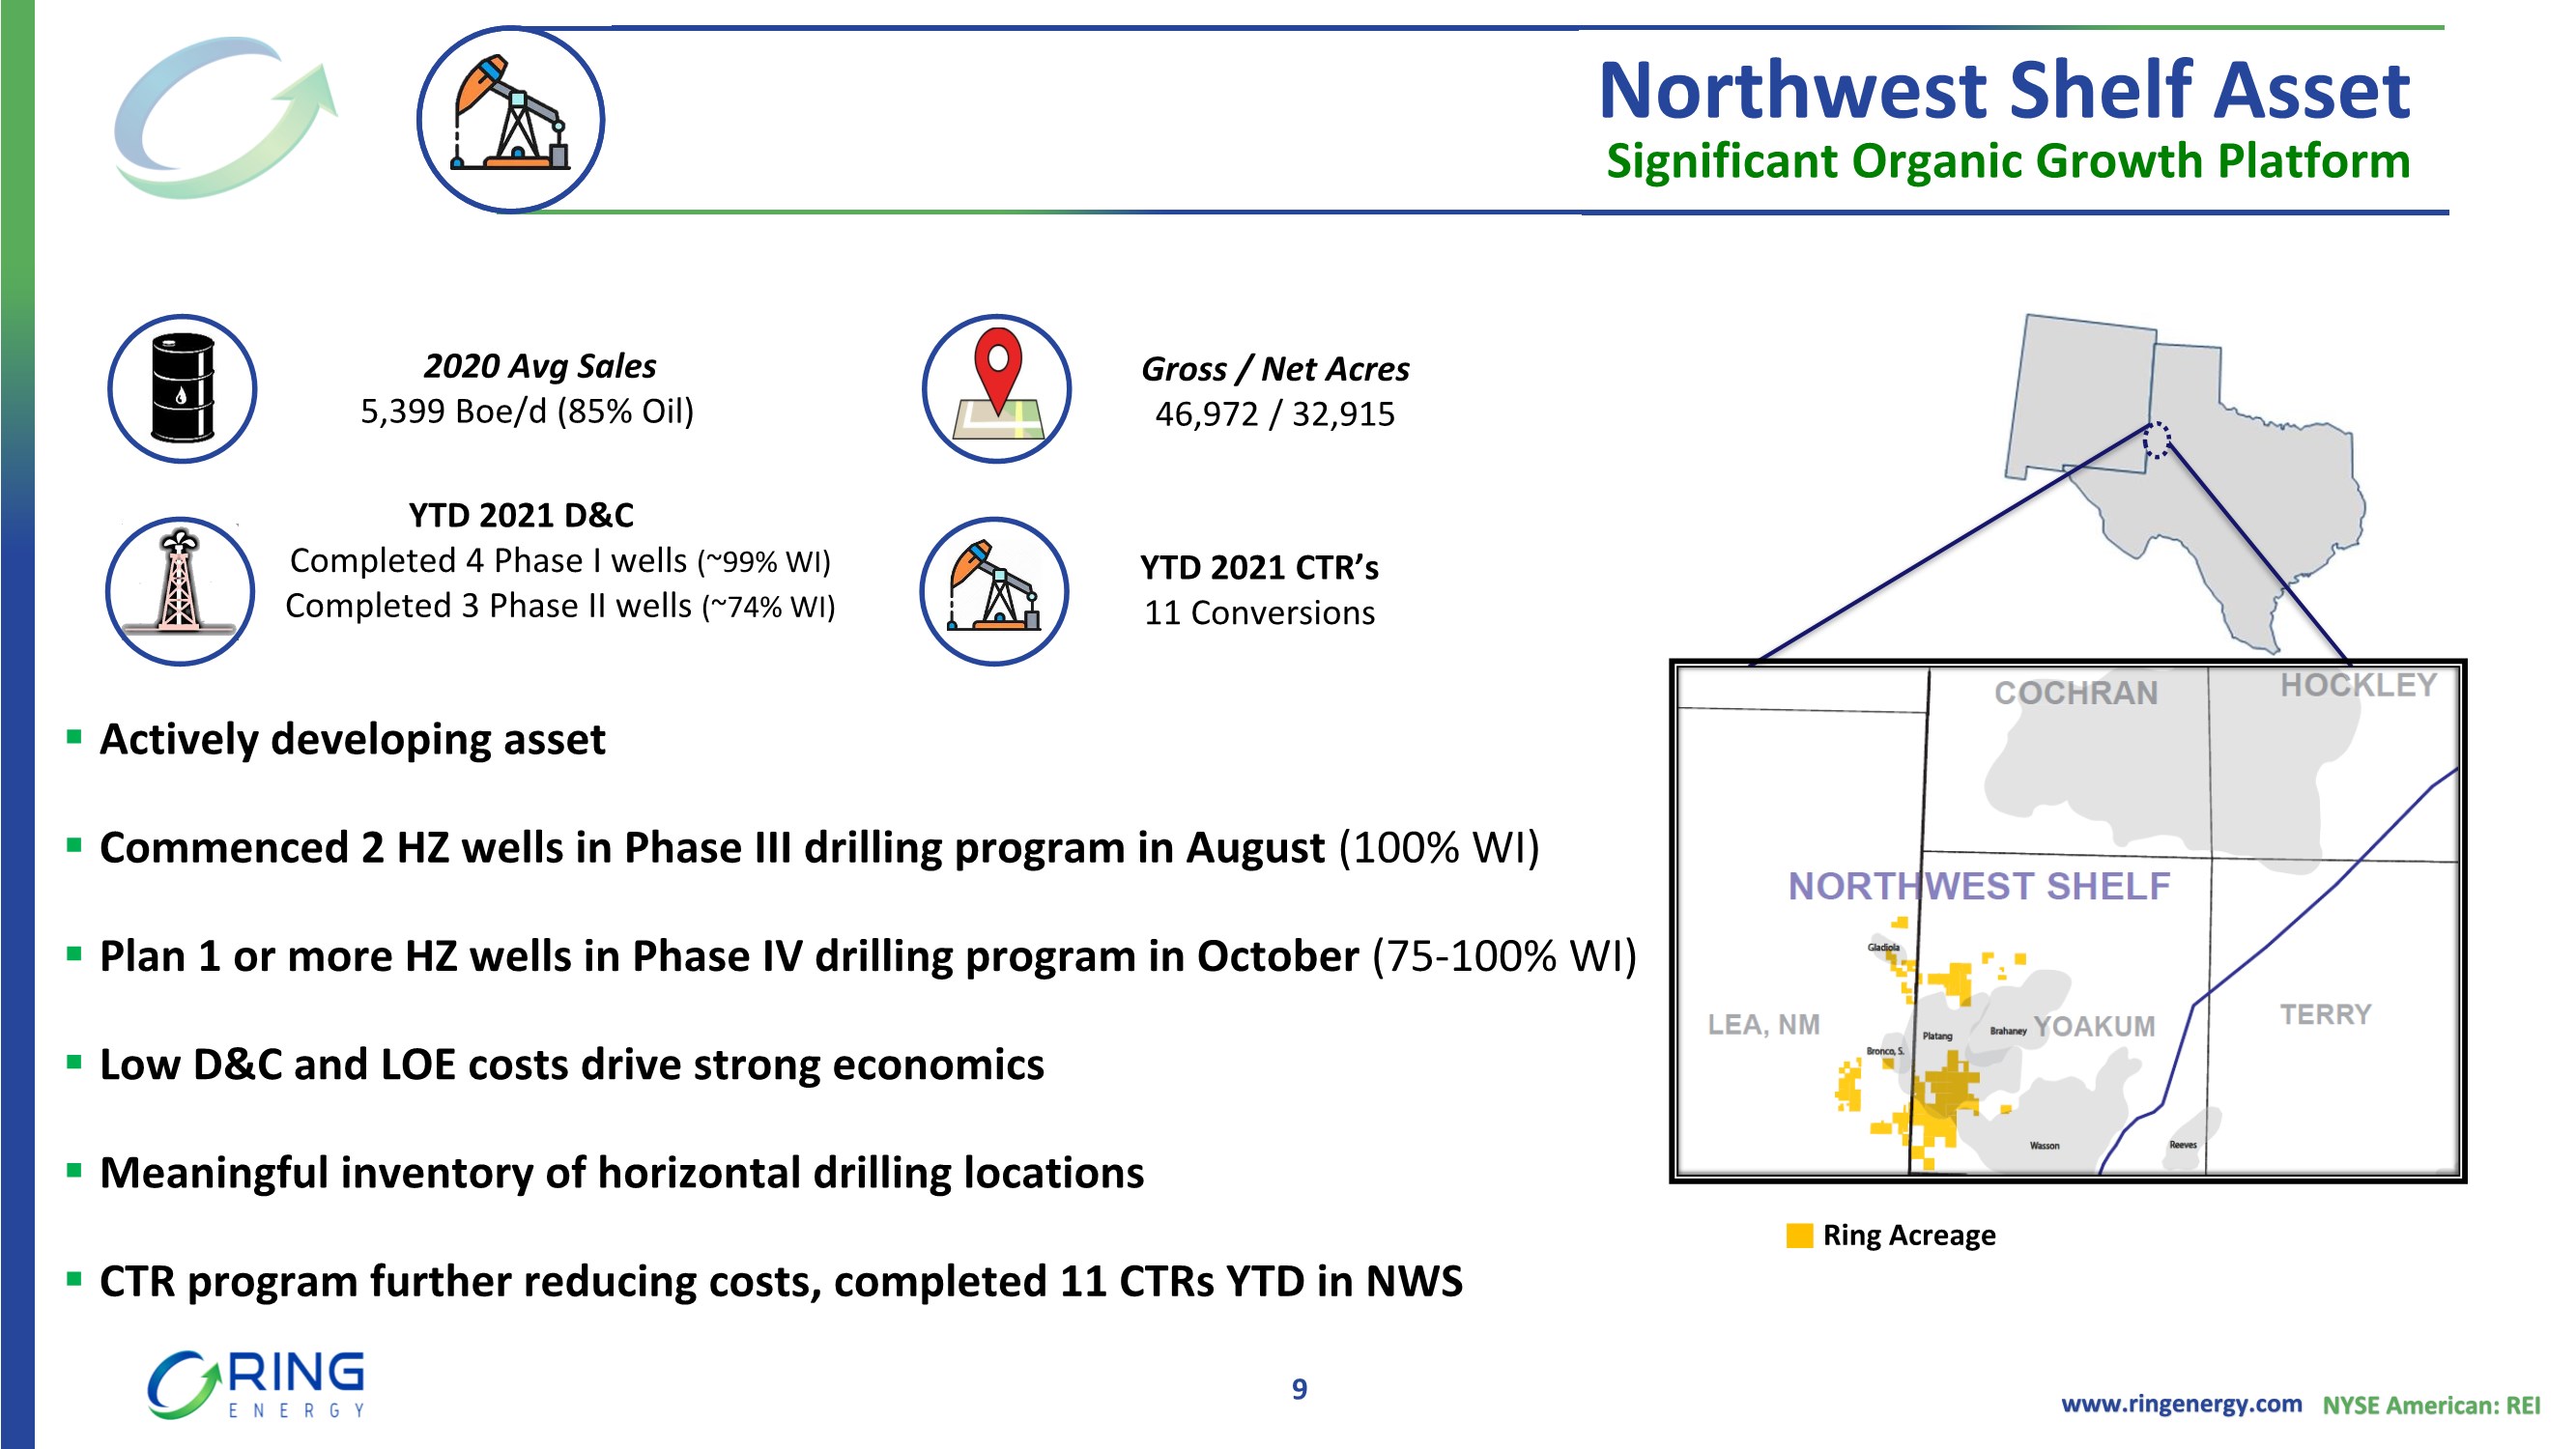
| www.ringenergy.com NYSE American: REI Significant Organic Growth Platform 2020 Avg Sales 5,399 Boe/d (85% Oil) YTD 2021 D&C Completed 4 Phase I wells (~99% WI) Completed 3 Phase II wells (~74% WI) Gross / Net Acres 46,972 / 32,915 ▪ Actively developing asset ▪ Commenced 2 HZ wells in Phase III drilling program in August (100% WI) ▪ Plan 1 or more HZ wells in Phase IV drilling program in October (75-100% WI) ▪ Low D&C and LOE costs drive strong economics ▪ Meaningful inventory of horizontal drilling locations ▪ CTR program further reducing costs, completed 11 CTRs YTD in NWS Northwest Shelf Asset 9 YTD 2021 CTR’s 11 Conversions Ring Acreage |
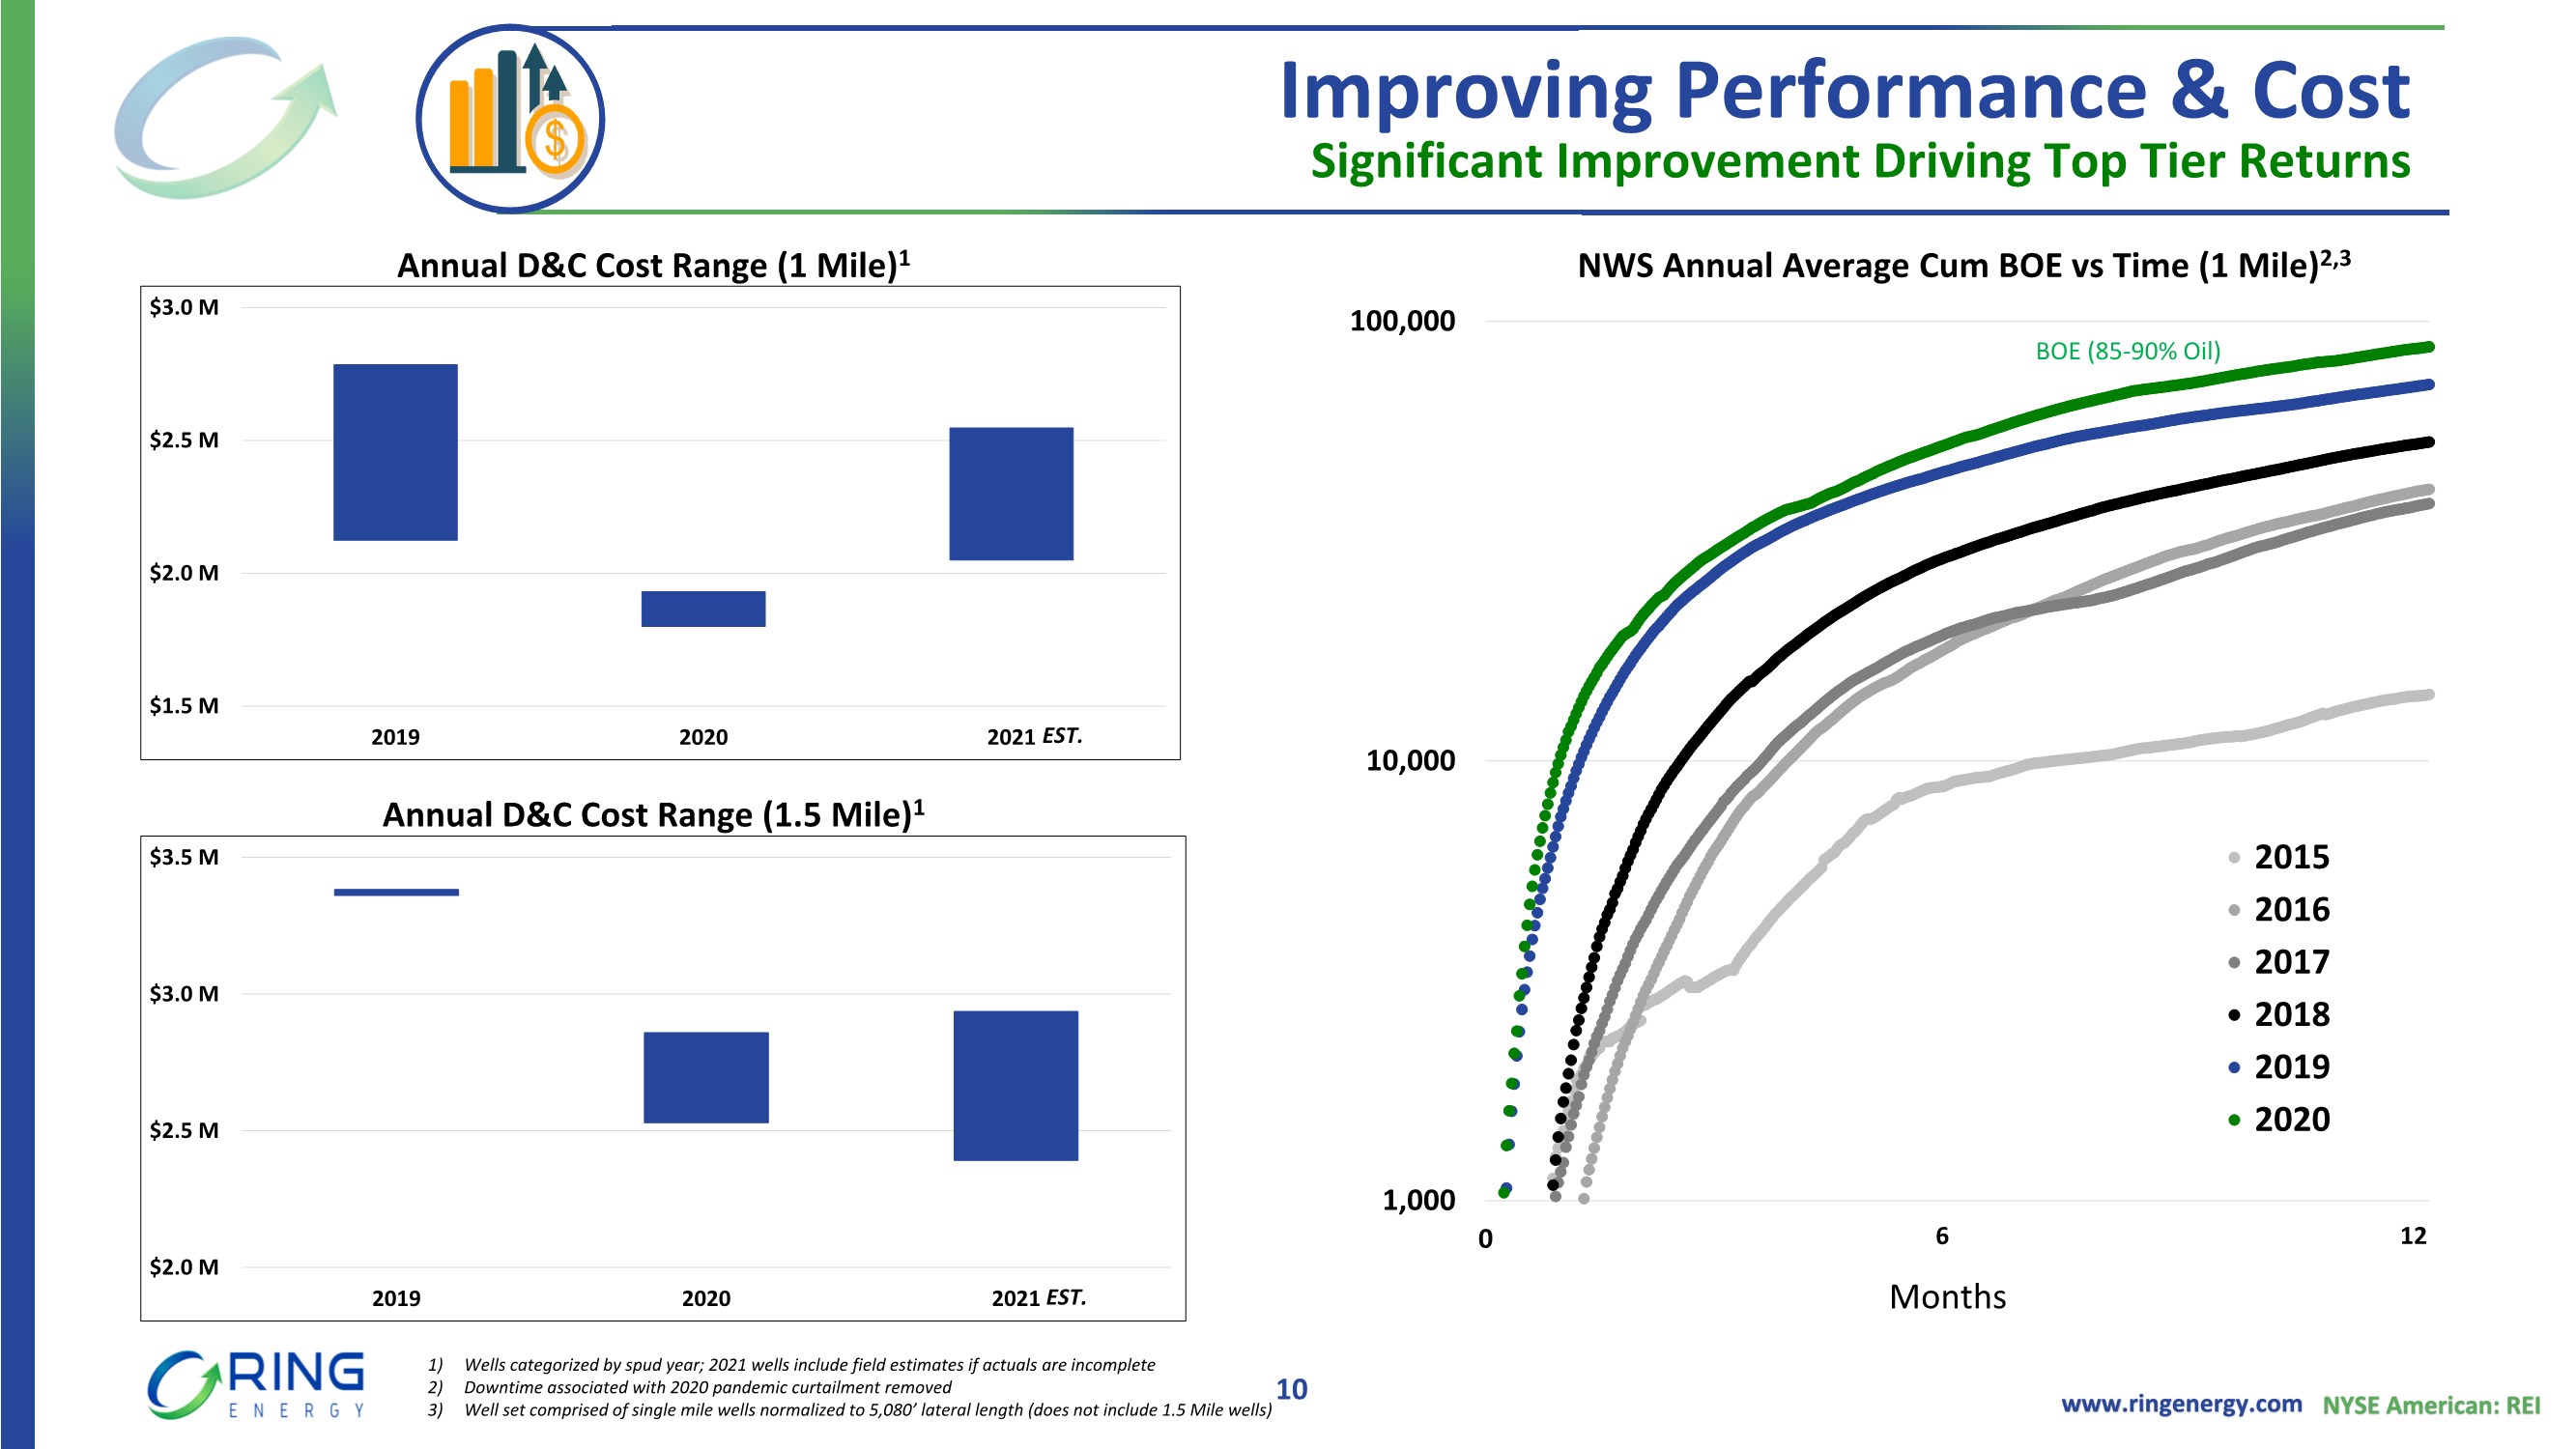
| www.ringenergy.com NYSE American: REI $2.0 M $2.5 M $3.0 M $3.5 M 2019 2020 2021 1,000 10,000 100,000 0 365 2015 2016 2017 2018 2019 2020 Improving Performance & Cost Significant Improvement Driving Top Tier Returns 10 Annual D&C Cost Range (1 Mile)1 NWS Annual Average Cum BOE vs Time (1 Mile)2,3 1) Wells categorized by spud year; 2021 wells include field estimates if actuals are incomplete 2) Downtime associated with 2020 pandemic curtailment removed 3) Well set comprised of single mile wells normalized to 5,080’ lateral length (does not include 1.5 Mile wells) Months 12 6 ~530 Avg ~410 Avg ~420 Avg BOE (85-90% Oil) $1.5 M $2.0 M $2.5 M $3.0 M 2019 2020 2021 Annual D&C Cost Range (1.5 Mile)1 EST. EST. |
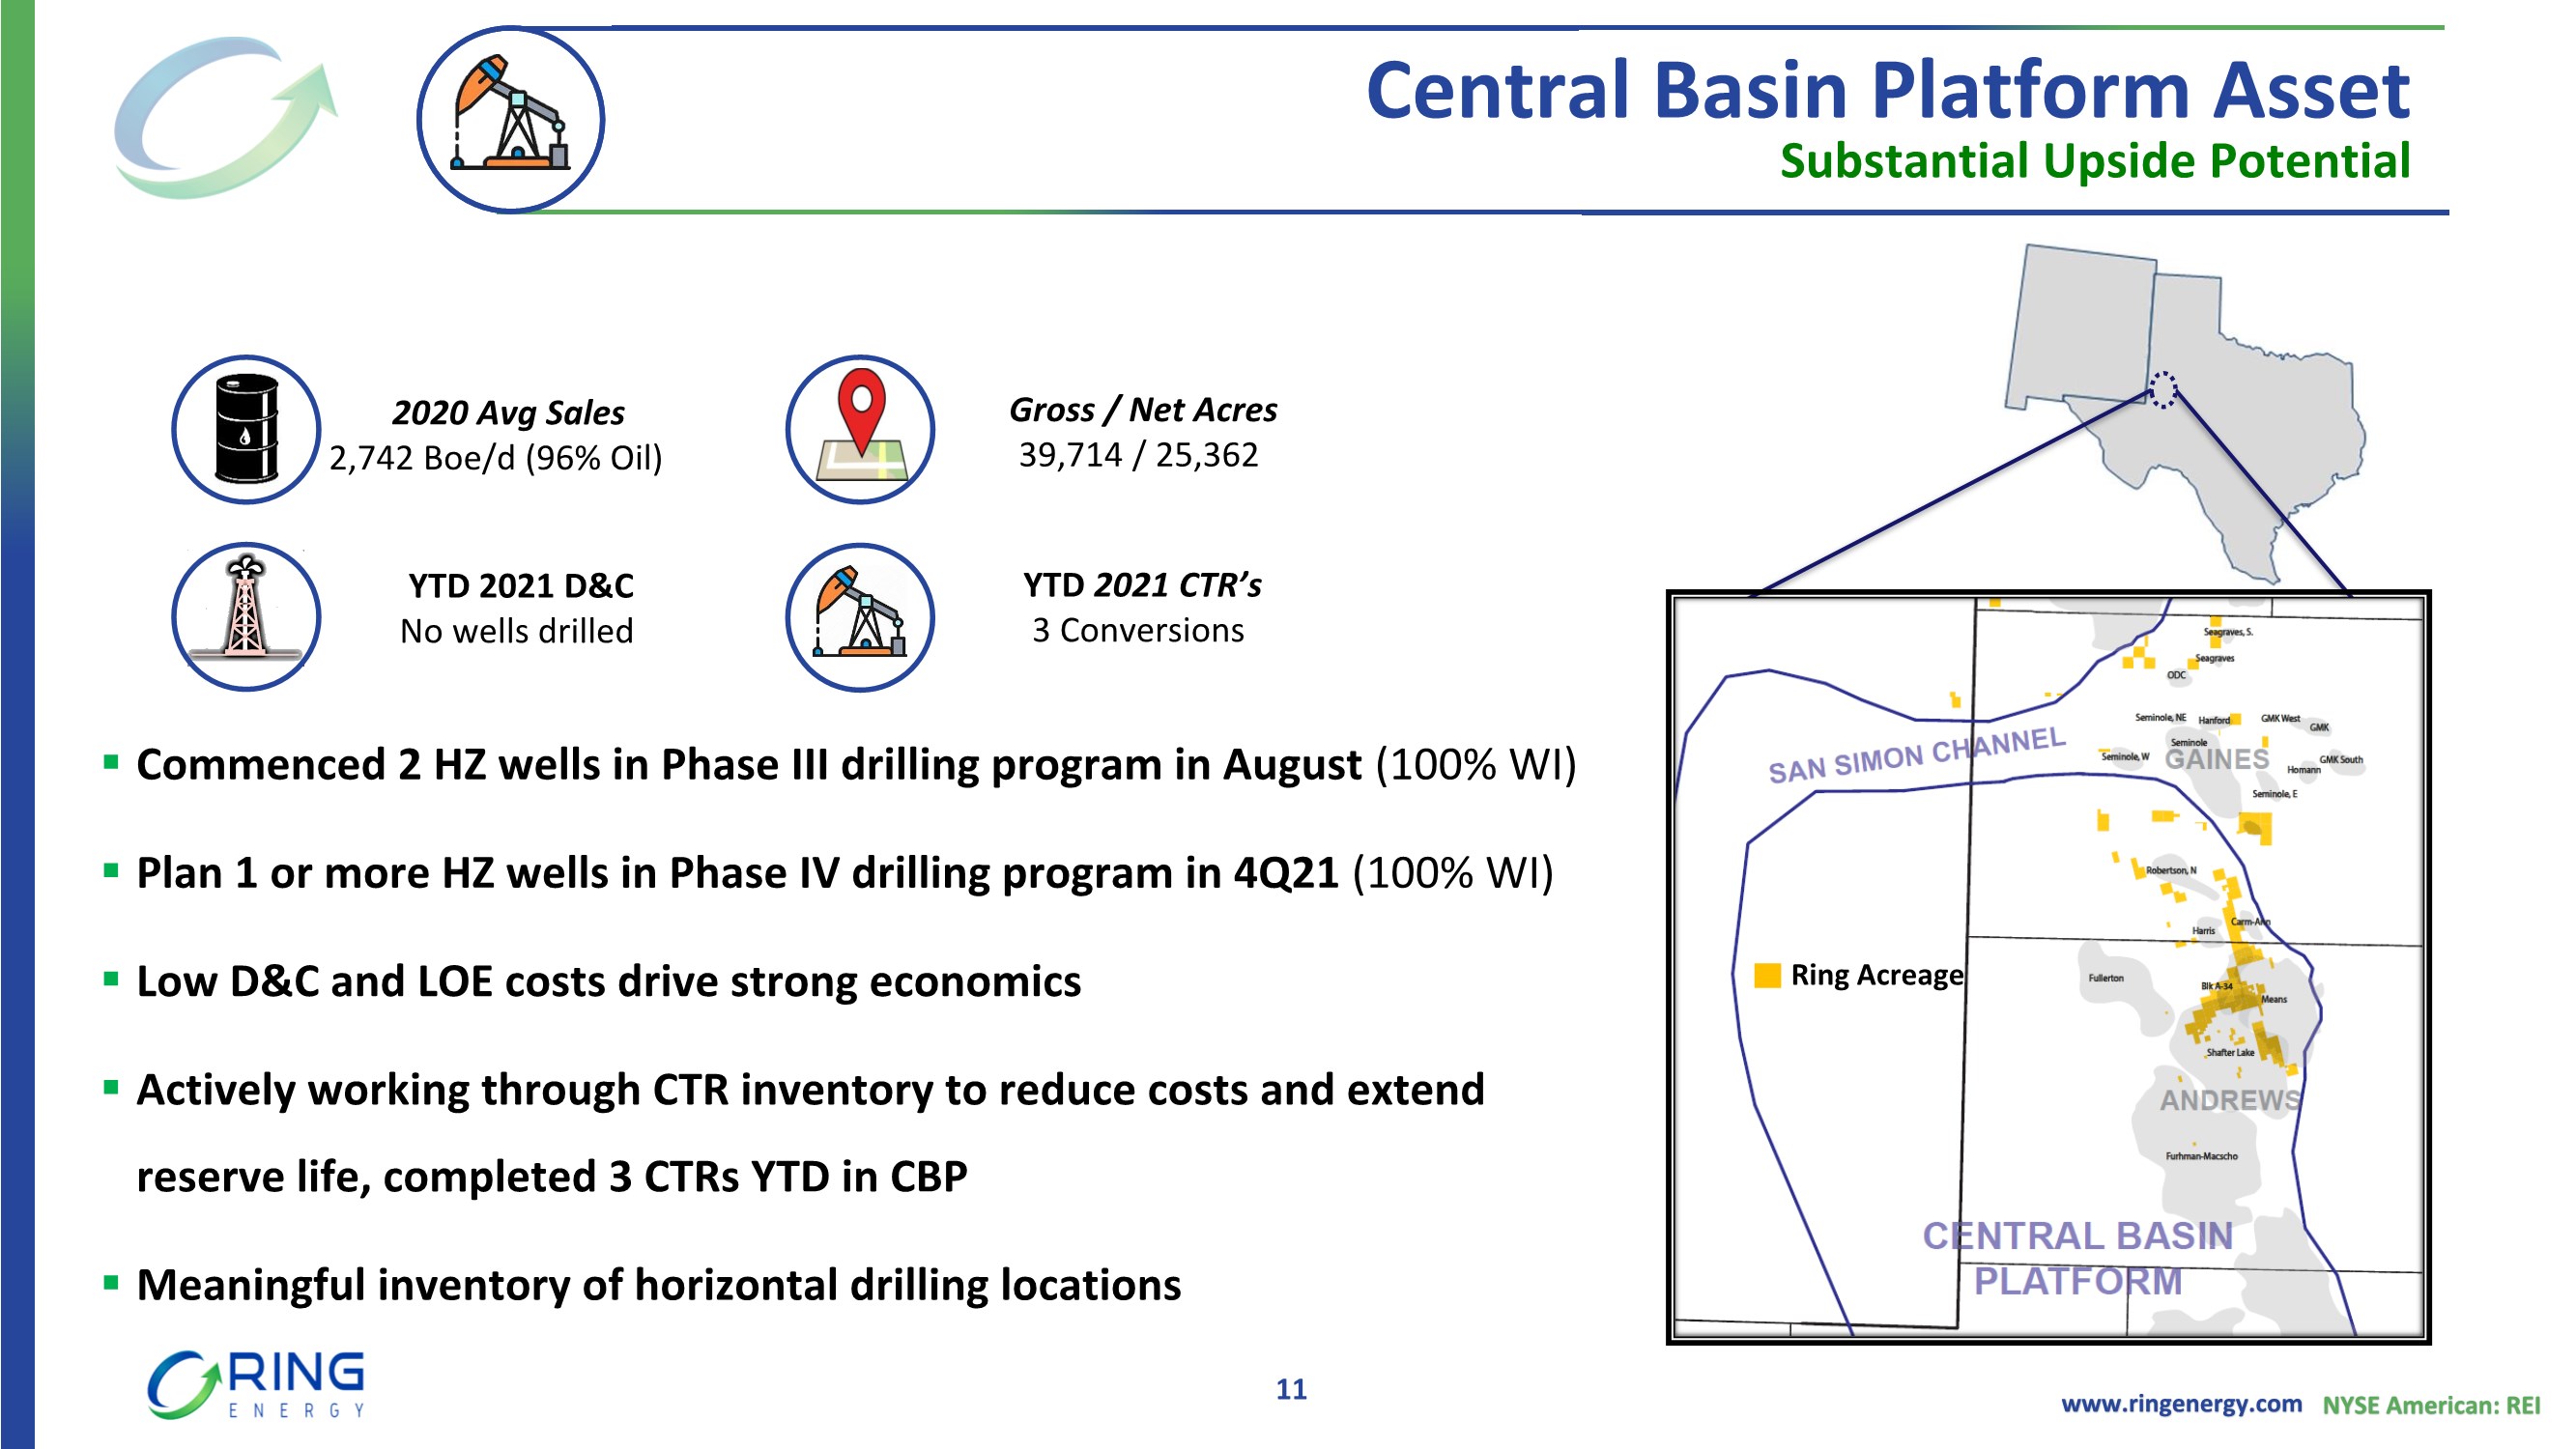
| www.ringenergy.com NYSE American: REI ▪ Commenced 2 HZ wells in Phase III drilling program in August (100% WI) ▪ Plan 1 or more HZ wells in Phase IV drilling program in 4Q21 (100% WI) ▪ Low D&C and LOE costs drive strong economics ▪ Actively working through CTR inventory to reduce costs and extend reserve life, completed 3 CTRs YTD in CBP ▪ Meaningful inventory of horizontal drilling locations 2020 Avg Sales 2,742 Boe/d (96% Oil) YTD 2021 CTR’s 3 Conversions YTD 2021 D&C No wells drilled Gross / Net Acres 39,714 / 25,362 Substantial Upside Potential Central Basin Platform Asset 11 Ring Acreage |
| www.ringenergy.com NYSE American: REI 0 50 100 150 200 2018 2019 2020 2021 YTD NWS CBP Maintains Solid PDP Reserve Base that Generates Consistent FCF ▪ Increasing reserves by extending well longevity and reducing operating & well repair costs ▪ ~50% long-term reduction in LOE ▪ Up to 80% reduction in future pulling costs ▪ Extends economic life & increases EUR Strategic Focus: CTRs 2020 2021 YTD NWS 17 11 CBP 12 3 0 20 12 $- $50,000 $100,000 $150,000 $200,000 Range of Avg Well Repair Cost ESP ROD $150,000 $40,000 $20,000 Cost Savings ESP vs ROD Maximizing Operational Margin is Predicated on Being THE LOW-COST OPERATOR 80% Lower $200,000 CTR Projects 2020 - 2021 ESP Failures 2018 – 2021 |
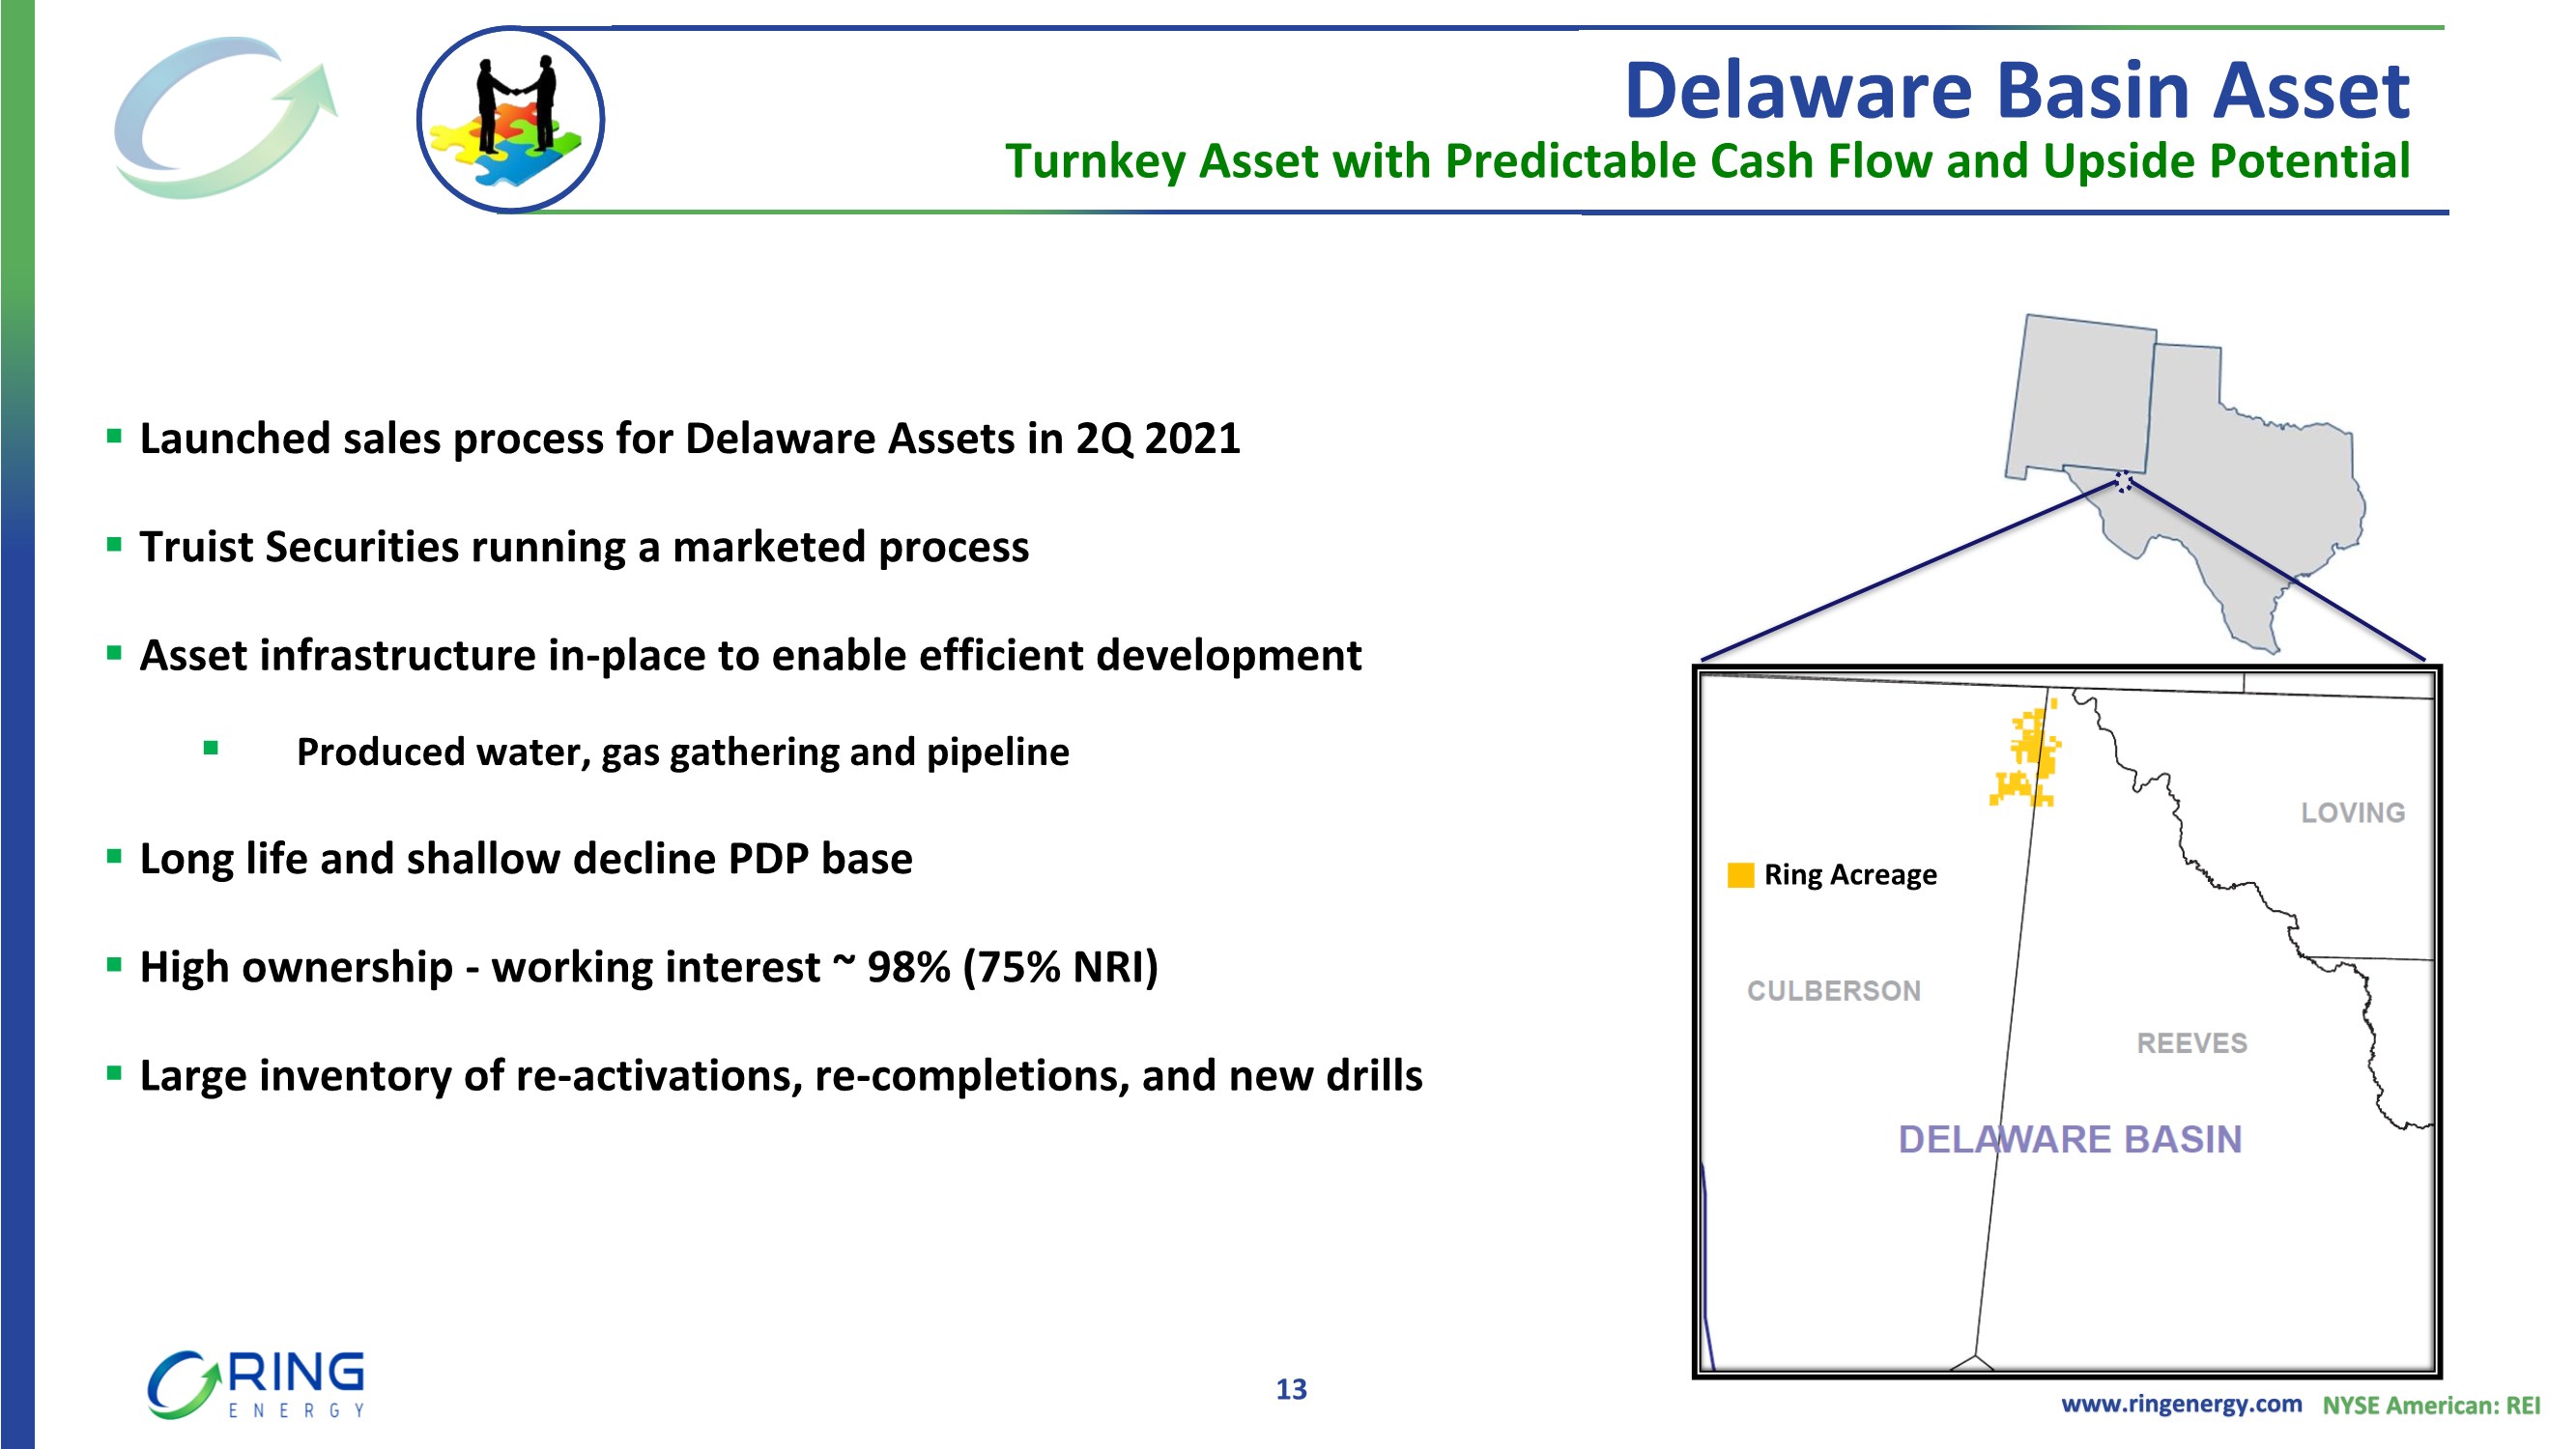
| www.ringenergy.com NYSE American: REI Turnkey Asset with Predictable Cash Flow and Upside Potential Delaware Basin Asset 13 ▪ Launched sales process for Delaware Assets in 2Q 2021 ▪ Truist Securities running a marketed process ▪ Asset infrastructure in-place to enable efficient development ▪ Produced water, gas gathering and pipeline ▪ Long life and shallow decline PDP base ▪ High ownership - working interest ~ 98% (75% NRI) ▪ Large inventory of re-activations, re-completions, and new drills Ring Acreage |
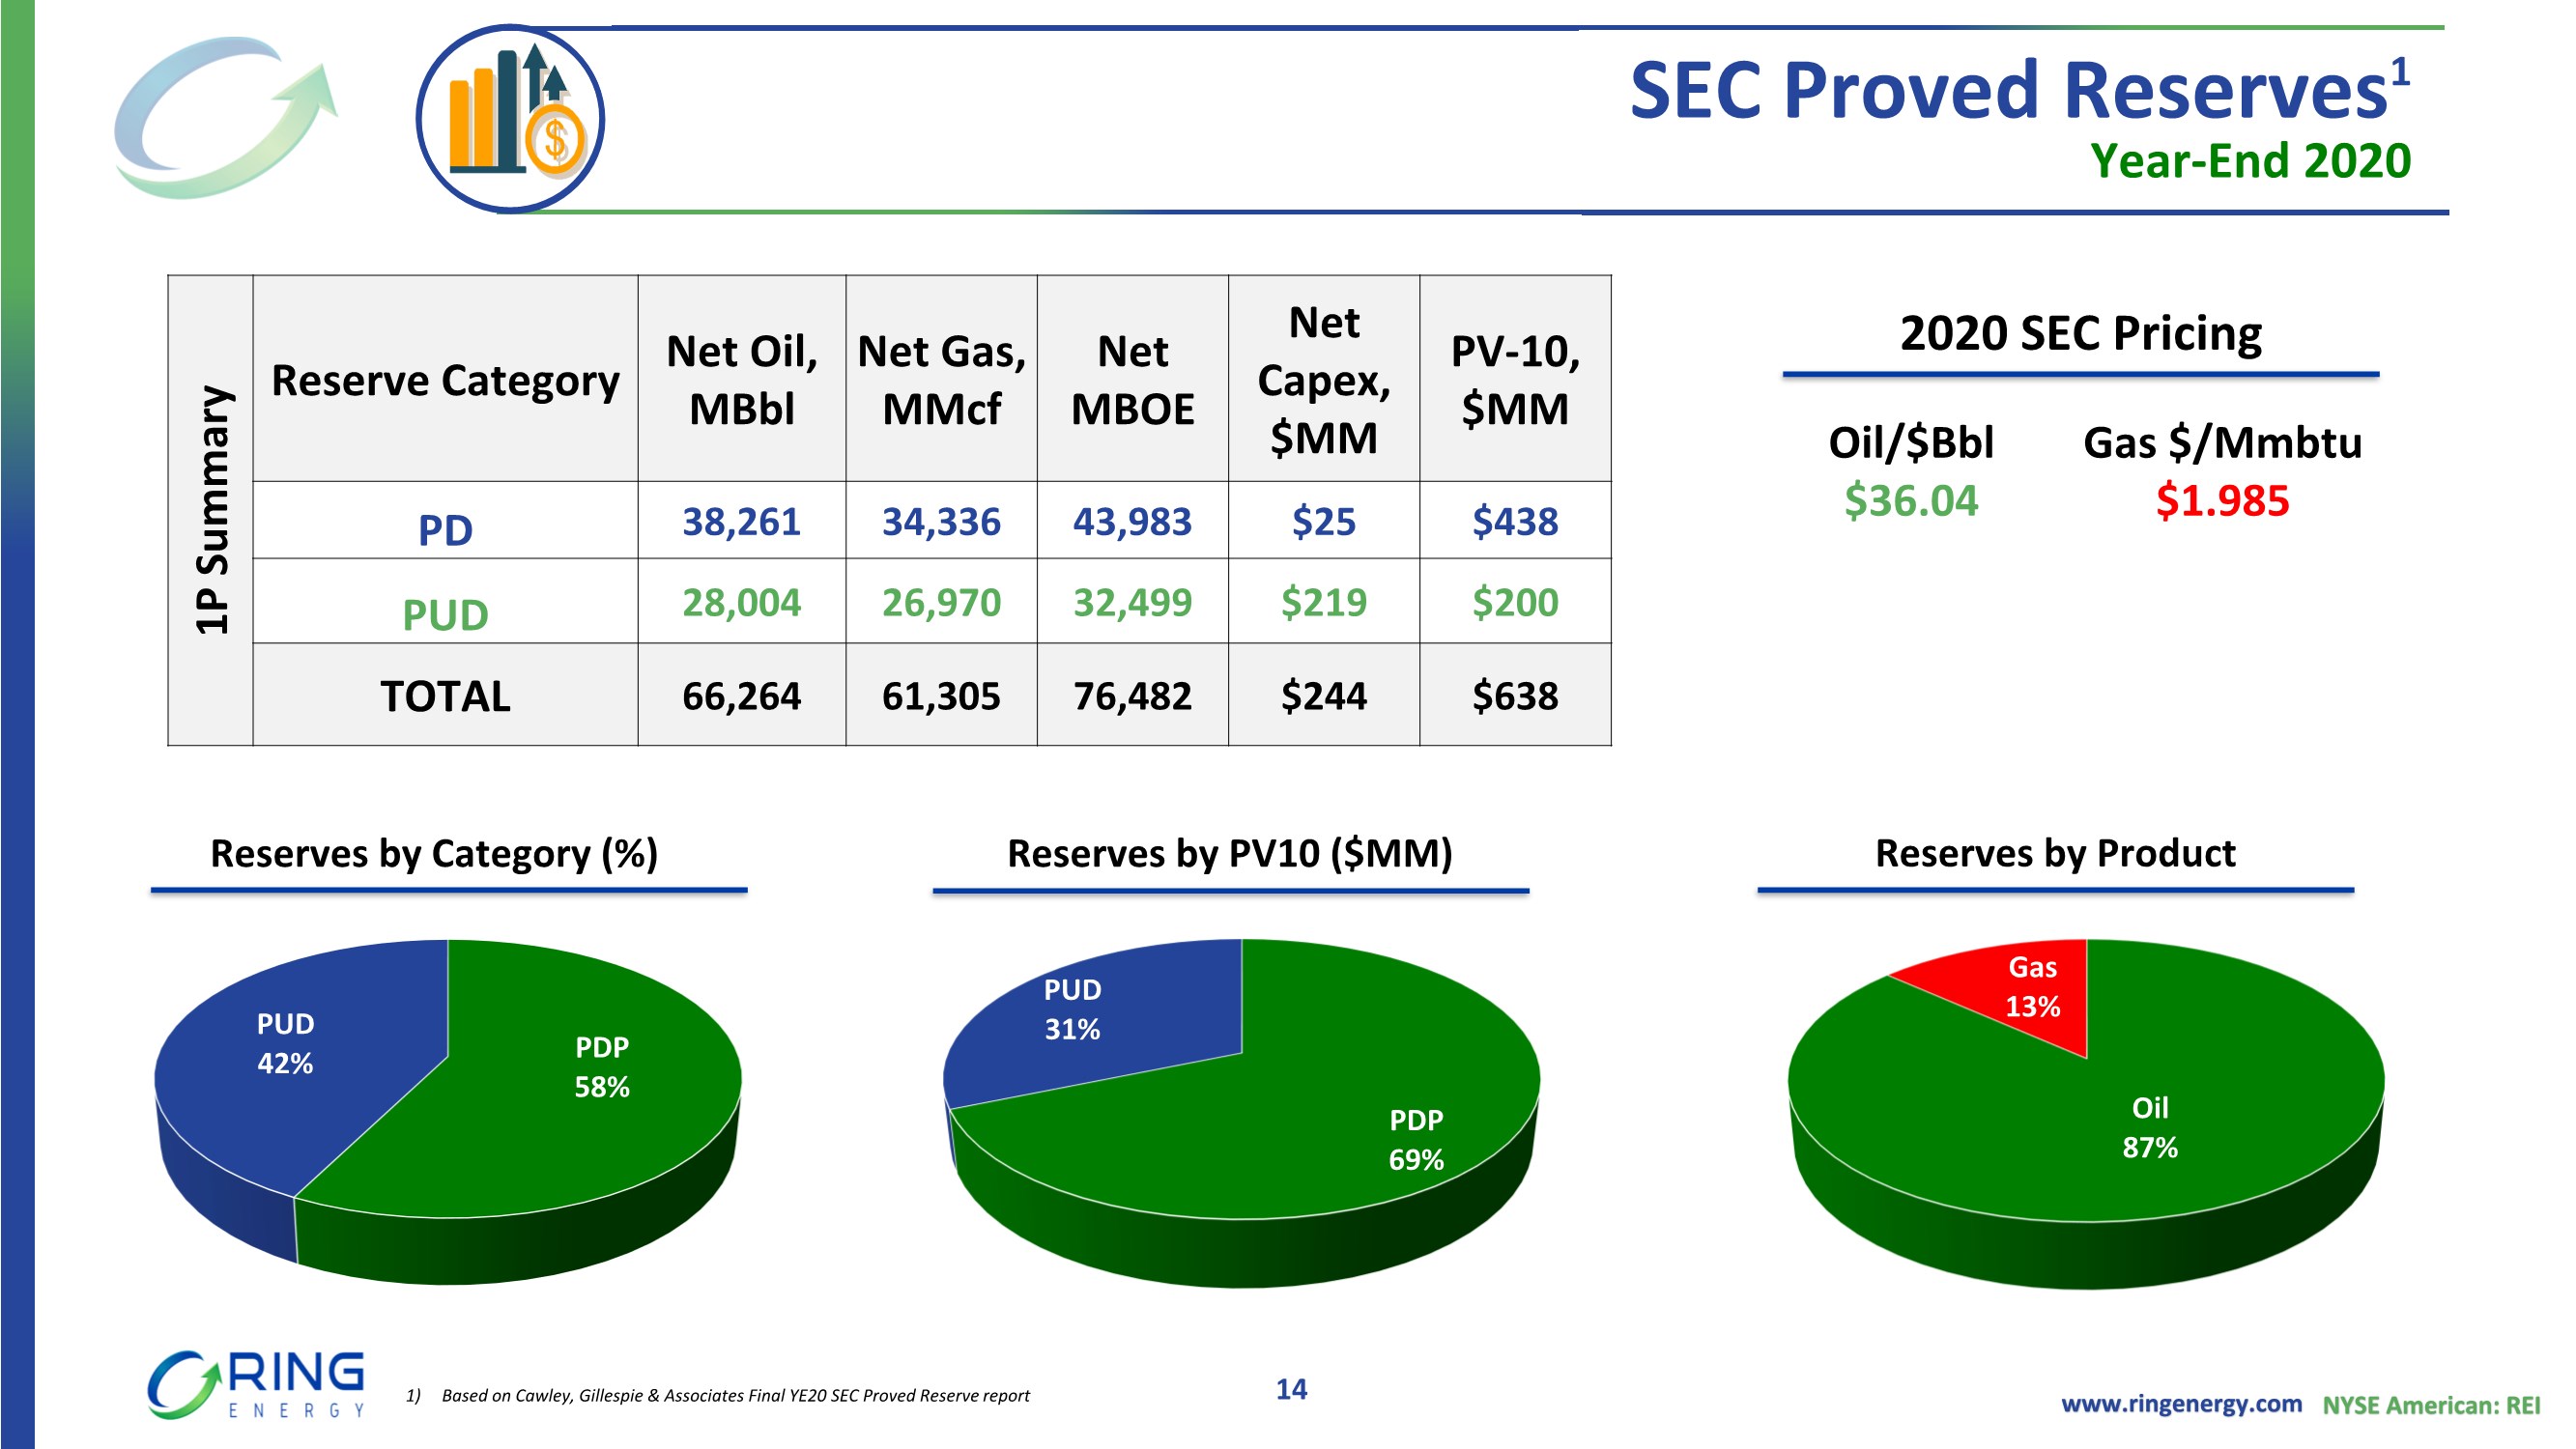
| www.ringenergy.com NYSE American: REI PDP 69% PUD 31% PDP 58% PUD 42% 1P Summary Reserve Category Net Oil, MBbl Net Gas, MMcf Net MBOE Net Capex, $MM PV-10, $MM PD 38,261 34,336 43,983 $25 $438 PUD 28,004 26,970 32,499 $219 $200 TOTAL 66,264 61,305 76,482 $244 $638 SEC Proved Reserves1 Year-End 2020 14 2020 SEC Pricing Reserves by Category (%) Reserves by PV10 ($MM) Reserves by Product Oil/$Bbl $36.04 Gas $/Mmbtu $1.985 Oil 87% Gas 13% 1) Based on Cawley, Gillespie & Associates Final YE20 SEC Proved Reserve report |
| www.ringenergy.com NYSE American: REI Generating Sustainable Results1 5,487 9,549 9,307 7,960 8,709 0 2,000 4,000 6,000 8,000 10,000 12,000 Q2 2020 Q3 2020 Q4 2020 Q1 2021 Q2 2021 Boe /d Net Sales $9.2 $10.8 $12.5 $11.8 $10.8 $0.0 $2.0 $4.0 $6.0 $8.0 $10.0 $12.0 $14.0 Q2 2020 Q3 2020 Q4 2020 Q1 2021 Q2 2021 $MM LOE and Cash G&A $13.5 $19.9 $24.5 $19.0 $20.6 $0.0 $10.0 $20.0 $30.0 Q2 2020 Q3 2020 Q4 2020 Q1 2021 Q2 2021 $MM Adjusted EBITDA 1 $7.8 $11.3 $12.7 $2.9 $5.6 $0.0 $5.0 $10.0 $15.0 Q2 2020 Q3 2020 Q4 2020 Q1 2021 Q2 2021 $MM Free Cash Flow 1 Supporting Strategic Vision 15 1) Adjusted EBITDA and Free Cash Flow are Non-GAAP financial measures and reconciled in Ring’s earnings releases Pandemic shut in * Q1’21 results impacted by winter storm shut in Phase I drill program * * * * Phase II drill program ~89% Oil ~85% Oil ~86% Oil ~89% Oil ~86% Oil |
| www.ringenergy.com NYSE American: REI Historical Metrics Quarterly Analysis of FCF1 $MM Q2 2020 Q3 2020 Q4 2020 Q1 2021 Q2 2021 Adj EBITDA1 $13.7 $19.9 $24.5 $19.0 $20.6 Capital -$1.9 -$4.3 -$7.8 -$14.5 -$11.5 Interest Exp. -$4.0 -$4.3 -$4.0 -$3.6 -$3.5 Proceeds from Divestiture $2.0 Free Cash Flow1 $7.8 $11.3 $12.7 $2.9 $5.6 16 $13.7 $19.9 $24.5 $19.0 $20.6 -$1.9 -$4.3 -$7.8 -$14.5 -$11.5 -$4.0 -$4.3 -$4.0 -$3.6 -$3.5 $7.8 $11.3 $12.7 $2.9 $5.6 -$30.0 -$20.0 -$10.0 $0.0 $10.0 $20.0 $30.0 Q2 2020 Q3 2020 Q4 2020 Q1 2021 Q2 2021 EBITDA/ Capital / Int Exp Adj EBITDA $MM Capital $MM Interest Exp $MM Proceeds from Divestiture $MM Free Cash Flow $MM ▪ Disciplined capital spending ▪ Prioritizing FCF generation ▪ Unrelenting goal to strengthen the balance sheet 1) Adjusted EBITDA and Free Cash Flow are Non-GAAP financial measures and reconciled in Ring’s earnings releases |
| www.ringenergy.com NYSE American: REI $375.0 $360.0 $313.0 $305.5 $300.5 $0.0 $100.0 $200.0 $300.0 $400.0 Q2 2020 Q3 2020 Q4 2020 Q1 2021 Q2 2021 RBL Balance $313 MM outstanding debt with $36 MM in Surplus Cash Continued FCF Generation is Key Pays Down Debt and Improves Balance Sheet 17 $20.0 $32.2 $40.6 $46.2 $51.4 $0.0 $10.0 $20.0 $30.0 $40.0 $50.0 $60.0 Q2 2020 Q3 2020 Q4 2020 Q1 2021 Q2 2021 Liquidity 1 1) Includes $0.76MM letters of credit (previous quarters did not include letters of credit) |
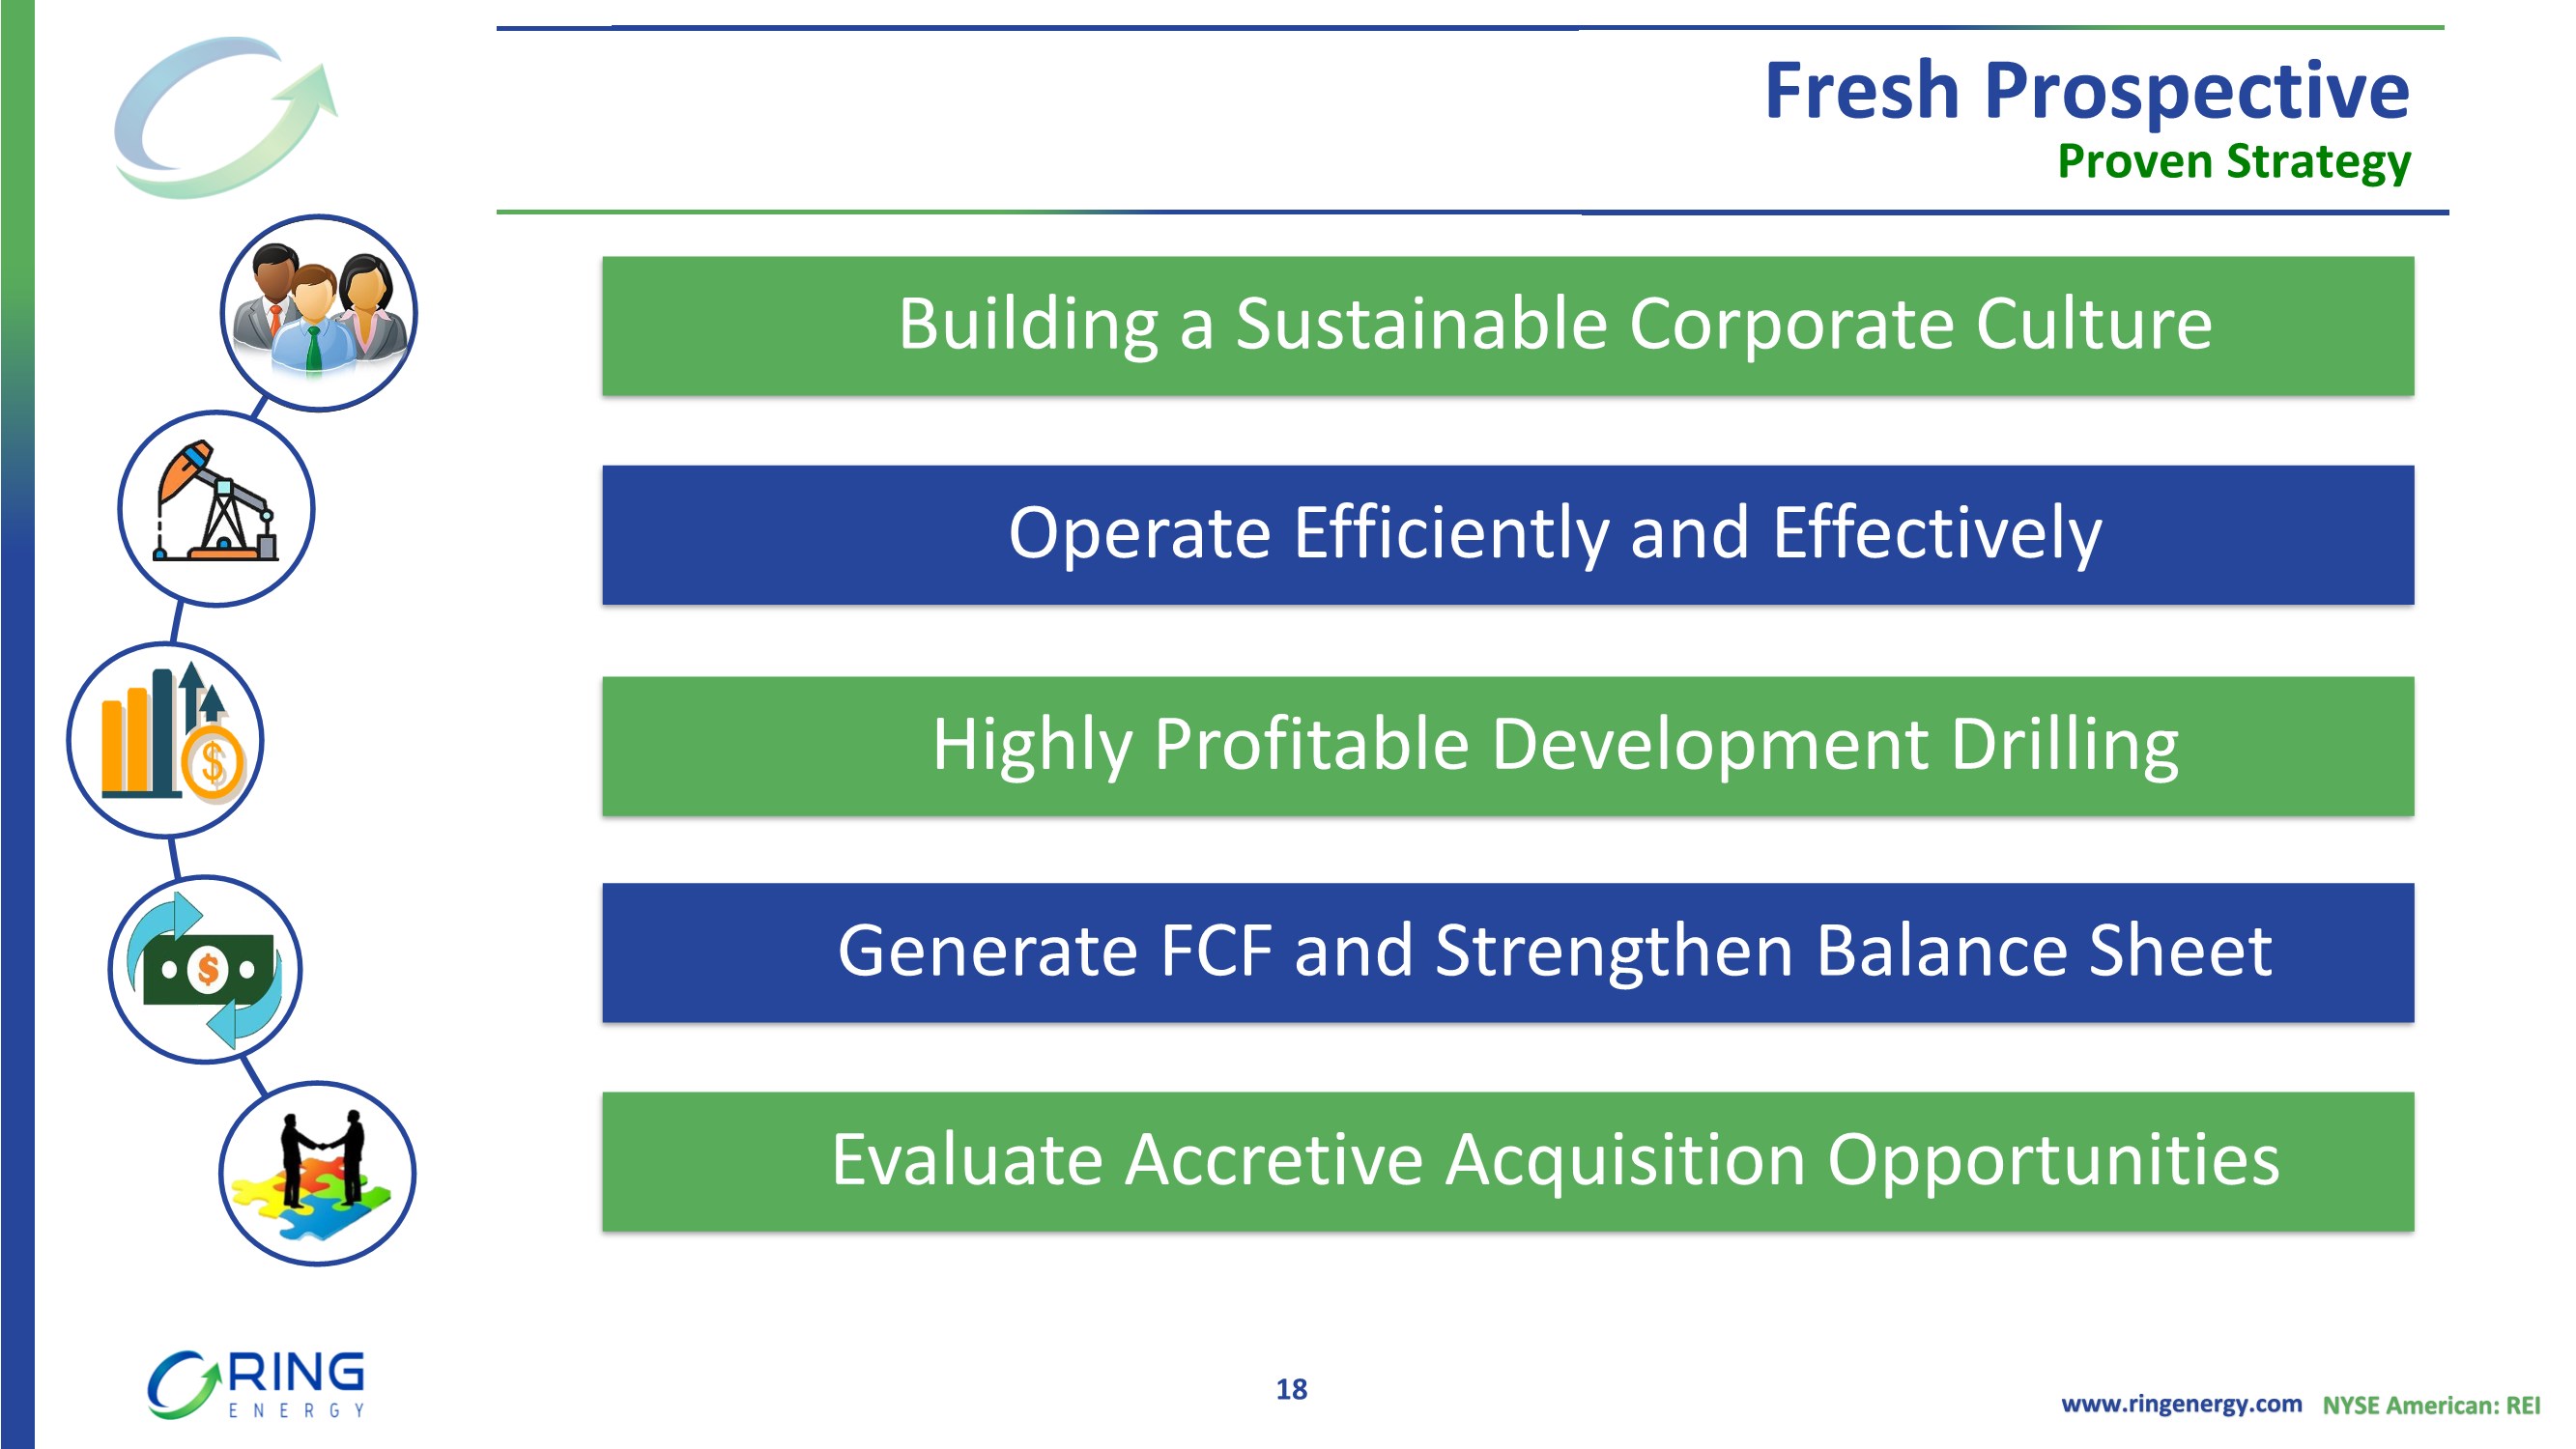
| www.ringenergy.com NYSE American: REI Building a Sustainable Corporate Culture Operate Efficiently and Effectively Highly Profitable Development Drilling Generate FCF and Strengthen Balance Sheet Evaluate Accretive Acquisition Opportunities Fresh Prospective Proven Strategy 18 |
| Appendix |
| www.ringenergy.com NYSE American: REI 52% 44% 4% D&C Cap Workover/CTRs Land/Other CAPEX Allocation Mid Point $32.5 million Second Half 2021 Guidance Maintain Production, Generate FCF, Pay Down Debt 20 Sales Volumes 2nd Half 2021 Total (Boe/d) 8,700 – 9,200 Oil (Bo/d) 7,700 – 8,100 Operating Expenses (per Boe) 2nd Half 2021 Lifting Cost $10.50 - $11.00 Capital Spending ($ in millions) 2nd Half 2021 Number of new wells drilled 6 - 8 Number of new wells completed 6 - 8 Capital Spending $30 - $35 |
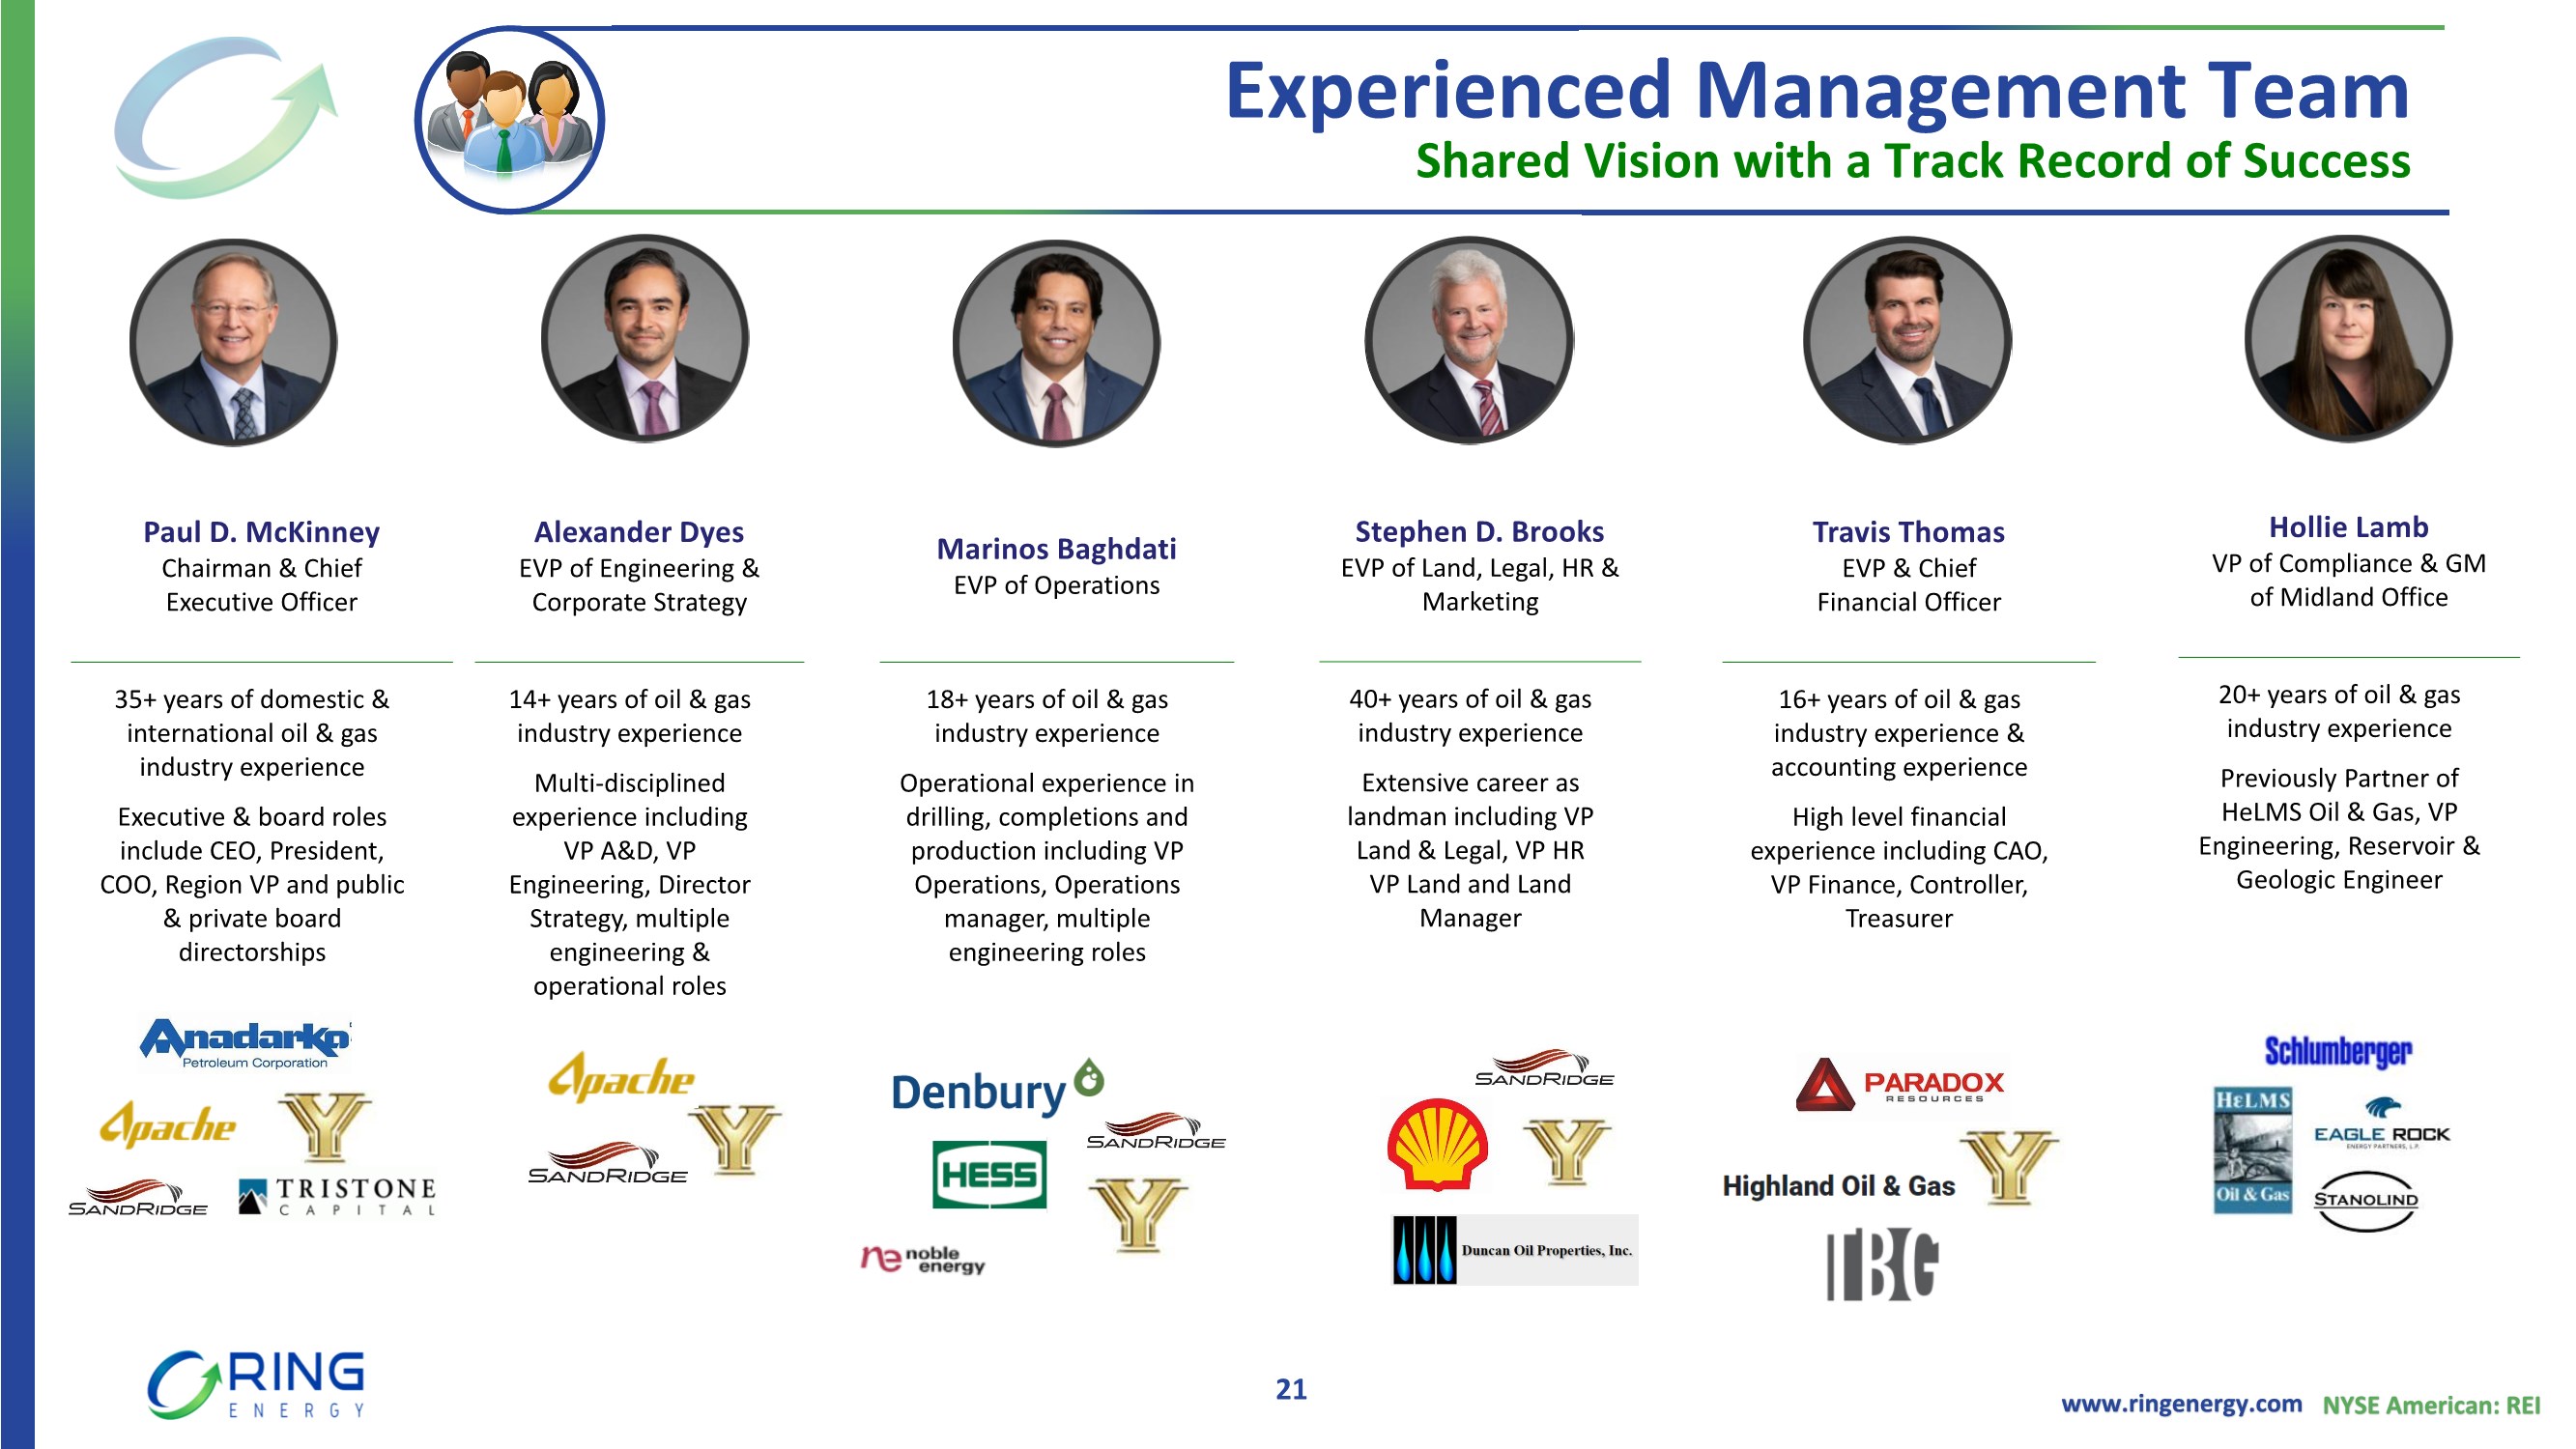
| www.ringenergy.com NYSE American: REI Add Photo Add Photo Add Photo Add Photo Add Photo Paul D. McKinney Chairman & Chief Executive Officer 35+ years of domestic & international oil & gas industry experience Executive & board roles include CEO, President, COO, Region VP and public & private board directorships Travis Thomas EVP & Chief Financial Officer 16+ years of oil & gas industry experience & accounting experience High level financial experience including CAO, VP Finance, Controller, Treasurer Alexander Dyes EVP of Engineering & Corporate Strategy 14+ years of oil & gas industry experience Multi-disciplined experience including VP A&D, VP Engineering, Director Strategy, multiple engineering & operational roles Marinos Baghdati EVP of Operations 18+ years of oil & gas industry experience Operational experience in drilling, completions and production including VP Operations, Operations manager, multiple engineering roles Stephen D. Brooks EVP of Land, Legal, HR & Marketing 40+ years of oil & gas industry experience Extensive career as landman including VP Land & Legal, VP HR VP Land and Land Manager Hollie Lamb VP of Compliance & GM of Midland Office 20+ years of oil & gas industry experience Previously Partner of HeLMS Oil & Gas, VP Engineering, Reservoir & Geologic Engineer Experienced Management Team Shared Vision with a Track Record of Success 21 |
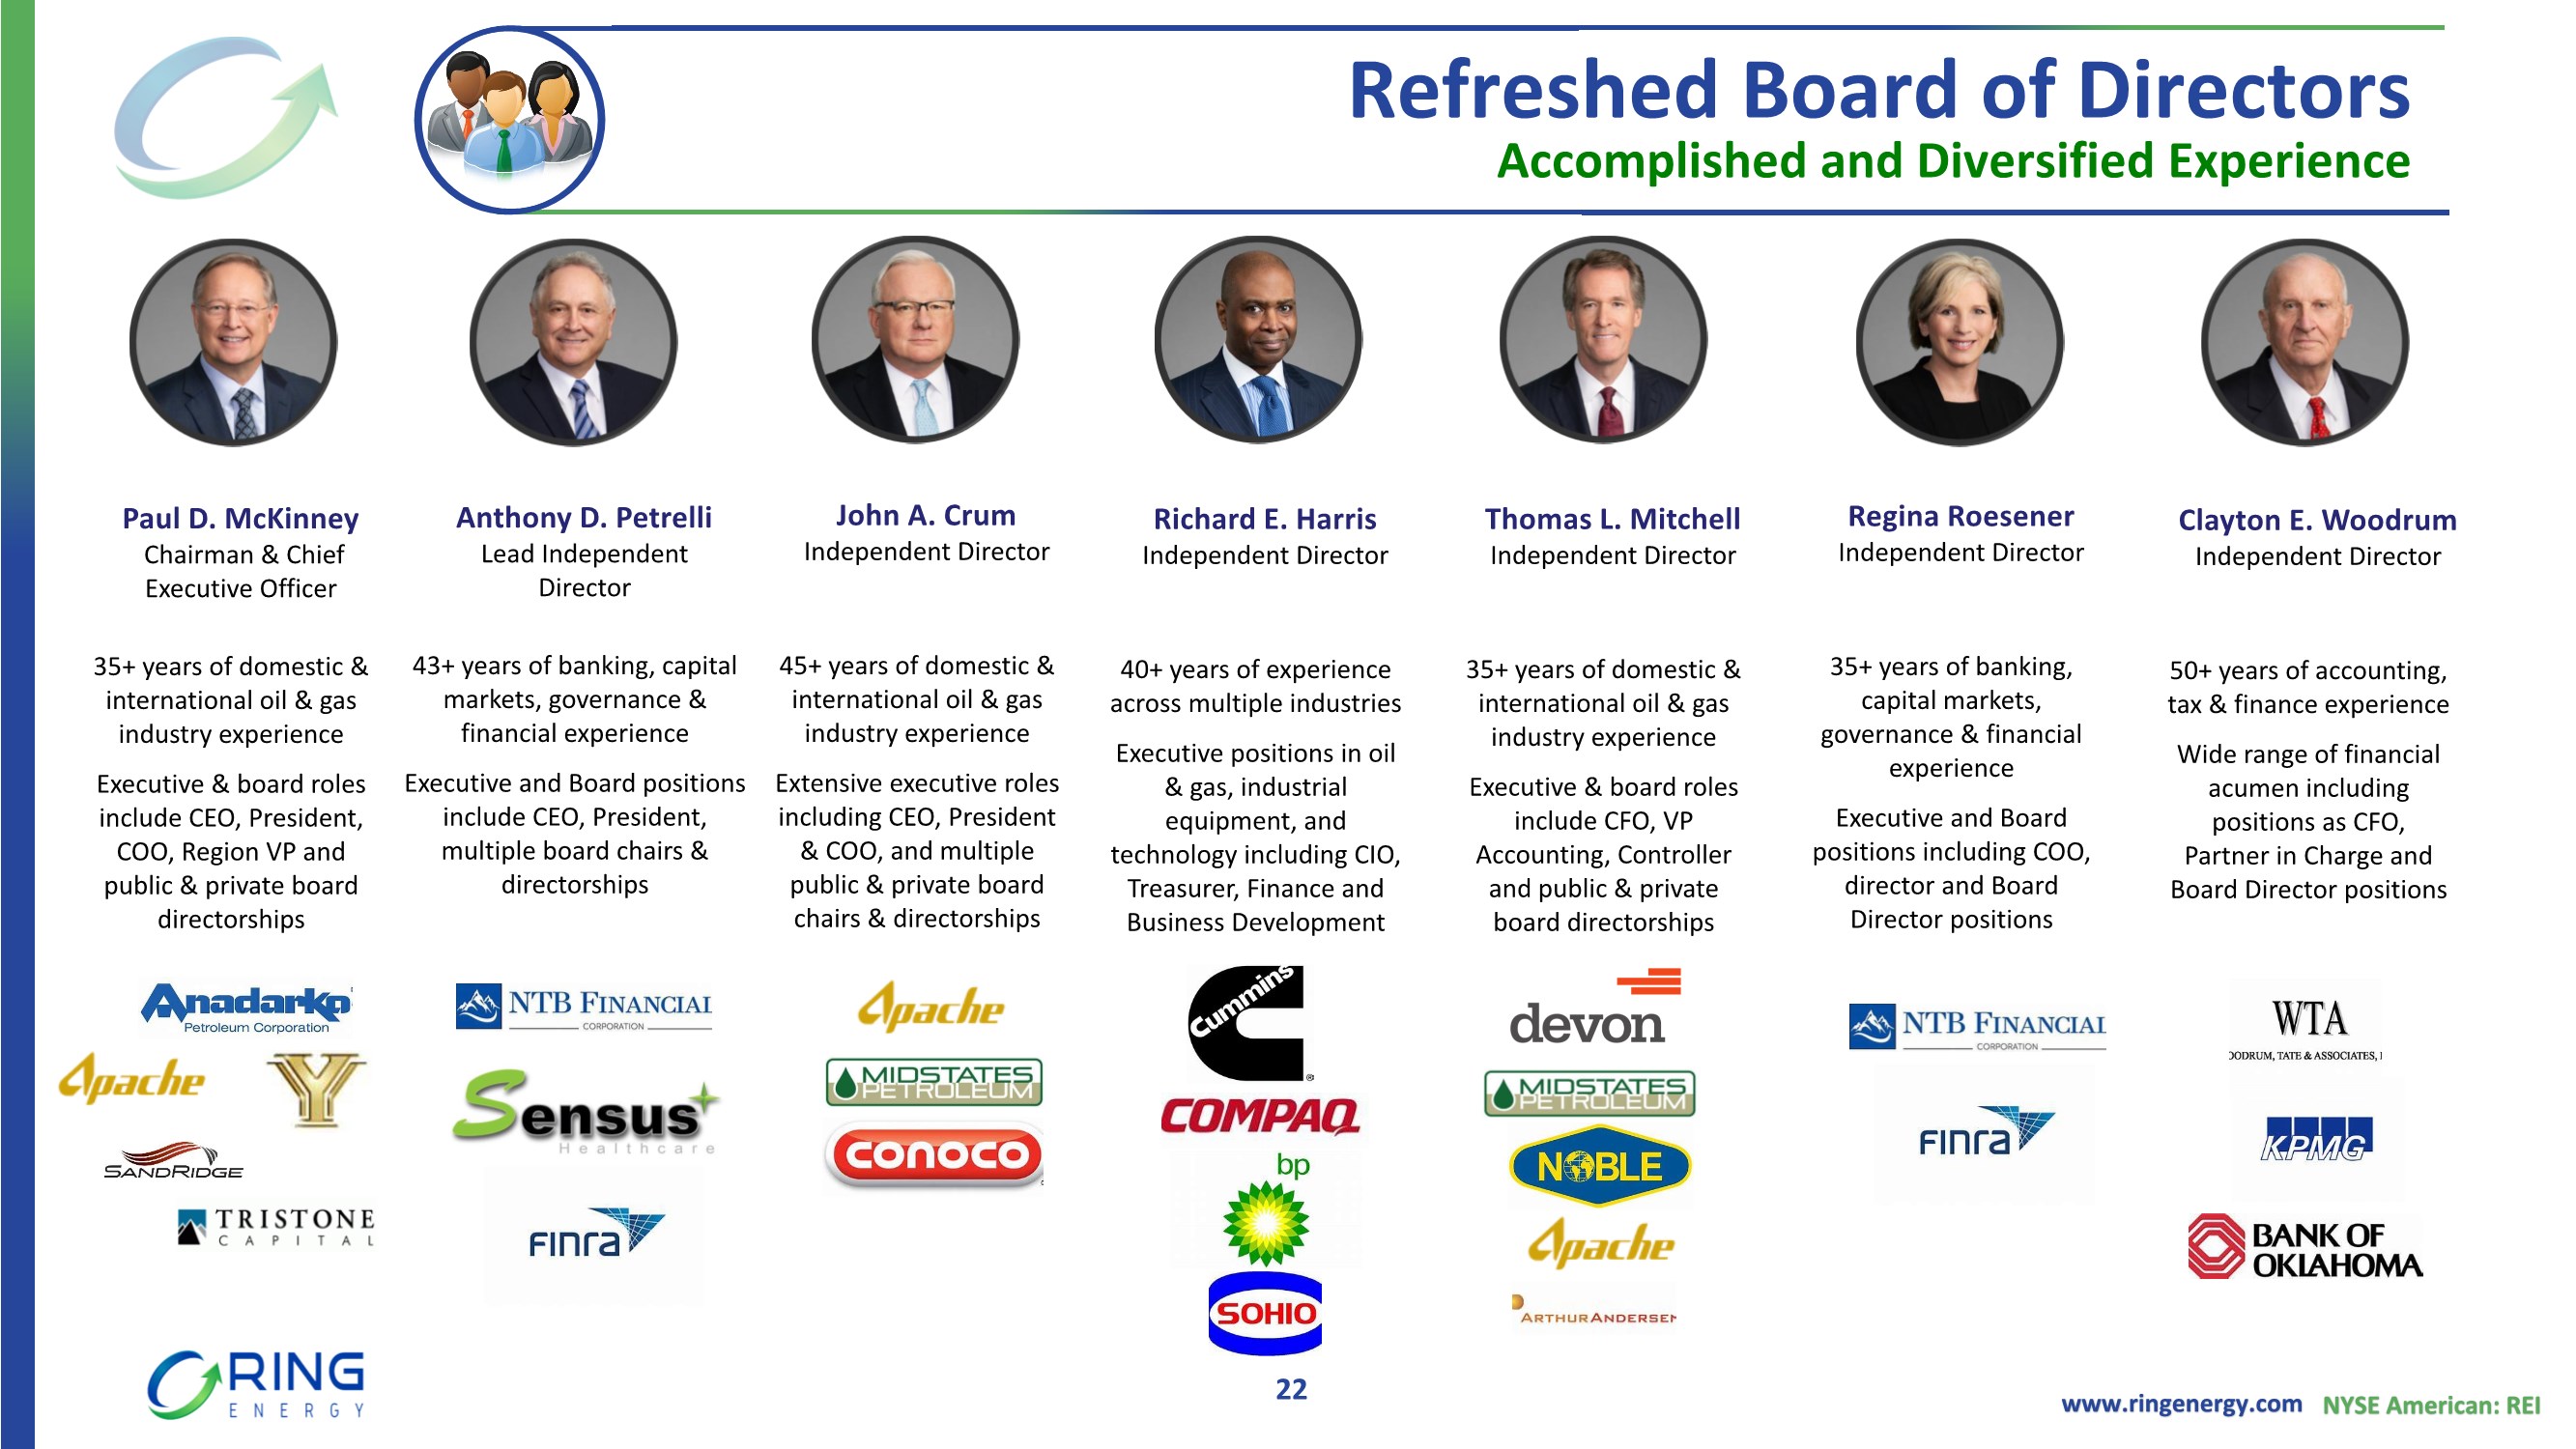
| www.ringenergy.com NYSE American: REI 22 Add Photo Paul D. McKinney Chairman & Chief Executive Officer 35+ years of domestic & international oil & gas industry experience Executive & board roles include CEO, President, COO, Region VP and public & private board directorships Anthony D. Petrelli Lead Independent Director 43+ years of banking, capital markets, governance & financial experience Executive and Board positions include CEO, President, multiple board chairs & directorships John A. Crum Independent Director 45+ years of domestic & international oil & gas industry experience Extensive executive roles including CEO, President & COO, and multiple public & private board chairs & directorships Richard E. Harris Independent Director 40+ years of experience across multiple industries Executive positions in oil & gas, industrial equipment, and technology including CIO, Treasurer, Finance and Business Development Thomas L. Mitchell Independent Director 35+ years of domestic & international oil & gas industry experience Executive & board roles include CFO, VP Accounting, Controller and public & private board directorships Regina Roesener Independent Director 35+ years of banking, capital markets, governance & financial experience Executive and Board positions including COO, director and Board Director positions Refreshed Board of Directors Accomplished and Diversified Experience Clayton E. Woodrum Independent Director 50+ years of accounting, tax & finance experience Wide range of financial acumen including positions as CFO, Partner in Charge and Board Director positions |
| www.ringenergy.com NYSE American: REI 459,000 688,500 1,142,250 $42.22 $45.42 $46.60 $30.00 $34.00 $38.00 $42.00 $46.00 $50.00 $54.00 $58.00 $62.00 $66.00 $70.00 0 200,000 400,000 600,000 800,000 1,000,000 1,200,000 FY'21 Collars FY'21 Swaps FY'22 Swaps Price ($/ Bbl ) Volume ( Bbls ) Financial Overview Oil Hedges as of 8/9/2021 23 Summary of Crude Oil Hedges Daily Total Weighted Avg. Weighted Avg. Weighted Avg. Volume Volume Swap Price Put/Floor Price Call/Ceiling Price (Bbls/d) (Bbls) (per Bbl) (per Bbl) (per Bbl) WTI - Crude 08/01/2021 12/31/2021 Collar 1,000 153,000 $45.00 $54.75 WTI - Crude 08/01/2021 12/31/2021 Collar 1,000 153,000 $45.00 $52.71 WTI - Crude 08/01/2021 12/31/2021 Collar 1,000 153,000 $40.00 $55.08 WTI - Crude 08/01/2021 12/31/2021 Put/Floor 1,500 229,500 $40.00 WTI - Crude 08/01/2021 12/31/2021 Swap 4,500 688,500 $45.42 WTI - Crude 01/01/2022 12/31/2022 Swap 3,129 1,142,250 $46.60 Commodity Effective Date End Date Structure $54.25 |
| www.ringenergy.com NYSE American: REI Income Statement and Operational Stats 24 Income Statement Operational Stats Oil and Natural Gas Revenues $ 47,760,102 $ 39,502,532 $ 10,636,593 $ 87,262,634 $ 50,206,921 Costs and Operating Expenses Lease operating expenses 7,424,488 8,226,575 5,646,330 15,651,063 14,067,717 Gathering, transportation and processing costs 897,166 935,019 625,966 1,832,185 1,775,585 Ad valorem taxes 703,775 737,251 800,000 1,441,026 1,607,455 Oil and natural gas production taxes 2,198,339 1,852,762 433,760 4,051,101 2,304,005 Depreciation, depletion and amortization 9,275,126 8,108,158 7,338,108 17,383,284 21,021,104 Ceiling test impairment - - 147,937,943 - 147,937,943 Asset retirement obligation accretion 184,013 193,744 231,367 377,757 463,329 Operating lease expense 84,790 271,517 292,207 356,307 581,258 General and administrative expense (including share-based compensation) 3,757,152 2,912,991 4,176,609 6,670,143 7,212,504 Total Costs and Operating Expenses 24,524,849 23,238,017 167,482,290 47,762,866 196,970,900 Income (Loss) Income from Operations 23,235,253 16,264,515 (156,845,697) 39,499,768 (146,763,979) Other Income (Expense) Interest income 1 - 1 1 6 Interest (expense) (3,654,529) (3,741,969) (4,253,040) (7,396,498) (8,501,538) (Loss) gain on derivative contracts (35,277,240) (31,588,639) (13,017,962) (66,865,879) 37,402,847 Deposit forfeiture income - - - - - Net Other Income (Expense) (38,931,768) (35,330,608) (17,271,001) (74,262,376) 28,901,315 (Loss) Income Before Tax Provision (15,696,515) (19,066,093) (174,116,698) (34,762,608) (117,862,664) Benefit from (Provision for) Income Taxes (190,644) - 39,116,632 (190,644) 26,666,716 Net (Loss) Income $ (15,887,159) $ (19,066,093) $ (135,000,066) $ (34,953,252) $ (91,195,948) Basic (Loss) Earnings per Share $ (0.16) $ (0.19) $ (1.99) $ (0.35) $ (1.34) Diluted (Loss) Earnings per Share $ (0.16) $ (0.19) $ (1.99) $ (0.35) $ (1.34) Basic Weighted-Average Shares Outstanding 99,300,458 99,092,715 67,980,794 99,197,160 67,987,295 Diluted Weighted-Average Shares Outstanding 99,300,458 99,092,715 67,980,794 99,197,160 67,987,295 Three Months Ended Six Months Ended June 30, June 30, June 30, March 31, June 30, RING ENERGY, INC. Condensed Statements of Operations (Unaudited) 2021 2021 2020 2021 2020 June 30, March 31, June 30, June 30, June 30, 2021 2021 2020 2021 2020 Net sales volumes: Oil (Bbls) 702,408 610,121 (2) 429,751 1,312,529 (2) 1,285,354 Natural gas (Mcf) 540,857 637,808 417,491 1,178,666 1,183,042 Total oil and natural gas (Boe) (1) 792,551 716,422 499,333 1,508,973 1,482,528 % Oil 89% 85% 86% 87% 87% Average daily equivalent sales (Boe/d) 8,709 7,960 5,487 8,337 8,146 Average realized sales prices: Oil ($/Bbl) $ 65.00 $ 58.00 $ 24.23 $ 61.74 $ 38.16 Natural gas ($/Mcf) 3.90 6.46 0.53 5.28 0.98 Barrel of oil equivalent ($/Boe) $ 60.26 $ 55.14 $ 21.30 $ 57.83 $ 33.87 Average costs and expenses per Boe ($/Boe): Lease operating expenses $ 9.37 $ 11.48 $ 11.31 $ 10.37 $ 9.49 Gathering, transportation and processing costs 1.13 1.31 1.25 1.21 1.20 Ad valorem taxes 0.89 1.03 1.60 0.95 1.08 Oil and natural gas production taxes 2.77 2.59 0.87 2.68 1.55 Depreciation, depletion and amortization 11.70 11.32 14.70 11.52 14.18 Asset retirement obligation accretion 0.23 0.27 0.46 0.25 0.31 Operating lease expense 0.11 0.38 0.59 0.24 0.39 General and administrative expense (including share- based compensation) 4.74 4.07 8.36 4.42 4.87 General and administrative expense (excluding share- based compensation) 4.30 3.57 5.73 3.95 3.52 (2) Includes 379 barrels of skim oil. Three Months Ended Six Months Ended (1) Boe is determined using the ratio of six Mcf of natural gas to one Bbl of oil (totals may not compute due to rounding). The conversion ratio does not assume price equivalency and the price on an equivalent basis for oil and natural gas may differ significantly. |
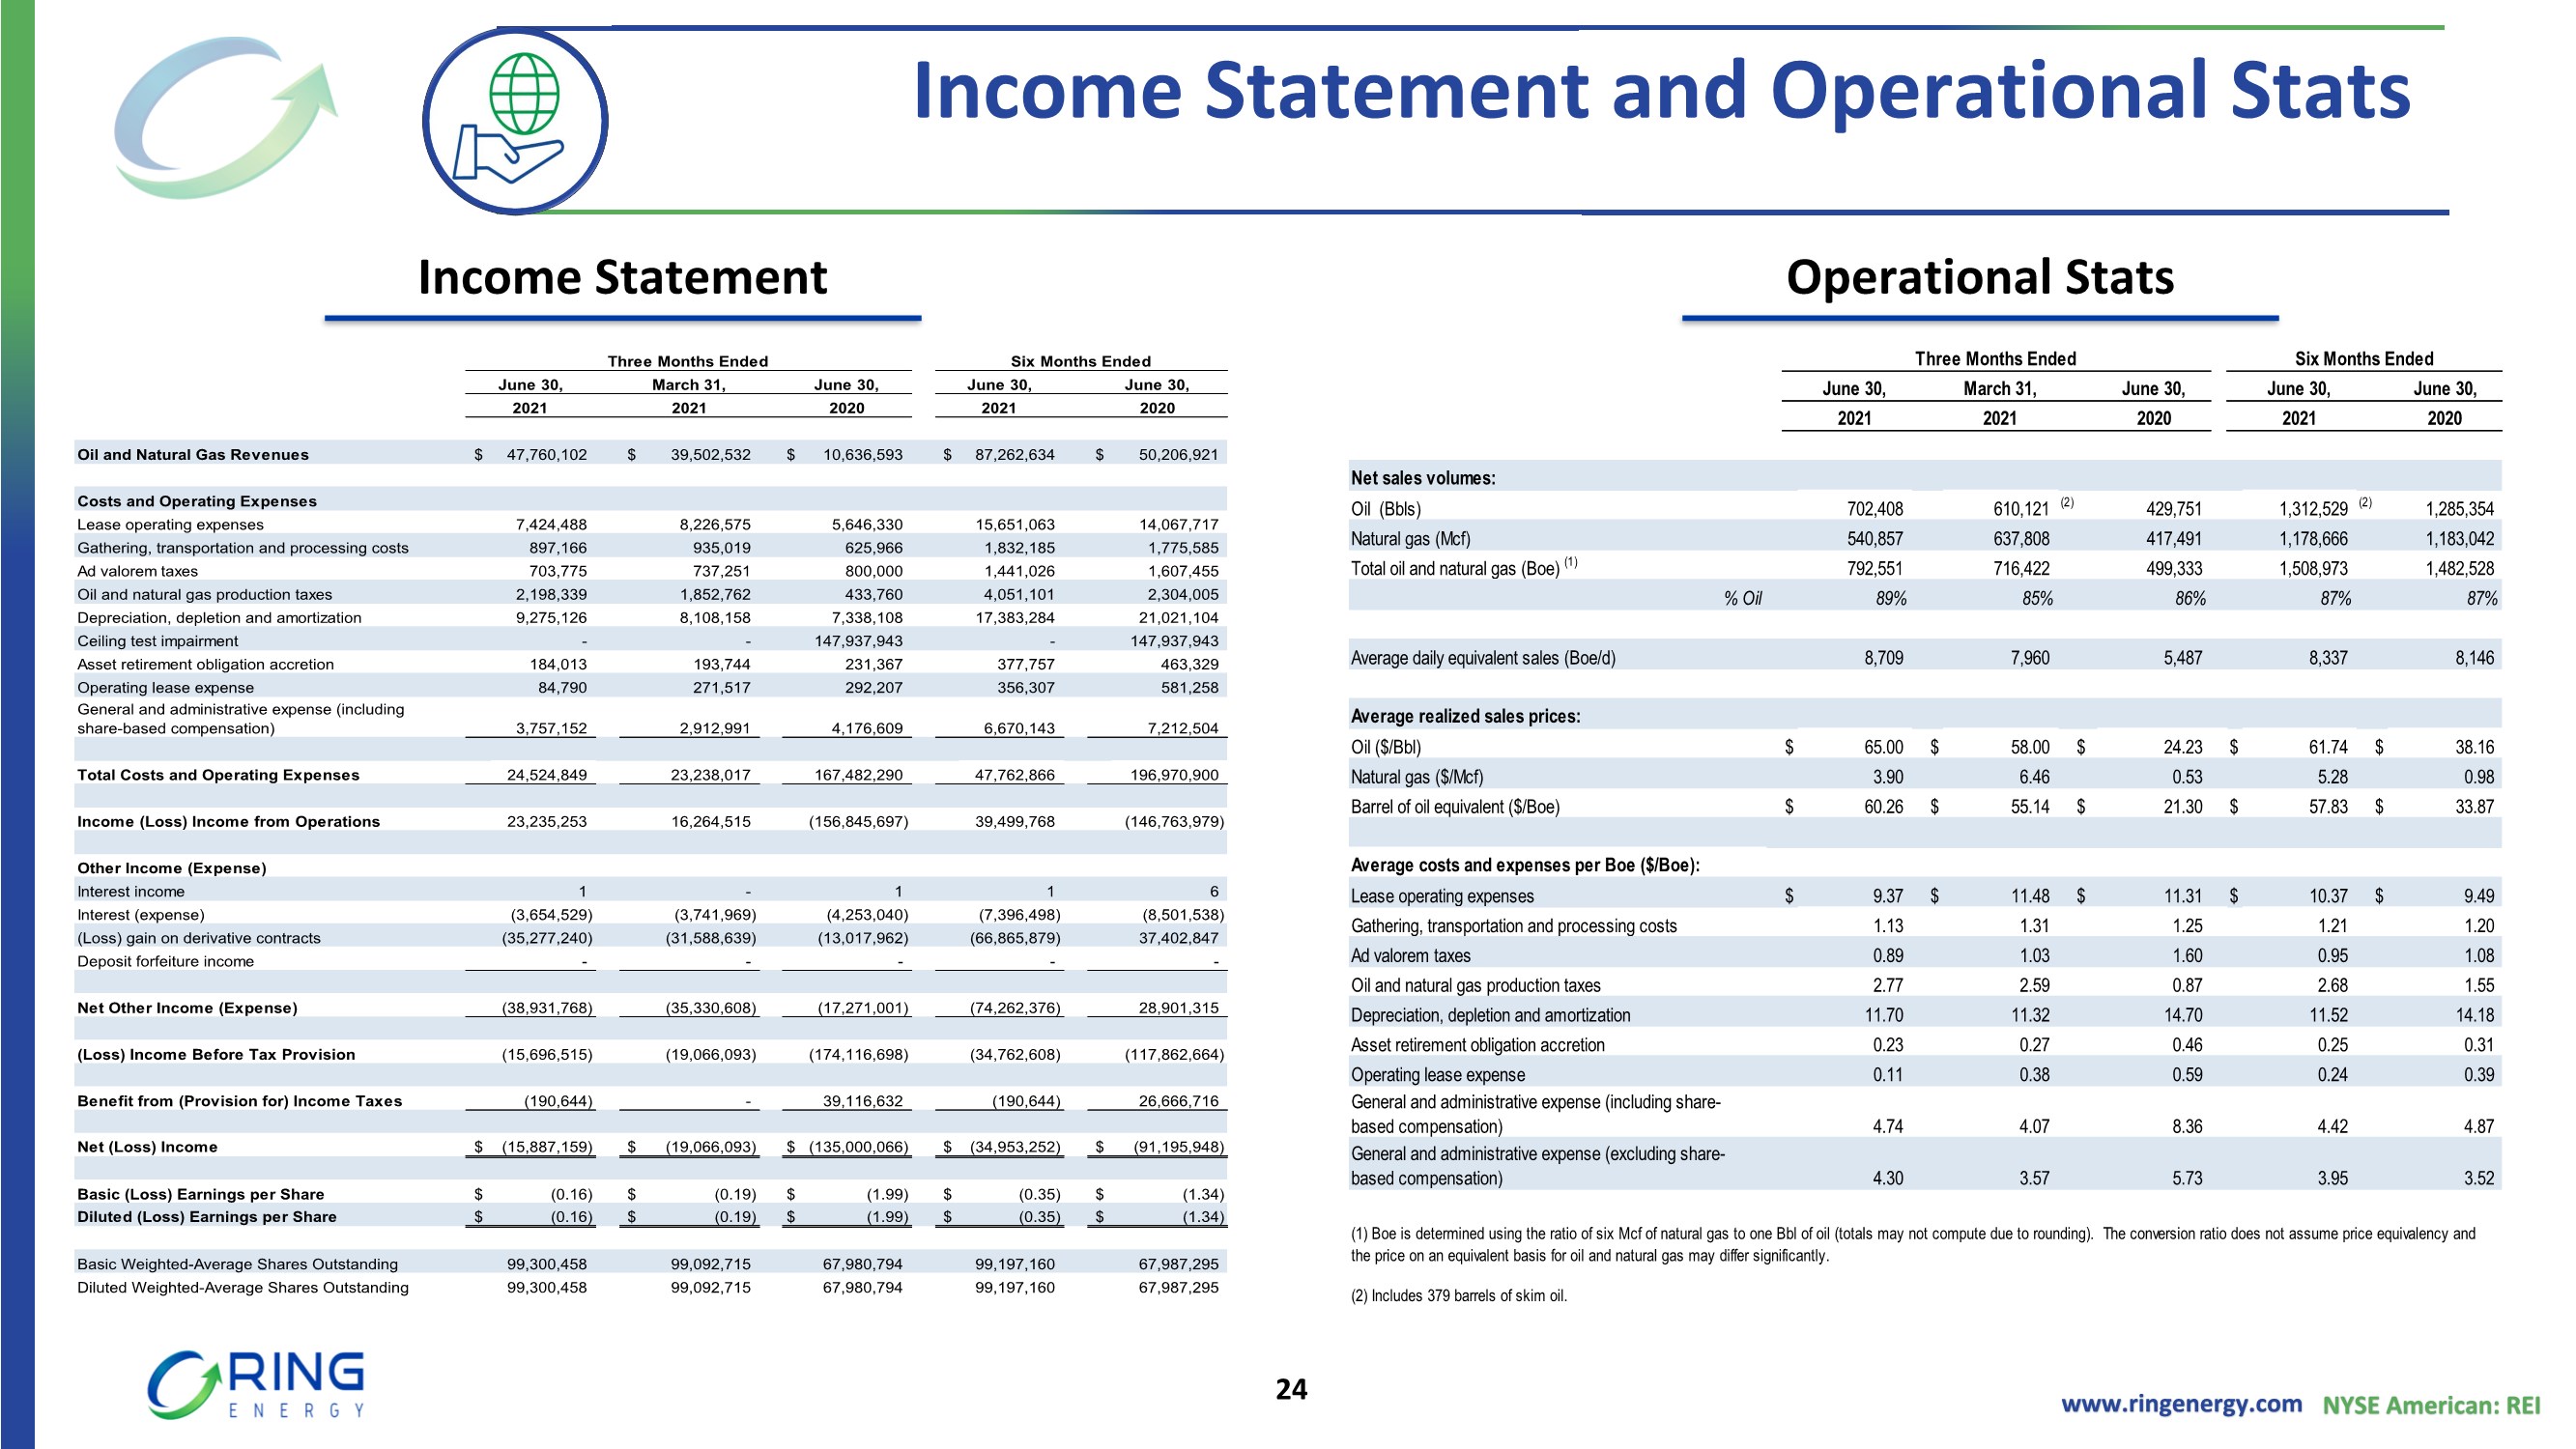
| www.ringenergy.com NYSE American: REI Balance Sheet and Cash Flow Statement 25 Balance Sheet Cash Flow Statement ASSETS Current Assets Cash and cash equivalents $ 2,670,242 $ 3,578,634 Accounts receivable 21,679,567 14,997,979 Joint interest billing receivable 1,909,804 1,327,262 Derivative receivable - 499,906 Prepaid expenses and other assets 1,577,671 396,109 Total Current Assets 27,837,284 20,799,890 Properties and Equipment Oil and natural gas properties subject to amortization 858,427,028 836,514,815 Financing lease asset subject to depreciation 819,784 858,513 Fixed assets subject to depreciation 1,741,902 1,520,890 Total Properties and Equipment 860,988,714 838,894,218 Accumulated depreciation, depletion and amortization (216,589,422) (200,111,658) Net Properties and Equipment 644,399,292 638,782,560 Operating Lease Asset 1,411,150 1,494,399 Properties and Equipment 2,049,096 2,379,348 TOTAL ASSETS $ 675,696,822 $ 663,456,197 LIABILITIES AND STOCKHOLDERS' EQUITY Current Liabilities Accounts payable $ 44,128,214 $ 32,500,081 Financing lease liability 259,261 295,311 Operating lease liability 216,730 859,017 Derivative liabilities 42,517,473 3,287,328 Notes payable 758,150 - Total Current Liabilities 87,879,828 36,941,737 Deferred income taxes 190,644 - Revolving line of credit 300,500,000 313,000,000 Financing lease liability, less current portion 4,183 126,857 Operating lease liability, less current portion 1,285,335 635,382 Derivative liabilities 10,147,883 869,273 Asset retirement obligations 14,992,850 17,117,135 Total Liabilities 415,000,723 368,690,384 Stockholders' Equity Preferred stock - $0.001 par value; 50,000,000 shares authorized; no shares issued or outstanding - - Common stock - $0.001 par value; 150,000,000 shares authorized; 99,351,145 shares and 85,568,287 shares issued and outstanding, respectively 99,351 85,568 Additional paid-in capital 551,821,170 550,951,415 Accumulated deficit (291,224,422) (256,271,170) Total Stockholders' Equity 260,696,099 294,765,813 TOTAL LIABILITIES AND STOCKHOLDERS' EQUITY $ 675,696,822 $ 663,456,197 RING ENERGY, INC. Condenced Balance Sheets June 30, December 31, (Unaudited) 2021 2020 Cash Flows From Operating Activities Net (loss) income $ (15,887,159) $ (19,066,093) $ (135,000,066) $ (34,953,252) $ (91,195,948) Adjustments to reconcile net (loss) income to net cash provided by operating activities: Depreciation, depletion and amortization 9,275,126 8,108,158 7,338,108 17,383,284 21,021,104 Ceiling test impairment - - 147,937,943 - 147,937,943 Accretion expense 184,013 193,744 231,367 377,757 463,329 Amortization of deferred financing costs 147,224 183,027 189,083 330,251 378,165 Share-based compensation 351,775 355,494 1,317,542 707,269 1,991,337 Shares issued for services - - - - - Deferred income tax (benefit) expense 47,967 (1,792,142) (37,077,082) (1,744,175) (25,048,702) Excess tax expense (benefit) related to share- based compensation 142,677 1,792,142 (2,039,550) 1,934,819 (1,618,014) Change in fair value of derivative instruments 35,277,240 31,588,639 13,017,962 66,865,879 (37,402,847) Cash (paid) received for derivative settlements, net (12,436,333) (5,920,791) 13,753,567 (18,357,124) 17,087,695 Changes in assets and liabilities: Accounts receivable (704,568) (5,968,739) 8,630,061 (6,673,307) 15,545,418 Prepaid expenses and retainers (1,346,762) 165,200 (186,593) (1,181,562) 3,397,860 Accounts payable 2,365,612 6,293,506 (15,436,648) 8,659,118 (22,050,677) Settlement of asset retirement obligation (1,093,816) (244,461) (27,368) (1,338,277) (320,580) Net Cash Provided by Operating Activities 16,322,996 15,687,684 2,648,326 32,010,680 30,186,083 Cash Flows From Investing Activities Payments to purchase oil and natural gas properties (178,718) (258,970) (537,386) (437,688) (1,017,434) Payments to develop oil and natural gas properties (10,824,079) (11,898,939) (5,839,641) (22,723,018) (30,302,779) Payments to acquire or improve fixed assets (41,442) (19,461) - (60,903) - Proceeds from divestiture of oil and natural gas properties - 2,000,000 - 2,000,000 - Purchase of fixed assets subject to depreciation - - - - - Net Cash Used in Investing Activities (11,044,239) (10,177,370) (6,377,027) (21,221,609) (31,320,213) Cash Flows From Financing Activities Proceeds from revolving line of credit 6,900,000 13,000,000 21,500,000 19,900,000 21,500,000 Payments on revolving line of credit (11,900,000) (20,500,000) (13,000,000) (32,400,000) (13,000,000) Proceeds from issuance of common stock and warrants 80,000 161,269 - 241,269 - Proceeds from notes payable 909,467 - - 909,467 - Payments on notes payable (151,317) - - (151,317) - Payment of deferred financing costs (76,887) - - (76,887) - Reduction of financing lease liabilities (70,288) (49,707) (72,906) (119,995) (140,712) Net Cash Used in (Provided by) Investing Activities (4,309,025) (7,388,438) 8,427,094 (11,697,463) 8,359,288 Net (Decrease) Increase in Cash 969,732 (1,878,124) 4,698,393 (908,392) 7,225,158 Cash at Beginning of Period 1,700,510 3,578,634 12,531,387 3,578,634 10,004,622 Cash at End of Period $ 2,670,242 $ 1,700,510 $ 17,229,780 $ 2,670,242 $ 17,229,780 Three Months Ended June 30, June 30, June 30, 2021 2020 Six Months Ended RING ENERGY, INC. Condensed Statements of Cash Flows (Unaudited) 2021 March 31, 2021 June 30, 2020 |
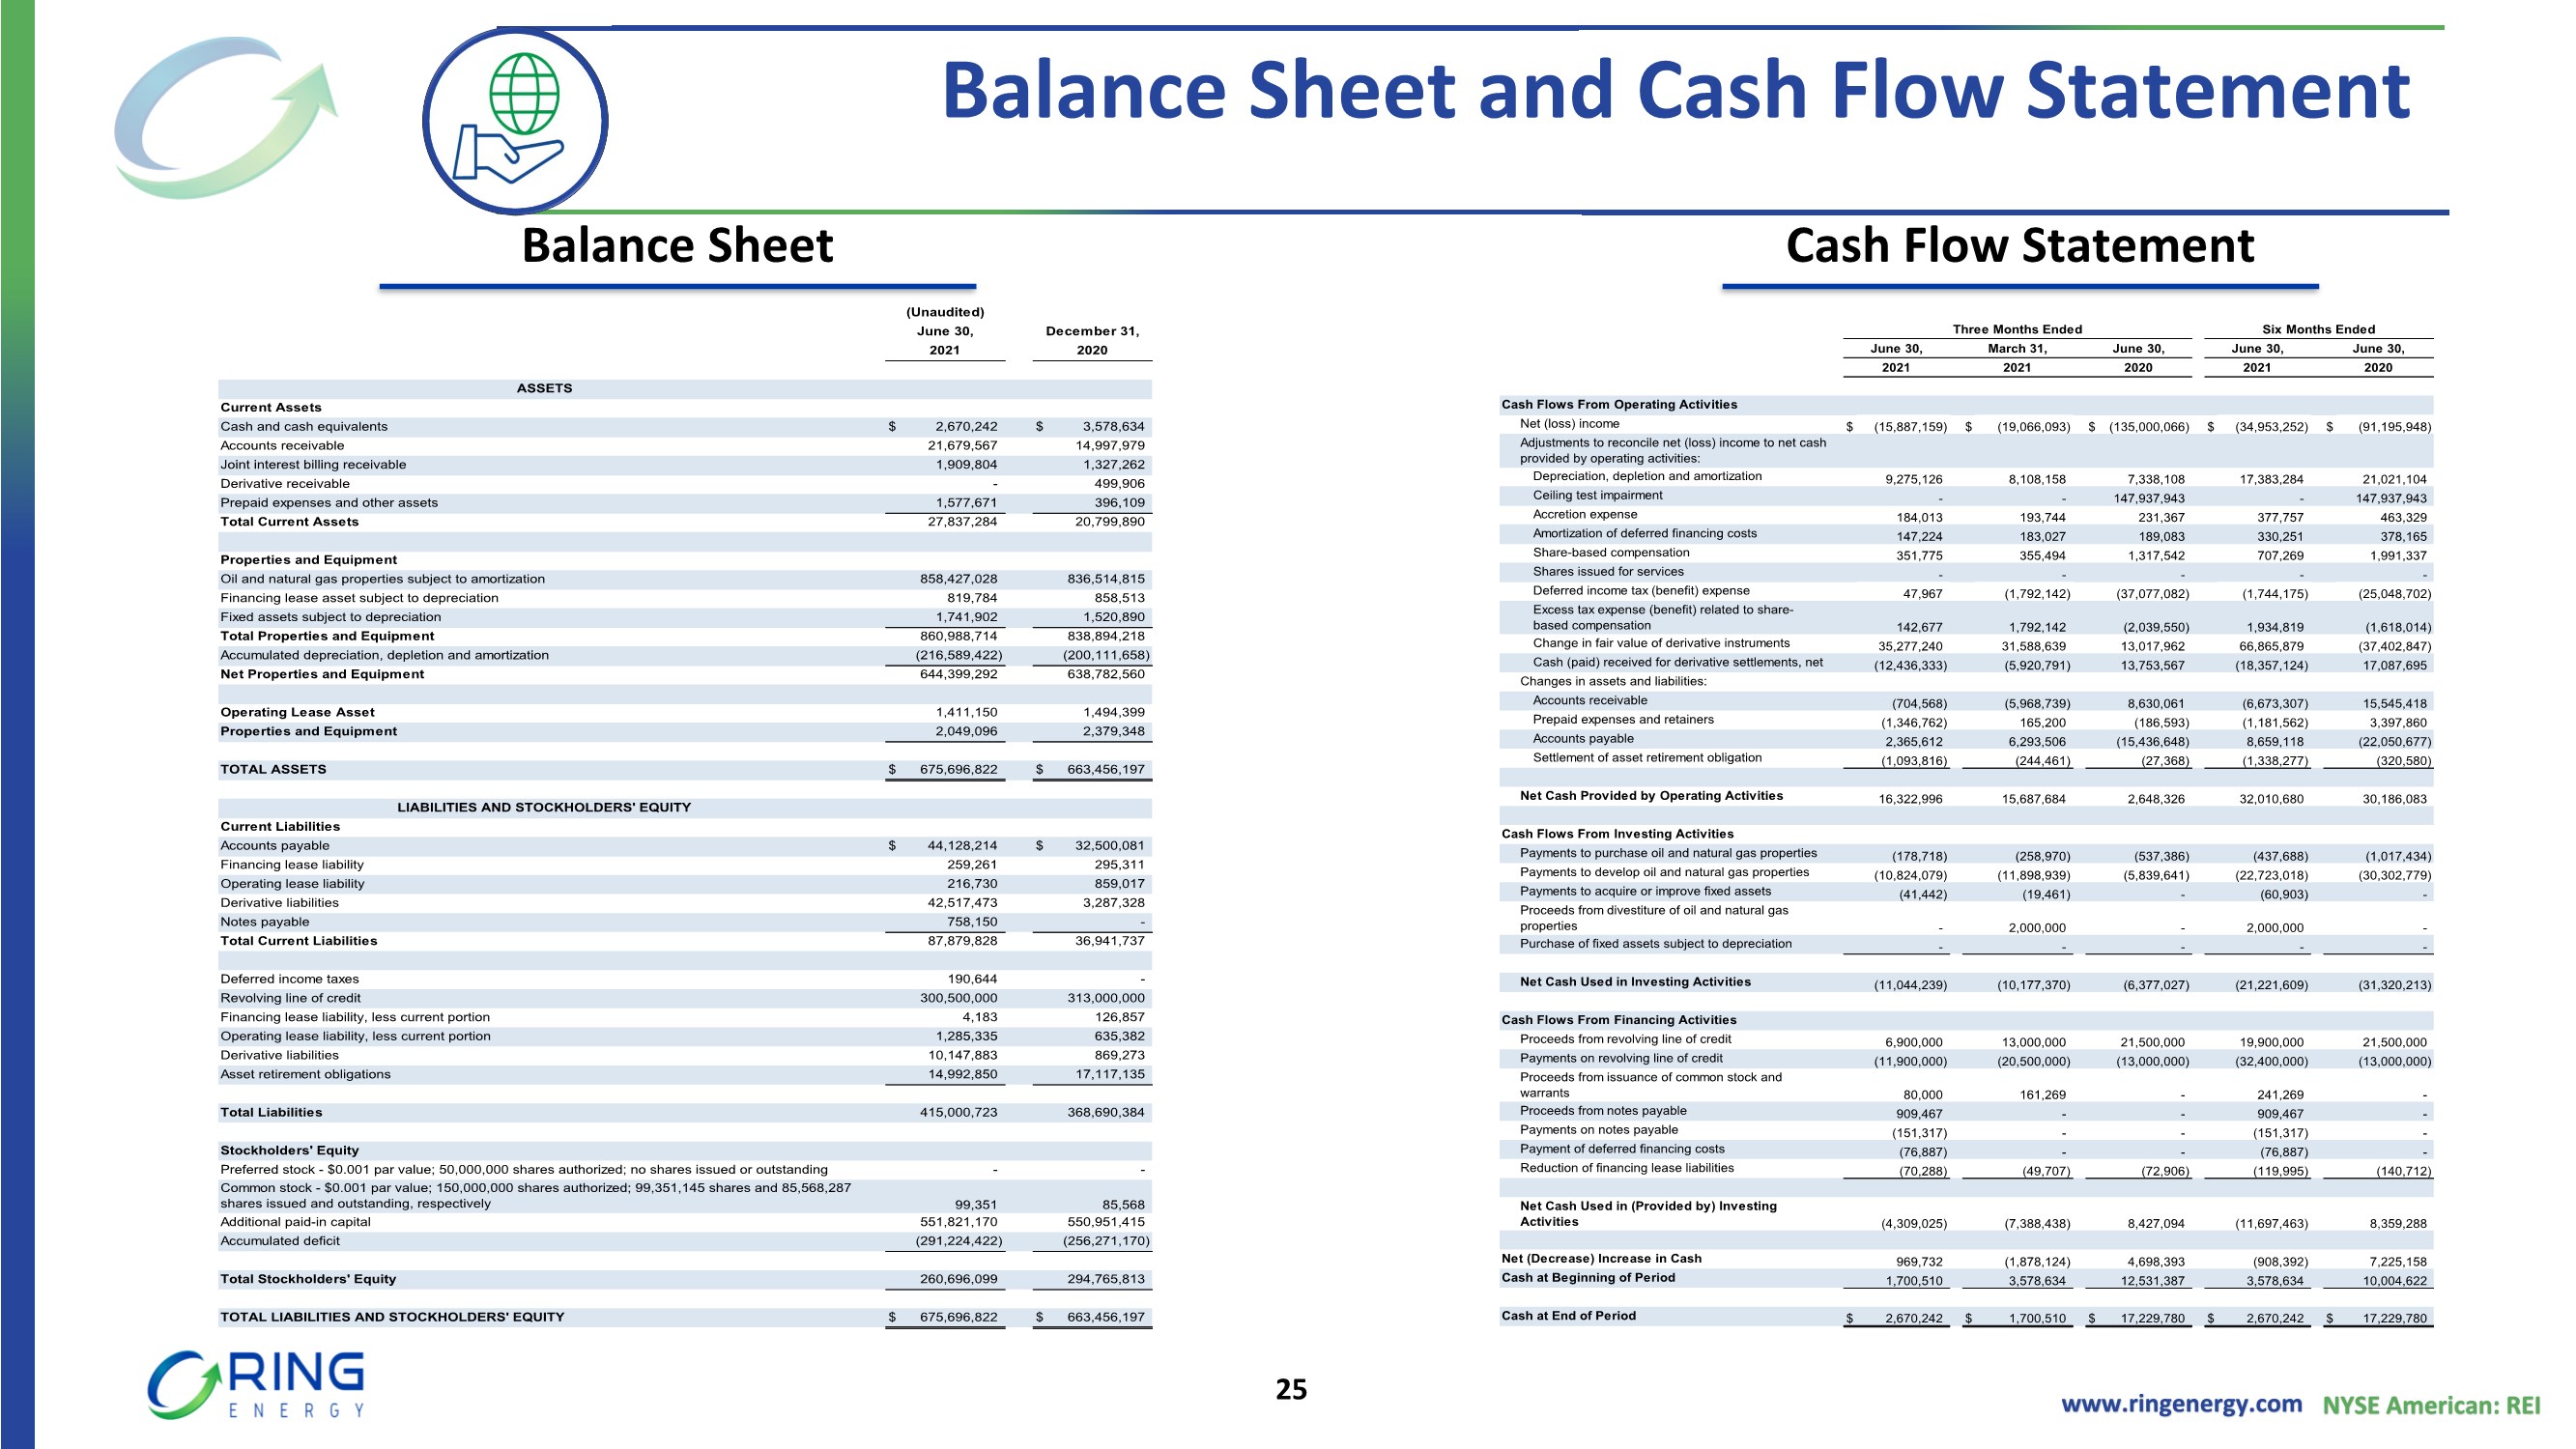
| www.ringenergy.com NYSE American: REI Non-GAAP Disclosure 26 Non-GAAP Information Certain financial information included in Ring’s financial results are not measures of financial performance recognized by accounting principles generally accepted in the United States, or GAAP. These non-GAAP financial measures are “Adjusted Net Income”, “Adjusted EBITDA”, “Free Cash Flow” and “Cash Flow from Operations”. Management uses these non-GAAP financial measures in its analysis of performance. In addition, Adjusted EBITDA is a key metric used to determine the Company’s incentive compensation awards. These disclosures may not be viewed as a substitute for results determined in accordance with GAAP and are not necessarily comparable to non-GAAP performance measures which may be reported by other companies. Adjusted Net Income does not include the estimated after-tax impact of share-based compensation, ceiling test impairment, and unrealized loss (gain) on change in fair value of derivatives, as well an add back of the full valuation against the Company’s deferred tax assets during the fourth quarter of 2020. Adjusted Net Income is presented because the timing and amount of these items cannot be reasonably estimated and affect the comparability of operating results from period to period, and current periods to prior periods. The Company also presents the non-GAAP financial measures Adjusted EBITDA and Free Cash Flow. The Company defines Adjusted EBITDA as net (loss) income plus net interest expense, unrealized loss on change in fair value of derivatives, ceiling test impairment, income tax (benefit) expense, depreciation, depletion and amortization and accretion, asset retirement obligation accretion and share-based compensation. Company management believes this presentation is relevant and useful because it helps investors understand Ring’s operating performance and makes it easier to compare its results with those of other companies that have different financing, capital and tax structures. Adjusted EBITDA should not be considered in isolation from or as a substitute for net income, as an indication of operating performance or cash flows from operating activities or as a measure of liquidity. Adjusted EBITDA, as Ring calculates it, may not be comparable to Adjusted EBITDA measures reported by other companies. In addition, Adjusted EBITDA does not represent funds available for discretionary use. The Company defines Free Cash Flow as Adjusted EBITDA (defined above) less net interest expense (excluding amortization of deferred financing cost) and capital expenditures. For this purpose, the Company’s definition of capital expenditures includes costs incurred related to oil and natural gas properties (such as drilling and infrastructure costs and the lease maintenance costs) and equipment, furniture and fixtures, but excludes acquisition costs of oil and gas properties from third parties that are not included in the Company’s capital expenditures guidance provided to investors. Company management believes that Free Cash Flow is an important financial performance measure for use in evaluating the performance and efficiency of its current operating activities after the impact of accrued capital expenditures and net interest expense and without being impacted by items such as changes associated with working capital, which can vary substantially from one period to another. There is no commonly accepted definition Free Cash Flow within the industry. Accordingly, Free Cash Flow, as defined and calculated by the Company, may not be comparable to Free Cash Flow or other similarly named non-GAAP measures reported by other companies. While the Company includes net interest expense in the calculation of Free Cash Flow, other mandatory debt service requirements of future payments of principal at maturity (if such debt is not refinanced) are excluded from the calculation of Free Cash Flow. These and other non- discretionary expenditures that are not deducted from Free Cash Flow would reduce cash available for other uses. |
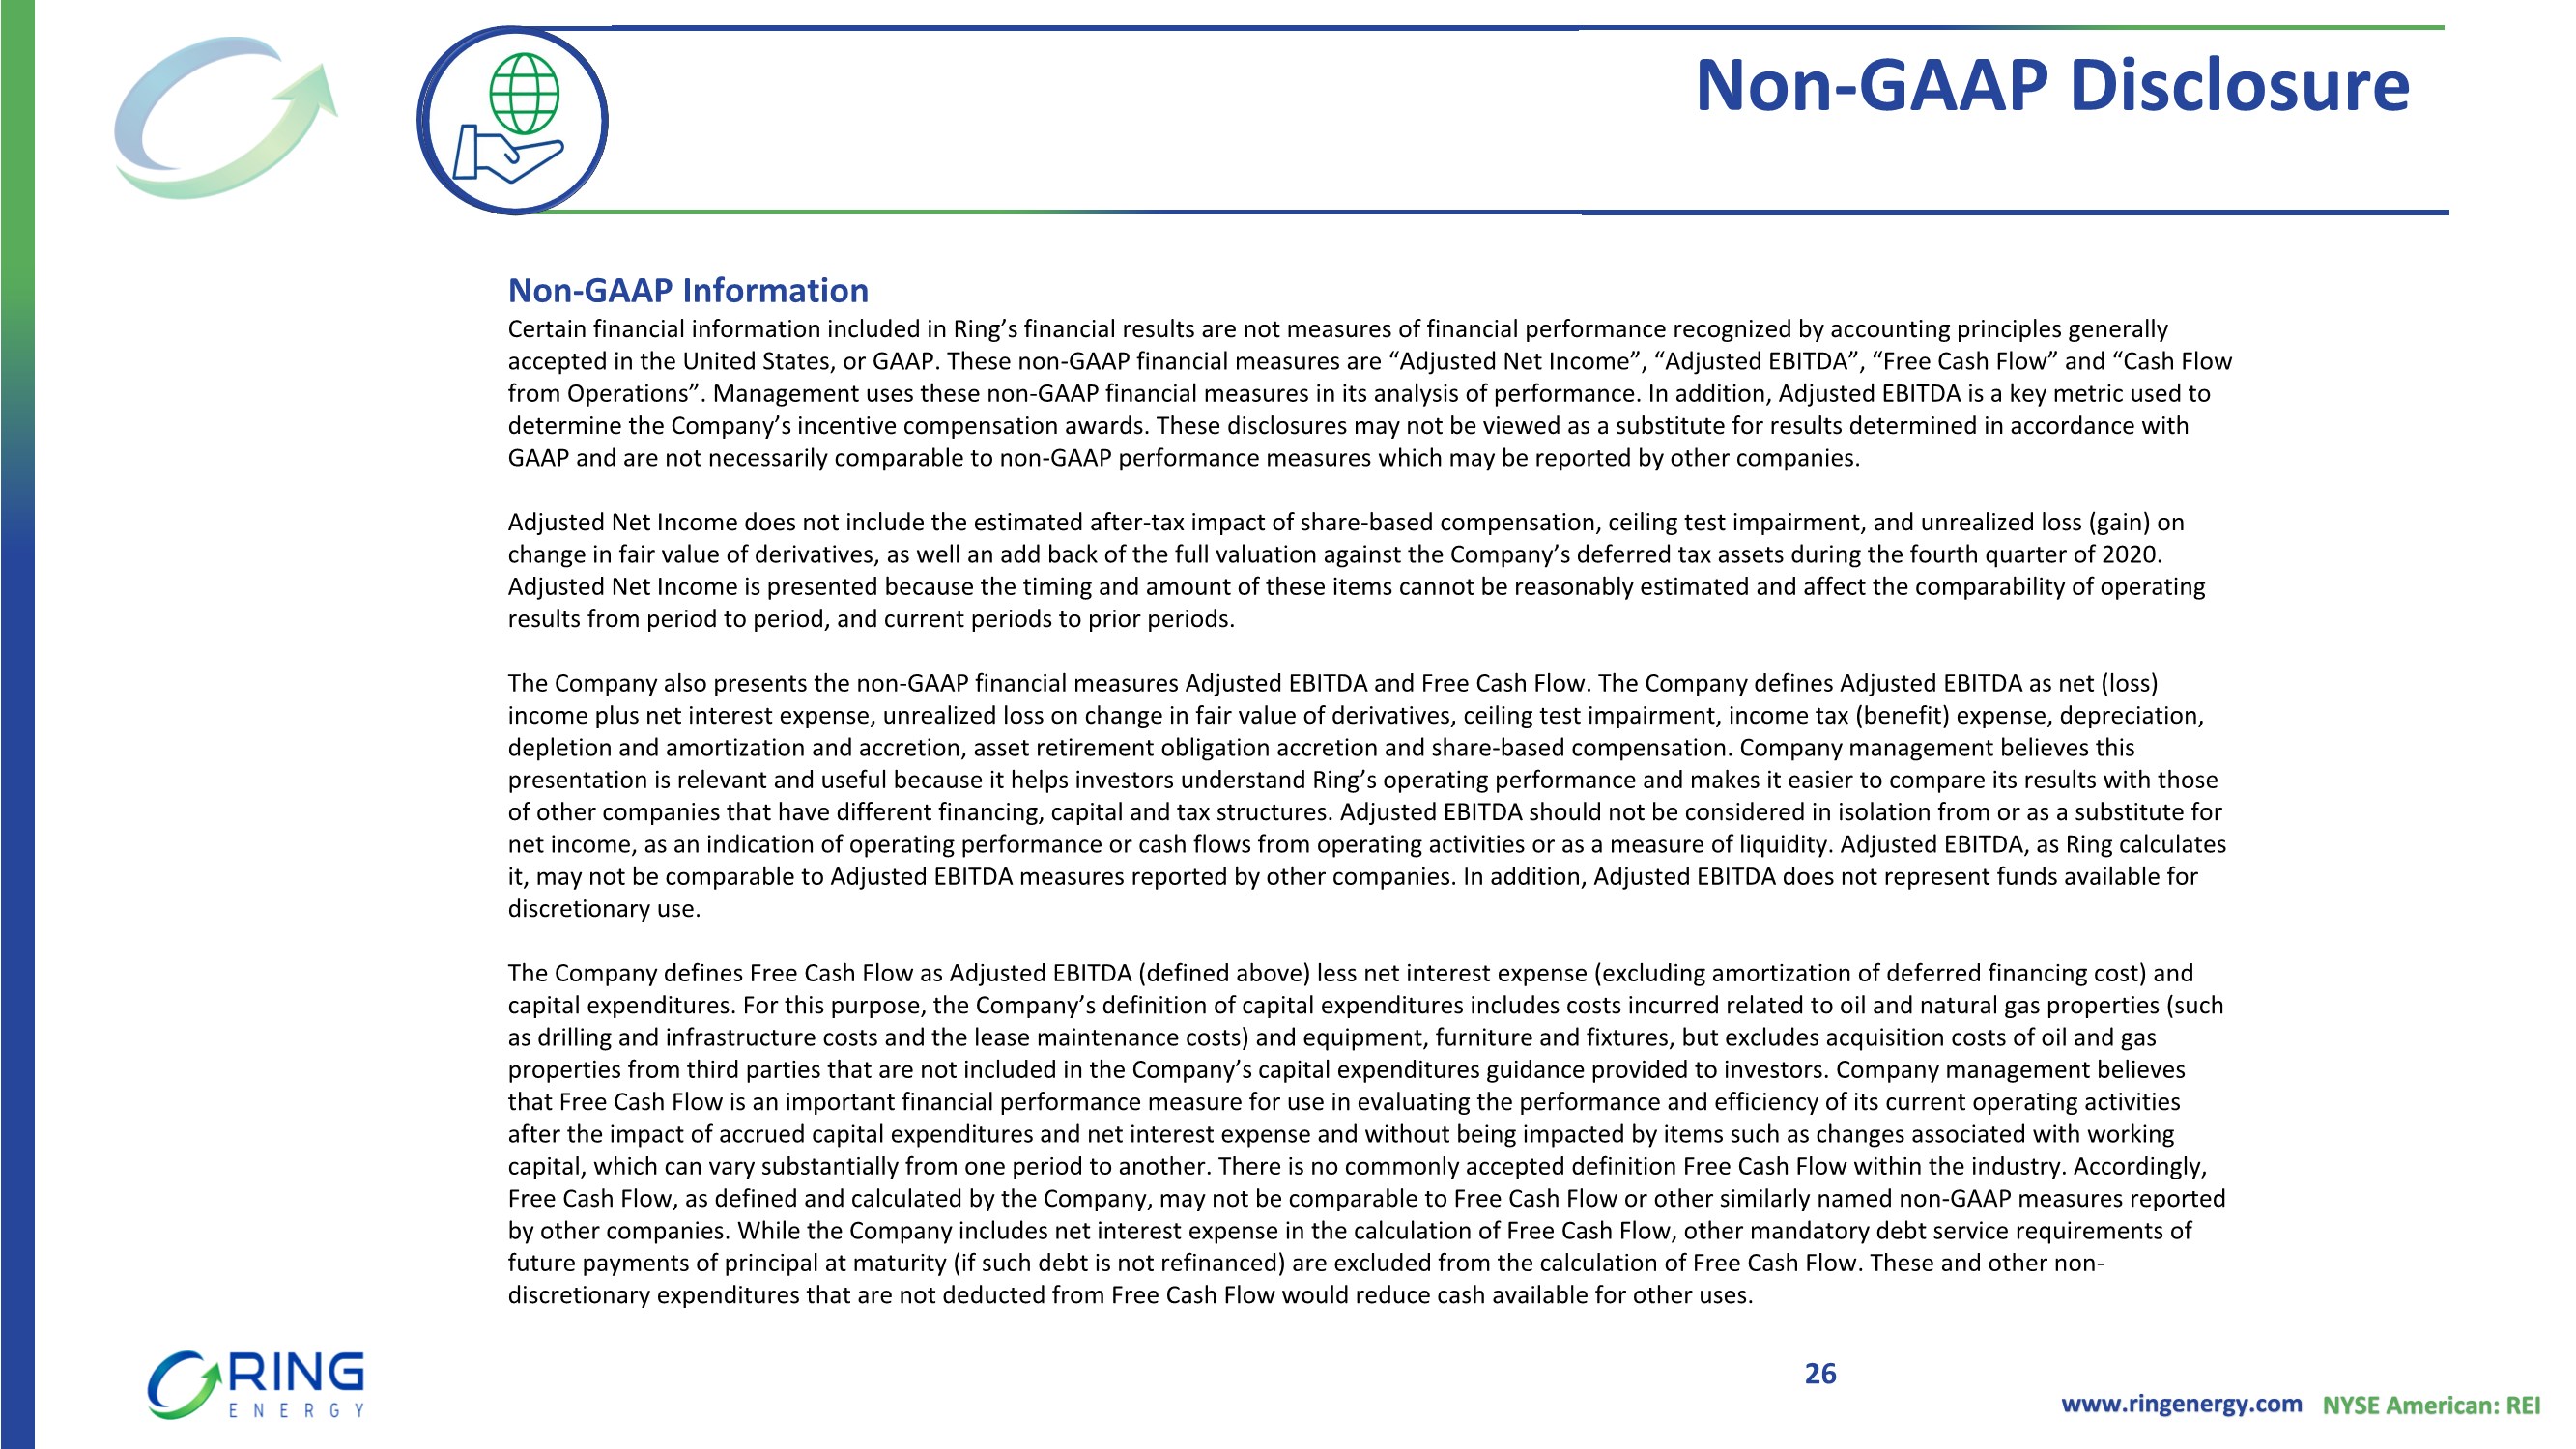
| www.ringenergy.com NYSE American: REI Non-GAAP Reconciliations 27 Net (Loss) Income $ (15,887,159) $ (19,066,093) $ (135,000,066) $ (34,953,252) $ (91,195,948) Share-based compensation 351,775 355,494 1,317,542 707,269 1,991,337 Ceiling test write impairment - - 147,937,943 - 147,937,943 Unrealized loss (gain) on change in fair value of derivatives 22,840,907 25,667,848 26,771,529 48,508,755 (20,315,152) Tax impact of adjusted items - - (39,545,799) - (29,274,627) Adjusted Net Income $ 7,305,523 $ 6,957,249 $ 1,481,149 $ 14,262,772 $ 9,143,553 Weighted-Average Shares Outstanding 99,300,458 99,092,715 67,980,794 99,197,160 67,987,295 Adjusted Net Income per Share $ 0.07 $ 0.07 $ 0.02 $ 0.14 $ 0.13 Net (Loss) Income $ (15,887,159) $ (19,066,093) $ (135,000,066) $ (34,953,252) $ (91,195,948) Interest expense, net 3,654,528 3,741,969 4,253,039 7,396,497 8,501,532 Unrealized loss (gain) on change in fair value of derivatives 22,840,907 25,667,848 26,771,529 48,508,755 (20,315,152) Ceiling test impairment - - 147,937,943 - 147,937,943 Income tax (benefit) expense 190,644 - (39,116,632) 190,644 (26,666,716) Depreciation, depletion and amortization 9,275,126 8,108,158 7,338,108 17,383,284 21,021,104 Asset retirement obligation accretion 184,013 193,744 231,367 377,757 463,329 Share-based compensation 351,775 355,494 1,317,542 707,269 1,991,337 Adjusted EBITDA $ 20,609,834 $ 19,001,120 $ 13,732,830 $ 39,610,954 $ 41,737,429 Adjusted EBITDA Margin 43% 48% 129% 45% 83% Weighted-Average Shares Outstanding 99,300,458 99,092,715 67,980,794 99,197,160 67,987,295 Adjusted EBITDA per Share $ 0.21 $ 0.19 $ 0.20 $ 0.40 $ 0.61 (Unaudited for All Periods) (Unaudited for All Periods) 2020 Three Months Ended June 30, 2020 2021 2021 2020 March 31, Three Months Ended March 31, June 30, June 30, 2021 Adjusted Net Income Adjusted EBITDA 2021 June 30, June 30, June 30, 2021 2020 Six Months Ended June 30, June 30, 2021 Six Months Ended Adjusted EBITDA $ 20,609,834 $ 19,001,120 $ 13,732,830 $ 39,610,954 $ 41,737,429 Net interest expense (excluding amortization of deferred financing costs) (3,507,304) (3,558,942) (4,063,956) (7,066,246) (8,123,367) Capital expenditures (11,456,062) (14,525,436) (1,823,642) (25,981,498) (17,796,828) Proceeds from divestiture of oil and natural gas properties - 2,000,000 - 2,000,000 - Free Cash Flow $ 5,646,468 $ 2,916,742 $ 7,845,232 $ 8,563,210 $ 15,817,234 Net Cash Provided by Operating Activities $ 16,322,996 $ 15,687,684 $ 2,648,326 $ 32,010,680 $ 30,186,083 Changes in operating assets and liabilities 779,534 (245,506) 7,020,548 534,028 3,427,979 Cash Flow from Operations $ 17,102,530 $ 15,442,178 $ 9,668,874 $ 32,544,708 $ 33,614,062 2021 2021 2020 June 30, 2021 (Unaudited for All Periods) June 30, June 30, Six Months Ended 2021 June 30, 2020 (Unaudited for All Periods) Cash Flow From Operations Three Months Ended June 30, March 31, June 30, June 30, June 30, Six Months Ended 2021 2020 Free Cash Flow Three Months Ended March 31, 2021 2020 |
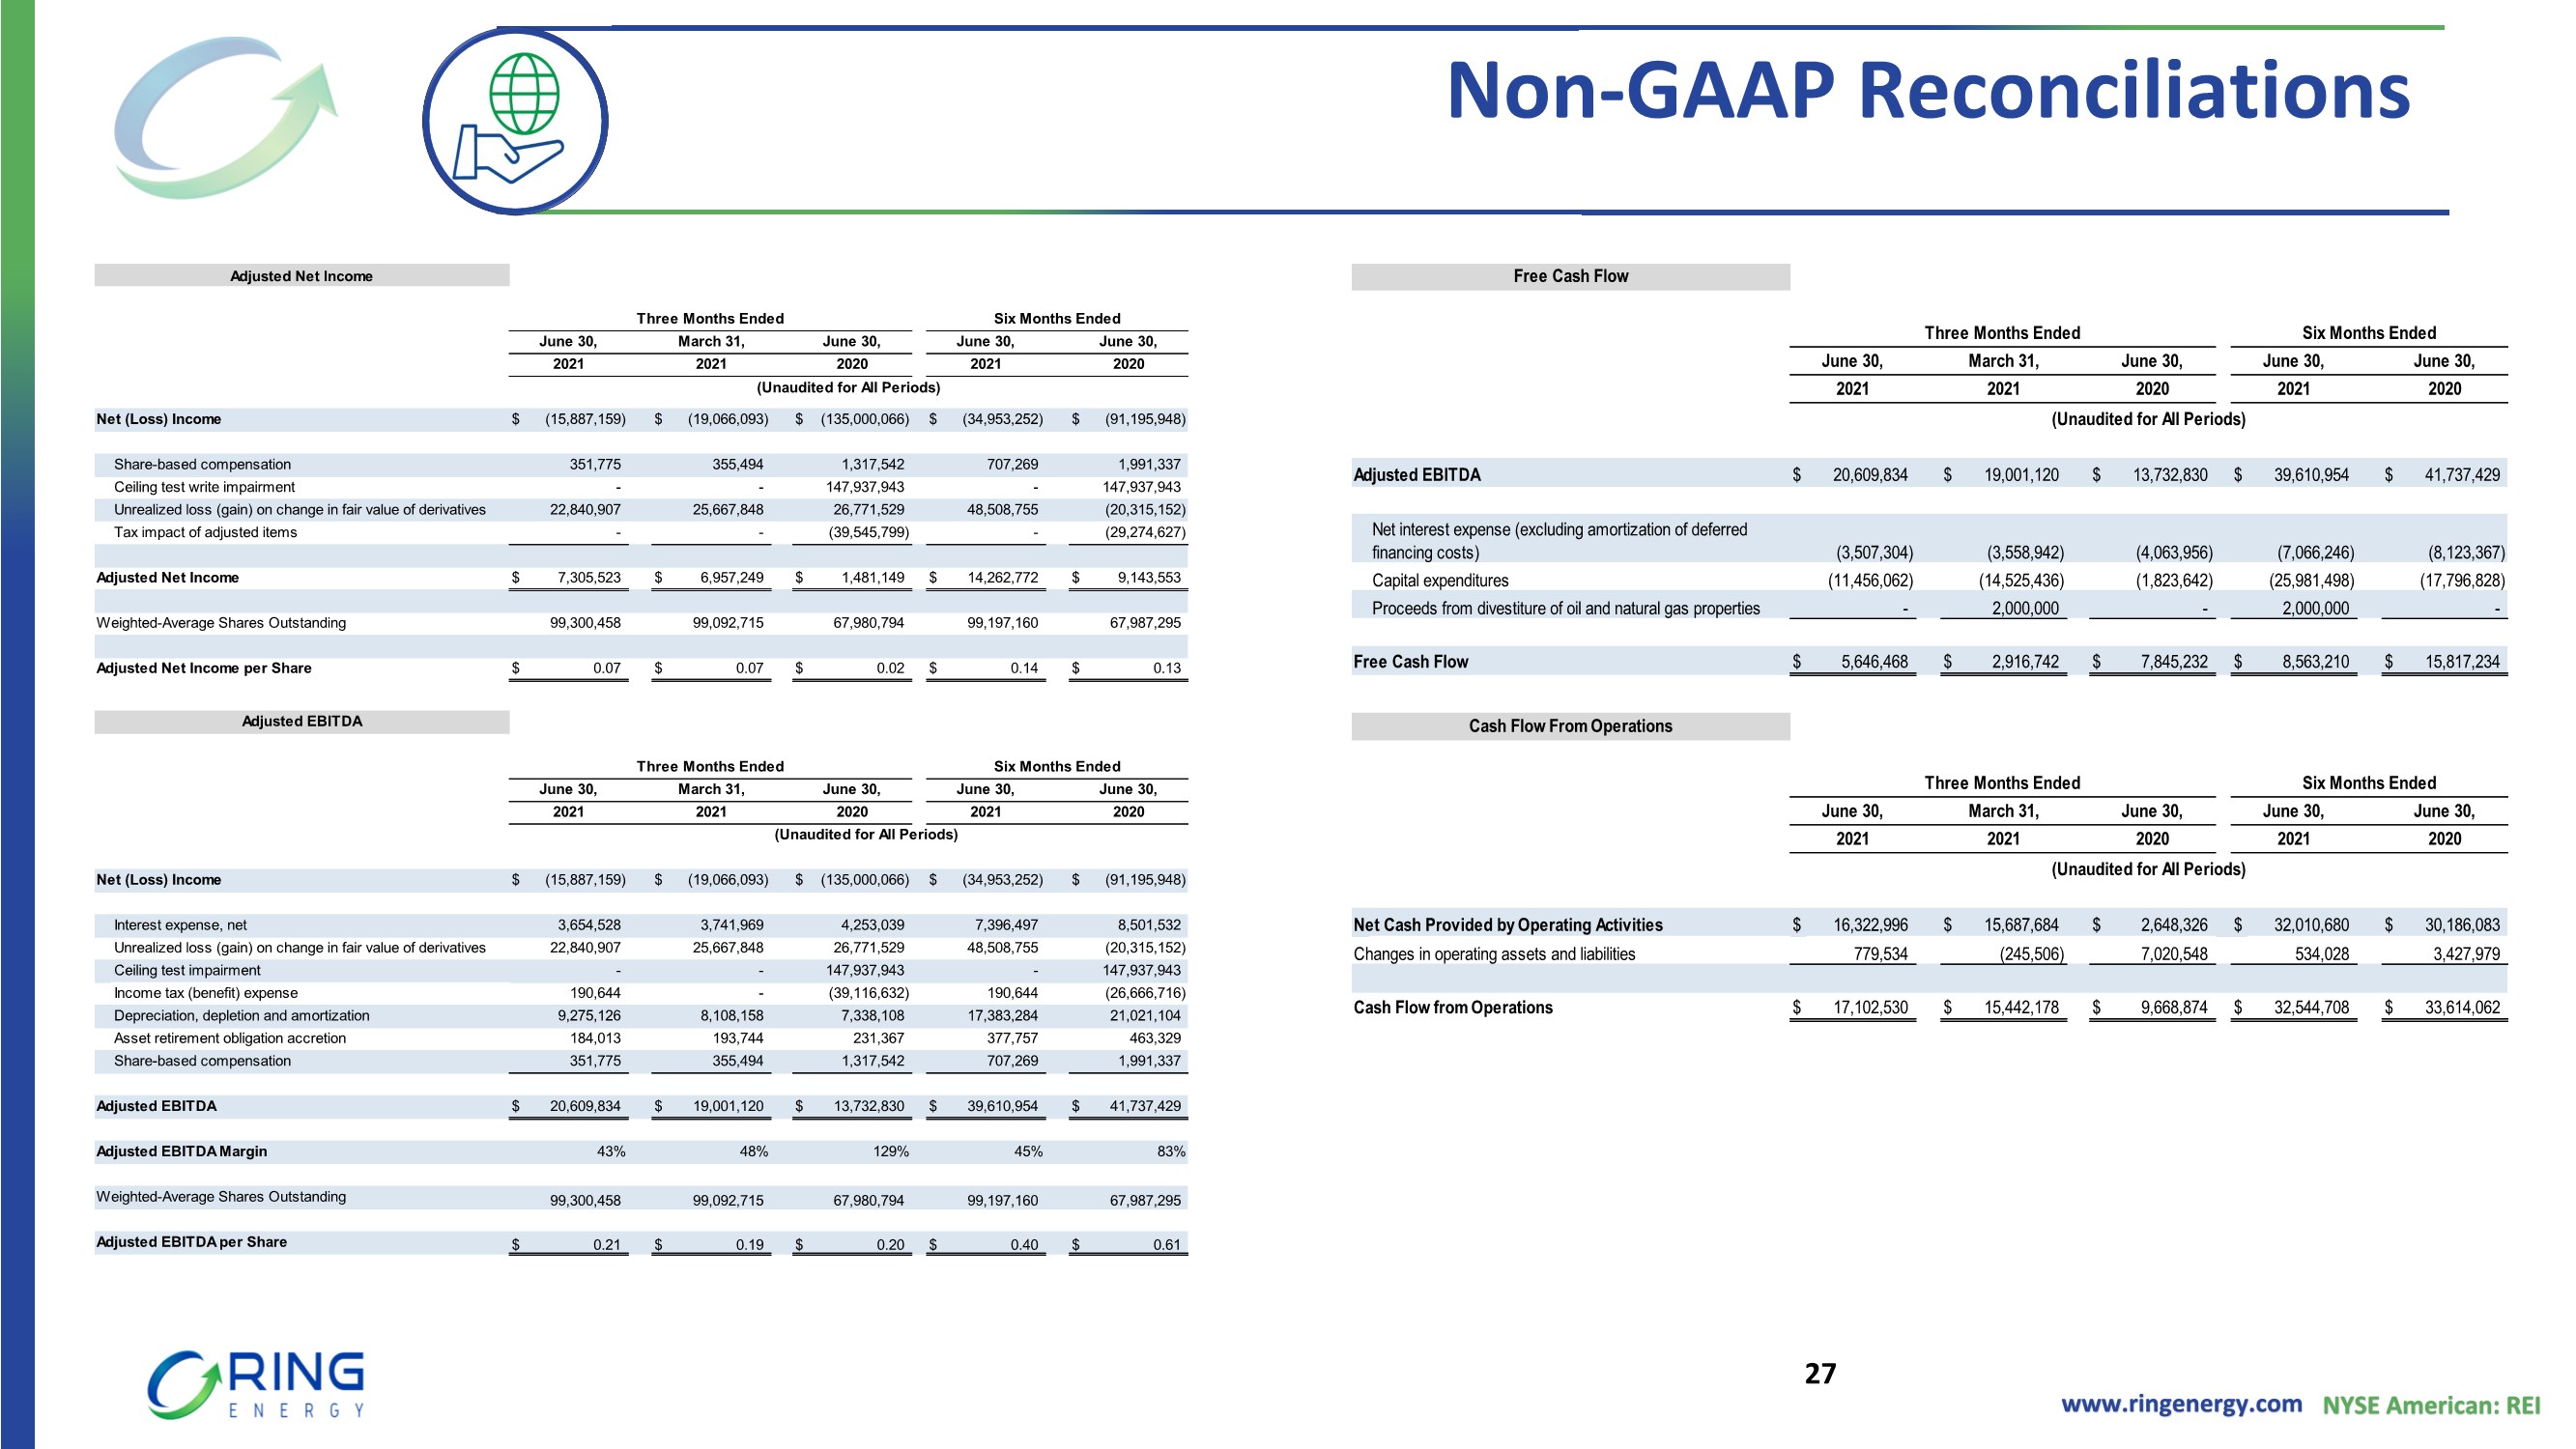
| ANALYST COVERAGE Alliance Global Partners (A.G.P.) Jeff Campbell (203) 577-5427 [email protected] Tuohy Brothers Investment Noel Parks (215) 913-7320 [email protected] ROTH Capital Partners John M. White (949) 720-7115 [email protected] Truist Financial Neal Dingmann (713) 247-9000 [email protected] COMPANY CONTACT Al Petrie (281) 975-2146 [email protected] Chris Delange (281) 975-2146 [email protected] |