
REPX 8-K
Riley Exploration Permian, Inc. (REPX)
8-K
2021-12-13
For: 2021-12-13
View Original
Added on
April 09, 2026
UNITED STATES
SECURITIES AND EXCHANGE COMMISSION
WASHINGTON, D.C. 20549
FORM 8-K
CURRENT REPORT
Pursuant to Section 13 or 15(d)
of the Securities Exchange Act of 1934
Date of Report (Date of earliest event reported): December 13, 2021
(Exact name of registrant as specified in its charter)
| (State or other jurisdiction of incorporation) | (Commission File Number) | (IRS Employer Identification No.) | ||||||
Address of Principal Executive Offices, Including Zip Code)
(Registrant’s Telephone Number, Including Area Code)
Check the appropriate box below if the Form 8-K filing is intended to simultaneously satisfy the filing obligation of the registrant under any of the following provisions (see General Instruction A.2. below):
| Written communications pursuant to Rule 425 under the Securities Act (17 CFR 230.425) | |||||
| Soliciting material pursuant to Rule 14a-12 under the Exchange Act (17 CFR 240.14a-12) | |||||
| Pre-commencement communications pursuant to Rule 14d-2(b) under the Exchange Act (17 CFR 240.14d-2(b)) | |||||
| Pre-commencement communications pursuant to Rule 13e-4(c) under the Exchange Act (17 CFR 240.13e-4(c)) | |||||
Securities registered pursuant to Section 12(b) of the Act:
| Title of Each Class | Trading Symbol(s) | Name of each exchange on which registered | |||||||||||||||
Indicate by check mark whether the registrant is an emerging growth company as defined in Rule 405 of the Securities Act of 1933 (§230.405 of this chapter) or Rule 12b-2 of the Securities Exchange Act of 1934 (§240.12b-2 of this chapter).
Emerging growth company o
If an emerging growth company, indicate by check mark if the registrant has elected not to use the extended transition period for complying with any new or revised financial accounting standards provided pursuant to Section 13(a) of the Exchange Act. o
Item 2.02 Results of Operations and Financial Condition.
On December 13, 2021, Riley Exploration Permian, Inc. (the “Company”) issued a press release announcing the Company’s financial condition and results of operations for the year ended September 30, 2021. A copy of the press release is furnished as Exhibit 99.1 to this Current Report on Form 8-K, and is incorporated herein by reference.
The information furnished pursuant to this Item 2.02 (including Exhibit 99.1) shall not be deemed to be “filed” for the purposes of Section 18 of the Securities Exchange Act of 1934, as amended (the “Exchange Act”), or otherwise be subject to the liabilities of that section, nor shall it be deemed to be incorporated by reference into any filing under the Securities Act of 1933, as amended (the “Securities Act”), or the Exchange Act.
Item 7.01. Regulation FD Disclosure.
On December 13, 2021, the Company provided information in an earnings presentation on its website, www.rileypermian.com, regarding its financial and operational results for the year ended September 30, 2021 (the “Earnings Presentation”). The Earnings Presentation, which is attached hereto as Exhibit 99.2, is being furnished and shall not be deemed to be “filed” for purposes of Section 18 of the Exchange Act, or otherwise be subject to the liabilities of that section, nor shall it be deemed to be incorporated by reference into any filing under the Securities Act or the Exchange Act.
Item 9.01 Financial Statements and Exhibits
(d) Exhibits
| Exhibit No. | Description | ||||
Press Release dated December 13, 2021. | |||||
| Earnings Presentation dated December 13, 2021. | |||||
| 104 | Cover Page Interactive Data File (embedded within the Inline XBRL document). | ||||
SIGNATURES
Pursuant to the requirements of the Securities Exchange Act of 1934, the registrant has duly caused this report to be signed on its behalf by the undersigned hereunto duly authorized.
| RILEY EXPLORATION PERMIAN, INC. | ||||||||
| Date: December 13, 2021 | By: | /s/ Philip Riley | ||||||
| Philip Riley | ||||||||
| Chief Financial Officer | ||||||||
Riley Permian Reports Fiscal Fourth Quarter and Year End 2021 Financial and Operating Results
OKLAHOMA CITY, December 13, 2021 -- Riley Exploration Permian, Inc. (NYSE American: REPX) ("Riley Permian" or the "Company"), today reported financial and operational results for the fiscal fourth quarter and year ended September 30, 2021.
HIGHLIGHTS FOR THE FISCAL FULL YEAR ENDING SEPTEMBER 30, 2021
•Increased total production by 22% to 3.15 MMBoe for fiscal year 2021, as compared to fiscal year 2020
•Reported net loss of $65.7 million with income from operations of $59.9 million for the same period
•Generated $89.9 million of Adjusted EBITDAX(1), $86.1 million of operating cash flow from continuing operations and $26.0 million of Free Cash Flow(1)
•Invested total cash capital expenditures before acquisitions of $60.0 million, which corresponds to 70% of operating cash flow from continuing operations
•Paid $18.3 million in dividends on common units/shares, which corresponds to 21% of operating cash flow from continuing operations or 70% of Free Cash Flow(1)
•Increased total proved developed reserves by 38% year-over-year to 41.5 MMBoe and increased total proved reserves by 27% year-over-year to 72.2 MMBoe
HIGHLIGHTS FOR THE FISCAL FOURTH QUARTER ENDING SEPTEMBER 30, 2021
•Increased production by 35% to 9.6 MBoe per day for the three months ended September 30, 2021, as compared to the same period in 2020, or by 5% quarter-over-quarter compared to fiscal third quarter 2021
•Reported net income of $15.7 million with income from operations of $26.9 million for the same period
•Generated $24.5 million of Adjusted EBITDAX(1), $27.2 million of operating cash flow from continuing operations and $7.2 million of Free Cash Flow(1)
•Realized a Cash Margin(1) of $39.08 per Boe before derivative settlements or $26.41 per Boe after derivative settlements
•Declared dividends of $0.28 per share with a record date of July 23, 2021 for a total of $5.5 million
“Riley Permian completed another strong fiscal year,” stated Bobby Riley, Chief Executive Officer and Chairman of the Board of Directors. Mr. Riley continued, “We completed our merger with Tengasco in February, had a successful capital raise in July, began and progressed on our EOR project this fall, and met our operational guidance metrics for the fiscal fourth quarter and the fiscal year. We are proud of the organic growth achieved over the past year and believe our reinvestment for growth is warranted to improve our scale, cost structure and cash flow. At the same time, we achieved this growth while allocating significant cash flow from operations back to shareholders in the form of dividends. Finally, we have continued to progress our efforts in developing CCUS projects, including for permanent storage projects on our property, and we’re optimistic in initiating our first project during 2022. We are engaging in constructive discussions and diligence efforts with counterparties from CO2 source hosts, capture equipment providers and regulatory advisors. We are seeking to construct commercial arrangements that provide attractive economic returns in the current regulatory environment, with potential for improvement should regulations change at the federal or state levels.”
___________________
(1)Non-GAAP financial measure, which is defined and reconciled below.
1
| Selected Operating and Financial Data | ||||||||||||||||||||||||||
| Three Months Ended September 30, | Year Ended September 30, | |||||||||||||||||||||||||
| 2021 | 2020 | 2021 | 2020 | |||||||||||||||||||||||
| Select Financial Data (in thousands): | ||||||||||||||||||||||||||
| Oil and natural gas sales, net | $ | 48,014 | $ | 15,309 | $ | 148,636 | $ | 73,133 | ||||||||||||||||||
| Net income (loss) | $ | 15,654 | $ | (5,084) | $ | (65,666) | $ | 35,144 | ||||||||||||||||||
Adjusted EBITDAX(1) | $ | 24,505 | $ | 14,257 | $ | 89,938 | $ | 68,387 | ||||||||||||||||||
| Production Data, net: | ||||||||||||||||||||||||||
| Oil (MBbls) | 639 | 497 | 2,340 | 2,060 | ||||||||||||||||||||||
| Natural gas (MMcf) | 807 | 466 | 2,602 | 1,628 | ||||||||||||||||||||||
| Natural gas liquids (MBbls) | 109 | 79 | 380 | 260 | ||||||||||||||||||||||
| Total (MBoe) | 882 | 653 | 3,154 | 2,592 | ||||||||||||||||||||||
| Daily combined volumes (Boe/d) | 9,581 | 7,100 | 8,640 | 7,081 | ||||||||||||||||||||||
| Daily oil volumes (Bbls/d) | 6,940 | 5,400 | 6,411 | 5,630 | ||||||||||||||||||||||
| Average Prices: | ||||||||||||||||||||||||||
| Oil ($ per Bbl) | $ | 68.95 | $ | 30.89 | $ | 58.29 | $ | 36.35 | ||||||||||||||||||
Natural gas ($ per Mcf)(2) | 2.36 | (0.55) | 2.88 | (0.78) | ||||||||||||||||||||||
Natural gas liquids ($ per Bbl)(2) | 19.16 | 2.80 | 12.41 | (1.90) | ||||||||||||||||||||||
| Total average price ($ per Boe) | $ | 54.46 | $ | 23.43 | $ | 47.12 | $ | 28.22 | ||||||||||||||||||
Average Prices, including the effects of derivative settlements(3): | ||||||||||||||||||||||||||
| Oil ($ per Bbl) | $ | 52.30 | $ | 44.48 | $ | 51.47 | $ | 49.41 | ||||||||||||||||||
Natural gas ($ per Mcf)(2)(4) | 1.69 | (0.55) | 2.75 | (0.78) | ||||||||||||||||||||||
Natural gas liquids ($ per Bbl)(2)(4) | 19.16 | 2.80 | 12.41 | (1.90) | ||||||||||||||||||||||
| Total average price ($ per Boe) | $ | 41.79 | $ | 33.77 | $ | 41.95 | $ | 38.61 | ||||||||||||||||||
Cash Costs ($ per Boe)(1) | $ | 15.38 | $ | 13.80 | $ | 14.96 | $ | 14.41 | ||||||||||||||||||
Cash Margin ($ per Boe)(1) | $ | 39.08 | $ | 9.63 | $ | 32.16 | $ | 13.81 | ||||||||||||||||||
Cash Margin, including derivative settlements ($ per Boe)(1) | $ | 26.41 | $ | 19.96 | $ | 26.99 | $ | 24.19 | ||||||||||||||||||
_____________________
(1)Non-GAAP financial measure, which is defined and reconciled below.
(2)The Company's natural gas and NGL sales are presented net of gathering, processing and transportation fees which at times exceed the price received and result in negative average prices.
(3)The Company's calculation of the effects of derivative settlements includes gains (losses) on the settlement of its commodity derivative contracts. These gains (losses) are included under other income and expense on the Company’s consolidated statement of operations.
(4)During the years ended September 30, 2021 and 2020, the Company did not have any NGL derivative contracts in place. During the year ended September 30, 2020, the Company did not have any natural gas derivative contracts in place.
2
OPERATIONS UPDATE
Riley Permian increased production by 35% to 9.6 MBoe per day for the three months ended September 30, 2021, as compared to the same period in 2020, or by 5% quarter-over-quarter compared to fiscal third quarter 2021. The Company brought online 6 gross (5.7 net) horizontal wells during the fiscal fourth quarter of 2021. The Company increased total production by 22% to 8.6 MBoe per day for fiscal year 2021, as compared to fiscal year 2020, in line with its budgeted guidance previously disclosed.
During the fiscal year 2021, Riley Permian increased total proved developed reserves by 37% year-over-year to 41.5 MMBoe and increased total proved reserves by 27% year-over-year to 72.2 MMBoe.
Since October 1, 2021, the Company has continued to progress on its EOR pilot program. The Company has drilled six of six currently planned vertical injection wells and has commenced installation of water and CO2 injection lines. Also, the Company executed two agreements in October 2021, including an agreement with the Cortez Pipeline Company relating to the connection and establishment of a delivery point for CO2 for Riley Permian, as well as an agreement with Kinder Morgan CO2 Company LLC, relating to the purchase and sale of CO2.
FINANCIALS UPDATE
The Company reported net income (loss) of $15.7 million and $(65.7) million and operating income of $26.9 million and $59.9 million for the three months and year ended September 30, 2021, respectively. The Company generated Adjusted EBITDAX(1) of $24.5 million and $89.9 million for the three months and year ended September 30, 2021, respectively. Additionally, the Company had operating cash flow from continuing operations of $27.2 million and $86.1 million and Free Cash Flow(1) of $7.2 million and $26.0 million for the three months and year ended September 30, 2021, respectively.
The Company reported net income (loss) of $15.7 million and $(65.7) million and operating income of $26.9 million and $59.9 million for the three months and year ended September 30, 2021, respectively. The Company generated Adjusted EBITDAX(1) of $24.5 million and $89.9 million for the three months and year ended September 30, 2021, respectively. Additionally, the Company had operating cash flow from continuing operations of $27.2 million and $86.1 million and Free Cash Flow(1) of $7.2 million and $26.0 million for the three months and year ended September 30, 2021, respectively.
Fiscal fourth quarter 2021 average realized prices, before derivative settlements were $68.95 per barrel of oil, $2.36 per Mcf of natural gas and $19.16 per barrel of natural gas liquids, resulting in a total equivalent price, before derivative settlements, of $54.46 per Boe. Adjusted for derivative settlements, total equivalent price was $41.79 per Boe, corresponding to realized derivative losses of $12.67 per Boe or $11.2 million.
Riley Permian's total Cash Costs(1) for the fiscal fourth quarter of 2021 were $15.38 per Boe, representing an increase of $0.31 per Boe or 2% compared to the fiscal third quarter of 2021. Fourth quarter Cash Costs(1) included lease operating expense (“LOE”) of $6.45 per Boe, production and ad valorem taxes of $2.92 per Boe, cash G&A expenses(1) of $4.92 per Boe and interest expense of $1.09 per Boe. LOE decreased by 20% on a per unit basis to $6.45 per Boe for the three months ended September 30, 2021, as compared to the same period in 2020, or by 7% on a per unit basis quarter-over-quarter compared to fiscal third quarter 2021. Cash G&A expenses(1) increased by 16% on a per unit basis to $4.92 per Boe for the fiscal fourth quarter 2021 compared to fiscal third quarter 2021, while interest expense decreased by 23% on a per unit basis to $1.09 per Boe for the fiscal fourth quarter 2021 compared to fiscal third quarter 2021.The Company realized a fiscal fourth quarter Cash Margin(1) of $39.08 per Boe before derivative settlements or $26.41 per Boe after derivative settlements.
The Company had $19.5 million in cash drilling and completions capital expenditures during the fiscal fourth quarter, or $57.1 million for fiscal year 2021. Including additions to leasehold and other property and equipment, the Company had $60.0 million in total cash capital expenditures before acquisitions for fiscal year 2021.
During the fiscal fourth quarter 2021, the Company declared common dividends of $0.28 per share or $5.5 million in total. In October 2021, the Company declared common dividends of $0.31 per share or $6.1 million in total.
As of December 8, 2021, we had $65 million drawn and $110 million of availability on our credit facility.
____________________
(1)Non-GAAP financial measure, which is defined and reconciled below.
3
FISCAL FIRST QUARTER AND FULL YEAR 2022 OUTLOOK AND GUIDANCE
Based on current market conditions, the Company forecasts fiscal first quarter 2022 accrued capital expenditures before acquisitions to total approximately $26 million to $32 million.
Riley Permian forecasts fiscal first quarter 2022 oil production to average 7.0 MBbls per day to 7.3 MBbls per day, with total equivalent production to average 9.5 MBoe per day to 10.0 MBoe per day.
The Company forecasts first fiscal quarter of 2022 LOE of approximately $7.25 to $7.75 per Boe and cash G&A expenses(1) of approximately $4.00 to $4.75 per Boe (excluding share-based and unit-based compensation expense, shown after the effect of gross profit from contract services derived from management services agreements).
Based on current market conditions, the Company forecasts full-year fiscal 2022 accrued capital expenditures before acquisitions to total approximately $85 million to $95 million, which includes amounts for drilling and completions (operated and anticipated non-operated), capital workovers, infrastructure, minor additions to land and existing working interests, as well as investments in our EOR program. We believe this level of capital investment may correspond to full-year production growth of approximately 11% to 15% over full-year fiscal 2021 production levels.
CONFERENCE CALL
Riley Permian management will host a conference call for investors and analysts on December 14, 2021 at 11:00 a.m. CT to discuss the Company's results. Interested parties are invited to participate by calling:
Riley Permian management will host a conference call for investors and analysts on December 14, 2021 at 11:00 a.m. CT to discuss the Company's results. Interested parties are invited to participate by calling:
•U.S./Canada Toll Free, (888) 330-2214
•International, +1 (646) 960-0161
•Conference ID number 5405646
An updated company presentation, which will include certain items to be discussed on the call, will be posted prior to the call on the Company's website (www.rileypermian.com). A replay of the call will be available until December 28, 2021 by calling:
•(800) 770-2030 or (647) 362-9199
•Conference ID number 5405646
About Riley Exploration Permian, Inc.
Riley Permian is a growth-oriented, independent oil and natural gas company focused on the acquisition, exploration, development and production of oil, natural gas and natural gas liquids. For more information please visit www.rileypermian.com.
Riley Permian is a growth-oriented, independent oil and natural gas company focused on the acquisition, exploration, development and production of oil, natural gas and natural gas liquids. For more information please visit www.rileypermian.com.
____________________
(1)Non-GAAP financial measure, which is defined above.
4
CAUTIONARY STATEMENT FOR THE PURPOSES OF THE "SAFE HARBOR" PROVISIONS OF THE PRIVATE SECURITIES LITIGATION REFORM ACT OF 1995
This press release contains forward-looking statements within the meaning of Section 27A of the Securities Act of 1933, as amended, and Section 21E of the Securities Exchange Act of 1934, as amended. The statements contained in this release that are not historical facts are forward-looking statements that represent management’s beliefs and assumptions based on currently available information. Forward-looking statements include information concerning our possible or assumed future results of operations, business strategies, need for financing, competitive position and potential growth opportunities. Our forward-looking statements do not consider the effects of future legislation or regulations. Forward-looking statements include all statements that are not historical facts and can be identified by the use of forward-looking terminology such as the words “believes,” “intends,” “may,” “should,” “anticipates,” “expects,” “could,” “plans,” “estimates,” “projects,” “targets” or comparable terminology or by discussions of strategy or trends. Although we believe that the expectations reflected in such forward-looking statements are reasonable, we cannot give any assurances that these expectations will prove to be correct. Such statements by their nature involve risks and uncertainties that could significantly affect expected results, and actual future results could differ materially from those described in such forward-looking statements.
Among the factors that could cause actual future results to differ materially are the risks and uncertainties the Company is exposed to. While it is not possible to identify all factors, we continue to face many risks and uncertainties including, but not limited to: fluctuations in the price we receive for our oil, natural gas, and NGL production, including local market price differentials; the impact of the COVID-19 pandemic, including reduced demand for oil and natural gas, economic slowdown, governmental and societal actions taken in response to the COVID-19 pandemic, and stay-at-home orders or illness that may cause interruptions to our operations; cost and availability of gathering, pipeline, refining, transportation, water, CO2, and other midstream and downstream activities and our ability to sell oil, natural gas, and NGLs, which may be negatively impacted by the COVID-19 pandemic; severe weather and other risks and lead to a lack of any available markets; our ability to successfully complete mergers, acquisitions and divestitures; failure of our enhanced oil recovery project to perform as expected or produce the anticipated benefits; risks relating to our operations, including development drilling and testing results and performance of acquired properties and newly drilled wells; any reduction in our borrowing base from time to time and our ability to repay any excess borrowings as a result of such reduction; the impact of our derivative instruments and hedging activities; continuing compliance with the financial covenants contained in our credit agreement; the loss of certain federal income tax deductions or other changes to the Internal Revenue Code; risks associated with executing our business strategy, including any changes in our strategy; inability to prove up undeveloped acreage and maintaining production on leases; risks associated with concentration of operations in one major geographic area; deviations from our forecasts and budgets, including our capital expenditure budget; the ability of the members of the Organization of Petroleum Exporting Countries (“OPEC”) and other oil exporting nations to agree to, adhere to and maintain oil price and production controls; legislative or regulatory changes, including initiatives related to hydraulic fracturing, emissions, and disposal of produced water, which may be negatively impacted by the recent change in Presidential administration or legislatures; the ability to receive drilling and other permits or approvals and rights-of-way in a timely manner (or at all), which may be negatively impacted by the impact of COVID-19 restrictions on regulatory employees who process and approve permits, other approvals and rights-of-way and which may be restricted by new Presidential and Secretarial orders and regulation and legislation; risks related to litigation; and cybersecurity threats, technology system failures and data security issues. Additional factors that could cause results to differ materially from those described above can be found in Riley Permian’s Annual Report on Form 10-K for the year ended September 30, 2021 filed with the SEC and available from the Company’s website at www.rileypermian.com under the “Investor” tab, and in other documents the Company files with the SEC.
The forward-looking statements in this press release are made as of the date hereof and are based on information available at that time. The Company does not undertake, and expressly disclaims, any duty to update or revise our forward-looking statements based on new information, future events or otherwise.
Source: Riley Exploration Permian, Inc.
5
| RILEY EXPLORATION PERMIAN, INC. | ||||||||||||||
| CONSOLIDATED BALANCE SHEETS | ||||||||||||||
| September 30, 2021 | September 30, 2020 | |||||||||||||
| (In thousands, except share amounts) | ||||||||||||||
| Assets | ||||||||||||||
| Current Assets: | ||||||||||||||
| Cash and cash equivalents | $ | 17,067 | $ | 1,660 | ||||||||||
| Accounts receivable | 17,473 | 10,128 | ||||||||||||
| Accounts receivable - related parties | 456 | 55 | ||||||||||||
| Prepaid expenses and other current assets | 1,730 | 1,752 | ||||||||||||
| Current derivative assets | — | 18,819 | ||||||||||||
| Total current assets | 36,726 | 32,414 | ||||||||||||
| Oil and natural gas properties, net (successful efforts) | 345,797 | 310,726 | ||||||||||||
| Other property and equipment, net | 3,183 | 1,801 | ||||||||||||
| Non-current derivative assets | 106 | 3,102 | ||||||||||||
| Other non-current assets, net | 2,419 | 2,949 | ||||||||||||
| Total Assets | $ | 388,231 | $ | 350,992 | ||||||||||
| Liabilities, Series A Preferred Units, and Members'/Shareholders' Equity | ||||||||||||||
| Current Liabilities: | ||||||||||||||
| Accounts payable | $ | 12,234 | $ | 4,739 | ||||||||||
| Accrued liabilities | 19,355 | 8,688 | ||||||||||||
| Revenue payable | 9,008 | 4,432 | ||||||||||||
| Income taxes payable | 219 | — | ||||||||||||
| Advances from joint interest owners | 214 | 254 | ||||||||||||
| Current derivative liabilities | 42,144 | — | ||||||||||||
| Other current liabilities | 441 | 450 | ||||||||||||
| Total Current Liabilities | 83,615 | 18,563 | ||||||||||||
| Non-current derivative liabilities | 8,932 | — | ||||||||||||
| Asset retirement obligations | 2,306 | 2,268 | ||||||||||||
| Revolving credit facility | 60,000 | 101,000 | ||||||||||||
| Deferred tax liabilities | 11,628 | 1,834 | ||||||||||||
| Other non-current liabilities | 60 | 418 | ||||||||||||
| Total Liabilities | 166,541 | 124,083 | ||||||||||||
| Commitments and Contingencies | ||||||||||||||
| Series A Preferred Units | — | 60,292 | ||||||||||||
| Members' Equity | — | 166,617 | ||||||||||||
| Shareholders' Equity: | ||||||||||||||
Preferred stock, $0.0001 par value, 25,000,000 shares authorized; 0 shares issued and outstanding | — | — | ||||||||||||
Common stock, $0.001 par value, 240,000,000 shares authorized; 19,672,050 and 0 shares issued and outstanding at September 30, 2021 and 2020, respectively | 20 | — | ||||||||||||
| Additional paid-in capital | 270,837 | — | ||||||||||||
| Accumulated deficit | (49,167) | — | ||||||||||||
| Total Shareholders' Equity | 221,690 | — | ||||||||||||
| Total Liabilities, Series A Preferred Units, and Members'/Shareholders' Equity | $ | 388,231 | $ | 350,992 | ||||||||||
6
| RILEY EXPLORATION PERMIAN, INC. | ||||||||||||||||||||||||||
| CONSOLIDATED STATEMENTS OF OPERATIONS | ||||||||||||||||||||||||||
| Three Months Ended September 30, | Year Ended September 30, | |||||||||||||||||||||||||
| 2021 | 2020 | 2021 | 2020 | |||||||||||||||||||||||
| (In thousands, except per share/unit amounts) | ||||||||||||||||||||||||||
| Revenues: | ||||||||||||||||||||||||||
| Oil and natural gas sales, net | $ | 48,014 | $ | 15,309 | $ | 148,636 | $ | 73,133 | ||||||||||||||||||
| Contract services - related parties | 600 | 650 | 2,400 | 3,800 | ||||||||||||||||||||||
| Total Revenues | 48,614 | 15,959 | 151,036 | 76,933 | ||||||||||||||||||||||
| Costs and Expenses: | ||||||||||||||||||||||||||
| Lease operating expenses | 5,686 | 5,254 | 21,975 | 20,243 | ||||||||||||||||||||||
| Production and ad valorem taxes | 2,575 | 944 | 8,636 | 4,280 | ||||||||||||||||||||||
| Exploration costs | 884 | 692 | 9,566 | 9,923 | ||||||||||||||||||||||
| Depletion, depreciation, amortization and accretion | 6,692 | 5,459 | 26,015 | 21,479 | ||||||||||||||||||||||
| General and administrative: | ||||||||||||||||||||||||||
| Administrative costs | 4,790 | 2,157 | 13,966 | 10,826 | ||||||||||||||||||||||
| Unit-based compensation expense | — | 313 | 689 | 963 | ||||||||||||||||||||||
| Share-based compensation expense | 751 | — | 6,104 | — | ||||||||||||||||||||||
| Cost of contract services - related parties | 147 | 100 | 477 | 503 | ||||||||||||||||||||||
| Transaction costs | 198 | 1,389 | 3,732 | 1,431 | ||||||||||||||||||||||
| Total Costs and Expenses | 21,723 | 16,308 | 91,160 | 69,648 | ||||||||||||||||||||||
| Income (Loss) From Operations | 26,891 | (349) | 59,876 | 7,285 | ||||||||||||||||||||||
| Other Income (Expense): | ||||||||||||||||||||||||||
| Interest expense | (963) | (1,213) | (4,534) | (5,299) | ||||||||||||||||||||||
| Gain (loss) on derivatives | (14,987) | (3,123) | (89,195) | 33,876 | ||||||||||||||||||||||
| Total Other Income (Expense) | (15,950) | (4,336) | (93,729) | 28,577 | ||||||||||||||||||||||
| Net Income (Loss) from Continuing Operations Before Income Taxes | 10,941 | (4,685) | (33,853) | 35,862 | ||||||||||||||||||||||
| Income tax benefit (expense) | 3,937 | (399) | (13,016) | (718) | ||||||||||||||||||||||
| Net Income (Loss) From Continuing Operations | 14,878 | (5,084) | (46,869) | 35,144 | ||||||||||||||||||||||
7
| RILEY EXPLORATION PERMIAN, INC. | ||||||||||||||||||||||||||
| CONSOLIDATED STATEMENTS OF OPERATIONS - (Continued) | ||||||||||||||||||||||||||
| Three Months Ended September 30, | Year Ended September 30, | |||||||||||||||||||||||||
| 2021 | 2020 | 2021 | 2020 | |||||||||||||||||||||||
| (In thousands, except per share/unit amounts) | ||||||||||||||||||||||||||
| Discontinued Operations: | ||||||||||||||||||||||||||
| Income (Loss) from discontinued operations | 775 | — | (18,738) | — | ||||||||||||||||||||||
| Income tax benefit (expense) on discontinued operations | 1 | — | (59) | — | ||||||||||||||||||||||
| Income (Loss) on discontinued operations | 776 | — | (18,797) | — | ||||||||||||||||||||||
| Net Income (Loss) | 15,654 | (5,084) | (65,666) | 35,144 | ||||||||||||||||||||||
| Dividends on preferred units | — | (904) | (1,491) | (3,535) | ||||||||||||||||||||||
| Net Income (Loss) Attributable to Common Shareholders/Unitholders | $ | 15,654 | $ | (5,988) | $ | (67,157) | $ | 31,609 | ||||||||||||||||||
| Net Income (Loss) per Share/Unit from Continuing Operations: | ||||||||||||||||||||||||||
| Basic | $ | 0.77 | $ | (0.41) | $ | (3.02) | $ | 2.54 | ||||||||||||||||||
| Diluted | $ | 0.76 | $ | (0.41) | $ | (3.02) | $ | 2.13 | ||||||||||||||||||
| Net Income (Loss) per Share/Unit from Discontinued Operations: | ||||||||||||||||||||||||||
| Basic | $ | 0.04 | $ | — | $ | (1.17) | $ | — | ||||||||||||||||||
| Diluted | $ | 0.04 | $ | — | $ | (1.17) | $ | — | ||||||||||||||||||
| Net Income (Loss) per Share/Unit: | ||||||||||||||||||||||||||
| Basic | $ | 0.81 | $ | (0.48) | $ | (4.19) | $ | 2.54 | ||||||||||||||||||
| Diluted | $ | 0.80 | $ | (0.48) | $ | (4.19) | $ | 2.13 | ||||||||||||||||||
Weighted Average Common Shares/Units Outstanding(1): | ||||||||||||||||||||||||||
| Basic | 19,434 | 12,468 | 16,021 | 12,457 | ||||||||||||||||||||||
| Diluted | 19,540 | 12,468 | 16,021 | 16,509 | ||||||||||||||||||||||
(1)Amounts for the three months and year ended September 30, 2021 were computed using a retroactive application of the Exchange Ratio and the one-for-twelve reverse stock split that occurred in connection with the Merger.
8
| RILEY EXPLORATION PERMIAN, INC. | ||||||||||||||||||||||||||
| CONSOLIDATED STATEMENTS OF CASH FLOWS | ||||||||||||||||||||||||||
| Three Months Ended September 30, | Year Ended September 30, | |||||||||||||||||||||||||
| 2021 | 2020 | 2021 | 2020 | |||||||||||||||||||||||
| (In thousands) | ||||||||||||||||||||||||||
| Cash Flows from Operating Activities: | ||||||||||||||||||||||||||
| Net income (loss) | $ | 15,654 | $ | (5,084) | $ | (65,666) | $ | 35,144 | ||||||||||||||||||
| Adjustments to reconcile net income (loss) to net cash provided by operating activities: | ||||||||||||||||||||||||||
| Loss (income) from discontinued operations | (776) | — | 18,797 | — | ||||||||||||||||||||||
| Oil and gas lease expirations | 732 | 614 | 9,347 | 7,902 | ||||||||||||||||||||||
| Depletion, depreciation, amortization and accretion | 6,692 | 5,321 | 26,015 | 21,341 | ||||||||||||||||||||||
| (Gain) loss on plugging liabilities | — | 138 | — | 138 | ||||||||||||||||||||||
| (Gain) loss on derivatives | 14,987 | 3,123 | 89,195 | (33,876) | ||||||||||||||||||||||
| Settlements on derivative contracts | (11,171) | 6,753 | (16,304) | 26,914 | ||||||||||||||||||||||
| Amortization of deferred financing costs | 170 | 164 | 653 | 648 | ||||||||||||||||||||||
| Unit-based compensation expense | — | 313 | 689 | 963 | ||||||||||||||||||||||
| Share-based compensation expense | 751 | — | 6,104 | — | ||||||||||||||||||||||
| Deferred income tax expense (benefit) | (4,223) | 346 | 12,962 | 665 | ||||||||||||||||||||||
| Changes in operating assets and liabilities: | ||||||||||||||||||||||||||
| Accounts receivable | (1,800) | (4,128) | (7,345) | 1,515 | ||||||||||||||||||||||
| Accounts receivable – related parties | 1,539 | 290 | (401) | 449 | ||||||||||||||||||||||
| Prepaid expenses and other current assets | 735 | 1,263 | 201 | 839 | ||||||||||||||||||||||
| Other non-current assets | — | 2 | — | 84 | ||||||||||||||||||||||
| Accounts payable and accrued liabilities | 2,229 | 2,800 | 7,445 | 16 | ||||||||||||||||||||||
| Income taxes payable | 286 | — | (54) | — | ||||||||||||||||||||||
| Revenue payable | 1,570 | 1,115 | 4,576 | (84) | ||||||||||||||||||||||
| Advances from joint interest owners | (52) | 11 | (40) | (108) | ||||||||||||||||||||||
| Other liabilities | (77) | — | (101) | — | ||||||||||||||||||||||
| Net Cash Provided By Operating Activities - Continuing Operations | 27,246 | 13,041 | 86,073 | 62,550 | ||||||||||||||||||||||
| Cash Flows from Investing Activities: | ||||||||||||||||||||||||||
| Additions to oil and natural gas properties | (19,746) | (5,955) | (58,329) | (47,183) | ||||||||||||||||||||||
| Acquisitions of oil and natural gas properties | — | 696 | (445) | (4,110) | ||||||||||||||||||||||
| Additions to other property and equipment | (541) | (60) | (1,714) | (228) | ||||||||||||||||||||||
| Tengasco acquired cash | — | — | 860 | — | ||||||||||||||||||||||
| Net Cash Used In Investing Activities - Continuing Operations | (20,287) | (5,319) | (59,628) | (51,521) | ||||||||||||||||||||||
9
| RILEY EXPLORATION PERMIAN, INC. | ||||||||||||||||||||||||||
| CONSOLIDATED STATEMENTS OF CASH FLOWS – (Continued) | ||||||||||||||||||||||||||
| Three Months Ended September 30, | Year Ended September 30, | |||||||||||||||||||||||||
| 2021 | 2020 | 2021 | 2020 | |||||||||||||||||||||||
| (In thousands) | ||||||||||||||||||||||||||
| Cash Flows from Financing Activities: | ||||||||||||||||||||||||||
| Deferred financing costs | (4) | (1,183) | (139) | (1,476) | ||||||||||||||||||||||
| Proceeds from revolving credit facility | — | 2,500 | 5,500 | 16,500 | ||||||||||||||||||||||
| Repayment under revolving credit facility | (37,500) | (5,500) | (46,500) | (12,500) | ||||||||||||||||||||||
| Payment of common share/unit dividends | (5,452) | (2,797) | (18,286) | (15,297) | ||||||||||||||||||||||
| Proceeds from issuance of common stock | 50,000 | — | 50,000 | — | ||||||||||||||||||||||
| Public offering costs | (3,316) | — | (3,316) | — | ||||||||||||||||||||||
| Payment of preferred unit dividends | — | — | (1,491) | — | ||||||||||||||||||||||
| Common stock repurchased for tax withholding | (514) | — | (514) | — | ||||||||||||||||||||||
| Purchase of common units under long-term incentive plan | — | — | (191) | (322) | ||||||||||||||||||||||
| Net Cash Provided By (Used in) Financing Activities - Continuing Operations | 3,214 | (6,980) | (14,937) | (13,095) | ||||||||||||||||||||||
| Net Increase (Decrease) in Cash and Cash Equivalents from Continuing Operations | 10,173 | 742 | 11,508 | (2,066) | ||||||||||||||||||||||
| Cash Flows from Discontinued Operations: | ||||||||||||||||||||||||||
| Operating activities | — | — | 7 | — | ||||||||||||||||||||||
| Investing activities | — | — | 3,892 | — | ||||||||||||||||||||||
| Net Increase (Decrease) in Cash and Cash Equivalents from Discontinued Operations | — | — | 3,899 | — | ||||||||||||||||||||||
| Net Increase (Decrease) in Cash and Cash Equivalents | 10,173 | 742 | 15,407 | (2,066) | ||||||||||||||||||||||
| Cash and Cash Equivalents, Beginning of Period | 6,894 | 918 | 1,660 | 3,726 | ||||||||||||||||||||||
| Cash and Cash Equivalents, End of Period | $ | 17,067 | $ | 1,660 | $ | 17,067 | $ | 1,660 | ||||||||||||||||||
10
OIL AND NATURAL GAS RESERVES
Netherland, Sewell & Associates, Inc. prepared the estimates of the Company's proved reserves in accordance with the rules and regulations of the Securities and Exchange Commission. The table below presents our total proved reserves as of September 30, 2021.
| Total Proved Developed Reserves | Total Proved Reserves | |||||||||||||
| Oil (MBbls) | 26,170 | 46,263 | ||||||||||||
| Natural Gas (MMcf) | 46,173 | 76,019 | ||||||||||||
| Natural Gas Liquids (MBbls) | 7,650 | 13,229 | ||||||||||||
| Total Proved Reserves (MBoe) | 41,516 | 72,163 | ||||||||||||
Estimates of reserves were prepared using an average price equal to the unweighted arithmetic average of hydrocarbon prices received on a field-by-field basis on the first day of each month within the 12-month period ended September 30, 2021 in accordance with SEC guidelines. Reserve estimates do not include any value for probable or possible reserves that may exist, nor do they include any value for undeveloped acreage. The reserve estimates represent our net revenue interest in our properties, all of which are located within the continental United States.
11
DERIVATIVE CONTRACTS
The following table summarizes the open financial derivative positions as of December 8, 2021, related to oil and natural gas production. Derivative positions in the table for calendar Q4 2021 are as of September 30, 2021.
| Weighted Average Price | ||||||||||||||||||||||||||
| Calendar Quarter | Notional Volume | Fixed | Put | Call | ||||||||||||||||||||||
| ($ per unit) | ||||||||||||||||||||||||||
| Oil Swaps (Bbl) | ||||||||||||||||||||||||||
| Q4 2021 | 558,116 | $ | 51.65 | $ | — | $ | — | |||||||||||||||||||
| Q1 2022 | 345,000 | $ | 57.47 | $ | — | $ | — | |||||||||||||||||||
| Q2 2022 | 345,000 | $ | 57.47 | $ | — | $ | — | |||||||||||||||||||
| Q3 2022 | 270,000 | $ | 56.03 | $ | — | $ | — | |||||||||||||||||||
| Q4 2022 | 270,000 | $ | 56.03 | $ | — | $ | — | |||||||||||||||||||
| Q1 2023 | 225,000 | $ | 53.65 | $ | — | $ | — | |||||||||||||||||||
| Q2 2023 | 195,000 | $ | 53.89 | $ | — | $ | — | |||||||||||||||||||
| Q3 2023 | 150,000 | $ | 52.58 | $ | — | $ | — | |||||||||||||||||||
| Q4 2023 | 150,000 | $ | 52.58 | $ | — | $ | — | |||||||||||||||||||
| Natural Gas Swaps (Mcf) | ||||||||||||||||||||||||||
| Q4 2021 | 555,000 | $ | 3.03 | $ | — | $ | — | |||||||||||||||||||
| Q1 2022 | 540,000 | $ | 3.26 | $ | — | $ | — | |||||||||||||||||||
| Q2 2022 | 540,000 | $ | 3.26 | $ | — | $ | — | |||||||||||||||||||
| Q3 2022 | 540,000 | $ | 3.26 | $ | — | $ | — | |||||||||||||||||||
| Q4 2022 | 540,000 | $ | 3.26 | $ | — | $ | — | |||||||||||||||||||
| Oil Collars (Bbl) | ||||||||||||||||||||||||||
| Q1 2022 | 90,000 | $ | — | $ | 35.00 | $ | 42.63 | |||||||||||||||||||
| Q2 2022 | 90,000 | $ | — | $ | 35.00 | $ | 42.63 | |||||||||||||||||||
| Q3 2022 | 90,000 | $ | — | $ | 35.00 | $ | 42.63 | |||||||||||||||||||
| Q4 2022 | 90,000 | $ | — | $ | 35.00 | $ | 42.63 | |||||||||||||||||||
| Oil Basis (Bbl) | ||||||||||||||||||||||||||
| Q4 2021 | 435,000 | $ | 0.40 | $ | — | $ | — | |||||||||||||||||||
| Q1 2022 | 180,000 | $ | 0.40 | $ | — | $ | — | |||||||||||||||||||
| Q2 2022 | 180,000 | $ | 0.40 | $ | — | $ | — | |||||||||||||||||||
| Q3 2022 | 180,000 | $ | 0.40 | $ | — | $ | — | |||||||||||||||||||
| Q4 2022 | 180,000 | $ | 0.40 | $ | — | $ | — | |||||||||||||||||||
12
NON-GAAP MEASURES
The Company presents certain non-GAAP financial measures to supplement its financial statements prepared in accordance with accounting principles generally accepted in the United States (“GAAP”). The non-GAAP financial measures include Adjusted Net Income, Adjusted EBITDAX, Cash G&A, Cash Costs and Cash Margin and Free Cash Flow. A reconciliation of each non-GAAP measure to the most directly comparable GAAP financial measure is presented below.
We believe that these non-GAAP measures presented, in conjunction with our financial and operating results prepared in accordance with GAAP, provide a more complete understanding of the Company’s performance. We use these non-GAAP measures to compare our financial and operating performance with that of other companies in the oil and natural gas industry as well as our financial and operating performance for current and historical periods. These non-GAAP measures should not be considered in isolation or as a substitute for GAAP measures, such as net income (loss), operating income (loss), total costs and expenses, general and administrative expenses or net cash provided by operating activities or any other GAAP measure of financial position or results of operations.
As not all companies use the same calculation, our non-GAAP measures may not be comparable to similarly titled measures presented by other companies.
Adjusted Net Income: We define Adjusted Net Income as net income (loss) plus (income) loss on discontinued operations, unrealized (gain) loss on derivative contracts, transaction costs, income tax expense related to our change in tax status and the associated changes in estimated income tax. We believe that Adjusted Net Income is a widely followed measure of operating performance and is one of many metrics used by investors as well as our management team. For example, Adjusted Net Income can be used to assess our operating performance and return on capital in comparison to other independent exploration and production companies without regard to financial or capital structure and to assess the financial performance of our assets and our company without regard to capital structure or historical cost basis. The following table provides a reconciliation of Net Income (Loss) to Adjusted Net Income for the periods indicated:
| Three Months Ended September 30, | Year Ended September 30, | |||||||||||||||||||||||||||||||
| 2021 | 2020 | 2021 | 2020 | |||||||||||||||||||||||||||||
| (In thousands) | ||||||||||||||||||||||||||||||||
| Net income (loss) | $ | 15,654 | $ | (5,084) | $ | (65,666) | $ | 35,144 | ||||||||||||||||||||||||
| Loss (income) on discontinued operations | (776) | — | 18,797 | — | ||||||||||||||||||||||||||||
| Unrealized loss (gain) on derivatives | 3,816 | 9,876 | 72,891 | (6,962) | ||||||||||||||||||||||||||||
| Transaction costs and other | 458 | 1,389 | 3,992 | 1,823 | ||||||||||||||||||||||||||||
| Income tax expense from change in tax status | — | — | 13,581 | — | ||||||||||||||||||||||||||||
Tax effect of adjustments(1) | (755) | — | (20,657) | — | ||||||||||||||||||||||||||||
| Adjusted Net Income | $ | 18,397 | $ | 6,181 | $ | 22,938 | $ | 30,005 | ||||||||||||||||||||||||
___________________
(1)Computed by applying a combined federal and state statutory rate of 21.59% effective as of September 30, 2021. The Company was a flow-through entity for federal and state income tax purposes for the three months and year ended September 30, 2020.
13
Adjusted EBITDAX: We define Adjusted EBITDAX as net income (loss) adjusted for loss (income) on discontinued operations, exploration expense, depletion, depreciation, amortization and accretion, equity-based compensation expense, interest expense, unrealized (gain) loss on commodity derivative contracts, income taxes, and transaction costs. We believe Adjusted EBITDAX is useful to investors because it provides an effective way to evaluate our operating performance and compare the results of our operations from period to period as well as to other companies in the oil and natural gas industry without regard to our financing methods or capital structure. The following table provides a reconciliation from the GAAP measure of Net income (loss) to Adjusted EBITDAX.
| Three Months Ended September 30, | Year Ended September 30, | |||||||||||||||||||||||||
| 2021 | 2020 | 2021 | 2020 | |||||||||||||||||||||||
| (In thousands) | ||||||||||||||||||||||||||
| Net income (loss) | $ | 15,654 | $ | (5,084) | $ | (65,666) | $ | 35,144 | ||||||||||||||||||
| Loss (income) on discontinued operations | (776) | — | 18,797 | — | ||||||||||||||||||||||
| Exploration expense | 884 | 692 | 9,566 | 9,923 | ||||||||||||||||||||||
| Depletion, depreciation, amortization and accretion | 6,692 | 5,459 | 26,015 | 21,479 | ||||||||||||||||||||||
| Unit-based compensation expense | — | 313 | 689 | 963 | ||||||||||||||||||||||
| Share-based compensation expense | 751 | — | 6,104 | — | ||||||||||||||||||||||
| Interest expense | 963 | 1,213 | 4,534 | 5,299 | ||||||||||||||||||||||
| Unrealized loss (gain) on derivatives | 3,816 | 9,876 | 72,891 | (6,962) | ||||||||||||||||||||||
| Income tax expense (benefit) | (3,937) | 399 | 13,016 | 718 | ||||||||||||||||||||||
| Transaction costs and other | 458 | 1,389 | 3,992 | 1,823 | ||||||||||||||||||||||
| Adjusted EBITDAX | $ | 24,505 | $ | 14,257 | $ | 89,938 | $ | 68,387 | ||||||||||||||||||
Cash G&A: Cash G&A is defined as general and administrative expense less share-based and unit-based compensation and contract services–related parties revenue plus cost of contract services–related parties. We believe Cash G&A is used by analysts and others in valuation, comparison and investment recommendations of companies in our industry to allow for analysis of cash G&A spend without regard to equity based compensation programs or amounts related to contract services. Administrative costs exclude share-based and unit-based compensation as those expenses are presented separately as components of general and administrative expense on our statement of operations. The following table provides a calculation for Cash G&A for the periods indicated:
| Three Months Ended September 30, | Year Ended September 30, | |||||||||||||||||||||||||
| 2021 | 2020 | 2021 | 2020 | |||||||||||||||||||||||
| (In thousands) | ||||||||||||||||||||||||||
| Administrative costs | $ | 4,790 | $ | 2,157 | $ | 13,966 | $ | 10,826 | ||||||||||||||||||
| Plus: Costs of contract services - related parties | 147 | 100 | 477 | 503 | ||||||||||||||||||||||
| Less: Contract services revenues - related parties | (600) | (650) | (2,400) | (3,800) | ||||||||||||||||||||||
| Total Cash G&A | $ | 4,337 | $ | 1,607 | $ | 12,043 | $ | 7,529 | ||||||||||||||||||
14
Cash Costs and Cash Margin per Boe: Cash Costs is a non-GAAP financial measure that we use as an indicator of our total cash-based cost of production and operations. We define “Cash Costs” as lease operating expenses plus production and ad valorem taxes, cash G&A, and interest expense. Management believes that Cash Costs is an important financial measure for use in evaluating the Company’s operating and financial performance and for comparison to other companies in the oil and natural gas industry. We believe this is a useful measure for investors in evaluating our results against other oil and natural gas companies. Cash Costs should be considered in addition to, rather than as a substitute for, Total Costs and Expenses. The following table provides a calculation for Cash Costs and Cash Margin for the periods indicated:
| Three Months Ended September 30, | Year Ended September 30, | |||||||||||||||||||||||||
| 2021 | 2020 | 2021 | 2020 | |||||||||||||||||||||||
| (In thousands, except per Boe amounts) | ||||||||||||||||||||||||||
| Cash Costs: | ||||||||||||||||||||||||||
| Lease operating expenses | $ | 5,686 | $ | 5,254 | $ | 21,975 | $ | 20,243 | ||||||||||||||||||
| Production and ad valorem taxes | 2,575 | 944 | 8,636 | 4,280 | ||||||||||||||||||||||
Cash G&A(1) | 4,337 | 1,607 | 12,043 | 7,529 | ||||||||||||||||||||||
| Interest expense | 963 | 1,213 | 4,534 | 5,299 | ||||||||||||||||||||||
| Total Cash Costs | $ | 13,561 | $ | 9,018 | $ | 47,188 | $ | 37,351 | ||||||||||||||||||
| Total Production (MBoe) | 882 | 653 | 3,154 | 2,592 | ||||||||||||||||||||||
| Cash Margin ($ per Boe): | ||||||||||||||||||||||||||
| Total average realized price ($ per Boe) | $ | 54.46 | $ | 23.43 | $ | 47.12 | $ | 28.22 | ||||||||||||||||||
| Less: | ||||||||||||||||||||||||||
| Lease operating expenses | 6.45 | 8.04 | 6.97 | 7.81 | ||||||||||||||||||||||
| Production and ad valorem taxes | 2.92 | 1.44 | 2.74 | 1.65 | ||||||||||||||||||||||
Cash G&A(1) | 4.92 | 2.46 | 3.82 | 2.91 | ||||||||||||||||||||||
| Interest expense | 1.09 | 1.86 | 1.44 | 2.04 | ||||||||||||||||||||||
| Total Cash Costs per Boe | 15.38 | 13.80 | 14.96 | 14.41 | ||||||||||||||||||||||
| Cash Margin per Boe | $ | 39.08 | $ | 9.63 | $ | 32.16 | $ | 13.81 | ||||||||||||||||||
| Realized gain (loss) on derivatives ($ per Boe) | (12.67) | 10.34 | (5.17) | 10.39 | ||||||||||||||||||||||
| Cash Margin per Boe, including derivative settlements | $ | 26.41 | $ | 19.96 | $ | 26.99 | $ | 24.19 | ||||||||||||||||||
______________________
(1)A non-GAAP financial measure which is reconciled above.
Free Cash Flow: Free Cash Flow is a measure that we use as an indicator of our ability to fund our development activities and generate excess cash for other corporate purposes. We define Free Cash Flow as Cash Flow from Continuing Operations, less capital expenditures before acquisitions. Free Cash Flow should be considered in addition to, rather than as a substitute for, net cash provided by operating activities as a measure of our liquidity. The following table provides a reconciliation of Net Cash Provided by Operating Activities - Continuing Operations to Free Cash Flow for the periods indicated:
| Three Months Ended September 30, | Year Ended September 30, | |||||||||||||||||||||||||
| 2021 | 2020 | 2021 | 2020 | |||||||||||||||||||||||
| (In thousands) | ||||||||||||||||||||||||||
| Net Cash Provided by Operating Activities - Continuing Operations | $ | 27,232 | $ | 13,041 | $ | 86,073 | $ | 62,550 | ||||||||||||||||||
| Additions to oil and natural gas properties | (19,447) | (5,955) | (58,329) | (47,183) | ||||||||||||||||||||||
| Additions to other property and equipment | (542) | (60) | (1,714) | (228) | ||||||||||||||||||||||
| Free Cash Flow | $ | 7,243 | $ | 7,026 | $ | 26,030 | $ | 15,139 | ||||||||||||||||||
15

Investor Presentation December 2021

2 Forward-Looking Statements Forward-Looking Statements This presentation contains projections and other forward-looking statements within the meaning of federal securities laws. These projections and statements reflect Riley Exploration Permian, Inc.’s (“Riley Permian”) current views with respect to future events and financial performance. No assurances can be given, however, that these events will occur or that these projections will be achieved, and actual results could differ materially from those projected as a result of certain factors. A discussion of these factors is included in Riley Permian’s periodic reports filed with the U.S. Securities and Exchange Commission (“SEC”). All statements, other than historical facts, that address activities that Riley Permian assumes, plans, expects, believes, intends or anticipates (and other similar expressions) will, should or may occur in the future are forward-looking statements. The forward-looking statements are based on management’s current beliefs, based on currently available information, as to the outcome and timing of future events, including the current adverse industry and macroeconomic conditions, commodity price volatility, production levels, the impact of the recent presidential and congressional elections on energy and environmental policies and regulations, any other potential regulatory actions (including those that may impose production limits in the Permian Basin), the impact and duration of the ongoing COVID-19 pandemic, acquisitions and sales of assets, future dividends, production, drilling and capital expenditure plans, severe weather conditions (including the impact of the recent severe winter storms on production volumes), impact of impairment charges, price and availability of CO2, and effects of hedging arrangements. These forward-looking statements involve certain risks and uncertainties that could cause the results to differ materially from those expected by the management of Riley Permian. These forward-looking statements involve significant risks and uncertainties that could cause actual results to differ materially from those anticipated, including, but not limited to, the risk that Riley Permian may reduce, suspend or totally eliminate dividend payments in the future, whether variable or fixed, due to insufficient liquidity or other factors, potential adverse reactions or changes to the business or operations of Riley Permian resulting from the recently completed merger, including Riley Permian’s future financial condition, results of operations, strategy and plans; changes in capital markets and the ability of Riley Permian to finance operations in the manner expected; the risk that the Company’s EOR and CCUS projects may not perform as expected or produce the anticipated benefits; the risks of oil and gas activities; and the fact that operating costs and business disruption may be greater than expected following the consummation of the merger. Riley Permian encourages readers to consider the risks and uncertainties associated with projections and other forward-looking statements. In addition, Riley Permian assumes no obligation to publicly revise or update any forward-looking statements based on future events or circumstances. For additional discussion of the factors that may cause us not to achieve our financial projections and/or production estimates, see Riley Permian’s filings with the SEC, including its forms 10-K, 10-Q and 8-K and any amendments thereto. We do not undertake any obligation to release publicly the results of any future revisions we may make to this prospective data or to update this prospective data to reflect events or circumstances after the date of this presentation. Therefore, you are cautioned not to place undue reliance on this information. None of the information contained in this presentation has been audited by any independent auditor. This presentation is prepared as a convenience for securities analysts and investors and may be useful as a reference tool. Riley Permian may elect to modify the format or discontinue publication at any time, without notice to securities analysts or investors. Use of non-GAAP Financial Information This presentation includes certain financial measures that are not calculated in accordance with U.S. generally accepted accounting principles (“GAAP”). These measures include (i) Adjusted Net Income, (ii) Adjusted EBITDAX, (iii) Cash Margins and (iv) Free Cash Flow. These non-GAAP financial measures are not measures of financial performance prepared or presented in accordance with GAAP and may exclude items that are significant in understanding and assessing our financial results. Therefore, these measures should not be considered in isolation, and users of any such information should not place undue reliance thereon. See the Appendix for the descriptions and reconciliations of these non-GAAP measures presented in this presentation to the most directly comparable financial measures calculated in accordance with GAAP. Oil & Gas Reserves The SEC generally permits oil and natural gas companies, in filings made with the SEC, to disclose proved reserves, which are reserve estimates that geological and engineering data demonstrate with reasonable certainty to be recoverable in future years from known reservoirs under existing economic and operating conditions, and certain probable and possible reserves that meet the SEC’s definitions for such terms. In this presentation, Riley Permian may use the terms “resource potential,” “resource play,” “estimated ultimate recovery,” or “EURs,” “type curve” and “standardized measure,” each of which the SEC guidelines restrict from being included in filings with the SEC without strict compliance with SEC definitions. These terms refer to Riley Permian’s internal estimates of unbooked hydrocarbon quantities that may be potentially discovered through exploratory drilling or recovered with additional drilling or recovery techniques. “Resource potential” is used by Riley Permian to refer to the estimated quantities of hydrocarbons that may be added to proved reserves, largely from a specified resource play potentially supporting numerous drilling locations. A “resource play” is a term used by Riley Permian to describe an accumulation of hydrocarbons known to exist over a large areal expanse and/or thick vertical section potentially supporting numerous drilling locations, which, when compared to a conventional play, typically has a lower geological and/or commercial development risk. “EURs” are based on Riley Permian’s previous operating experience in a given area and publicly available information relating to the operations of producers who are conducting operations in these areas. Unbooked resource potential or “EURs” do not constitute reserves within the meaning of the Society of Petroleum Engineer’s Petroleum Resource Management System or SEC rules and do not include any proved reserves. Actual quantities of reserves that may be ultimately recovered from Riley Permian’s interests may differ substantially from those presented herein. Factors affecting ultimate recovery include the scope of Riley Permian’s ongoing drilling program, which will be directly affected by the availability of capital, decreases in oil, natural gas liquids and natural gas prices, well spacing, drilling and production costs, availability and cost of drilling services and equipment, lease expirations, transportation constraints, regulatory approvals, negative revisions to reserve estimates and other factors, as well as actual drilling results, including geological and mechanical factors affecting recovery rates. “EURs” from reserves may change significantly as development of Riley Permian’s core assets provides additional data. In addition, Riley Permian’s production forecasts and expectations for future periods are dependent upon many assumptions, including estimates of production decline rates from existing wells and the undertaking and outcome of future drilling activity, which may be affected by significant commodity price declines or drilling cost increases. “Type curve” refers to a production profile of a well, or a particular category of wells, for a specific play and/or area.
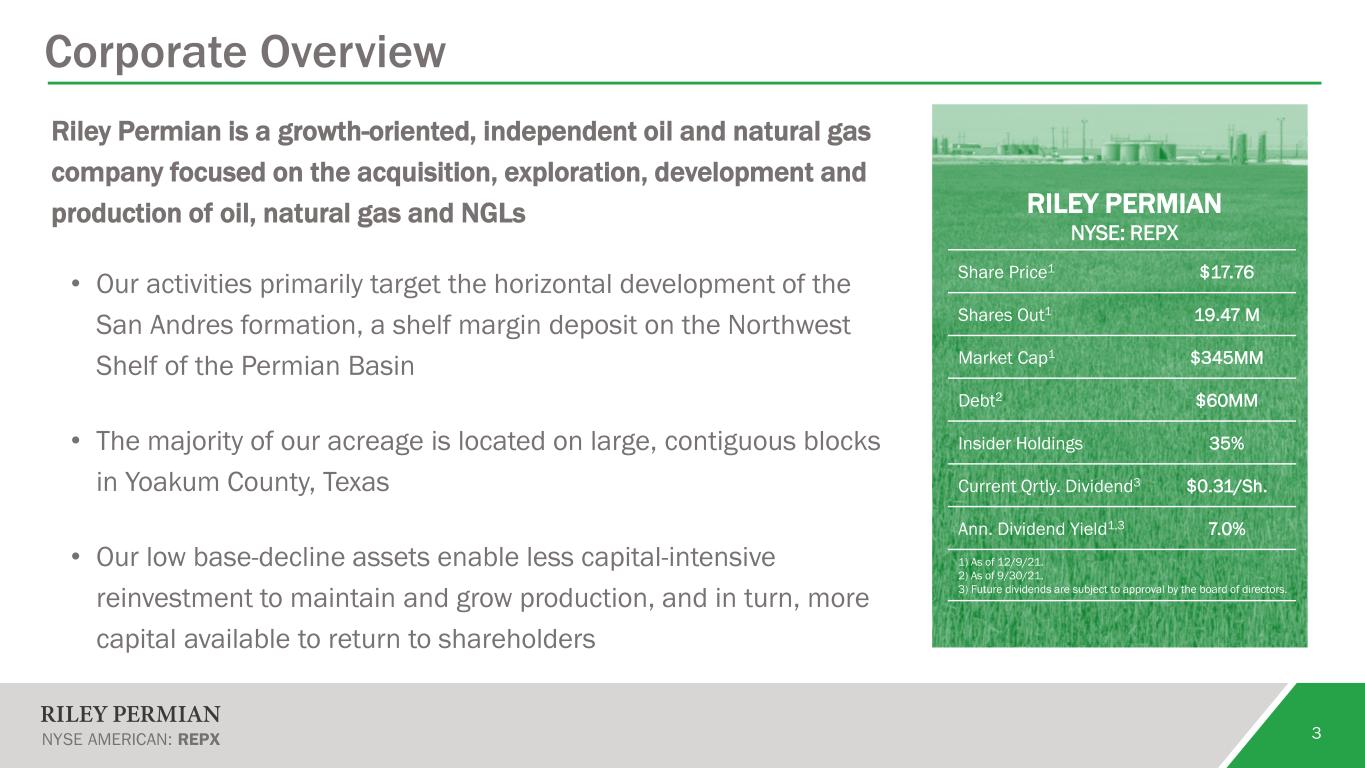
Corporate Overview Riley Permian is a growth-oriented, independent oil and natural gas company focused on the acquisition, exploration, development and production of oil, natural gas and NGLs • Our activities primarily target the horizontal development of the San Andres formation, a shelf margin deposit on the Northwest Shelf of the Permian Basin • The majority of our acreage is located on large, contiguous blocks in Yoakum County, Texas • Our low base-decline assets enable less capital-intensive reinvestment to maintain and grow production, and in turn, more capital available to return to shareholders 3 RILEY PERMIAN NYSE: REPX Share Price1 $17.76 Shares Out1 19.47 M Market Cap1 $345MM Debt2 $60MM Insider Holdings 35% Current Qrtly. Dividend3 $0.31/Sh. Ann. Dividend Yield1,3 7.0% 1) As of 12/9/21. 2) As of 9/30/21. 3) Future dividends are subject to approval by the board of directors.
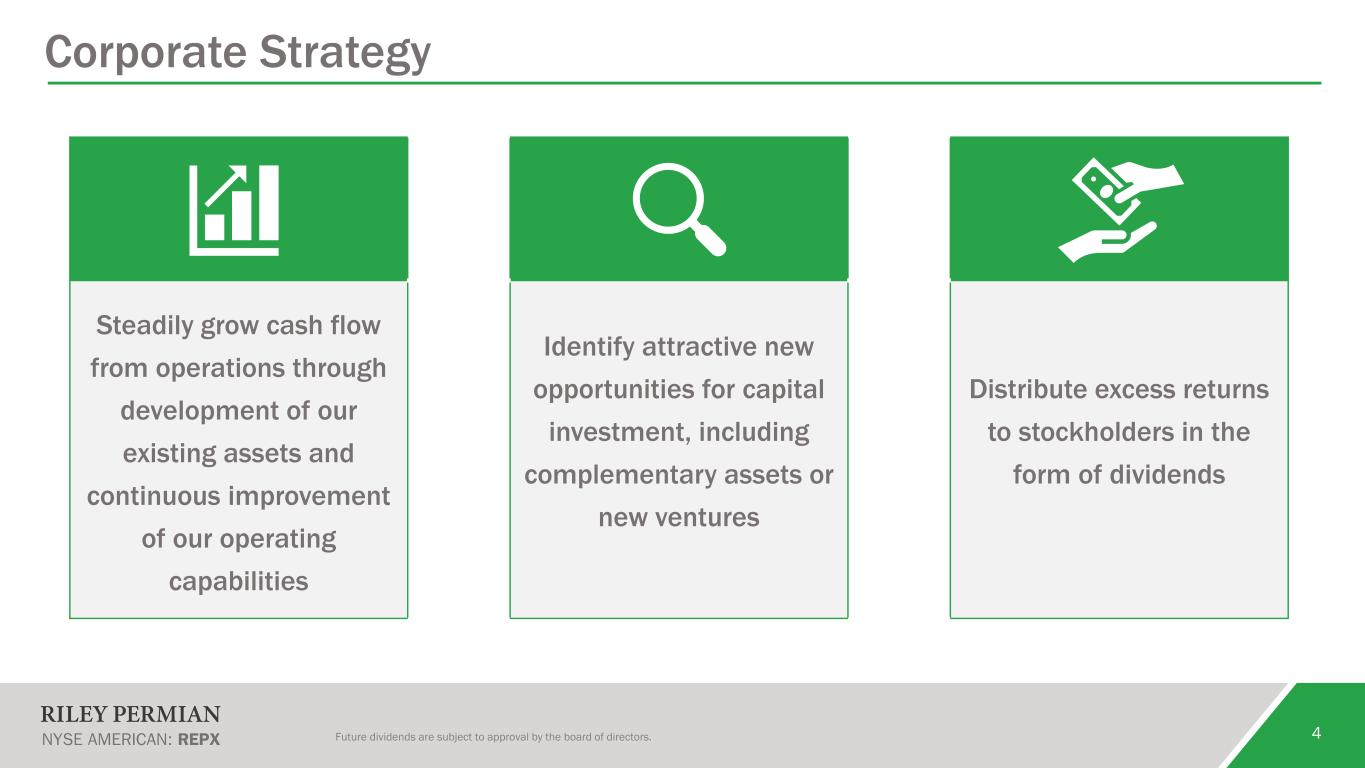
Corporate Strategy 4Future dividends are subject to approval by the board of directors. Steadily grow cash flow from operations through development of our existing assets and continuous improvement of our operating capabilities Identify attractive new opportunities for capital investment, including complementary assets or new ventures Distribute excess returns to stockholders in the form of dividends
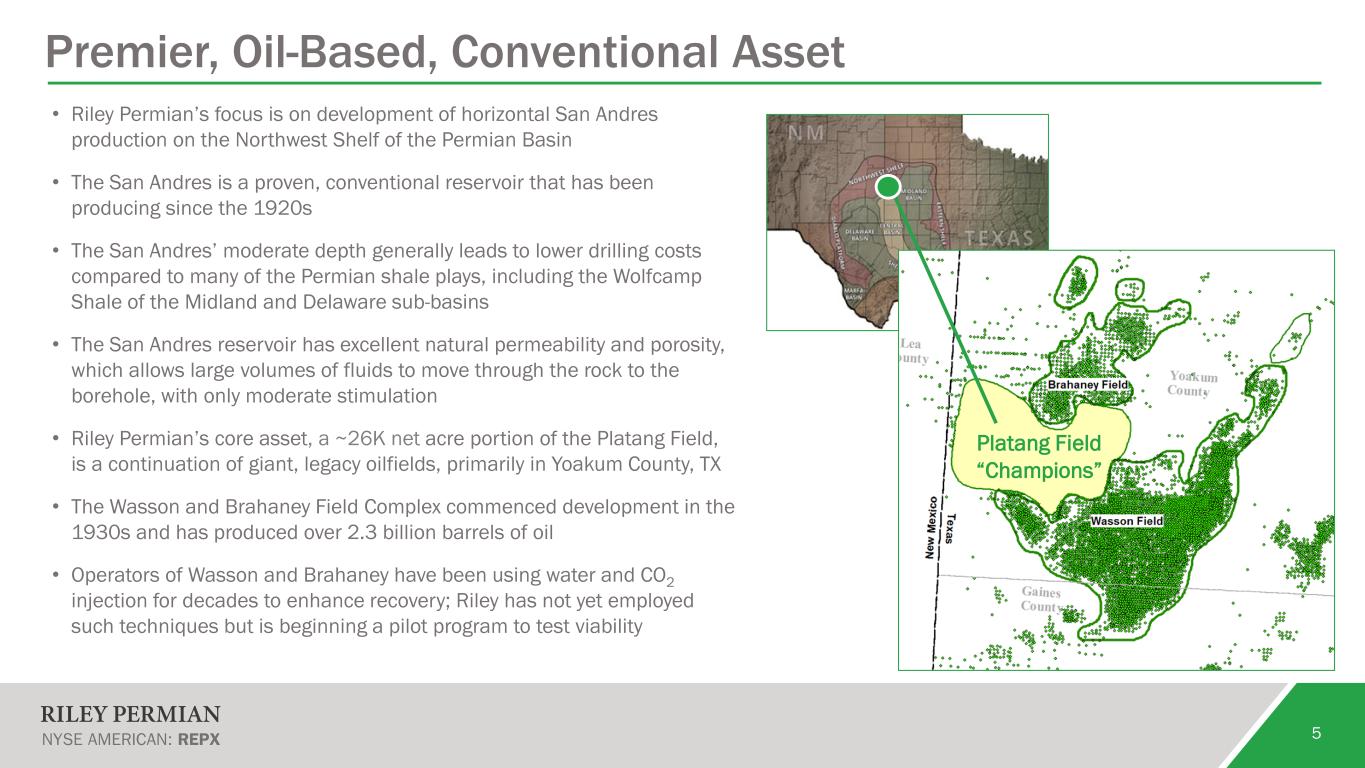
Premier, Oil-Based, Conventional Asset 5 • Riley Permian’s focus is on development of horizontal San Andres production on the Northwest Shelf of the Permian Basin • The San Andres is a proven, conventional reservoir that has been producing since the 1920s • The San Andres’ moderate depth generally leads to lower drilling costs compared to many of the Permian shale plays, including the Wolfcamp Shale of the Midland and Delaware sub-basins • The San Andres reservoir has excellent natural permeability and porosity, which allows large volumes of fluids to move through the rock to the borehole, with only moderate stimulation • Riley Permian’s core asset, a ~26K net acre portion of the Platang Field, is a continuation of giant, legacy oilfields, primarily in Yoakum County, TX • The Wasson and Brahaney Field Complex commenced development in the 1930s and has produced over 2.3 billion barrels of oil • Operators of Wasson and Brahaney have been using water and CO2 injection for decades to enhance recovery; Riley has not yet employed such techniques but is beginning a pilot program to test viability Platang Field “Champions”
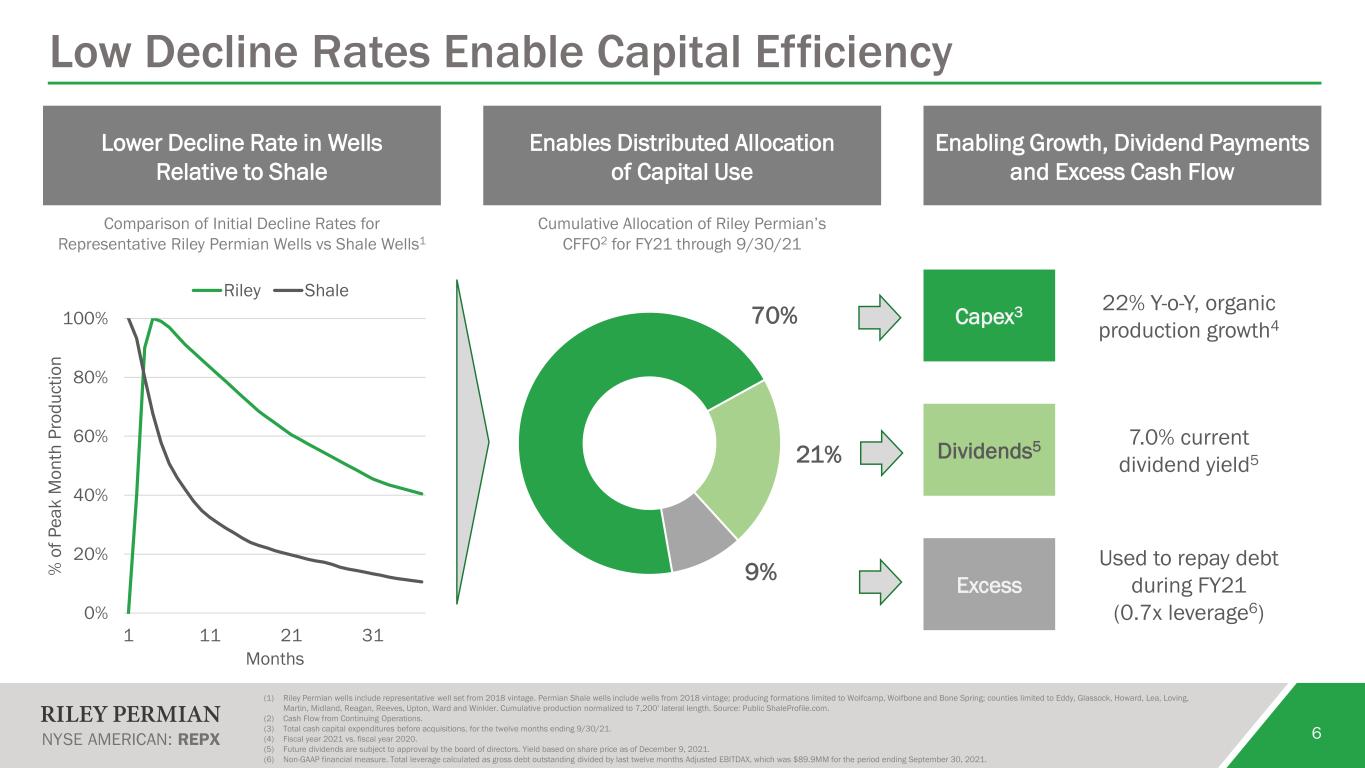
Lower Decline Rate in Wells Relative to Shale Enables Distributed Allocation of Capital Use Enabling Growth, Dividend Payments and Excess Cash Flow Comparison of Initial Decline Rates for Representative Riley Permian Wells vs Shale Wells1 Cumulative Allocation of Riley Permian’s CFFO2 for FY21 through 9/30/21 Capex3 22% Y-o-Y, organic production growth4 Dividends5 7.0% current dividend yield5 Excess Used to repay debt during FY21 (0.7x leverage6) 6 Low Decline Rates Enable Capital Efficiency (1) Riley Permian wells include representative well set from 2018 vintage. Permian Shale wells include wells from 2018 vintage; producing formations limited to Wolfcamp, Wolfbone and Bone Spring; counties limited to Eddy, Glassock, Howard, Lea, Loving, Martin, Midland, Reagan, Reeves, Upton, Ward and Winkler. Cumulative production normalized to 7,200’ lateral length. Source: Public ShaleProfile.com. (2) Cash Flow from Continuing Operations. (3) Total cash capital expenditures before acquisitions, for the twelve months ending 9/30/21. (4) Fiscal year 2021 vs. fiscal year 2020. (5) Future dividends are subject to approval by the board of directors. Yield based on share price as of December 9, 2021. (6) Non-GAAP financial measure. Total leverage calculated as gross debt outstanding divided by last twelve months Adjusted EBITDAX, which was $89.9MM for the period ending September 30, 2021. 0% 20% 40% 60% 80% 100% 1 11 21 31 % o f P ea k M on th P ro du ct io n Months Riley Shale 70% 21% 9%
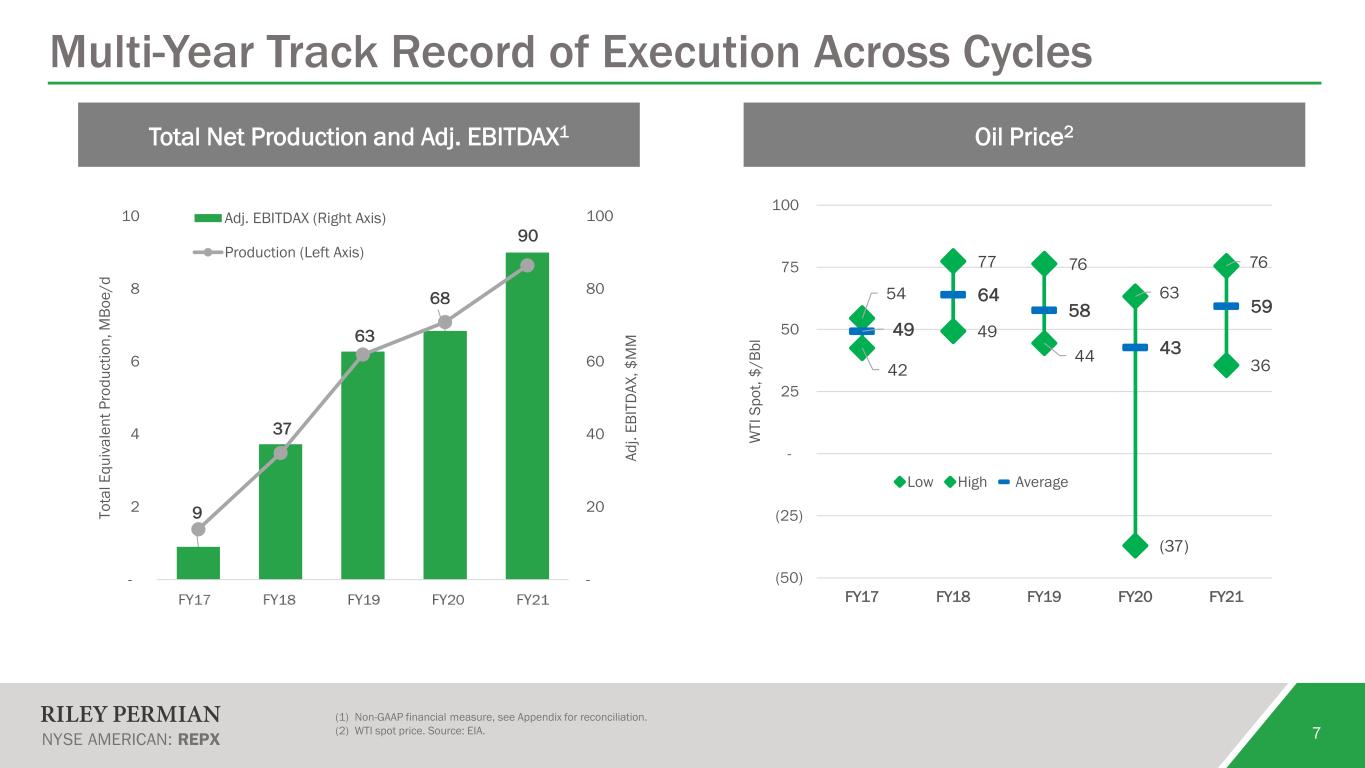
9 37 63 68 90 - 20 40 60 80 100 - 2 4 6 8 10 1 2 3 4 5 Ad j. EB IT D AX , $ M M To ta l E qu iv al en t P ro du ct io n, M Bo e/ d Adj. EBITDAX (Right Axis) Production (Left Axis) Total Net Production and Adj. EBITDAX1 Oil Price2 7 Multi-Year Track Record of Execution Across Cycles (1) Non-GAAP financial measure, see Appendix for reconciliation. (2) WTI spot price. Source: EIA. 42 49 44 (37) 36 54 77 76 63 76 49 64 58 43 59 (50) (25) - 25 50 75 100 FY17 FY18 FY19 FY20 FY21 W TI S po t, $/ Bb l Low High Average
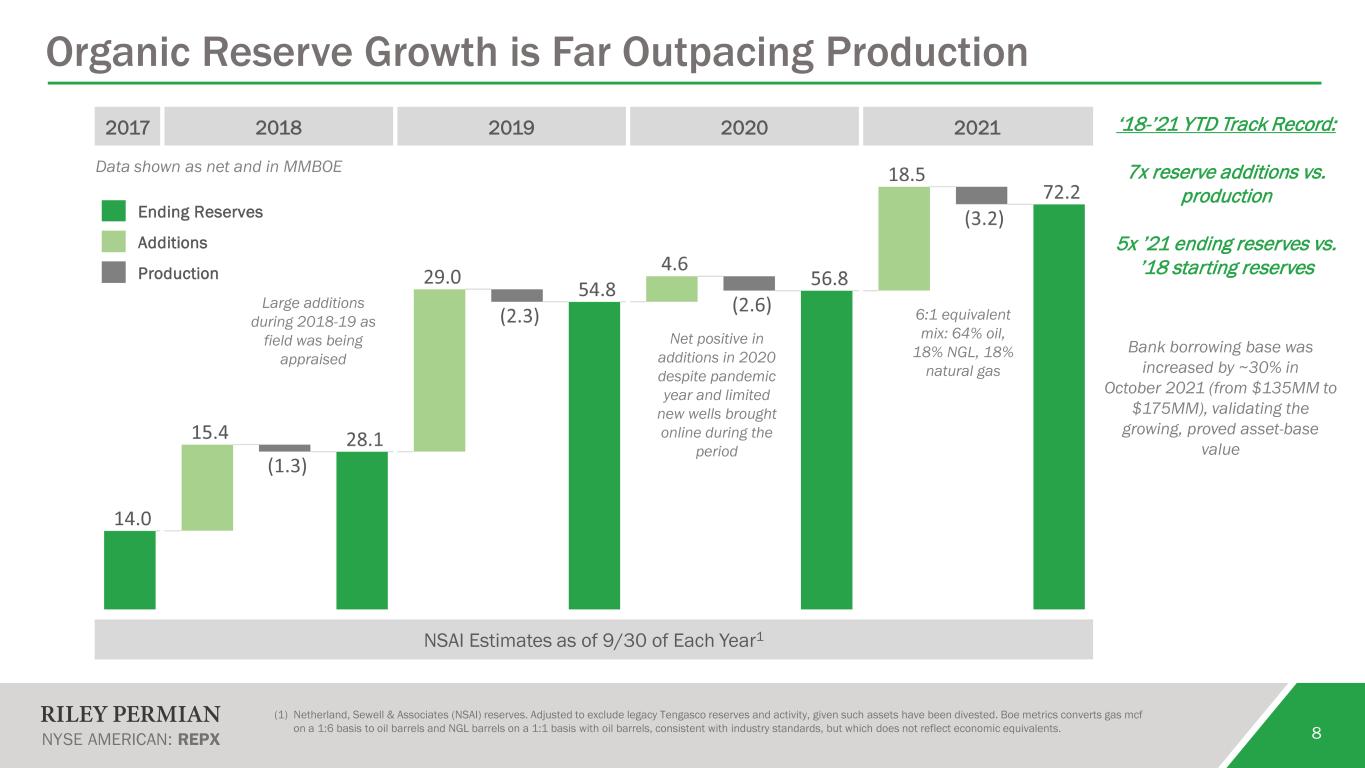
2017 2018 2019 2020 2021 NSAI Estimates as of 9/30 of Each Year1 Organic Reserve Growth is Far Outpacing Production 8 (1) Netherland, Sewell & Associates (NSAI) reserves. Adjusted to exclude legacy Tengasco reserves and activity, given such assets have been divested. Boe metrics converts gas mcf on a 1:6 basis to oil barrels and NGL barrels on a 1:1 basis with oil barrels, consistent with industry standards, but which does not reflect economic equivalents. Bank borrowing base was increased by ~30% in October 2021 (from $135MM to $175MM), validating the growing, proved asset-base value 6:1 equivalent mix: 64% oil, 18% NGL, 18% natural gas Net positive in additions in 2020 despite pandemic year and limited new wells brought online during the period ‘18-’21 YTD Track Record: 7x reserve additions vs. production 5x ’21 ending reserves vs. ’18 starting reserves Large additions during 2018-19 as field was being appraised Ending Reserves Additions Production Data shown as net and in MMBOE
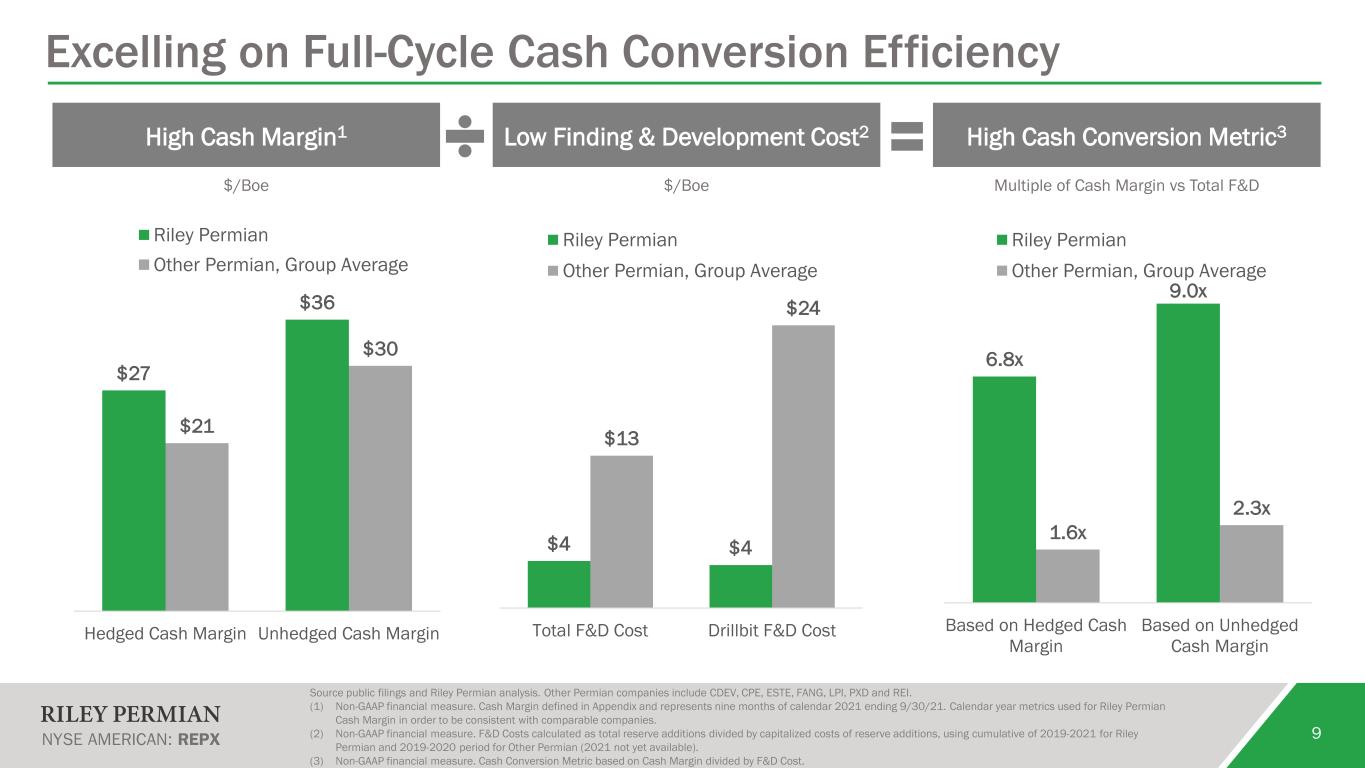
9 Source public filings and Riley Permian analysis. Other Permian companies include CDEV, CPE, ESTE, FANG, LPI, PXD and REI. (1) Non-GAAP financial measure. Cash Margin defined in Appendix and represents nine months of calendar 2021 ending 9/30/21. Calendar year metrics used for Riley Permian Cash Margin in order to be consistent with comparable companies. (2) Non-GAAP financial measure. F&D Costs calculated as total reserve additions divided by capitalized costs of reserve additions, using cumulative of 2019-2021 for Riley Permian and 2019-2020 period for Other Permian (2021 not yet available). (3) Non-GAAP financial measure. Cash Conversion Metric based on Cash Margin divided by F&D Cost. High Cash Margin1 Low Finding & Development Cost2 High Cash Conversion Metric3 $/Boe $/Boe Multiple of Cash Margin vs Total F&D Excelling on Full-Cycle Cash Conversion Efficiency $27 $36 $21 $30 Hedged Cash Margin Unhedged Cash Margin Riley Permian Other Permian, Group Average $4 $4 $13 $24 Total F&D Cost Drillbit F&D Cost Riley Permian Other Permian, Group Average 6.8x 9.0x 1.6x 2.3x Based on Hedged Cash Margin Based on Unhedged Cash Margin Riley Permian Other Permian, Group Average
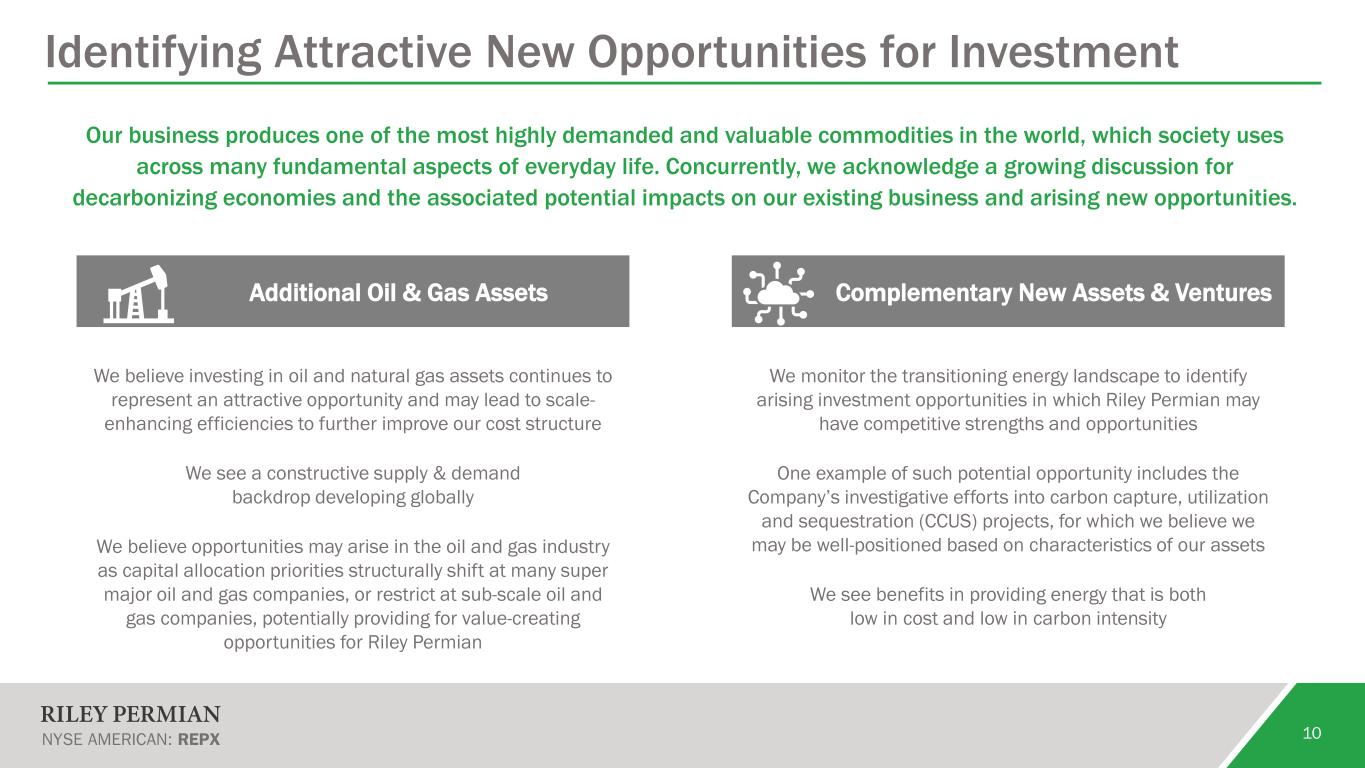
Identifying Attractive New Opportunities for Investment 10 Our business produces one of the most highly demanded and valuable commodities in the world, which society uses across many fundamental aspects of everyday life. Concurrently, we acknowledge a growing discussion for decarbonizing economies and the associated potential impacts on our existing business and arising new opportunities. Additional Oil & Gas Assets Complementary New Assets & Ventures We believe investing in oil and natural gas assets continues to represent an attractive opportunity and may lead to scale- enhancing efficiencies to further improve our cost structure We see a constructive supply & demand backdrop developing globally We believe opportunities may arise in the oil and gas industry as capital allocation priorities structurally shift at many super major oil and gas companies, or restrict at sub-scale oil and gas companies, potentially providing for value-creating opportunities for Riley Permian We monitor the transitioning energy landscape to identify arising investment opportunities in which Riley Permian may have competitive strengths and opportunities One example of such potential opportunity includes the Company’s investigative efforts into carbon capture, utilization and sequestration (CCUS) projects, for which we believe we may be well-positioned based on characteristics of our assets We see benefits in providing energy that is both low in cost and low in carbon intensity
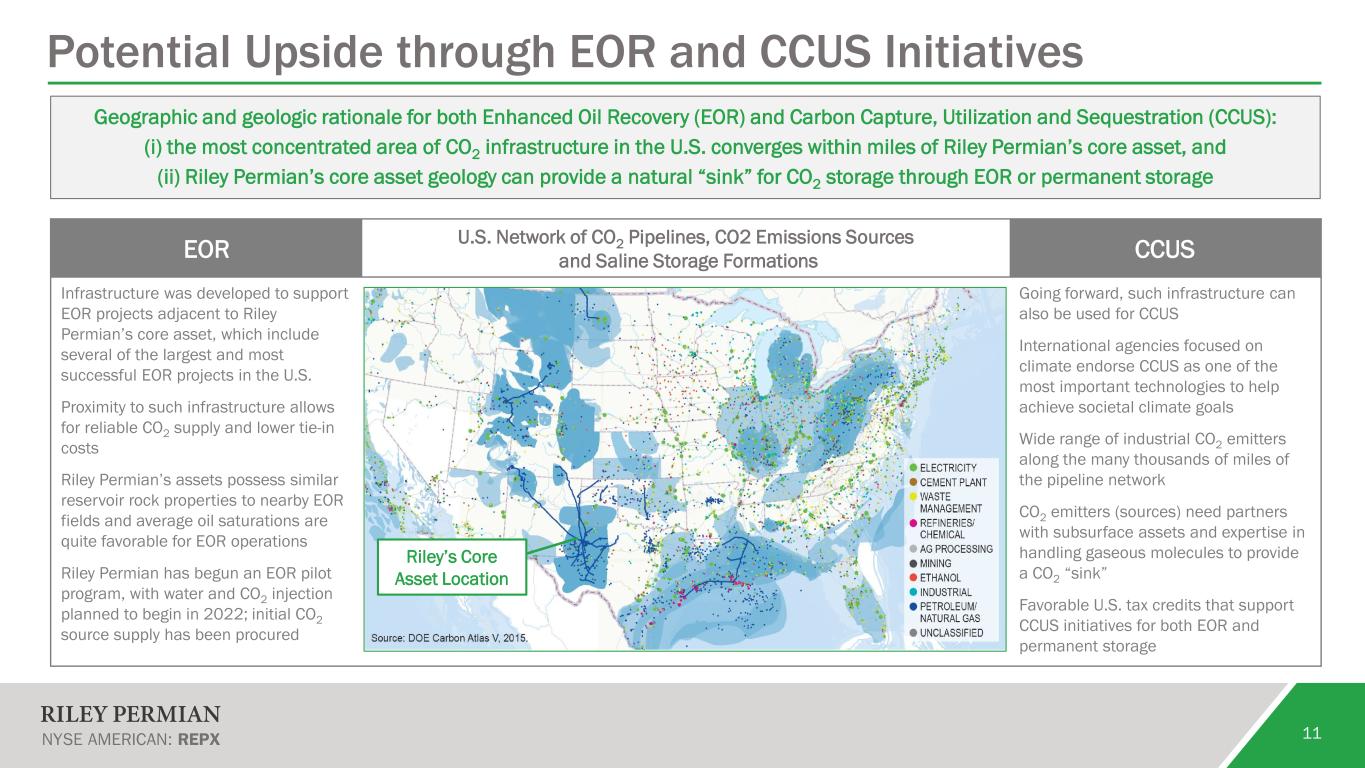
EOR U.S. Network of CO2 Pipelines, CO2 Emissions Sources and Saline Storage Formations CCUS Infrastructure was developed to support EOR projects adjacent to Riley Permian’s core asset, which include several of the largest and most successful EOR projects in the U.S. Proximity to such infrastructure allows for reliable CO2 supply and lower tie-in costs Riley Permian’s assets possess similar reservoir rock properties to nearby EOR fields and average oil saturations are quite favorable for EOR operations Riley Permian has begun an EOR pilot program, with water and CO2 injection planned to begin in 2022; initial CO2 source supply has been procured Going forward, such infrastructure can also be used for CCUS International agencies focused on climate endorse CCUS as one of the most important technologies to help achieve societal climate goals Wide range of industrial CO2 emitters along the many thousands of miles of the pipeline network CO2 emitters (sources) need partners with subsurface assets and expertise in handling gaseous molecules to provide a CO2 “sink” Favorable U.S. tax credits that support CCUS initiatives for both EOR and permanent storage Potential Upside through EOR and CCUS Initiatives 11 Geographic and geologic rationale for both Enhanced Oil Recovery (EOR) and Carbon Capture, Utilization and Sequestration (CCUS): (i) the most concentrated area of CO2 infrastructure in the U.S. converges within miles of Riley Permian’s core asset, and (ii) Riley Permian’s core asset geology can provide a natural “sink” for CO2 storage through EOR or permanent storage Riley’s Core Asset Location
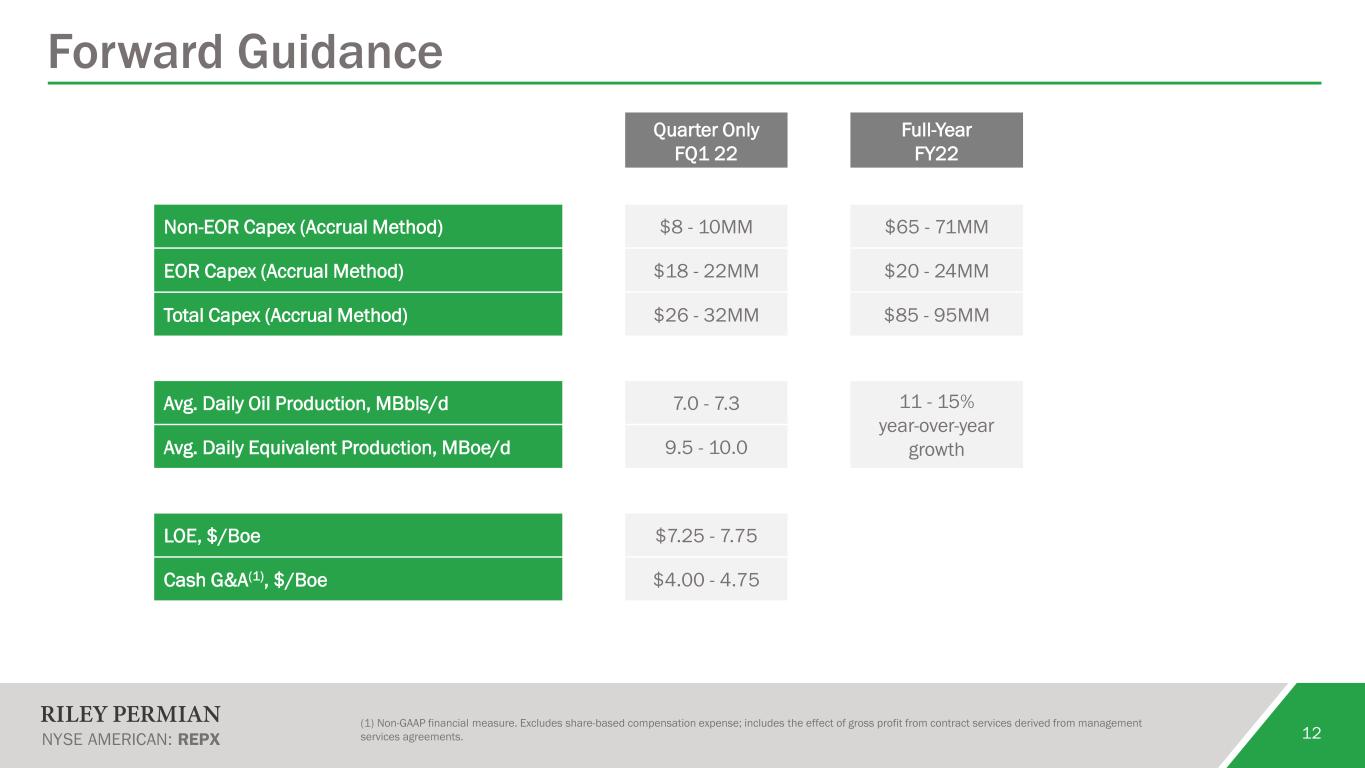
12 Forward Guidance Quarter Only FQ1 22 Full-Year FY22 Non-EOR Capex (Accrual Method) $8 - 10MM $65 - 71MM EOR Capex (Accrual Method) $18 - 22MM $20 - 24MM Total Capex (Accrual Method) $26 - 32MM $85 - 95MM Avg. Daily Oil Production, MBbls/d 7.0 - 7.3 11 - 15% year-over-year growthAvg. Daily Equivalent Production, MBoe/d 9.5 - 10.0 LOE, $/Boe $7.25 - 7.75 Cash G&A(1), $/Boe $4.00 - 4.75 (1) Non-GAAP financial measure. Excludes share-based compensation expense; includes the effect of gross profit from contract services derived from management services agreements.
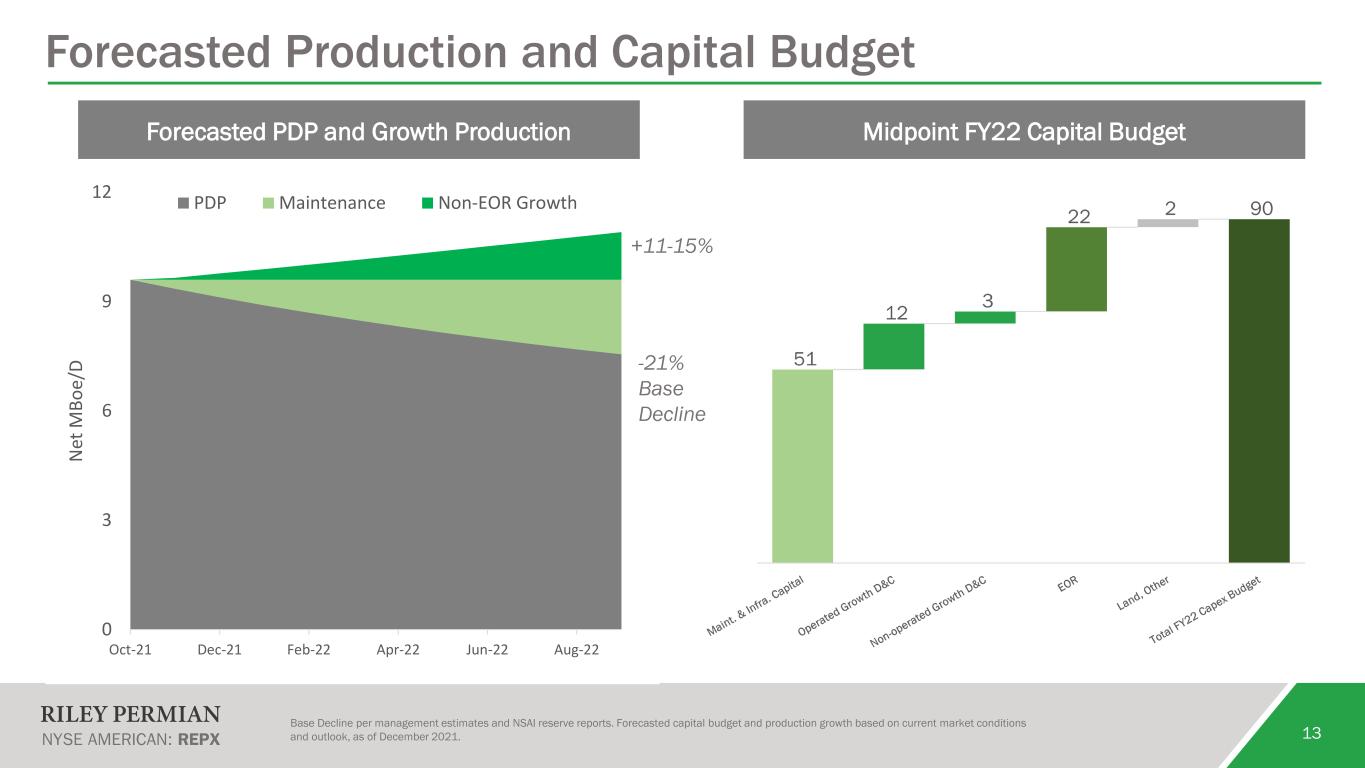
Forecasted PDP and Growth Production Midpoint FY22 Capital Budget 0 3 6 9 12 Oct-21 Dec-21 Feb-22 Apr-22 Jun-22 Aug-22 N et M Bo e/ D PDP Maintenance Non-EOR Growth 13 Forecasted Production and Capital Budget -21% Base Decline +11-15% Base Decline per management estimates and NSAI reserve reports. Forecasted capital budget and production growth based on current market conditions and outlook, as of December 2021.
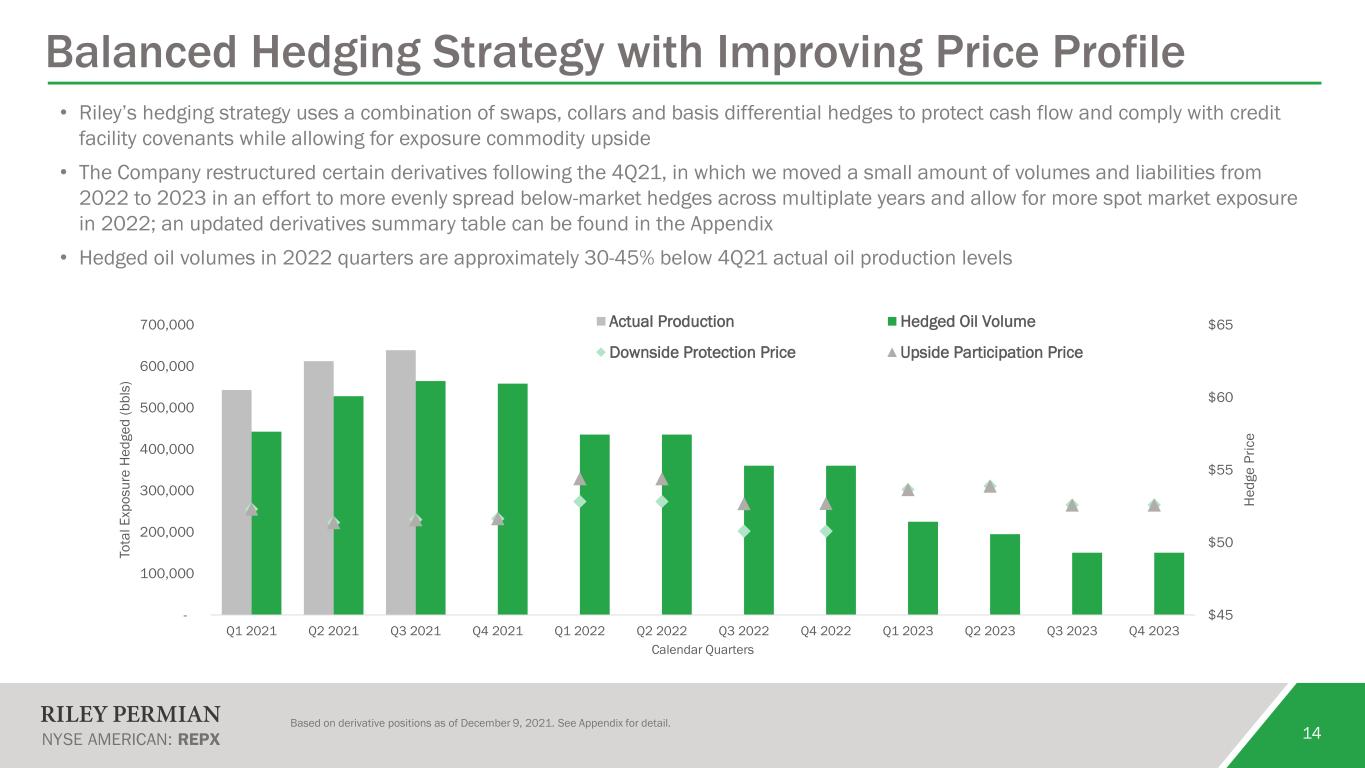
14 Balanced Hedging Strategy with Improving Price Profile • Riley’s hedging strategy uses a combination of swaps, collars and basis differential hedges to protect cash flow and comply with credit facility covenants while allowing for exposure commodity upside • The Company restructured certain derivatives following the 4Q21, in which we moved a small amount of volumes and liabilities from 2022 to 2023 in an effort to more evenly spread below-market hedges across multiplate years and allow for more spot market exposure in 2022; an updated derivatives summary table can be found in the Appendix • Hedged oil volumes in 2022 quarters are approximately 30-45% below 4Q21 actual oil production levels $45 $50 $55 $60 $65 - 100,000 200,000 300,000 400,000 500,000 600,000 700,000 Q1 2021 Q2 2021 Q3 2021 Q4 2021 Q1 2022 Q2 2022 Q3 2022 Q4 2022 Q1 2023 Q2 2023 Q3 2023 Q4 2023 He dg e Pr ic e To ta l E xp os ur e He dg ed (b bl s) Calendar Quarters Actual Production Hedged Oil Volume Downside Protection Price Upside Participation Price Based on derivative positions as of December 9, 2021. See Appendix for detail.
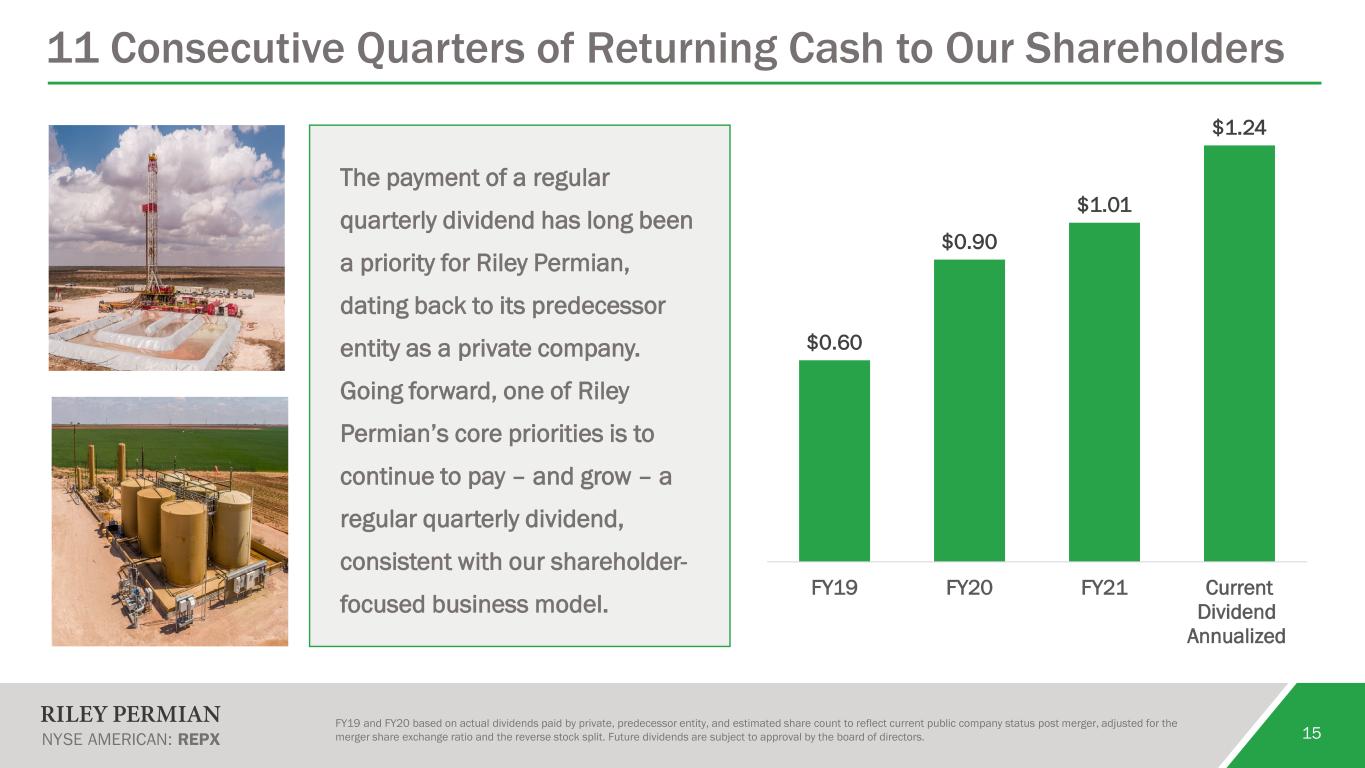
11 Consecutive Quarters of Returning Cash to Our Shareholders 15 FY19 and FY20 based on actual dividends paid by private, predecessor entity, and estimated share count to reflect current public company status post merger, adjusted for the merger share exchange ratio and the reverse stock split. Future dividends are subject to approval by the board of directors. The payment of a regular quarterly dividend has long been a priority for Riley Permian, dating back to its predecessor entity as a private company. Going forward, one of Riley Permian’s core priorities is to continue to pay – and grow – a regular quarterly dividend, consistent with our shareholder- focused business model. $0.60 $0.90 $1.01 $1.24 FY19 FY20 FY21 Current Dividend Annualized
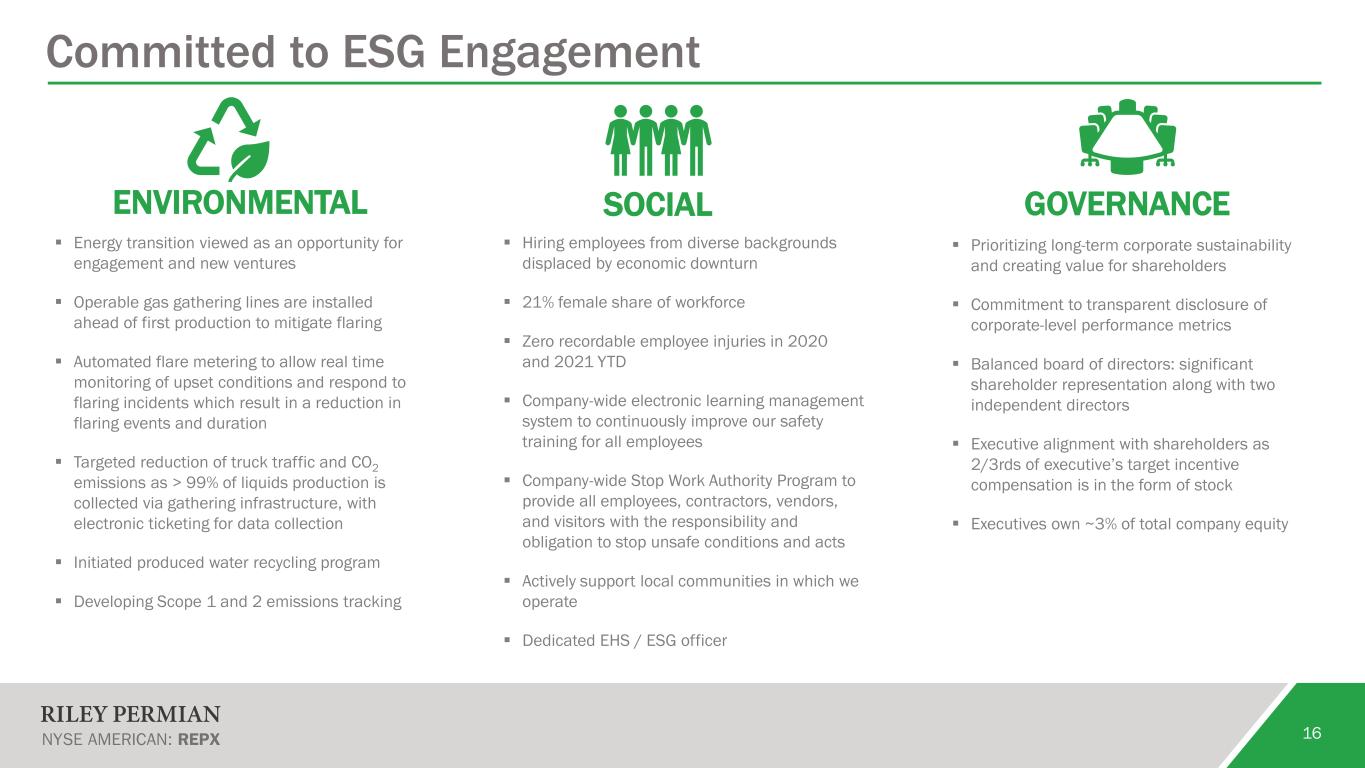
Committed to ESG Engagement 16 Energy transition viewed as an opportunity for engagement and new ventures Operable gas gathering lines are installed ahead of first production to mitigate flaring Automated flare metering to allow real time monitoring of upset conditions and respond to flaring incidents which result in a reduction in flaring events and duration Targeted reduction of truck traffic and CO2 emissions as > 99% of liquids production is collected via gathering infrastructure, with electronic ticketing for data collection Initiated produced water recycling program Developing Scope 1 and 2 emissions tracking Hiring employees from diverse backgrounds displaced by economic downturn 21% female share of workforce Zero recordable employee injuries in 2020 and 2021 YTD Company-wide electronic learning management system to continuously improve our safety training for all employees Company-wide Stop Work Authority Program to provide all employees, contractors, vendors, and visitors with the responsibility and obligation to stop unsafe conditions and acts Actively support local communities in which we operate Dedicated EHS / ESG officer Prioritizing long-term corporate sustainability and creating value for shareholders Commitment to transparent disclosure of corporate-level performance metrics Balanced board of directors: significant shareholder representation along with two independent directors Executive alignment with shareholders as 2/3rds of executive’s target incentive compensation is in the form of stock Executives own ~3% of total company equity ENVIRONMENTAL SOCIAL GOVERNANCE
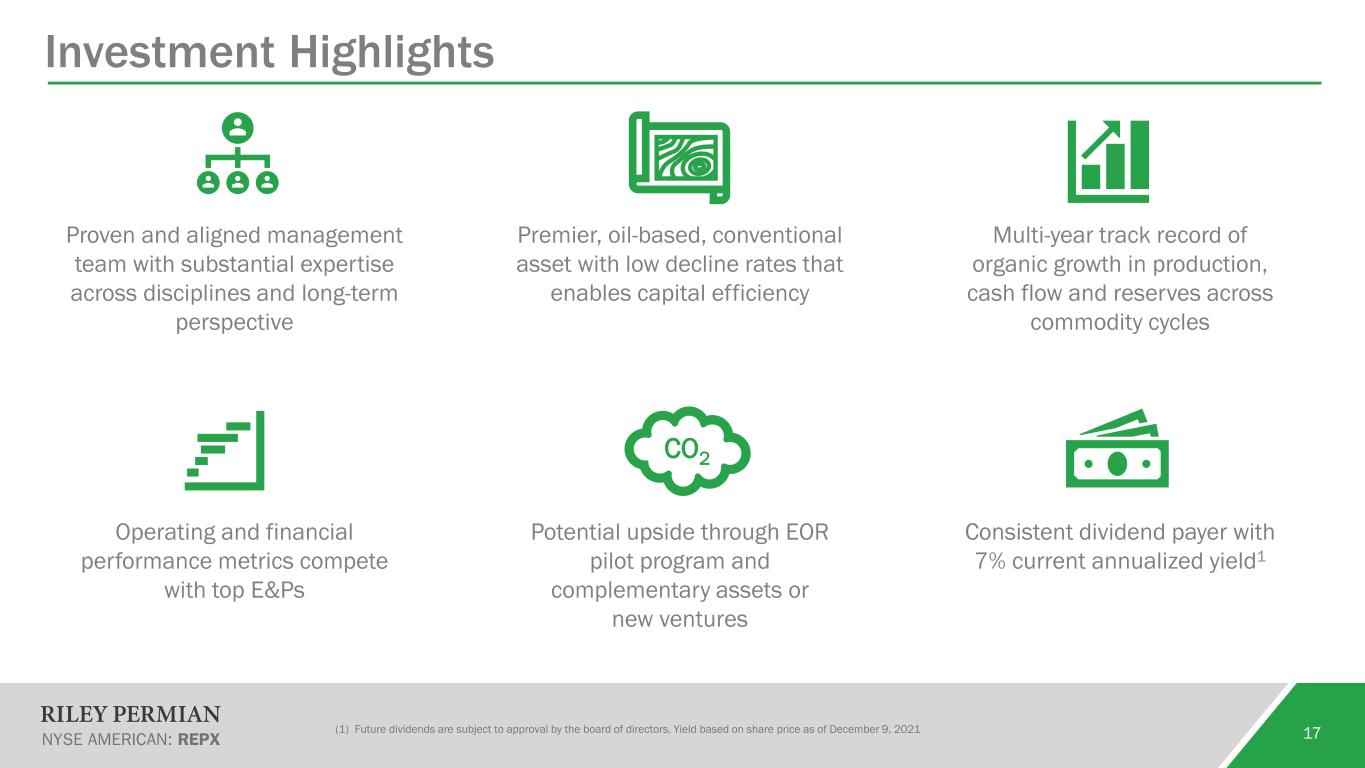
CO2 Investment Highlights 17(1) Future dividends are subject to approval by the board of directors. Yield based on share price as of December 9, 2021 Proven and aligned management team with substantial expertise across disciplines and long-term perspective Premier, oil-based, conventional asset with low decline rates that enables capital efficiency Multi-year track record of organic growth in production, cash flow and reserves across commodity cycles Operating and financial performance metrics compete with top E&Ps Potential upside through EOR pilot program and complementary assets or new ventures Consistent dividend payer with 7% current annualized yield1
Additional Information 18 Company www.rileypermian.com 29 E. Reno Ave., Ste 500 Oklahoma City, OK 73104 Investor Relations Direct: 405-415-8699 [email protected]
Appendix 19[ insert footnotes here ]
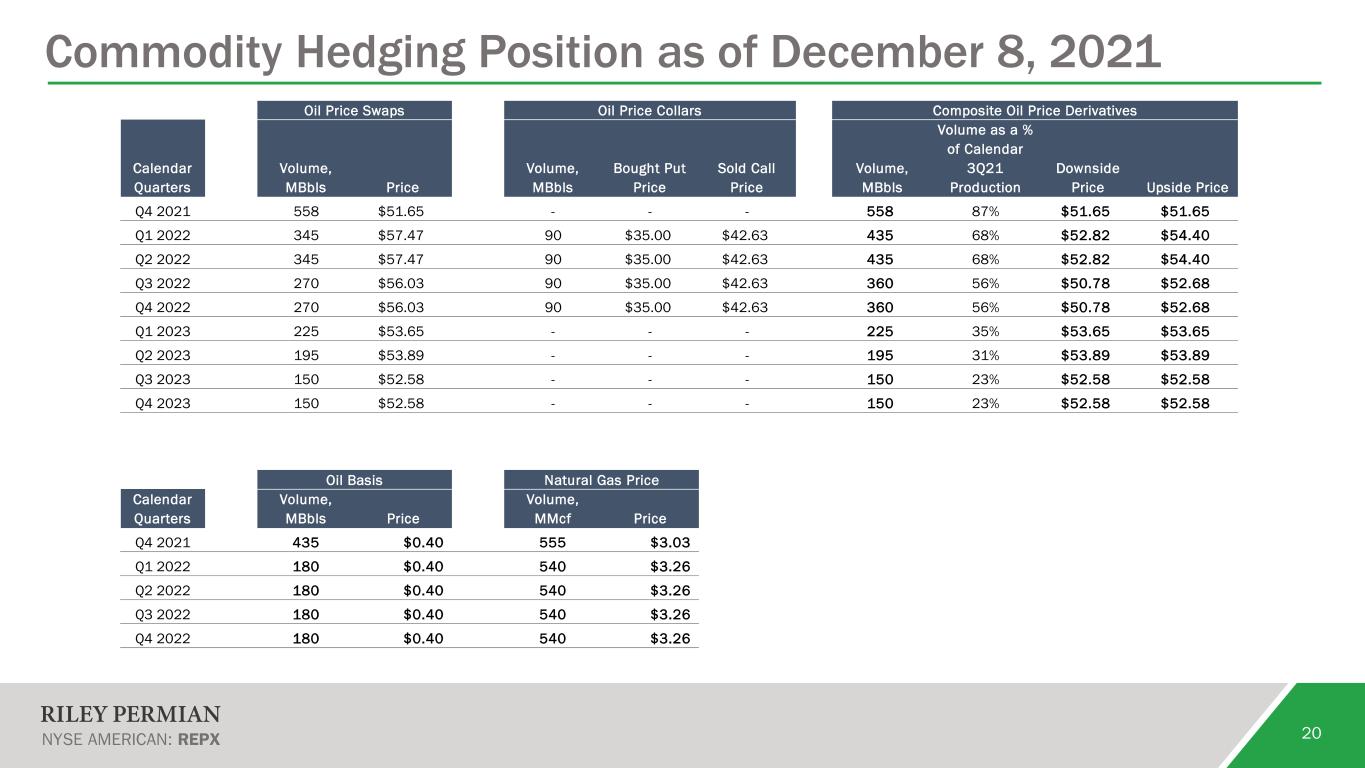
20 Commodity Hedging Position as of December 8, 2021 Oil Price Swaps Oil Price Collars Composite Oil Price Derivatives Calendar Quarters Volume, MBbls Price Volume, MBbls Bought Put Price Sold Call Price Volume, MBbls Volume as a % of Calendar 3Q21 Production Downside Price Upside Price Q4 2021 558 $51.65 - - - 558 87% $51.65 $51.65 Q1 2022 345 $57.47 90 $35.00 $42.63 435 68% $52.82 $54.40 Q2 2022 345 $57.47 90 $35.00 $42.63 435 68% $52.82 $54.40 Q3 2022 270 $56.03 90 $35.00 $42.63 360 56% $50.78 $52.68 Q4 2022 270 $56.03 90 $35.00 $42.63 360 56% $50.78 $52.68 Q1 2023 225 $53.65 - - - 225 35% $53.65 $53.65 Q2 2023 195 $53.89 - - - 195 31% $53.89 $53.89 Q3 2023 150 $52.58 - - - 150 23% $52.58 $52.58 Q4 2023 150 $52.58 - - - 150 23% $52.58 $52.58 Oil Basis Natural Gas Price Calendar Quarters Volume, MBbls Price Volume, MMcf Price Q4 2021 435 $0.40 555 $3.03 Q1 2022 180 $0.40 540 $3.26 Q2 2022 180 $0.40 540 $3.26 Q3 2022 180 $0.40 540 $3.26 Q4 2022 180 $0.40 540 $3.26
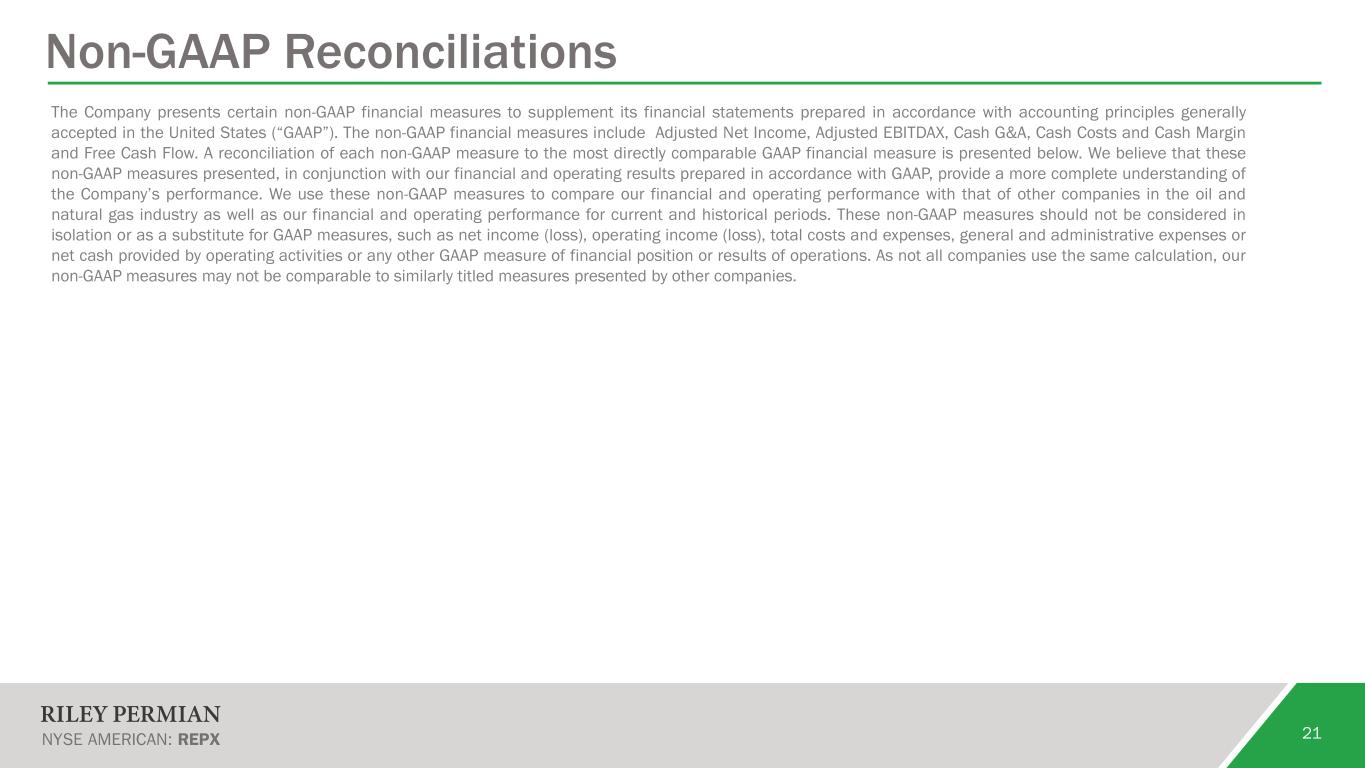
21 Non-GAAP Reconciliations The Company presents certain non-GAAP financial measures to supplement its financial statements prepared in accordance with accounting principles generally accepted in the United States (“GAAP”). The non-GAAP financial measures include Adjusted Net Income, Adjusted EBITDAX, Cash G&A, Cash Costs and Cash Margin and Free Cash Flow. A reconciliation of each non-GAAP measure to the most directly comparable GAAP financial measure is presented below. We believe that these non-GAAP measures presented, in conjunction with our financial and operating results prepared in accordance with GAAP, provide a more complete understanding of the Company’s performance. We use these non-GAAP measures to compare our financial and operating performance with that of other companies in the oil and natural gas industry as well as our financial and operating performance for current and historical periods. These non-GAAP measures should not be considered in isolation or as a substitute for GAAP measures, such as net income (loss), operating income (loss), total costs and expenses, general and administrative expenses or net cash provided by operating activities or any other GAAP measure of financial position or results of operations. As not all companies use the same calculation, our non-GAAP measures may not be comparable to similarly titled measures presented by other companies.
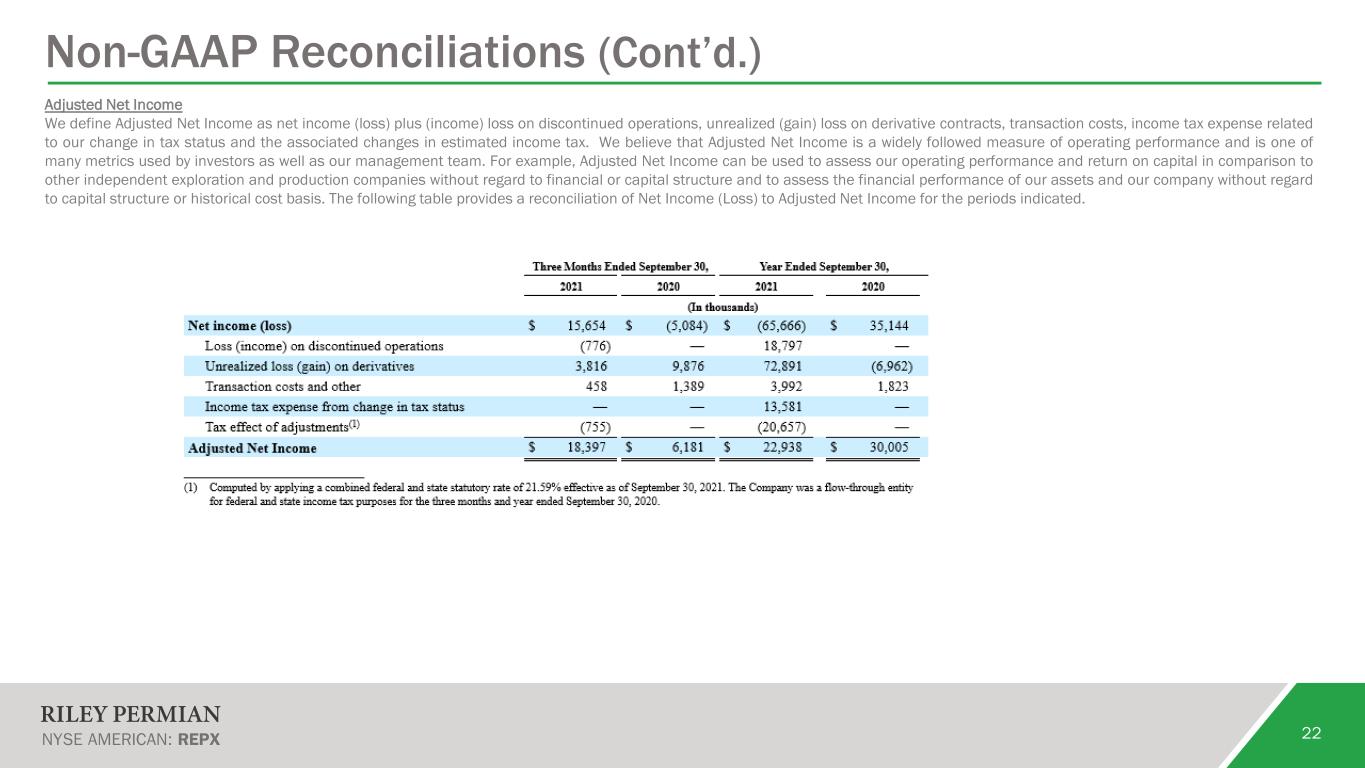
22 Non-GAAP Reconciliations (Cont’d.) Adjusted Net Income We define Adjusted Net Income as net income (loss) plus (income) loss on discontinued operations, unrealized (gain) loss on derivative contracts, transaction costs, income tax expense related to our change in tax status and the associated changes in estimated income tax. We believe that Adjusted Net Income is a widely followed measure of operating performance and is one of many metrics used by investors as well as our management team. For example, Adjusted Net Income can be used to assess our operating performance and return on capital in comparison to other independent exploration and production companies without regard to financial or capital structure and to assess the financial performance of our assets and our company without regard to capital structure or historical cost basis. The following table provides a reconciliation of Net Income (Loss) to Adjusted Net Income for the periods indicated.
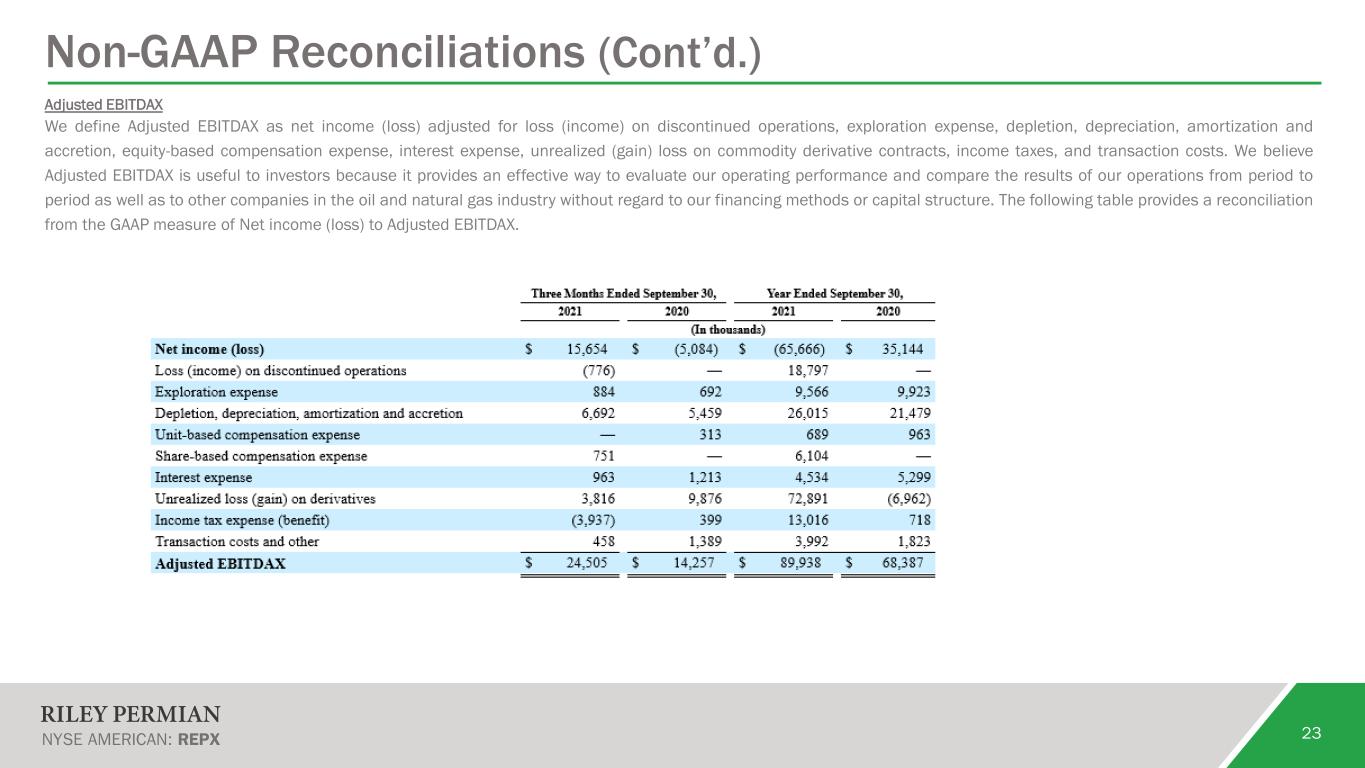
23 Non-GAAP Reconciliations (Cont’d.) Adjusted EBITDAX We define Adjusted EBITDAX as net income (loss) adjusted for loss (income) on discontinued operations, exploration expense, depletion, depreciation, amortization and accretion, equity-based compensation expense, interest expense, unrealized (gain) loss on commodity derivative contracts, income taxes, and transaction costs. We believe Adjusted EBITDAX is useful to investors because it provides an effective way to evaluate our operating performance and compare the results of our operations from period to period as well as to other companies in the oil and natural gas industry without regard to our financing methods or capital structure. The following table provides a reconciliation from the GAAP measure of Net income (loss) to Adjusted EBITDAX.
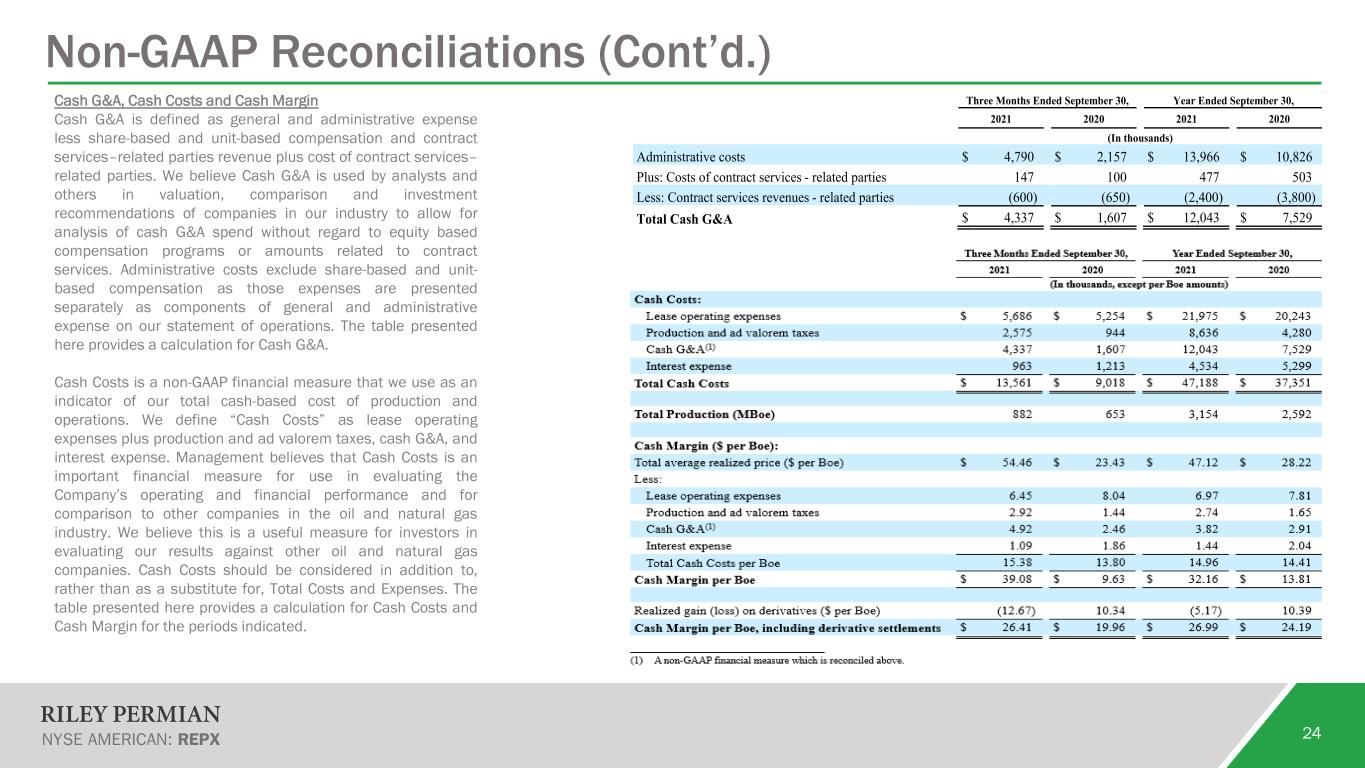
24 Non-GAAP Reconciliations (Cont’d.) Cash G&A, Cash Costs and Cash Margin Cash G&A is defined as general and administrative expense less share-based and unit-based compensation and contract services–related parties revenue plus cost of contract services– related parties. We believe Cash G&A is used by analysts and others in valuation, comparison and investment recommendations of companies in our industry to allow for analysis of cash G&A spend without regard to equity based compensation programs or amounts related to contract services. Administrative costs exclude share-based and unit- based compensation as those expenses are presented separately as components of general and administrative expense on our statement of operations. The table presented here provides a calculation for Cash G&A. Cash Costs is a non-GAAP financial measure that we use as an indicator of our total cash-based cost of production and operations. We define “Cash Costs” as lease operating expenses plus production and ad valorem taxes, cash G&A, and interest expense. Management believes that Cash Costs is an important financial measure for use in evaluating the Company’s operating and financial performance and for comparison to other companies in the oil and natural gas industry. We believe this is a useful measure for investors in evaluating our results against other oil and natural gas companies. Cash Costs should be considered in addition to, rather than as a substitute for, Total Costs and Expenses. The table presented here provides a calculation for Cash Costs and Cash Margin for the periods indicated. Three Months Ended September 30, Year Ended September 30, 2021 2020 2021 2020 (In thousands) Administrative costs $ 4,790 $ 2,157 $ 13,966 $ 10,826 Plus: Costs of contract services - related parties 147 100 477 503 Less: Contract services revenues - related parties (600) (650) (2,400) (3,800) Total Cash G&A $ 4,337 $ 1,607 $ 12,043 $ 7,529
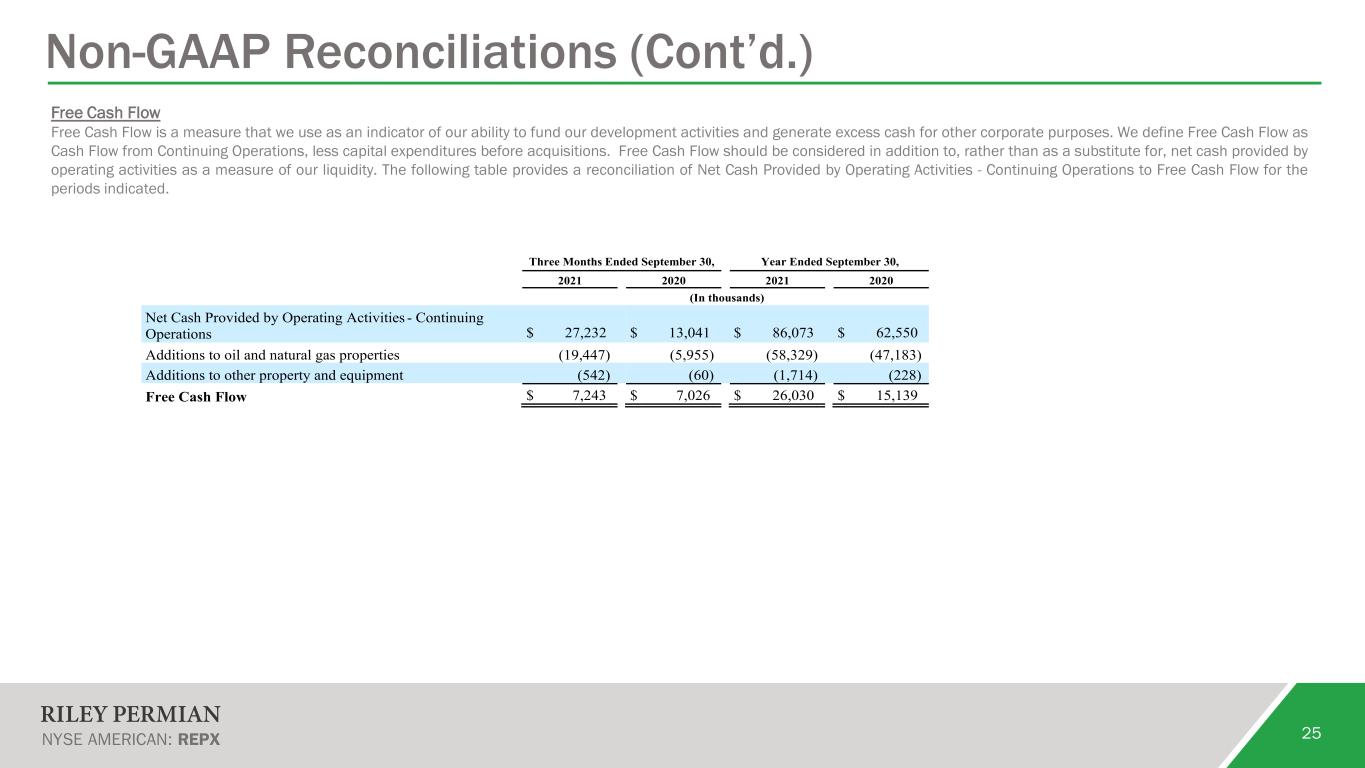
25 Non-GAAP Reconciliations (Cont’d.) Free Cash Flow Free Cash Flow is a measure that we use as an indicator of our ability to fund our development activities and generate excess cash for other corporate purposes. We define Free Cash Flow as Cash Flow from Continuing Operations, less capital expenditures before acquisitions. Free Cash Flow should be considered in addition to, rather than as a substitute for, net cash provided by operating activities as a measure of our liquidity. The following table provides a reconciliation of Net Cash Provided by Operating Activities - Continuing Operations to Free Cash Flow for the periods indicated. Three Months Ended September 30, Year Ended September 30, 2021 2020 2021 2020 (In thousands) Net Cash Provided by Operating Activities - Continuing Operations $ 27,232 $ 13,041 $ 86,073 $ 62,550 Additions to oil and natural gas properties (19,447) (5,955) (58,329) (47,183) Additions to other property and equipment (542) (60) (1,714) (228) Free Cash Flow $ 7,243 $ 7,026 $ 26,030 $ 15,139