
Riley Exploration Permian, Inc 8-K/A, filed Sep 3, 2025
Riley Exploration Permian, Inc. (REPX)
8-K/A
2025-09-03
For: 2025-07-01
View Original
Added on
April 09, 2026
About this 8-K/A
Riley Exploration Permian, Inc filed this 8-K/A on September 3, 2025, reporting on events of July 1, 2025.
Items reported
- Item 2.02: Financial results
- Item 9.01: Financial statements and exhibits
UNITED STATES
SECURITIES AND EXCHANGE COMMISSION
WASHINGTON, D.C. 20549
FORM 8-K/A
(Amendment No. 1)
CURRENT REPORT
Pursuant to Section 13 or 15(d)
of the Securities Exchange Act of 1934
Date of Report (Date of earliest event reported): July 1, 2025
(Exact name of registrant as specified in its charter)
| (State or other jurisdiction of incorporation) | (Commission File Number) | (IRS Employer Identification No.) | ||||||
Address of Principal Executive Offices, Including Zip Code)
(Registrant’s Telephone Number, Including Area Code)
Check the appropriate box below if the Form 8-K filing is intended to simultaneously satisfy the filing obligation of the registrant under any of the following provisions (see General Instruction A.2. below):
| Written communications pursuant to Rule 425 under the Securities Act (17 CFR 230.425) | |||||
| Soliciting material pursuant to Rule 14a-12 under the Exchange Act (17 CFR 240.14a-12) | |||||
| Pre-commencement communications pursuant to Rule 14d-2(b) under the Exchange Act (17 CFR 240.14d-2(b)) | |||||
| Pre-commencement communications pursuant to Rule 13e-4(c) under the Exchange Act (17 CFR 240.13e-4(c)) | |||||
Securities registered pursuant to Section 12(b) of the Act:
| Title of Each Class | Trading Symbol(s) | Name of each exchange on which registered | |||||||||||||||
Indicate by check mark whether the registrant is an emerging growth company as defined in Rule 405 of the Securities Act of 1933 (§230.405 of this chapter) or Rule 12b-2 of the Securities Exchange Act of 1934 (§240.12b-2 of this chapter).
Emerging growth company o
If an emerging growth company, indicate by check mark if the registrant has elected not to use the extended transition period for complying with any new or revised financial accounting standards provided pursuant to Section 13(a) of the Exchange Act. o
Introductory Note
As previously disclosed in the Current Report on Form 8-K filed on July 2, 2025 (the “Prior 8-K”) with the Securities and Exchange Commission, on July 1, 2025 (the “Closing Date”), Riley Exploration - Permian, LLC (“REP LLC”), a wholly-owned subsidiary of Riley Exploration Permian, Inc. (“REPX,” together with REP LLC, hereinafter referred to as the “Company”), completed its previously announced acquisition of 100% of the ownership interests of Silverback Exploration II, LLC and its subsidiaries (“Silverback”) which own oil and natural gas assets located primarily in the Yeso trend of the Permian Basin in Eddy County, New Mexico (the “Silverback Acquisition”).
The Company is filing this amendment to the Prior 8-K for the purpose of providing (i) the audited consolidated financial statements of Silverback as of and for the year ended December 31, 2024, (ii) the unaudited interim consolidated financial statements of Silverback as of and for the three months ended March 31, 2025, and (iii) the unaudited pro forma financial information of the Company giving effect to the Silverback Acquisition, as described below.
Item 9.01 Financial Statements and Exhibits
(a) Financial Statements of Business Acquired
Audited consolidated financial statements of Silverback for the year ended December 31, 2024, are attached hereto as Exhibit 99.1 and incorporated herein by reference.
Unaudited interim consolidated financial statements of Silverback as of and for the three months ended March 31, 2025 are attached hereto as Exhibit 99.2 and incorporated herein by reference.
(b) Pro Forma Financial Information
Unaudited pro forma condensed combined balance sheet of the Company as of March 31, 2025, and the unaudited pro forma condensed combined statements of operations for the year ended December 31, 2024, and the three months ended March 31, 2025, are attached hereto as Exhibit 99.3 and incorporated herein by reference. These unaudited pro forma financial statements give effect to the Silverback Acquisition on the basis, and subject to the assumptions, set forth in accordance with Article 11 of Regulation S-X.
(d) Exhibits
| Exhibit No. | Description | ||||
Consent of Baker Tilly US, LLP | |||||
Audited consolidated financial statements of Silverback Exploration II, LLC for the year ended December 31, 2024. | |||||
Unaudited interim consolidated financial statements of Silverback Exploration II, LLC as of and for the three months ended March 31, 2025. | |||||
Unaudited pro forma condensed combined balance sheet of Riley Exploration Permian, Inc. as of March 31, 2025 and the unaudited pro forma condensed combined statements of operations for the year ended December 31, 2024 and the three months ended March 31, 2025. | |||||
| 104 | Cover Page Interactive Data File (embedded within the Inline XBRL document). | ||||
SIGNATURES
Pursuant to the requirements of the Securities Exchange Act of 1934, the registrant has duly caused this report to be signed on its behalf by the undersigned hereunto duly authorized.
| RILEY EXPLORATION PERMIAN, INC. | |||||||||||
| Date: | September 3, 2025 | By: | /s/ Philip Riley | ||||||||
| Philip Riley | |||||||||||
| Chief Financial Officer and Executive Vice President of Strategy | |||||||||||
Exhibit 23.1
Consent of Independent Auditors
We consent to the incorporation by reference in the Registration Statements on Form S-3 of Riley Exploration Permian, Inc. (No. 333-279327) and Form S-8 (No. 333-253750 and No. 333-271415) of our report dated April 30, 2025, relating to the consolidated financial statements of Silverback Exploration II, LLC as of December 31, 2024 and for the year then ended, appearing in this Current Report on Form 8-K/A dated July 1, 2025 of Riley Exploration Permian, Inc.
/s/ Baker Tilly US, LLP
Dallas, Texas
September 2, 2025
Report of Independent Auditors and Consolidated Financial Statements with Supplementary Information Silverback Exploration II, LLC December 31, 2024
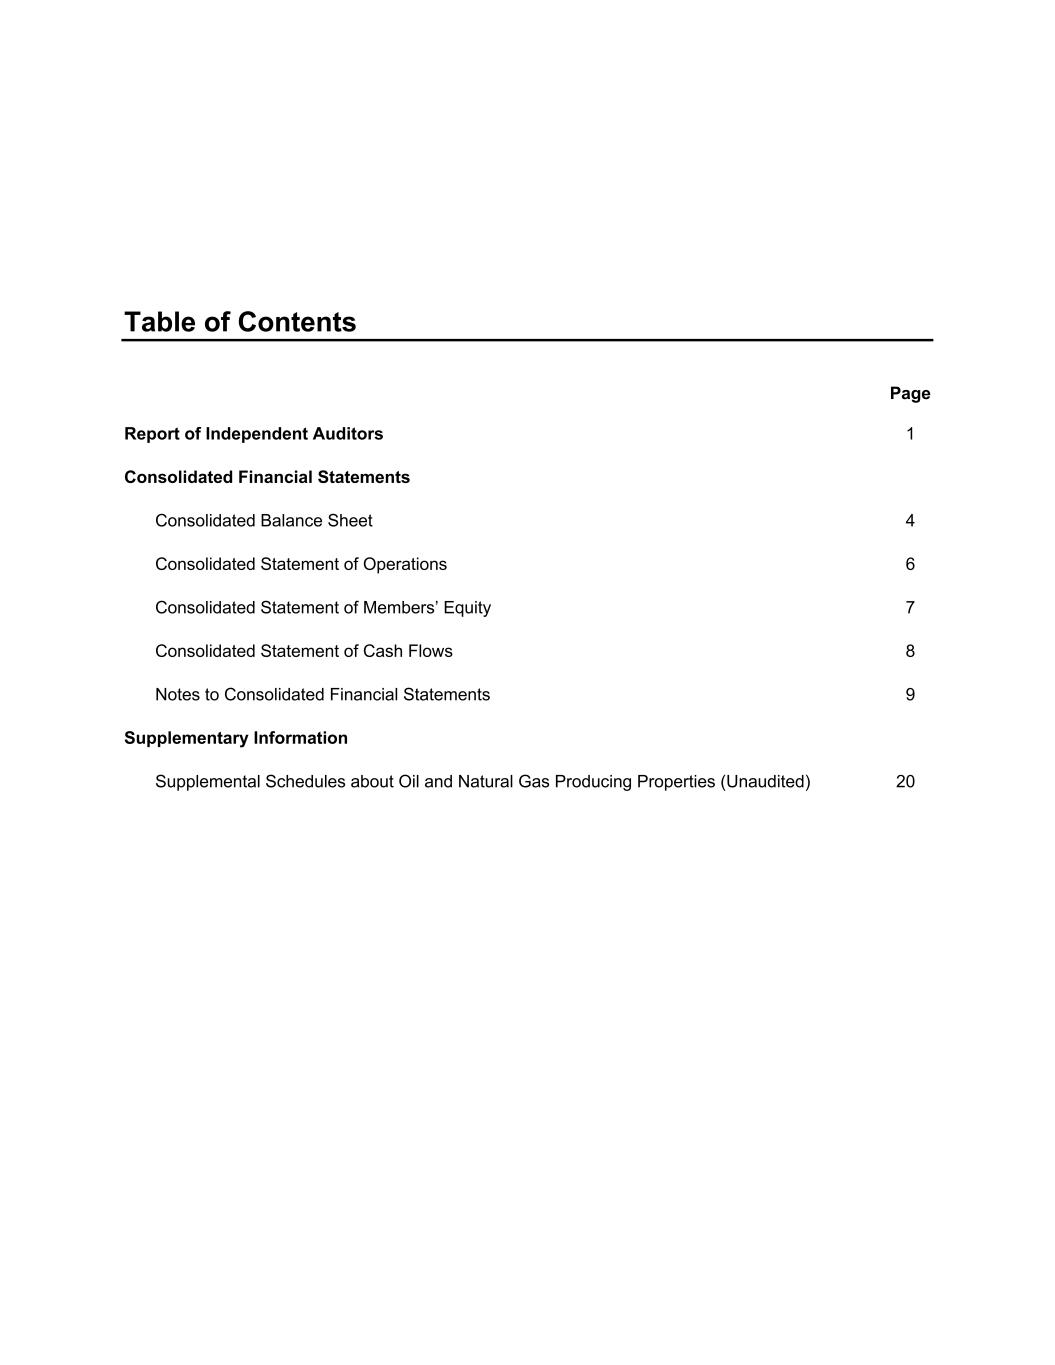
Table of Contents Page Report of Independent Auditors 1 Consolidated Financial Statements Consolidated Balance Sheet 4 Consolidated Statement of Operations 6 Consolidated Statement of Members’ Equity 7 Consolidated Statement of Cash Flows 8 Notes to Consolidated Financial Statements 9 Supplementary Information Supplemental Schedules about Oil and Natural Gas Producing Properties (Unaudited) 20
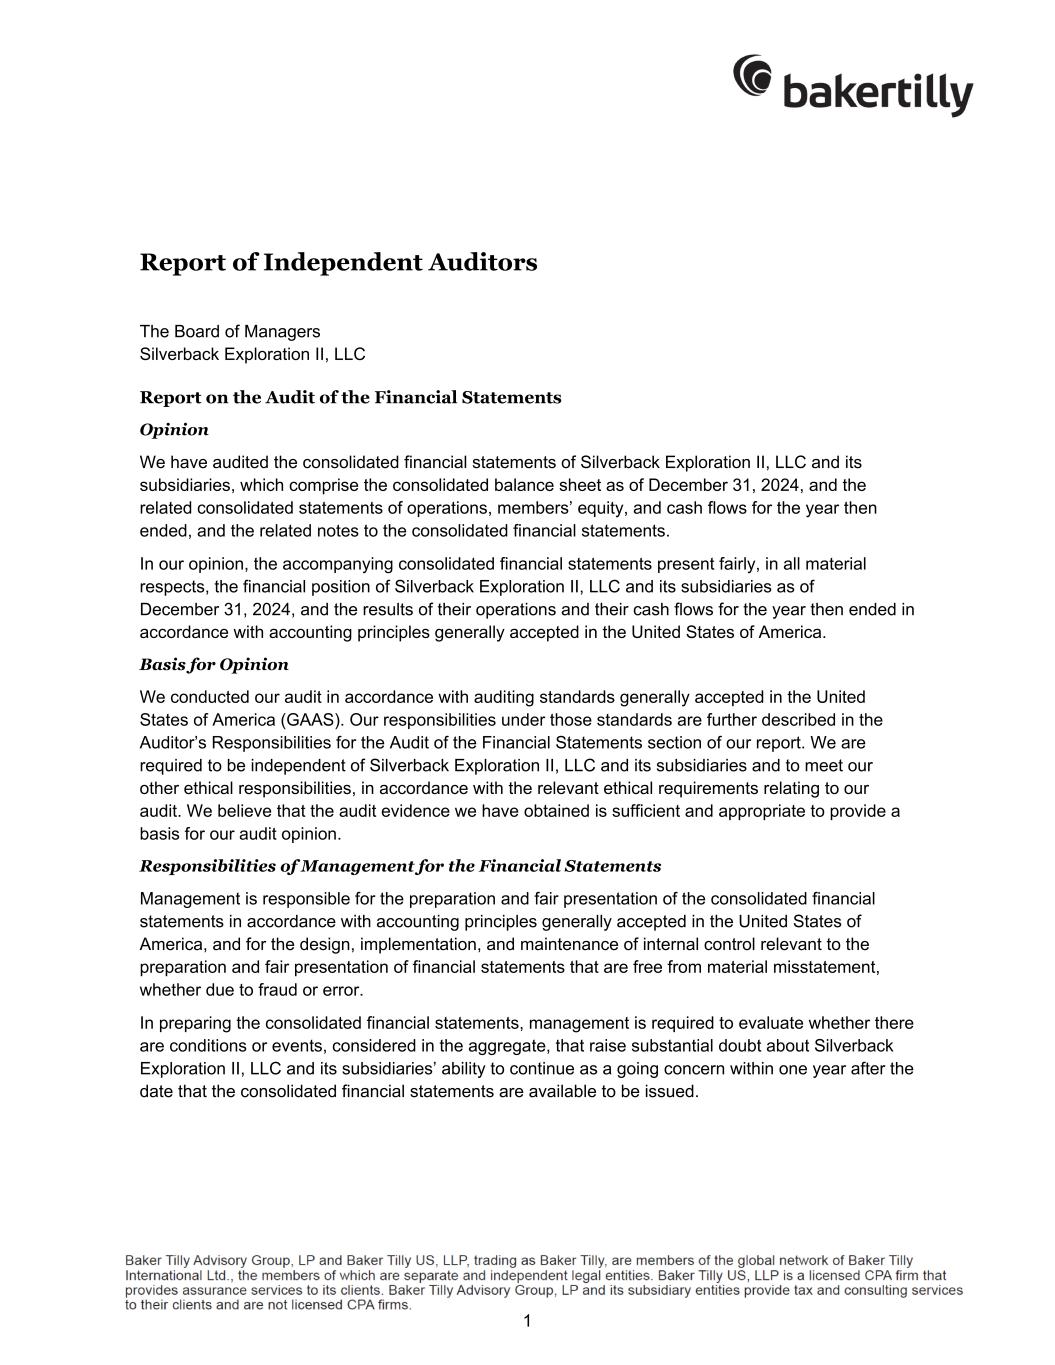
1 Report of Independent Auditors The Board of Managers Silverback Exploration II, LLC Report on the Audit of the Financial Statements Opinion We have audited the consolidated financial statements of Silverback Exploration II, LLC and its subsidiaries, which comprise the consolidated balance sheet as of December 31, 2024, and the related consolidated statements of operations, members’ equity, and cash flows for the year then ended, and the related notes to the consolidated financial statements. In our opinion, the accompanying consolidated financial statements present fairly, in all material respects, the financial position of Silverback Exploration II, LLC and its subsidiaries as of December 31, 2024, and the results of their operations and their cash flows for the year then ended in accordance with accounting principles generally accepted in the United States of America. Basis for Opinion We conducted our audit in accordance with auditing standards generally accepted in the United States of America (GAAS). Our responsibilities under those standards are further described in the Auditor’s Responsibilities for the Audit of the Financial Statements section of our report. We are required to be independent of Silverback Exploration II, LLC and its subsidiaries and to meet our other ethical responsibilities, in accordance with the relevant ethical requirements relating to our audit. We believe that the audit evidence we have obtained is sufficient and appropriate to provide a basis for our audit opinion. Responsibilities of Management for the Financial Statements Management is responsible for the preparation and fair presentation of the consolidated financial statements in accordance with accounting principles generally accepted in the United States of America, and for the design, implementation, and maintenance of internal control relevant to the preparation and fair presentation of financial statements that are free from material misstatement, whether due to fraud or error. In preparing the consolidated financial statements, management is required to evaluate whether there are conditions or events, considered in the aggregate, that raise substantial doubt about Silverback Exploration II, LLC and its subsidiaries’ ability to continue as a going concern within one year after the date that the consolidated financial statements are available to be issued.
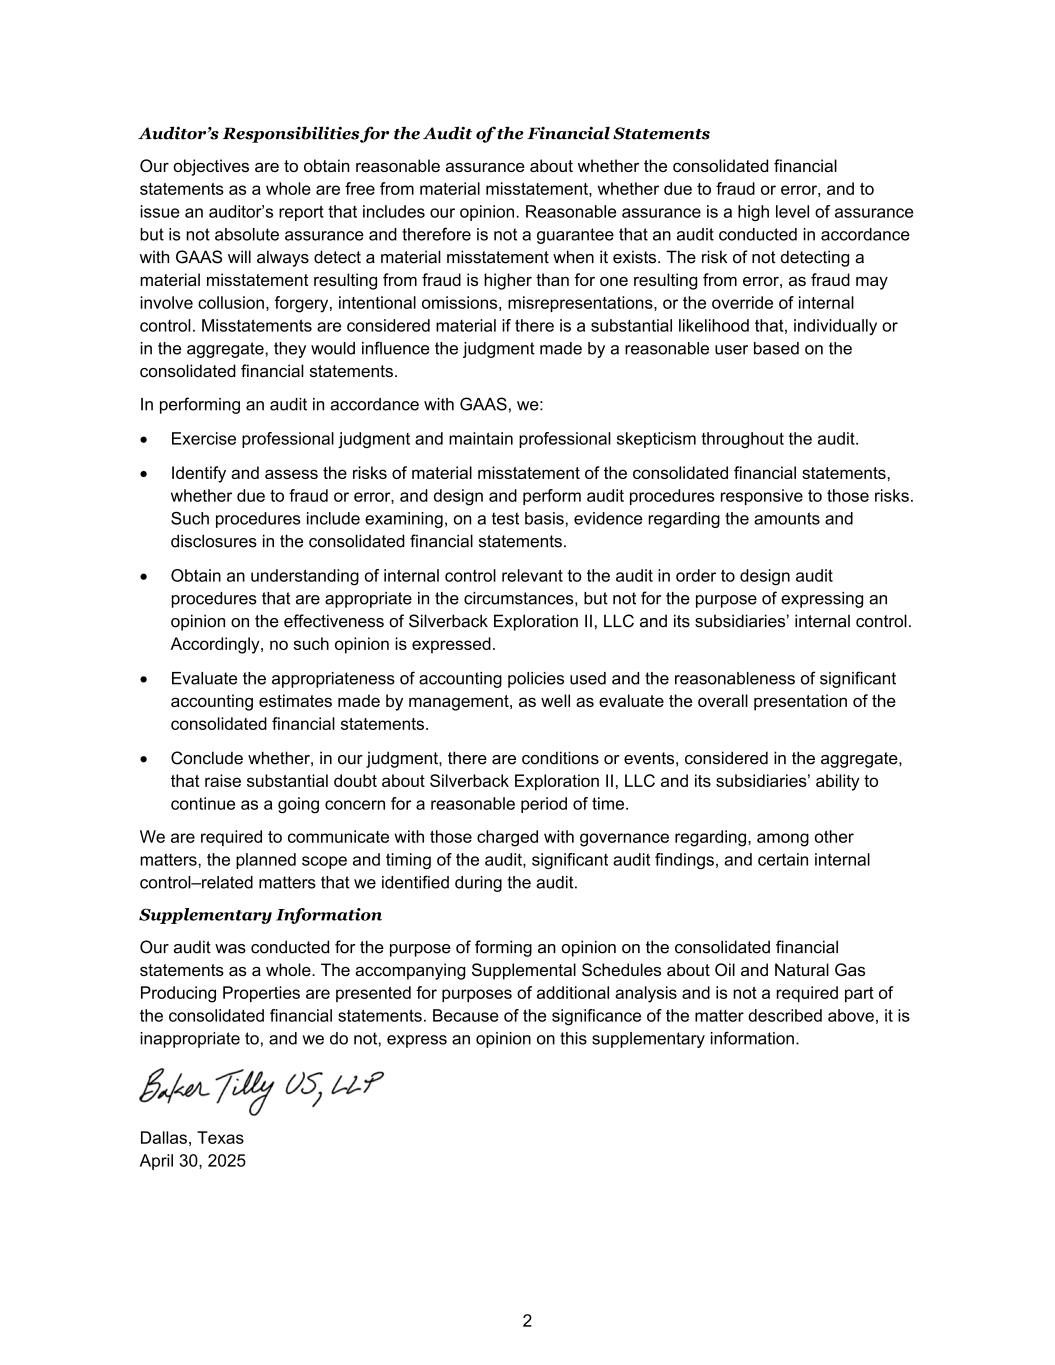
2 Auditor’s Responsibilities for the Audit of the Financial Statements Our objectives are to obtain reasonable assurance about whether the consolidated financial statements as a whole are free from material misstatement, whether due to fraud or error, and to issue an auditor’s report that includes our opinion. Reasonable assurance is a high level of assurance but is not absolute assurance and therefore is not a guarantee that an audit conducted in accordance with GAAS will always detect a material misstatement when it exists. The risk of not detecting a material misstatement resulting from fraud is higher than for one resulting from error, as fraud may involve collusion, forgery, intentional omissions, misrepresentations, or the override of internal control. Misstatements are considered material if there is a substantial likelihood that, individually or in the aggregate, they would influence the judgment made by a reasonable user based on the consolidated financial statements. In performing an audit in accordance with GAAS, we: Exercise professional judgment and maintain professional skepticism throughout the audit. Identify and assess the risks of material misstatement of the consolidated financial statements, whether due to fraud or error, and design and perform audit procedures responsive to those risks. Such procedures include examining, on a test basis, evidence regarding the amounts and disclosures in the consolidated financial statements. Obtain an understanding of internal control relevant to the audit in order to design audit procedures that are appropriate in the circumstances, but not for the purpose of expressing an opinion on the effectiveness of Silverback Exploration II, LLC and its subsidiaries’ internal control. Accordingly, no such opinion is expressed. Evaluate the appropriateness of accounting policies used and the reasonableness of significant accounting estimates made by management, as well as evaluate the overall presentation of the consolidated financial statements. Conclude whether, in our judgment, there are conditions or events, considered in the aggregate, that raise substantial doubt about Silverback Exploration II, LLC and its subsidiaries’ ability to continue as a going concern for a reasonable period of time. We are required to communicate with those charged with governance regarding, among other matters, the planned scope and timing of the audit, significant audit findings, and certain internal control–related matters that we identified during the audit. Supplementary Information Our audit was conducted for the purpose of forming an opinion on the consolidated financial statements as a whole. The accompanying Supplemental Schedules about Oil and Natural Gas Producing Properties are presented for purposes of additional analysis and is not a required part of the consolidated financial statements. Because of the significance of the matter described above, it is inappropriate to, and we do not, express an opinion on this supplementary information. Dallas, Texas April 30, 2025
Consolidated Financial Statements
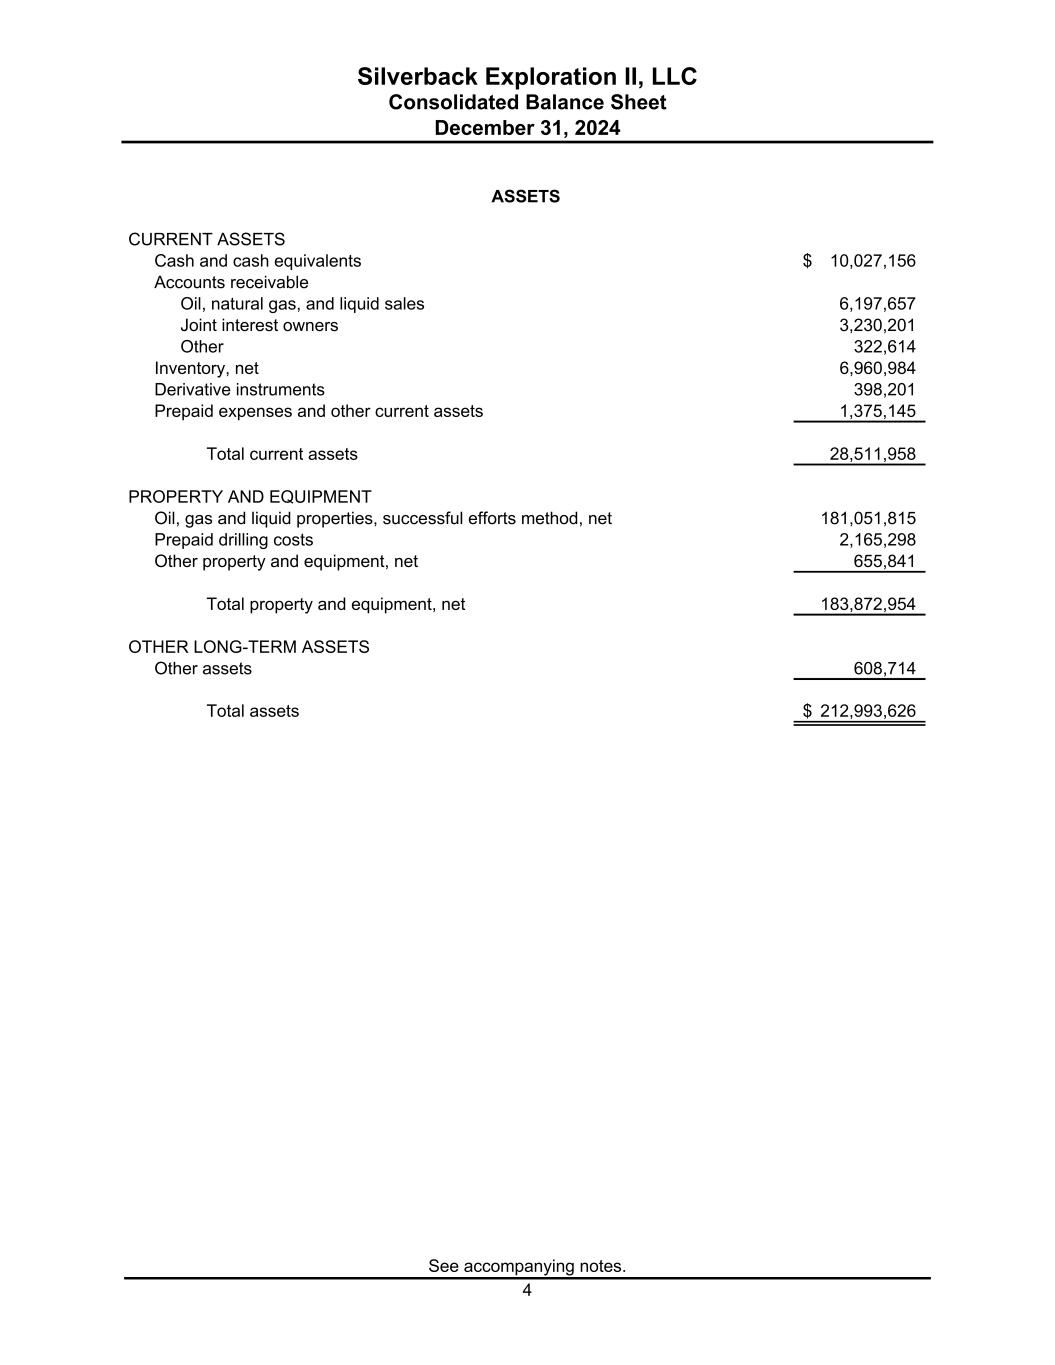
Silverback Exploration II, LLC See accompanying notes. 4 Consolidated Balance Sheet December 31, 2024 CURRENT ASSETS Cash and cash equivalents 10,027,156$ Accounts receivable Oil, natural gas, and liquid sales 6,197,657 Joint interest owners 3,230,201 Other 322,614 Inventory, net 6,960,984 Derivative instruments 398,201 Prepaid expenses and other current assets 1,375,145 Total current assets 28,511,958 PROPERTY AND EQUIPMENT Oil, gas and liquid properties, successful efforts method, net 181,051,815 Prepaid drilling costs 2,165,298 Other property and equipment, net 655,841 Total property and equipment, net 183,872,954 OTHER LONG-TERM ASSETS Other assets 608,714 Total assets 212,993,626$ ASSETS
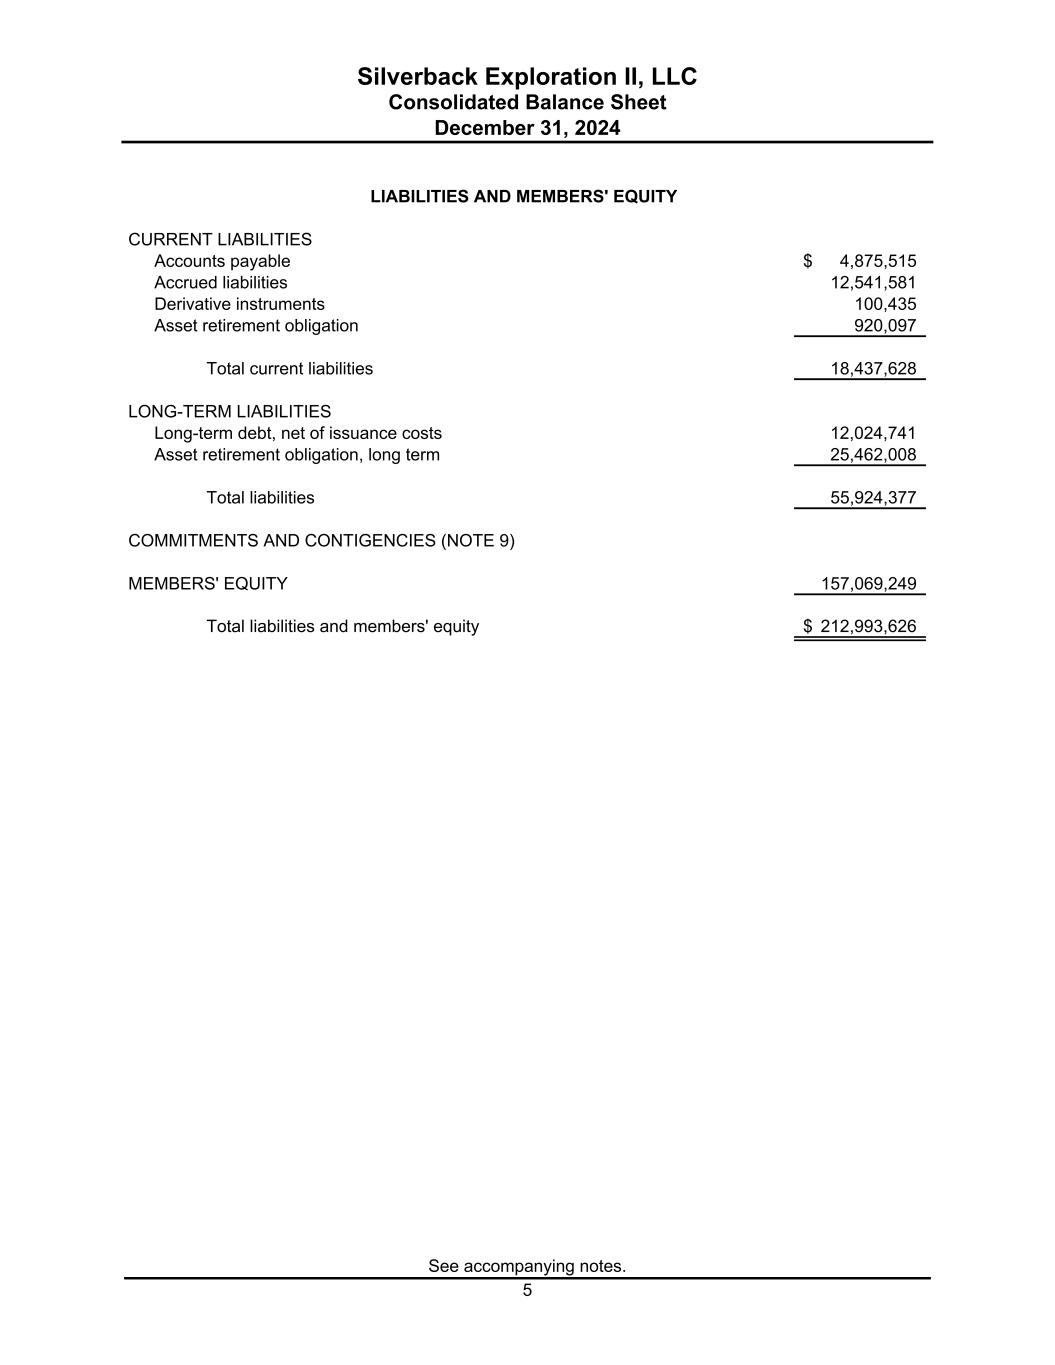
Silverback Exploration II, LLC Consolidated Balance Sheet December 31, 2024 See accompanying notes. 5 CURRENT LIABILITIES Accounts payable 4,875,515$ Accrued liabilities 12,541,581 Derivative instruments 100,435 Asset retirement obligation 920,097 Total current liabilities 18,437,628 LONG-TERM LIABILITIES Long-term debt, net of issuance costs 12,024,741 Asset retirement obligation, long term 25,462,008 Total liabilities 55,924,377 COMMITMENTS AND CONTIGENCIES (NOTE 9) MEMBERS' EQUITY 157,069,249 Total liabilities and members' equity 212,993,626$ LIABILITIES AND MEMBERS' EQUITY
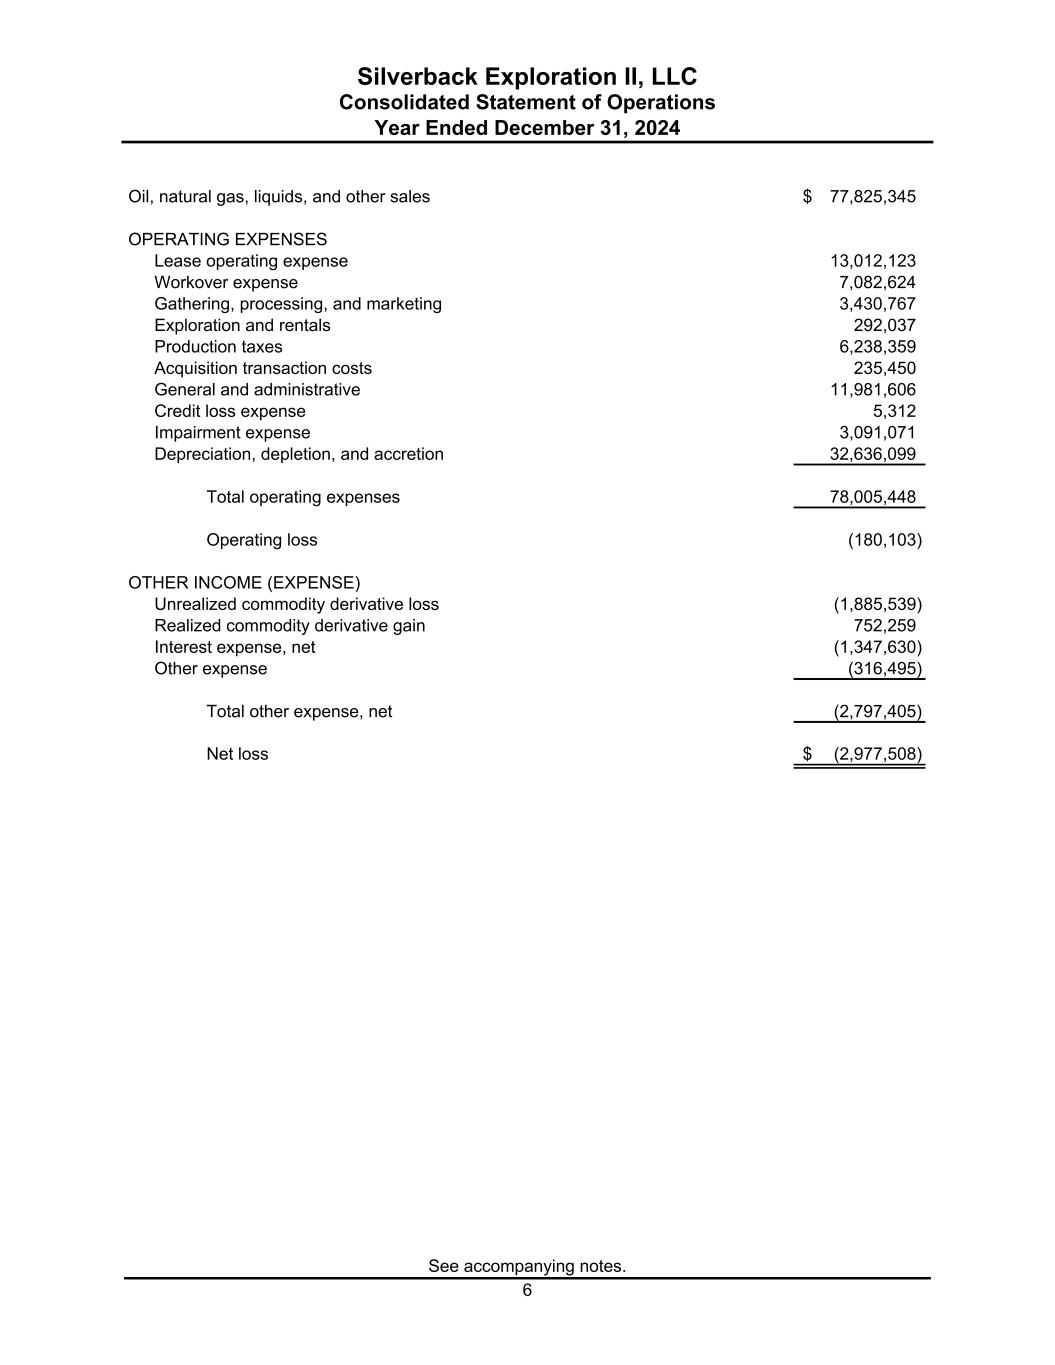
Silverback Exploration II, LLC See accompanying notes. 6 Consolidated Statement of Operations Year Ended December 31, 2024 Oil, natural gas, liquids, and other sales 77,825,345$ OPERATING EXPENSES Lease operating expense 13,012,123 Workover expense 7,082,624 Gathering, processing, and marketing 3,430,767 Exploration and rentals 292,037 Production taxes 6,238,359 Acquisition transaction costs 235,450 General and administrative 11,981,606 Credit loss expense 5,312 Impairment expense 3,091,071 Depreciation, depletion, and accretion 32,636,099 Total operating expenses 78,005,448 Operating loss (180,103) OTHER INCOME (EXPENSE) Unrealized commodity derivative loss (1,885,539) Realized commodity derivative gain 752,259 Interest expense, net (1,347,630) Other expense (316,495) Total other expense, net (2,797,405) Net loss (2,977,508)$
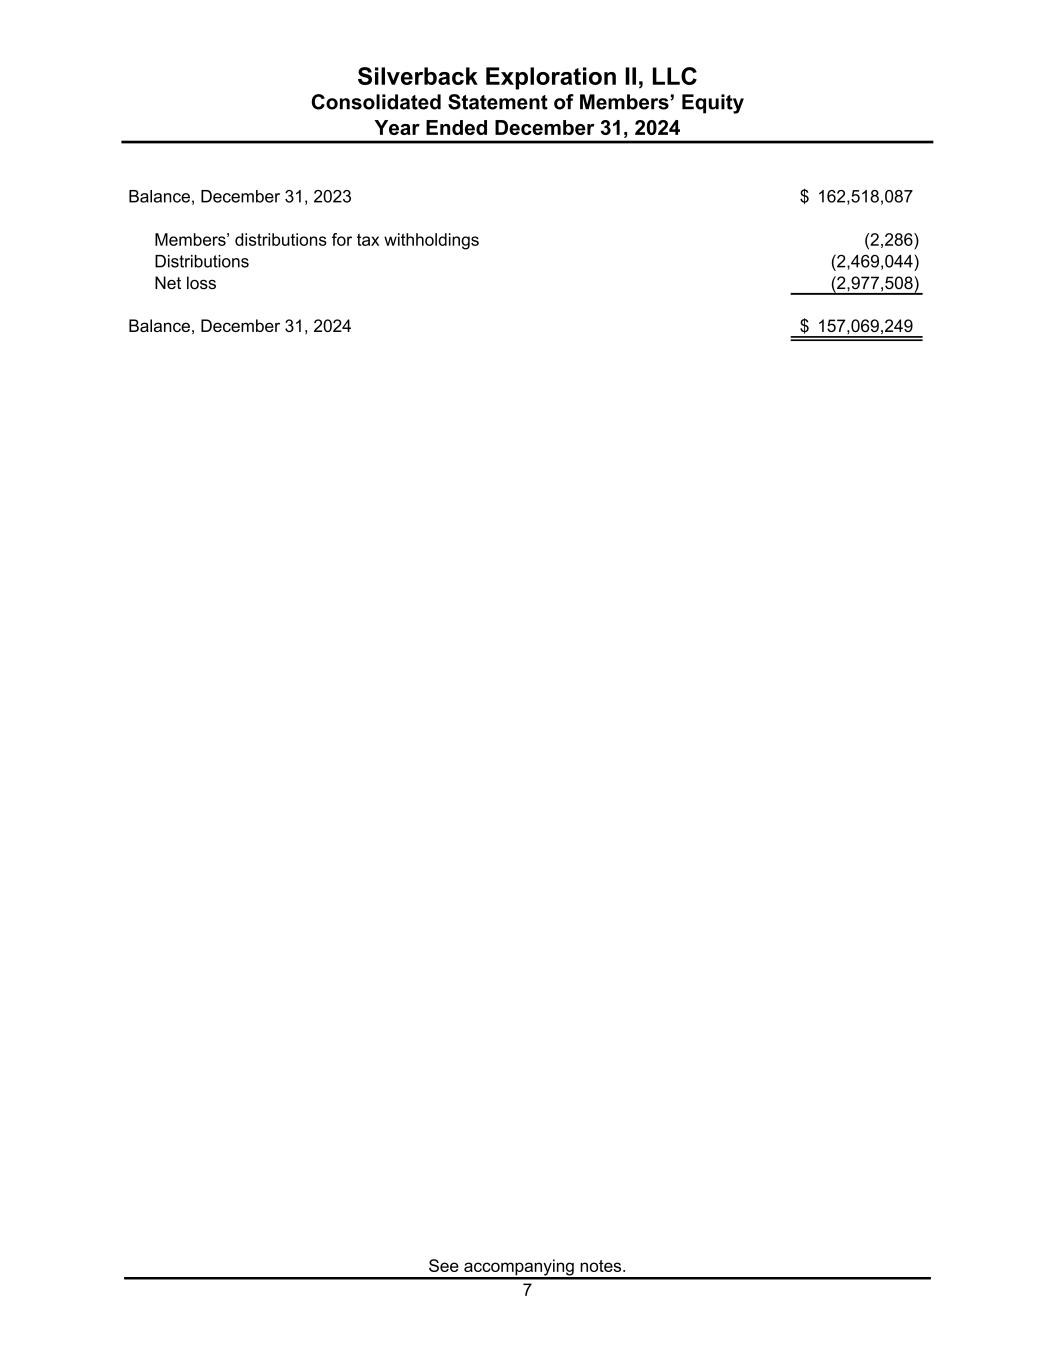
Silverback Exploration II, LLC See accompanying notes. 7 Consolidated Statement of Members’ Equity Year Ended December 31, 2024 Balance, December 31, 2023 162,518,087$ Members’ distributions for tax withholdings (2,286) Distributions (2,469,044) Net loss (2,977,508) Balance, December 31, 2024 157,069,249$
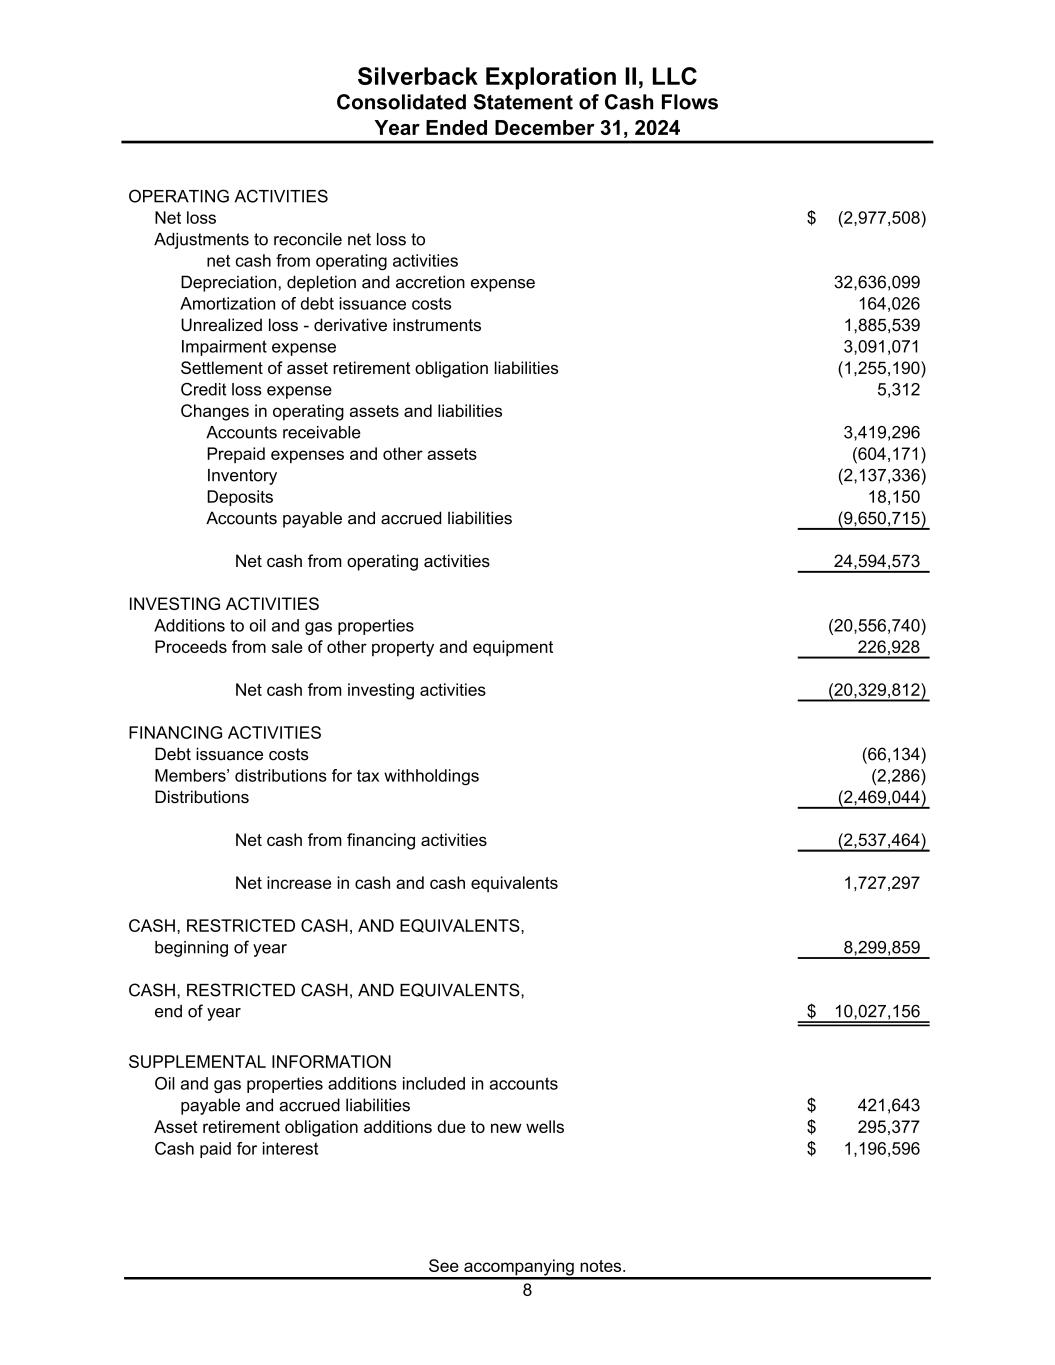
Silverback Exploration II, LLC See accompanying notes. 8 Consolidated Statement of Cash Flows Year Ended December 31, 2024 OPERATING ACTIVITIES Net loss (2,977,508)$ Adjustments to reconcile net loss to net cash from operating activities Depreciation, depletion and accretion expense 32,636,099 Amortization of debt issuance costs 164,026 Unrealized loss - derivative instruments 1,885,539 Impairment expense 3,091,071 Settlement of asset retirement obligation liabilities (1,255,190) Credit loss expense 5,312 Changes in operating assets and liabilities Accounts receivable 3,419,296 Prepaid expenses and other assets (604,171) Inventory (2,137,336) Deposits 18,150 Accounts payable and accrued liabilities (9,650,715) Net cash from operating activities 24,594,573 INVESTING ACTIVITIES Additions to oil and gas properties (20,556,740) Proceeds from sale of other property and equipment 226,928 Net cash from investing activities (20,329,812) FINANCING ACTIVITIES Debt issuance costs (66,134) Members’ distributions for tax withholdings (2,286) Distributions (2,469,044) Net cash from financing activities (2,537,464) Net increase in cash and cash equivalents 1,727,297 CASH, RESTRICTED CASH, AND EQUIVALENTS, beginning of year 8,299,859 CASH, RESTRICTED CASH, AND EQUIVALENTS, end of year 10,027,156$ SUPPLEMENTAL INFORMATION Oil and gas properties additions included in accounts payable and accrued liabilities 421,643$ Asset retirement obligation additions due to new wells 295,377$ Cash paid for interest 1,196,596$
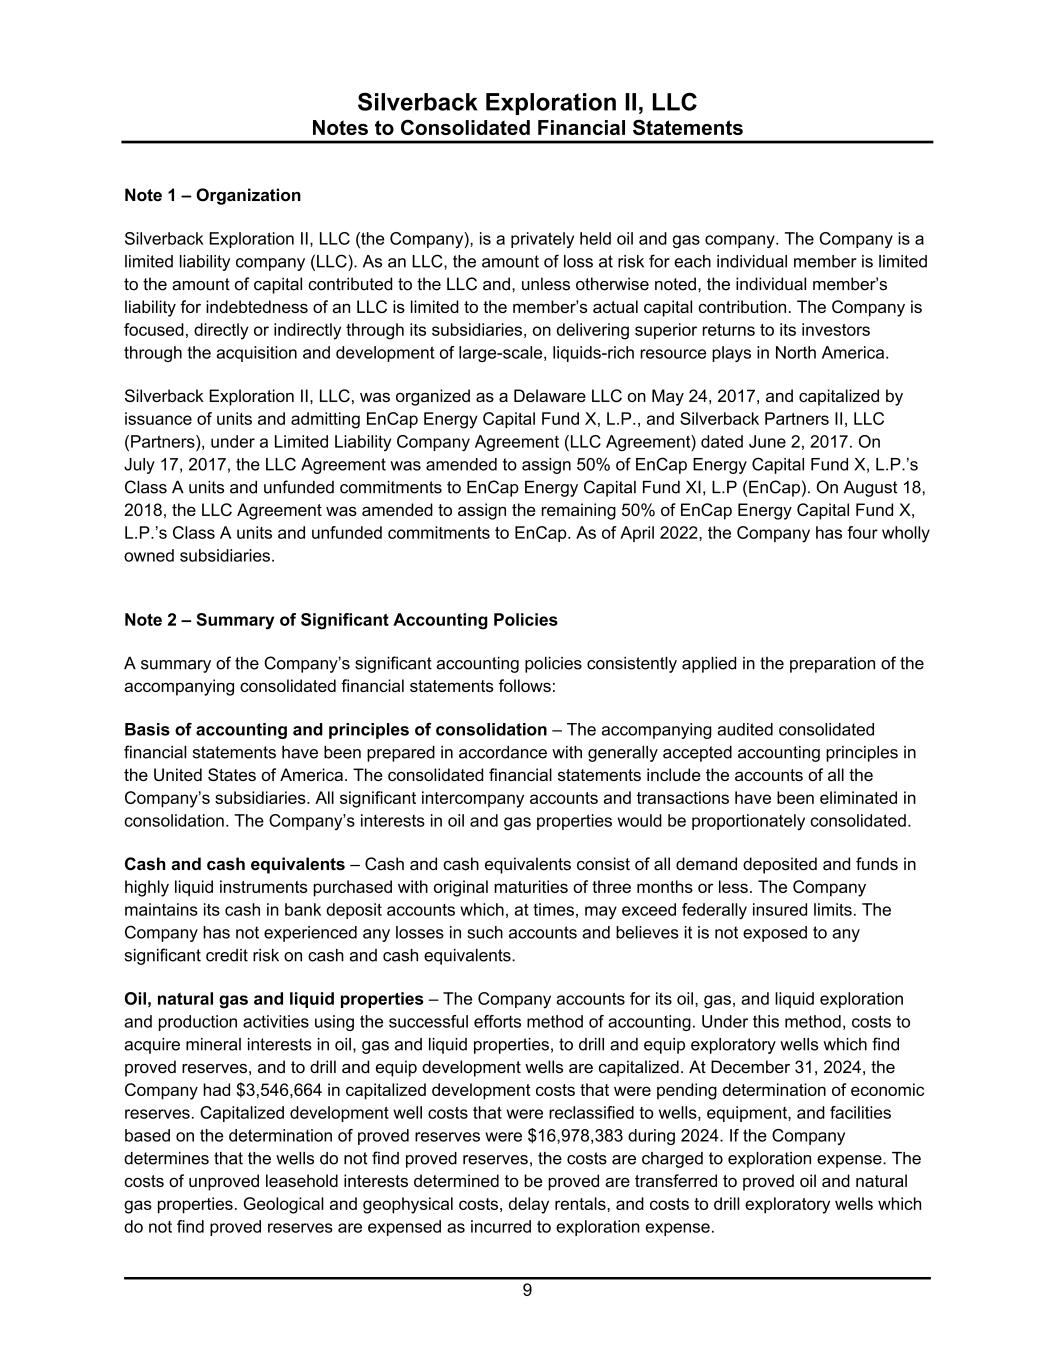
Silverback Exploration II, LLC 9 Notes to Consolidated Financial Statements Note 1 – Organization Silverback Exploration II, LLC (the Company), is a privately held oil and gas company. The Company is a limited liability company (LLC). As an LLC, the amount of loss at risk for each individual member is limited to the amount of capital contributed to the LLC and, unless otherwise noted, the individual member’s liability for indebtedness of an LLC is limited to the member’s actual capital contribution. The Company is focused, directly or indirectly through its subsidiaries, on delivering superior returns to its investors through the acquisition and development of large-scale, liquids-rich resource plays in North America. Silverback Exploration II, LLC, was organized as a Delaware LLC on May 24, 2017, and capitalized by issuance of units and admitting EnCap Energy Capital Fund X, L.P., and Silverback Partners II, LLC (Partners), under a Limited Liability Company Agreement (LLC Agreement) dated June 2, 2017. On July 17, 2017, the LLC Agreement was amended to assign 50% of EnCap Energy Capital Fund X, L.P.’s Class A units and unfunded commitments to EnCap Energy Capital Fund XI, L.P (EnCap). On August 18, 2018, the LLC Agreement was amended to assign the remaining 50% of EnCap Energy Capital Fund X, L.P.’s Class A units and unfunded commitments to EnCap. As of April 2022, the Company has four wholly owned subsidiaries. Note 2 – Summary of Significant Accounting Policies A summary of the Company’s significant accounting policies consistently applied in the preparation of the accompanying consolidated financial statements follows: Basis of accounting and principles of consolidation – The accompanying audited consolidated financial statements have been prepared in accordance with generally accepted accounting principles in the United States of America. The consolidated financial statements include the accounts of all the Company’s subsidiaries. All significant intercompany accounts and transactions have been eliminated in consolidation. The Company’s interests in oil and gas properties would be proportionately consolidated. Cash and cash equivalents – Cash and cash equivalents consist of all demand deposited and funds in highly liquid instruments purchased with original maturities of three months or less. The Company maintains its cash in bank deposit accounts which, at times, may exceed federally insured limits. The Company has not experienced any losses in such accounts and believes it is not exposed to any significant credit risk on cash and cash equivalents. Oil, natural gas and liquid properties – The Company accounts for its oil, gas, and liquid exploration and production activities using the successful efforts method of accounting. Under this method, costs to acquire mineral interests in oil, gas and liquid properties, to drill and equip exploratory wells which find proved reserves, and to drill and equip development wells are capitalized. At December 31, 2024, the Company had $3,546,664 in capitalized development costs that were pending determination of economic reserves. Capitalized development well costs that were reclassified to wells, equipment, and facilities based on the determination of proved reserves were $16,978,383 during 2024. If the Company determines that the wells do not find proved reserves, the costs are charged to exploration expense. The costs of unproved leasehold interests determined to be proved are transferred to proved oil and natural gas properties. Geological and geophysical costs, delay rentals, and costs to drill exploratory wells which do not find proved reserves are expensed as incurred to exploration expense.
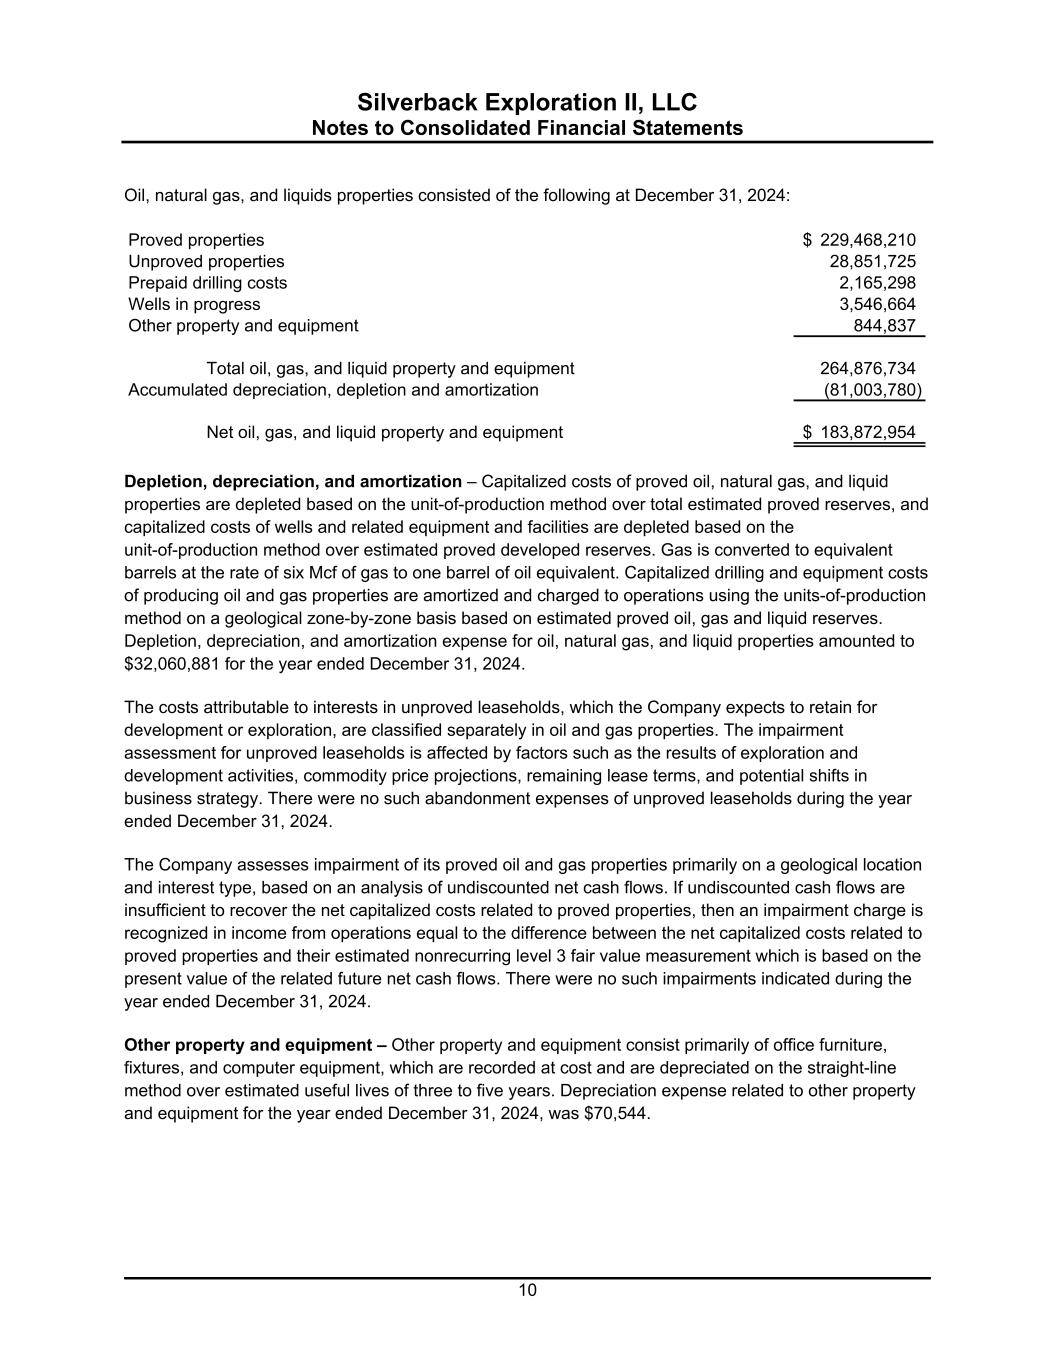
Silverback Exploration II, LLC Notes to Consolidated Financial Statements 10 Oil, natural gas, and liquids properties consisted of the following at December 31, 2024: Proved properties 229,468,210$ Unproved properties 28,851,725 Prepaid drilling costs 2,165,298 Wells in progress 3,546,664 Other property and equipment 844,837 Total oil, gas, and liquid property and equipment 264,876,734 Accumulated depreciation, depletion and amortization (81,003,780) Net oil, gas, and liquid property and equipment 183,872,954$ Depletion, depreciation, and amortization – Capitalized costs of proved oil, natural gas, and liquid properties are depleted based on the unit-of-production method over total estimated proved reserves, and capitalized costs of wells and related equipment and facilities are depleted based on the unit-of-production method over estimated proved developed reserves. Gas is converted to equivalent barrels at the rate of six Mcf of gas to one barrel of oil equivalent. Capitalized drilling and equipment costs of producing oil and gas properties are amortized and charged to operations using the units-of-production method on a geological zone-by-zone basis based on estimated proved oil, gas and liquid reserves. Depletion, depreciation, and amortization expense for oil, natural gas, and liquid properties amounted to $32,060,881 for the year ended December 31, 2024. The costs attributable to interests in unproved leaseholds, which the Company expects to retain for development or exploration, are classified separately in oil and gas properties. The impairment assessment for unproved leaseholds is affected by factors such as the results of exploration and development activities, commodity price projections, remaining lease terms, and potential shifts in business strategy. There were no such abandonment expenses of unproved leaseholds during the year ended December 31, 2024. The Company assesses impairment of its proved oil and gas properties primarily on a geological location and interest type, based on an analysis of undiscounted net cash flows. If undiscounted cash flows are insufficient to recover the net capitalized costs related to proved properties, then an impairment charge is recognized in income from operations equal to the difference between the net capitalized costs related to proved properties and their estimated nonrecurring level 3 fair value measurement which is based on the present value of the related future net cash flows. There were no such impairments indicated during the year ended December 31, 2024. Other property and equipment – Other property and equipment consist primarily of office furniture, fixtures, and computer equipment, which are recorded at cost and are depreciated on the straight-line method over estimated useful lives of three to five years. Depreciation expense related to other property and equipment for the year ended December 31, 2024, was $70,544.
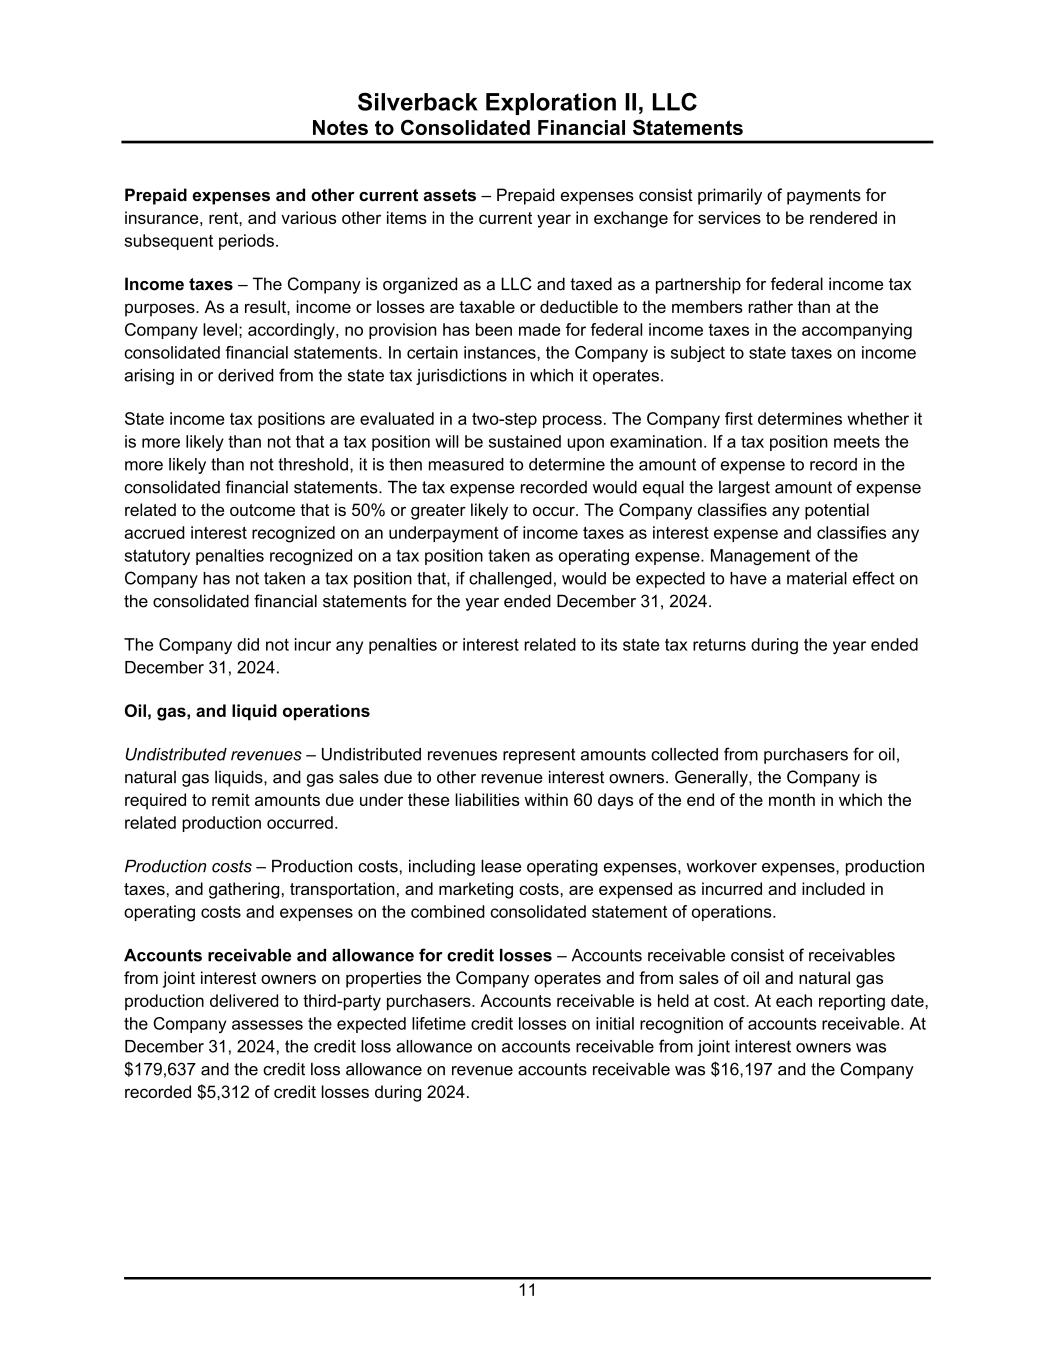
Silverback Exploration II, LLC Notes to Consolidated Financial Statements 11 Prepaid expenses and other current assets – Prepaid expenses consist primarily of payments for insurance, rent, and various other items in the current year in exchange for services to be rendered in subsequent periods. Income taxes – The Company is organized as a LLC and taxed as a partnership for federal income tax purposes. As a result, income or losses are taxable or deductible to the members rather than at the Company level; accordingly, no provision has been made for federal income taxes in the accompanying consolidated financial statements. In certain instances, the Company is subject to state taxes on income arising in or derived from the state tax jurisdictions in which it operates. State income tax positions are evaluated in a two-step process. The Company first determines whether it is more likely than not that a tax position will be sustained upon examination. If a tax position meets the more likely than not threshold, it is then measured to determine the amount of expense to record in the consolidated financial statements. The tax expense recorded would equal the largest amount of expense related to the outcome that is 50% or greater likely to occur. The Company classifies any potential accrued interest recognized on an underpayment of income taxes as interest expense and classifies any statutory penalties recognized on a tax position taken as operating expense. Management of the Company has not taken a tax position that, if challenged, would be expected to have a material effect on the consolidated financial statements for the year ended December 31, 2024. The Company did not incur any penalties or interest related to its state tax returns during the year ended December 31, 2024. Oil, gas, and liquid operations Undistributed revenues – Undistributed revenues represent amounts collected from purchasers for oil, natural gas liquids, and gas sales due to other revenue interest owners. Generally, the Company is required to remit amounts due under these liabilities within 60 days of the end of the month in which the related production occurred. Production costs – Production costs, including lease operating expenses, workover expenses, production taxes, and gathering, transportation, and marketing costs, are expensed as incurred and included in operating costs and expenses on the combined consolidated statement of operations. Accounts receivable and allowance for credit losses – Accounts receivable consist of receivables from joint interest owners on properties the Company operates and from sales of oil and natural gas production delivered to third-party purchasers. Accounts receivable is held at cost. At each reporting date, the Company assesses the expected lifetime credit losses on initial recognition of accounts receivable. At December 31, 2024, the credit loss allowance on accounts receivable from joint interest owners was $179,637 and the credit loss allowance on revenue accounts receivable was $16,197 and the Company recorded $5,312 of credit losses during 2024.
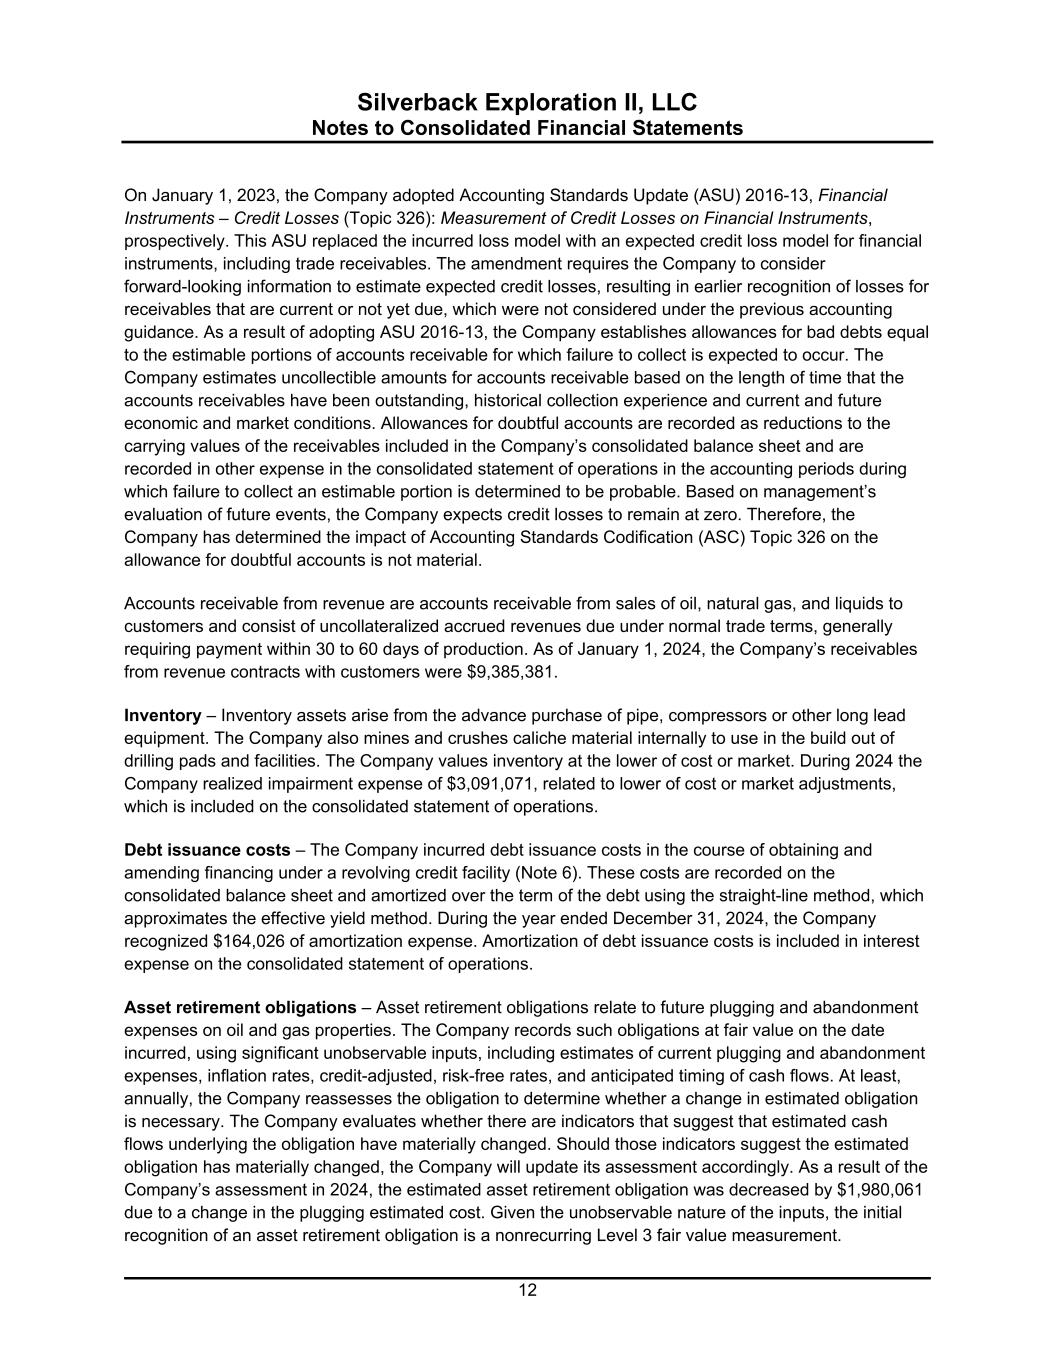
Silverback Exploration II, LLC Notes to Consolidated Financial Statements 12 On January 1, 2023, the Company adopted Accounting Standards Update (ASU) 2016-13, Financial Instruments – Credit Losses (Topic 326): Measurement of Credit Losses on Financial Instruments, prospectively. This ASU replaced the incurred loss model with an expected credit loss model for financial instruments, including trade receivables. The amendment requires the Company to consider forward-looking information to estimate expected credit losses, resulting in earlier recognition of losses for receivables that are current or not yet due, which were not considered under the previous accounting guidance. As a result of adopting ASU 2016-13, the Company establishes allowances for bad debts equal to the estimable portions of accounts receivable for which failure to collect is expected to occur. The Company estimates uncollectible amounts for accounts receivable based on the length of time that the accounts receivables have been outstanding, historical collection experience and current and future economic and market conditions. Allowances for doubtful accounts are recorded as reductions to the carrying values of the receivables included in the Company’s consolidated balance sheet and are recorded in other expense in the consolidated statement of operations in the accounting periods during which failure to collect an estimable portion is determined to be probable. Based on management’s evaluation of future events, the Company expects credit losses to remain at zero. Therefore, the Company has determined the impact of Accounting Standards Codification (ASC) Topic 326 on the allowance for doubtful accounts is not material. Accounts receivable from revenue are accounts receivable from sales of oil, natural gas, and liquids to customers and consist of uncollateralized accrued revenues due under normal trade terms, generally requiring payment within 30 to 60 days of production. As of January 1, 2024, the Company’s receivables from revenue contracts with customers were $9,385,381. Inventory – Inventory assets arise from the advance purchase of pipe, compressors or other long lead equipment. The Company also mines and crushes caliche material internally to use in the build out of drilling pads and facilities. The Company values inventory at the lower of cost or market. During 2024 the Company realized impairment expense of $3,091,071, related to lower of cost or market adjustments, which is included on the consolidated statement of operations. Debt issuance costs – The Company incurred debt issuance costs in the course of obtaining and amending financing under a revolving credit facility (Note 6). These costs are recorded on the consolidated balance sheet and amortized over the term of the debt using the straight-line method, which approximates the effective yield method. During the year ended December 31, 2024, the Company recognized $164,026 of amortization expense. Amortization of debt issuance costs is included in interest expense on the consolidated statement of operations. Asset retirement obligations – Asset retirement obligations relate to future plugging and abandonment expenses on oil and gas properties. The Company records such obligations at fair value on the date incurred, using significant unobservable inputs, including estimates of current plugging and abandonment expenses, inflation rates, credit-adjusted, risk-free rates, and anticipated timing of cash flows. At least, annually, the Company reassesses the obligation to determine whether a change in estimated obligation is necessary. The Company evaluates whether there are indicators that suggest that estimated cash flows underlying the obligation have materially changed. Should those indicators suggest the estimated obligation has materially changed, the Company will update its assessment accordingly. As a result of the Company’s assessment in 2024, the estimated asset retirement obligation was decreased by $1,980,061 due to a change in the plugging estimated cost. Given the unobservable nature of the inputs, the initial recognition of an asset retirement obligation is a nonrecurring Level 3 fair value measurement.
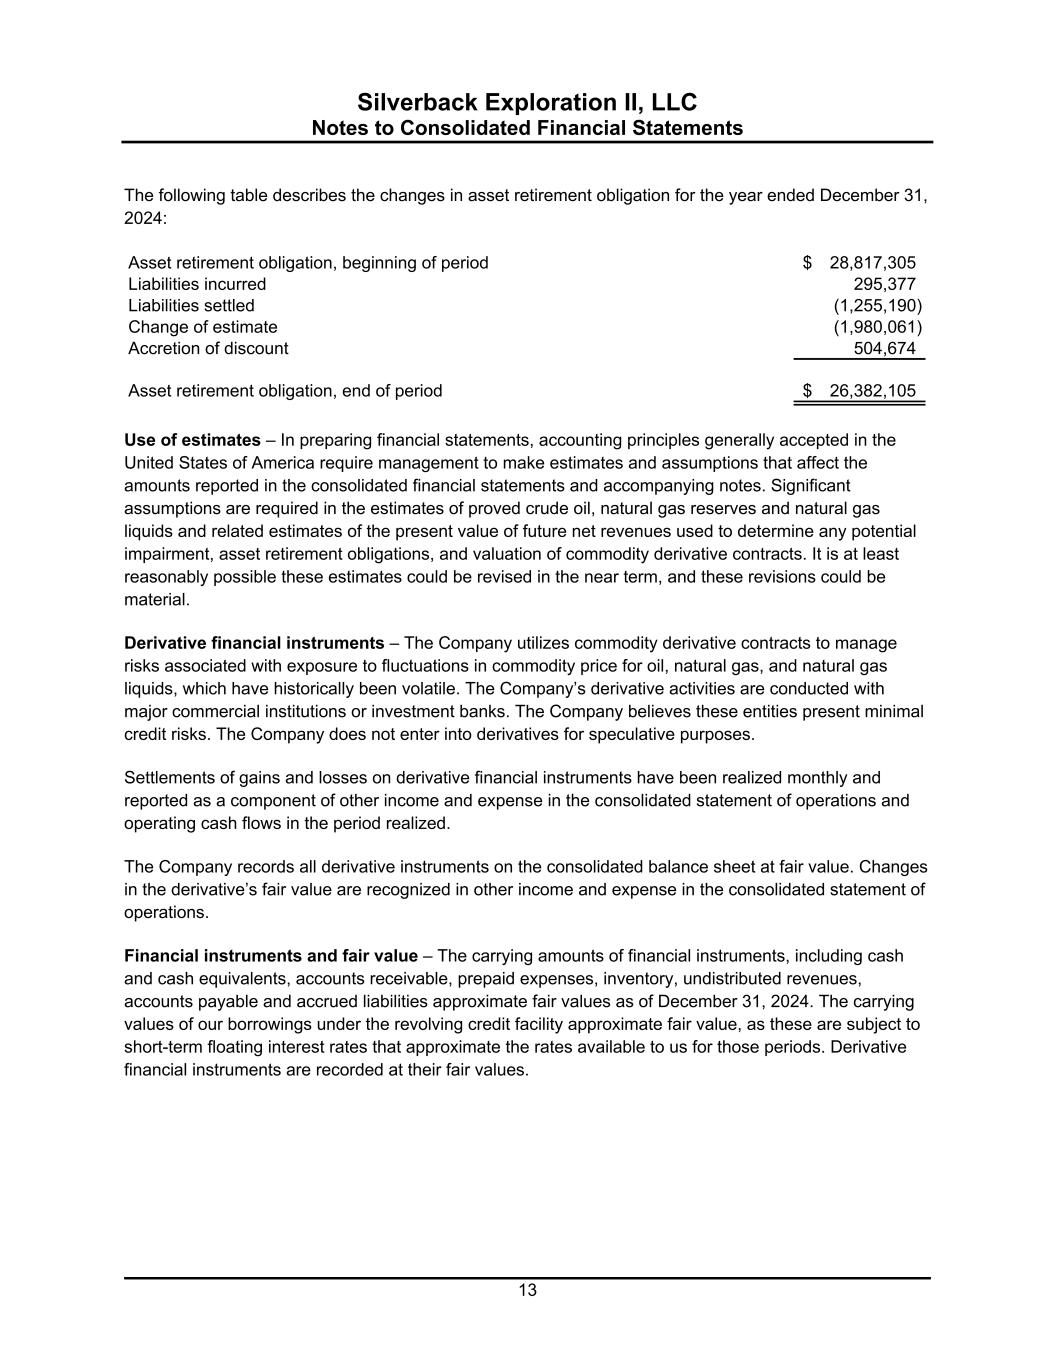
Silverback Exploration II, LLC Notes to Consolidated Financial Statements 13 The following table describes the changes in asset retirement obligation for the year ended December 31, 2024: Asset retirement obligation, beginning of period 28,817,305$ Liabilities incurred 295,377 Liabilities settled (1,255,190) Change of estimate (1,980,061) Accretion of discount 504,674 Asset retirement obligation, end of period 26,382,105$ Use of estimates – In preparing financial statements, accounting principles generally accepted in the United States of America require management to make estimates and assumptions that affect the amounts reported in the consolidated financial statements and accompanying notes. Significant assumptions are required in the estimates of proved crude oil, natural gas reserves and natural gas liquids and related estimates of the present value of future net revenues used to determine any potential impairment, asset retirement obligations, and valuation of commodity derivative contracts. It is at least reasonably possible these estimates could be revised in the near term, and these revisions could be material. Derivative financial instruments – The Company utilizes commodity derivative contracts to manage risks associated with exposure to fluctuations in commodity price for oil, natural gas, and natural gas liquids, which have historically been volatile. The Company’s derivative activities are conducted with major commercial institutions or investment banks. The Company believes these entities present minimal credit risks. The Company does not enter into derivatives for speculative purposes. Settlements of gains and losses on derivative financial instruments have been realized monthly and reported as a component of other income and expense in the consolidated statement of operations and operating cash flows in the period realized. The Company records all derivative instruments on the consolidated balance sheet at fair value. Changes in the derivative’s fair value are recognized in other income and expense in the consolidated statement of operations. Financial instruments and fair value – The carrying amounts of financial instruments, including cash and cash equivalents, accounts receivable, prepaid expenses, inventory, undistributed revenues, accounts payable and accrued liabilities approximate fair values as of December 31, 2024. The carrying values of our borrowings under the revolving credit facility approximate fair value, as these are subject to short-term floating interest rates that approximate the rates available to us for those periods. Derivative financial instruments are recorded at their fair values.
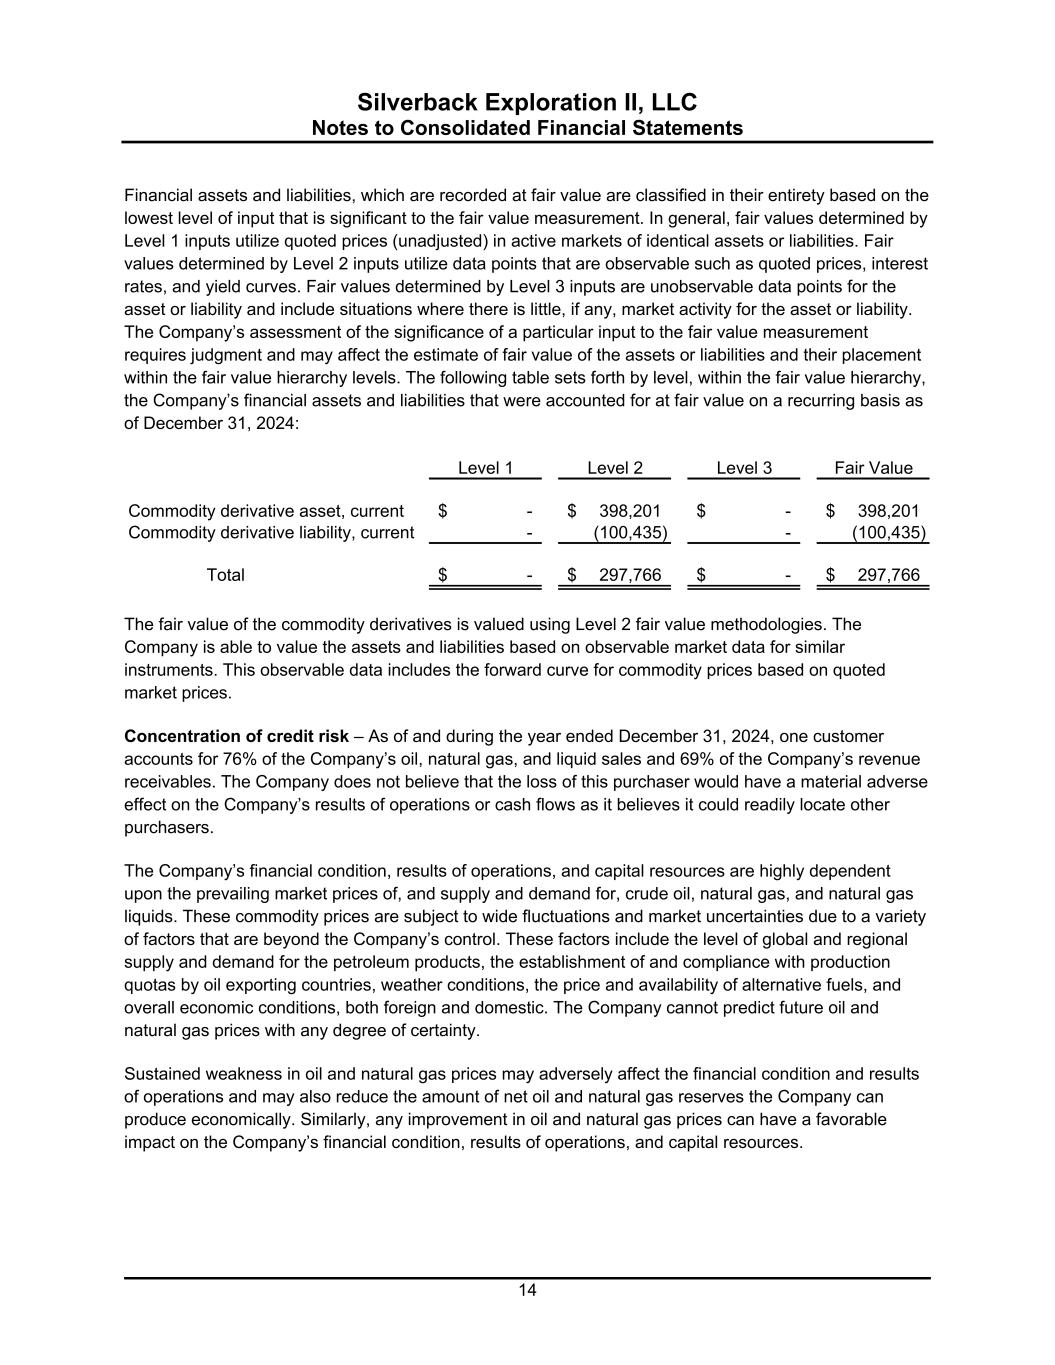
Silverback Exploration II, LLC Notes to Consolidated Financial Statements 14 Financial assets and liabilities, which are recorded at fair value are classified in their entirety based on the lowest level of input that is significant to the fair value measurement. In general, fair values determined by Level 1 inputs utilize quoted prices (unadjusted) in active markets of identical assets or liabilities. Fair values determined by Level 2 inputs utilize data points that are observable such as quoted prices, interest rates, and yield curves. Fair values determined by Level 3 inputs are unobservable data points for the asset or liability and include situations where there is little, if any, market activity for the asset or liability. The Company’s assessment of the significance of a particular input to the fair value measurement requires judgment and may affect the estimate of fair value of the assets or liabilities and their placement within the fair value hierarchy levels. The following table sets forth by level, within the fair value hierarchy, the Company’s financial assets and liabilities that were accounted for at fair value on a recurring basis as of December 31, 2024: Level 1 Level 2 Level 3 Fair Value Commodity derivative asset, current -$ 398,201$ -$ 398,201$ Commodity derivative liability, current - (100,435) - (100,435) Total -$ 297,766$ -$ 297,766$ The fair value of the commodity derivatives is valued using Level 2 fair value methodologies. The Company is able to value the assets and liabilities based on observable market data for similar instruments. This observable data includes the forward curve for commodity prices based on quoted market prices. Concentration of credit risk – As of and during the year ended December 31, 2024, one customer accounts for 76% of the Company’s oil, natural gas, and liquid sales and 69% of the Company’s revenue receivables. The Company does not believe that the loss of this purchaser would have a material adverse effect on the Company’s results of operations or cash flows as it believes it could readily locate other purchasers. The Company’s financial condition, results of operations, and capital resources are highly dependent upon the prevailing market prices of, and supply and demand for, crude oil, natural gas, and natural gas liquids. These commodity prices are subject to wide fluctuations and market uncertainties due to a variety of factors that are beyond the Company’s control. These factors include the level of global and regional supply and demand for the petroleum products, the establishment of and compliance with production quotas by oil exporting countries, weather conditions, the price and availability of alternative fuels, and overall economic conditions, both foreign and domestic. The Company cannot predict future oil and natural gas prices with any degree of certainty. Sustained weakness in oil and natural gas prices may adversely affect the financial condition and results of operations and may also reduce the amount of net oil and natural gas reserves the Company can produce economically. Similarly, any improvement in oil and natural gas prices can have a favorable impact on the Company’s financial condition, results of operations, and capital resources.
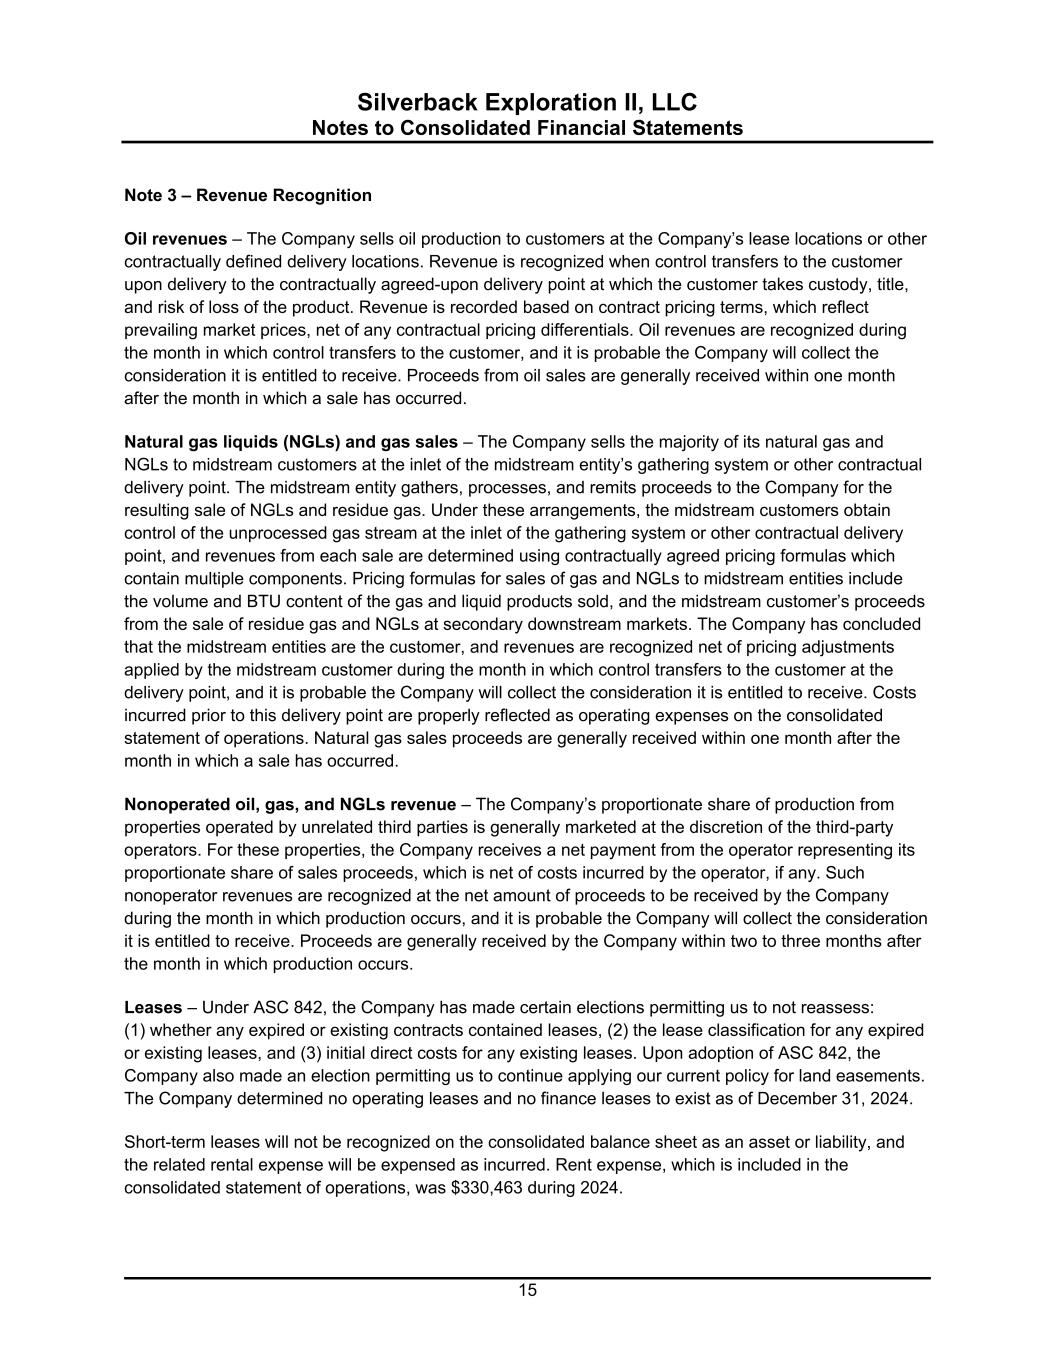
Silverback Exploration II, LLC Notes to Consolidated Financial Statements 15 Note 3 – Revenue Recognition Oil revenues – The Company sells oil production to customers at the Company’s lease locations or other contractually defined delivery locations. Revenue is recognized when control transfers to the customer upon delivery to the contractually agreed-upon delivery point at which the customer takes custody, title, and risk of loss of the product. Revenue is recorded based on contract pricing terms, which reflect prevailing market prices, net of any contractual pricing differentials. Oil revenues are recognized during the month in which control transfers to the customer, and it is probable the Company will collect the consideration it is entitled to receive. Proceeds from oil sales are generally received within one month after the month in which a sale has occurred. Natural gas liquids (NGLs) and gas sales – The Company sells the majority of its natural gas and NGLs to midstream customers at the inlet of the midstream entity’s gathering system or other contractual delivery point. The midstream entity gathers, processes, and remits proceeds to the Company for the resulting sale of NGLs and residue gas. Under these arrangements, the midstream customers obtain control of the unprocessed gas stream at the inlet of the gathering system or other contractual delivery point, and revenues from each sale are determined using contractually agreed pricing formulas which contain multiple components. Pricing formulas for sales of gas and NGLs to midstream entities include the volume and BTU content of the gas and liquid products sold, and the midstream customer’s proceeds from the sale of residue gas and NGLs at secondary downstream markets. The Company has concluded that the midstream entities are the customer, and revenues are recognized net of pricing adjustments applied by the midstream customer during the month in which control transfers to the customer at the delivery point, and it is probable the Company will collect the consideration it is entitled to receive. Costs incurred prior to this delivery point are properly reflected as operating expenses on the consolidated statement of operations. Natural gas sales proceeds are generally received within one month after the month in which a sale has occurred. Nonoperated oil, gas, and NGLs revenue – The Company’s proportionate share of production from properties operated by unrelated third parties is generally marketed at the discretion of the third-party operators. For these properties, the Company receives a net payment from the operator representing its proportionate share of sales proceeds, which is net of costs incurred by the operator, if any. Such nonoperator revenues are recognized at the net amount of proceeds to be received by the Company during the month in which production occurs, and it is probable the Company will collect the consideration it is entitled to receive. Proceeds are generally received by the Company within two to three months after the month in which production occurs. Leases – Under ASC 842, the Company has made certain elections permitting us to not reassess: (1) whether any expired or existing contracts contained leases, (2) the lease classification for any expired or existing leases, and (3) initial direct costs for any existing leases. Upon adoption of ASC 842, the Company also made an election permitting us to continue applying our current policy for land easements. The Company determined no operating leases and no finance leases to exist as of December 31, 2024. Short-term leases will not be recognized on the consolidated balance sheet as an asset or liability, and the related rental expense will be expensed as incurred. Rent expense, which is included in the consolidated statement of operations, was $330,463 during 2024.
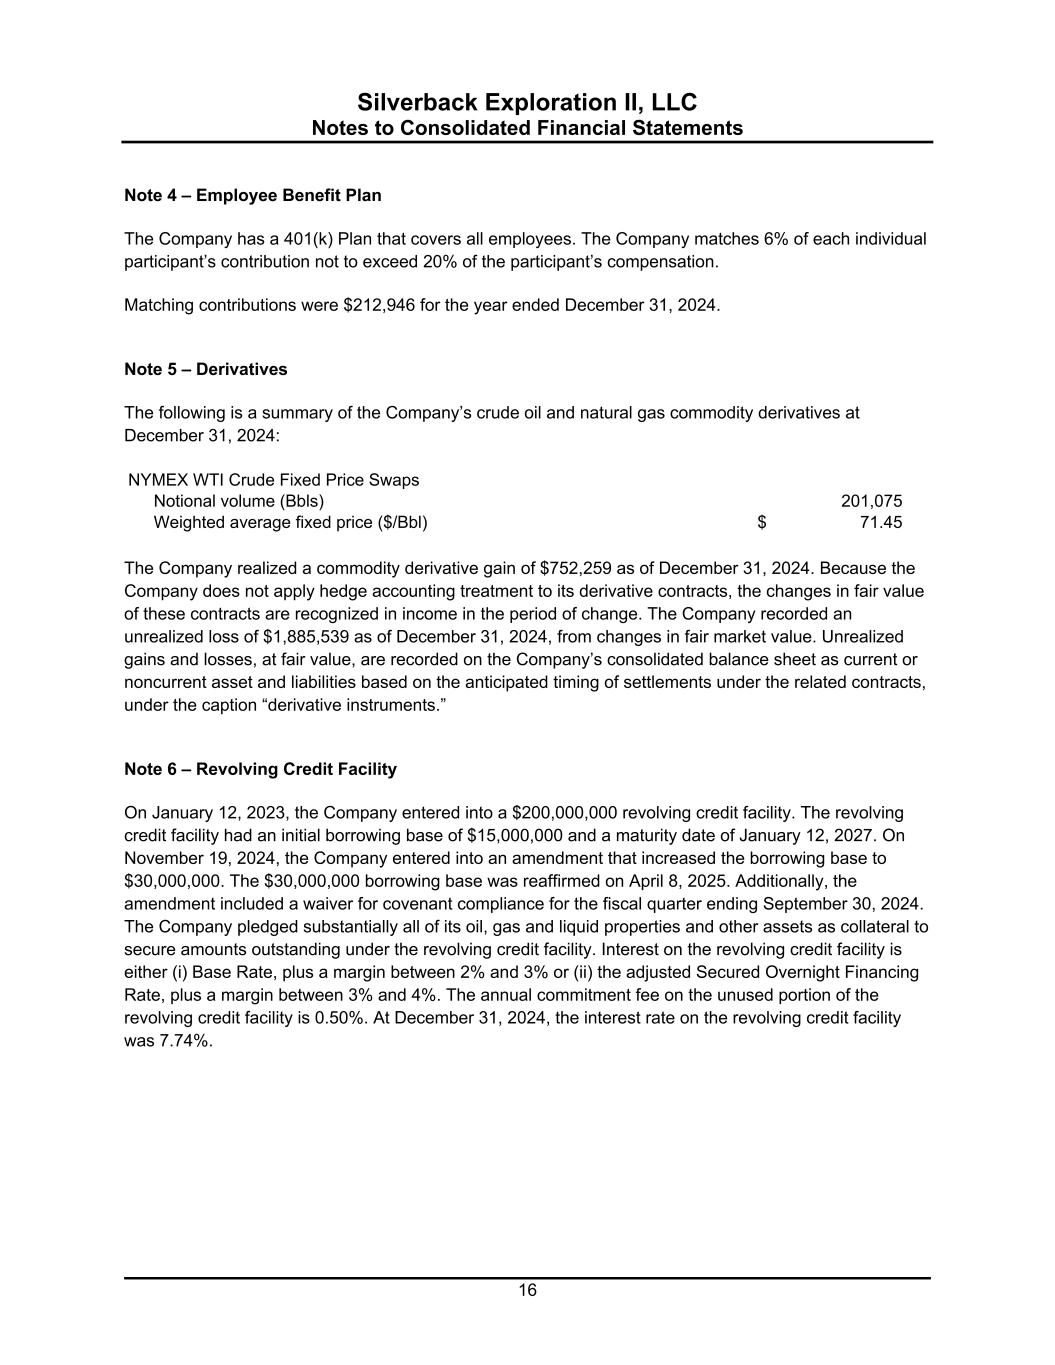
Silverback Exploration II, LLC Notes to Consolidated Financial Statements 16 Note 4 – Employee Benefit Plan The Company has a 401(k) Plan that covers all employees. The Company matches 6% of each individual participant’s contribution not to exceed 20% of the participant’s compensation. Matching contributions were $212,946 for the year ended December 31, 2024. Note 5 – Derivatives The following is a summary of the Company’s crude oil and natural gas commodity derivatives at December 31, 2024: NYMEX WTI Crude Fixed Price Swaps Notional volume (Bbls) 201,075 Weighted average fixed price ($/Bbl) 71.45$ The Company realized a commodity derivative gain of $752,259 as of December 31, 2024. Because the Company does not apply hedge accounting treatment to its derivative contracts, the changes in fair value of these contracts are recognized in income in the period of change. The Company recorded an unrealized loss of $1,885,539 as of December 31, 2024, from changes in fair market value. Unrealized gains and losses, at fair value, are recorded on the Company’s consolidated balance sheet as current or noncurrent asset and liabilities based on the anticipated timing of settlements under the related contracts, under the caption “derivative instruments.” Note 6 – Revolving Credit Facility On January 12, 2023, the Company entered into a $200,000,000 revolving credit facility. The revolving credit facility had an initial borrowing base of $15,000,000 and a maturity date of January 12, 2027. On November 19, 2024, the Company entered into an amendment that increased the borrowing base to $30,000,000. The $30,000,000 borrowing base was reaffirmed on April 8, 2025. Additionally, the amendment included a waiver for covenant compliance for the fiscal quarter ending September 30, 2024. The Company pledged substantially all of its oil, gas and liquid properties and other assets as collateral to secure amounts outstanding under the revolving credit facility. Interest on the revolving credit facility is either (i) Base Rate, plus a margin between 2% and 3% or (ii) the adjusted Secured Overnight Financing Rate, plus a margin between 3% and 4%. The annual commitment fee on the unused portion of the revolving credit facility is 0.50%. At December 31, 2024, the interest rate on the revolving credit facility was 7.74%.
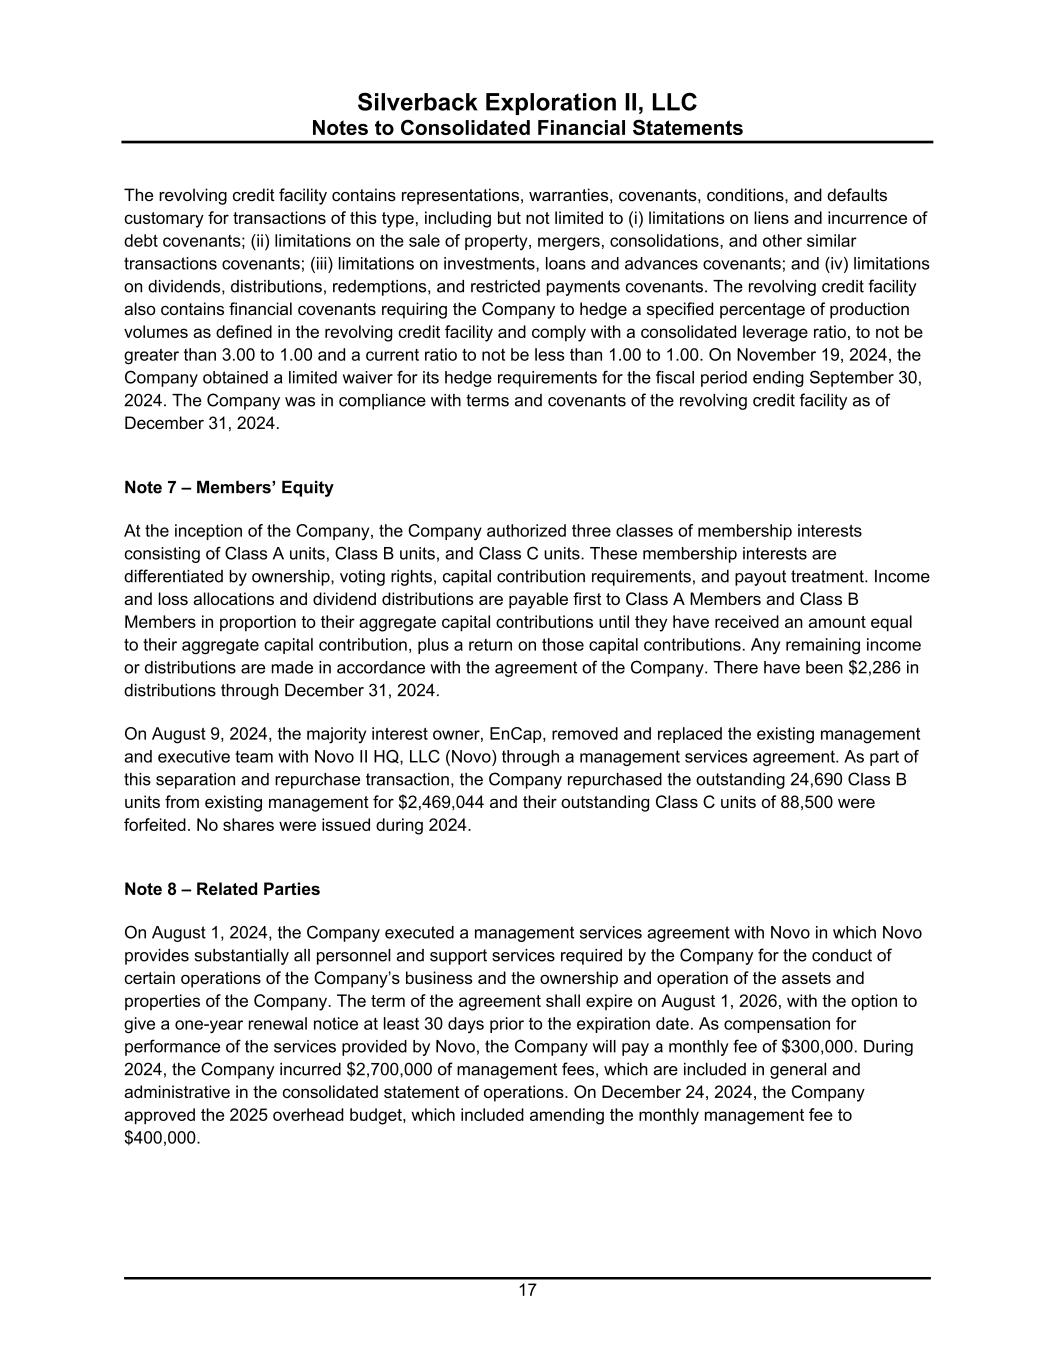
Silverback Exploration II, LLC Notes to Consolidated Financial Statements 17 The revolving credit facility contains representations, warranties, covenants, conditions, and defaults customary for transactions of this type, including but not limited to (i) limitations on liens and incurrence of debt covenants; (ii) limitations on the sale of property, mergers, consolidations, and other similar transactions covenants; (iii) limitations on investments, loans and advances covenants; and (iv) limitations on dividends, distributions, redemptions, and restricted payments covenants. The revolving credit facility also contains financial covenants requiring the Company to hedge a specified percentage of production volumes as defined in the revolving credit facility and comply with a consolidated leverage ratio, to not be greater than 3.00 to 1.00 and a current ratio to not be less than 1.00 to 1.00. On November 19, 2024, the Company obtained a limited waiver for its hedge requirements for the fiscal period ending September 30, 2024. The Company was in compliance with terms and covenants of the revolving credit facility as of December 31, 2024. Note 7 – Members’ Equity At the inception of the Company, the Company authorized three classes of membership interests consisting of Class A units, Class B units, and Class C units. These membership interests are differentiated by ownership, voting rights, capital contribution requirements, and payout treatment. Income and loss allocations and dividend distributions are payable first to Class A Members and Class B Members in proportion to their aggregate capital contributions until they have received an amount equal to their aggregate capital contribution, plus a return on those capital contributions. Any remaining income or distributions are made in accordance with the agreement of the Company. There have been $2,286 in distributions through December 31, 2024. On August 9, 2024, the majority interest owner, EnCap, removed and replaced the existing management and executive team with Novo II HQ, LLC (Novo) through a management services agreement. As part of this separation and repurchase transaction, the Company repurchased the outstanding 24,690 Class B units from existing management for $2,469,044 and their outstanding Class C units of 88,500 were forfeited. No shares were issued during 2024. Note 8 – Related Parties On August 1, 2024, the Company executed a management services agreement with Novo in which Novo provides substantially all personnel and support services required by the Company for the conduct of certain operations of the Company’s business and the ownership and operation of the assets and properties of the Company. The term of the agreement shall expire on August 1, 2026, with the option to give a one-year renewal notice at least 30 days prior to the expiration date. As compensation for performance of the services provided by Novo, the Company will pay a monthly fee of $300,000. During 2024, the Company incurred $2,700,000 of management fees, which are included in general and administrative in the consolidated statement of operations. On December 24, 2024, the Company approved the 2025 overhead budget, which included amending the monthly management fee to $400,000.
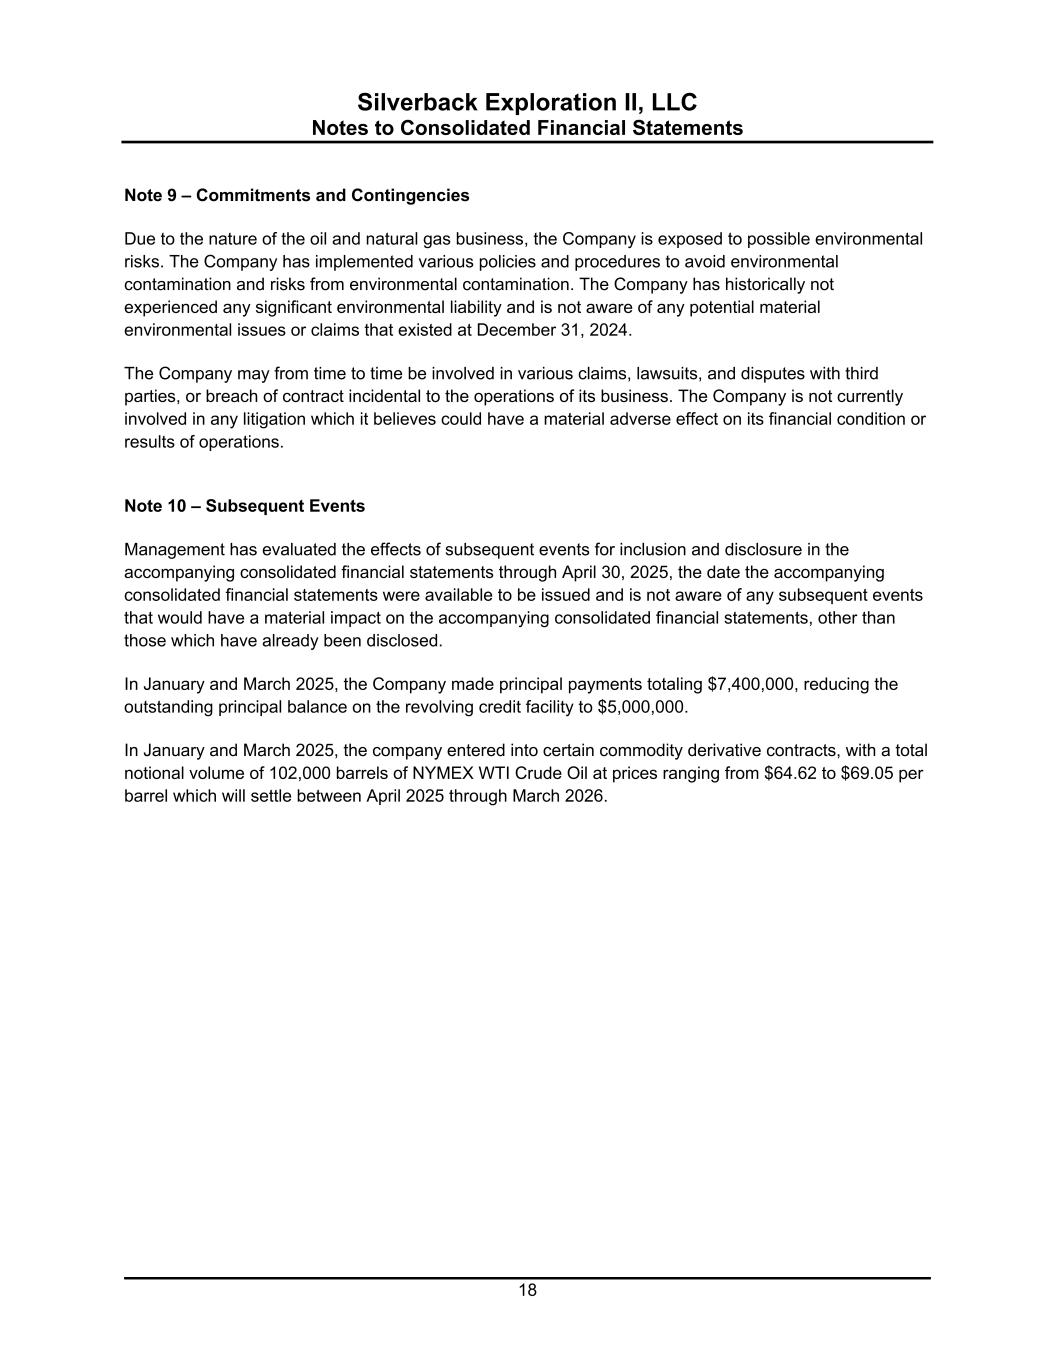
Silverback Exploration II, LLC Notes to Consolidated Financial Statements 18 Note 9 – Commitments and Contingencies Due to the nature of the oil and natural gas business, the Company is exposed to possible environmental risks. The Company has implemented various policies and procedures to avoid environmental contamination and risks from environmental contamination. The Company has historically not experienced any significant environmental liability and is not aware of any potential material environmental issues or claims that existed at December 31, 2024. The Company may from time to time be involved in various claims, lawsuits, and disputes with third parties, or breach of contract incidental to the operations of its business. The Company is not currently involved in any litigation which it believes could have a material adverse effect on its financial condition or results of operations. Note 10 – Subsequent Events Management has evaluated the effects of subsequent events for inclusion and disclosure in the accompanying consolidated financial statements through April 30, 2025, the date the accompanying consolidated financial statements were available to be issued and is not aware of any subsequent events that would have a material impact on the accompanying consolidated financial statements, other than those which have already been disclosed. In January and March 2025, the Company made principal payments totaling $7,400,000, reducing the outstanding principal balance on the revolving credit facility to $5,000,000. In January and March 2025, the company entered into certain commodity derivative contracts, with a total notional volume of 102,000 barrels of NYMEX WTI Crude Oil at prices ranging from $64.62 to $69.05 per barrel which will settle between April 2025 through March 2026.
Supplementary Information
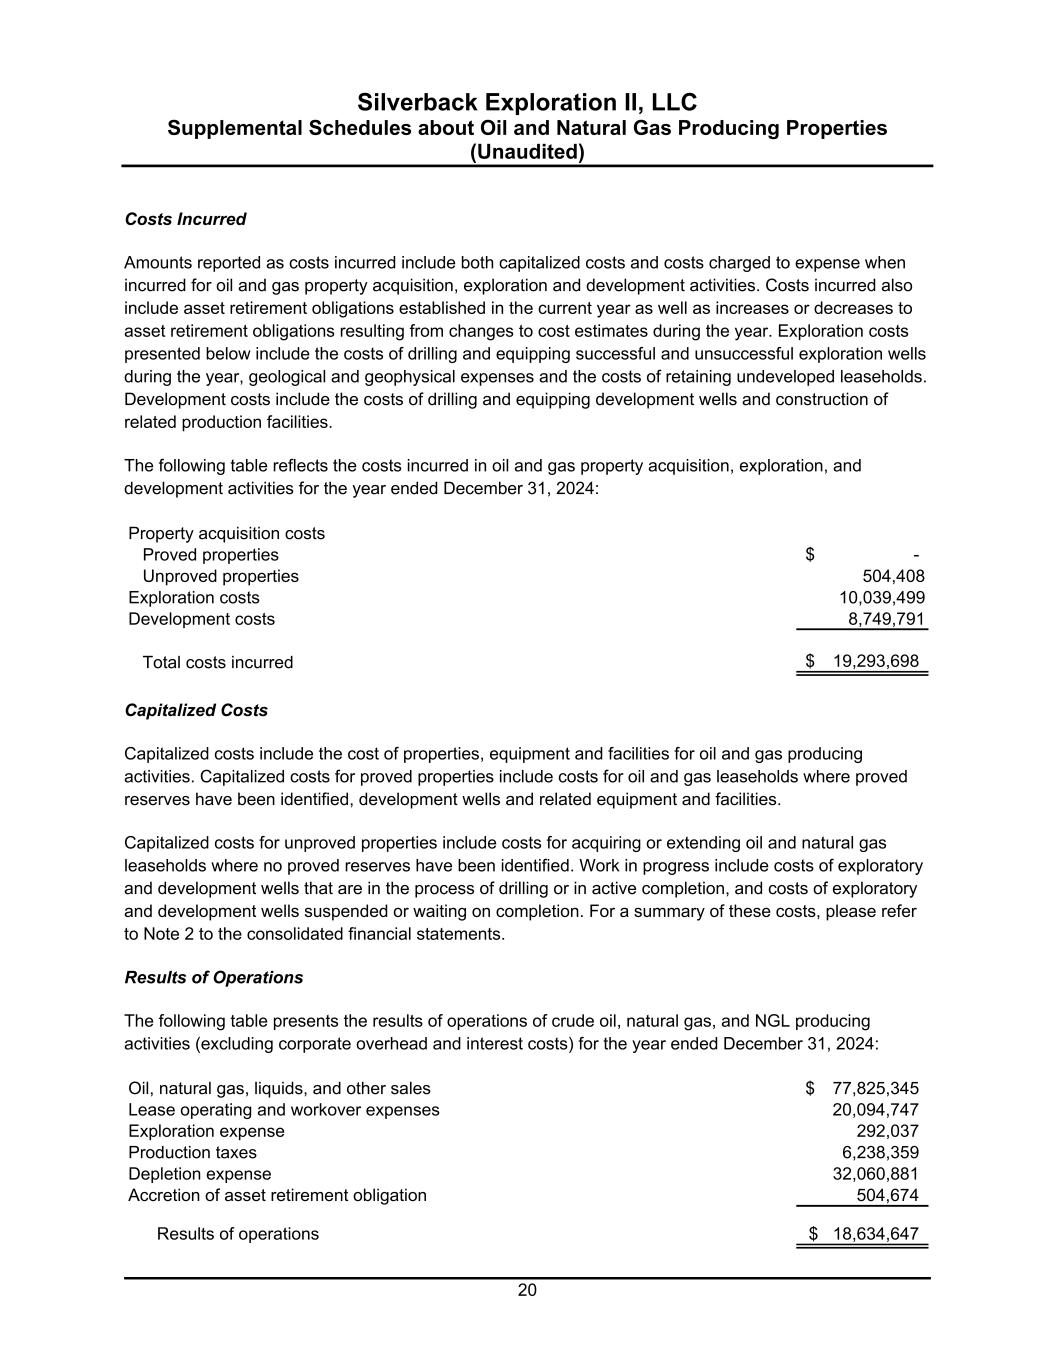
Silverback Exploration II, LLC 20 Supplemental Schedules about Oil and Natural Gas Producing Properties (Unaudited) Costs Incurred Amounts reported as costs incurred include both capitalized costs and costs charged to expense when incurred for oil and gas property acquisition, exploration and development activities. Costs incurred also include asset retirement obligations established in the current year as well as increases or decreases to asset retirement obligations resulting from changes to cost estimates during the year. Exploration costs presented below include the costs of drilling and equipping successful and unsuccessful exploration wells during the year, geological and geophysical expenses and the costs of retaining undeveloped leaseholds. Development costs include the costs of drilling and equipping development wells and construction of related production facilities. The following table reflects the costs incurred in oil and gas property acquisition, exploration, and development activities for the year ended December 31, 2024: Property acquisition costs Proved properties -$ Unproved properties 504,408 Exploration costs 10,039,499 Development costs 8,749,791 Total costs incurred 19,293,698$ Capitalized Costs Capitalized costs include the cost of properties, equipment and facilities for oil and gas producing activities. Capitalized costs for proved properties include costs for oil and gas leaseholds where proved reserves have been identified, development wells and related equipment and facilities. Capitalized costs for unproved properties include costs for acquiring or extending oil and natural gas leaseholds where no proved reserves have been identified. Work in progress include costs of exploratory and development wells that are in the process of drilling or in active completion, and costs of exploratory and development wells suspended or waiting on completion. For a summary of these costs, please refer to Note 2 to the consolidated financial statements. Results of Operations The following table presents the results of operations of crude oil, natural gas, and NGL producing activities (excluding corporate overhead and interest costs) for the year ended December 31, 2024: Oil, natural gas, liquids, and other sales 77,825,345$ Lease operating and workover expenses 20,094,747 Exploration expense 292,037 Production taxes 6,238,359 Depletion expense 32,060,881 Accretion of asset retirement obligation 504,674 Results of operations 18,634,647$
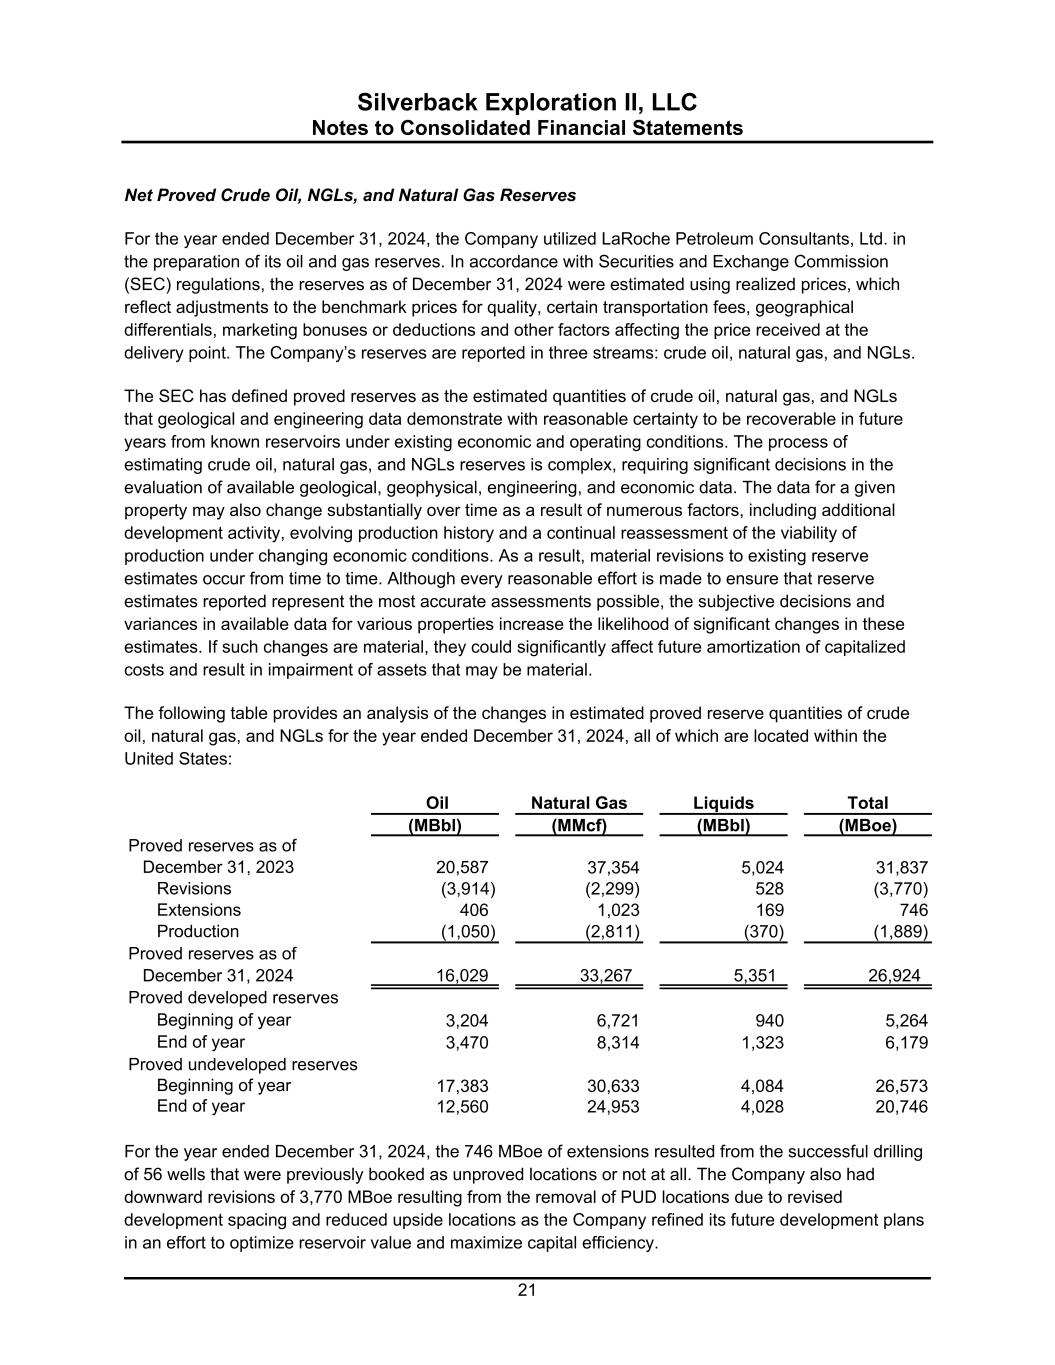
Silverback Exploration II, LLC Notes to Consolidated Financial Statements 21 Net Proved Crude Oil, NGLs, and Natural Gas Reserves For the year ended December 31, 2024, the Company utilized LaRoche Petroleum Consultants, Ltd. in the preparation of its oil and gas reserves. In accordance with Securities and Exchange Commission (SEC) regulations, the reserves as of December 31, 2024 were estimated using realized prices, which reflect adjustments to the benchmark prices for quality, certain transportation fees, geographical differentials, marketing bonuses or deductions and other factors affecting the price received at the delivery point. The Company’s reserves are reported in three streams: crude oil, natural gas, and NGLs. The SEC has defined proved reserves as the estimated quantities of crude oil, natural gas, and NGLs that geological and engineering data demonstrate with reasonable certainty to be recoverable in future years from known reservoirs under existing economic and operating conditions. The process of estimating crude oil, natural gas, and NGLs reserves is complex, requiring significant decisions in the evaluation of available geological, geophysical, engineering, and economic data. The data for a given property may also change substantially over time as a result of numerous factors, including additional development activity, evolving production history and a continual reassessment of the viability of production under changing economic conditions. As a result, material revisions to existing reserve estimates occur from time to time. Although every reasonable effort is made to ensure that reserve estimates reported represent the most accurate assessments possible, the subjective decisions and variances in available data for various properties increase the likelihood of significant changes in these estimates. If such changes are material, they could significantly affect future amortization of capitalized costs and result in impairment of assets that may be material. The following table provides an analysis of the changes in estimated proved reserve quantities of crude oil, natural gas, and NGLs for the year ended December 31, 2024, all of which are located within the United States: Oil Natural Gas Liquids Total (MBbl) (MMcf) (MBbl) (MBoe) 20,587 (3,914) (2,299) 528 (3,770) 406 1,023 169 746 (1,050) (2,811) (370) (1,889) Proved reserves as of December 31, 2024 16,029 33,267 5,351 26,924 3,204 6,721 940 5,264 3,470 8,314 1,323 6,179 Proved undeveloped reserves 17,383 30,633 4,084 26,573 12,560 24,953 4,028 20,746 5,024 31,837 Proved reserves as of December 31, 2023 37,354 End of year Beginning of year End of year Revisions Extensions Production Proved developed reserves Beginning of year For the year ended December 31, 2024, the 746 MBoe of extensions resulted from the successful drilling of 56 wells that were previously booked as unproved locations or not at all. The Company also had downward revisions of 3,770 MBoe resulting from the removal of PUD locations due to revised development spacing and reduced upside locations as the Company refined its future development plans in an effort to optimize reservoir value and maximize capital efficiency.
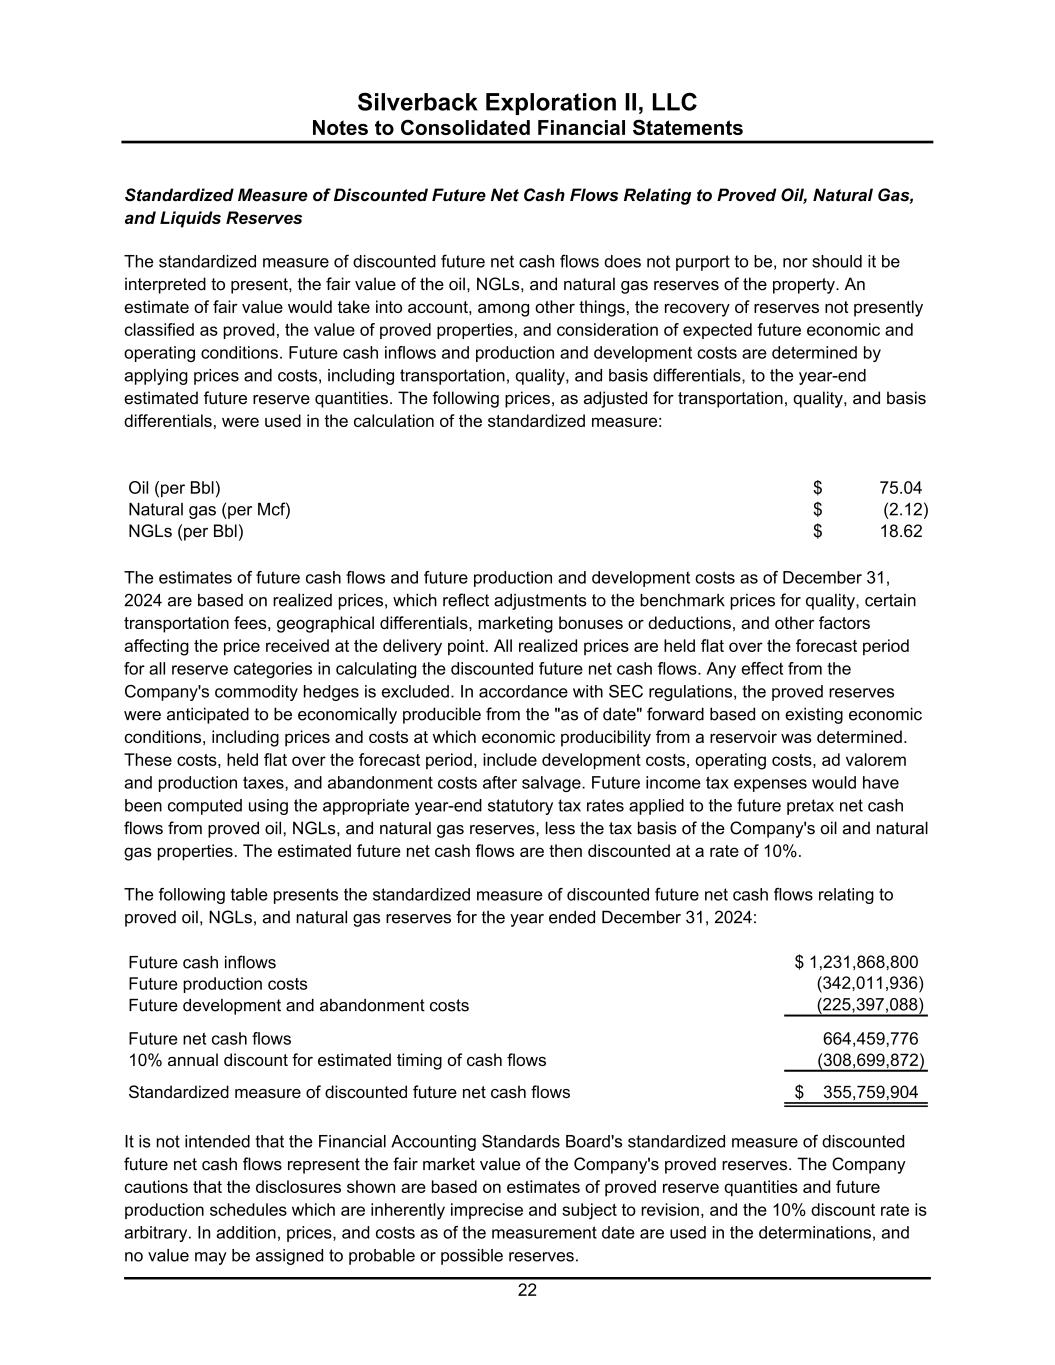
Silverback Exploration II, LLC Notes to Consolidated Financial Statements 22 Standardized Measure of Discounted Future Net Cash Flows Relating to Proved Oil, Natural Gas, and Liquids Reserves The standardized measure of discounted future net cash flows does not purport to be, nor should it be interpreted to present, the fair value of the oil, NGLs, and natural gas reserves of the property. An estimate of fair value would take into account, among other things, the recovery of reserves not presently classified as proved, the value of proved properties, and consideration of expected future economic and operating conditions. Future cash inflows and production and development costs are determined by applying prices and costs, including transportation, quality, and basis differentials, to the year-end estimated future reserve quantities. The following prices, as adjusted for transportation, quality, and basis differentials, were used in the calculation of the standardized measure: Oil (per Bbl) 75.04$ Natural gas (per Mcf) (2.12)$ NGLs (per Bbl) 18.62$ The estimates of future cash flows and future production and development costs as of December 31, 2024 are based on realized prices, which reflect adjustments to the benchmark prices for quality, certain transportation fees, geographical differentials, marketing bonuses or deductions, and other factors affecting the price received at the delivery point. All realized prices are held flat over the forecast period for all reserve categories in calculating the discounted future net cash flows. Any effect from the Company's commodity hedges is excluded. In accordance with SEC regulations, the proved reserves were anticipated to be economically producible from the "as of date" forward based on existing economic conditions, including prices and costs at which economic producibility from a reservoir was determined. These costs, held flat over the forecast period, include development costs, operating costs, ad valorem and production taxes, and abandonment costs after salvage. Future income tax expenses would have been computed using the appropriate year-end statutory tax rates applied to the future pretax net cash flows from proved oil, NGLs, and natural gas reserves, less the tax basis of the Company's oil and natural gas properties. The estimated future net cash flows are then discounted at a rate of 10%. The following table presents the standardized measure of discounted future net cash flows relating to proved oil, NGLs, and natural gas reserves for the year ended December 31, 2024: Future cash inflows Future production costs Future development and abandonment costs Future net cash flows 10% annual discount for estimated timing of cash flows Standardized measure of discounted future net cash flows 1,231,868,800$ 355,759,904$ (342,011,936) (225,397,088) 664,459,776 (308,699,872) It is not intended that the Financial Accounting Standards Board's standardized measure of discounted future net cash flows represent the fair market value of the Company's proved reserves. The Company cautions that the disclosures shown are based on estimates of proved reserve quantities and future production schedules which are inherently imprecise and subject to revision, and the 10% discount rate is arbitrary. In addition, prices, and costs as of the measurement date are used in the determinations, and no value may be assigned to probable or possible reserves.
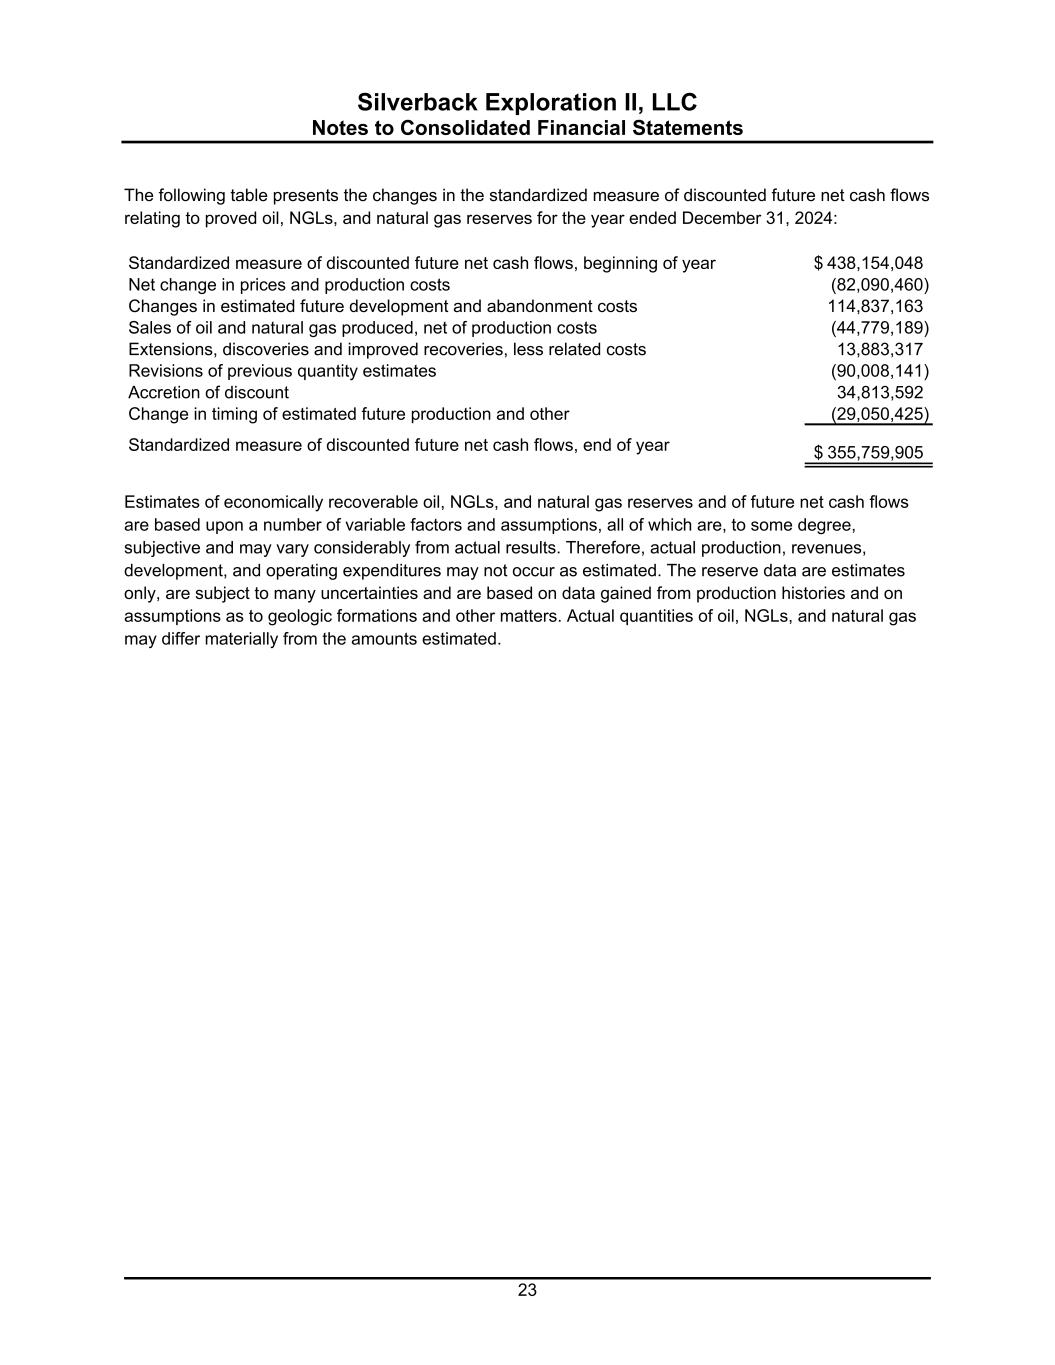
Silverback Exploration II, LLC Notes to Consolidated Financial Statements 23 The following table presents the changes in the standardized measure of discounted future net cash flows relating to proved oil, NGLs, and natural gas reserves for the year ended December 31, 2024: Standardized measure of discounted future net cash flows, beginning of year 438,154,048$ Net change in prices and production costs (82,090,460) Changes in estimated future development and abandonment costs 114,837,163 Sales of oil and natural gas produced, net of production costs (44,779,189) Extensions, discoveries and improved recoveries, less related costs 13,883,317 Revisions of previous quantity estimates (90,008,141) Accretion of discount 34,813,592 Change in timing of estimated future production and other (29,050,425) Standardized measure of discounted future net cash flows, end of year 355,759,905$ Estimates of economically recoverable oil, NGLs, and natural gas reserves and of future net cash flows are based upon a number of variable factors and assumptions, all of which are, to some degree, subjective and may vary considerably from actual results. Therefore, actual production, revenues, development, and operating expenditures may not occur as estimated. The reserve data are estimates only, are subject to many uncertainties and are based on data gained from production histories and on assumptions as to geologic formations and other matters. Actual quantities of oil, NGLs, and natural gas may differ materially from the amounts estimated.


Condensed Consolidated Financial Statements (Unaudited) Silverback Exploration II, LLC As of March 31, 2025
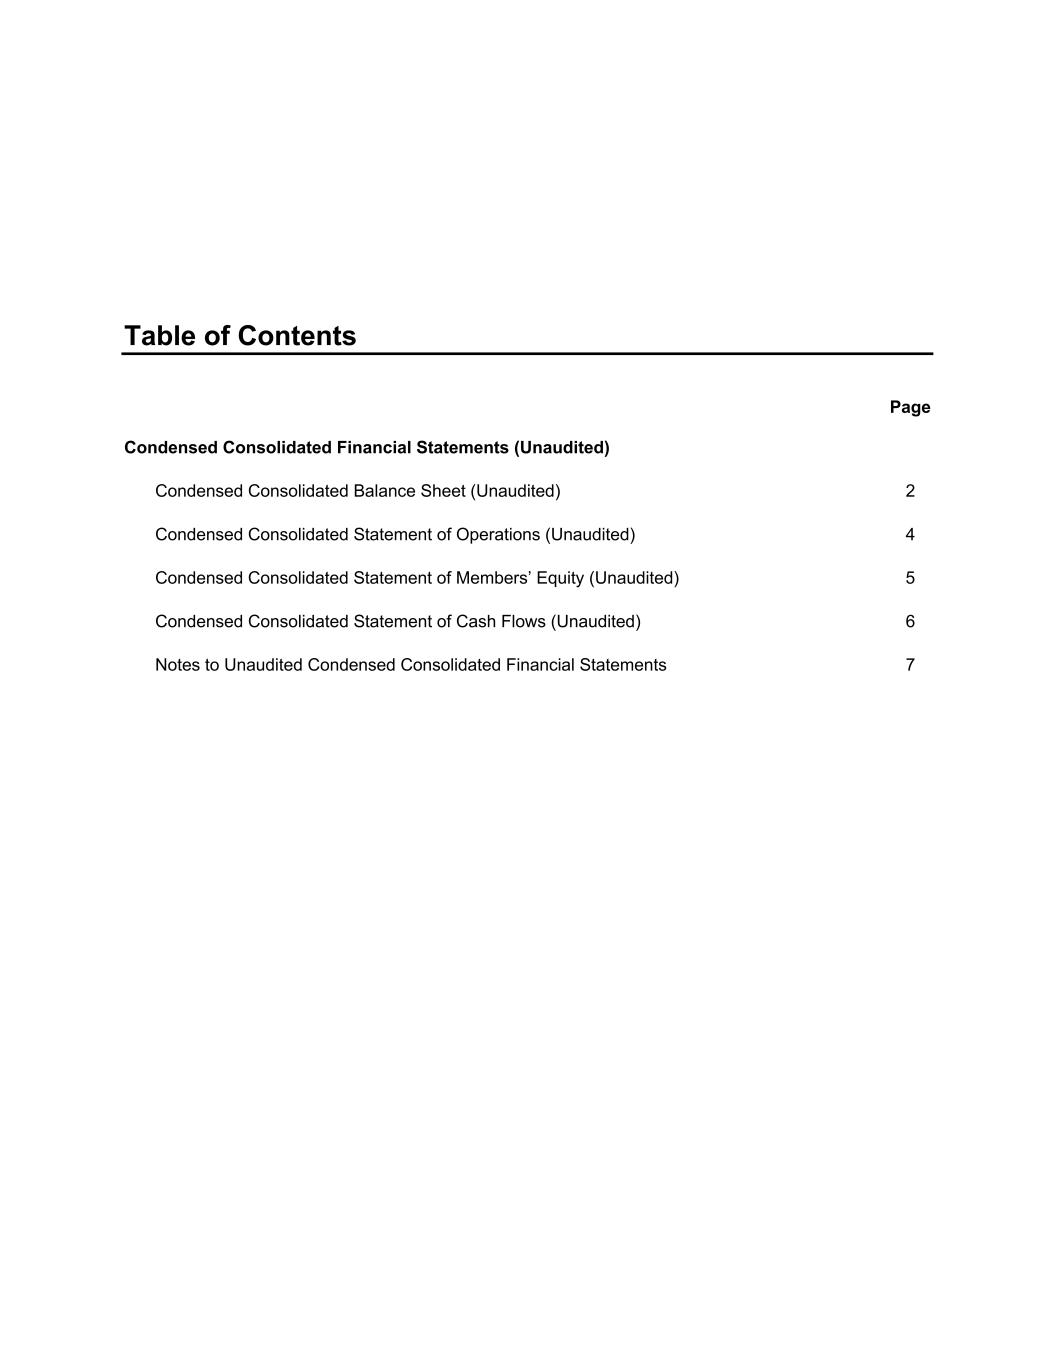
Table of Contents Page Condensed Consolidated Financial Statements (Unaudited) Condensed Consolidated Balance Sheet (Unaudited) 2 Condensed Consolidated Statement of Operations (Unaudited) 4 Condensed Consolidated Statement of Members’ Equity (Unaudited) 5 Condensed Consolidated Statement of Cash Flows (Unaudited) 6 Notes to Unaudited Condensed Consolidated Financial Statements 7
Condensed Consolidated Financial Statements (Unaudited)
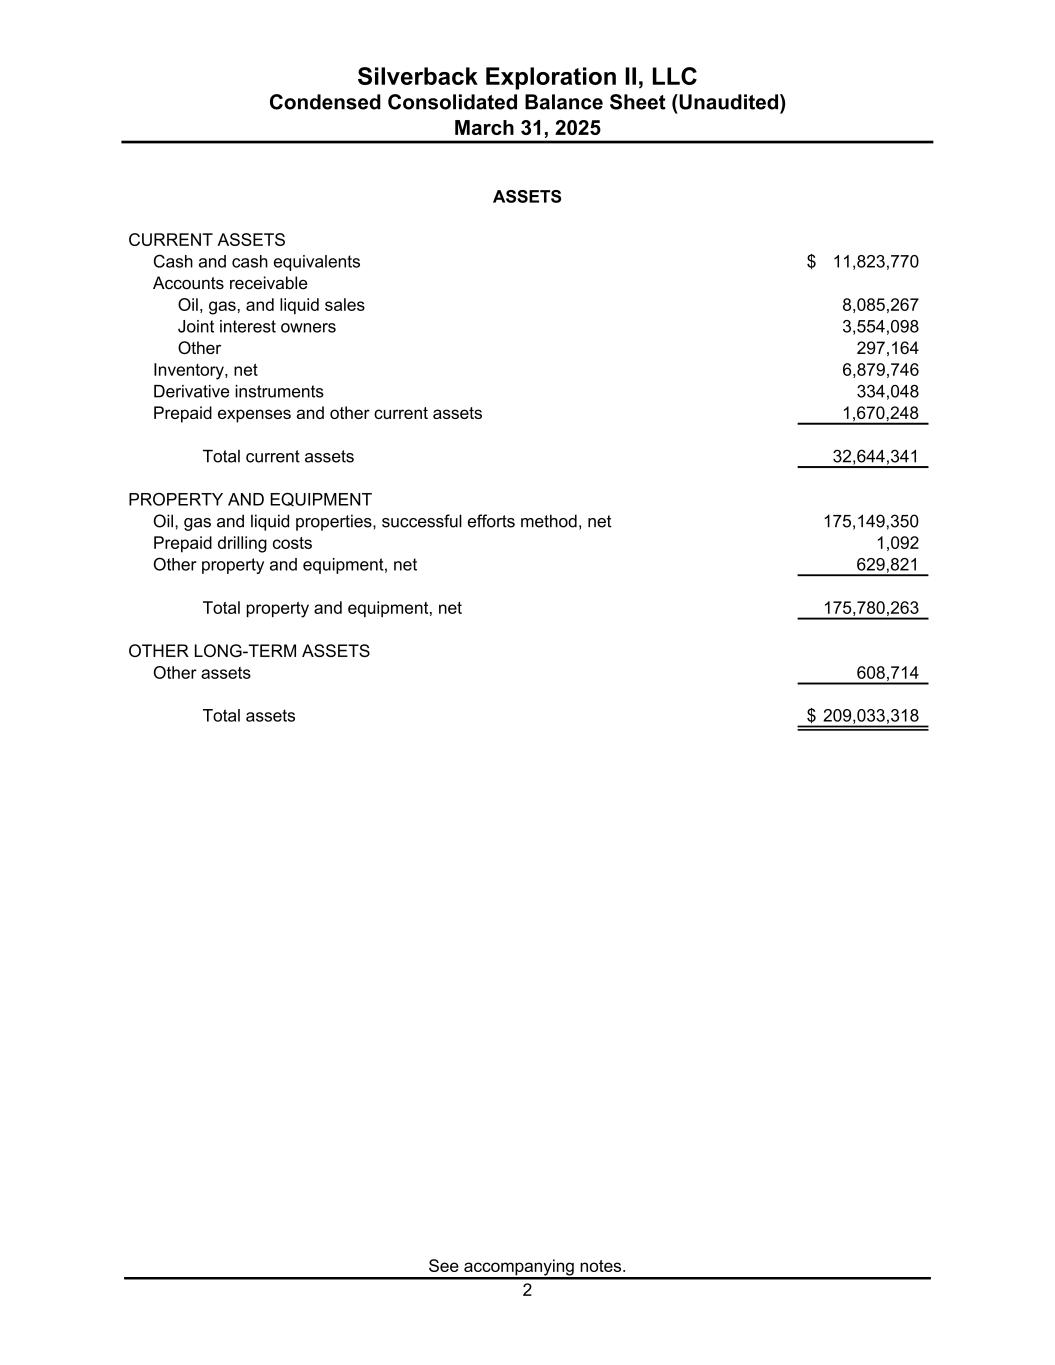
Silverback Exploration II, LLC See accompanying notes. 2 Condensed Consolidated Balance Sheet (Unaudited) March 31, 2025 CURRENT ASSETS Cash and cash equivalents 11,823,770$ Accounts receivable Oil, gas, and liquid sales 8,085,267 Joint interest owners 3,554,098 Other 297,164 Inventory, net 6,879,746 Derivative instruments 334,048 Prepaid expenses and other current assets 1,670,248 Total current assets 32,644,341 PROPERTY AND EQUIPMENT Oil, gas and liquid properties, successful efforts method, net 175,149,350 Prepaid drilling costs 1,092 Other property and equipment, net 629,821 Total property and equipment, net 175,780,263 OTHER LONG-TERM ASSETS Other assets 608,714 Total assets 209,033,318$ ASSETS
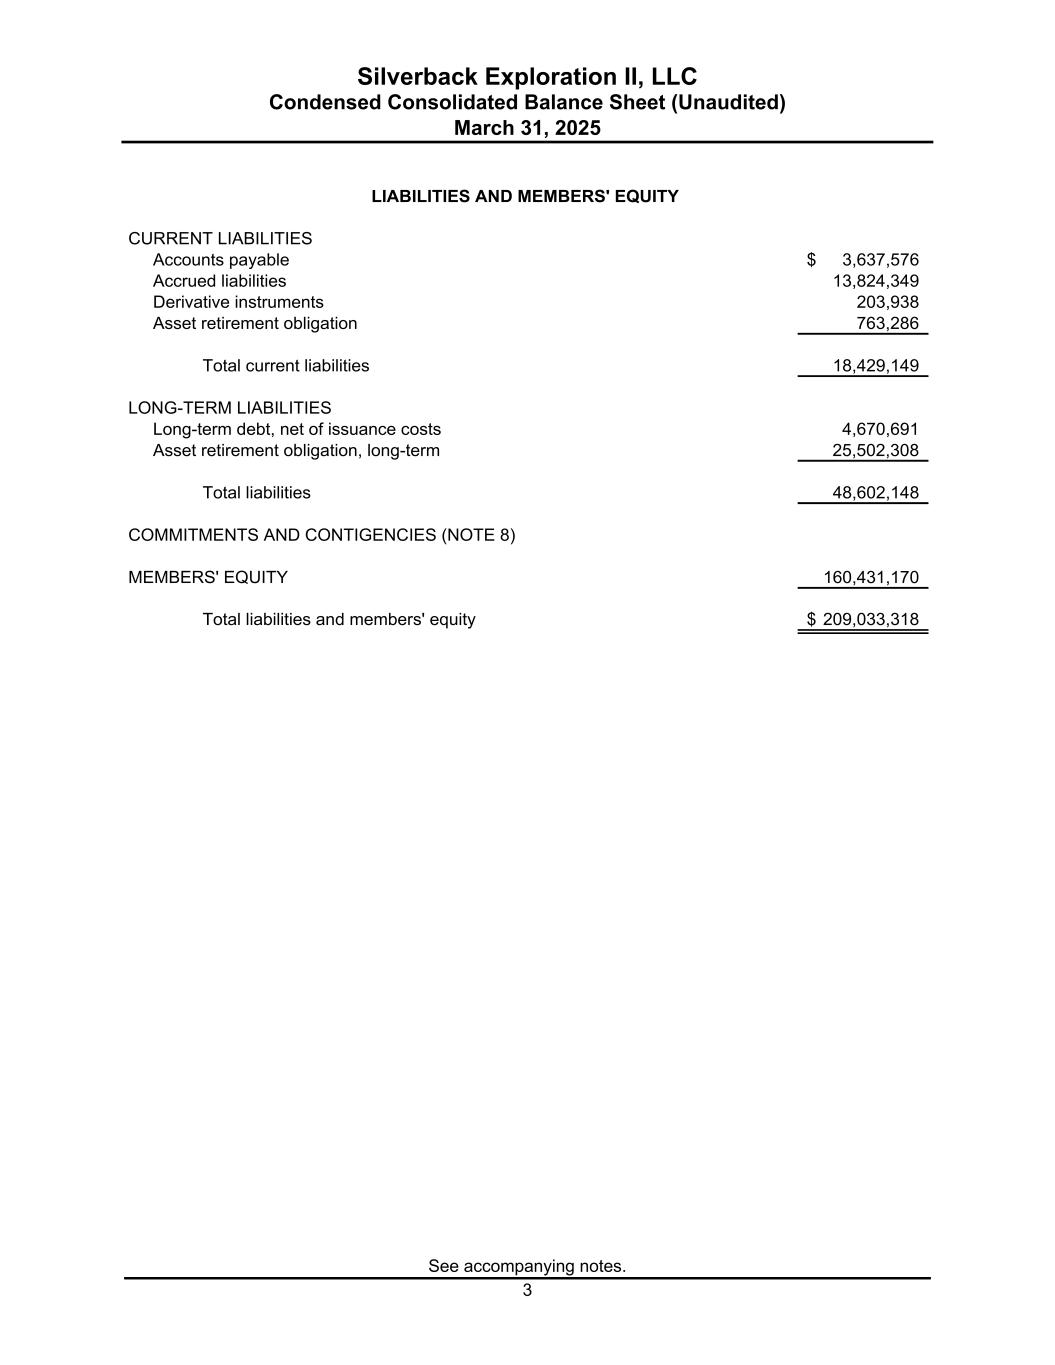
Silverback Exploration II, LLC Condensed Consolidated Balance Sheet (Unaudited) March 31, 2025 See accompanying notes. 3 CURRENT LIABILITIES Accounts payable 3,637,576$ Accrued liabilities 13,824,349 Derivative instruments 203,938 Asset retirement obligation 763,286 Total current liabilities 18,429,149 LONG-TERM LIABILITIES Long-term debt, net of issuance costs 4,670,691 Asset retirement obligation, long-term 25,502,308 Total liabilities 48,602,148 COMMITMENTS AND CONTIGENCIES (NOTE 8) MEMBERS' EQUITY 160,431,170 Total liabilities and members' equity 209,033,318$ LIABILITIES AND MEMBERS' EQUITY
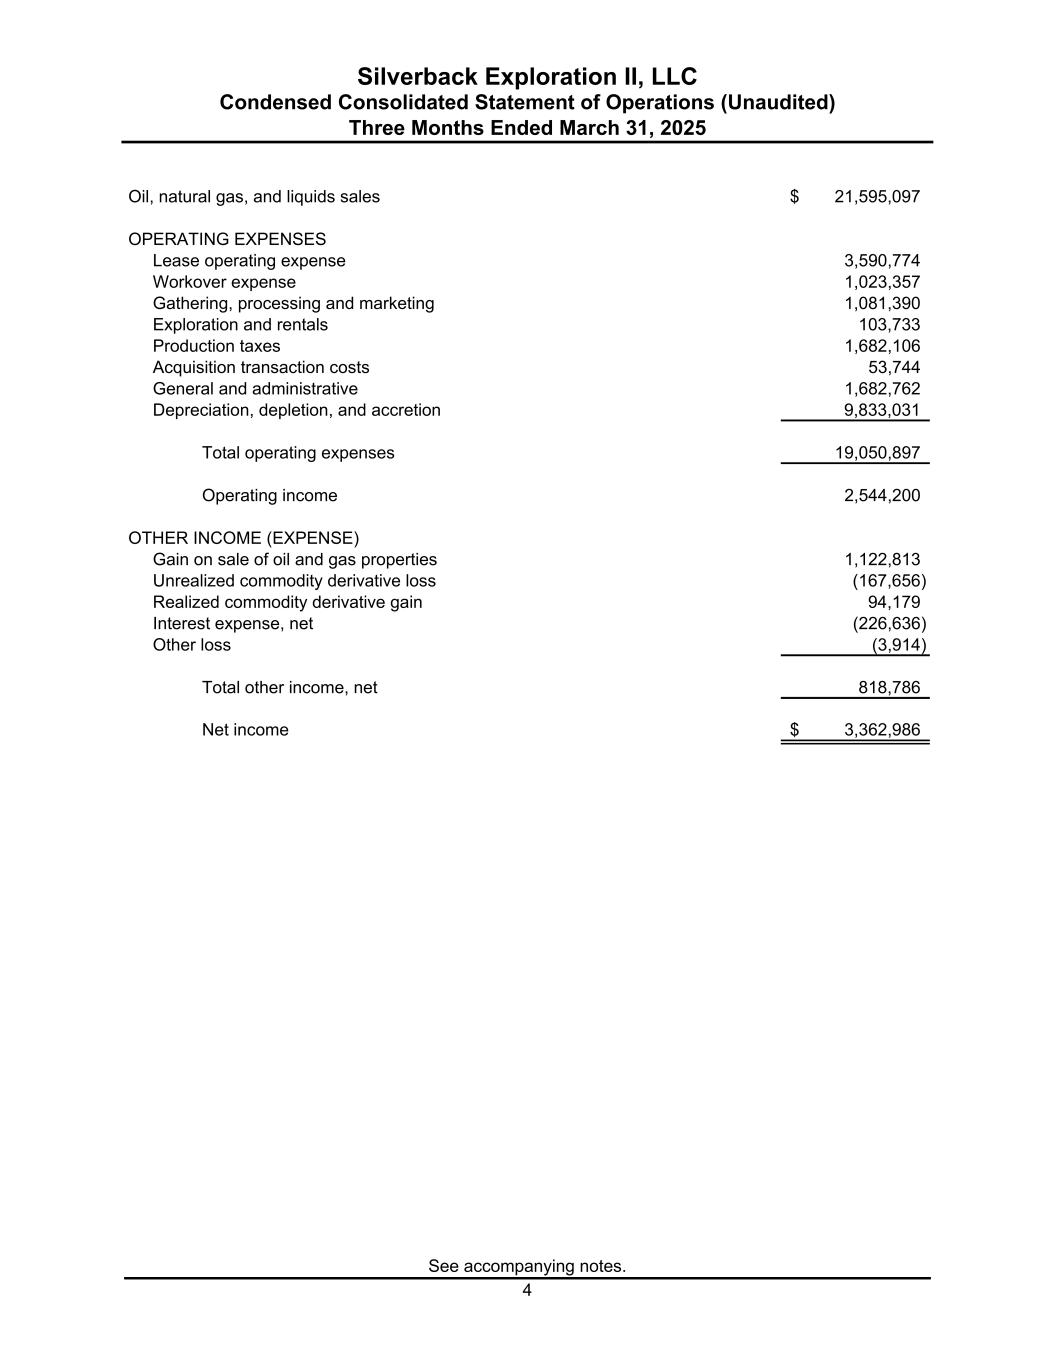
Silverback Exploration II, LLC See accompanying notes. 4 Condensed Consolidated Statement of Operations (Unaudited) Three Months Ended March 31, 2025 Oil, natural gas, and liquids sales 21,595,097$ OPERATING EXPENSES Lease operating expense 3,590,774 Workover expense 1,023,357 Gathering, processing and marketing 1,081,390 Exploration and rentals 103,733 Production taxes 1,682,106 Acquisition transaction costs 53,744 General and administrative 1,682,762 Depreciation, depletion, and accretion 9,833,031 Total operating expenses 19,050,897 Operating income 2,544,200 OTHER INCOME (EXPENSE) Gain on sale of oil and gas properties 1,122,813 Unrealized commodity derivative loss (167,656) Realized commodity derivative gain 94,179 Interest expense, net (226,636) Other loss (3,914) Total other income, net 818,786 Net income 3,362,986$
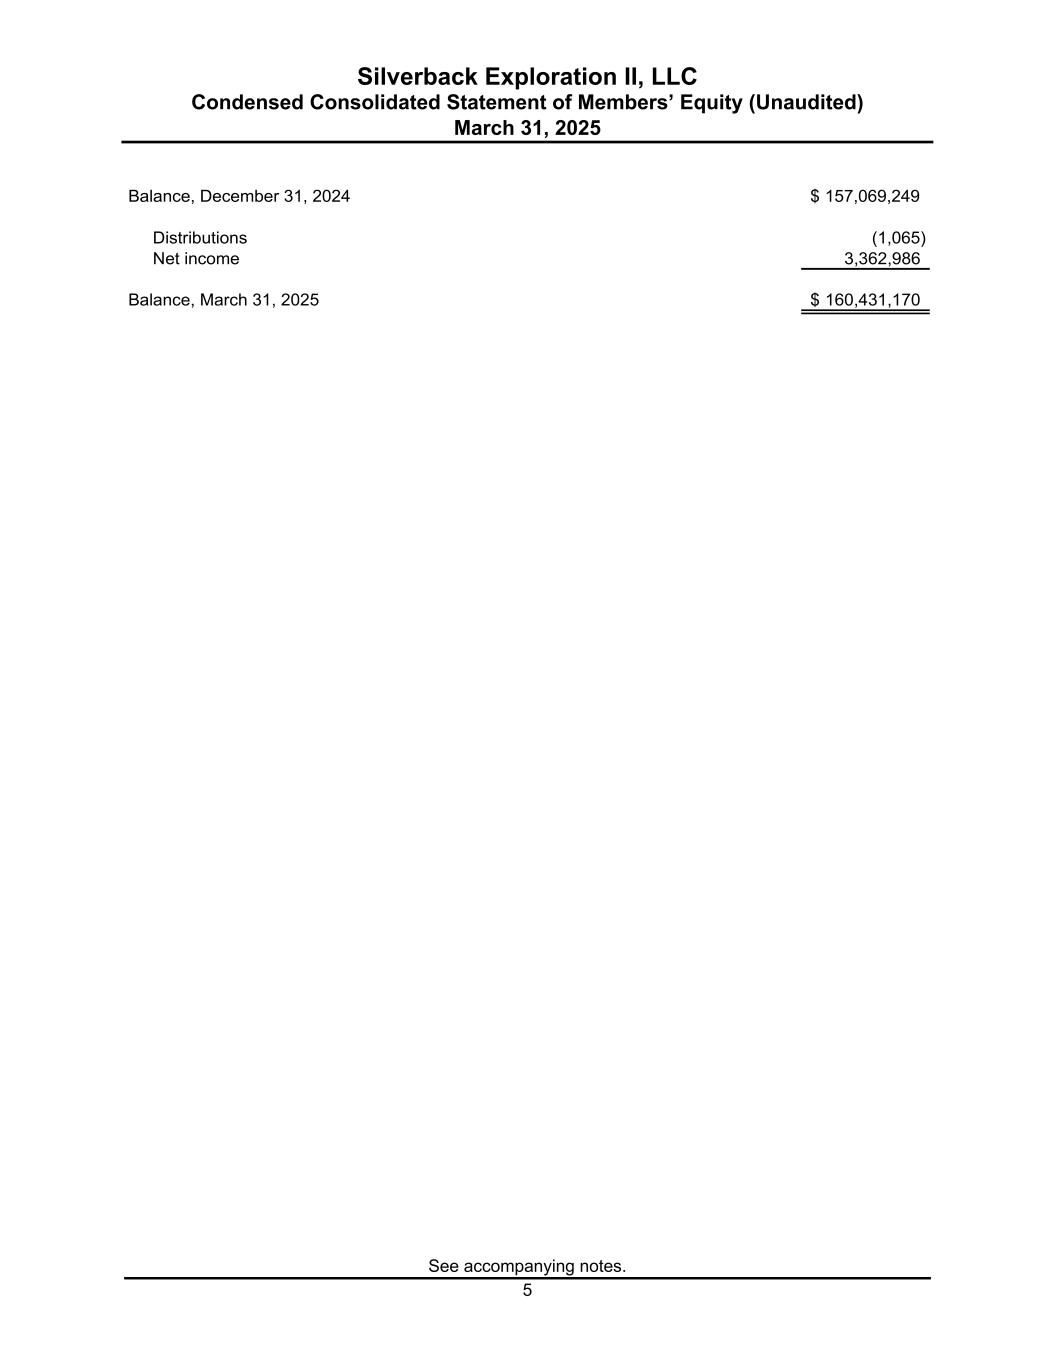
Silverback Exploration II, LLC See accompanying notes. 5 Condensed Consolidated Statement of Members’ Equity (Unaudited) March 31, 2025 Balance, December 31, 2024 $ 157,069,249 Distributions (1,065) Net income 3,362,986 Balance, March 31, 2025 160,431,170$
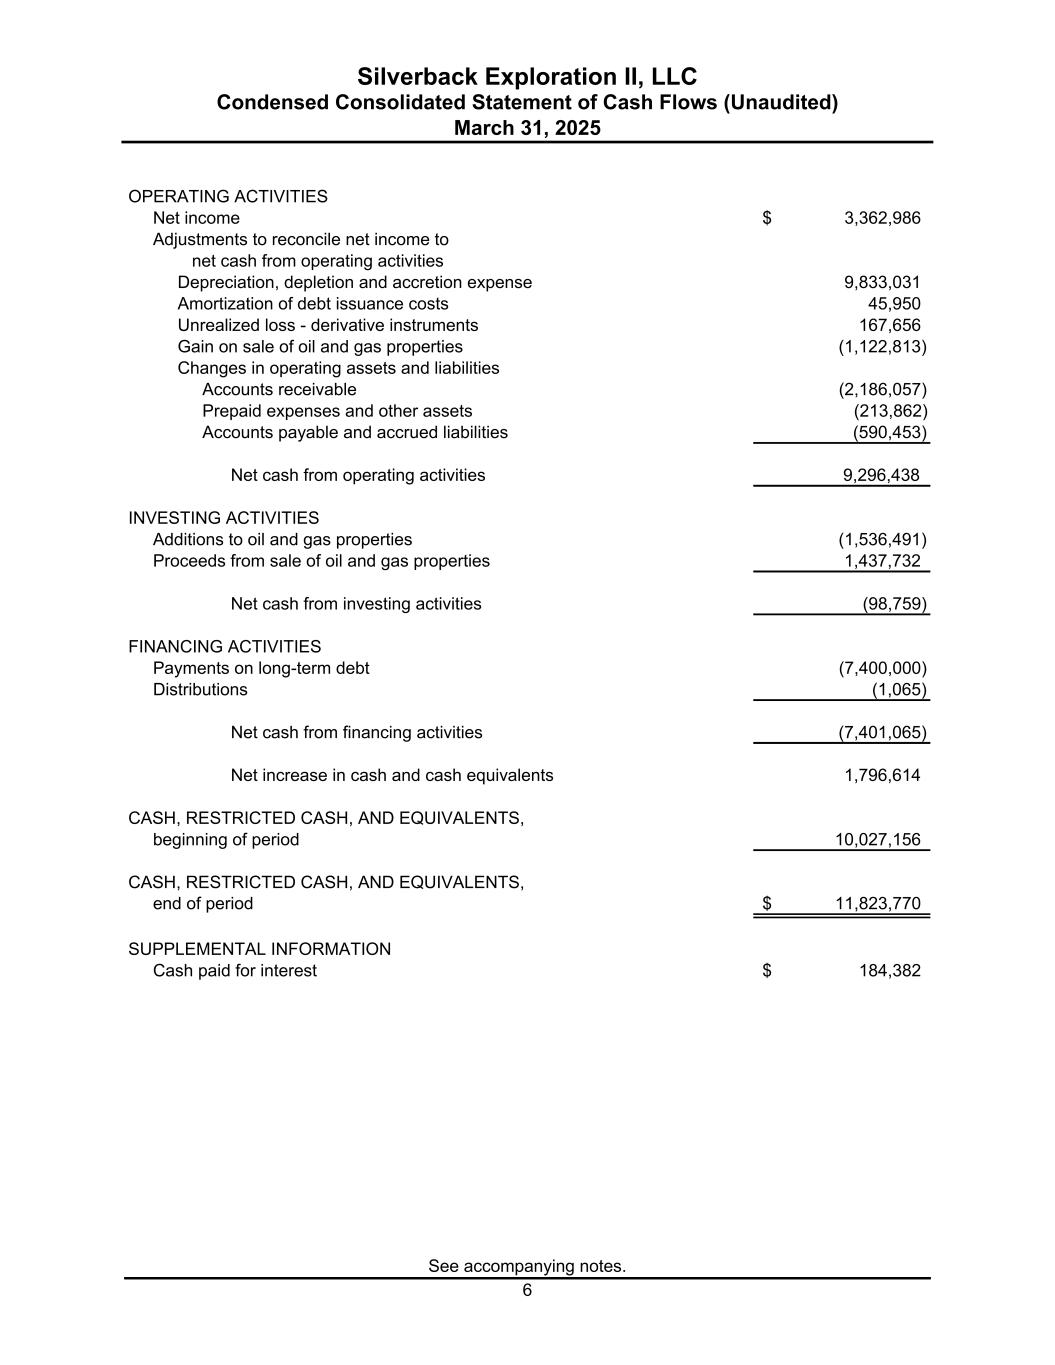
Silverback Exploration II, LLC See accompanying notes. 6 Condensed Consolidated Statement of Cash Flows (Unaudited) March 31, 2025 OPERATING ACTIVITIES Net income 3,362,986$ Adjustments to reconcile net income to net cash from operating activities Depreciation, depletion and accretion expense 9,833,031 Amortization of debt issuance costs 45,950 Unrealized loss - derivative instruments 167,656 Gain on sale of oil and gas properties (1,122,813) Changes in operating assets and liabilities Accounts receivable (2,186,057) Prepaid expenses and other assets (213,862) Accounts payable and accrued liabilities (590,453) Net cash from operating activities 9,296,438 INVESTING ACTIVITIES Additions to oil and gas properties (1,536,491) Proceeds from sale of oil and gas properties 1,437,732 Net cash from investing activities (98,759) FINANCING ACTIVITIES Payments on long-term debt (7,400,000) Distributions (1,065) Net cash from financing activities (7,401,065) Net increase in cash and cash equivalents 1,796,614 CASH, RESTRICTED CASH, AND EQUIVALENTS, beginning of period 10,027,156 CASH, RESTRICTED CASH, AND EQUIVALENTS, end of period 11,823,770$ SUPPLEMENTAL INFORMATION Cash paid for interest 184,382$
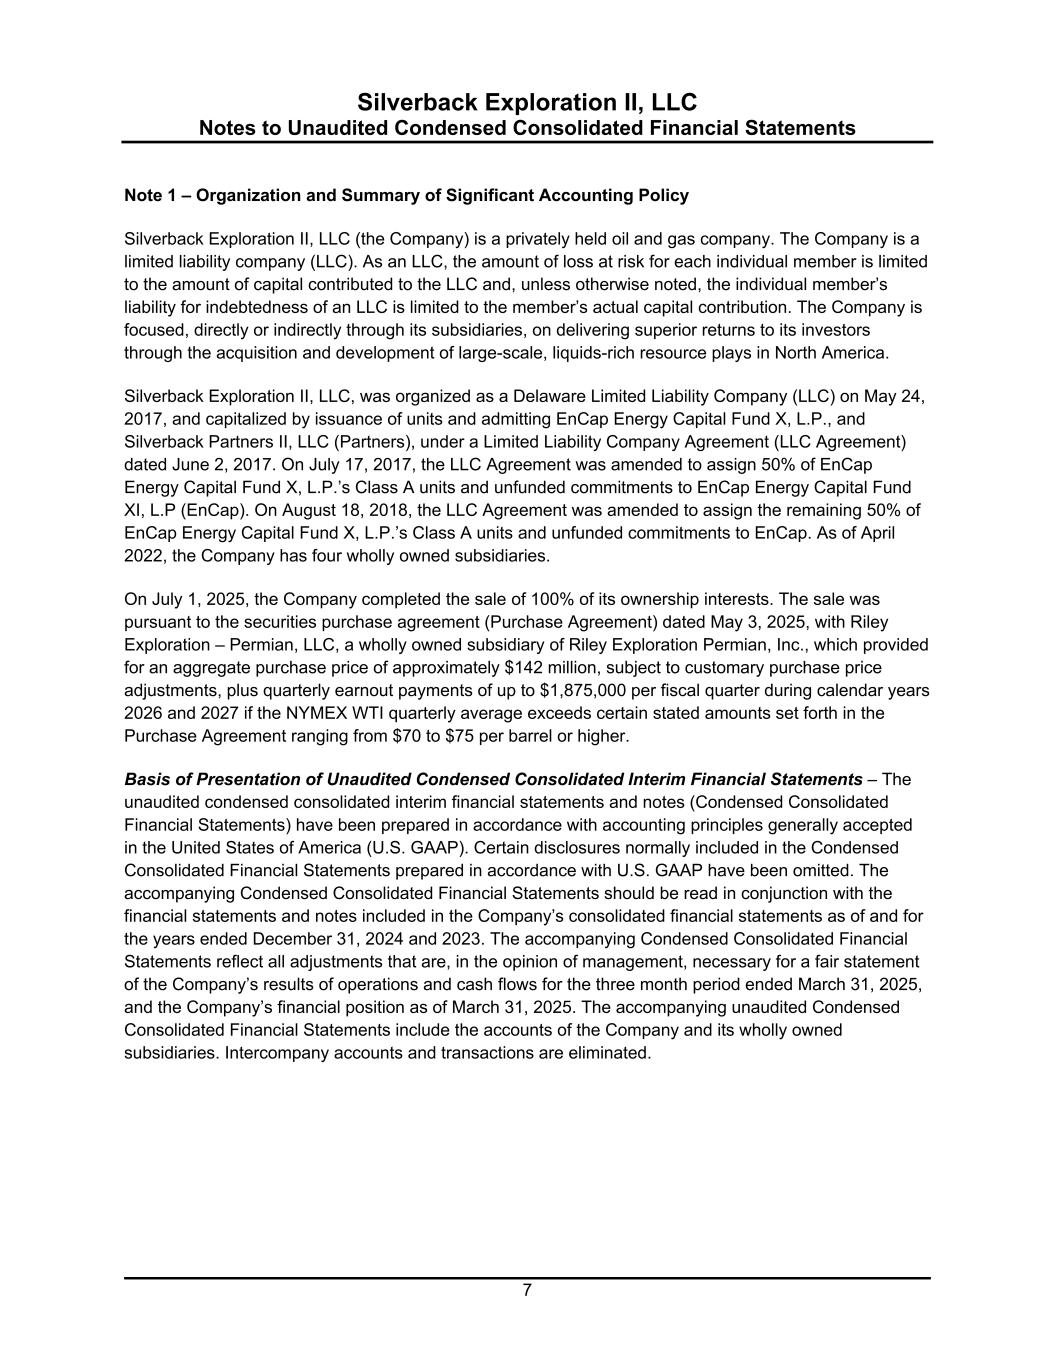
Silverback Exploration II, LLC 7 Notes to Unaudited Condensed Consolidated Financial Statements Note 1 – Organization and Summary of Significant Accounting Policy Silverback Exploration II, LLC (the Company) is a privately held oil and gas company. The Company is a limited liability company (LLC). As an LLC, the amount of loss at risk for each individual member is limited to the amount of capital contributed to the LLC and, unless otherwise noted, the individual member’s liability for indebtedness of an LLC is limited to the member’s actual capital contribution. The Company is focused, directly or indirectly through its subsidiaries, on delivering superior returns to its investors through the acquisition and development of large-scale, liquids-rich resource plays in North America. Silverback Exploration II, LLC, was organized as a Delaware Limited Liability Company (LLC) on May 24, 2017, and capitalized by issuance of units and admitting EnCap Energy Capital Fund X, L.P., and Silverback Partners II, LLC (Partners), under a Limited Liability Company Agreement (LLC Agreement) dated June 2, 2017. On July 17, 2017, the LLC Agreement was amended to assign 50% of EnCap Energy Capital Fund X, L.P.’s Class A units and unfunded commitments to EnCap Energy Capital Fund XI, L.P (EnCap). On August 18, 2018, the LLC Agreement was amended to assign the remaining 50% of EnCap Energy Capital Fund X, L.P.’s Class A units and unfunded commitments to EnCap. As of April 2022, the Company has four wholly owned subsidiaries. On July 1, 2025, the Company completed the sale of 100% of its ownership interests. The sale was pursuant to the securities purchase agreement (Purchase Agreement) dated May 3, 2025, with Riley Exploration – Permian, LLC, a wholly owned subsidiary of Riley Exploration Permian, Inc., which provided for an aggregate purchase price of approximately $142 million, subject to customary purchase price adjustments, plus quarterly earnout payments of up to $1,875,000 per fiscal quarter during calendar years 2026 and 2027 if the NYMEX WTI quarterly average exceeds certain stated amounts set forth in the Purchase Agreement ranging from $70 to $75 per barrel or higher. Basis of Presentation of Unaudited Condensed Consolidated Interim Financial Statements – The unaudited condensed consolidated interim financial statements and notes (Condensed Consolidated Financial Statements) have been prepared in accordance with accounting principles generally accepted in the United States of America (U.S. GAAP). Certain disclosures normally included in the Condensed Consolidated Financial Statements prepared in accordance with U.S. GAAP have been omitted. The accompanying Condensed Consolidated Financial Statements should be read in conjunction with the financial statements and notes included in the Company’s consolidated financial statements as of and for the years ended December 31, 2024 and 2023. The accompanying Condensed Consolidated Financial Statements reflect all adjustments that are, in the opinion of management, necessary for a fair statement of the Company’s results of operations and cash flows for the three month period ended March 31, 2025, and the Company’s financial position as of March 31, 2025. The accompanying unaudited Condensed Consolidated Financial Statements include the accounts of the Company and its wholly owned subsidiaries. Intercompany accounts and transactions are eliminated.
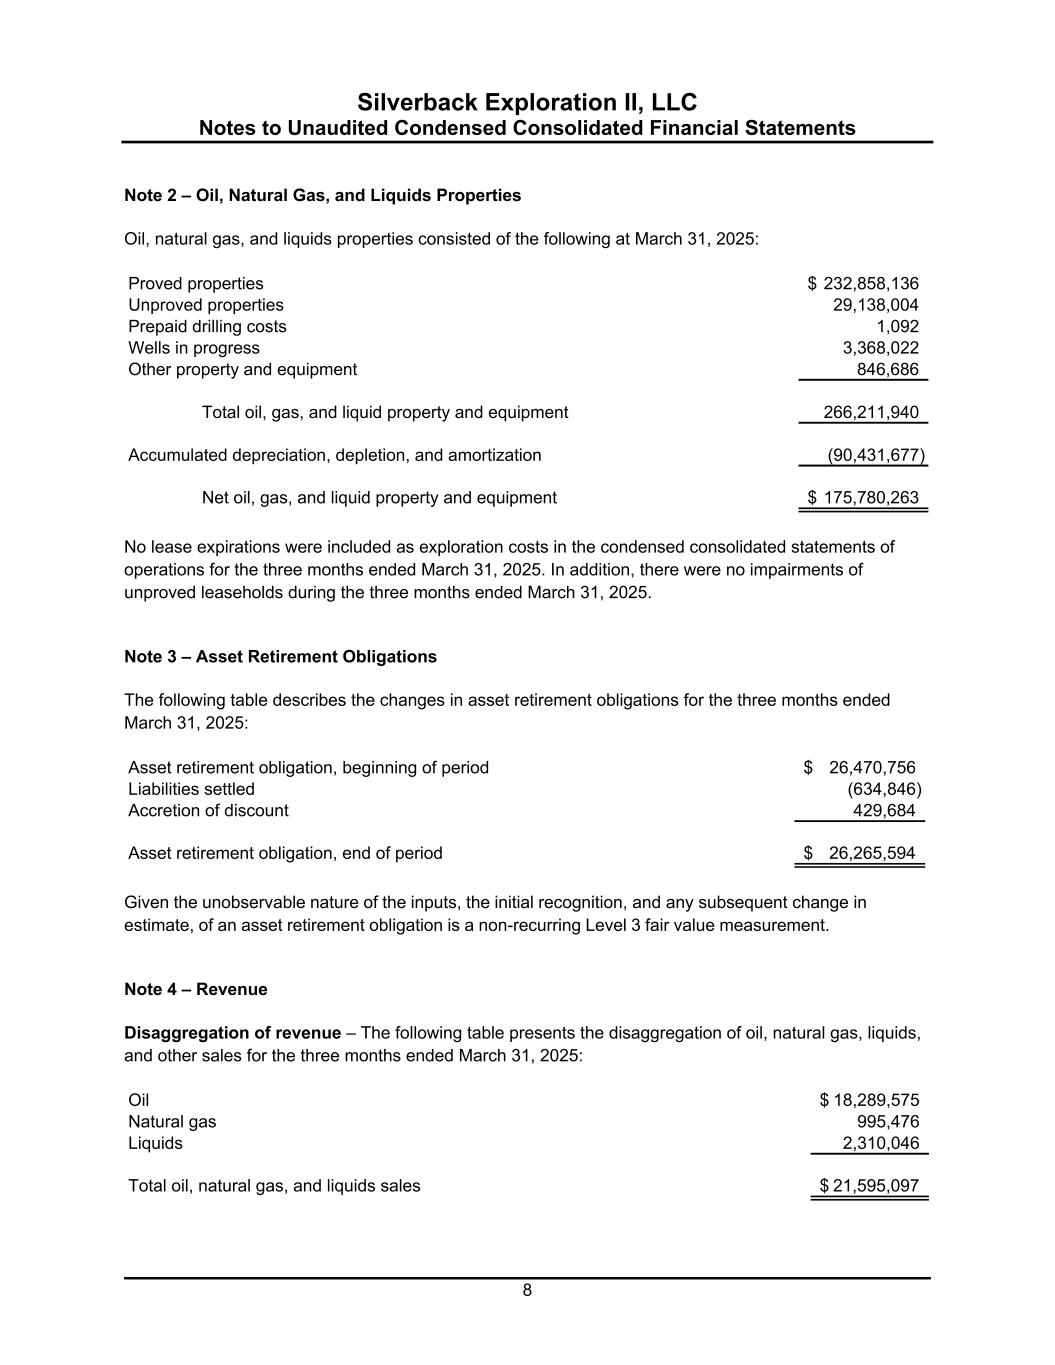
Silverback Exploration II, LLC Notes to Unaudited Condensed Consolidated Financial Statements 8 Note 2 – Oil, Natural Gas, and Liquids Properties Oil, natural gas, and liquids properties consisted of the following at March 31, 2025: Proved properties 232,858,136$ Unproved properties 29,138,004 Prepaid drilling costs 1,092 Wells in progress 3,368,022 Other property and equipment 846,686 Total oil, gas, and liquid property and equipment 266,211,940 Accumulated depreciation, depletion, and amortization (90,431,677) Net oil, gas, and liquid property and equipment 175,780,263$ No lease expirations were included as exploration costs in the condensed consolidated statements of operations for the three months ended March 31, 2025. In addition, there were no impairments of unproved leaseholds during the three months ended March 31, 2025. Note 3 – Asset Retirement Obligations The following table describes the changes in asset retirement obligations for the three months ended March 31, 2025: Asset retirement obligation, beginning of period 26,470,756$ Liabilities settled (634,846) Accretion of discount 429,684 Asset retirement obligation, end of period 26,265,594$ Given the unobservable nature of the inputs, the initial recognition, and any subsequent change in estimate, of an asset retirement obligation is a non-recurring Level 3 fair value measurement. Note 4 – Revenue Disaggregation of revenue – The following table presents the disaggregation of oil, natural gas, liquids, and other sales for the three months ended March 31, 2025: Oil 18,289,575$ Natural gas 995,476 Liquids 2,310,046 Total oil, natural gas, and liquids sales 21,595,097$
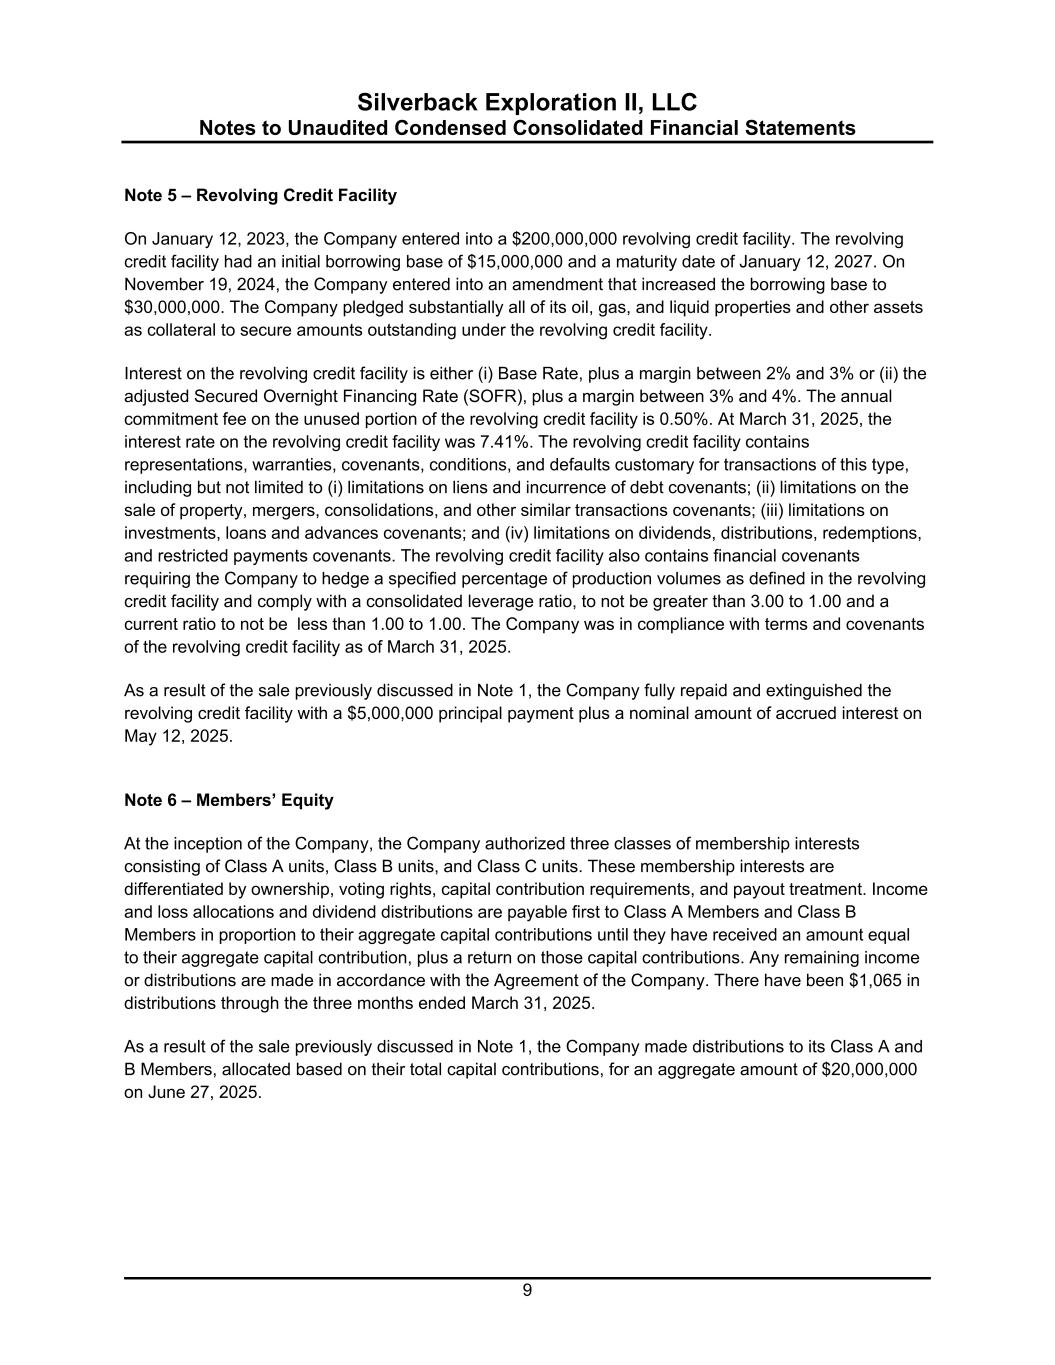
Silverback Exploration II, LLC Notes to Unaudited Condensed Consolidated Financial Statements 9 Note 5 – Revolving Credit Facility On January 12, 2023, the Company entered into a $200,000,000 revolving credit facility. The revolving credit facility had an initial borrowing base of $15,000,000 and a maturity date of January 12, 2027. On November 19, 2024, the Company entered into an amendment that increased the borrowing base to $30,000,000. The Company pledged substantially all of its oil, gas, and liquid properties and other assets as collateral to secure amounts outstanding under the revolving credit facility. Interest on the revolving credit facility is either (i) Base Rate, plus a margin between 2% and 3% or (ii) the adjusted Secured Overnight Financing Rate (SOFR), plus a margin between 3% and 4%. The annual commitment fee on the unused portion of the revolving credit facility is 0.50%. At March 31, 2025, the interest rate on the revolving credit facility was 7.41%. The revolving credit facility contains representations, warranties, covenants, conditions, and defaults customary for transactions of this type, including but not limited to (i) limitations on liens and incurrence of debt covenants; (ii) limitations on the sale of property, mergers, consolidations, and other similar transactions covenants; (iii) limitations on investments, loans and advances covenants; and (iv) limitations on dividends, distributions, redemptions, and restricted payments covenants. The revolving credit facility also contains financial covenants requiring the Company to hedge a specified percentage of production volumes as defined in the revolving credit facility and comply with a consolidated leverage ratio, to not be greater than 3.00 to 1.00 and a current ratio to not be less than 1.00 to 1.00. The Company was in compliance with terms and covenants of the revolving credit facility as of March 31, 2025. As a result of the sale previously discussed in Note 1, the Company fully repaid and extinguished the revolving credit facility with a $5,000,000 principal payment plus a nominal amount of accrued interest on May 12, 2025. Note 6 – Members’ Equity At the inception of the Company, the Company authorized three classes of membership interests consisting of Class A units, Class B units, and Class C units. These membership interests are differentiated by ownership, voting rights, capital contribution requirements, and payout treatment. Income and loss allocations and dividend distributions are payable first to Class A Members and Class B Members in proportion to their aggregate capital contributions until they have received an amount equal to their aggregate capital contribution, plus a return on those capital contributions. Any remaining income or distributions are made in accordance with the Agreement of the Company. There have been $1,065 in distributions through the three months ended March 31, 2025. As a result of the sale previously discussed in Note 1, the Company made distributions to its Class A and B Members, allocated based on their total capital contributions, for an aggregate amount of $20,000,000 on June 27, 2025.
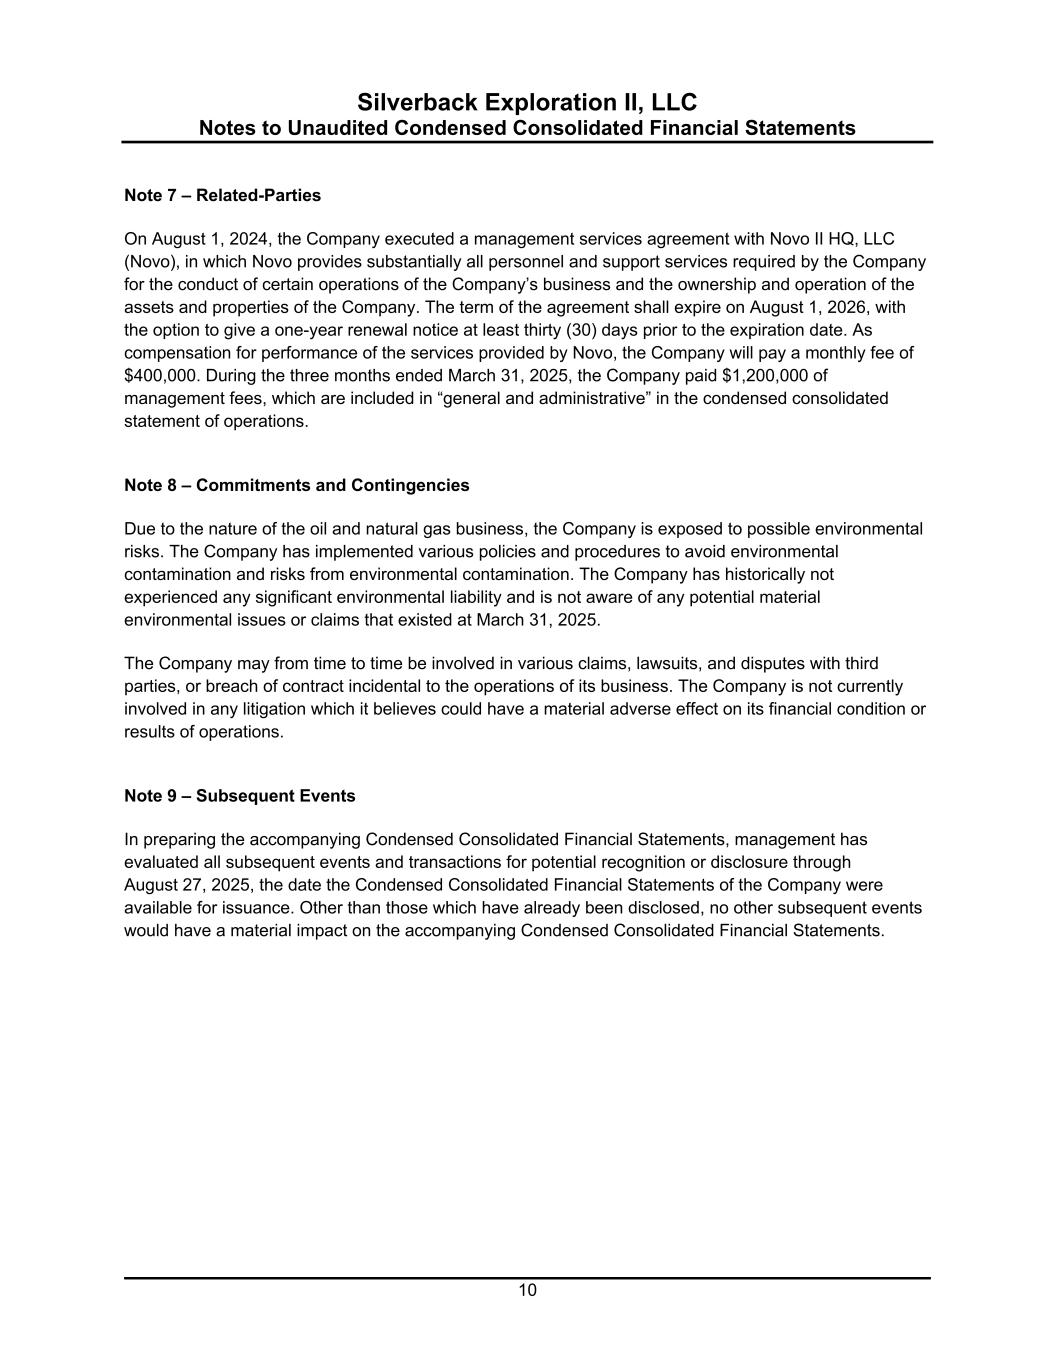
Silverback Exploration II, LLC Notes to Unaudited Condensed Consolidated Financial Statements 10 Note 7 – Related-Parties On August 1, 2024, the Company executed a management services agreement with Novo II HQ, LLC (Novo), in which Novo provides substantially all personnel and support services required by the Company for the conduct of certain operations of the Company’s business and the ownership and operation of the assets and properties of the Company. The term of the agreement shall expire on August 1, 2026, with the option to give a one-year renewal notice at least thirty (30) days prior to the expiration date. As compensation for performance of the services provided by Novo, the Company will pay a monthly fee of $400,000. During the three months ended March 31, 2025, the Company paid $1,200,000 of management fees, which are included in “general and administrative” in the condensed consolidated statement of operations. Note 8 – Commitments and Contingencies Due to the nature of the oil and natural gas business, the Company is exposed to possible environmental risks. The Company has implemented various policies and procedures to avoid environmental contamination and risks from environmental contamination. The Company has historically not experienced any significant environmental liability and is not aware of any potential material environmental issues or claims that existed at March 31, 2025. The Company may from time to time be involved in various claims, lawsuits, and disputes with third parties, or breach of contract incidental to the operations of its business. The Company is not currently involved in any litigation which it believes could have a material adverse effect on its financial condition or results of operations. Note 9 – Subsequent Events In preparing the accompanying Condensed Consolidated Financial Statements, management has evaluated all subsequent events and transactions for potential recognition or disclosure through August 27, 2025, the date the Condensed Consolidated Financial Statements of the Company were available for issuance. Other than those which have already been disclosed, no other subsequent events would have a material impact on the accompanying Condensed Consolidated Financial Statements.

Exhibit 99.3
RILEY EXPLORATION PERMIAN, INC.
UNAUDITED PRO FORMA CONDENSED COMBINED FINANCIAL STATEMENTS
The unaudited pro forma condensed combined financial information is prepared in accordance with Article 11 of Regulation S-X of the Securities Exchange Act of 1934 (“Article 11”) and should be read in conjunction with the accompanying notes. The following unaudited pro forma condensed combined financial information combines the historical consolidated financial position and results of operations of Riley Exploration Permian, Inc. (“Riley Permian”) and the historical consolidated financial position and results of operations of Silverback Exploration II, LLC (“Silverback”) after giving effect to the Silverback Acquisition as further described in Note 1. Description of the Transactions and Basis of Presentation and the pro forma effects of certain assumptions and adjustments described in “Notes to the Unaudited Pro Forma Condensed Combined Financial Information” below. The unaudited pro forma condensed combined financial information has been prepared to give effect to the following (collectively, the “Transactions”):
◦Application of the acquisition method of accounting under the provisions of the Financial Accounting Standards Board (“FASB”) Accounting Standards Codification (“ASC”) 805, Business Combinations (“ASC 805”) where the assets acquired and liabilities assumed of Silverback will be recorded by Riley Permian at their respective fair values as of the closing date;
◦Preliminary adjustments to conform the financial presentation of Silverback to those of Riley Permian;
◦Other transaction accounting adjustments, including transaction costs of the Silverback Acquisition; and
◦Other financing transaction accounting adjustments, including the effect of the drawdown on the credit facility.
The following pro forma financial statements and related notes are based on and should be read in conjunction with:
◦The historical audited consolidated financial statements of Riley Permian and the related notes included in Riley Permian’s Annual Report on Form 10-K as of and for the year ended December 31, 2024;
◦The historical audited consolidated financial statements of Silverback and the related notes included herein as of and for the year ended December 31, 2024;
◦The historical unaudited condensed consolidated financial statements of Riley Permian and the related notes included in Riley Permian’s Quarterly Report on Form 10-Q as of and for the three months ended March 31, 2025; and
◦The historical unaudited condensed consolidated financial statements of Silverback and the related notes included herein as of and for the three months ended March 31, 2025.
The unaudited pro forma condensed combined balance sheet as of March 31, 2025, gives pro forma effect to the Transactions as if they had been consummated on March 31, 2025. The unaudited pro forma condensed combined statements of operations for the three months ended March 31, 2025, and for the year ended December 31, 2024, give pro forma effect to the Transactions as if they had been consummated on January 1, 2024.
The unaudited pro forma condensed combined financial information has been prepared using the acquisition method of accounting pursuant to the provisions of ASC 805, whereby Riley Permian is considered the accounting acquirer. The consideration transferred will be allocated to the identifiable assets acquired and liabilities assumed based upon their estimated fair values as of the acquisition date, and any excess value of the consideration transferred over the acquired net assets will be recognized as goodwill, if applicable. The assets and liabilities of Silverback have been measured based on various preliminary estimates using assumptions that Riley Permian believes are reasonable based on information that is currently available. As a result, the unaudited pro forma condensed combined financial information has been presented for illustrative purposes only and is not necessarily indicative of the financial position and results of operations that would have been achieved had the Transactions occurred on the dates indicated.
The unaudited pro forma condensed combined financial information appearing below is based on available preliminary information and certain assumptions that are believed to be reasonable as of the date of this Form 8-K/A, and also does not consider any potential effects of changes in market conditions on revenues or expense efficiencies, among other factors. Future results may vary significantly from the results reflected because of various factors. As of the date of this filing, the valuation of the identifiable assets acquired and liabilities assumed remains ongoing and adjustments may be made. Riley Permian expects to complete the final purchase price allocation during the 12-month period subsequent to the close date.
1
Exhibit 99.3
| RILEY EXPLORATION PERMIAN, INC. | ||||||||||||||||||||||||||||||||||||||
| UNAUDITED PRO FORMA CONDENSED COMBINED BALANCE SHEET | ||||||||||||||||||||||||||||||||||||||
As of March 31, 2025 | ||||||||||||||||||||||||||||||||||||||
| Historical | Transaction Accounting Adjustments | |||||||||||||||||||||||||||||||||||||
Riley Permian | Silverback | Reclass Adjustments | Financing | Acquisition | Pro Forma Combined | |||||||||||||||||||||||||||||||||
| (In thousands, except share amounts) | ||||||||||||||||||||||||||||||||||||||
| Assets | ||||||||||||||||||||||||||||||||||||||
| Current Assets: | ||||||||||||||||||||||||||||||||||||||
| Cash | $ | 8,857 | $ | 11,824 | $ | — | $ | 125,000 | 4(a) | $ | (127,516) | 4(b) | $ | 18,165 | ||||||||||||||||||||||||
| Accounts receivable, net | 37,518 | — | 11,936 | 2(a) | — | (63) | 4(c) | 49,391 | ||||||||||||||||||||||||||||||
| Oil, gas and liquid sales | — | 8,085 | (8,085) | 2(a) | — | — | — | |||||||||||||||||||||||||||||||
| Joint interest owners | — | 3,554 | (3,554) | 2(a) | — | — | — | |||||||||||||||||||||||||||||||
| Other | — | 297 | (297) | 2(a) | — | — | — | |||||||||||||||||||||||||||||||
| Prepaid expenses | 1,838 | — | 1,670 | 2(b) | — | — | 3,508 | |||||||||||||||||||||||||||||||
| Prepaid expenses and other current assets | 1,670 | (1,670) | 2(b) | — | — | |||||||||||||||||||||||||||||||||
| Inventory | 4,346 | 6,880 | — | — | — | 11,226 | ||||||||||||||||||||||||||||||||
| Current derivative assets | 1,253 | — | 334 | 2(c) | — | — | 1,587 | |||||||||||||||||||||||||||||||
| Derivative instruments | — | 334 | (334) | 2(c) | — | — | — | |||||||||||||||||||||||||||||||
| Total Current Assets | 53,812 | 32,644 | — | 125,000 | (127,579) | 83,877 | ||||||||||||||||||||||||||||||||
| Oil and natural gas properties, net (successful efforts) | 864,655 | — | 175,150 | 2(d) | — | (42,949) | 4(c)(d) | 996,856 | ||||||||||||||||||||||||||||||
| Oil, gas and liquid properties, successful efforts method, net | — | 175,149 | (175,149) | 2(d) | — | — | — | |||||||||||||||||||||||||||||||
| Prepaid drilling costs | — | 1 | (1) | 2(d) | — | — | — | |||||||||||||||||||||||||||||||
| Other property and equipment, net | 34,968 | 630 | — | — | — | 35,598 | ||||||||||||||||||||||||||||||||
| Non-current derivative assets | 36 | — | — | — | — | 36 | ||||||||||||||||||||||||||||||||
| Equity method investment | 28,942 | — | — | — | — | 28,942 | ||||||||||||||||||||||||||||||||
| Other non-current assets, net | 12,531 | 609 | — | — | — | 13,140 | ||||||||||||||||||||||||||||||||
| Total Assets | $ | 994,944 | $ | 209,033 | $ | — | $ | 125,000 | $ | (170,528) | $ | 1,158,449 | ||||||||||||||||||||||||||
| Liabilities and Shareholders' Equity | ||||||||||||||||||||||||||||||||||||||
| Current Liabilities: | ||||||||||||||||||||||||||||||||||||||
| Accounts payable | $ | 18,134 | $ | 3,638 | $ | — | $ | — | $ | (7) | 4(c) | $ | 21,765 | |||||||||||||||||||||||||
| Accrued liabilities | 31,588 | 13,824 | — | — | 2,030 | 4(e) | 47,442 | |||||||||||||||||||||||||||||||
| Revenue payable | 34,161 | — | — | — | — | 34,161 | ||||||||||||||||||||||||||||||||
| Current derivative liabilities | 2,659 | — | 204 | 2(e) | — | — | 2,863 | |||||||||||||||||||||||||||||||
| Derivative instruments | — | 204 | (204) | 2(e) | — | — | — | |||||||||||||||||||||||||||||||
| Current portion of long-term debt | 20,000 | — | — | — | — | 20,000 | ||||||||||||||||||||||||||||||||
| Other current liabilities | 15,292 | — | 763 | 2(f) | — | 700 | 4(c)(g) | 16,755 | ||||||||||||||||||||||||||||||
| Asset retirement obligation | — | 763 | (763) | 2(f) | — | — | — | |||||||||||||||||||||||||||||||
| Total Current Liabilities | 121,834 | 18,429 | — | — | 2,723 | 142,986 | ||||||||||||||||||||||||||||||||
| Non-current derivative liabilities | 2,160 | — | — | — | — | 2,160 | ||||||||||||||||||||||||||||||||
| Asset retirement obligations | 33,340 | 25,502 | — | — | (7,216) | 4(c)(g) | 51,626 | |||||||||||||||||||||||||||||||
| Long-term debt | 229,342 | 4,671 | — | 125,000 | 4(a) | (4,671) | 4(f) | 354,342 | ||||||||||||||||||||||||||||||
| Deferred tax liabilities | 74,721 | — | — | — | — | 74,721 | ||||||||||||||||||||||||||||||||
| Other non-current liabilities | 1,164 | — | — | — | 3,100 | 4(h) | 4,264 | |||||||||||||||||||||||||||||||
| Total Liabilities | 462,561 | 48,602 | — | 125,000 | (6,064) | 630,099 | ||||||||||||||||||||||||||||||||
| Commitments and Contingencies | ||||||||||||||||||||||||||||||||||||||
| Shareholders' Equity: | ||||||||||||||||||||||||||||||||||||||
| Preferred stock, $0.0001 par value, 25,000,000 shares authorized; 0 shares issued and outstanding | — | — | — | — | — | — | ||||||||||||||||||||||||||||||||
Common stock, $0.001 par value, 240,000,000 shares authorized; 21,885,008 shares issued and outstanding at March 31, 2025 | 21 | — | — | — | — | 21 | ||||||||||||||||||||||||||||||||
| Additional paid-in capital | 311,529 | — | — | — | — | 311,529 | ||||||||||||||||||||||||||||||||
| Members' Equity | — | 160,431 | — | — | (160,431) | 4(i) | — | |||||||||||||||||||||||||||||||
| Retained earnings | 220,833 | — | — | — | (4,033) | 4(i) | 216,800 | |||||||||||||||||||||||||||||||
| Total Shareholders' Equity | 532,383 | 160,431 | — | — | (164,464) | 528,350 | ||||||||||||||||||||||||||||||||
| Total Liabilities and Shareholders' Equity | $ | 994,944 | $ | 209,033 | $ | — | $ | 125,000 | $ | (170,528) | $ | 1,158,449 | ||||||||||||||||||||||||||
2
Exhibit 99.3
| RILEY EXPLORATION PERMIAN, INC. | |||||||||||||||||||||||||||||||||||||||||
| UNAUDITED PRO FORMA CONDENSED COMBINED STATEMENT OF OPERATIONS | |||||||||||||||||||||||||||||||||||||||||
For the Three Months Ended March 31, 2025 | |||||||||||||||||||||||||||||||||||||||||
| Historical | Transaction Accounting Adjustments | ||||||||||||||||||||||||||||||||||||||||
Riley Permian | Silverback | Reclass Adjustments | Financing | Acquisition | Pro Forma Combined | ||||||||||||||||||||||||||||||||||||
| (In thousands, except per share amounts) | |||||||||||||||||||||||||||||||||||||||||
| Revenues: | |||||||||||||||||||||||||||||||||||||||||
| Oil and natural gas sales, net | $ | 102,457 | $ | — | $ | 20,514 | 2(g) | $ | — | $ | — | $ | 122,971 | ||||||||||||||||||||||||||||
| Oil, natural gas, liquids and other sales | — | 21,595 | (21,595) | 2(g) | — | — | — | ||||||||||||||||||||||||||||||||||
| Total Revenues | 102,457 | 21,595 | (1,081) | — | — | 122,971 | |||||||||||||||||||||||||||||||||||
| Costs and Expenses: | — | ||||||||||||||||||||||||||||||||||||||||
| Lease operating expenses | 18,331 | 3,591 | 1,023 | 2(h) | — | — | 22,945 | ||||||||||||||||||||||||||||||||||
| Workover expense | — | 1,023 | (1,023) | 2(h) | — | — | — | ||||||||||||||||||||||||||||||||||
| Gathering, processing and marketing | — | 1,081 | (1,081) | 2(g) | — | — | — | ||||||||||||||||||||||||||||||||||
| Production and ad valorem taxes | 6,670 | 1,682 | — | — | — | 8,352 | |||||||||||||||||||||||||||||||||||
| Exploration costs | 9 | — | 104 | 2(i) | — | — | 113 | ||||||||||||||||||||||||||||||||||
| Exploration and rentals | — | 104 | (104) | 2(i) | — | — | — | ||||||||||||||||||||||||||||||||||
| Depletion, depreciation, amortization and accretion | 19,138 | 9,833 | — | — | (3,936) | 5(b) | 25,035 | ||||||||||||||||||||||||||||||||||
| General and administrative: | — | — | |||||||||||||||||||||||||||||||||||||||
| Administrative costs | 7,438 | — | 1,687 | 2(j)(m) | — | — | 9,125 | ||||||||||||||||||||||||||||||||||
| Share-based compensation expense | 1,369 | — | — | — | — | 1,369 | |||||||||||||||||||||||||||||||||||
| General and administrative | — | 1,683 | (1,683) | 2(j) | — | — | — | ||||||||||||||||||||||||||||||||||
| Transaction costs | — | 54 | — | — | — | 54 | |||||||||||||||||||||||||||||||||||
| Total Cost and Expenses | 52,955 | 19,051 | (1,077) | — | (3,936) | 66,993 | |||||||||||||||||||||||||||||||||||
| Income from Operations | 49,502 | 2,544 | (4) | — | 3,936 | 55,978 | |||||||||||||||||||||||||||||||||||
| Other Income (Expense): | — | ||||||||||||||||||||||||||||||||||||||||
| Interest expense, net | (6,661) | (226) | — | (2,368) | 5(a) | 226 | 5(d) | (9,029) | |||||||||||||||||||||||||||||||||
| Gain (loss) on derivatives, net | (5,850) | — | (74) | 2(k) | — | — | (5,924) | ||||||||||||||||||||||||||||||||||
| Unrealized commodity derivative loss | — | (168) | 168 | 2(k) | — | — | — | ||||||||||||||||||||||||||||||||||
| Realized commodity derivative gain | — | 94 | (94) | 2(k) | — | — | — | ||||||||||||||||||||||||||||||||||
| Gain on sale of oil and gas properties | — | 1,123 | — | — | (1,123) | 5(e) | — | ||||||||||||||||||||||||||||||||||
| Other loss | — | (4) | 4 | 2(m) | — | — | — | ||||||||||||||||||||||||||||||||||
| Loss from equity method investment | (119) | — | — | — | — | (119) | |||||||||||||||||||||||||||||||||||
| Total Other Income (Expense) | (12,630) | 819 | 4 | (2,368) | (897) | (15,072) | |||||||||||||||||||||||||||||||||||
| Net Income from Operations before Income Taxes | 36,872 | 3,363 | — | (2,368) | 3,039 | 40,906 | |||||||||||||||||||||||||||||||||||
| Income tax expense | (8,239) | — | — | 609 | 5(f) | (1,645) | 5(f) | (9,275) | |||||||||||||||||||||||||||||||||
| Net Income | $ | 28,633 | $ | 3,363 | $ | — | $ | (1,759) | $ | 1,394 | $ | 31,631 | |||||||||||||||||||||||||||||
| Net Income per Share: | |||||||||||||||||||||||||||||||||||||||||
| Basic | $ | 1.36 | $ | 1.50 | 5(g) | ||||||||||||||||||||||||||||||||||||
| Diluted | $ | 1.36 | $ | 1.50 | 5(g) | ||||||||||||||||||||||||||||||||||||
| Weighted Average Common Shares Outstanding: | |||||||||||||||||||||||||||||||||||||||||
| Basic | 21,111 | 21,111 | |||||||||||||||||||||||||||||||||||||||
| Diluted | 21,111 | 21,111 | |||||||||||||||||||||||||||||||||||||||
3
Exhibit 99.3
| RILEY EXPLORATION PERMIAN, INC. | |||||||||||||||||||||||||||||||||||||||||
| UNAUDITED PRO FORMA CONDENSED COMBINED STATEMENT OF OPERATIONS | |||||||||||||||||||||||||||||||||||||||||
For the Year Ended December 31, 2024 | |||||||||||||||||||||||||||||||||||||||||
| Historical | Transaction Accounting Adjustments | ||||||||||||||||||||||||||||||||||||||||
Riley Permian | Silverback | Reclass Adjustments | Financing | Acquisition | Pro Forma Combined | ||||||||||||||||||||||||||||||||||||
| (In thousands, except per share amounts) | |||||||||||||||||||||||||||||||||||||||||
| Revenues: | |||||||||||||||||||||||||||||||||||||||||
| Oil and natural gas sales, net | $ | 409,801 | $ | — | $ | 74,394 | 2(g) | $ | — | $ | — | $ | 484,195 | ||||||||||||||||||||||||||||
| Oil, natural gas, liquids and other sales | — | 77,825 | (77,825) | 2(g) | — | — | — | ||||||||||||||||||||||||||||||||||
| Contract services - related parties | 380 | — | — | — | 380 | ||||||||||||||||||||||||||||||||||||
| Total Revenues | 410,181 | 77,825 | (3,431) | — | — | 484,575 | |||||||||||||||||||||||||||||||||||
| Costs and Expenses: | |||||||||||||||||||||||||||||||||||||||||
| Lease operating expenses | 71,463 | 13,012 | 7,083 | 2(h) | — | — | 91,558 | ||||||||||||||||||||||||||||||||||
| Workover expense | — | 7,083 | (7,083) | 2(h) | — | — | — | ||||||||||||||||||||||||||||||||||
| Gathering, processing and marketing | — | 3,431 | (3,431) | 2(g) | — | — | — | ||||||||||||||||||||||||||||||||||
| Production and ad valorem taxes | 29,428 | 6,238 | — | — | — | 35,666 | |||||||||||||||||||||||||||||||||||
| Exploration costs | 2,595 | — | 292 | 2(i) | — | — | 2,887 | ||||||||||||||||||||||||||||||||||
| Exploration and rentals | — | 292 | (292) | 2(i) | — | — | |||||||||||||||||||||||||||||||||||
| Depletion, depreciation, amortization and accretion | 74,900 | 32,636 | — | — | (13,034) | 5(b) | 94,502 | ||||||||||||||||||||||||||||||||||
| Impairment of oil and natural gas properties | 11,317 | — | — | — | — | 11,317 | |||||||||||||||||||||||||||||||||||
| Impairment expense | — | 3,091 | (3,091) | 2(l) | — | — | — | ||||||||||||||||||||||||||||||||||
| Other impairments | 30,158 | — | 3,091 | 2(l) | — | 33,249 | |||||||||||||||||||||||||||||||||||
| General and administrative: | — | ||||||||||||||||||||||||||||||||||||||||
| Administrative costs | 26,551 | — | 12,303 | 2(j)(m) | — | 38,854 | |||||||||||||||||||||||||||||||||||
| Share-based compensation expense | 8,138 | — | — | — | — | 8,138 | |||||||||||||||||||||||||||||||||||
| General and administrative | — | 11,982 | (11,982) | 2(j) | — | — | — | ||||||||||||||||||||||||||||||||||
| Cost of contract services - related parties | 363 | — | — | — | — | 363 | |||||||||||||||||||||||||||||||||||
| Transaction costs | 1,573 | 235 | — | — | 4,033 | 5(c) | 5,841 | ||||||||||||||||||||||||||||||||||
| Credit loss expense | — | 5 | (5) | 2(m) | — | — | |||||||||||||||||||||||||||||||||||
| Total Cost and Expenses | 256,486 | 78,005 | (3,115) | — | (9,001) | 322,375 | |||||||||||||||||||||||||||||||||||
| Income (Loss) from Operations | 153,695 | (180) | (316) | — | 9,001 | 162,200 | |||||||||||||||||||||||||||||||||||
| Other Income (Expense): | — | — | |||||||||||||||||||||||||||||||||||||||
| Interest expense, net | (34,338) | (1,348) | — | (9,474) | 5(a) | 1,348 | 5(d) | (43,812) | |||||||||||||||||||||||||||||||||
| Gain (loss) on derivatives, net | (1,665) | — | (1,134) | 2(k) | — | — | (2,799) | ||||||||||||||||||||||||||||||||||
| Unrealized commodity derivative loss | — | (1,886) | 1,886 | 2(k) | — | — | — | ||||||||||||||||||||||||||||||||||
| Realized commodity derivative gain | — | 752 | (752) | 2(k) | — | — | — | ||||||||||||||||||||||||||||||||||
| Other expense | — | (316) | 316 | 2(m) | — | — | — | ||||||||||||||||||||||||||||||||||
| Loss from equity method investment | (721) | — | — | — | — | (721) | |||||||||||||||||||||||||||||||||||
| Total Other Income (Expense) | (36,724) | (2,798) | 316 | (9,474) | 1,348 | (47,332) | |||||||||||||||||||||||||||||||||||
| Net Income (Loss) from Operations Before Income Taxes | 116,971 | (2,978) | — | (9,474) | 10,349 | 114,868 | |||||||||||||||||||||||||||||||||||
| Income tax expense | (28,074) | — | — | 2,435 | 5(f) | (1,894) | 5(f) | (27,533) | |||||||||||||||||||||||||||||||||
| Net Income (Loss) | $ | 88,897 | $ | (2,978) | $ | — | $ | (7,039) | $ | 8,455 | $ | 87,335 | |||||||||||||||||||||||||||||
| Net Income per Share: | |||||||||||||||||||||||||||||||||||||||||
| Basic | $ | 4.29 | $ | 4.22 | 5(g) | ||||||||||||||||||||||||||||||||||||
| Diluted | $ | 4.26 | $ | 4.18 | 5(g) | ||||||||||||||||||||||||||||||||||||
| Weighted Average Common Shares Outstanding: | |||||||||||||||||||||||||||||||||||||||||
| Basic | 20,712 | 20,712 | |||||||||||||||||||||||||||||||||||||||
| Diluted | 20,875 | 20,875 | |||||||||||||||||||||||||||||||||||||||
4
Exhibit 99.3
NOTES TO UNAUDITED PRO FORMA CONDENSED COMBINED FINANCIAL STATEMENTS
Note 1. Description of the Transactions and Basis of Presentation
Acquisition of Silverback
On July 1, 2025 (“Closing Date”), Riley Permian completed its previously announced acquisition of 100% of the ownership interests of Silverback (the “Silverback Acquisition”). The Silverback Acquisition was completed pursuant to the securities purchase agreement (the “Purchase Agreement”) dated May 3, 2025, which provided for an aggregate purchase price of approximately $142 million, subject to customary purchase price adjustments, plus quarterly earnout payments of up to approximately $1.9 million per fiscal quarter during calendar years 2026 and 2027, contingent upon the NYMEX WTI quarterly average exceeding specified thresholds ranging $70 to $75 per barrel or higher. At closing on July 1, 2025, the fair value of the consideration transferred was adjusted to approximately $129 million, which reflected certain purchase price adjustments and inclusion of the fair value of the contingent consideration. We funded the cash consideration with borrowings from our revolving credit facility.
Basis of Presentation
The unaudited pro forma condensed combined financial information has been prepared in accordance with Article 11. The unaudited pro forma condensed combined balance sheet as of March 31, 2025, combines the historical unaudited condensed consolidated balance sheets of Riley Permian and Silverback, giving effect to the Transactions as if they had been consummated on March 31, 2025. The unaudited pro forma condensed combined statements of operations for the three months ended March 31, 2025, and for the year ended December 31, 2024, combines the historical condensed consolidated statements of operations of Riley Permian and Silverback, giving effect to the Transactions as if they had been consummated on January 1, 2024.
The pro forma financial statements and explanatory notes have been prepared to illustrate the effects of the Silverback Acquisition under the acquisition method of accounting whereby Riley Permian is considered the accounting acquirer. The pro forma financial statements are presented for informational purposes only and do not necessarily indicate the financial results of the combined company had the companies been combined at the beginning of the periods presented, nor do they necessarily indicate the results of operations in future periods or the future financial position of the combined company. The results of operations of the combined company will be reported prospectively after closing following completion of the Silverback Acquisition. Under the acquisition method of accounting, the assets and liabilities of Silverback, as of closing, will be recorded by Riley Permian at their estimated fair values and any excess of the consideration transferred over the fair value of Silverback’s net assets will be allocated to goodwill, if applicable. The pro forma allocation of the consideration transferred reflected in the pro forma financial statements is subject to adjustment and may vary materially from the actual allocation that will be recorded as of the closing date.
The unaudited pro forma condensed combined financial information is presented for illustrative purposes only and does not reflect the costs of any integration activities or cost savings or synergies that may be achieved as a result of the Silverback Acquisition.
Note 2. Significant Accounting Policies and Reclassification Adjustments
During the preparation of the pro forma financial statements, Riley Permian performed a preliminary analysis of Silverback’s historical financial information to identify differences in accounting policies and financial statement presentation as compared to those of Riley Permian. Accordingly, certain reclassification adjustments have been made to conform Silverback’s historical financial statements to the presentation used by Riley Permian in the preparation of the pro forma financial statements.
The following reclassification adjustments were made to conform the presentation of Silverback’s historical condensed consolidated balance sheet as of March 31, 2025, to Riley Permian’s presentation:
(a)Represents a reclassification from accounts receivable oil, gas and liquid sales, joint interest owners and other to accounts receivable, net.
(b)Represents a reclassification from prepaid expenses and other current assets to prepaid expenses.
(c)Represents a reclassification from derivative instruments to current derivative assets.
5
Exhibit 99.3
(d)Represents a reclassification from oil, gas and liquid properties, successful efforts method, net and prepaid drilling costs to oil and natural gas properties, net (successful efforts).
(e)Represents a reclassification from derivative instruments to current derivative liabilities.
(f)Represents a reclassification from asset retirement obligation to other current liabilities.
The following reclassification adjustments were made to conform the presentation of Silverback’s historical condensed consolidated statements of operations for the three months ended March 31, 2025, and for the year ended December 31, 2024, to Riley Permian’s presentation:
(g)Represents a reclassification from oil, natural gas, liquids and other sales and gathering, processing and marketing to oil and natural gas sales, net.
(h)Represents a reclassification from workover expense to lease operating expenses.
(i)Represents a reclassification from exploration and rentals to exploration costs.
(j)Represents a reclassification from general and administrative to administrative costs.
(k)Represents a reclassification from unrealized commodity derivative loss and realized commodity derivative gain to gain (loss) on derivatives, net.
(l)Represents a reclassification from impairment expense to other impairments.
(m)Represents a reclassification from other loss, other expense and credit loss expense to administrative costs.
Note 3. Preliminary Purchase Price Allocation
Preliminary Purchase Price Allocation
The preliminary consideration transferred is allocated to the identifiable assets acquired and liabilities assumed of Silverback based on their preliminary estimated fair values. The fair value assessments are preliminary and are based on available information and certain assumptions, which Riley Permian believes are reasonable. The following table sets forth a preliminary allocation of the preliminary consideration transferred to the fair value of the identifiable tangible and intangible assets acquired and liabilities assumed of Silverback using Silverback’s balance sheet as of March 31, 2025, adjusted for reclassifications and presentational alignment to that of Riley Permian’s historical financial information:
6
Exhibit 99.3
| Preliminary Purchase Price Allocation | ||||||||
| (In thousands) | ||||||||
Cash consideration paid to Sellers upon closing | $ | 125,513 | ||||||
Preliminary estimated fair value of Earnout | 3,100 | |||||||
Total consideration transferred | $ | 128,613 | ||||||
Fair value of assets acquired: | ||||||||
Cash | $ | 11,824 | ||||||
| Accounts receivable | 11,873 | |||||||
Prepaid expenses | 1,670 | |||||||
| Inventory | 6,880 | |||||||
Current derivative assets | 334 | |||||||
Oil and natural gas properties (successful efforts) | 132,201 | |||||||
Other property and equipment | 630 | |||||||
Other non-current assets | 609 | |||||||
Amount attributable to assets acquired | $ | 166,021 | ||||||
Fair value of liabilities assumed: | ||||||||
| Accounts payable | $ | 3,631 | ||||||
Accrued liabilities | 13,824 | |||||||
| Current derivative liabilities | 204 | |||||||
| Asset retirement obligations | 19,749 | |||||||
| Amount attributable to liabilities assumed | $ | 37,408 | ||||||
| Net assets acquired | $ | 128,613 | ||||||
Note 4. Adjustments to the Unaudited Pro Forma Condensed Combined Balance Sheet
Transaction accounting adjustments include the following adjustments related to the unaudited pro forma condensed combined balance sheet as of March 31, 2025, as follows:
Financing Transaction Accounting Adjustments
(a)Represents the borrowings of $125 million of principal amount under the terms of Riley Permian’s revolving credit facility. Riley Permian used the proceeds from the additional borrowings to fund the Silverback Acquisition and for general corporate purposes.
Acquisition Transaction Accounting Adjustments
(b)Represents an adjustment of $127.5 million to decrease the amount of cash, which was determined as follows:
As of March 31, 2025 | ||||||||
| (In thousands) | ||||||||
| Cash consideration transferred | $ | (125,513) | ||||||
Transaction costs paid at closing | (2,003) | |||||||
| Pro forma net adjustment to cash | $ | (127,516) | ||||||
(c)Represents an adjustment to remove assets not acquired and liabilities not assumed in the Silverback Acquisition.
7
Exhibit 99.3
(d)Represents an adjustment of $38.8 million to the carrying amounts of Silverback’s oil and natural gas properties from their recorded net book values to their preliminary estimated fair values.
(e)Represents an adjustment of $2.0 million to record estimated transaction costs expected to be incurred by Riley Permian as an increase to accrued liabilities and a corresponding decrease to retained earnings. These costs are non-recurring and are not expected to have a continuing impact on the combined company’s operating results in future periods.
(f)Represents an adjustment of $4.7 million to long-term debt to reflect the settlement of Silverback’s historical long-term debt prior to the consummation of the Silverback Acquisition.
(g)Represents an adjustment of $5.1 million to the carrying amount of Silverback’s asset retirement obligations from their recorded net book values to their preliminary estimated fair values.
(h)Represents an adjustment of $3.1 million to reflect the fair value of contingent consideration in connection with the Silverback Acquisition.
(i)The following table summarizes the transaction accounting adjustments impacting the historical equity balances of Silverback:
| Adjustments to Silverback Equity | Transaction Costs | Total Transaction Accounting Adjustments | ||||||||||||||||||
| (In thousands) | ||||||||||||||||||||
| Preferred Stock | $ | — | $ | — | $ | — | ||||||||||||||
| Common Stock | — | — | — | |||||||||||||||||
| Additional paid-in capital | — | — | — | |||||||||||||||||
| Members' Equity | (160,431) | — | (160,431) | |||||||||||||||||
| Retained earnings | — | (4,033) | (4,033) | |||||||||||||||||
Pro forma net adjustments to equity | $ | (160,431) | $ | (4,033) | $ | (164,464) | ||||||||||||||
Elimination of Silverback’s Historical Equity: Represents the elimination of Silverback’s historical equity balances as of March 31, 2025.
Transaction Costs: Represents $4.0 million of estimated transaction costs expected to be incurred in connection with the Silverback Acquisition.
Note 5. Adjustments to the Unaudited Pro Forma Condensed Combined Statements of Operations
Transaction accounting adjustments include the following adjustments related to the unaudited pro forma condensed combined statements of operations for the three months ended March 31, 2025, and for the year ended December 31, 2024, as follows:
Financing Transaction Accounting Adjustments
(a)Represents an adjustment to interest expense related to the borrowings under the terms of Riley Permian’s revolving credit facility.
A 1/8 percent variance in the effective interest rate on the borrowings used to finance the Silverback Acquisition would result in a change in interest expense of approximately $39 thousand and $156 thousand for the three months ended March 31, 2025, and for the year ended December 31, 2024, respectively.
Acquisition Transaction Accounting Adjustments
(b)Represents an adjustment to reflect a decrease in depletion, depreciation, amortization and accretion expense of $3.9 million and $13.0 million for the three months ended March 31, 2025, and for the year ended December 31, 2024, respectively. This adjustment was calculated in accordance with the successful efforts method of accounting for oil and gas properties, which were based on the preliminary purchase price allocation of the estimated fair value of Silverback’s oil and natural gas properties.
8
Exhibit 99.3
(c)Represents an adjustment of $4.0 million to record estimated transaction costs expected to be incurred by Riley Permian in connection with the Silverback Acquisition for the year ended December 31, 2024. These costs are non-recurring and are not expected to have a continuing impact on the combined company’s operating results in future periods.
(d)Represents an adjustment to eliminate Silverback’s historical interest expense related to its settlement of long-term debt prior to the consummation of the Silverback Acquisition.
(e)Represents an adjustment to eliminate Silverback’s historical gain on sale of oil and gas properties related to assets not acquired and liabilities not assumed in the Silverback Acquisition.
(f)Represents the estimated income tax impact of adjustments to the unaudited pro forma condensed combined statements of operations for the three months ended March 31, 2025, and for the year ended December 31, 2024. A blended statutory rate of 25.7% has been assumed for both periods for purposes of the pro forma adjustments. The blended statutory rate is not necessarily indicative of the effective tax rate of the combined company.
(g)The unaudited pro forma combined basic and diluted earnings per share calculations are based on the weighted average basic and diluted shares of Riley Permian. The following table summarizes the computation of the unaudited pro forma basic and diluted net income per share:
| For the Three Months Ended March 31, 2025 | For the Year Ended December 31, 2024 | |||||||||||||
| (In thousands) | ||||||||||||||
| Pro forma net income | $ | 31,631 | $ | 87,335 | ||||||||||
| Basic weighted-average common shares outstanding | 21,111 | 20,712 | ||||||||||||
| Restricted shares | — | 163 | ||||||||||||
Diluted weighted-average common shares outstanding | 21,111 | 20,875 | ||||||||||||
Basic net income per common share | $ | 1.50 | $ | 4.22 | ||||||||||
Diluted net income per common share | $ | 1.50 | $ | 4.18 | ||||||||||
Note 6. Supplemental Pro Forma Oil and Natural Gas Reserves Information
The following estimated pro forma oil and gas reserves information is not necessarily indicative of the results that might have occurred had the Transactions been consummated on January 1, 2024, and is not intended to be a projection of future results. Future results may vary significantly from the results reflected because of various factors. The reserve information for the Company has been prepared by Ryder Scott, LLC, independent petroleum engineers. Silverback’s reserve information has been prepared by Silverback’s independent reservoir engineers. An explanation of the underlying methodology applied to the Company’s reserve information, as required by SEC regulations, can be found within the Annual Report on Form 10-K as of and for the year ended December 31, 2024. The Silverback reserve information is provided and discussed in the footnotes to their financial statements for the year ended December 31, 2024, included elsewhere in this filing; and, this Silverback reserve information is reflective of the historical assumptions and development plans of Silverback at that time. The following tables set forth the estimated pro forma combined proved developed and undeveloped reserves information as of December 31, 2024, along with a summary of changes in quantities of remaining proved and unproved reserves during the year ended December 31, 2024:
9
Exhibit 99.3
| Oil (MBbls) | ||||||||||||||||||||
| Historical | Pro Forma Combined | |||||||||||||||||||
Riley Permian | Silverback | |||||||||||||||||||
| December 31, 2023 | 66,308 | 20,587 | 86,895 | |||||||||||||||||
| Acquisitions | 1,989 | — | 1,989 | |||||||||||||||||
| Extensions and discoveries | 8,894 | 406 | 9,300 | |||||||||||||||||
| Revisions | (5,137) | (3,914) | (9,051) | |||||||||||||||||
| Production | (5,519) | (1,050) | (6,569) | |||||||||||||||||
| December 31, 2024 | 66,535 | 16,029 | 82,564 | |||||||||||||||||
| Proved Developed Reserves, Included Above: | ||||||||||||||||||||
| December 31, 2023 | 36,731 | 3,204 | 39,935 | |||||||||||||||||
| December 31, 2024 | 40,111 | 3,470 | 43,581 | |||||||||||||||||
| Proved Undeveloped Reserves, Included Above | ||||||||||||||||||||
| December 31, 2023 | 29,577 | 17,383 | 46,960 | |||||||||||||||||
| December 31, 2024 | 26,424 | 12,560 | 38,984 | |||||||||||||||||
Natural Gas (MMcf) | ||||||||||||||||||||
| Historical | Pro Forma Combined | |||||||||||||||||||
Riley Permian | Silverback | |||||||||||||||||||
| December 31, 2023 | 123,948 | 37,354 | 161,302 | |||||||||||||||||
| Acquisitions | 6,624 | — | 6,624 | |||||||||||||||||
| Extensions and discoveries | 17,218 | 1,023 | 18,241 | |||||||||||||||||
| Revisions | 21,933 | (2,299) | 19,634 | |||||||||||||||||
| Production | (7,484) | (2,811) | (10,295) | |||||||||||||||||
| December 31, 2024 | 162,239 | 33,267 | 195,506 | |||||||||||||||||
| Proved Developed Reserves, Included Above: | ||||||||||||||||||||
| December 31, 2023 | 71,671 | 6,721 | 78,392 | |||||||||||||||||
| December 31, 2024 | 103,337 | 8,314 | 111,651 | |||||||||||||||||
| Proved Undeveloped Reserves, Included Above | ||||||||||||||||||||
| December 31, 2023 | 52,277 | 30,633 | 82,910 | |||||||||||||||||
| December 31, 2024 | 58,902 | 24,953 | 83,855 | |||||||||||||||||
10
Exhibit 99.3
NGLs (MBbl) | ||||||||||||||||||||
| Historical | Pro Forma Combined | |||||||||||||||||||
Riley Permian | Silverback | |||||||||||||||||||
| December 31, 2023 | 20,749 | 5,024 | 25,773 | |||||||||||||||||
| Acquisitions | 1,176 | — | 1,176 | |||||||||||||||||
| Extensions and discoveries | 3,837 | 169 | 4,006 | |||||||||||||||||
| Revisions | 5,751 | 528 | 6,279 | |||||||||||||||||
| Production | (1,486) | (370) | (1,856) | |||||||||||||||||
| December 31, 2024 | 30,027 | 5,351 | 35,378 | |||||||||||||||||
| Proved Developed Reserves, Included Above: | ||||||||||||||||||||
| December 31, 2023 | 11,502 | 940 | 12,442 | |||||||||||||||||
| December 31, 2024 | 19,312 | 1,323 | 20,635 | |||||||||||||||||
| Proved Undeveloped Reserves, Included Above | ||||||||||||||||||||
| December 31, 2023 | 9,247 | 4,084 | 13,331 | |||||||||||||||||
| December 31, 2024 | 10,715 | 4,028 | 14,743 | |||||||||||||||||
Total Reserves Equivalent (MBoe) | ||||||||||||||||||||
| Historical | Pro Forma Combined | |||||||||||||||||||
Riley Permian | Silverback | |||||||||||||||||||
| December 31, 2023 | 107,715 | 31,837 | 139,552 | |||||||||||||||||
| Acquisitions | 4,269 | — | 4,269 | |||||||||||||||||
| Extensions and discoveries | 15,600 | 746 | 16,346 | |||||||||||||||||
| Revisions | 4,270 | (3,770) | 500 | |||||||||||||||||
| Production | (8,252) | (1,889) | (10,141) | |||||||||||||||||
| December 31, 2024 | 123,602 | 26,924 | 150,526 | |||||||||||||||||
| Proved Developed Reserves, Included Above: | ||||||||||||||||||||
| December 31, 2023 | 60,178 | 5,264 | 65,442 | |||||||||||||||||
| December 31, 2024 | 76,646 | 6,179 | 82,825 | |||||||||||||||||
| Proved Undeveloped Reserves, Included Above | ||||||||||||||||||||
| December 31, 2023 | 47,537 | 26,573 | 74,110 | |||||||||||||||||
| December 31, 2024 | 46,956 | 20,746 | 67,702 | |||||||||||||||||
Standardized Measure of Discounted Future Net Cash Flows Relating to Proved Oil, Natural Gas and NGL Reserves
The following estimated pro forma standardized measure is not necessarily indicative of the results that might have occurred had the Transactions been consummated on January 1, 2024, and is not intended to be a projection of future results. Future results may vary significantly from the results reflected because of various factors. The following tables present the estimated pro forma discounted future net cash flows as of December 31, 2024. The pro forma standardized measure information set forth below gives effect to the Transactions as if they were consummated on January 1, 2024:
11
Exhibit 99.3
Year Ended December 31, 2024 | ||||||||||||||||||||||||||
| Historical | Pro Forma Adjustments(1) | Pro Forma Combined | ||||||||||||||||||||||||
Riley Permian | Silverback | |||||||||||||||||||||||||
| (In thousands) | ||||||||||||||||||||||||||
| Future crude oil, natural gas and NGLs sales | $ | 4,764,599 | $ | 1,231,869 | $ | — | $ | 5,996,468 | ||||||||||||||||||
| Future production costs | (1,638,032) | (342,012) | — | (1,980,044) | ||||||||||||||||||||||
| Future development costs | (325,414) | (225,397) | — | (550,811) | ||||||||||||||||||||||
| Future income tax expense | (524,581) | — | (170,766) | (695,347) | ||||||||||||||||||||||
| Future net cash flows | 2,276,572 | 664,460 | (170,766) | 2,770,266 | ||||||||||||||||||||||
| 10% annual discount | (1,034,771) | (308,700) | 64,319 | (1,279,152) | ||||||||||||||||||||||
| Standardized measure of discounted future net cash flows | $ | 1,241,801 | $ | 355,760 | $ | (106,447) | $ | 1,491,114 | ||||||||||||||||||
_____________________
(1)Pro forma adjustments represent effects of income tax on the undiscounted and discounted future net cash flows associated with the Silverback Acquisition. Corporate income taxes were not allocated to the Silverback Acquisition on a historical basis.
The changes in the pro forma standardized measure for the year ended December 31, 2024, are as follows:
| Year Ended December 31, 2024 | ||||||||||||||||||||||||||
| Historical | Pro Forma Adjustments(1) | Pro Forma Combined | ||||||||||||||||||||||||
| Riley Permian | Silverback | |||||||||||||||||||||||||
| (In thousands) | ||||||||||||||||||||||||||
| Balance, beginning of period | $ | 1,260,465 | $ | 438,154 | $ | — | $ | 1,698,619 | ||||||||||||||||||
| Sales of crude oil, natural gas and NGLs, net | (308,907) | (44,779) | — | (353,686) | ||||||||||||||||||||||
| Net change in prices and production costs | (238,938) | (82,091) | — | (321,029) | ||||||||||||||||||||||
| Net changes in future development costs | 9,976 | 114,837 | — | 124,813 | ||||||||||||||||||||||
| Extensions and discoveries | 253,381 | 13,883 | — | 267,264 | ||||||||||||||||||||||
| Acquisition of reserves | 47,020 | — | — | 47,020 | ||||||||||||||||||||||
| Revisions of previous quantity estimates | 71,800 | (90,008) | — | (18,208) | ||||||||||||||||||||||
| Previously estimated development costs incurred | 38,858 | — | — | 38,858 | ||||||||||||||||||||||
| Net change in income taxes | (2,035) | — | (106,447) | (108,482) | ||||||||||||||||||||||
| Accretion of discount | 158,406 | 34,814 | — | 193,220 | ||||||||||||||||||||||
| Other | (48,225) | (29,050) | — | (77,275) | ||||||||||||||||||||||
| Balance, end of period | $ | 1,241,801 | $ | 355,760 | $ | (106,447) | $ | 1,491,114 | ||||||||||||||||||
_____________________
(1)Pro forma adjustments represent effects of income tax on the undiscounted and discounted future net cash flows associated with the Silverback Acquisition. Corporate income taxes were not allocated to the Silverback Acquisition on a historical basis.
12