
RJF 8-K
Raymond James Financial Inc (RJF)
8-K
2022-04-27
For: 2022-04-27
View Original
Added on
April 12, 2026
UNITED STATES
SECURITIES AND EXCHANGE COMMISSION
Washington, D.C. 20549
FORM 8-K
CURRENT REPORT
Pursuant to Section 13 or 15(d) of the Securities Exchange Act of 1934
Date of Report (date of earliest event reported)
(Exact name of registrant as specified in its charter)
(State or other jurisdiction of incorporation) | (Commission File Number) | (I.R.S. Employer Identification No.) | ||||||||||||
(Address of principal executive offices) | (Zip Code) | |||||||||||||
(727 ) 567-1000
(Registrant’s telephone number, including area code)
None
(Former name or former address, if changed since last report)
Check the appropriate box below if the Form 8-K filing is intended to simultaneously satisfy the filing obligation of the registrant under any of the following provisions:
Securities registered pursuant to Section 12(b) of the Exchange Act:
| Title of each class | Trading Symbol(s) | Name of each exchange on which registered | ||||||
Indicate by check mark whether the registrant is an emerging growth company as defined in Rule 405 of the Securities Act (17 CFR 230.405) or Rule 12b-2 of the Exchange Act (17 CFR 240.12b-2).
Emerging growth company ☐
If an emerging growth company, indicate by check mark if the registrant has elected not to use the extended transition period for complying with any new or revised financial accounting standards provided pursuant to Section 13(a) of the Exchange Act.
☐
Item 2.02 Results of Operations and Financial Condition
On April 27, 2022, Raymond James Financial, Inc. (the "Company") issued a press release disclosing its results for the fiscal second quarter ended March 31, 2022. A copy of this press release is attached to this Current Report as Exhibit 99.1 and incorporated by reference herein. In addition, a copy of the Company’s Financial Supplement and Earnings Presentation for the fiscal second quarter ended March 31, 2022 are attached as Exhibits 99.2 and 99.3, respectively, to this Current Report and are incorporated by reference herein.
The information in this Current Report, including any exhibits hereto, is being "furnished" and shall not be deemed to be “filed” for purposes of Section 18 of the Securities Exchange Act of 1934, as amended, or otherwise subject to the liabilities of that section, nor shall it be deemed incorporated by reference into any filing of the Company with the Securities and Exchange Commission, whether made before or after the date hereof, regardless of any general incorporation language in such filings (unless the Company specifically states that the information or exhibit in this particular report is incorporated by reference).
Item 9.01 Financial Statements and Exhibits
(d) Exhibits. The following are filed as exhibits to this report:
Exhibit No.
104 Cover Page Interactive Data File (embedded within the Inline XBRL document).
SIGNATURES
Pursuant to the requirements of the Securities Exchange Act of 1934, the registrant has duly caused this report to be signed on its behalf by the undersigned hereunto duly authorized.
RAYMOND JAMES FINANCIAL, INC. | ||||||||
Date: April 27, 2022 | By: | /s/ Paul M. Shoukry | ||||||
| Paul M. Shoukry | ||||||||
| Chief Financial Officer and Treasurer | ||||||||

| April 27, 2022 | FOR IMMEDIATE RELEASE | |||||||
| Media Contact: Steve Hollister, 727.567.2824 | ||||||||
| Investor Contact: Kristina Waugh, 727.567.7654 | ||||||||
| raymondjames.com/news-and-media/press-releases | ||||||||
RAYMOND JAMES FINANCIAL REPORTS SECOND QUARTER
OF FISCAL 2022 RESULTS
•Domestic Private Client Group net new asset(1) growth of 11% over the prior 12 months and nearly 9% annualized for the fiscal second quarter
•Quarterly net revenues of $2.67 billion, up 13% over the prior year’s fiscal second quarter and down 4% compared to the record set in the preceding quarter
•Quarterly net income of $323 million, or $1.52 per diluted share, and quarterly adjusted net income of $331 million(2), or $1.55 per diluted share(2)
•Client assets under administration of $1.26 trillion(3), record Private Client Group (PCG) assets in fee-based accounts of $678.0 billion(3), and financial assets under management of $193.7 billion
•Record PCG financial advisors of 8,730(3), net increases of 403 over March 2021 and 266 over December 2021
•Record clients’ domestic cash sweep balances of $76.5 billion and record net loans at Raymond James Bank of $27.9 billion
•Annualized return on equity for the first half of fiscal 2022 of 18.1% and annualized adjusted return on tangible common equity for the first half of fiscal 2022 of 20.6%(2)
ST. PETERSBURG, Fla – Raymond James Financial, Inc. (NYSE: RJF) today reported net revenues of $2.67 billion and net income of $323 million, or $1.52 per diluted share, for the fiscal second quarter ended March 31, 2022. Excluding $11 million of acquisition-related expenses, quarterly adjusted net income was $331 million(2), or $1.55 per diluted share(2).
Quarterly net revenues grew 13% over the prior year’s fiscal second quarter primarily driven by higher asset management and related administrative fees, reflecting the strong year-over-year growth in Private Client Group assets in fee-based accounts and net interest income. The sequential decline in quarterly net revenues was largely attributable to lower investment banking revenues, while the quarterly decline in net income also reflected a bank loan provision for credit losses during the current quarter compared to a benefit in the preceding quarter, and a higher effective tax rate. The bank loan provision for credit losses in the current quarter was primarily associated with strong loan growth during the quarter.
For the first six months of the fiscal year, record net revenues of $5.45 billion increased 19%, record earnings per diluted share of $3.61 increased 14%, and adjusted earnings per diluted share of $3.67(2) increased 16% over the first half of fiscal 2021. The Private Client Group, Capital Markets and Asset Management segments generated record net revenues and pre-tax income during the first six months of the fiscal year.
“I am pleased with our results for the fiscal second quarter and the first half of the fiscal year, especially given the challenging market conditions. Financial advisor retention and recruiting in the Private Client Group segment remain strong, contributing to solid domestic net new asset growth of 11% over the prior 12 months, and we successfully closed on the Charles Stanley acquisition during the quarter,” said Chair and CEO Paul Reilly. “While heightened geopolitical and macroeconomic uncertainties negatively impacted investment banking revenues during the quarter,
Please refer to the footnotes at the end of this press release for additional information.
1
the M&A pipeline remains robust. Looking forward, we are well positioned for the expected increases in short-term interest rates with healthy loan growth at Raymond James Bank, a high concentration of floating-rate assets, record clients’ domestic cash sweep balances and solid capital ratios providing us ample balance sheet flexibility. The TriState Capital Holdings acquisition, which is currently anticipated to close by the end of the fiscal third quarter, is expected to further increase our floating-rate, interest-earning assets and diversify our funding sources.”
Segment Results
Private Client Group
•Record quarterly net revenues of $1.92 billion, up 17% over the prior year’s fiscal second quarter and 5% over the preceding quarter
•Quarterly pre-tax income of $213 million, up 11% over the prior year’s fiscal second quarter and 9% over the preceding quarter
•Private Client Group assets under administration of $1.20 trillion(3), up 17% over March 2021 and flat compared to December 2021
•Record Private Client Group assets in fee-based accounts of $678.0 billion(3), up 19% over March 2021 and flat compared to December 2021
•Record Private Client Group financial advisors of 8,730(3), which includes 200 advisors with Charles Stanley, increased 403 over March 2021 and 266 over December 2021
•Record clients’ domestic cash sweep balances of $76.5 billion, up 22% over March 2021 and 4% over December 2021
Record quarterly net revenues grew 17% over the prior-year quarter and 5% over the preceding quarter, predominantly driven by the increase in asset management and related administrative fees, reflecting higher assets in fee-based accounts. Net revenues and expenses during the quarter included just over two months of results for Charles Stanley, which closed on January 21, 2022.
“With our continued focus on supporting, retaining and attracting high-quality financial advisors, we generated solid domestic net new asset growth of 11% over the prior 12 months and nearly 9% annualized during the quarter,” said Reilly. “Furthermore, financial advisor recruiting activity remains strong as prospective advisors continue to be attracted to our client-centric culture, multiple affiliation options and robust support and solutions offerings.”
Capital Markets
•Quarterly net revenues of $413 million, down 5% compared to the prior year’s fiscal second quarter and 33% compared to the preceding quarter
•Quarterly pre-tax income of $87 million, down 17% compared to the prior year’s fiscal second quarter and 57% compared to the preceding quarter
•Quarterly investment banking revenues of $226 million, flat compared to the prior year’s fiscal second quarter and down 45% compared to the record set in the preceding quarter
Quarterly net revenues declined 5% compared to the prior-year quarter predominantly driven by lower fixed income brokerage revenues and equity underwriting revenues, partially offset by a year-over-year increase in M&A revenues. Sequentially, quarterly net revenues decreased 33% primarily due to lower investment banking revenues.
“Following remarkable results in the preceding quarter, Capital Markets revenues declined as investment banking revenues were negatively impacted by increased geopolitical and macroeconomic uncertainties,” said Reilly. “The M&A pipeline remains robust, but market conditions throughout the remainder of the fiscal year will heavily influence closings. In March, we announced the acquisition of SumRidge Partners, a technology-driven fixed income market maker specializing in investment-grade and high-yield corporate bonds, municipal bonds and institutional preferred securities. We currently expect to close the acquisition in the fiscal fourth quarter of 2022.”
Please refer to the footnotes at the end of this press release for additional information.
2
Asset Management
•Quarterly net revenues of $234 million, up 12% over the prior year’s fiscal second quarter and down 1% compared to the preceding quarter
•Quarterly pre-tax income of $103 million, up 18% over the prior year’s fiscal second quarter and down 4% compared to the preceding quarter
•Financial assets under management of $193.7 billion, up 9% over March 2021 and down 5% compared to December 2021
The year-over-year growth of quarterly net revenues and pre-tax income was largely attributable to higher financial assets under management, driven by equity market appreciation and net inflows into fee-based accounts in the Private Client Group. Financial assets under management decreased 5% sequentially as net inflows were more than offset by the declines in equity markets during the quarter.
Raymond James Bank
•Quarterly net revenues of $197 million, up 23% over the prior year’s fiscal second quarter and 8% over the preceding quarter
•Quarterly pre-tax income of $83 million, down 25% compared to the prior year’s fiscal second quarter and 19% compared to the preceding quarter
•Record net loans of $27.9 billion, up 22% over March 2021 and 7% over December 2021
•Net interest margin (NIM) of 2.01% for the quarter, up 7 basis points over the prior year’s fiscal second quarter and 9 basis points over the preceding quarter
Net revenue growth was due to higher asset balances and NIM expansion during the quarter. The asset growth was primarily attributable to strong, broad-based loan growth, including 41% year-over-year growth of securities-based loans to clients in the Private Client Group. The Bank’s NIM increased 9 basis points during the quarter to 2.01%, and further NIM expansion is expected from the Federal Reserve’s interest rate increases. Despite revenue growth, pre-tax income declined reflecting the bank loan loss provision in the current quarter, resulting from strong loan growth in contrast to the bank loan benefit for credit losses in the comparative periods. The bank loan allowance for credit losses as a percent of loans held for investment ended the quarter at 1.17%, down from 1.50% at March 2021 and 1.18% at December 2021, as the credit quality of the loan portfolio remains healthy.
Other
The effective tax rate during the quarter increased to 25.4%, reflecting the unfavorable impact of nondeductible valuation losses associated with the corporate-owned life insurance portfolio. As of April 27, 2022, $1 billion remained available under the Board’s approved share repurchase authorization. At the end of the quarter, the total capital ratio was 25.0%(4) and the tier 1 leverage ratio was 11.1%(4), both well above the regulatory requirements.
A conference call to discuss the results will take place tomorrow morning, Thursday, April 28, at 8:15 a.m. ET. The live audio webcast, and the presentation which management will review on the call, will be available at www.raymondjames.com/investor-relations/financial-information/quarterly-earnings. For a listen-only connection to the conference call, please dial: 800-899-6991 (conference code: 22018191). An audio replay of the call will be available at the same location until July 27, 2022.
Please refer to the footnotes at the end of this press release for additional information.
3
About Raymond James Financial, Inc.
Raymond James Financial, Inc. (NYSE: RJF) is a leading diversified financial services company providing private client group, capital markets, asset management, banking and other services to individuals, corporations and municipalities. The company has approximately 8,700 financial advisors. Total client assets are $1.26 trillion. Public since 1983, the firm is listed on the New York Stock Exchange under the symbol RJF. Additional information is available at www.raymondjames.com.
Forward-Looking Statements
Certain statements made in this press release may constitute “forward-looking statements” under the Private Securities Litigation Reform Act of 1995. Forward-looking statements include information concerning future strategic objectives, business prospects, anticipated savings, financial results (including expenses, earnings, liquidity, cash flow and capital expenditures), industry or market conditions, demand for and pricing of our products, acquisitions (including our announced acquisitions of TriState Capital Holdings, Inc. and SumRidge Partners, LLC), divestitures, anticipated results of litigation, regulatory developments, and general economic conditions. In addition, words such as “expects,” “anticipates,” and future or conditional verbs such as “will”, as well as any other statement that necessarily depends on future events, is intended to identify forward-looking statements. Forward-looking statements are not guarantees, and they involve risks, uncertainties and assumptions. Although we make such statements based on assumptions that we believe to be reasonable, there can be no assurance that actual results will not differ materially from those expressed in the forward-looking statements. We caution investors not to rely unduly on any forward-looking statements and urge you to carefully consider the risks described in our filings with the Securities and Exchange Commission (the “SEC”) from time to time, including our most recent Annual Report on Form 10-K, and subsequent Quarterly Reports on Form 10-Q and Current Reports on Form 8-K, which are available at www.raymondjames.com and the SEC’s website at www.sec.gov. We expressly disclaim any obligation to update any forward-looking statement in the event it later turns out to be inaccurate, whether as a result of new information, future events, or otherwise.
Please refer to the footnotes at the end of this press release for additional information.
4
RAYMOND JAMES FINANCIAL, INC. Fiscal Second Quarter of 2022 | Selected Financial Highlights (Unaudited) | ||||
Summary results of operations
| Three months ended | % change from | |||||||||||||||||||||||||||||||
| $ in millions, except per share amounts | March 31, 2022 | March 31, 2021 | December 31, 2021 | March 31, 2021 | December 31, 2021 | |||||||||||||||||||||||||||
| Net revenues | $ | 2,673 | $ | 2,372 | $ | 2,781 | 13% | (4)% | ||||||||||||||||||||||||
| Pre-tax income | $ | 433 | $ | 447 | $ | 558 | (3)% | (22)% | ||||||||||||||||||||||||
| Net income | $ | 323 | $ | 355 | $ | 446 | (9)% | (28)% | ||||||||||||||||||||||||
Earnings per common share: (5) (6) | ||||||||||||||||||||||||||||||||
| Basic | $ | 1.56 | $ | 1.72 | $ | 2.16 | (9)% | (28)% | ||||||||||||||||||||||||
| Diluted | $ | 1.52 | $ | 1.68 | $ | 2.10 | (10)% | (28)% | ||||||||||||||||||||||||
Non-GAAP measures: (2) | ||||||||||||||||||||||||||||||||
Adjusted pre-tax income | $ | 444 | NA | $ | 564 | (1)% | (21)% | |||||||||||||||||||||||||
Adjusted net income | $ | 331 | NA | $ | 451 | (7)% | (27)% | |||||||||||||||||||||||||
Adjusted earnings per common share – basic (5) (6) | $ | 1.59 | NA | $ | 2.18 | (8)% | (27)% | |||||||||||||||||||||||||
Adjusted earnings per common share – diluted (5) (6) | $ | 1.55 | NA | $ | 2.12 | (8)% | (27)% | |||||||||||||||||||||||||
| Six months ended | ||||||||||||||||||||
| $ in millions, except per share amounts | March 31, 2022 | March 31, 2021 | % change | |||||||||||||||||
| Net revenues | $ | 5,454 | $ | 4,594 | 19% | |||||||||||||||
| Pre-tax income | $ | 991 | $ | 846 | 17% | |||||||||||||||
| Net income | $ | 769 | $ | 667 | 15% | |||||||||||||||
Earnings per common share: (5) (6) | ||||||||||||||||||||
| Basic | $ | 3.71 | $ | 3.23 | 15% | |||||||||||||||
| Diluted | $ | 3.61 | $ | 3.16 | 14% | |||||||||||||||
Non-GAAP measures: (2) | ||||||||||||||||||||
| Adjusted pre-tax income | $ | 1,008 | $ | 848 | 19% | |||||||||||||||
| Adjusted net income | $ | 782 | $ | 669 | 17% | |||||||||||||||
Adjusted earnings per common share – basic (5) (6) | $ | 3.77 | $ | 3.24 | 16% | |||||||||||||||
Adjusted earnings per common share – diluted (5) (6) | $ | 3.67 | $ | 3.17 | 16% | |||||||||||||||
Please refer to the footnotes at the end of this press release for additional information.
5
RAYMOND JAMES FINANCIAL, INC.
Fiscal Second Quarter of 2022
| Consolidated Statements of Income (Unaudited) | ||||||||||||||||||||||||||||||||
| Three months ended | % change from | |||||||||||||||||||||||||||||||
| in millions, except per share amounts | March 31, 2022 | March 31, 2021 | December 31, 2021 | March 31, 2021 | December 31, 2021 | |||||||||||||||||||||||||||
| Revenues: | ||||||||||||||||||||||||||||||||
| Asset management and related administrative fees | $ | 1,464 | $ | 1,173 | $ | 1,382 | 25% | 6% | ||||||||||||||||||||||||
| Brokerage revenues: | ||||||||||||||||||||||||||||||||
| Securities commissions | 422 | 443 | 425 | (5)% | (1)% | |||||||||||||||||||||||||||
| Principal transactions | 142 | 148 | 133 | (4)% | 7% | |||||||||||||||||||||||||||
| Total brokerage revenues | 564 | 591 | 558 | (5)% | 1% | |||||||||||||||||||||||||||
| Account and service fees | 179 | 159 | 177 | 13% | 1% | |||||||||||||||||||||||||||
| Investment banking | 235 | 242 | 425 | (3)% | (45)% | |||||||||||||||||||||||||||
| Interest income | 242 | 200 | 225 | 21% | 8% | |||||||||||||||||||||||||||
| Other | 27 | 44 | 51 | (39)% | (47)% | |||||||||||||||||||||||||||
| Total revenues | 2,711 | 2,409 | 2,818 | 13% | (4)% | |||||||||||||||||||||||||||
| Interest expense | (38) | (37) | (37) | 3% | 3% | |||||||||||||||||||||||||||
| Net revenues | 2,673 | 2,372 | 2,781 | 13% | (4)% | |||||||||||||||||||||||||||
| Non-interest expenses: | ||||||||||||||||||||||||||||||||
| Compensation, commissions and benefits | 1,852 | 1,648 | 1,884 | 12% | (2)% | |||||||||||||||||||||||||||
| Non-compensation expenses: | ||||||||||||||||||||||||||||||||
| Communications and information processing | 127 | 107 | 112 | 19% | 13% | |||||||||||||||||||||||||||
| Occupancy and equipment | 62 | 57 | 59 | 9% | 5% | |||||||||||||||||||||||||||
| Business development | 34 | 21 | 35 | 62% | (3)% | |||||||||||||||||||||||||||
| Investment sub-advisory fees | 40 | 31 | 38 | 29% | 5% | |||||||||||||||||||||||||||
| Professional fees | 22 | 24 | 26 | (8)% | (15)% | |||||||||||||||||||||||||||
| Bank loan provision/(benefit) for credit losses | 21 | (32) | (11) | NM | NM | |||||||||||||||||||||||||||
Acquisition-related expenses (7) | 11 | — | 6 | NM | 83% | |||||||||||||||||||||||||||
| Other | 71 | 69 | 74 | 3% | (4)% | |||||||||||||||||||||||||||
| Total non-compensation expenses | 388 | 277 | 339 | 40% | 14% | |||||||||||||||||||||||||||
| Total non-interest expenses | 2,240 | 1,925 | 2,223 | 16% | 1% | |||||||||||||||||||||||||||
Pre-tax income | 433 | 447 | 558 | (3)% | (22)% | |||||||||||||||||||||||||||
| Provision for income taxes | 110 | 92 | 112 | 20% | (2)% | |||||||||||||||||||||||||||
| Net income | $ | 323 | $ | 355 | $ | 446 | (9)% | (28)% | ||||||||||||||||||||||||
Earnings per common share – basic (5) (6) | $ | 1.56 | $ | 1.72 | $ | 2.16 | (9)% | (28)% | ||||||||||||||||||||||||
Earnings per common share – diluted (5) (6) | $ | 1.52 | $ | 1.68 | $ | 2.10 | (10)% | (28)% | ||||||||||||||||||||||||
Weighted-average common shares outstanding – basic (5) | 207.7 | 206.7 | 206.3 | —% | 1% | |||||||||||||||||||||||||||
Weighted-average common and common equivalent shares outstanding – diluted (5) | 213.0 | 211.8 | 212.4 | 1% | —% | |||||||||||||||||||||||||||
Please refer to the footnotes at the end of this press release for additional information.
6
RAYMOND JAMES FINANCIAL, INC.
Fiscal Second Quarter of 2022
| Consolidated Statements of Income (Unaudited) | ||||||||||||||||||||
| Six months ended | ||||||||||||||||||||
| in millions, except per share amounts | March 31, 2022 | March 31, 2021 | % change | |||||||||||||||||
| Revenues: | ||||||||||||||||||||
| Asset management and related administrative fees | $ | 2,846 | $ | 2,240 | 27% | |||||||||||||||
| Brokerage revenues: | ||||||||||||||||||||
| Securities commissions | 847 | 824 | 3% | |||||||||||||||||
| Principal transactions | 275 | 295 | (7)% | |||||||||||||||||
| Total brokerage revenues | 1,122 | 1,119 | —% | |||||||||||||||||
| Account and service fees | 356 | 304 | 17% | |||||||||||||||||
| Investment banking | 660 | 503 | 31% | |||||||||||||||||
| Interest income | 467 | 403 | 16% | |||||||||||||||||
Other (8) | 78 | 100 | (22)% | |||||||||||||||||
| Total revenues | 5,529 | 4,669 | 18% | |||||||||||||||||
| Interest expense | (75) | (75) | —% | |||||||||||||||||
| Net revenues | 5,454 | 4,594 | 19% | |||||||||||||||||
| Non-interest expenses: | ||||||||||||||||||||
| Compensation, commissions and benefits | 3,736 | 3,148 | 19% | |||||||||||||||||
| Non-compensation expenses: | ||||||||||||||||||||
| Communications and information processing | 239 | 206 | 16% | |||||||||||||||||
| Occupancy and equipment | 121 | 114 | 6% | |||||||||||||||||
| Business development | 69 | 44 | 57% | |||||||||||||||||
| Investment sub-advisory fees | 78 | 59 | 32% | |||||||||||||||||
| Professional fees | 48 | 54 | (11)% | |||||||||||||||||
| Bank loan provision/(benefit) for credit losses | 10 | (18) | NM | |||||||||||||||||
Acquisition-related expenses (7) | 17 | 2 | 750% | |||||||||||||||||
Other (8) | 145 | 139 | 4% | |||||||||||||||||
| Total non-compensation expenses | 727 | 600 | 21% | |||||||||||||||||
| Total non-interest expenses | 4,463 | 3,748 | 19% | |||||||||||||||||
Pre-tax income | 991 | 846 | 17% | |||||||||||||||||
| Provision for income taxes | 222 | 179 | 24% | |||||||||||||||||
| Net income | $ | 769 | $ | 667 | 15% | |||||||||||||||
Earnings per common share – basic (5) (6) | $ | 3.71 | $ | 3.23 | 15% | |||||||||||||||
Earnings per common share – diluted (5) (6) | $ | 3.61 | $ | 3.16 | 14% | |||||||||||||||
Weighted-average common shares outstanding – basic (5) | 207.0 | 206.0 | —% | |||||||||||||||||
Weighted-average common and common equivalent shares outstanding – diluted (5) | 212.6 | 210.6 | 1% | |||||||||||||||||
Please refer to the footnotes at the end of this press release for additional information.
7
| RAYMOND JAMES FINANCIAL, INC. | Consolidated Selected Key Metrics | ||||
Fiscal Second Quarter of 2022 | (Unaudited) | ||||
| As of | % change from | ||||||||||||||||||||||||||||||||||
$ in millions, except per share amounts | March 31, 2022 | March 31, 2021 | December 31, 2021 | March 31, 2021 | December 31, 2021 | ||||||||||||||||||||||||||||||
| Total assets | $ | 73,101 | $ | 56,066 | $ | 68,461 | 30% | 7% | |||||||||||||||||||||||||||
| Total equity attributable to Raymond James Financial, Inc. | $ | 8,602 | $ | 7,592 | $ | 8,600 | 13% | —% | |||||||||||||||||||||||||||
Book value per share (5) (9) | $ | 41.38 | $ | 36.89 | $ | 41.45 | 12% | —% | |||||||||||||||||||||||||||
Tangible book value per share (2) (5) (9) | $ | 36.46 | $ | 32.94 | $ | 37.55 | 11% | (3)% | |||||||||||||||||||||||||||
Capital ratios: | |||||||||||||||||||||||||||||||||||
| Tier 1 capital | 23.9 | % | (4) | 23.6 | % | 25.9 | % | ||||||||||||||||||||||||||||
| Total capital | 25.0 | % | (4) | 24.7 | % | 27.0 | % | ||||||||||||||||||||||||||||
| Tier 1 leverage | 11.1 | % | (4) | 12.2 | % | 12.1 | % | ||||||||||||||||||||||||||||
| Three months ended | Six months ended | ||||||||||||||||||||||||||||||||||
| March 31, 2022 | March 31, 2021 | December 31, 2021 | March 31, 2022 | March 31, 2021 | |||||||||||||||||||||||||||||||
Return on equity (10) | 15.0 | % | 19.0 | % | 21.2 | % | 18.1 | % | 18.1 | % | |||||||||||||||||||||||||
Adjusted return on equity (2) (10) | 15.4 | % | NA | 21.4 | % | 18.4 | % | 18.2 | % | ||||||||||||||||||||||||||
Return on tangible common equity (2) (10) | 16.8 | % | 21.2 | % | 23.4 | % | 20.2 | % | 20.1 | % | |||||||||||||||||||||||||
Adjusted return on tangible common equity (2) (10) | 17.2 | % | NA | 23.7 | % | 20.6 | % | 20.2 | % | ||||||||||||||||||||||||||
Pre-tax margin (11) | 16.2 | % | 18.8 | % | 20.1 | % | 18.2 | % | 18.4 | % | |||||||||||||||||||||||||
Adjusted pre-tax margin (2) (11) | 16.6 | % | NA | 20.3 | % | 18.5 | % | 18.5 | % | ||||||||||||||||||||||||||
Total compensation ratio (12) | 69.3 | % | 69.5 | % | 67.7 | % | 68.5 | % | 68.5 | % | |||||||||||||||||||||||||
| Effective tax rate | 25.4 | % | 20.6 | % | 20.1 | % | 22.4 | % | 21.2 | % | |||||||||||||||||||||||||
Client asset metrics ($ in billions) | As of | % change from | |||||||||||||||||||||||||||||||||
| March 31, 2022 | March 31, 2021 | December 31, 2021 | March 31, 2021 | December 31, 2021 | |||||||||||||||||||||||||||||||
Client assets under administration (3) | $ | 1,256.1 | $ | 1,085.4 | $ | 1,257.8 | 16% | —% | |||||||||||||||||||||||||||
Private Client Group assets under administration (3) | $ | 1,198.3 | $ | 1,028.1 | $ | 1,199.8 | 17% | —% | |||||||||||||||||||||||||||
Private Client Group assets in fee-based accounts (3) | $ | 678.0 | $ | 567.6 | $ | 677.8 | 19% | —% | |||||||||||||||||||||||||||
Financial assets under management | $ | 193.7 | $ | 178.2 | $ | 203.2 | 9% | (5)% | |||||||||||||||||||||||||||
Clients’ domestic cash sweep balances ($ in millions) | As of | % change from | |||||||||||||||||||||||||||||||||
| March 31, 2022 | March 31, 2021 | December 31, 2021 | March 31, 2021 | December 31, 2021 | |||||||||||||||||||||||||||||||
Raymond James Bank Deposit Program (“RJBDP”): (13) | |||||||||||||||||||||||||||||||||||
| Raymond James Bank | $ | 33,570 | $ | 28,174 | $ | 33,097 | 19% | 1% | |||||||||||||||||||||||||||
| Third-party banks | 25,887 | 25,110 | 24,316 | 3% | 6% | ||||||||||||||||||||||||||||||
| Subtotal RJBDP | 59,457 | 53,284 | 57,413 | 12% | 4% | ||||||||||||||||||||||||||||||
| Client Interest Program | 17,013 | 9,517 | 16,065 | 79% | 6% | ||||||||||||||||||||||||||||||
Total clients’ domestic cash sweep balances | $ | 76,470 | $ | 62,801 | $ | 73,478 | 22% | 4% | |||||||||||||||||||||||||||
| Three months ended | Six months ended | ||||||||||||||||||||||||||||||||||
| March 31, 2022 | March 31, 2021 | December 31, 2021 | March 31, 2022 | March 31, 2021 | |||||||||||||||||||||||||||||||
Average yield on RJBDP - third-party banks (14) | 0.32 | % | 0.30 | % | 0.28 | % | 0.30 | % | 0.31 | % | |||||||||||||||||||||||||
| Private Client Group financial advisors | As of | % change from | |||||||||||||||||||||||||||||||||
| March 31, 2022 | March 31, 2021 | December 31, 2021 | March 31, 2021 | December 31, 2021 | |||||||||||||||||||||||||||||||
| Employees | 3,601 | 3,375 | 3,447 | 7% | 4% | ||||||||||||||||||||||||||||||
| Independent contractors | 5,129 | 4,952 | 5,017 | 4% | 2% | ||||||||||||||||||||||||||||||
Total advisors (3) | 8,730 | 8,327 | 8,464 | 5% | 3% | ||||||||||||||||||||||||||||||
Please refer to the footnotes at the end of this press release for additional information.
8
| RAYMOND JAMES FINANCIAL, INC. | Consolidated Net Interest | ||||
Fiscal Second Quarter of 2022 | (Unaudited) | ||||
The following tables present our consolidated average interest-earning asset and interest-bearing liability balances, interest income and expense and the related rates.
| Consolidated Net Interest | ||||||||||||||||||||||||||||||||||||||||||||||||||||||||||||||
| Three months ended | ||||||||||||||||||||||||||||||||||||||||||||||||||||||||||||||
| March 31, 2022 | March 31, 2021 | December 31, 2021 | ||||||||||||||||||||||||||||||||||||||||||||||||||||||||||||
| $ in millions | Average balance | Interest | Annualized average rate | Average balance | Interest | Annualized average rate | Average balance | Interest | Annualized average rate | |||||||||||||||||||||||||||||||||||||||||||||||||||||
| Interest-earning assets: | ||||||||||||||||||||||||||||||||||||||||||||||||||||||||||||||
| Cash and cash equivalents | $ | 5,919 | $ | 3 | 0.20 | % | $ | 5,284 | $ | 2 | 0.20 | % | $ | 6,076 | $ | 3 | 0.18 | % | ||||||||||||||||||||||||||||||||||||||||||||
| Assets segregated for regulatory purposes and restricted cash | 19,522 | 7 | 0.15 | % | 10,087 | 5 | 0.18 | % | 13,011 | 4 | 0.12 | % | ||||||||||||||||||||||||||||||||||||||||||||||||||
| Available-for-sale securities | 8,869 | 25 | 1.16 | % | 7,997 | 21 | 1.08 | % | 8,511 | 22 | 1.02 | % | ||||||||||||||||||||||||||||||||||||||||||||||||||
| Brokerage client receivables | 2,558 | 21 | 3.29 | % | 2,222 | 19 | 3.36 | % | 2,484 | 21 | 3.35 | % | ||||||||||||||||||||||||||||||||||||||||||||||||||
| Bank loans, net of unearned income and deferred expenses: | ||||||||||||||||||||||||||||||||||||||||||||||||||||||||||||||
| Loans held for investment: | ||||||||||||||||||||||||||||||||||||||||||||||||||||||||||||||
| Commercial and industrial (“C&I”) loans | 8,783 | 54 | 2.49 | % | 7,540 | 48 | 2.56 | % | 8,581 | 55 | 2.49 | % | ||||||||||||||||||||||||||||||||||||||||||||||||||
| Commercial real estate (“CRE”) loans | 3,150 | 20 | 2.56 | % | 2,665 | 17 | 2.54 | % | 2,941 | 20 | 2.67 | % | ||||||||||||||||||||||||||||||||||||||||||||||||||
| Real estate investment trust (“REIT”) loans | 1,324 | 9 | 2.48 | % | 1,309 | 8 | 2.50 | % | 1,133 | 7 | 2.56 | % | ||||||||||||||||||||||||||||||||||||||||||||||||||
Tax-exempt loans (15) | 1,289 | 9 | 3.18 | % | 1,227 | 8 | 3.35 | % | 1,297 | 8 | 3.19 | % | ||||||||||||||||||||||||||||||||||||||||||||||||||
| Residential mortgage loans | 5,770 | 38 | 2.69 | % | 5,005 | 34 | 2.72 | % | 5,451 | 37 | 2.68 | % | ||||||||||||||||||||||||||||||||||||||||||||||||||
| Securities-based loans and other | 6,753 | 39 | 2.31 | % | 4,638 | 26 | 2.23 | % | 6,289 | 35 | 2.20 | % | ||||||||||||||||||||||||||||||||||||||||||||||||||
| Loans held for sale | 268 | 2 | 2.94 | % | 177 | 1 | 1.89 | % | 239 | 2 | 2.94 | % | ||||||||||||||||||||||||||||||||||||||||||||||||||
| Total bank loans, net | 27,337 | 171 | 2.53 | % | 22,561 | 142 | 2.56 | % | 25,931 | 164 | 2.52 | % | ||||||||||||||||||||||||||||||||||||||||||||||||||
| All other interest-earning assets | 2,192 | 15 | 2.64 | % | 2,201 | 11 | 1.87 | % | 2,376 | 11 | 1.91 | % | ||||||||||||||||||||||||||||||||||||||||||||||||||
| Total interest-earning assets | $ | 66,397 | $ | 242 | 1.48 | % | $ | 50,352 | $ | 200 | 1.61 | % | $ | 58,389 | $ | 225 | 1.53 | % | ||||||||||||||||||||||||||||||||||||||||||||
| Interest-bearing liabilities: | ||||||||||||||||||||||||||||||||||||||||||||||||||||||||||||||
| Bank deposits: | ||||||||||||||||||||||||||||||||||||||||||||||||||||||||||||||
| Savings, money market and Negotiable Order of Withdrawal accounts | $ | 33,097 | $ | 2 | 0.02 | % | $ | 27,662 | $ | 2 | 0.02 | % | $ | 31,894 | $ | 2 | 0.02 | % | ||||||||||||||||||||||||||||||||||||||||||||
| Certificates of deposit | 733 | 3 | 1.83 | % | 898 | 4 | 1.88 | % | 843 | 4 | 1.87 | % | ||||||||||||||||||||||||||||||||||||||||||||||||||
| Total bank deposits | 33,830 | 5 | 0.06 | % | 28,560 | 6 | 0.08 | % | 32,737 | 6 | 0.07 | % | ||||||||||||||||||||||||||||||||||||||||||||||||||
| Brokerage client payables | 21,405 | — | 0.01 | % | 11,485 | 1 | 0.02 | % | 14,300 | 1 | 0.03 | % | ||||||||||||||||||||||||||||||||||||||||||||||||||
| Other borrowings | 856 | 4 | 2.15 | % | 862 | 5 | 2.18 | % | 857 | 5 | 2.20 | % | ||||||||||||||||||||||||||||||||||||||||||||||||||
| Senior notes payable | 2,037 | 23 | 4.44 | % | 2,045 | 24 | 4.74 | % | 2,037 | 23 | 4.44 | % | ||||||||||||||||||||||||||||||||||||||||||||||||||
| All other interest-bearing liabilities | 707 | 6 | 1.93 | % | 600 | 1 | 0.88 | % | 650 | 2 | 1.16 | % | ||||||||||||||||||||||||||||||||||||||||||||||||||
| Total interest-bearing liabilities | $ | 58,835 | $ | 38 | 0.26 | % | $ | 43,552 | $ | 37 | 0.34 | % | $ | 50,581 | $ | 37 | 0.28 | % | ||||||||||||||||||||||||||||||||||||||||||||
| Net interest income | $ | 204 | $ | 163 | $ | 188 | ||||||||||||||||||||||||||||||||||||||||||||||||||||||||
Please refer to the footnotes at the end of this press release for additional information.
9
| RAYMOND JAMES FINANCIAL, INC. | Consolidated Net Interest | ||||
Fiscal Second Quarter of 2022 | (Unaudited) | ||||
| Consolidated Net Interest | |||||||||||||||||||||||||||||||||||||||||
| Six months ended | |||||||||||||||||||||||||||||||||||||||||
| March 31, 2022 | March 31, 2021 | ||||||||||||||||||||||||||||||||||||||||
| $ in millions | Average balance | Interest | Annualized average rate | Average balance | Interest | Annualized average rate | |||||||||||||||||||||||||||||||||||
| Interest-earning assets: | |||||||||||||||||||||||||||||||||||||||||
| Cash and cash equivalents | $ | 5,954 | $ | 6 | 0.19 | % | $ | 5,500 | $ | 6 | 0.23 | % | |||||||||||||||||||||||||||||
| Assets segregated for regulatory and other purposes | 15,844 | 11 | 0.14 | % | 7,954 | 8 | 0.19 | % | |||||||||||||||||||||||||||||||||
| Available-for-sale securities | 8,688 | 47 | 1.09 | % | 7,735 | 44 | 1.14 | % | |||||||||||||||||||||||||||||||||
| Brokerage client receivables | 2,521 | 42 | 3.32 | % | 2,152 | 37 | 3.42 | % | |||||||||||||||||||||||||||||||||
| Bank loans, net of unearned income and deferred expenses: | |||||||||||||||||||||||||||||||||||||||||
| Loans held for investment: | |||||||||||||||||||||||||||||||||||||||||
| C&I loans | 8,681 | 109 | 2.49 | % | 7,537 | 99 | 2.60 | % | |||||||||||||||||||||||||||||||||
| CRE loans | 3,044 | 40 | 2.61 | % | 2,623 | 34 | 2.56 | % | |||||||||||||||||||||||||||||||||
| REIT loans | 1,227 | 16 | 2.51 | % | 1,272 | 16 | 2.47 | % | |||||||||||||||||||||||||||||||||
Tax-exempt loans (15) | 1,293 | 17 | 3.19 | % | 1,232 | 16 | 3.35 | % | |||||||||||||||||||||||||||||||||
| Residential mortgage loans | 5,609 | 75 | 2.68 | % | 5,003 | 69 | 2.75 | % | |||||||||||||||||||||||||||||||||
| Securities-based loans and other | 6,519 | 74 | 2.26 | % | 4,460 | 51 | 2.26 | % | |||||||||||||||||||||||||||||||||
| Loans held for sale | 254 | 4 | 2.94 | % | 159 | 2 | 2.36 | % | |||||||||||||||||||||||||||||||||
| Total bank loans, net | 26,627 | 335 | 2.53 | % | 22,286 | 287 | 2.59 | % | |||||||||||||||||||||||||||||||||
| All other interest-earning assets | 2,279 | 26 | 2.26 | % | 2,247 | 21 | 1.93 | % | |||||||||||||||||||||||||||||||||
| Total interest-earning assets | $ | 61,913 | $ | 467 | 1.51 | % | $ | 47,874 | $ | 403 | 1.69 | % | |||||||||||||||||||||||||||||
| Interest-bearing liabilities: | |||||||||||||||||||||||||||||||||||||||||
| Bank deposits: | |||||||||||||||||||||||||||||||||||||||||
| Savings, money market and Negotiable Order of Withdrawal accounts | $ | 32,489 | $ | 4 | 0.02 | % | $ | 27,144 | $ | 3 | 0.02 | % | |||||||||||||||||||||||||||||
| Certificates of deposit | 789 | 7 | 1.85 | % | 925 | 9 | 1.90 | % | |||||||||||||||||||||||||||||||||
| Total bank deposits | 33,278 | 11 | 0.06 | % | 28,069 | 12 | 0.08 | % | |||||||||||||||||||||||||||||||||
| Brokerage client payables | 17,275 | 1 | 0.01 | % | 9,403 | 2 | 0.04 | % | |||||||||||||||||||||||||||||||||
| Other borrowings | 856 | 9 | 2.17 | % | 864 | 10 | 2.21 | % | |||||||||||||||||||||||||||||||||
| Senior notes payable | 2,037 | 46 | 4.44 | % | 2,045 | 48 | 4.74 | % | |||||||||||||||||||||||||||||||||
| All other interest-bearing liabilities | 680 | 8 | 1.65 | % | 587 | 3 | 1.01 | % | |||||||||||||||||||||||||||||||||
| Total interest-bearing liabilities | $ | 54,126 | $ | 75 | 0.28 | % | $ | 40,968 | $ | 75 | 0.36 | % | |||||||||||||||||||||||||||||
| Net interest income | $ | 392 | $ | 328 | |||||||||||||||||||||||||||||||||||||
Please refer to the footnotes at the end of this press release for additional information.
10
| RAYMOND JAMES FINANCIAL, INC. | Segment Results | ||||
Fiscal Second Quarter of 2022 | (Unaudited) | ||||
| Three months ended | % change from | |||||||||||||||||||||||||||||||
| $ in millions | March 31, 2022 | March 31, 2021 | December 31, 2021 | March 31, 2021 | December 31, 2021 | |||||||||||||||||||||||||||
| Net revenues: | ||||||||||||||||||||||||||||||||
| Private Client Group | $ | 1,922 | $ | 1,647 | $ | 1,839 | 17% | 5% | ||||||||||||||||||||||||
| Capital Markets | 413 | 433 | 614 | (5)% | (33)% | |||||||||||||||||||||||||||
| Asset Management | 234 | 209 | 236 | 12% | (1)% | |||||||||||||||||||||||||||
| Raymond James Bank | 197 | 160 | 183 | 23% | 8% | |||||||||||||||||||||||||||
Other (16) | (18) | (12) | (15) | (50)% | (20)% | |||||||||||||||||||||||||||
| Intersegment eliminations | (75) | (65) | (76) | (15)% | 1% | |||||||||||||||||||||||||||
Total net revenues | $ | 2,673 | $ | 2,372 | $ | 2,781 | 13% | (4)% | ||||||||||||||||||||||||
Pre-tax income/(loss): | ||||||||||||||||||||||||||||||||
| Private Client Group | $ | 213 | $ | 192 | $ | 195 | 11% | 9% | ||||||||||||||||||||||||
| Capital Markets | 87 | 105 | 201 | (17)% | (57)% | |||||||||||||||||||||||||||
| Asset Management | 103 | 87 | 107 | 18% | (4)% | |||||||||||||||||||||||||||
| Raymond James Bank | 83 | 111 | 102 | (25)% | (19)% | |||||||||||||||||||||||||||
Other (16) | (53) | (48) | (47) | (10)% | (13)% | |||||||||||||||||||||||||||
Pre-tax income | $ | 433 | $ | 447 | $ | 558 | (3)% | (22)% | ||||||||||||||||||||||||
| Six months ended | ||||||||||||||||||||
| $ in millions | March 31, 2022 | March 31, 2021 | % change | |||||||||||||||||
| Net revenues: | ||||||||||||||||||||
| Private Client Group | $ | 3,761 | $ | 3,114 | 21% | |||||||||||||||
| Capital Markets | 1,027 | 885 | 16% | |||||||||||||||||
| Asset Management | 470 | 404 | 16% | |||||||||||||||||
| Raymond James Bank | 380 | 327 | 16% | |||||||||||||||||
Other (16) | (33) | (8) | (313)% | |||||||||||||||||
| Intersegment eliminations | (151) | (128) | (18)% | |||||||||||||||||
| Total net revenues | $ | 5,454 | $ | 4,594 | 19% | |||||||||||||||
| Pre-tax income/(loss): | ||||||||||||||||||||
| Private Client Group | $ | 408 | $ | 332 | 23% | |||||||||||||||
| Capital Markets | 288 | 234 | 23% | |||||||||||||||||
| Asset Management | 210 | 170 | 24% | |||||||||||||||||
| Raymond James Bank | 185 | 182 | 2% | |||||||||||||||||
Other (16) | (100) | (72) | (39)% | |||||||||||||||||
| Pre-tax income | $ | 991 | $ | 846 | 17% | |||||||||||||||
Please refer to the footnotes at the end of this press release for additional information.
11
| RAYMOND JAMES FINANCIAL, INC. | Segment Results | ||||
Fiscal Second Quarter of 2022 | (Unaudited) | ||||
| Private Client Group | ||||||||||||||||||||||||||||||||
| Three months ended | % change from | |||||||||||||||||||||||||||||||
| $ in millions | March 31, 2022 | March 31, 2021 | December 31, 2021 | March 31, 2021 | December 31, 2021 | |||||||||||||||||||||||||||
| Revenues: | ||||||||||||||||||||||||||||||||
| Asset management and related administrative fees | $ | 1,245 | $ | 979 | $ | 1,162 | 27% | 7% | ||||||||||||||||||||||||
| Brokerage revenues: | ||||||||||||||||||||||||||||||||
| Mutual and other fund products | 166 | 183 | 171 | (9)% | (3)% | |||||||||||||||||||||||||||
| Insurance and annuity products | 110 | 109 | 111 | 1% | (1)% | |||||||||||||||||||||||||||
| Equities, ETFs and fixed income products | 121 | 121 | 115 | —% | 5% | |||||||||||||||||||||||||||
| Total brokerage revenues | 397 | 413 | 397 | (4)% | —% | |||||||||||||||||||||||||||
| Account and service fees: | ||||||||||||||||||||||||||||||||
| Mutual fund and annuity service fees | 109 | 99 | 114 | 10% | (4)% | |||||||||||||||||||||||||||
RJBDP fees: (13) | ||||||||||||||||||||||||||||||||
Third-party banks | 20 | 19 | 17 | 5% | 18% | |||||||||||||||||||||||||||
Raymond James Bank | 49 | 44 | 50 | 11% | (2)% | |||||||||||||||||||||||||||
| Client account and other fees | 53 | 42 | 49 | 26% | 8% | |||||||||||||||||||||||||||
| Total account and service fees | 231 | 204 | 230 | 13% | —% | |||||||||||||||||||||||||||
| Investment banking | 9 | 16 | 13 | (44)% | (31)% | |||||||||||||||||||||||||||
| Interest income | 37 | 30 | 33 | 23% | 12% | |||||||||||||||||||||||||||
| All other | 6 | 8 | 7 | (25)% | (14)% | |||||||||||||||||||||||||||
| Total revenues | 1,925 | 1,650 | 1,842 | 17% | 5% | |||||||||||||||||||||||||||
| Interest expense | (3) | (3) | (3) | —% | —% | |||||||||||||||||||||||||||
| Net revenues | 1,922 | 1,647 | 1,839 | 17% | 5% | |||||||||||||||||||||||||||
| Non-interest expenses: | ||||||||||||||||||||||||||||||||
| Financial advisor compensation and benefits | 1,231 | 1,040 | 1,187 | 18% | 4% | |||||||||||||||||||||||||||
| Administrative compensation and benefits | 289 | 260 | 283 | 11% | 2% | |||||||||||||||||||||||||||
| Total compensation, commissions and benefits | 1,520 | 1,300 | 1,470 | 17% | 3% | |||||||||||||||||||||||||||
| Non-compensation expenses | 189 | 155 | 174 | 22% | 9% | |||||||||||||||||||||||||||
| Total non-interest expenses | 1,709 | 1,455 | 1,644 | 17% | 4% | |||||||||||||||||||||||||||
| Pre-tax income | $ | 213 | $ | 192 | $ | 195 | 11% | 9% | ||||||||||||||||||||||||
Please refer to the footnotes at the end of this press release for additional information.
12
| RAYMOND JAMES FINANCIAL, INC. | Segment Results | ||||
Fiscal Second Quarter of 2022 | (Unaudited) | ||||
| Private Client Group | ||||||||||||||||||||
| Six months ended | ||||||||||||||||||||
| $ in millions | March 31, 2022 | March 31, 2021 | % change | |||||||||||||||||
| Revenues: | ||||||||||||||||||||
| Asset management and related administrative fees | $ | 2,407 | $ | 1,864 | 29% | |||||||||||||||
| Brokerage revenues: | ||||||||||||||||||||
| Mutual and other fund products | 337 | 331 | 2% | |||||||||||||||||
| Insurance and annuity products | 221 | 207 | 7% | |||||||||||||||||
| Equities, ETFs and fixed income products | 236 | 228 | 4% | |||||||||||||||||
| Total brokerage revenues | 794 | 766 | 4% | |||||||||||||||||
| Account and service fees: | ||||||||||||||||||||
| Mutual fund and annuity service fees | 223 | 193 | 16% | |||||||||||||||||
RJBDP fees: (13) | ||||||||||||||||||||
| Third-party banks | 37 | 40 | (8)% | |||||||||||||||||
| Raymond James Bank | 99 | 87 | 14% | |||||||||||||||||
| Client account and other fees | 102 | 74 | 38% | |||||||||||||||||
| Total account and service fees | 461 | 394 | 17% | |||||||||||||||||
| Investment banking | 22 | 22 | —% | |||||||||||||||||
| Interest income | 70 | 60 | 17% | |||||||||||||||||
| All other | 13 | 13 | —% | |||||||||||||||||
| Total revenues | 3,767 | 3,119 | 21% | |||||||||||||||||
| Interest expense | (6) | (5) | 20% | |||||||||||||||||
| Net revenues | 3,761 | 3,114 | 21% | |||||||||||||||||
| Non-interest expenses: | ||||||||||||||||||||
| Financial advisor compensation and benefits | 2,418 | 1,971 | 23% | |||||||||||||||||
| Administrative compensation and benefits | 572 | 509 | 12% | |||||||||||||||||
| Total compensation, commissions and benefits | 2,990 | 2,480 | 21% | |||||||||||||||||
| Non-compensation expenses | 363 | 302 | 20% | |||||||||||||||||
| Total non-interest expenses | 3,353 | 2,782 | 21% | |||||||||||||||||
| Pre-tax income | $ | 408 | $ | 332 | 23% | |||||||||||||||
Please refer to the footnotes at the end of this press release for additional information.
13
| RAYMOND JAMES FINANCIAL, INC. | Segment Results | ||||
Fiscal Second Quarter of 2022 | (Unaudited) | ||||
| Capital Markets | ||||||||||||||||||||||||||||||||
| Three months ended | % change from | |||||||||||||||||||||||||||||||
| $ in millions | March 31, 2022 | March 31, 2021 | December 31, 2021 | March 31, 2021 | December 31, 2021 | |||||||||||||||||||||||||||
| Revenues: | ||||||||||||||||||||||||||||||||
| Brokerage revenues: | ||||||||||||||||||||||||||||||||
| Fixed income | $ | 125 | $ | 142 | $ | 120 | (12)% | 4% | ||||||||||||||||||||||||
| Equity | 41 | 34 | 39 | 21% | 5% | |||||||||||||||||||||||||||
| Total brokerage revenues | 166 | 176 | 159 | (6)% | 4% | |||||||||||||||||||||||||||
| Investment banking: | ||||||||||||||||||||||||||||||||
| Merger & acquisition and advisory | 139 | 122 | 271 | 14% | (49)% | |||||||||||||||||||||||||||
| Equity underwriting | 52 | 67 | 97 | (22)% | (46)% | |||||||||||||||||||||||||||
| Debt underwriting | 35 | 37 | 44 | (5)% | (20)% | |||||||||||||||||||||||||||
| Total investment banking | 226 | 226 | 412 | —% | (45)% | |||||||||||||||||||||||||||
| Interest income | 5 | 5 | 5 | —% | —% | |||||||||||||||||||||||||||
| Tax credit fund revenues | 15 | 24 | 35 | (38)% | (57)% | |||||||||||||||||||||||||||
| All other | 4 | 4 | 5 | —% | (20)% | |||||||||||||||||||||||||||
| Total revenues | 416 | 435 | 616 | (4)% | (32)% | |||||||||||||||||||||||||||
| Interest expense | (3) | (2) | (2) | 50% | 50% | |||||||||||||||||||||||||||
| Net revenues | 413 | 433 | 614 | (5)% | (33)% | |||||||||||||||||||||||||||
| Non-interest expenses: | ||||||||||||||||||||||||||||||||
Compensation, commissions and benefits | 253 | 259 | 331 | (2)% | (24)% | |||||||||||||||||||||||||||
Acquisition-related expenses (7) | — | — | 4 | —% | (100)% | |||||||||||||||||||||||||||
| Other non-compensation expenses | 73 | 69 | 78 | 6% | (6)% | |||||||||||||||||||||||||||
| Total non-interest expenses | 326 | 328 | 413 | (1)% | (21)% | |||||||||||||||||||||||||||
Pre-tax income | $ | 87 | $ | 105 | $ | 201 | (17)% | (57)% | ||||||||||||||||||||||||
| Six months ended | ||||||||||||||||||||
| $ in millions | March 31, 2022 | March 31, 2021 | % change | |||||||||||||||||
| Revenues: | ||||||||||||||||||||
| Brokerage revenues: | ||||||||||||||||||||
| Fixed income | $ | 245 | $ | 273 | (10)% | |||||||||||||||
| Equity | 80 | 76 | 5% | |||||||||||||||||
| Total brokerage revenues | 325 | 349 | (7)% | |||||||||||||||||
| Investment banking: | ||||||||||||||||||||
| Merger & acquisition and advisory | 410 | 271 | 51% | |||||||||||||||||
| Equity underwriting | 149 | 127 | 17% | |||||||||||||||||
| Debt underwriting | 79 | 83 | (5)% | |||||||||||||||||
| Total investment banking | 638 | 481 | 33% | |||||||||||||||||
| Interest income | 10 | 8 | 25% | |||||||||||||||||
| Tax credit fund revenues | 50 | 40 | 25% | |||||||||||||||||
| All other | 9 | 11 | (18)% | |||||||||||||||||
| Total revenues | 1,032 | 889 | 16% | |||||||||||||||||
| Interest expense | (5) | (4) | (25)% | |||||||||||||||||
| Net revenues | 1,027 | 885 | 16% | |||||||||||||||||
| Non-interest expenses: | ||||||||||||||||||||
| Compensation, commissions and benefits | 584 | 511 | 14% | |||||||||||||||||
Acquisition-related expenses (7) | 4 | — | NM | |||||||||||||||||
| Other non-compensation expenses | 151 | 140 | 8% | |||||||||||||||||
| Total non-interest expenses | 739 | 651 | 14% | |||||||||||||||||
| Pre-tax income | $ | 288 | $ | 234 | 23% | |||||||||||||||
Please refer to the footnotes at the end of this press release for additional information.
14
| RAYMOND JAMES FINANCIAL, INC. | Segment Results | ||||
Fiscal Second Quarter of 2022 | (Unaudited) | ||||
| Asset Management | ||||||||||||||||||||||||||||||||
| Three months ended | % change from | |||||||||||||||||||||||||||||||
| $ in millions | March 31, 2022 | March 31, 2021 | December 31, 2021 | March 31, 2021 | December 31, 2021 | |||||||||||||||||||||||||||
| Revenues: | ||||||||||||||||||||||||||||||||
Asset management and related administrative fees: | ||||||||||||||||||||||||||||||||
| Managed programs | $ | 149 | $ | 137 | $ | 151 | 9% | (1)% | ||||||||||||||||||||||||
| Administration and other | 77 | 64 | 76 | 20% | 1% | |||||||||||||||||||||||||||
Total asset management and related administrative fees | 226 | 201 | 227 | 12% | —% | |||||||||||||||||||||||||||
| Account and service fees | 6 | 5 | 6 | 20% | —% | |||||||||||||||||||||||||||
| All other | 2 | 3 | 3 | (33)% | (33)% | |||||||||||||||||||||||||||
| Net revenues | 234 | 209 | 236 | 12% | (1)% | |||||||||||||||||||||||||||
| Non-interest expenses: | ||||||||||||||||||||||||||||||||
Compensation, commissions and benefits | 47 | 50 | 46 | (6)% | 2% | |||||||||||||||||||||||||||
| Non-compensation expenses | 84 | 72 | 83 | 17% | 1% | |||||||||||||||||||||||||||
| Total non-interest expenses | 131 | 122 | 129 | 7% | 2% | |||||||||||||||||||||||||||
Pre-tax income | $ | 103 | $ | 87 | $ | 107 | 18% | (4)% | ||||||||||||||||||||||||
| Six months ended | ||||||||||||||||||||
| $ in millions | March 31, 2022 | March 31, 2021 | % change | |||||||||||||||||
| Revenues: | ||||||||||||||||||||
| Asset management and related administrative fees: | ||||||||||||||||||||
| Managed programs | $ | 300 | $ | 266 | 13% | |||||||||||||||
| Administration and other | 153 | 123 | 24% | |||||||||||||||||
| Total asset management and related administrative fees | 453 | 389 | 16% | |||||||||||||||||
| Account and service fees | 12 | 9 | 33% | |||||||||||||||||
| All other | 5 | 6 | (17)% | |||||||||||||||||
| Net revenues | 470 | 404 | 16% | |||||||||||||||||
| Non-interest expenses: | ||||||||||||||||||||
| Compensation, commissions and benefits | 93 | 95 | (2)% | |||||||||||||||||
| Non-compensation expenses | 167 | 139 | 20% | |||||||||||||||||
| Total non-interest expenses | 260 | 234 | 11% | |||||||||||||||||
| Pre-tax income | $ | 210 | $ | 170 | 24% | |||||||||||||||
Please refer to the footnotes at the end of this press release for additional information.
15
| RAYMOND JAMES FINANCIAL, INC. | Segment Results | |||||||
| Fiscal Second Quarter of 2021 | (Unaudited) | |||||||
| Raymond James Bank | ||||||||||||||||||||||||||||||||
| Three months ended | % change from | |||||||||||||||||||||||||||||||
| $ in millions | March 31, 2022 | March 31, 2021 | December 31, 2021 | March 31, 2021 | December 31, 2021 | |||||||||||||||||||||||||||
| Revenues: | ||||||||||||||||||||||||||||||||
| Interest income | $ | 199 | $ | 165 | $ | 187 | 21% | 6% | ||||||||||||||||||||||||
| Interest expense | (10) | (10) | (10) | —% | —% | |||||||||||||||||||||||||||
| Net interest income | 189 | 155 | 177 | 22% | 7% | |||||||||||||||||||||||||||
| All other | 8 | 5 | 6 | 60% | 33% | |||||||||||||||||||||||||||
| Net revenues | 197 | 160 | 183 | 23% | 8% | |||||||||||||||||||||||||||
| Non-interest expenses: | ||||||||||||||||||||||||||||||||
| Compensation and benefits | 14 | 13 | 13 | 8% | 8% | |||||||||||||||||||||||||||
| Non-compensation expenses: | ||||||||||||||||||||||||||||||||
| Bank loan provision/(benefit) for credit losses | 21 | (32) | (11) | NM | NM | |||||||||||||||||||||||||||
RJBDP fees to Private Client Group (13) | 49 | 44 | 50 | 11% | (2)% | |||||||||||||||||||||||||||
| All other | 30 | 24 | 29 | 25% | 3% | |||||||||||||||||||||||||||
| Total non-compensation expenses | 100 | 36 | 68 | 178% | 47% | |||||||||||||||||||||||||||
| Total non-interest expenses | 114 | 49 | 81 | 133% | 41% | |||||||||||||||||||||||||||
| Pre-tax income | $ | 83 | $ | 111 | $ | 102 | (25)% | (19)% | ||||||||||||||||||||||||
| Six months ended | ||||||||||||||||||||
| $ in millions | March 31, 2022 | March 31, 2021 | % change | |||||||||||||||||
| Revenues: | ||||||||||||||||||||
| Interest income | $ | 386 | $ | 333 | 16% | |||||||||||||||
| Interest expense | (20) | (21) | (5)% | |||||||||||||||||
| Net interest income | 366 | 312 | 17% | |||||||||||||||||
| All other | 14 | 15 | (7)% | |||||||||||||||||
| Net revenues | 380 | 327 | 16% | |||||||||||||||||
| Non-interest expenses: | ||||||||||||||||||||
| Compensation and benefits | 27 | 25 | 8% | |||||||||||||||||
| Non-compensation expenses: | ||||||||||||||||||||
| Bank loan provision/(benefit) for credit losses | 10 | (18) | NM | |||||||||||||||||
RJBDP fees to Private Client Group (13) | 99 | 87 | 14% | |||||||||||||||||
| All other | 59 | 51 | 16% | |||||||||||||||||
| Total non-compensation expenses | 168 | 120 | 40% | |||||||||||||||||
| Total non-interest expenses | 195 | 145 | 34% | |||||||||||||||||
| Pre-tax income | $ | 185 | $ | 182 | 2% | |||||||||||||||
Please refer to the footnotes at the end of this press release for additional information.
16
| RAYMOND JAMES FINANCIAL, INC. | Segment Results | ||||
Fiscal Second Quarter of 2022 | (Unaudited) | ||||
| Other | ||||||||||||||||||||||||||||||||
| Three months ended | % change from | |||||||||||||||||||||||||||||||
| $ in millions | March 31, 2022 | March 31, 2021 | December 31, 2021 | March 31, 2021 | December 31, 2021 | |||||||||||||||||||||||||||
| Revenues: | ||||||||||||||||||||||||||||||||
| Interest income | $ | 3 | $ | 3 | $ | 1 | —% | 200% | ||||||||||||||||||||||||
| Net gains/(losses) on private equity investments | (2) | 8 | 5 | NM | NM | |||||||||||||||||||||||||||
| All other | 5 | 2 | 2 | 150% | 150% | |||||||||||||||||||||||||||
| Total revenues | 6 | 13 | 8 | (54)% | (25)% | |||||||||||||||||||||||||||
| Interest expense | (24) | (25) | (23) | (4)% | 4% | |||||||||||||||||||||||||||
| Net revenues | (18) | (12) | (15) | (50)% | (20)% | |||||||||||||||||||||||||||
| Non-interest expenses: | ||||||||||||||||||||||||||||||||
| Compensation and all other | 24 | 36 | 30 | (33)% | (20)% | |||||||||||||||||||||||||||
Acquisition-related expenses (7) | 11 | — | 2 | NM | 450% | |||||||||||||||||||||||||||
| Total non-interest expenses | 35 | 36 | 32 | (3)% | 9% | |||||||||||||||||||||||||||
Pre-tax loss | $ | (53) | $ | (48) | $ | (47) | (10)% | (13)% | ||||||||||||||||||||||||
| Six months ended | ||||||||||||||||||||
| $ in millions | March 31, 2022 | March 31, 2021 | % change | |||||||||||||||||
| Revenues: | ||||||||||||||||||||
| Interest income | $ | 4 | $ | 6 | (33)% | |||||||||||||||
Net gains on private equity investments (8) | 3 | 32 | (91)% | |||||||||||||||||
| All other | 7 | 3 | 133% | |||||||||||||||||
| Total revenues | 14 | 41 | (66)% | |||||||||||||||||
| Interest expense | (47) | (49) | (4)% | |||||||||||||||||
| Net revenues | (33) | (8) | (313)% | |||||||||||||||||
| Non-interest expenses: | ||||||||||||||||||||
Compensation and all other (8) | 54 | 62 | (13)% | |||||||||||||||||
Acquisition-related expenses (7) | 13 | 2 | 550% | |||||||||||||||||
| Total non-interest expenses | 67 | 64 | 5% | |||||||||||||||||
Pre-tax loss | $ | (100) | $ | (72) | (39)% | |||||||||||||||
Please refer to the footnotes at the end of this press release for additional information.
17
| RAYMOND JAMES FINANCIAL, INC. | Raymond James Bank Selected Key Metrics | ||||
Fiscal Second Quarter of 2022 | (Unaudited) | ||||
The following metrics are attributable to our Raymond James Bank banking subsidiary, which is a component of our Raymond James Bank
segment.
| As of | % change from | |||||||||||||||||||||||||||||||
$ in millions | March 31, 2022 | March 31, 2021 | December 31, 2021 | March 31, 2021 | December 31, 2021 | |||||||||||||||||||||||||||
Total assets | $ | 38,579 | $ | 33,221 | $ | 38,107 | 16% | 1% | ||||||||||||||||||||||||
Total equity | $ | 2,383 | $ | 2,409 | $ | 2,597 | (1)% | (8)% | ||||||||||||||||||||||||
Bank loans, net | $ | 27,883 | $ | 22,879 | $ | 26,132 | 22% | 7% | ||||||||||||||||||||||||
| Bank loan allowance for credit losses | $ | 328 | $ | 345 | $ | 308 | (5)% | 6% | ||||||||||||||||||||||||
| Bank loan allowance for credit losses as a % of loans held for investment | 1.17 | % | 1.50 | % | 1.18 | % | ||||||||||||||||||||||||||
| Total nonperforming assets | $ | 104 | $ | 31 | $ | 74 | 235% | 41% | ||||||||||||||||||||||||
| Nonperforming assets as a % of total assets | 0.27 | % | 0.09 | % | 0.19 | % | ||||||||||||||||||||||||||
| Total criticized loans | $ | 735 | $ | 1,001 | $ | 735 | (27)% | —% | ||||||||||||||||||||||||
Criticized loans as a % of loans held for investment | 2.63 | % | 4.35 | % | 2.75 | % | ||||||||||||||||||||||||||
| Capital ratios: | ||||||||||||||||||||||||||||||||
| Tier 1 capital | 12.6 | % | (4) | 13.1 | % | 13.3 | % | |||||||||||||||||||||||||
| Total capital | 13.9 | % | (4) | 14.4 | % | 14.6 | % | |||||||||||||||||||||||||
| Tier 1 leverage | 7.2 | % | (4) | 7.5 | % | 7.2 | % | |||||||||||||||||||||||||
| Three months ended | % change from | |||||||||||||||||||||||||||||||
| $ in millions | March 31, 2022 | March 31, 2021 | December 31, 2021 | March 31, 2021 | December 31, 2021 | |||||||||||||||||||||||||||
| Bank loan provision/(benefit) for credit losses | $ | 21 | $ | (32) | $ | (11) | NM | NM | ||||||||||||||||||||||||
| Net charge-offs | $ | 1 | $ | 2 | $ | 1 | (50)% | —% | ||||||||||||||||||||||||
| Net interest margin (net yield on interest-earning assets) | 2.01 | % | 1.94 | % | 1.92 | % | ||||||||||||||||||||||||||
| Six months ended | ||||||||||||||||||||||||||||||||
| $ in millions | March 31, 2022 | March 31, 2021 | % change | |||||||||||||||||||||||||||||
| Bank loan provision/(benefit) for credit losses | $ | 10 | $ | (18) | NM | |||||||||||||||||||||||||||
| Net charge-offs: | $ | 2 | $ | 2 | —% | |||||||||||||||||||||||||||
| Net interest margin (net yield on interest-earning assets) | 1.97 | % | 1.98 | % | ||||||||||||||||||||||||||||
Please refer to the footnotes at the end of this press release for additional information.
18
| RAYMOND JAMES FINANCIAL, INC. | Non-GAAP Financial Measures | ||||
Fiscal Second Quarter of 2022 | (Unaudited) | ||||
Reconciliation of non-GAAP financial measures to GAAP financial measures
We utilize certain non-GAAP financial measures as additional measures to aid in, and enhance, the understanding of our financial results and related measures. These non-GAAP financial measures have been separately identified in this document. We believe certain of these non-GAAP financial measures provides useful information to management and investors by excluding certain material items that may not be indicative of our core operating results. We utilize these non-GAAP financial measures in assessing the financial performance of the business, as they facilitate a comparison of current- and prior-period results. We believe that return on tangible common equity and tangible book value per share are meaningful to investors as they facilitate comparisons of our results to the results of other companies. In the following tables, the tax effect of non-GAAP adjustments reflects the statutory rate associated with each non-GAAP item. These non-GAAP financial measures should be considered in addition to, and not as a substitute for, measures of financial performance prepared in accordance with GAAP. In addition, our non-GAAP financial measures may not be comparable to similarly titled non-GAAP financial measures of other companies. The following tables provide a reconciliation of non-GAAP financial measures to the most directly comparable GAAP measures.
| Three months ended | Six months ended | ||||||||||||||||||||||||||||
| $ in millions, except per share amounts | March 31, 2022 | December 31, 2021 | March 31, 2022 | March 31, 2021 | |||||||||||||||||||||||||
Net income | $ | 323 | $ | 446 | $ | 769 | $ | 667 | |||||||||||||||||||||
Non-GAAP adjustments: | |||||||||||||||||||||||||||||
Acquisition-related expenses (7) | 11 | 6 | 17 | 2 | |||||||||||||||||||||||||
| Pre-tax impact of non-GAAP adjustments | 11 | 6 | 17 | 2 | |||||||||||||||||||||||||
Tax effect of non-GAAP adjustments | (3) | (1) | (4) | — | |||||||||||||||||||||||||
Total non-GAAP adjustments, net of tax | 8 | 5 | 13 | 2 | |||||||||||||||||||||||||
Adjusted net income | $ | 331 | $ | 451 | $ | 782 | $ | 669 | |||||||||||||||||||||
Pre-tax income | $ | 433 | $ | 558 | $ | 991 | $ | 846 | |||||||||||||||||||||
Pre-tax impact of non-GAAP adjustments (as detailed above) | 11 | 6 | 17 | 2 | |||||||||||||||||||||||||
Adjusted pre-tax income | $ | 444 | $ | 564 | $ | 1,008 | $ | 848 | |||||||||||||||||||||
Pre-tax margin (11) | 16.2 | % | 20.1 | % | 18.2 | % | 18.4 | % | |||||||||||||||||||||
Non-GAAP adjustments: | |||||||||||||||||||||||||||||
Acquisition-related expenses (7) | 0.4 | % | 0.2 | % | 0.3 | % | 0.1 | % | |||||||||||||||||||||
| Total non-GAAP adjustments | 0.4 | % | 0.2 | % | 0.3 | % | 0.1 | % | |||||||||||||||||||||
Adjusted pre-tax margin (11) | 16.6 | % | 20.3 | % | 18.5 | % | 18.5 | % | |||||||||||||||||||||
Earnings per common share: (5) (6) | |||||||||||||||||||||||||||||
| Basic | $ | 1.56 | $ | 2.16 | $ | 3.71 | $ | 3.23 | |||||||||||||||||||||
Non-GAAP adjustments: | |||||||||||||||||||||||||||||
Acquisition-related expenses (7) | 0.05 | 0.03 | 0.08 | 0.01 | |||||||||||||||||||||||||
| Tax effect of non-GAAP adjustments | (0.02) | (0.01) | (0.02) | — | |||||||||||||||||||||||||
| Total non-GAAP adjustments, net of tax | 0.03 | 0.02 | 0.06 | 0.01 | |||||||||||||||||||||||||
| Adjusted basic | $ | 1.59 | $ | 2.18 | $ | 3.77 | $ | 3.24 | |||||||||||||||||||||
| Diluted | $ | 1.52 | $ | 2.10 | $ | 3.61 | $ | 3.16 | |||||||||||||||||||||
Non-GAAP adjustments: | |||||||||||||||||||||||||||||
Acquisition-related expenses (7) | 0.05 | 0.03 | 0.08 | 0.01 | |||||||||||||||||||||||||
| Tax effect of non-GAAP adjustments | (0.02) | (0.01) | (0.02) | — | |||||||||||||||||||||||||
| Total non-GAAP adjustments, net of tax | 0.03 | 0.02 | 0.06 | 0.01 | |||||||||||||||||||||||||
| Adjusted diluted | $ | 1.55 | $ | 2.12 | $ | 3.67 | $ | 3.17 | |||||||||||||||||||||
Please refer to the footnotes at the end of this press release for additional information.
19
| RAYMOND JAMES FINANCIAL, INC. | Non-GAAP Financial Measures | ||||
Fiscal Second Quarter of 2022 | (Unaudited) | ||||
Reconciliation of non-GAAP financial measures to GAAP financial measures
(Continued from previous page)
| Book value per share | As of | |||||||||||||||||||
| $ in millions, except per share amounts | March 31, 2022 | March 31, 2021 | December 31, 2021 | |||||||||||||||||
Total equity attributable to Raymond James Financial, Inc. | $ | 8,602 | $ | 7,592 | $ | 8,600 | ||||||||||||||
Less non-GAAP adjustments: | ||||||||||||||||||||
Goodwill and identifiable intangible assets, net | 1,110 | 868 | 874 | |||||||||||||||||
| Deferred tax liabilities, net | (88) | (56) | (65) | |||||||||||||||||
| Tangible common equity attributable to Raymond James Financial, Inc. | $ | 7,580 | $ | 6,780 | $ | 7,791 | ||||||||||||||
Common shares outstanding (5) | 207.9 | 205.8 | 207.5 | |||||||||||||||||
Book value per share (5) (9) | $ | 41.38 | $ | 36.89 | $ | 41.45 | ||||||||||||||
Tangible book value per share (5) (9) | $ | 36.46 | $ | 32.94 | $ | 37.55 | ||||||||||||||
| Return on equity | Three months ended | Six months ended | |||||||||||||||||||||||||||||||||
| $ in millions | March 31, 2022 | March 31, 2021 | December 31, 2021 | March 31, 2022 | March 31, 2021 | ||||||||||||||||||||||||||||||
Average equity (17) | $ | 8,601 | $ | 7,478 | $ | 8,423 | $ | 8,482 | $ | 7,356 | |||||||||||||||||||||||||
Impact on average equity of non-GAAP adjustments: | |||||||||||||||||||||||||||||||||||
Acquisition-related expenses (7) | 6 | NA | 3 | 8 | 1 | ||||||||||||||||||||||||||||||
| Tax effect of non-GAAP adjustments | (2) | NA | (1) | (2) | — | ||||||||||||||||||||||||||||||
Adjusted average equity (17) | $ | 8,605 | NA | $ | 8,425 | $ | 8,488 | $ | 7,357 | ||||||||||||||||||||||||||
Average equity (17) | $ | 8,601 | $ | 7,478 | $ | 8,423 | $ | 8,482 | $ | 7,356 | |||||||||||||||||||||||||
Less: | |||||||||||||||||||||||||||||||||||
| Average goodwill and identifiable intangible assets, net | 992 | 851 | 878 | 955 | 767 | ||||||||||||||||||||||||||||||
| Average deferred tax liabilities, net | (77) | (56) | (64) | (72) | (49) | ||||||||||||||||||||||||||||||
Average tangible common equity (17) | $ | 7,686 | $ | 6,683 | $ | 7,609 | $ | 7,599 | $ | 6,638 | |||||||||||||||||||||||||
Impact on average equity of non-GAAP adjustments: | |||||||||||||||||||||||||||||||||||
Acquisition-related expenses (7) | 6 | NA | 3 | 8 | 1 | ||||||||||||||||||||||||||||||
| Tax effect of non-GAAP adjustments | (2) | NA | (1) | (2) | — | ||||||||||||||||||||||||||||||
Adjusted average tangible common equity (17) | $ | 7,690 | NA | $ | 7,611 | $ | 7,605 | $ | 6,639 | ||||||||||||||||||||||||||
Return on equity (10) | 15.0 | % | 19.0 | % | 21.2 | % | 18.1 | % | 18.1 | % | |||||||||||||||||||||||||
Adjusted return on equity (10) | 15.4 | % | NA | 21.4 | % | 18.4 | % | 18.2 | % | ||||||||||||||||||||||||||
Return on tangible common equity (10) | 16.8 | % | 21.2 | % | 23.4 | % | 20.2 | % | 20.1 | % | |||||||||||||||||||||||||
Adjusted return on tangible common equity (10) | 17.2 | % | NA | 23.7 | % | 20.6 | % | 20.2 | % | ||||||||||||||||||||||||||
Please refer to the footnotes at the end of this press release for additional information.
20
RAYMOND JAMES FINANCIAL, INC.
Fiscal Second Quarter of 2022 Footnotes
| (1) | Domestic Private Client Group net new assets represents domestic Private Client Group client inflows, including dividends and interest, less domestic Private Client Group client outflows, including commissions, advisory fees and other fees. | |||||||
| (2) | These are non-GAAP financial measures. See the schedules on the previous pages for a reconciliation of non-GAAP financial measures to the most directly comparable GAAP measures and for more information on these measures. There were no non-GAAP adjustments to earnings for the three months ended March 31, 2021; therefore percent changes for earnings-related non-GAAP financial measures are calculated based on non-GAAP financial measures for the current period as compared to GAAP results for the March 31, 2021 period. | |||||||
| (3) | These metrics include the impact of the acquisition of Charles Stanley Group PLC (“Charles Stanley”), which was completed on January 21, 2022. As of March 31, 2022, the impact on client assets under administration and Private Client Group assets under administration was $33 billion, the impact on Private Client Group assets in fee-based accounts was $21 billion, and the impact on financial advisors was the addition of 200 advisors. | |||||||
| (4) | Estimated. | |||||||
| (5) | During our fiscal fourth quarter of 2021 the Board of Directors approved a 3-for-2 stock split, effected in the form of a 50% stock dividend, paid on September 21, 2021. All share and per share information has been retroactively adjusted to reflect this stock split. | |||||||
| (6) | Earnings per common share is computed by dividing net income (less allocation of earnings and dividends to participating securities) by weighted-average common shares outstanding (basic or diluted as applicable) for each respective period or, in the case of adjusted earnings per common share, computed by dividing adjusted net income (less allocation of earnings and dividends to participating securities) by weighted-average common shares outstanding (basic or diluted as applicable) for each respective period. | |||||||
| (7) | Acquisition-related expenses in our Other segment for the three and six months ended March 31, 2022 primarily included professional expenses and other costs incurred to effect our acquisition of Charles Stanley, which was completed in January 2022, and our announced acquisitions of TriState Capital Holdings, Inc. and SumRidge Partners, LLC. Acquisition-related expenses in our Other segment for the six months ended March 31, 2021 primarily included professional expenses associated with our acquisitions of NWPS Holdings, Inc. and Financo, LLC (“Financo”), which were completed in fiscal 2021. Acquisition-related expenses in our Capital Markets segment included amortization expense related to intangible assets with short useful lives associated with our acquisitions of Financo and Cebile Capital, which were completed in fiscal 2021. | |||||||
| (8) | Other revenues included $3 million and $32 million of net private equity gains for the six months ended March 31, 2022 and 2021, respectively, which were included in our Other segment. Of these amounts, an insignificant amount of losses and $10 million of gains for the six months ended March 31, 2022 and 2021, respectively, were attributable to noncontrolling interests and were offset in Other expenses. | |||||||
| (9) | Book value per share is computed by dividing total equity attributable to Raymond James Financial, Inc. by the number of common shares outstanding at the end of each respective period or, in the case of tangible book value per share, computed by dividing tangible common equity by the number of common shares outstanding at the end of each respective period. Tangible common equity is defined as total equity attributable to Raymond James Financial, Inc. less goodwill and intangible assets, net of related deferred taxes. | |||||||
| (10) | Return on equity is computed by dividing annualized net income by average equity for each respective period or, in the case of return on tangible common equity, computed by dividing annualized net income by average tangible common equity for each respective period. Adjusted return on equity is computed by dividing annualized adjusted net income by adjusted average equity for each respective period, or in the case of adjusted return on tangible common equity, computed by dividing annualized adjusted net income by adjusted average tangible common equity for each respective period. | |||||||
| (11) | Pre-tax margin is computed by dividing pre-tax income by net revenues for each respective period or, in the case of adjusted pre-tax margin, computed by dividing adjusted pre-tax income by net revenues for each respective period. | |||||||
| (12) | Total compensation ratio is computed by dividing compensation, commissions and benefits expense by net revenues for each respective period. | |||||||
| (13) | We earn fees from RJBDP, a multi-bank sweep program in which clients’ cash deposits in their brokerage accounts are swept into interest-bearing deposit accounts at Raymond James Bank and various third-party banks. Fees earned by the Private Client Group on Raymond James Bank deposits are eliminated in consolidation. | |||||||
| (14) | Average yield on RJBDP - third-party banks is computed by dividing annualized RJBDP fees - third-party banks, which are net of the interest expense paid to clients by the third-party banks, by the average daily RJBDP balances at third-party banks. | |||||||
| (15) | The average yield is presented on a tax-equivalent basis for each respective period. | |||||||
| (16) | The Other segment includes the results of our private equity investments, interest income on certain corporate cash balances, certain acquisition-related expenses, and certain corporate overhead costs of RJF, including the interest costs on our public debt. | |||||||
| (17) | Average equity is computed by adding the total equity attributable to Raymond James Financial, Inc. as of the date indicated to the prior quarter-end total, and dividing by two, or in the case of average tangible common equity, computed by adding tangible common equity as of the date indicated to the prior quarter-end total, and dividing by two. For the year-to-date period, average equity is computed by adding the total equity attributable to Raymond James Financial, Inc. as of each quarter-end date during the indicated period to the beginning of year total, and dividing by three, or in the case of average tangible common equity, computed by adding tangible common equity as of each quarter-end date during the indicated period to the beginning of year total, and dividing by three. Adjusted average equity is computed by adjusting for the impact on average equity of the non-GAAP adjustments, as applicable for each respective period. Adjusted average tangible common equity is computed by adjusting for the impact on average tangible common equity of the non-GAAP adjustments, as applicable for each respective period. | |||||||
21

EARNINGS RELEASE FINANCIAL SUPPLEMENT
SECOND QUARTER
OF FISCAL 2022 RESULTS
RAYMOND JAMES FINANCIAL, INC.
Consolidated Statements of Income (Unaudited)
| Three months ended | % change from | Six months ended | ||||||||||||||||||||||||||||||||||||||||||||||||||||||||||||
| in millions, except per share amounts | March 31, 2021 | June 30, 2021 | September 30, 2021 | December 31, 2021 | March 31, 2022 | March 31, 2021 | December 31, 2021 | March 31, 2021 | March 31, 2022 | % change | ||||||||||||||||||||||||||||||||||||||||||||||||||||
| Revenues: | ||||||||||||||||||||||||||||||||||||||||||||||||||||||||||||||
Asset management and related administrative fees | $ | 1,173 | $ | 1,262 | $ | 1,366 | $ | 1,382 | $ | 1,464 | 25 | % | 6 | % | $ | 2,240 | $ | 2,846 | 27 | % | ||||||||||||||||||||||||||||||||||||||||||
| Brokerage revenues: | ||||||||||||||||||||||||||||||||||||||||||||||||||||||||||||||
| Securities commissions | 443 | 415 | 412 | 425 | 422 | (5) | % | (1) | % | 824 | 847 | 3 | % | |||||||||||||||||||||||||||||||||||||||||||||||||
| Principal transactions | 148 | 137 | 129 | 133 | 142 | (4) | % | 7 | % | 295 | 275 | (7) | % | |||||||||||||||||||||||||||||||||||||||||||||||||
| Total brokerage revenues | 591 | 552 | 541 | 558 | 564 | (5) | % | 1 | % | 1,119 | 1,122 | — | % | |||||||||||||||||||||||||||||||||||||||||||||||||
| Account and service fees | 159 | 161 | 170 | 177 | 179 | 13 | % | 1 | % | 304 | 356 | 17 | % | |||||||||||||||||||||||||||||||||||||||||||||||||
| Investment banking | 242 | 276 | 364 | 425 | 235 | (3) | % | (45) | % | 503 | 660 | 31 | % | |||||||||||||||||||||||||||||||||||||||||||||||||
| Interest income | 200 | 205 | 215 | 225 | 242 | 21 | % | 8 | % | 403 | 467 | 16 | % | |||||||||||||||||||||||||||||||||||||||||||||||||
Other (1) | 44 | 55 | 74 | 51 | 27 | (39) | % | (47) | % | 100 | 78 | (22) | % | |||||||||||||||||||||||||||||||||||||||||||||||||
| Total revenues | 2,409 | 2,511 | 2,730 | 2,818 | 2,711 | 13 | % | (4) | % | 4,669 | 5,529 | 18 | % | |||||||||||||||||||||||||||||||||||||||||||||||||
| Interest expense | (37) | (40) | (35) | (37) | (38) | 3 | % | 3 | % | (75) | (75) | — | % | |||||||||||||||||||||||||||||||||||||||||||||||||
| Net revenues | 2,372 | 2,471 | 2,695 | 2,781 | 2,673 | 13 | % | (4) | % | 4,594 | 5,454 | 19 | % | |||||||||||||||||||||||||||||||||||||||||||||||||
| Non-interest expenses: | ||||||||||||||||||||||||||||||||||||||||||||||||||||||||||||||
| Compensation, commissions and benefits | 1,648 | 1,661 | 1,774 | 1,884 | 1,852 | 12 | % | (2) | % | 3,148 | 3,736 | 19 | % | |||||||||||||||||||||||||||||||||||||||||||||||||
| Non-compensation expenses: | ||||||||||||||||||||||||||||||||||||||||||||||||||||||||||||||
Communications and information processing | 107 | 109 | 114 | 112 | 127 | 19 | % | 13 | % | 206 | 239 | 16 | % | |||||||||||||||||||||||||||||||||||||||||||||||||
| Occupancy and equipment | 57 | 58 | 60 | 59 | 62 | 9 | % | 5 | % | 114 | 121 | 6 | % | |||||||||||||||||||||||||||||||||||||||||||||||||
| Business development | 21 | 31 | 36 | 35 | 34 | 62 | % | (3) | % | 44 | 69 | 57 | % | |||||||||||||||||||||||||||||||||||||||||||||||||
| Investment sub-advisory fees | 31 | 34 | 37 | 38 | 40 | 29 | % | 5 | % | 59 | 78 | 32 | % | |||||||||||||||||||||||||||||||||||||||||||||||||
| Professional fees | 24 | 26 | 32 | 26 | 22 | (8) | % | (15) | % | 54 | 48 | (11) | % | |||||||||||||||||||||||||||||||||||||||||||||||||
| Bank loan provision/(benefit) for credit losses | (32) | (19) | 5 | (11) | 21 | NM | NM | (18) | 10 | NM | ||||||||||||||||||||||||||||||||||||||||||||||||||||
Losses on extinguishment of debt (2) | — | 98 | — | — | — | — | % | — | % | — | — | — | % | |||||||||||||||||||||||||||||||||||||||||||||||||
Acquisition-related expenses (3) | — | 7 | 10 | 6 | 11 | NM | 83 | % | 2 | 17 | 750 | % | ||||||||||||||||||||||||||||||||||||||||||||||||||
Other (1) | 69 | 81 | 67 | 74 | 71 | 3 | % | (4) | % | 139 | 145 | 4 | % | |||||||||||||||||||||||||||||||||||||||||||||||||
| Total non-compensation expenses | 277 | 425 | 361 | 339 | 388 | 40 | % | 14 | % | 600 | 727 | 21 | % | |||||||||||||||||||||||||||||||||||||||||||||||||
| Total non-interest expenses | 1,925 | 2,086 | 2,135 | 2,223 | 2,240 | 16 | % | 1 | % | 3,748 | 4,463 | 19 | % | |||||||||||||||||||||||||||||||||||||||||||||||||
Pre-tax income | 447 | 385 | 560 | 558 | 433 | (3) | % | (22) | % | 846 | 991 | 17 | % | |||||||||||||||||||||||||||||||||||||||||||||||||
| Provision for income taxes | 92 | 78 | 131 | 112 | 110 | 20 | % | (2) | % | 179 | 222 | 24 | % | |||||||||||||||||||||||||||||||||||||||||||||||||
| Net income | $ | 355 | $ | 307 | $ | 429 | $ | 446 | $ | 323 | (9) | % | (28) | % | $ | 667 | $ | 769 | 15 | % | ||||||||||||||||||||||||||||||||||||||||||
Earnings per common share – basic (4) (5) | $ | 1.72 | $ | 1.49 | $ | 2.08 | $ | 2.16 | $ | 1.56 | (9) | % | (28) | % | $ | 3.23 | $ | 3.71 | 15 | % | ||||||||||||||||||||||||||||||||||||||||||
Earnings per common share – diluted (4) (5) | $ | 1.68 | $ | 1.45 | $ | 2.02 | $ | 2.10 | $ | 1.52 | (10) | % | (28) | % | $ | 3.16 | $ | 3.61 | 14 | % | ||||||||||||||||||||||||||||||||||||||||||
Weighted-average common shares outstanding – basic (5) | 206.7 | 205.8 | 205.5 | 206.3 | 207.7 | — | % | 1 | % | 206.0 | 207.0 | — | % | |||||||||||||||||||||||||||||||||||||||||||||||||
Weighted-average common and common equivalent shares outstanding – diluted (5) | 211.8 | 211.7 | 211.7 | 212.4 | 213.0 | 1 | % | — | % | 210.6 | 212.6 | 1 | % | |||||||||||||||||||||||||||||||||||||||||||||||||
Please refer to the footnotes at the end of this supplement for additional information.
2
RAYMOND JAMES FINANCIAL, INC.
Consolidated Selected Key Metrics (Unaudited)
| As of | % change from | |||||||||||||||||||||||||||||||||||||||||||
| $ in millions, except per share amounts | March 31, 2021 | June 30, 2021 | September 30, 2021 | December 31, 2021 | March 31, 2022 | March 31, 2021 | December 31, 2021 | |||||||||||||||||||||||||||||||||||||
| Total assets | $ | 56,066 | $ | 57,161 | $ | 61,891 | $ | 68,461 | $ | 73,101 | 30 | % | 7 | % | ||||||||||||||||||||||||||||||
| Total equity attributable to Raymond James Financial, Inc. | $ | 7,592 | $ | 7,863 | $ | 8,245 | $ | 8,600 | $ | 8,602 | 13 | % | — | % | ||||||||||||||||||||||||||||||
Book value per share (5) (6) | $ | 36.89 | $ | 38.28 | $ | 40.08 | $ | 41.45 | $ | 41.38 | 12 | % | — | % | ||||||||||||||||||||||||||||||
Tangible book value per share (5) (6) (7) | $ | 32.94 | $ | 34.36 | $ | 36.11 | $ | 37.55 | $ | 36.46 | 11 | % | (3) | % | ||||||||||||||||||||||||||||||
| Capital ratios: | ||||||||||||||||||||||||||||||||||||||||||||
| Tier 1 capital | 23.6 | % | 24.4 | % | 25.0 | % | 25.9 | % | 23.9 | % | (8) | |||||||||||||||||||||||||||||||||
| Total capital | 24.7 | % | 25.6 | % | 26.2 | % | 27.0 | % | 25.0 | % | (8) | |||||||||||||||||||||||||||||||||
| Tier 1 leverage | 12.2 | % | 12.6 | % | 12.6 | % | 12.1 | % | 11.1 | % | (8) | |||||||||||||||||||||||||||||||||
| Three months ended | % change from | Six months ended | ||||||||||||||||||||||||||||||||||||||||||||||||||||||||||||
| $ in millions | March 31, 2021 | June 30, 2021 | September 30, 2021 | December 31, 2021 | March 31, 2022 | March 31, 2021 | December 31, 2021 | March 31, 2021 | March 31, 2022 | % change | ||||||||||||||||||||||||||||||||||||||||||||||||||||
Adjusted pre-tax income (7) | NA | $ | 490 | $ | 570 | $ | 564 | $ | 444 | (1) | % | (21) | % | $ | 848 | $ | 1,008 | 19 | % | |||||||||||||||||||||||||||||||||||||||||||
Adjusted net income (7) | NA | $ | 386 | $ | 437 | $ | 451 | $ | 331 | (7) | % | (27) | % | $ | 669 | $ | 782 | 17 | % | |||||||||||||||||||||||||||||||||||||||||||
Adjusted earnings per common share – basic (4) (5) (7) | NA | $ | 1.88 | $ | 2.12 | $ | 2.18 | $ | 1.59 | (8) | % | (27) | % | $ | 3.24 | $ | 3.77 | 16 | % | |||||||||||||||||||||||||||||||||||||||||||
Adjusted earnings per common share – diluted (4) (5) (7) | NA | $ | 1.82 | $ | 2.06 | $ | 2.12 | $ | 1.55 | (8) | % | (27) | % | $ | 3.17 | $ | 3.67 | 16 | % | |||||||||||||||||||||||||||||||||||||||||||
Return on equity (9) | 19.0 | % | 15.9 | % | 21.3 | % | 21.2 | % | 15.0 | % | 18.1 | % | 18.1 | % | ||||||||||||||||||||||||||||||||||||||||||||||||
Adjusted return on equity (7) (9) | NA | 19.9 | % | 21.7 | % | 21.4 | % | 15.4 | % | 18.2 | % | 18.4 | % | |||||||||||||||||||||||||||||||||||||||||||||||||
Return on tangible common equity (7) (9) | 21.2 | % | 17.7 | % | 23.7 | % | 23.4 | % | 16.8 | % | 20.1 | % | 20.2 | % | ||||||||||||||||||||||||||||||||||||||||||||||||
Adjusted return on tangible common equity (7) (9) | NA | 22.2 | % | 24.1 | % | 23.7 | % | 17.2 | % | 20.2 | % | 20.6 | % | |||||||||||||||||||||||||||||||||||||||||||||||||
Pre-tax margin (10) | 18.8 | % | 15.6 | % | 20.8 | % | 20.1 | % | 16.2 | % | 18.4 | % | 18.2 | % | ||||||||||||||||||||||||||||||||||||||||||||||||
Adjusted pre-tax margin (7) (10) | NA | 19.8 | % | 21.2 | % | 20.3 | % | 16.6 | % | 18.5 | % | 18.5 | % | |||||||||||||||||||||||||||||||||||||||||||||||||
Total compensation ratio (11) | 69.5 | % | 67.2 | % | 65.8 | % | 67.7 | % | 69.3 | % | 68.5 | % | 68.5 | % | ||||||||||||||||||||||||||||||||||||||||||||||||
| Effective tax rate | 20.6 | % | 20.3 | % | 23.4 | % | 20.1 | % | 25.4 | % | 21.2 | % | 22.4 | % | ||||||||||||||||||||||||||||||||||||||||||||||||
Please refer to the footnotes at the end of this supplement for additional information.
3
RAYMOND JAMES FINANCIAL, INC.
Consolidated Selected Key Metrics (Unaudited)
| As of | % change from | ||||||||||||||||||||||||||||||||||||||||||||||
| March 31, 2021 | June 30, 2021 | September 30, 2021 | December 31, 2021 | March 31, 2022 | March 31, 2021 | December 31, 2021 | |||||||||||||||||||||||||||||||||||||||||
Client asset metrics ($ in billions): | |||||||||||||||||||||||||||||||||||||||||||||||
Client assets under administration (12) | $ | 1,085.4 | $ | 1,165.0 | $ | 1,178.7 | $ | 1,257.8 | $ | 1,256.1 | 16 | % | — | % | |||||||||||||||||||||||||||||||||
Private Client Group assets under administration (12) | $ | 1,028.1 | $ | 1,102.9 | $ | 1,115.4 | $ | 1,199.8 | $ | 1,198.3 | 17 | % | — | % | |||||||||||||||||||||||||||||||||
Private Client Group assets in fee-based accounts (12) | $ | 567.6 | $ | 616.7 | $ | 627.1 | $ | 677.8 | $ | 678.0 | 19 | % | — | % | |||||||||||||||||||||||||||||||||
| Financial assets under management | $ | 178.2 | $ | 191.0 | $ | 191.9 | $ | 203.2 | $ | 193.7 | 9 | % | (5) | % | |||||||||||||||||||||||||||||||||
Clients' domestic cash sweep balances ($ in millions): | |||||||||||||||||||||||||||||||||||||||||||||||
Raymond James Bank Deposit Program (“RJBDP”): (13) | |||||||||||||||||||||||||||||||||||||||||||||||
| Raymond James Bank | $ | 28,174 | $ | 29,253 | $ | 31,410 | $ | 33,097 | $ | 33,570 | 19 | % | 1 | % | |||||||||||||||||||||||||||||||||
| Third-party banks | 25,110 | 25,080 | 24,496 | 24,316 | 25,887 | 3 | % | 6 | % | ||||||||||||||||||||||||||||||||||||||
| Subtotal RJBDP | 53,284 | 54,333 | 55,906 | 57,413 | 59,457 | 12 | % | 4 | % | ||||||||||||||||||||||||||||||||||||||
| Client Interest Program | 9,517 | 8,610 | 10,762 | 16,065 | 17,013 | 79 | % | 6 | % | ||||||||||||||||||||||||||||||||||||||
| Total clients’ domestic cash sweep balances | $ | 62,801 | $ | 62,943 | $ | 66,668 | $ | 73,478 | $ | 76,470 | 22 | % | 4 | % | |||||||||||||||||||||||||||||||||
| Three months ended | Six months ended | ||||||||||||||||||||||||||||||||||||||||||||||
| March 31, 2021 | June 30, 2021 | September 30, 2021 | December 31, 2021 | March 31, 2022 | March 31, 2021 | March 31, 2022 | |||||||||||||||||||||||||||||||||||||||||
Average yield on RJBDP - third-party banks (14) | 0.30 | % | 0.29 | % | 0.29 | % | 0.28 | % | 0.32 | % | 0.31 | % | 0.30 | % | |||||||||||||||||||||||||||||||||
| As of | % change from | ||||||||||||||||||||||||||||||||||||||||||||||
| March 31, 2021 | June 30, 2021 | September 30, 2021 | December 31, 2021 | March 31, 2022 | March 31, 2021 | December 31, 2021 | |||||||||||||||||||||||||||||||||||||||||
| Private Client Group financial advisors: | |||||||||||||||||||||||||||||||||||||||||||||||
| Employees | 3,375 | 3,423 | 3,461 | 3,447 | 3,601 | 7 | % | 4 | % | ||||||||||||||||||||||||||||||||||||||
| Independent contractors | 4,952 | 4,990 | 5,021 | 5,017 | 5,129 | 4 | % | 2 | % | ||||||||||||||||||||||||||||||||||||||
Total advisors (12) | 8,327 | 8,413 | 8,482 | 8,464 | 8,730 | 5 | % | 3 | % | ||||||||||||||||||||||||||||||||||||||
Please refer to the footnotes at the end of this supplement for additional information.
4
RAYMOND JAMES FINANCIAL, INC.
Segment Results - Private Client Group (Unaudited)
| Three months ended | % change from | Six months ended | ||||||||||||||||||||||||||||||||||||||||||||||||||||||||||||
| $ in millions | March 31, 2021 | June 30, 2021 | September 30, 2021 | December 31, 2021 | March 31, 2022 | March 31, 2021 | December 31, 2021 | March 31, 2021 | March 31, 2022 | % change | ||||||||||||||||||||||||||||||||||||||||||||||||||||
| Revenues: | ||||||||||||||||||||||||||||||||||||||||||||||||||||||||||||||
Asset management and related administrative fees | $ | 979 | $ | 1,050 | $ | 1,142 | $ | 1,162 | $ | 1,245 | 27 | % | 7 | % | $ | 1,864 | $ | 2,407 | 29 | % | ||||||||||||||||||||||||||||||||||||||||||
| Brokerage revenues: | ||||||||||||||||||||||||||||||||||||||||||||||||||||||||||||||
| Mutual and other fund products | 183 | 167 | 172 | 171 | 166 | (9) | % | (3) | % | 331 | 337 | 2 | % | |||||||||||||||||||||||||||||||||||||||||||||||||
| Insurance and annuity products | 109 | 113 | 118 | 111 | 110 | 1 | % | (1) | % | 207 | 221 | 7 | % | |||||||||||||||||||||||||||||||||||||||||||||||||
Equities, ETFs, and fixed income products | 121 | 110 | 100 | 115 | 121 | — | % | 5 | % | 228 | 236 | 4 | % | |||||||||||||||||||||||||||||||||||||||||||||||||
| Total brokerage revenues | 413 | 390 | 390 | 397 | 397 | (4) | % | — | % | 766 | 794 | 4 | % | |||||||||||||||||||||||||||||||||||||||||||||||||
| Account and service fees: | ||||||||||||||||||||||||||||||||||||||||||||||||||||||||||||||
Mutual fund and annuity service fees | 99 | 105 | 110 | 114 | 109 | 10 | % | (4) | % | 193 | 223 | 16 | % | |||||||||||||||||||||||||||||||||||||||||||||||||
RJBDP fees: (13) | ||||||||||||||||||||||||||||||||||||||||||||||||||||||||||||||
| Third-party banks | 19 | 18 | 18 | 17 | 20 | 5 | % | 18 | % | 40 | 37 | (8) | % | |||||||||||||||||||||||||||||||||||||||||||||||||
| Raymond James Bank | 44 | 47 | 49 | 50 | 49 | 11 | % | (2) | % | 87 | 99 | 14 | % | |||||||||||||||||||||||||||||||||||||||||||||||||
| Client account and other fees | 42 | 39 | 44 | 49 | 53 | 26 | % | 8 | % | 74 | 102 | 38 | % | |||||||||||||||||||||||||||||||||||||||||||||||||
Total account and service fees | 204 | 209 | 221 | 230 | 231 | 13 | % | — | % | 394 | 461 | 17 | % | |||||||||||||||||||||||||||||||||||||||||||||||||
| Investment banking | 16 | 11 | 14 | 13 | 9 | (44) | % | (31) | % | 22 | 22 | — | % | |||||||||||||||||||||||||||||||||||||||||||||||||
| Interest income | 30 | 31 | 32 | 33 | 37 | 23 | % | 12 | % | 60 | 70 | 17 | % | |||||||||||||||||||||||||||||||||||||||||||||||||
| All other | 8 | 7 | 5 | 7 | 6 | (25) | % | (14) | % | 13 | 13 | — | % | |||||||||||||||||||||||||||||||||||||||||||||||||
| Total revenues | 1,650 | 1,698 | 1,804 | 1,842 | 1,925 | 17 | % | 5 | % | 3,119 | 3,767 | 21 | % | |||||||||||||||||||||||||||||||||||||||||||||||||
| Interest expense | (3) | (2) | (3) | (3) | (3) | — | % | — | % | (5) | (6) | 20 | % | |||||||||||||||||||||||||||||||||||||||||||||||||
| Net revenues | 1,647 | 1,696 | 1,801 | 1,839 | 1,922 | 17 | % | 5 | % | 3,114 | 3,761 | 21 | % | |||||||||||||||||||||||||||||||||||||||||||||||||
| Non-interest expenses: | ||||||||||||||||||||||||||||||||||||||||||||||||||||||||||||||
Financial advisor compensation and benefits | 1,040 | 1,082 | 1,151 | 1,187 | 1,231 | 18 | % | 4 | % | 1,971 | 2,418 | 23 | % | |||||||||||||||||||||||||||||||||||||||||||||||||
Administrative compensation and benefits | 260 | 251 | 255 | 283 | 289 | 11 | % | 2 | % | 509 | 572 | 12 | % | |||||||||||||||||||||||||||||||||||||||||||||||||
Total compensation, commissions and benefits | 1,300 | 1,333 | 1,406 | 1,470 | 1,520 | 17 | % | 3 | % | 2,480 | 2,990 | 21 | % | |||||||||||||||||||||||||||||||||||||||||||||||||
| Non-compensation expenses | 155 | 168 | 173 | 174 | 189 | 22 | % | 9 | % | 302 | 363 | 20 | % | |||||||||||||||||||||||||||||||||||||||||||||||||
Total non-interest expenses | 1,455 | 1,501 | 1,579 | 1,644 | 1,709 | 17 | % | 4 | % | 2,782 | 3,353 | 21 | % | |||||||||||||||||||||||||||||||||||||||||||||||||
| Pre-tax income | $ | 192 | $ | 195 | $ | 222 | $ | 195 | $ | 213 | 11 | % | 9 | % | $ | 332 | $ | 408 | 23 | % | ||||||||||||||||||||||||||||||||||||||||||
Please refer to the footnotes at the end of this supplement for additional information.
5
RAYMOND JAMES FINANCIAL, INC.
Segment Results - Capital Markets (Unaudited)
| Three months ended | % change from | Six months ended | ||||||||||||||||||||||||||||||||||||||||||||||||||||||||||||
| $ in millions | March 31, 2021 | June 30, 2021 | September 30, 2021 | December 31, 2021 | March 31, 2022 | March 31, 2021 | December 31, 2021 | March 31, 2021 | March 31, 2022 | % change | ||||||||||||||||||||||||||||||||||||||||||||||||||||
| Revenues: | ||||||||||||||||||||||||||||||||||||||||||||||||||||||||||||||
| Brokerage revenues: | ||||||||||||||||||||||||||||||||||||||||||||||||||||||||||||||
| Fixed income | $ | 142 | $ | 124 | $ | 118 | $ | 120 | $ | 125 | (12) | % | 4 | % | $ | 273 | $ | 245 | (10) | % | ||||||||||||||||||||||||||||||||||||||||||
| Equity | 34 | 36 | 33 | 39 | 41 | 21 | % | 5 | % | 76 | 80 | 5 | % | |||||||||||||||||||||||||||||||||||||||||||||||||
| Total brokerage revenues | 176 | 160 | 151 | 159 | 166 | (6) | % | 4 | % | 349 | 325 | (7) | % | |||||||||||||||||||||||||||||||||||||||||||||||||
| Investment banking: | ||||||||||||||||||||||||||||||||||||||||||||||||||||||||||||||
| Merger & acquisition and advisory | 122 | 153 | 215 | 271 | 139 | 14 | % | (49) | % | 271 | 410 | 51 | % | |||||||||||||||||||||||||||||||||||||||||||||||||
| Equity underwriting | 67 | 69 | 89 | 97 | 52 | (22) | % | (46) | % | 127 | 149 | 17 | % | |||||||||||||||||||||||||||||||||||||||||||||||||
| Debt underwriting | 37 | 43 | 46 | 44 | 35 | (5) | % | (20) | % | 83 | 79 | (5) | % | |||||||||||||||||||||||||||||||||||||||||||||||||
| Total investment banking | 226 | 265 | 350 | 412 | 226 | — | % | (45) | % | 481 | 638 | 33 | % | |||||||||||||||||||||||||||||||||||||||||||||||||
| Interest income | 5 | 4 | 4 | 5 | 5 | — | % | — | % | 8 | 10 | 25 | % | |||||||||||||||||||||||||||||||||||||||||||||||||
| Tax credit fund revenues | 24 | 17 | 48 | 35 | 15 | (38) | % | (57) | % | 40 | 50 | 25 | % | |||||||||||||||||||||||||||||||||||||||||||||||||
| All other | 4 | 3 | 4 | 5 | 4 | — | % | (20) | % | 11 | 9 | (18) | % | |||||||||||||||||||||||||||||||||||||||||||||||||
| Total revenues | 435 | 449 | 557 | 616 | 416 | (4) | % | (32) | % | 889 | 1,032 | 16 | % | |||||||||||||||||||||||||||||||||||||||||||||||||
| Interest expense | (2) | (3) | (3) | (2) | (3) | 50 | % | 50 | % | (4) | (5) | 25 | % | |||||||||||||||||||||||||||||||||||||||||||||||||
| Net revenues | 433 | 446 | 554 | 614 | 413 | (5) | % | (33) | % | 885 | 1,027 | 16 | % | |||||||||||||||||||||||||||||||||||||||||||||||||
| Non-interest expenses: | ||||||||||||||||||||||||||||||||||||||||||||||||||||||||||||||
Compensation, commissions and benefits | 259 | 256 | 288 | 331 | 253 | (2) | % | (24) | % | 511 | 584 | 14 | % | |||||||||||||||||||||||||||||||||||||||||||||||||
Acquisition-related expenses (3) | — | 3 | 3 | 4 | — | — | % | (100) | % | — | 4 | NM | ||||||||||||||||||||||||||||||||||||||||||||||||||
| Other non-compensation expenses | 69 | 72 | 80 | 78 | 73 | 6 | % | (6) | % | 140 | 151 | 8 | % | |||||||||||||||||||||||||||||||||||||||||||||||||
| Total non-interest expenses | 328 | 331 | 371 | 413 | 326 | (1) | % | (21) | % | 651 | 739 | 14 | % | |||||||||||||||||||||||||||||||||||||||||||||||||
| Pre-tax income | $ | 105 | $ | 115 | $ | 183 | $ | 201 | $ | 87 | (17) | % | (57) | % | $ | 234 | $ | 288 | 23 | % | ||||||||||||||||||||||||||||||||||||||||||
Please refer to the footnotes at the end of this supplement for additional information.
6
RAYMOND JAMES FINANCIAL, INC.
Segment Results - Asset Management (Unaudited)
| Three months ended | % change from | Six months ended | ||||||||||||||||||||||||||||||||||||||||||||||||||||||||||||
| $ in millions | March 31, 2021 | June 30, 2021 | September 30, 2021 | December 31, 2021 | March 31, 2022 | March 31, 2021 | December 31, 2021 | March 31, 2021 | March 31, 2022 | % change | ||||||||||||||||||||||||||||||||||||||||||||||||||||
| Revenues: | ||||||||||||||||||||||||||||||||||||||||||||||||||||||||||||||
Asset management and related administrative fees: | ||||||||||||||||||||||||||||||||||||||||||||||||||||||||||||||
| Managed programs | $ | 137 | $ | 148 | $ | 156 | $ | 151 | $ | 149 | 9 | % | (1) | % | $ | 266 | $ | 300 | 13 | % | ||||||||||||||||||||||||||||||||||||||||||
| Administration and other | 64 | 70 | 74 | 76 | 77 | 20 | % | 1 | % | 123 | 153 | 24 | % | |||||||||||||||||||||||||||||||||||||||||||||||||
Total asset management and related administrative fees | 201 | 218 | 230 | 227 | 226 | 12 | % | — | % | 389 | 453 | 16 | % | |||||||||||||||||||||||||||||||||||||||||||||||||
| Account and service fees | 5 | 4 | 5 | 6 | 6 | 20 | % | — | % | 9 | 12 | 33 | % | |||||||||||||||||||||||||||||||||||||||||||||||||
| All other | 3 | 3 | 3 | 3 | 2 | (33) | % | (33) | % | 6 | 5 | (17) | % | |||||||||||||||||||||||||||||||||||||||||||||||||
| Net revenues | 209 | 225 | 238 | 236 | 234 | 12 | % | (1) | % | 404 | 470 | 16 | % | |||||||||||||||||||||||||||||||||||||||||||||||||
| Non-interest expenses: | ||||||||||||||||||||||||||||||||||||||||||||||||||||||||||||||
Compensation, commissions and benefits | 50 | 43 | 44 | 46 | 47 | (6) | % | 2 | % | 95 | 93 | (2) | % | |||||||||||||||||||||||||||||||||||||||||||||||||
| Non-compensation expenses | 72 | 77 | 80 | 83 | 84 | 17 | % | 1 | % | 139 | 167 | 20 | % | |||||||||||||||||||||||||||||||||||||||||||||||||
| Total non-interest expenses | 122 | 120 | 124 | 129 | 131 | 7 | % | 2 | % | 234 | 260 | 11 | % | |||||||||||||||||||||||||||||||||||||||||||||||||
| Pre-tax income | $ | 87 | $ | 105 | $ | 114 | $ | 107 | $ | 103 | 18 | % | (4) | % | $ | 170 | $ | 210 | 24 | % | ||||||||||||||||||||||||||||||||||||||||||
Please refer to the footnotes at the end of this supplement for additional information.
7
RAYMOND JAMES FINANCIAL, INC.
Segment Results - Raymond James Bank (Unaudited)
| Three months ended | % change from | Six months ended | ||||||||||||||||||||||||||||||||||||||||||||||||||||||||||||
| $ in millions | March 31, 2021 | June 30, 2021 | September 30, 2021 | December 31, 2021 | March 31, 2022 | March 31, 2021 | December 31, 2021 | March 31, 2021 | March 31, 2022 | % change | ||||||||||||||||||||||||||||||||||||||||||||||||||||
| Revenues: | ||||||||||||||||||||||||||||||||||||||||||||||||||||||||||||||
| Interest income | $ | 165 | $ | 172 | $ | 179 | $ | 187 | $ | 199 | 21 | % | 6 | % | $ | 333 | $ | 386 | 16 | % | ||||||||||||||||||||||||||||||||||||||||||
| Interest expense | (10) | (11) | (10) | (10) | (10) | — | % | — | % | (21) | (20) | (5) | % | |||||||||||||||||||||||||||||||||||||||||||||||||
| Net interest income | 155 | 161 | 169 | 177 | 189 | 22 | % | 7 | % | 312 | 366 | 17 | % | |||||||||||||||||||||||||||||||||||||||||||||||||
| All other | 5 | 8 | 7 | 6 | 8 | 60 | % | 33 | % | 15 | 14 | (7) | % | |||||||||||||||||||||||||||||||||||||||||||||||||
| Net revenues | 160 | 169 | 176 | 183 | 197 | 23 | % | 8 | % | 327 | 380 | 16 | % | |||||||||||||||||||||||||||||||||||||||||||||||||
| Non-interest expenses: | ||||||||||||||||||||||||||||||||||||||||||||||||||||||||||||||
| Compensation and benefits | 13 | 13 | 13 | 13 | 14 | 8 | % | 8 | % | 25 | 27 | 8 | % | |||||||||||||||||||||||||||||||||||||||||||||||||
| Non-compensation expenses: | ||||||||||||||||||||||||||||||||||||||||||||||||||||||||||||||
| Bank loan provision/(benefit) for credit losses | (32) | (19) | 5 | (11) | 21 | NM | NM | (18) | 10 | NM | ||||||||||||||||||||||||||||||||||||||||||||||||||||
RJBDP fees to Private Client Group (13) | 44 | 47 | 49 | 50 | 49 | 11 | % | (2) | % | 87 | 99 | 14 | % | |||||||||||||||||||||||||||||||||||||||||||||||||
| All other | 24 | 24 | 28 | 29 | 30 | 25 | % | 3 | % | 51 | 59 | 16 | % | |||||||||||||||||||||||||||||||||||||||||||||||||
| Total non-compensation expenses | 36 | 52 | 82 | 68 | 100 | 178 | % | 47 | % | 120 | 168 | 40 | % | |||||||||||||||||||||||||||||||||||||||||||||||||
| Total non-interest expenses | 49 | 65 | 95 | 81 | 114 | 133 | % | 41 | % | 145 | 195 | 34 | % | |||||||||||||||||||||||||||||||||||||||||||||||||
| Pre-tax income | $ | 111 | $ | 104 | $ | 81 | $ | 102 | $ | 83 | (25) | % | (19) | % | $ | 182 | $ | 185 | 2 | % | ||||||||||||||||||||||||||||||||||||||||||
Please refer to the footnotes at the end of this supplement for additional information.
8
RAYMOND JAMES FINANCIAL, INC.
Segment Results - Other (15) (Unaudited)
| Three months ended | % change from | Six months ended | ||||||||||||||||||||||||||||||||||||||||||||||||||||||||||||
| $ in millions | March 31, 2021 | June 30, 2021 | September 30, 2021 | December 31, 2021 | March 31, 2022 | March 31, 2021 | December 31, 2021 | March 31, 2021 | March 31, 2022 | % change | ||||||||||||||||||||||||||||||||||||||||||||||||||||
| Revenues: | ||||||||||||||||||||||||||||||||||||||||||||||||||||||||||||||
| Interest income | $ | 3 | $ | — | $ | 2 | $ | 1 | $ | 3 | — | % | 200 | % | $ | 6 | $ | 4 | (33) | % | ||||||||||||||||||||||||||||||||||||||||||
Net gains/(losses) on private equity investments (1) | 8 | 24 | 18 | 5 | (2) | NM | NM | 32 | 3 | (91) | % | |||||||||||||||||||||||||||||||||||||||||||||||||||
| All other | 2 | 4 | (1) | 2 | 5 | 150 | % | 150 | % | 3 | 7 | 133 | % | |||||||||||||||||||||||||||||||||||||||||||||||||
| Total revenues | 13 | 28 | 19 | 8 | 6 | (54) | % | (25) | % | 41 | 14 | (66) | % | |||||||||||||||||||||||||||||||||||||||||||||||||
| Interest expense | (25) | (26) | (21) | (23) | (24) | (4) | % | 4 | % | (49) | (47) | (4) | % | |||||||||||||||||||||||||||||||||||||||||||||||||
| Net revenues | (12) | 2 | (2) | (15) | (18) | (50) | % | (20) | % | (8) | (33) | (313) | % | |||||||||||||||||||||||||||||||||||||||||||||||||
| Non-interest expenses: | ||||||||||||||||||||||||||||||||||||||||||||||||||||||||||||||
Compensation and all other (1) | 36 | 34 | 31 | 30 | 24 | (33) | % | (20) | % | 62 | 54 | (13) | % | |||||||||||||||||||||||||||||||||||||||||||||||||
Losses on extinguishment of debt (2) | — | 98 | — | — | — | — | % | — | % | — | — | — | % | |||||||||||||||||||||||||||||||||||||||||||||||||
Acquisition-related expenses (3) | — | 4 | 7 | 2 | 11 | NM | 450 | % | 2 | 13 | 550 | % | ||||||||||||||||||||||||||||||||||||||||||||||||||
| Total non-interest expenses | 36 | 136 | 38 | 32 | 35 | (3) | % | 9 | % | 64 | 67 | 5 | % | |||||||||||||||||||||||||||||||||||||||||||||||||
| Pre-tax loss | $ | (48) | $ | (134) | $ | (40) | $ | (47) | $ | (53) | (10) | % | (13) | % | $ | (72) | $ | (100) | (39) | % | ||||||||||||||||||||||||||||||||||||||||||
Please refer to the footnotes at the end of this supplement for additional information.
9
RAYMOND JAMES FINANCIAL, INC.
Raymond James Bank Selected Key Metrics (Unaudited)
The following metrics are attributable to our Raymond James Bank banking subsidiary, which is a component of our Raymond James Bank segment.
| As of | % change from | |||||||||||||||||||||||||||||||||||||||||||
| $ in millions | March 31, 2021 | June 30, 2021 | September 30, 2021 | December 31, 2021 | March 31, 2022 | March 31, 2021 | December 31, 2021 | |||||||||||||||||||||||||||||||||||||
| Total assets | $ | 33,221 | $ | 34,576 | $ | 36,481 | $ | 38,107 | $ | 38,579 | 16 | % | 1 | % | ||||||||||||||||||||||||||||||
| Total equity | $ | 2,409 | $ | 2,532 | $ | 2,594 | $ | 2,597 | $ | 2,383 | (1) | % | (8) | % | ||||||||||||||||||||||||||||||
| Bank loans, net | $ | 22,879 | $ | 23,896 | $ | 24,994 | $ | 26,132 | $ | 27,883 | 22 | % | 7 | % | ||||||||||||||||||||||||||||||
| Bank loan allowance for credit losses | $ | 345 | $ | 322 | $ | 320 | $ | 308 | $ | 328 | (5) | % | 6 | % | ||||||||||||||||||||||||||||||
| Bank loan allowance for credit losses as a % of loans held for investment | 1.50 | % | 1.34 | % | 1.27 | % | 1.18 | % | 1.17 | % | ||||||||||||||||||||||||||||||||||
| Total nonperforming assets | $ | 31 | $ | 43 | $ | 74 | $ | 74 | $ | 104 | 235 | % | 41 | % | ||||||||||||||||||||||||||||||
| Nonperforming assets as a % of total assets | 0.09 | % | 0.12 | % | 0.20 | % | 0.19 | % | 0.27 | % | ||||||||||||||||||||||||||||||||||
| Total criticized loans | $ | 1,001 | $ | 980 | $ | 824 | $ | 735 | $ | 735 | (27) | % | — | % | ||||||||||||||||||||||||||||||
| Criticized loans as a % of loans held for investment | 4.35 | % | 4.07 | % | 3.27 | % | 2.75 | % | 2.63 | % | ||||||||||||||||||||||||||||||||||
Capital ratios: | ||||||||||||||||||||||||||||||||||||||||||||
| Tier 1 capital | 13.1 | % | 13.5 | % | 13.4 | % | 13.3 | % | 12.6 | % | (8) | |||||||||||||||||||||||||||||||||
| Total capital | 14.4 | % | 14.7 | % | 14.6 | % | 14.6 | % | 13.9 | % | (8) | |||||||||||||||||||||||||||||||||
| Tier 1 leverage | 7.5 | % | 7.5 | % | 7.4 | % | 7.2 | % | 7.2 | % | (8) | |||||||||||||||||||||||||||||||||
| As of | % change from | |||||||||||||||||||||||||||||||||||||||||||
| $ in millions | March 31, 2021 | June 30, 2021 | September 30, 2021 | December 31, 2021 | March 31, 2022 | March 31, 2021 | December 31, 2021 | |||||||||||||||||||||||||||||||||||||
| Commercial and industrial loans | $ | 7,816 | $ | 8,011 | $ | 8,440 | $ | 8,608 | $ | 9,067 | 16 | % | 5 | % | ||||||||||||||||||||||||||||||
| Commercial real estate loans | 2,710 | 2,728 | 2,872 | 2,992 | 3,321 | 23 | % | 11 | % | |||||||||||||||||||||||||||||||||||
Real estate investment trust loans | 1,380 | 1,270 | 1,112 | 1,189 | 1,408 | 2 | % | 18 | % | |||||||||||||||||||||||||||||||||||
| Tax-exempt loans | 1,223 | 1,320 | 1,321 | 1,290 | 1,287 | 5 | % | — | % | |||||||||||||||||||||||||||||||||||
| Residential mortgage loans | 5,001 | 5,170 | 5,318 | 5,568 | 5,945 | 19 | % | 7 | % | |||||||||||||||||||||||||||||||||||
| Securities-based loans and other | 4,891 | 5,582 | 6,106 | 6,563 | 6,904 | 41 | % | 5 | % | |||||||||||||||||||||||||||||||||||
| Total loans held for investment | 23,021 | 24,081 | 25,169 | 26,210 | 27,932 | 21 | % | 7 | % | |||||||||||||||||||||||||||||||||||
| Held for sale loans | 203 | 137 | 145 | 230 | 279 | 37 | % | 21 | % | |||||||||||||||||||||||||||||||||||
| Total loans held for sale and investment | 23,224 | 24,218 | 25,314 | 26,440 | 28,211 | 21 | % | 7 | % | |||||||||||||||||||||||||||||||||||
| Allowance for credit losses | (345) | (322) | (320) | (308) | (328) | (5) | % | 6 | % | |||||||||||||||||||||||||||||||||||
| Bank loans, net | $ | 22,879 | $ | 23,896 | $ | 24,994 | $ | 26,132 | $ | 27,883 | 22 | % | 7 | % | ||||||||||||||||||||||||||||||
| Three months ended | % change from | Six months ended | ||||||||||||||||||||||||||||||||||||||||||||||||||||||||||||
| $ in millions | March 31, 2021 | June 30, 2021 | September 30, 2021 | December 31, 2021 | March 31, 2022 | March 31, 2021 | December 31, 2021 | March 31, 2021 | March 31, 2022 | % change | ||||||||||||||||||||||||||||||||||||||||||||||||||||
| Bank loan provision/(benefit) for credit losses | $ | (32) | $ | (19) | $ | 5 | $ | (11) | $ | 21 | NM | NM | $ | (18) | $ | 10 | NM | |||||||||||||||||||||||||||||||||||||||||||||
| Net charge-offs | $ | 2 | $ | 4 | $ | 7 | $ | 1 | $ | 1 | (50) | % | — | % | $ | 2 | $ | 2 | — | % | ||||||||||||||||||||||||||||||||||||||||||
Net interest margin (net yield on interest-earning assets) | 1.94 | % | 1.92 | % | 1.92 | % | 1.92 | % | 2.01 | % | 1.98 | % | 1.97 | % | ||||||||||||||||||||||||||||||||||||||||||||||||
Please refer to the footnotes at the end of this supplement for additional information.
10
RAYMOND JAMES FINANCIAL, INC.
Reconciliation of non-GAAP financial measures to GAAP financial measures (Unaudited)
We utilize certain non-GAAP financial measures as additional measures to aid in, and enhance, the understanding of our financial results and related measures. These non-GAAP financial measures have been separately identified in this document. We believe certain of these non-GAAP financial measures provides useful information to management and investors by excluding certain material items that may not be indicative of our core operating results. We utilize these non-GAAP financial measures in assessing the financial performance of the business, as they facilitate a comparison of current- and prior-period results. We believe that return on tangible common equity and tangible book value per share are meaningful to investors as they facilitate comparisons of our results to the results of other companies. In the following tables, the tax effect of non-GAAP adjustments reflects the statutory rate associated with each non-GAAP item. These non-GAAP financial measures should be considered in addition to, and not as a substitute for, measures of financial performance prepared in accordance with GAAP. In addition, our non-GAAP financial measures may not be comparable to similarly titled non-GAAP financial measures of other companies. The following tables provide a reconciliation of non-GAAP financial measures to the most directly comparable GAAP measures for those periods which include non-GAAP adjustments.
| Three months ended | Six months ended | |||||||||||||||||||||||||||||||||||||
| $ in millions | June 30, 2021 | September 30, 2021 | December 31, 2021 | March 31, 2022 | March 31, 2021 | March 31, 2022 | ||||||||||||||||||||||||||||||||
Net income | $ | 307 | $ | 429 | $ | 446 | $ | 323 | $ | 667 | $ | 769 | ||||||||||||||||||||||||||
Non-GAAP adjustments: | ||||||||||||||||||||||||||||||||||||||
Losses on extinguishment of debt (2) | 98 | — | — | — | — | — | ||||||||||||||||||||||||||||||||
Acquisition-related expenses (3) | 7 | 10 | 6 | 11 | 2 | 17 | ||||||||||||||||||||||||||||||||
| Pre-tax impact of non-GAAP adjustments | 105 | 10 | 6 | 11 | 2 | 17 | ||||||||||||||||||||||||||||||||
Tax effect of non-GAAP adjustments | (26) | (2) | (1) | (3) | — | (4) | ||||||||||||||||||||||||||||||||
Total non-GAAP adjustments, net of tax | 79 | 8 | 5 | 8 | 2 | 13 | ||||||||||||||||||||||||||||||||
Adjusted net income | $ | 386 | $ | 437 | $ | 451 | $ | 331 | $ | 669 | $ | 782 | ||||||||||||||||||||||||||
Pre-tax income | $ | 385 | $ | 560 | $ | 558 | $ | 433 | $ | 846 | $ | 991 | ||||||||||||||||||||||||||
Pre-tax impact of non-GAAP adjustments (as detailed above) | 105 | 10 | 6 | 11 | 2 | 17 | ||||||||||||||||||||||||||||||||
Adjusted pre-tax income | $ | 490 | $ | 570 | $ | 564 | $ | 444 | $ | 848 | $ | 1,008 | ||||||||||||||||||||||||||
Pre-tax margin (10) | 15.6 | % | 20.8 | % | 20.1 | % | 16.2 | % | 18.4 | % | 18.2 | % | ||||||||||||||||||||||||||
Non-GAAP adjustments: | ||||||||||||||||||||||||||||||||||||||
Losses on extinguishment of debt (2) | 3.9 | % | — | % | — | % | — | % | — | % | — | % | ||||||||||||||||||||||||||
Acquisition-related expenses (3) | 0.3 | % | 0.4 | % | 0.2 | % | 0.4 | % | 0.1 | % | 0.3 | % | ||||||||||||||||||||||||||
Total non-GAAP adjustments, net of tax | 4.2 | % | 0.4 | 0.2 | % | 0.4 | % | 0.1 | % | 0.3 | % | |||||||||||||||||||||||||||
Adjusted pre-tax margin (10) | 19.8 | % | 21.2 | % | 20.3 | % | 16.6 | % | 18.5 | % | 18.5 | % | ||||||||||||||||||||||||||
Please refer to the footnotes at the end of this supplement for additional information.
11
RAYMOND JAMES FINANCIAL, INC.
Reconciliation of non-GAAP financial measures to GAAP financial measures (Unaudited)
(Continued from previous page)
| Three months ended | Six months ended | |||||||||||||||||||||||||||||||||||||
Earnings per common share (4) (5) | June 30, 2021 | September 30, 2021 | December 31, 2021 | March 31, 2022 | March 31, 2021 | March 31, 2022 | ||||||||||||||||||||||||||||||||
| Basic | $ | 1.49 | $ | 2.08 | $ | 2.16 | $ | 1.56 | $ | 3.23 | $ | 3.71 | ||||||||||||||||||||||||||
Non-GAAP adjustments: | ||||||||||||||||||||||||||||||||||||||
Losses on extinguishment of debt (2) | 0.48 | — | — | — | — | — | ||||||||||||||||||||||||||||||||
Acquisition-related expenses (3) | 0.03 | 0.05 | 0.03 | 0.05 | 0.01 | 0.08 | ||||||||||||||||||||||||||||||||
| Tax effect of non-GAAP adjustments | (0.12) | (0.01) | (0.01) | (0.02) | — | (0.02) | ||||||||||||||||||||||||||||||||
| Total non-GAAP adjustments, net of tax | 0.39 | 0.04 | 0.02 | 0.03 | 0.01 | 0.06 | ||||||||||||||||||||||||||||||||
| Adjusted basic | $ | 1.88 | $ | 2.12 | $ | 2.18 | $ | 1.59 | $ | 3.24 | $ | 3.77 | ||||||||||||||||||||||||||
| Diluted | $ | 1.45 | $ | 2.02 | $ | 2.10 | $ | 1.52 | $ | 3.16 | $ | 3.61 | ||||||||||||||||||||||||||
Non-GAAP adjustments: | ||||||||||||||||||||||||||||||||||||||
Losses on extinguishment of debt (2) | 0.46 | — | — | — | — | — | ||||||||||||||||||||||||||||||||
Acquisition-related expenses (3) | 0.03 | 0.05 | 0.03 | 0.05 | 0.01 | 0.08 | ||||||||||||||||||||||||||||||||
| Tax effect of non-GAAP adjustments | (0.12) | (0.01) | (0.01) | (0.02) | — | (0.02) | ||||||||||||||||||||||||||||||||
| Total non-GAAP adjustments, net of tax | 0.37 | 0.04 | 0.02 | 0.03 | 0.01 | 0.06 | ||||||||||||||||||||||||||||||||
| Adjusted diluted | $ | 1.82 | $ | 2.06 | $ | 2.12 | $ | 1.55 | $ | 3.17 | $ | 3.67 | ||||||||||||||||||||||||||
| Book value per share | As of | |||||||||||||||||||||||||||||||
| $ in millions, except per share amounts | March 31, 2021 | June 30, 2021 | September 30, 2021 | December 31, 2021 | March 31, 2022 | |||||||||||||||||||||||||||
Total equity attributable to Raymond James Financial, Inc. | $ | 7,592 | $ | 7,863 | $ | 8,245 | $ | 8,600 | $ | 8,602 | ||||||||||||||||||||||
Less non-GAAP adjustments: | ||||||||||||||||||||||||||||||||
Goodwill and identifiable intangible assets, net | 868 | 862 | 882 | 874 | 1,110 | |||||||||||||||||||||||||||
| Deferred tax liabilities, net | (56) | (56) | (64) | (65) | (88) | |||||||||||||||||||||||||||
| Tangible common equity attributable to Raymond James Financial, Inc. | $ | 6,780 | $ | 7,057 | $ | 7,427 | $ | 7,791 | $ | 7,580 | ||||||||||||||||||||||
Common shares outstanding (5) | 205.8 | 205.4 | 205.7 | 207.5 | 207.9 | |||||||||||||||||||||||||||
Book value per share (5) (6) | $ | 36.89 | $ | 38.28 | $ | 40.08 | $ | 41.45 | $ | 41.38 | ||||||||||||||||||||||
Tangible book value per share (5) (6) (7) | $ | 32.94 | $ | 34.36 | $ | 36.11 | $ | 37.55 | $ | 36.46 | ||||||||||||||||||||||
Please refer to the footnotes at the end of this supplement for additional information.
12
RAYMOND JAMES FINANCIAL, INC.
Reconciliation of non-GAAP financial measures to GAAP financial measures (Unaudited)
(Continued from previous page)
| Return on equity | Three months ended | Six months ended | |||||||||||||||||||||||||||||||||||||||||||||
| $ in millions | March 31, 2021 | June 30, 2021 | September 30, 2021 | December 31, 2021 | March 31, 2022 | March 31, 2021 | March 31, 2022 | ||||||||||||||||||||||||||||||||||||||||
Average equity (16) | $ | 7,478 | $ | 7,728 | $ | 8,054 | $ | 8,423 | $ | 8,601 | $ | 7,356 | $ | 8,482 | |||||||||||||||||||||||||||||||||
Impact on average equity of non-GAAP adjustments: | |||||||||||||||||||||||||||||||||||||||||||||||
Losses on extinguishment of debt (2) | NA | 49 | — | — | — | — | — | ||||||||||||||||||||||||||||||||||||||||
Acquisition-related expenses (3) | NA | 4 | 5 | 3 | 6 | 1 | 8 | ||||||||||||||||||||||||||||||||||||||||
| Tax effect of non-GAAP adjustments | NA | (13) | (1) | (1) | (2) | — | (2) | ||||||||||||||||||||||||||||||||||||||||
Adjusted average equity (16) | NA | $ | 7,768 | $ | 8,058 | $ | 8,425 | $ | 8,605 | $ | 7,357 | $ | 8,488 | ||||||||||||||||||||||||||||||||||
Average equity (16) | $ | 7,478 | $ | 7,728 | $ | 8,054 | $ | 8,423 | $ | 8,601 | $ | 7,356 | $ | 8,482 | |||||||||||||||||||||||||||||||||
| Less: | |||||||||||||||||||||||||||||||||||||||||||||||
| Average goodwill and identifiable intangible assets, net | 851 | 865 | 872 | 878 | 992 | 767 | 955 | ||||||||||||||||||||||||||||||||||||||||
| Average deferred tax liabilities, net | (56) | (56) | (60) | (64) | (77) | (49) | (72) | ||||||||||||||||||||||||||||||||||||||||
Average tangible common equity (16) | $ | 6,683 | $ | 6,919 | $ | 7,242 | $ | 7,609 | $ | 7,686 | $ | 6,638 | $ | 7,599 | |||||||||||||||||||||||||||||||||
Impact on average equity of non-GAAP adjustments: | |||||||||||||||||||||||||||||||||||||||||||||||
Losses on extinguishment of debt (2) | NA | 49 | — | — | — | — | — | ||||||||||||||||||||||||||||||||||||||||
Acquisition-related expenses (3) | NA | 4 | 5 | 3 | 6 | 1 | 8 | ||||||||||||||||||||||||||||||||||||||||
| Tax effect of non-GAAP adjustments | NA | (13) | (1) | (1) | (2) | — | (2) | ||||||||||||||||||||||||||||||||||||||||
Adjusted average tangible common equity (16) | NA | $ | 6,959 | $ | 7,246 | $ | 7,611 | $ | 7,690 | $ | 6,639 | $ | 7,605 | ||||||||||||||||||||||||||||||||||
Return on equity (9) | 19.0 | % | 15.9 | % | 21.3 | % | 21.2 | % | 15.0 | % | 18.1 | % | 18.1 | % | |||||||||||||||||||||||||||||||||
Adjusted return on equity (9) | NA | 19.9 | % | 21.7 | % | 21.4 | % | 15.4 | % | 18.2 | % | 18.4 | % | ||||||||||||||||||||||||||||||||||
Return on tangible common equity (9) | 21.2 | % | 17.7 | % | 23.7 | % | 23.4 | % | 16.8 | % | 20.1 | % | 20.2 | % | |||||||||||||||||||||||||||||||||
Adjusted return on tangible common equity (9) | NA | 22.2 | % | 24.1 | % | 23.7 | % | 17.2 | % | 20.2 | % | 20.6 | % | ||||||||||||||||||||||||||||||||||
Please refer to the footnotes at the end of this supplement for additional information.
13
RAYMOND JAMES FINANCIAL, INC.
Footnotes
| (1) | Other revenues included $24 million, $18 million, and $32 million of private equity gains for the three months ended June 30, 2021, three months ended September 30, 2021, and six months ended March 31, 2021, respectively, which were included in our Other segment. Of these amounts $10 million, $5 million, and $10 million of the gains for the three months ended June 30, 2021, three months ended September 30, 2021, and six months ended March 31, 2021, respectively, were attributable to noncontrolling interests and were offset in Other expenses. Net gains/(losses) on private equity investments for all other periods presented were insignificant. | |||||||
| (2) | Losses on extinguishment of debt include make-whole premiums, the accelerated amortization of debt issuance costs, and certain legal and other professional fees associated with the redemptions of our $250 million of 5.625% senior notes due 2024 and our $500 million of 3.625% senior notes due 2026 which occurred during our fiscal third quarter of 2021. | |||||||
| (3) | Acquisition-related expenses in our Other segment included professional expenses and other costs incurred to effect our acquisition of Charles Stanley Group PLC ("Charles Stanley"), which was completed in January 2022, our announced acquisitions of TriState Capital Holdings, Inc. and SumRidge Partners, LLC., and our acquisitions completed in fiscal 2021. Acquisition-related expenses in our Capital Markets segment included amortization expense related to intangible assets with short useful lives associated with certain of our acquisitions completed in fiscal 2021. | |||||||
| (4) | Earnings per common share is computed by dividing net income (less allocation of earnings and dividends to participating securities) by weighted-average common shares outstanding (basic or diluted as applicable) for each respective period or, in the case of adjusted earnings per common share, computed by dividing adjusted net income (less allocation of earnings and dividends to participating securities) by weighted-average common shares outstanding (basic or diluted as applicable) for each respective period. | |||||||
| (5) | During our fiscal fourth quarter of 2021 the Board of Directors approved a 3-for-2 stock split, effected in the form of a 50% stock dividend, paid on September 21, 2021. All share and per share information has been retroactively adjusted to reflect this stock split. | |||||||
| (6) | Book value per share is computed by dividing total equity attributable to Raymond James Financial, Inc. by the number of common shares outstanding at the end of each respective period or, in the case of tangible book value per share, computed by dividing tangible common equity by the number of common shares outstanding at the end of each respective period. Tangible common equity is defined as total equity attributable to Raymond James Financial, Inc. less goodwill and intangible assets, net of related deferred taxes. | |||||||
| (7) | These are non-GAAP financial measures. See the schedules on the previous pages for a reconciliation of non-GAAP financial measures to the most directly comparable GAAP measures and for more information on these measures. There were no non-GAAP adjustments to earnings for the three months ended March 31, 2021. | |||||||
| (8) | Estimated. | |||||||
| (9) | Return on equity is computed by dividing annualized net income by average equity for each respective period or, in the case of return on tangible common equity, computed by dividing annualized net income by average tangible common equity for each respective period. Adjusted return on equity is computed by dividing annualized adjusted net income by adjusted average equity for each respective period, or in the case of adjusted return on tangible common equity, computed by dividing annualized adjusted net income by adjusted average tangible common equity for each respective period. | |||||||
| (10) | Pre-tax margin is computed by dividing pre-tax income by net revenues for each respective period or, in the case of adjusted pre-tax margin, computed by dividing adjusted pre-tax income by net revenues for each respective period. | |||||||
| (11) | Total compensation ratio is computed by dividing compensation, commissions and benefits expense by net revenues for each respective period. | |||||||
| (12) | These metrics include the impact of the acquisition of Charles Stanley, which closed on January 21, 2022. As of March 31, 2022, the impact on client assets under administration and Private Client Group assets under administration was $33 billion, the impact on Private Client Group assets in fee-based accounts was $21 billion, and the impact on financial advisors was the addition of 200 advisors. | |||||||
| (13) | We earn fees from RJBDP, a multi-bank sweep program in which clients’ cash deposits in their brokerage accounts are swept into interest-bearing deposit accounts at Raymond James Bank and various third-party banks. Fees earned by the Private Client Group on Raymond James Bank deposits are eliminated in consolidation. | |||||||
| (14) | Average yield on RJBDP - third-party banks is computed by dividing annualized RJBDP fees - third-party banks, which are net of the interest expense paid to clients by the third-party banks, by the average daily RJBDP balances at third-party banks. | |||||||
| (15) | The Other segment includes the results of our private equity investments, interest income on certain corporate cash balances, certain acquisition-related expenses, and certain corporate overhead costs of RJF, including the interest costs on our public debt and any losses on extinguishment of such debt. | |||||||
| (16) | Average equity is computed by adding the total equity attributable to Raymond James Financial, Inc. as of the date indicated to the prior quarter-end total, and dividing by two, or in the case of average tangible common equity, computed by adding tangible common equity as of the date indicated to the prior quarter-end total, and dividing by two. For the year-to-date period, average equity is computed by adding the total equity attributable to Raymond James Financial, Inc. as of each quarter-end date during the indicated period to the beginning of year total, and dividing by three, or in the case of average tangible common equity, computed by adding tangible common equity as of each quarter-end date during the indicated period to the beginning of year total, and dividing by three. Adjusted average equity is computed by adjusting for the impact on average equity of the non-GAAP adjustments, as applicable for each respective period. Adjusted average tangible common equity is computed by adjusting for the impact on average tangible common equity of the non-GAAP adjustments, as applicable for each respective period. | |||||||
14

Fiscal 2Q22 Results April 27, 2022
Forward-looking statements Certain statements made in this presentation and the associated conference call may constitute “forward-looking statements” under the Private Securities Litigation Reform Act of 1995. Forward-looking statements include information concerning future strategic objectives, business prospects, anticipated savings, financial results (including expenses, earnings, liquidity, cash flow and capital expenditures), industry or market conditions, demand for and pricing of our products, acquisitions (including our announced acquisitions of TriState Capital Holdings, Inc. and SumRidge Partners, LLC), divestitures, anticipated results of litigation, regulatory developments, and general economic conditions. In addition, words such as “believes,” “expects,” “anticipates,” “intends,” “plans,” “estimates,” “projects,” “forecasts,” and future or conditional verbs such as “will,” “may,” “could,” “should,” and “would,” as well as any other statement that necessarily depends on future events, is intended to identify forward-looking statements. Forward-looking statements are not guarantees, and they involve risks, uncertainties and assumptions. Although we make such statements based on assumptions that we believe to be reasonable, there can be no assurance that actual results will not differ materially from those expressed in the forward-looking statements. We caution investors not to rely unduly on any forward-looking statements and urge you to carefully consider the risks described in our filings with the Securities and Exchange Commission (the “SEC”) from time to time, including our most recent Annual Report on Form 10-K, and subsequent Quarterly Reports on Form 10-Q and Current Reports on Form 8-K, which are available at www.raymondjames.com and the SEC’s website at www.sec.gov. We expressly disclaim any obligation to update any forward-looking statement in the event it later turns out to be inaccurate, whether as a result of new information, future events, or otherwise. 2
Overview of Results Paul Reilly Chair & CEO, Raymond James Financial 3
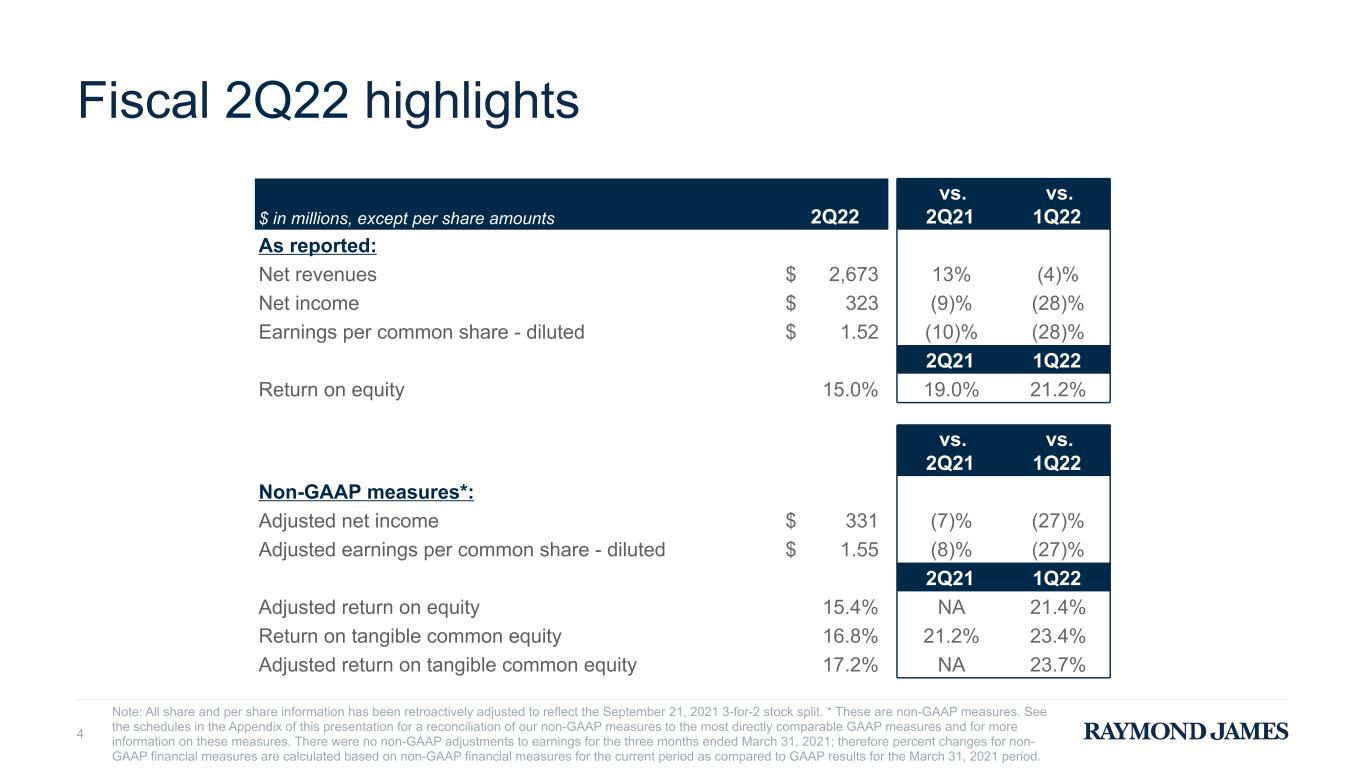
Fiscal 2Q22 highlights 4 Note: All share and per share information has been retroactively adjusted to reflect the September 21, 2021 3-for-2 stock split. * These are non-GAAP measures. See the schedules in the Appendix of this presentation for a reconciliation of our non-GAAP measures to the most directly comparable GAAP measures and for more information on these measures. There were no non-GAAP adjustments to earnings for the three months ended March 31, 2021; therefore percent changes for non- GAAP financial measures are calculated based on non-GAAP financial measures for the current period as compared to GAAP results for the March 31, 2021 period. $ in millions, except per share amounts 2Q22 vs. 2Q21 vs. 1Q22 As reported: Net revenues $ 2,673 13% (4)% Net income $ 323 (9)% (28)% Earnings per common share - diluted $ 1.52 (10)% (28)% 2Q21 1Q22 Return on equity 15.0 % 19.0% 21.2% vs. 2Q21 vs. 1Q22 Non-GAAP measures*: Adjusted net income $ 331 (7)% (27)% Adjusted earnings per common share - diluted $ 1.55 (8)% (27)% 2Q21 1Q22 Adjusted return on equity 15.4 % NA 21.4% Return on tangible common equity 16.8 % 21.2% 23.4% Adjusted return on tangible common equity 17.2 % NA 23.7%
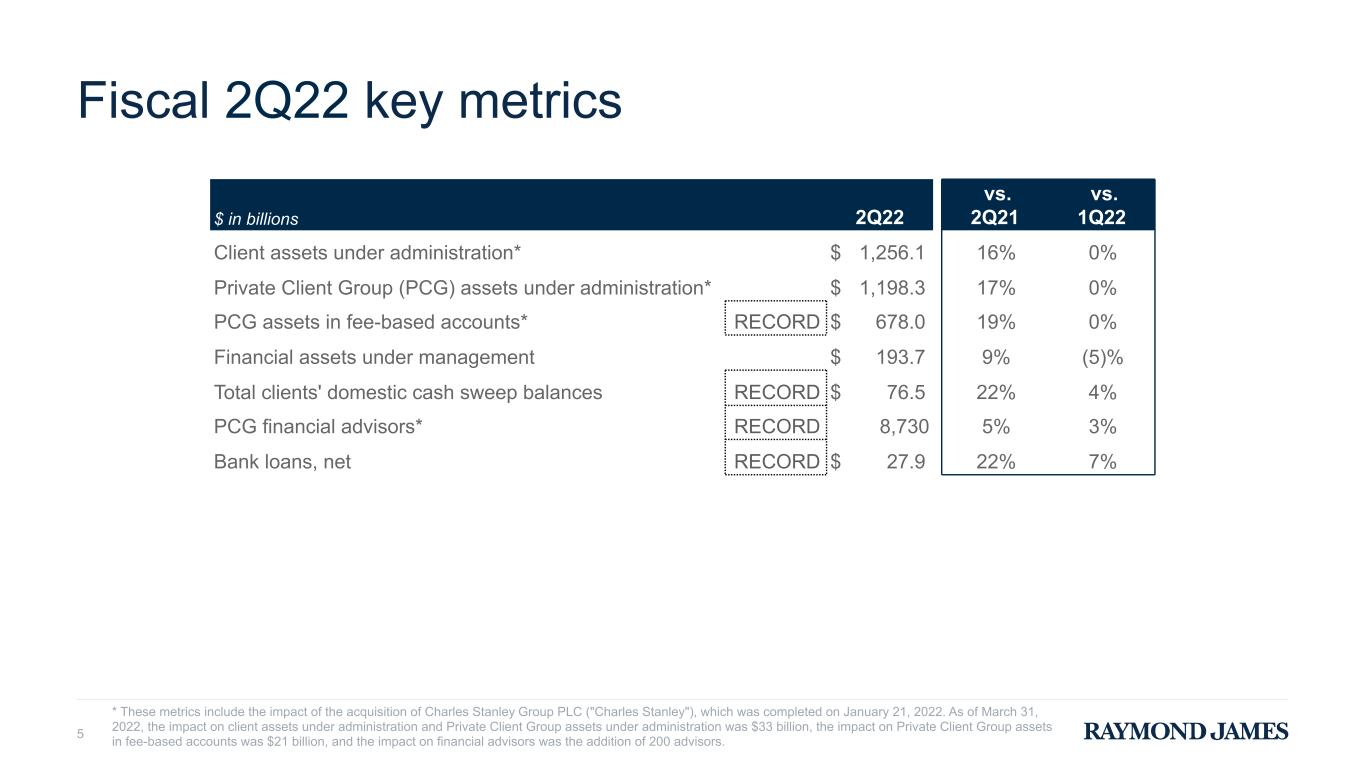
Fiscal 2Q22 key metrics 5 $ in billions 2Q22 vs. 2Q21 vs. 1Q22 Client assets under administration* $ 1,256.1 16% 0% Private Client Group (PCG) assets under administration* $ 1,198.3 17% 0% PCG assets in fee-based accounts* RECORD $ 678.0 19% 0% Financial assets under management $ 193.7 9% (5)% Total clients' domestic cash sweep balances RECORD $ 76.5 22% 4% PCG financial advisors* RECORD 8,730 5% 3% Bank loans, net RECORD $ 27.9 22% 7% * These metrics include the impact of the acquisition of Charles Stanley Group PLC ("Charles Stanley"), which was completed on January 21, 2022. As of March 31, 2022, the impact on client assets under administration and Private Client Group assets under administration was $33 billion, the impact on Private Client Group assets in fee-based accounts was $21 billion, and the impact on financial advisors was the addition of 200 advisors.
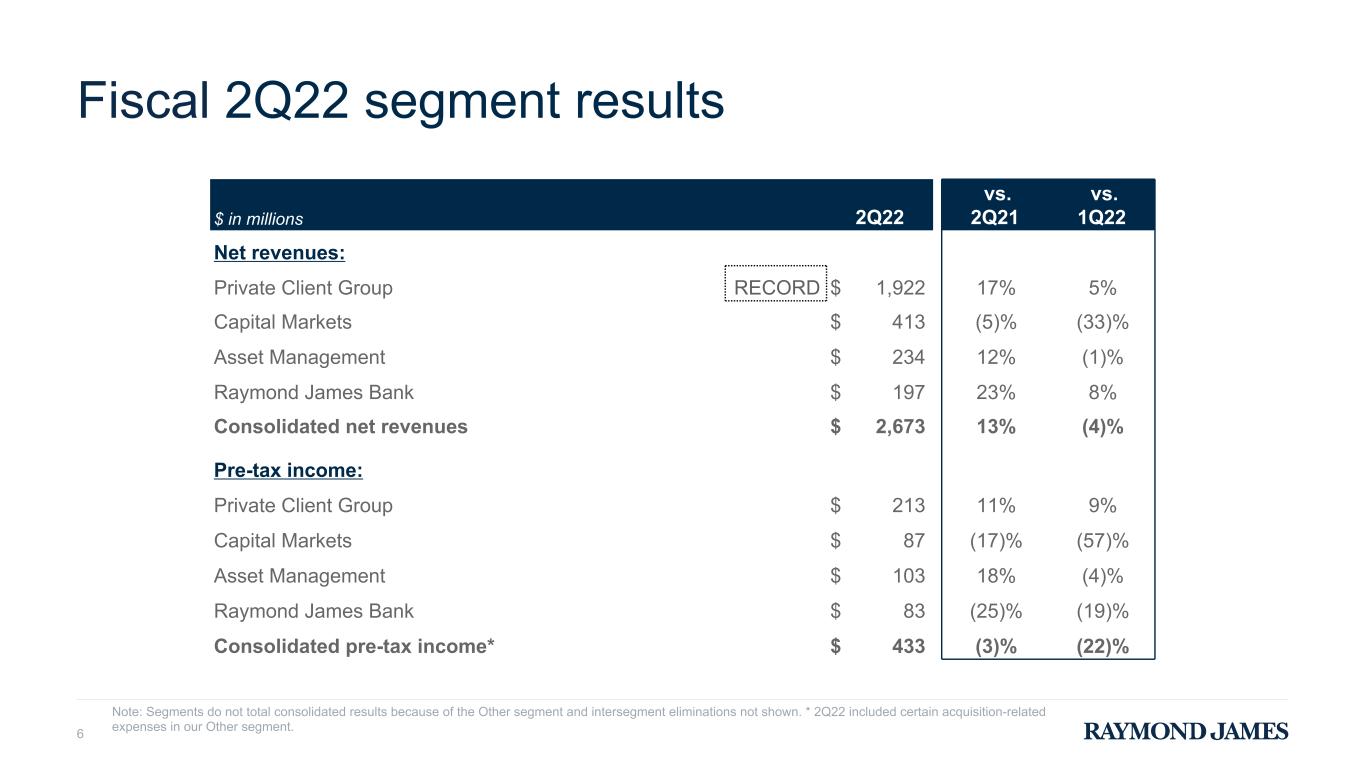
Fiscal 2Q22 segment results 6 $ in millions 2Q22 vs. 2Q21 vs. 1Q22 Net revenues: Private Client Group RECORD $ 1,922 17% 5% Capital Markets $ 413 (5)% (33)% Asset Management $ 234 12% (1)% Raymond James Bank $ 197 23% 8% Consolidated net revenues $ 2,673 13% (4)% Pre-tax income: Private Client Group $ 213 11% 9% Capital Markets $ 87 (17)% (57)% Asset Management $ 103 18% (4)% Raymond James Bank $ 83 (25)% (19)% Consolidated pre-tax income* $ 433 (3)% (22)% Note: Segments do not total consolidated results because of the Other segment and intersegment eliminations not shown. * 2Q22 included certain acquisition-related expenses in our Other segment.
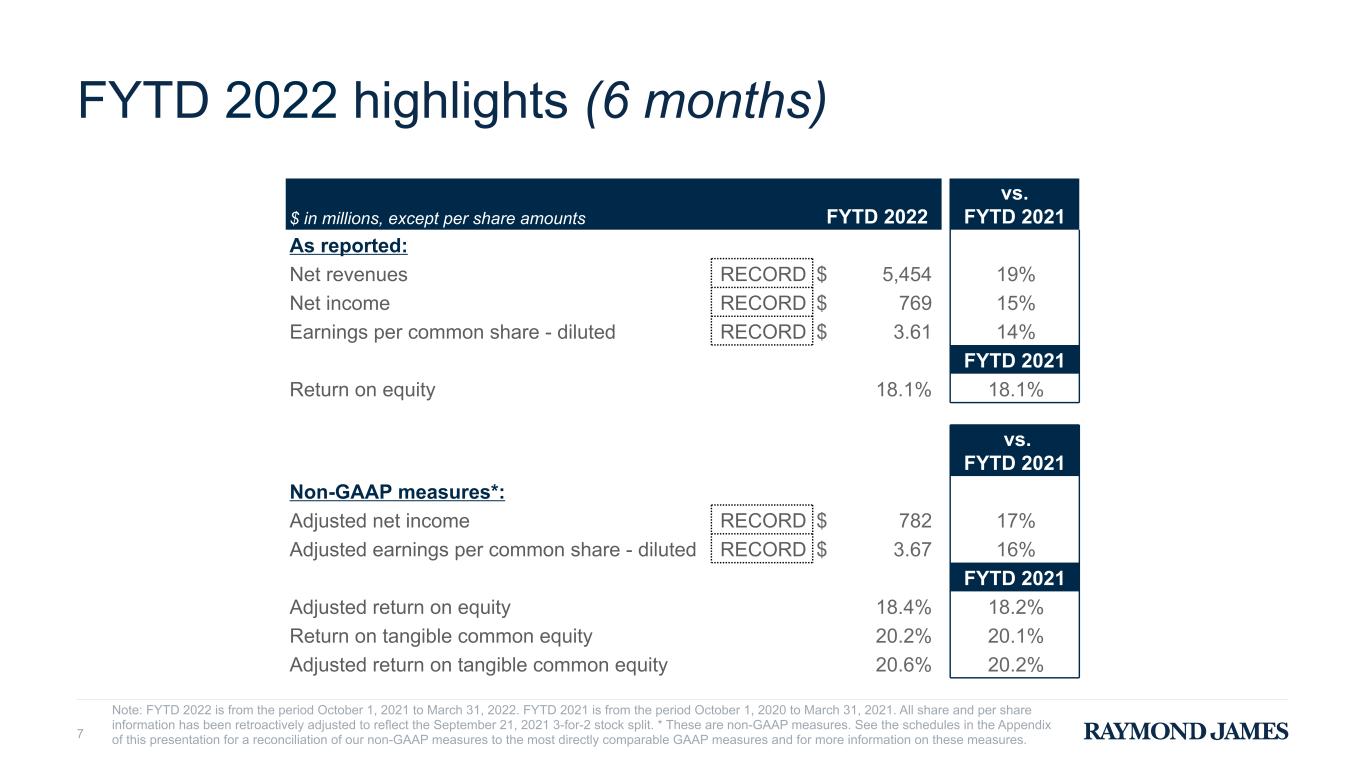
FYTD 2022 highlights (6 months) 7 Note: FYTD 2022 is from the period October 1, 2021 to March 31, 2022. FYTD 2021 is from the period October 1, 2020 to March 31, 2021. All share and per share information has been retroactively adjusted to reflect the September 21, 2021 3-for-2 stock split. * These are non-GAAP measures. See the schedules in the Appendix of this presentation for a reconciliation of our non-GAAP measures to the most directly comparable GAAP measures and for more information on these measures. $ in millions, except per share amounts FYTD 2022 vs. FYTD 2021 As reported: Net revenues RECORD $ 5,454 19% Net income RECORD $ 769 15% Earnings per common share - diluted RECORD $ 3.61 14% FYTD 2021 Return on equity 18.1 % 18.1% vs. FYTD 2021 Non-GAAP measures*: Adjusted net income RECORD $ 782 17% Adjusted earnings per common share - diluted RECORD $ 3.67 16% FYTD 2021 Adjusted return on equity 18.4 % 18.2% Return on tangible common equity 20.2 % 20.1% Adjusted return on tangible common equity 20.6 % 20.2%
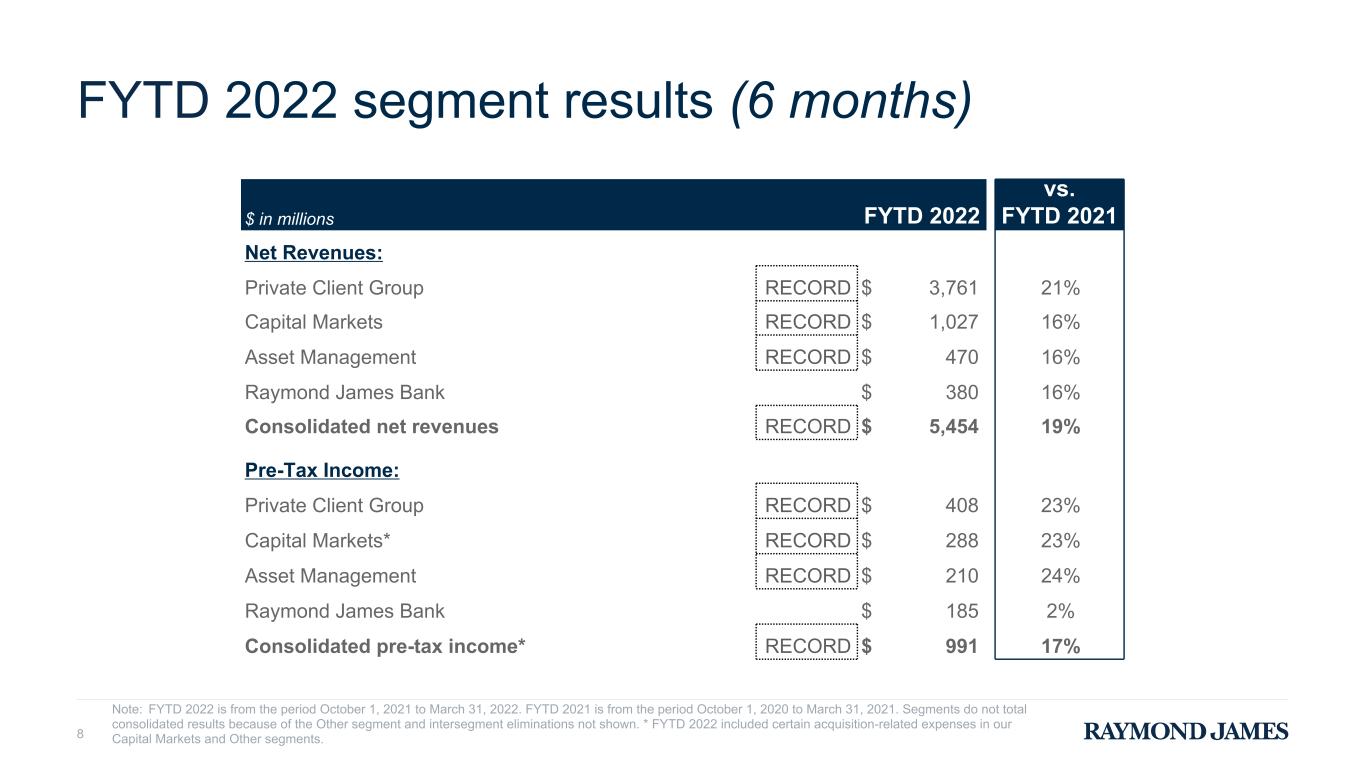
FYTD 2022 segment results (6 months) 8 $ in millions FYTD 2022 vs. FYTD 2021 Net Revenues: Private Client Group RECORD $ 3,761 21% Capital Markets RECORD $ 1,027 16% Asset Management RECORD $ 470 16% Raymond James Bank $ 380 16% Consolidated net revenues RECORD $ 5,454 19% Pre-Tax Income: Private Client Group RECORD $ 408 23% Capital Markets* RECORD $ 288 23% Asset Management RECORD $ 210 24% Raymond James Bank $ 185 2% Consolidated pre-tax income* RECORD $ 991 17% Note: FYTD 2022 is from the period October 1, 2021 to March 31, 2022. FYTD 2021 is from the period October 1, 2020 to March 31, 2021. Segments do not total consolidated results because of the Other segment and intersegment eliminations not shown. * FYTD 2022 included certain acquisition-related expenses in our Capital Markets and Other segments.
Financial Review Paul Shoukry Chief Financial Officer, Raymond James Financial 9
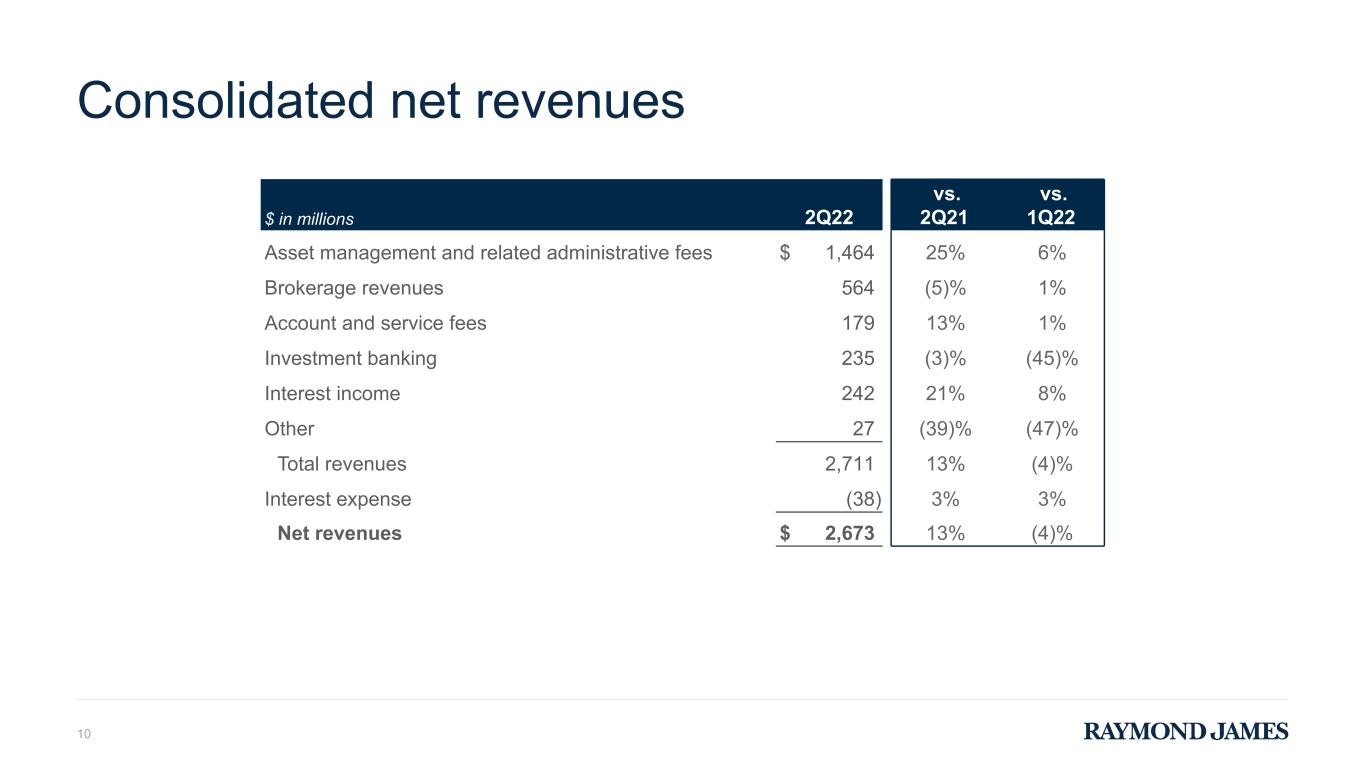
Consolidated net revenues 10 $ in millions 2Q22 vs. 2Q21 vs. 1Q22 Asset management and related administrative fees $ 1,464 25% 6% Brokerage revenues 564 (5)% 1% Account and service fees 179 13% 1% Investment banking 235 (3)% (45)% Interest income 242 21% 8% Other 27 (39)% (47)% Total revenues 2,711 13% (4)% Interest expense (38) 3% 3% Net revenues $ 2,673 13% (4)%
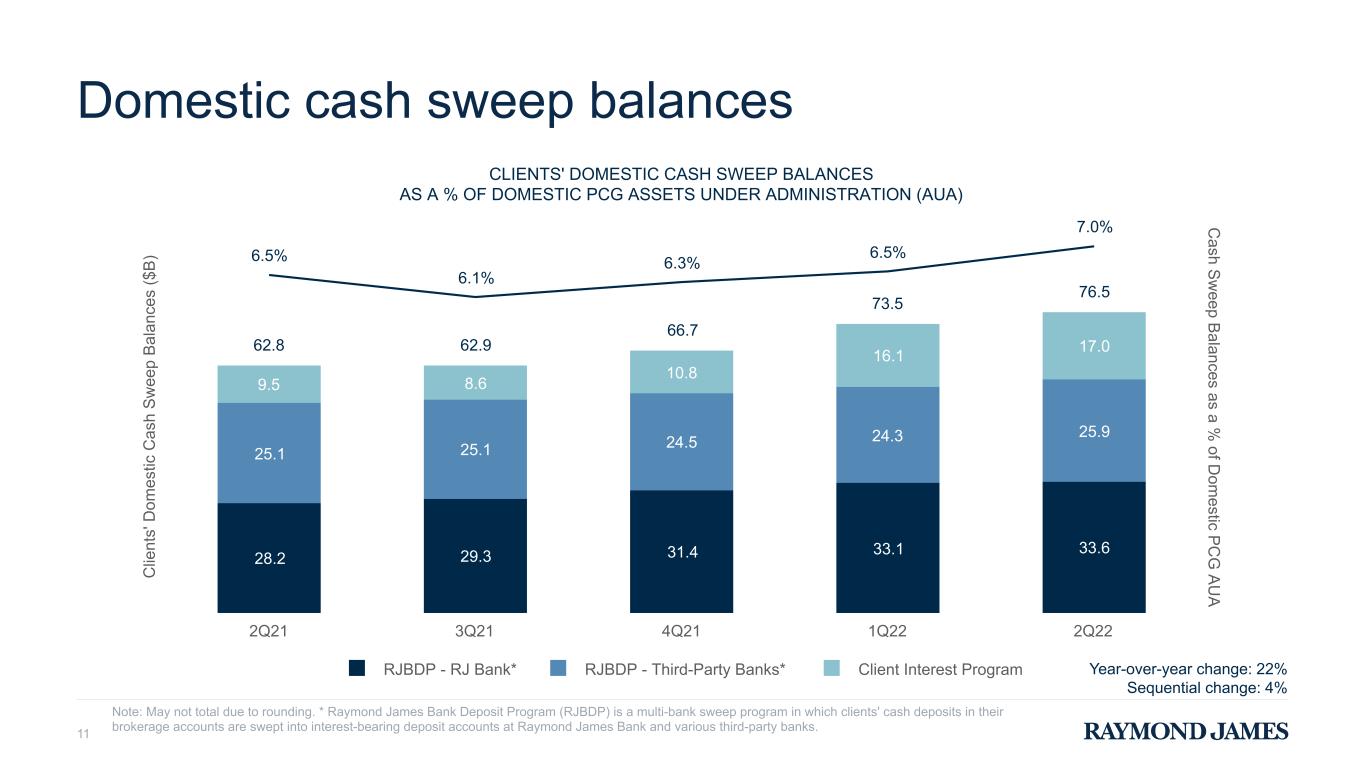
Domestic cash sweep balances 11 C lie nt s' D om es tic C as h S w ee p B al an ce s ($ B ) C ash S w eep B alances as a % of D om estic P C G A U A CLIENTS' DOMESTIC CASH SWEEP BALANCES AS A % OF DOMESTIC PCG ASSETS UNDER ADMINISTRATION (AUA) 28.2 29.3 31.4 33.1 33.6 25.1 25.1 24.5 24.3 25.9 9.5 8.6 10.8 16.1 17.062.8 62.9 66.7 73.5 76.5 6.5% 6.1% 6.3% 6.5% 7.0% RJBDP - RJ Bank* RJBDP - Third-Party Banks* Client Interest Program 2Q21 3Q21 4Q21 1Q22 2Q22 Note: May not total due to rounding. * Raymond James Bank Deposit Program (RJBDP) is a multi-bank sweep program in which clients' cash deposits in their brokerage accounts are swept into interest-bearing deposit accounts at Raymond James Bank and various third-party banks. Year-over-year change: 22% Sequential change: 4%
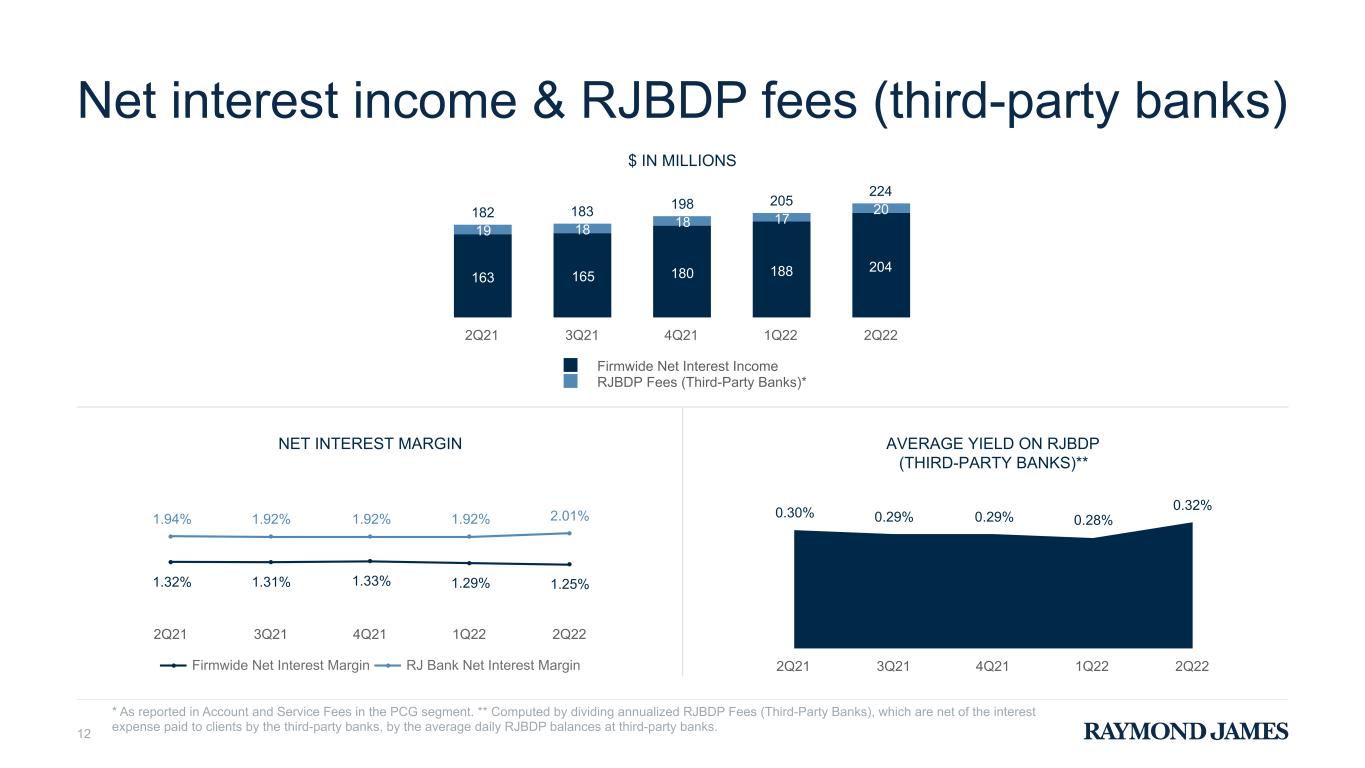
Net interest income & RJBDP fees (third-party banks) 12 * As reported in Account and Service Fees in the PCG segment. ** Computed by dividing annualized RJBDP Fees (Third-Party Banks), which are net of the interest expense paid to clients by the third-party banks, by the average daily RJBDP balances at third-party banks. $ IN MILLIONS 182 183 198 205 224 163 165 180 188 204 19 18 18 17 20 Firmwide Net Interest Income RJBDP Fees (Third-Party Banks)* 2Q21 3Q21 4Q21 1Q22 2Q22 NET INTEREST MARGIN 1.94% 1.92% 1.92% 1.92% 2.01% 1.32% 1.31% 1.33% 1.29% 1.25% Firmwide Net Interest Margin RJ Bank Net Interest Margin 2Q21 3Q21 4Q21 1Q22 2Q22 AVERAGE YIELD ON RJBDP (THIRD-PARTY BANKS)** 0.30% 0.29% 0.29% 0.28% 0.32% 2Q21 3Q21 4Q21 1Q22 2Q22
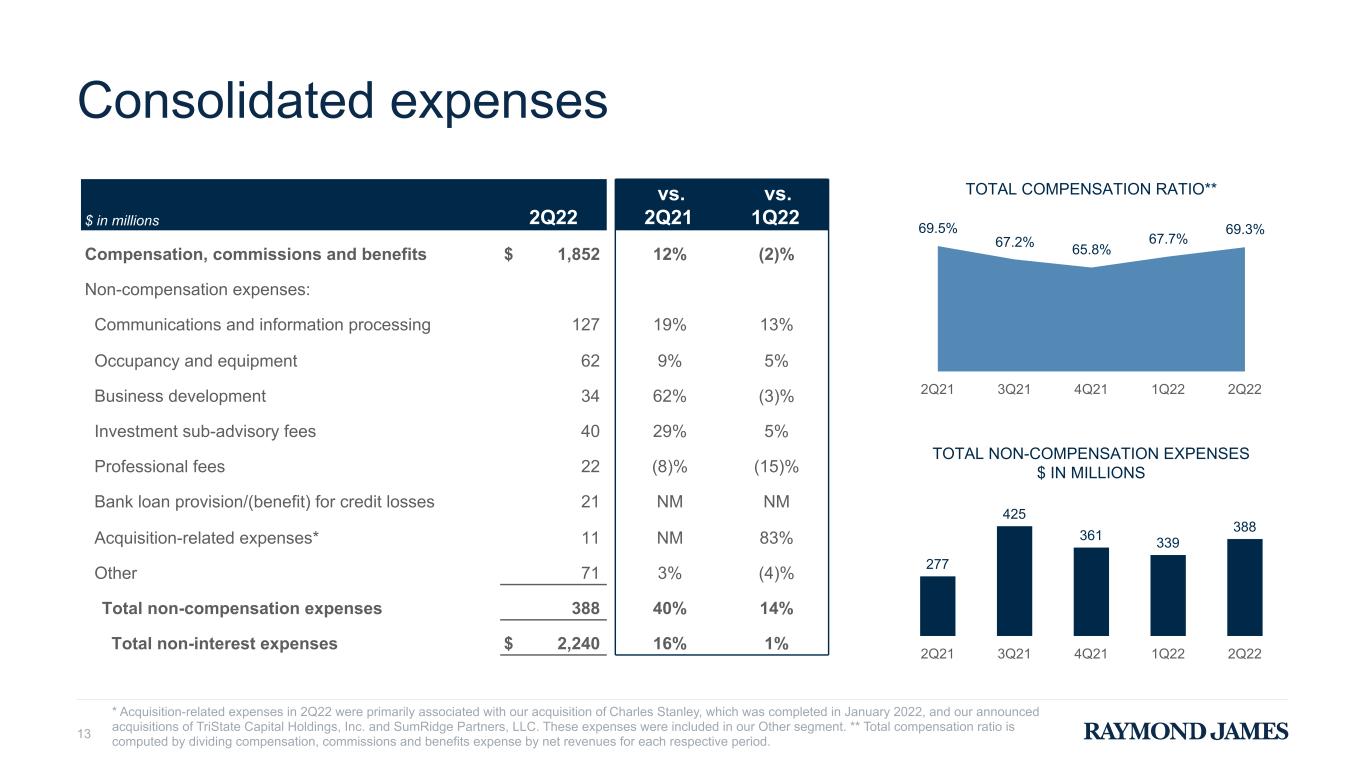
Consolidated expenses 13 $ in millions 2Q22 vs. 2Q21 vs. 1Q22 Compensation, commissions and benefits $ 1,852 12% (2)% Non-compensation expenses: Communications and information processing 127 19% 13% Occupancy and equipment 62 9% 5% Business development 34 62% (3)% Investment sub-advisory fees 40 29% 5% Professional fees 22 (8)% (15)% Bank loan provision/(benefit) for credit losses 21 NM NM Acquisition-related expenses* 11 NM 83% Other 71 3% (4)% Total non-compensation expenses 388 40% 14% Total non-interest expenses $ 2,240 16% 1% * Acquisition-related expenses in 2Q22 were primarily associated with our acquisition of Charles Stanley, which was completed in January 2022, and our announced acquisitions of TriState Capital Holdings, Inc. and SumRidge Partners, LLC. These expenses were included in our Other segment. ** Total compensation ratio is computed by dividing compensation, commissions and benefits expense by net revenues for each respective period. TOTAL COMPENSATION RATIO** 69.5% 67.2% 65.8% 67.7% 69.3% 2Q21 3Q21 4Q21 1Q22 2Q22 TOTAL NON-COMPENSATION EXPENSES $ IN MILLIONS 277 425 361 339 388 2Q21 3Q21 4Q21 1Q22 2Q22
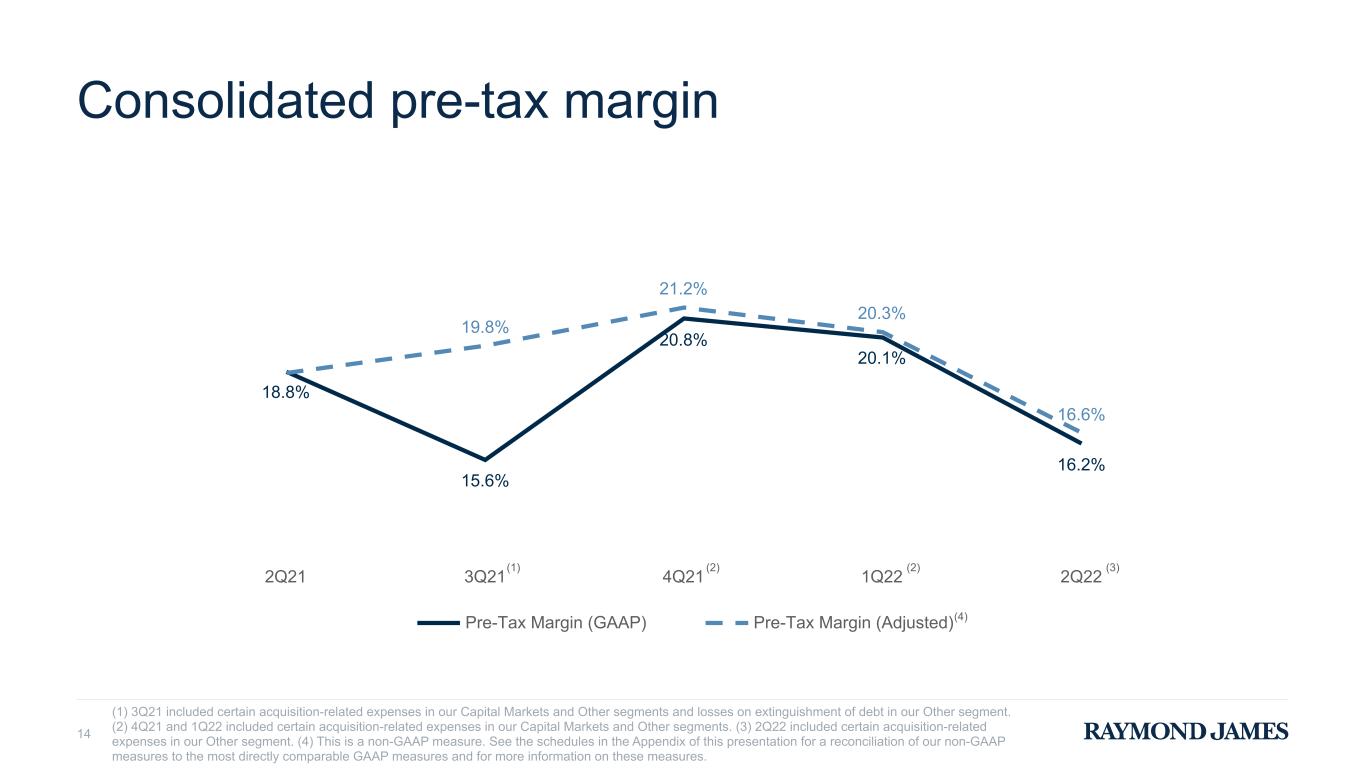
Consolidated pre-tax margin 14 18.8% 15.6% 20.8% 20.1% 16.2% 19.8% 21.2% 20.3% 16.6% Pre-Tax Margin (GAAP) Pre-Tax Margin (Adjusted) 2Q21 3Q21 4Q21 1Q22 2Q22 (1) 3Q21 included certain acquisition-related expenses in our Capital Markets and Other segments and losses on extinguishment of debt in our Other segment. (2) 4Q21 and 1Q22 included certain acquisition-related expenses in our Capital Markets and Other segments. (3) 2Q22 included certain acquisition-related expenses in our Other segment. (4) This is a non-GAAP measure. See the schedules in the Appendix of this presentation for a reconciliation of our non-GAAP measures to the most directly comparable GAAP measures and for more information on these measures. (1) (2) (2) (4) (3)
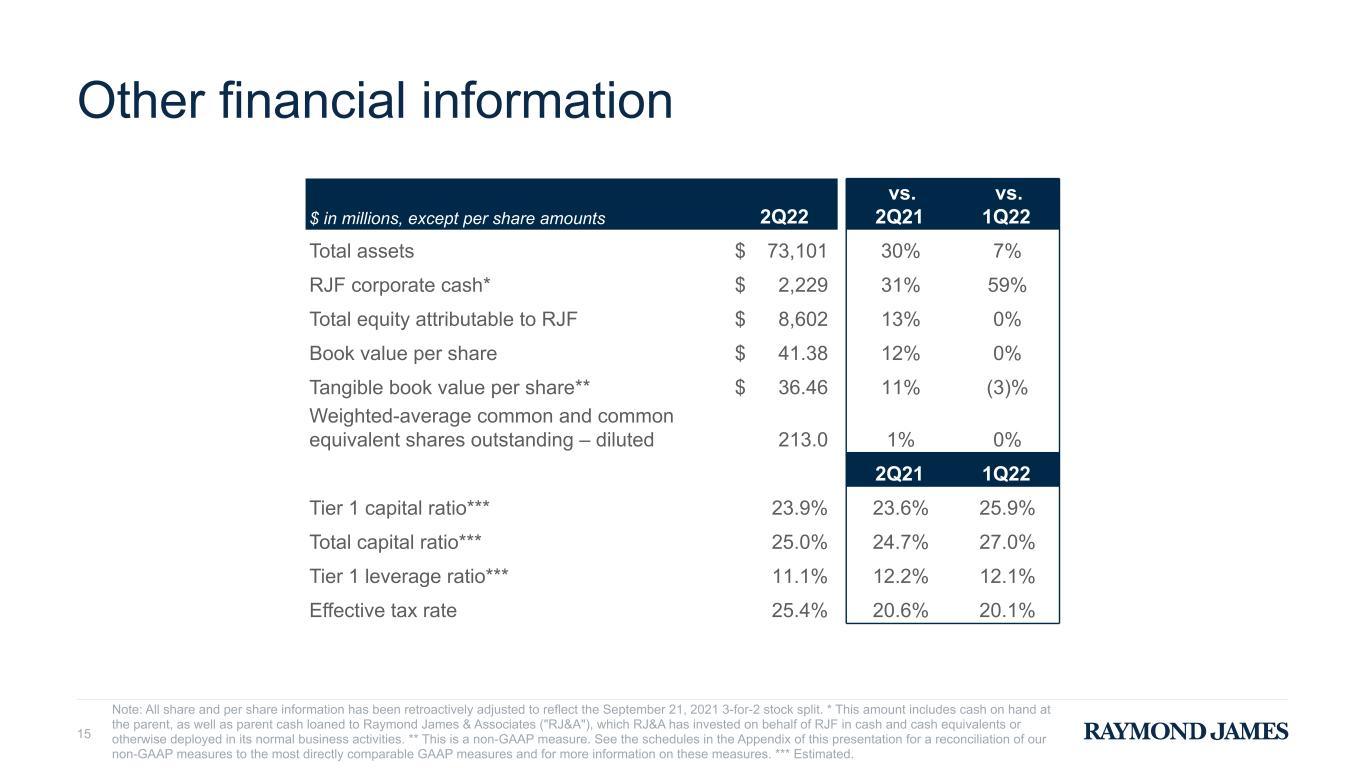
Other financial information 15 Note: All share and per share information has been retroactively adjusted to reflect the September 21, 2021 3-for-2 stock split. * This amount includes cash on hand at the parent, as well as parent cash loaned to Raymond James & Associates ("RJ&A"), which RJ&A has invested on behalf of RJF in cash and cash equivalents or otherwise deployed in its normal business activities. ** This is a non-GAAP measure. See the schedules in the Appendix of this presentation for a reconciliation of our non-GAAP measures to the most directly comparable GAAP measures and for more information on these measures. *** Estimated. $ in millions, except per share amounts 2Q22 vs. 2Q21 vs. 1Q22 Total assets $ 73,101 30% 7% RJF corporate cash* $ 2,229 31% 59% Total equity attributable to RJF $ 8,602 13% 0% Book value per share $ 41.38 12% 0% Tangible book value per share** $ 36.46 11% (3)% Weighted-average common and common equivalent shares outstanding – diluted 213.0 1% 0% 2Q21 1Q22 Tier 1 capital ratio*** 23.9 % 23.6% 25.9% Total capital ratio*** 25.0 % 24.7% 27.0% Tier 1 leverage ratio*** 11.1 % 12.2% 12.1% Effective tax rate 25.4 % 20.6% 20.1%
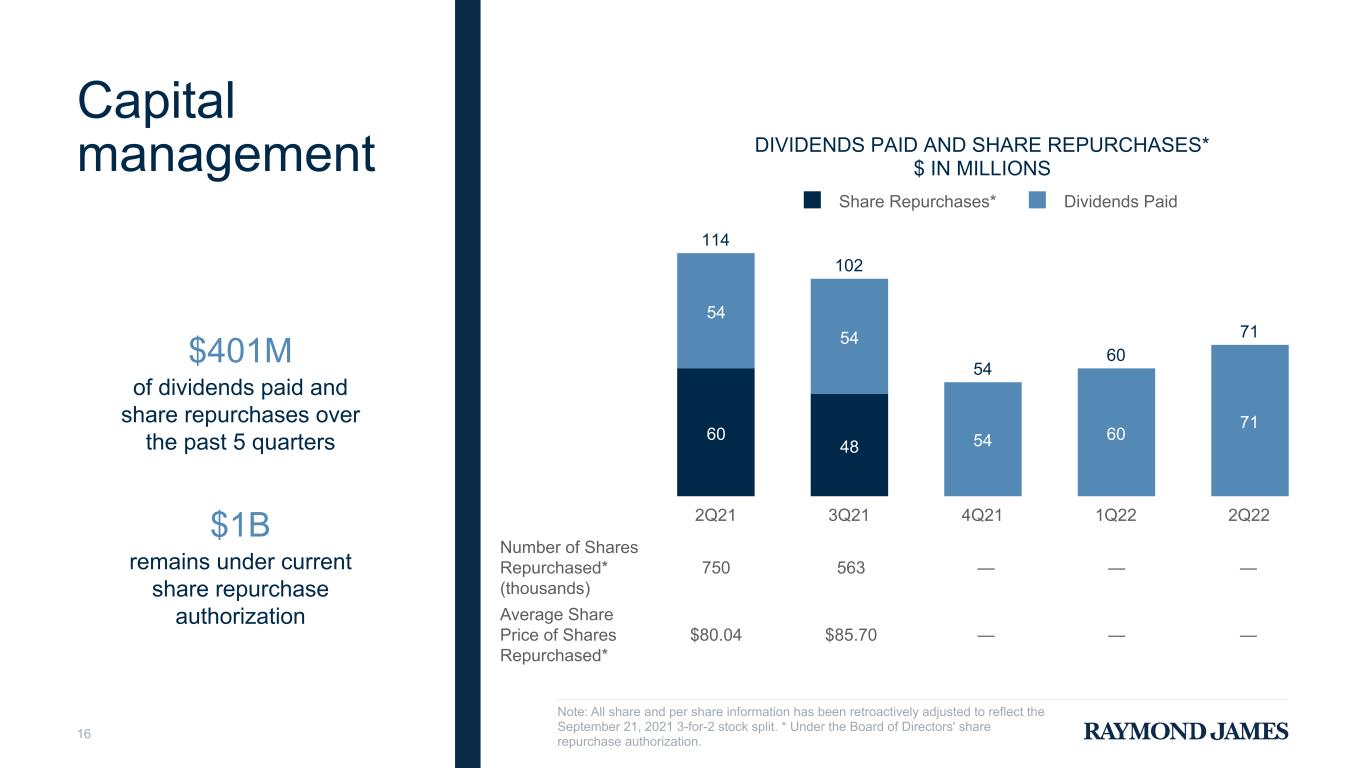
$401M of dividends paid and share repurchases over the past 5 quarters Capital management 16 DIVIDENDS PAID AND SHARE REPURCHASES* $ IN MILLIONS 114 102 54 60 71 60 48 54 54 54 60 71 Share Repurchases* Dividends Paid 2Q21 3Q21 4Q21 1Q22 2Q22 Number of Shares Repurchased* (thousands) 750 563 — — — Average Share Price of Shares Repurchased* $80.04 $85.70 — — — Note: All share and per share information has been retroactively adjusted to reflect the September 21, 2021 3-for-2 stock split. * Under the Board of Directors' share repurchase authorization. $1B remains under current share repurchase authorization
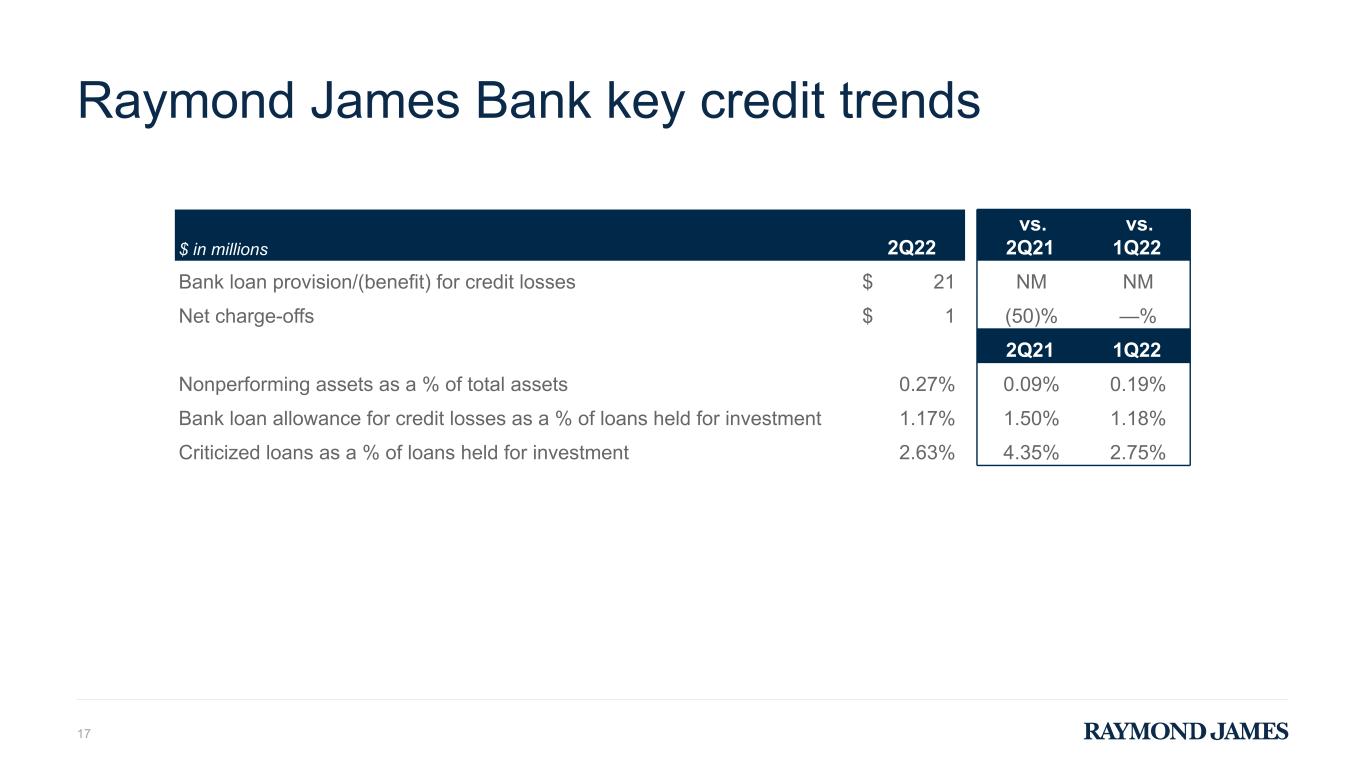
Raymond James Bank key credit trends 17 $ in millions 2Q22 vs. 2Q21 vs. 1Q22 Bank loan provision/(benefit) for credit losses $ 21 NM NM Net charge-offs $ 1 (50)% —% 2Q21 1Q22 Nonperforming assets as a % of total assets 0.27 % 0.09% 0.19% Bank loan allowance for credit losses as a % of loans held for investment 1.17 % 1.50% 1.18% Criticized loans as a % of loans held for investment 2.63 % 4.35% 2.75%

Outlook 18
Appendix 19
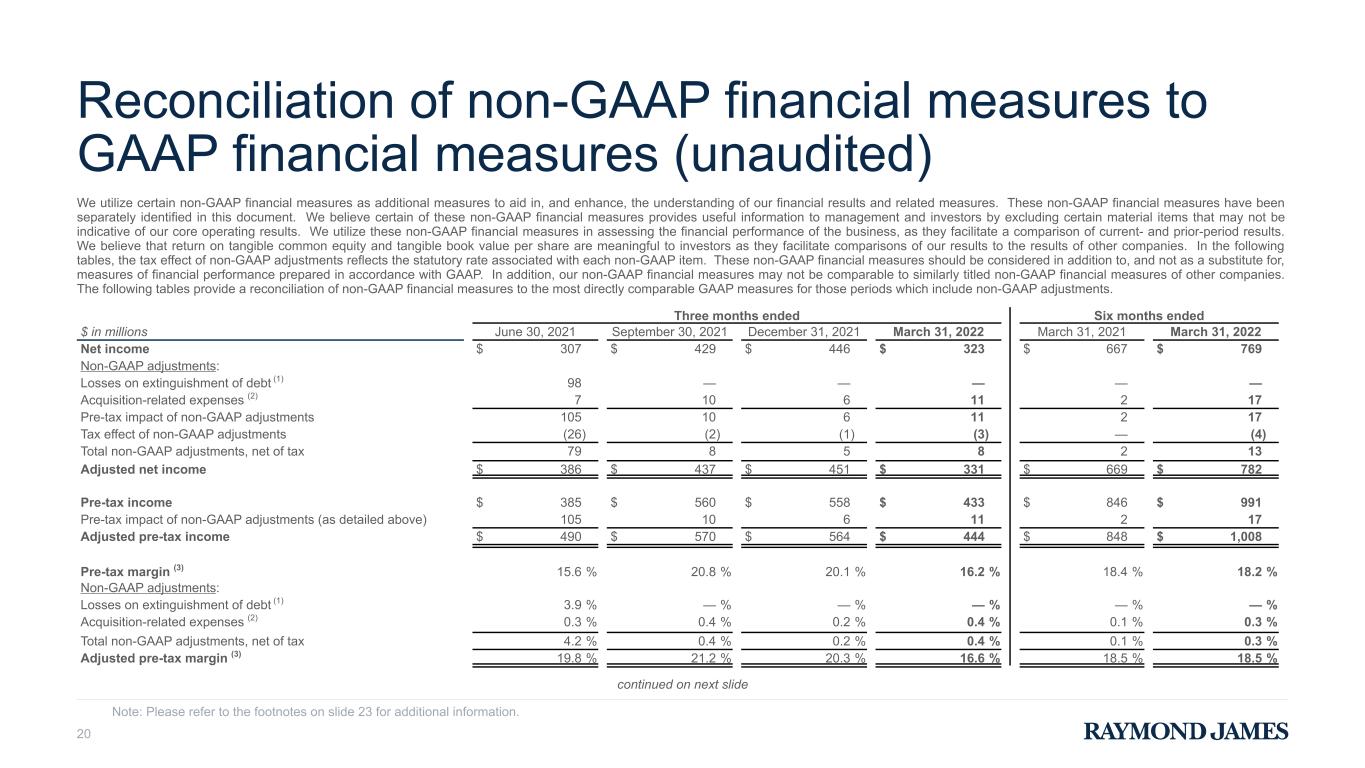
Reconciliation of non-GAAP financial measures to GAAP financial measures (unaudited) 20 We utilize certain non-GAAP financial measures as additional measures to aid in, and enhance, the understanding of our financial results and related measures. These non-GAAP financial measures have been separately identified in this document. We believe certain of these non-GAAP financial measures provides useful information to management and investors by excluding certain material items that may not be indicative of our core operating results. We utilize these non-GAAP financial measures in assessing the financial performance of the business, as they facilitate a comparison of current- and prior-period results. We believe that return on tangible common equity and tangible book value per share are meaningful to investors as they facilitate comparisons of our results to the results of other companies. In the following tables, the tax effect of non-GAAP adjustments reflects the statutory rate associated with each non-GAAP item. These non-GAAP financial measures should be considered in addition to, and not as a substitute for, measures of financial performance prepared in accordance with GAAP. In addition, our non-GAAP financial measures may not be comparable to similarly titled non-GAAP financial measures of other companies. The following tables provide a reconciliation of non-GAAP financial measures to the most directly comparable GAAP measures for those periods which include non-GAAP adjustments. Three months ended Six months ended $ in millions June 30, 2021 September 30, 2021 December 31, 2021 March 31, 2022 March 31, 2021 March 31, 2022 Net income $ 307 $ 429 $ 446 $ 323 $ 667 $ 769 Non-GAAP adjustments: Losses on extinguishment of debt (1) 98 — — — — — Acquisition-related expenses (2) 7 10 6 11 2 17 Pre-tax impact of non-GAAP adjustments 105 10 6 11 2 17 Tax effect of non-GAAP adjustments (26) (2) (1) (3) — (4) Total non-GAAP adjustments, net of tax 79 8 5 8 2 13 Adjusted net income $ 386 $ 437 $ 451 $ 331 $ 669 $ 782 Pre-tax income $ 385 $ 560 $ 558 $ 433 $ 846 $ 991 Pre-tax impact of non-GAAP adjustments (as detailed above) 105 10 6 11 2 17 Adjusted pre-tax income $ 490 $ 570 $ 564 $ 444 $ 848 $ 1,008 Pre-tax margin (3) 15.6 % 20.8 % 20.1 % 16.2 % 18.4 % 18.2 % Non-GAAP adjustments: Losses on extinguishment of debt (1) 3.9 % — % — % — % — % — % Acquisition-related expenses (2) 0.3 % 0.4 % 0.2 % 0.4 % 0.1 % 0.3 % Total non-GAAP adjustments, net of tax 4.2 % 0.4 % 0.2 % 0.4 % 0.1 % 0.3 % Adjusted pre-tax margin (3) 19.8 % 21.2 % 20.3 % 16.6 % 18.5 % 18.5 % Note: Please refer to the footnotes on slide 23 for additional information. continued on next slide
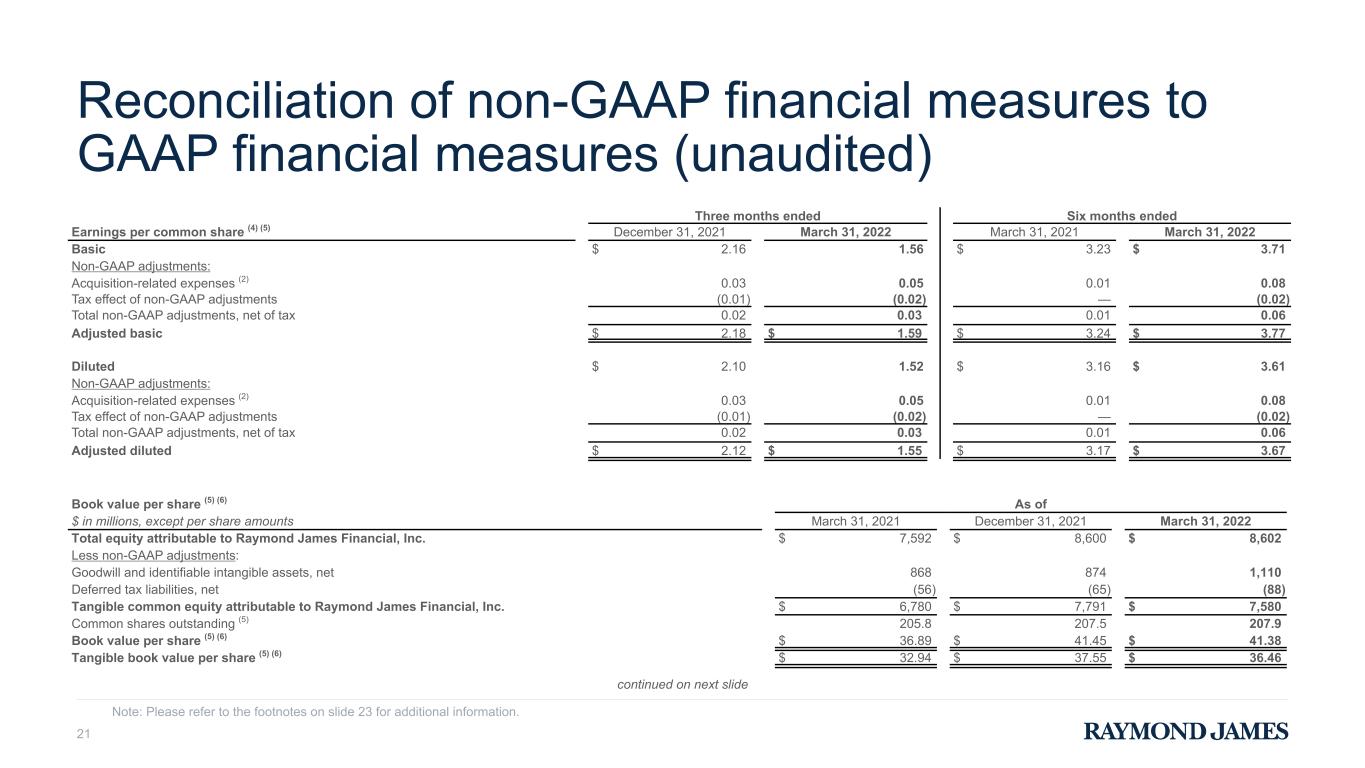
Reconciliation of non-GAAP financial measures to GAAP financial measures (unaudited) 21 Note: Please refer to the footnotes on slide 23 for additional information. Three months ended Six months ended Earnings per common share (4) (5) December 31, 2021 March 31, 2022 March 31, 2021 March 31, 2022 Basic $ 2.16 1.56 $ 3.23 $ 3.71 Non-GAAP adjustments: Acquisition-related expenses (2) 0.03 0.05 0.01 0.08 Tax effect of non-GAAP adjustments (0.01) (0.02) — (0.02) Total non-GAAP adjustments, net of tax 0.02 0.03 0.01 0.06 Adjusted basic $ 2.18 $ 1.59 $ 3.24 $ 3.77 Diluted $ 2.10 1.52 $ 3.16 $ 3.61 Non-GAAP adjustments: Acquisition-related expenses (2) 0.03 0.05 0.01 0.08 Tax effect of non-GAAP adjustments (0.01) (0.02) — (0.02) Total non-GAAP adjustments, net of tax 0.02 0.03 0.01 0.06 Adjusted diluted $ 2.12 $ 1.55 $ 3.17 $ 3.67 Book value per share (5) (6) As of $ in millions, except per share amounts March 31, 2021 December 31, 2021 March 31, 2022 Total equity attributable to Raymond James Financial, Inc. $ 7,592 $ 8,600 $ 8,602 Less non-GAAP adjustments: Goodwill and identifiable intangible assets, net 868 874 1,110 Deferred tax liabilities, net (56) (65) (88) Tangible common equity attributable to Raymond James Financial, Inc. $ 6,780 $ 7,791 $ 7,580 Common shares outstanding (5) 205.8 207.5 207.9 Book value per share (5) (6) $ 36.89 $ 41.45 $ 41.38 Tangible book value per share (5) (6) $ 32.94 $ 37.55 $ 36.46 continued on next slide
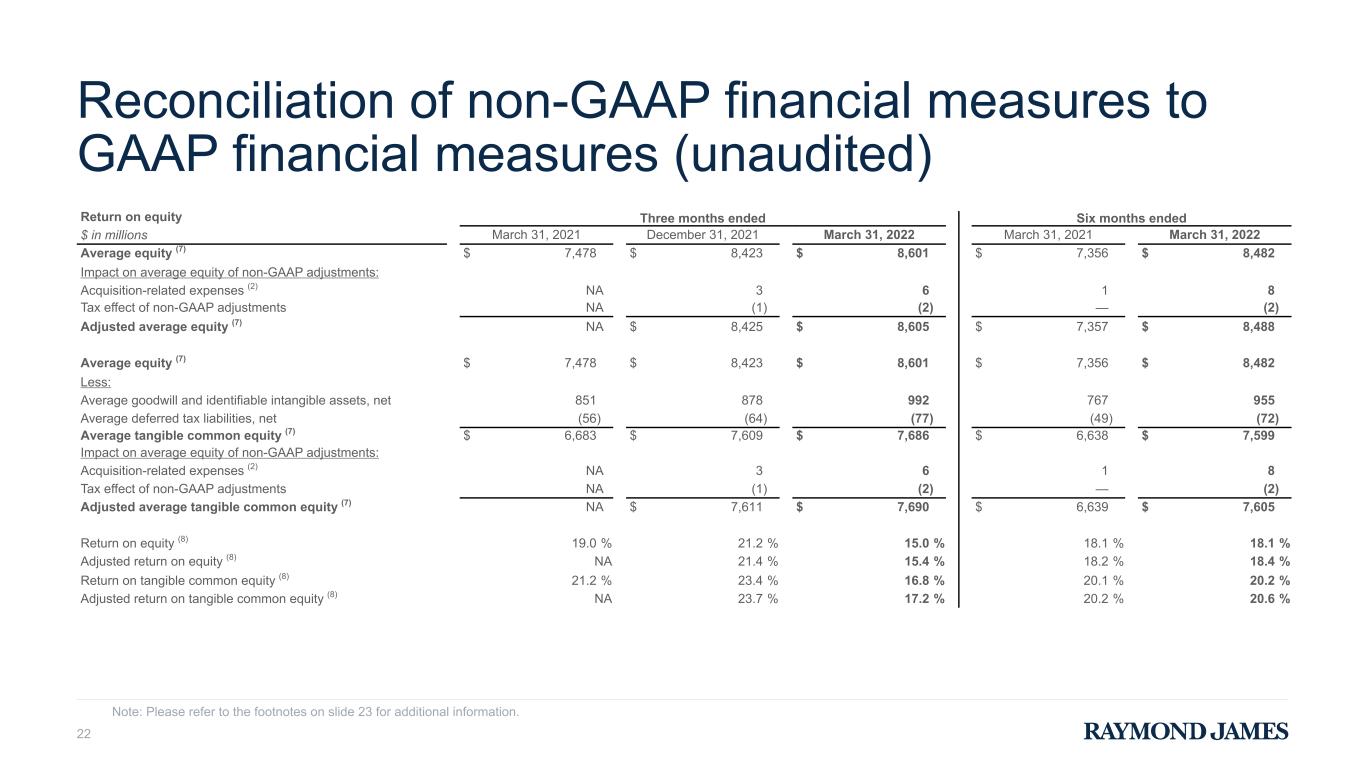
Reconciliation of non-GAAP financial measures to GAAP financial measures (unaudited) 22 Note: Please refer to the footnotes on slide 23 for additional information. Return on equity Three months ended Six months ended $ in millions March 31, 2021 December 31, 2021 March 31, 2022 March 31, 2021 March 31, 2022 Average equity (7) $ 7,478 $ 8,423 $ 8,601 $ 7,356 $ 8,482 Impact on average equity of non-GAAP adjustments: Acquisition-related expenses (2) NA 3 6 1 8 Tax effect of non-GAAP adjustments NA (1) (2) — (2) Adjusted average equity (7) NA $ 8,425 $ 8,605 $ 7,357 $ 8,488 Average equity (7) $ 7,478 $ 8,423 $ 8,601 $ 7,356 $ 8,482 Less: Average goodwill and identifiable intangible assets, net 851 878 992 767 955 Average deferred tax liabilities, net (56) (64) (77) (49) (72) Average tangible common equity (7) $ 6,683 $ 7,609 $ 7,686 $ 6,638 $ 7,599 Impact on average equity of non-GAAP adjustments: Acquisition-related expenses (2) NA 3 6 1 8 Tax effect of non-GAAP adjustments NA (1) (2) — (2) Adjusted average tangible common equity (7) NA $ 7,611 $ 7,690 $ 6,639 $ 7,605 Return on equity (8) 19.0 % 21.2 % 15.0 % 18.1 % 18.1 % Adjusted return on equity (8) NA 21.4 % 15.4 % 18.2 % 18.4 % Return on tangible common equity (8) 21.2 % 23.4 % 16.8 % 20.1 % 20.2 % Adjusted return on tangible common equity (8) NA 23.7 % 17.2 % 20.2 % 20.6 %
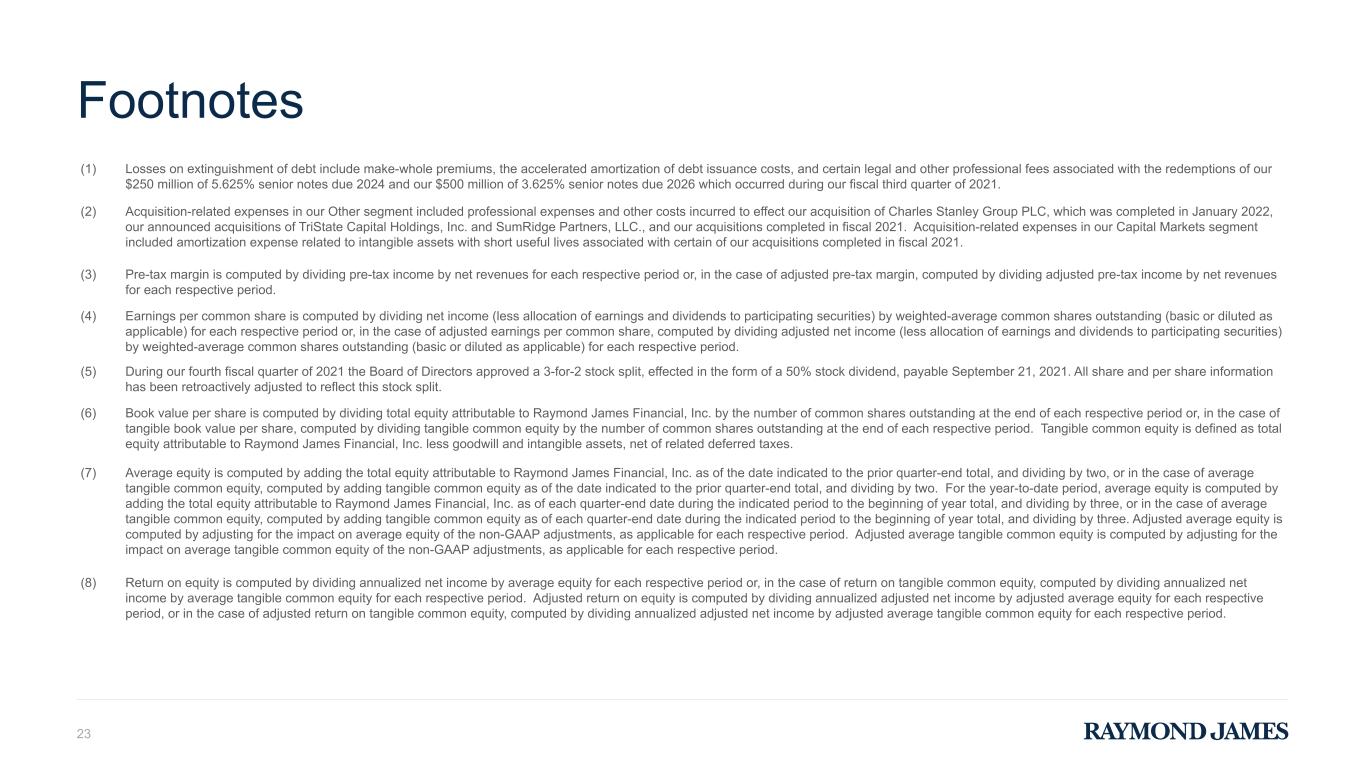
Footnotes 23 (1) Losses on extinguishment of debt include make-whole premiums, the accelerated amortization of debt issuance costs, and certain legal and other professional fees associated with the redemptions of our $250 million of 5.625% senior notes due 2024 and our $500 million of 3.625% senior notes due 2026 which occurred during our fiscal third quarter of 2021. (2) Acquisition-related expenses in our Other segment included professional expenses and other costs incurred to effect our acquisition of Charles Stanley Group PLC, which was completed in January 2022, our announced acquisitions of TriState Capital Holdings, Inc. and SumRidge Partners, LLC., and our acquisitions completed in fiscal 2021. Acquisition-related expenses in our Capital Markets segment included amortization expense related to intangible assets with short useful lives associated with certain of our acquisitions completed in fiscal 2021. (3) Pre-tax margin is computed by dividing pre-tax income by net revenues for each respective period or, in the case of adjusted pre-tax margin, computed by dividing adjusted pre-tax income by net revenues for each respective period. (4) Earnings per common share is computed by dividing net income (less allocation of earnings and dividends to participating securities) by weighted-average common shares outstanding (basic or diluted as applicable) for each respective period or, in the case of adjusted earnings per common share, computed by dividing adjusted net income (less allocation of earnings and dividends to participating securities) by weighted-average common shares outstanding (basic or diluted as applicable) for each respective period. (5) During our fourth fiscal quarter of 2021 the Board of Directors approved a 3-for-2 stock split, effected in the form of a 50% stock dividend, payable September 21, 2021. All share and per share information has been retroactively adjusted to reflect this stock split. (6) Book value per share is computed by dividing total equity attributable to Raymond James Financial, Inc. by the number of common shares outstanding at the end of each respective period or, in the case of tangible book value per share, computed by dividing tangible common equity by the number of common shares outstanding at the end of each respective period. Tangible common equity is defined as total equity attributable to Raymond James Financial, Inc. less goodwill and intangible assets, net of related deferred taxes. (7) Average equity is computed by adding the total equity attributable to Raymond James Financial, Inc. as of the date indicated to the prior quarter-end total, and dividing by two, or in the case of average tangible common equity, computed by adding tangible common equity as of the date indicated to the prior quarter-end total, and dividing by two. For the year-to-date period, average equity is computed by adding the total equity attributable to Raymond James Financial, Inc. as of each quarter-end date during the indicated period to the beginning of year total, and dividing by three, or in the case of average tangible common equity, computed by adding tangible common equity as of each quarter-end date during the indicated period to the beginning of year total, and dividing by three. Adjusted average equity is computed by adjusting for the impact on average equity of the non-GAAP adjustments, as applicable for each respective period. Adjusted average tangible common equity is computed by adjusting for the impact on average tangible common equity of the non-GAAP adjustments, as applicable for each respective period. (8) Return on equity is computed by dividing annualized net income by average equity for each respective period or, in the case of return on tangible common equity, computed by dividing annualized net income by average tangible common equity for each respective period. Adjusted return on equity is computed by dividing annualized adjusted net income by adjusted average equity for each respective period, or in the case of adjusted return on tangible common equity, computed by dividing annualized adjusted net income by adjusted average tangible common equity for each respective period.