
SentinelOne, Inc 8-K, filed Aug 27, 2026
SentinelOne, Inc. (S)
8-K
2026-08-27
For: 2026-08-27
View Original
Added on
August 27, 2026
About this 8-K
SentinelOne, Inc filed this 8-K on August 27, 2026.
Items reported
- Item 2.02: Financial results
- Item 7.01: Regulation FD disclosure
- Item 9.01: Financial statements and exhibits
UNITED STATES
SECURITIES AND EXCHANGE COMMISSION
WASHINGTON, D.C. 20549
FORM 8-K
CURRENT REPORT
Pursuant to Section 13 or 15(d)
of the Securities Exchange Act of 1934
Date of Report (Date of earliest event reported): August 27, 2026
(Exact name of registrant as specified in its charter)
_____________________________________________________________________________________________
(State or other jurisdiction of incorporation) | (Commission File Number) | (IRS Employer Identification No.) | ||||||||||||
(Address, including zip code, of principal executive offices) | ||||||||
Registrant’s telephone number, including area code: (855 ) 868-3733
Not Applicable
(Former name or former address, if changed since last report)
Check the appropriate box below if the Form 8-K filing is intended to simultaneously satisfy the filing obligation of the registrant under any of the following provisions (see General Instruction A.2. below):
Written communications pursuant to Rule 425 under the Securities Act (17 CFR 230.425) | |||||||||||||||||
Soliciting material pursuant to Rule 14a12 under the Exchange Act (17 CFR 240.14a-12) | |||||||||||||||||
Pre-commencement communications pursuant to Rule 14d-2(b) under the Exchange Act (17 CFR 240.14d-2(b)) | |||||||||||||||||
Pre-commencement communications pursuant to Rule 13e-4(c) under the Exchange Act (17 CFR 240.13e-4(c)) | |||||||||||||||||
Securities registered pursuant to Section 12(b) of the Act:
Title of each class | Trading Symbol(s) | Name of each exchange on which registered | ||||||||||||
Indicate by check mark whether the registrant is an emerging growth company as defined in Rule 405 of the Securities Act of 1933 (§ 230.405 of this chapter) or Rule 12b-2 of the Securities Exchange Act of 1934 (§ 240.12b-2 of this chapter).
Emerging growth company | |||||
If an emerging growth company, indicate by check mark if the registrant has elected not to use the extended transition period for complying with any new or revised financial accounting standards provided pursuant to Section 13(a) of the Exchange Act. | ☐ | ||||
Item 2.02 Results of Operations and Financial Condition.
On August 27, 2026, SentinelOne, Inc. (the “Company”) announced its financial results for the second quarter of fiscal year 2027 ended July 31, 2026, by issuing an earnings presentation and a press release. The Company also announced that it would hold a webcast to discuss its financial results for the second quarter of fiscal year 2027 ended July 31, 2026. A copy of the press release and the earnings presentation is furnished herewith as Exhibit 99.1 and 99.2, respectively.
The Company makes reference to non-GAAP financial information in the Company’s press release, earnings presentation and the webcast call. A reconciliation of these non-GAAP financial measures to the comparable GAAP financial measures is contained in the attached press release and earnings presentation.
The information contained herein and in the accompanying exhibits are “furnished” and shall not be deemed “filed” for purposes of Section 18 of the Securities Exchange Act of 1934, as amended (the “Exchange Act”), or otherwise subject to the liabilities of that section, and shall not be incorporated by reference in any filing under the Securities Act of 1933, as amended, or the Exchange Act regardless of any general incorporation language in such filing, unless expressly incorporated by specific reference in such filing.
Item 7.01 Regulation FD Disclosure.
On August 27, 2026, the Company posted supplemental investor materials on the Investors Relations section of its website, available at investors.sentinelone.com. The Company announces material information to the public through filings with the Securities and Exchange Commission, the investor relations page on the Company’s website, press releases, public conference calls, webcasts, the Company’s news website, available at sentinelone.com/press and blog posts on the Company’s corporate website at sentinelone.com/blog in order to achieve broad, non-exclusionary distribution of information to the public and for complying with its disclosure obligations under Regulation FD.
The information disclosed by the foregoing channels could be deemed to be material information. As such, the Company encourages investors, the media and others to follow the channels listed above and to review the information disclosed through such channels.
Any updates to the list of disclosure channels through which the Company announces information will be posted on the investor relations page on the Company’s website.
Item 9.01 Financial Statements and Exhibits.
(d) Exhibits
Exhibit Number | Exhibit Description | |||||||
104 | Cover Page Interactive Data File (embedded within the Inline XBRL document). | |||||||
SIGNATURES
Pursuant to the requirements of the Securities Exchange Act of 1934, the registrant has duly caused this report to be signed on its behalf by the undersigned hereunto duly authorized.
SENTINELONE, INC. | ||||||||||||||
Date: August 27, 2026 | By: | /s/ Sonalee Parekh | ||||||||||||
Sonalee Parekh | ||||||||||||||
Chief Financial Officer | ||||||||||||||
Exhibit 99.1

SentinelOne Announces Second Quarter Fiscal Year 2027 Financial Results
Revenue grew 21% year-over-year to $292 million, exceeding guidance
ARR grew 22% year-over-year to $1.218 billion
Raising Revenue and Operating Income Outlook for Fiscal Year 2027
MOUNTAIN VIEW, Calif. – August 27, 2026 – SentinelOne, Inc. (NYSE: S) today announced financial results for the second quarter of fiscal year 2027 ended July 31, 2026.
“Our Q2 performance demonstrates strong progress across every dimension of our business – a top-tier growth profile, accelerating platform adoption, and undisputed technology leadership for both AI for Security and Security for AI,” said Tomer Weingarten, CEO of SentinelOne. “AI is transforming the way software is built, businesses are operated, and cybersecurity is delivered. With AI-native runtime protection fundamental to the Singularity platform’s architecture, SentinelOne is uniquely positioned to lead the future of AI cybersecurity.”
“Q2 was an exceptional quarter of execution and demonstrated the power of our platform model. We exceeded all top and bottom line guided metrics, achieved record profitability and are raising our revenue and operating income outlook for fiscal year 2027,” said Sonalee Parekh, CFO of SentinelOne. “We are scaling the business with discipline, investing in key AI growth opportunities while driving substantial operating leverage.”
Second Quarter Fiscal Year 2027 Highlights
(All metrics are compared to the second quarter of fiscal year 2026 unless otherwise noted)
•Total revenue grew 21% to $292 million, compared to $242 million.
•Annualized recurring revenue (ARR) grew 22% to $1,218 million as of July 31, 2026.
•Customers with ARR of $100,000 or more grew 13% to 1,715 as of July 31, 2026.
•Gross margin: GAAP gross margin was 72%, compared to 75%. Non-GAAP gross margin was 77%, compared to 79%.
•Operating margin: GAAP operating margin was (31)%, compared to (33)%. Non-GAAP operating margin was 10%, compared to 2%.
•Net income (loss) margin: GAAP net loss margin was (32)%, compared to (30)%. Non-GAAP net income margin was 10%, compared to 5%.
•Earnings per share: GAAP diluted earnings per share was $(0.27), compared to $(0.22). Non-GAAP diluted earnings per share was $0.08, compared to $0.04.
•Cash, cash equivalents, and investments were $813 million as of July 31, 2026.
Financial Outlook
We are providing the following guidance for the third quarter of fiscal year 2027, and for fiscal year 2027 (ending January 31, 2027).
Q3 Fiscal Year 2027 Guidance | Fiscal Year 2027 Guidance | |||||||||||||
| Revenue | $309 - 311 million | $1.202 - 1.207 billion | ||||||||||||
| Non-GAAP operating income | $38 - 40 million | $124 - 128 million | ||||||||||||
| Non-GAAP diluted earnings per share (EPS) | $0.08 - 0.09 | $0.30 - 0.32 | ||||||||||||
| Diluted weighted average shares outstanding | 370 million | 361 million | ||||||||||||
| Non-GAAP tax rate | 17% | 17% | ||||||||||||
These statements are forward-looking and actual results may differ materially as a result of many factors. Refer to the below for information on the factors that could cause our actual results to differ materially from these forward-looking statements.
Guidance for non-GAAP financial measures excludes stock-based compensation expense, employer payroll tax on employee stock transactions, amortization of acquired intangible assets, acquisition-related compensation costs, restructuring charges, gains and losses on strategic investments, and certain discrete tax expenses. We have not provided the most directly comparable GAAP measures because certain items are out of our control or cannot be reasonably predicted. Accordingly, a reconciliation of non-GAAP operating income, non-GAAP EPS and diluted weighted average shares outstanding is not available without unreasonable effort.
Webcast Information
We will host a live audio webcast for analysts and investors to discuss our earnings results for the second quarter of fiscal year 2027 and outlook for the third quarter of fiscal year 2027 and full fiscal year 2027 today, August 27, 2026, at 2:00 p.m. Pacific Time (5:00 p.m. Eastern Time). The live webcast and a recording of the event will be available on the Investor Relations section of our website at investors.sentinelone.com.
We have used, and intend to continue to use, the Investor Relations section of our website at investors.sentinelone.com as a means of disclosing material nonpublic information and for complying with our disclosure obligations under Regulation FD.
Forward-Looking Statements
This press release contains forward-looking statements within the meaning of Section 27A of the Securities Act of 1933, as amended, and Section 21E of the Securities Exchange Act of 1934, as amended, which statements involve risks and uncertainties, including but not limited to statements regarding our future growth, execution, product innovation and technological development, competitive position, and future financial and operating performance, including our financial outlook for the third quarter of fiscal year 2027 and our full fiscal year 2027; progress towards our long-term profitability targets; and general market trends. The words “believe,” “may,” “will,” “potentially,” “estimate,” “continue,” “anticipate,” “intend,” “could,” “would,” “project,” “target,” “plan,” “expect,” or the negative of these terms and similar expressions are intended to identify forward-looking statements. However, not all forward-looking statements contain these identifying words.
There are a significant number of factors that could cause our actual results to differ materially from statements made in this press release, including but not limited to: our limited operating history; our history of losses; intense competition in the market we compete in; fluctuations in our operating results; actual or perceived network or security incidents impacting us; actual or perceived defects, errors or vulnerabilities in our platform; our ability to successfully integrate any acquisitions and strategic investments; risks associated with managing our rapid growth; the growing prevalence of artificial intelligence (AI) and sophistication of AI models; general global, political,
economic, and macroeconomic climate, including but not limited to, the changes in U.S. federal spending and policies, including government shutdowns, significant political or regulatory developments or changes in trade policy, actual or perceived instability in the banking industry; supply chain disruptions; a potential recession, inflation, and interest rate volatility; geopolitical conflicts around the world; our ability to attract new and retain existing customers, or renew and expand our relationships with them; the ability of our platform to effectively interoperate within our customers’ IT infrastructure; disruptions or other business interruptions that affect the availability of our platform including cybersecurity incidents; the failure to timely develop and achieve market acceptance of new products and subscriptions as well as existing products, subscriptions and support offerings; rapidly evolving technological developments in the market for security products and subscription and support offerings; length of sales cycles; and risks of securities class action litigation.
Additional risks and uncertainties that could affect our financial results are included under the captions “Risk Factors” and “Management’s Discussion and Analysis of Financial Condition and Results of Operations” set forth in our filings and reports with the Securities and Exchange Commission (SEC), including our most recently filed Annual Report on Form 10-K, dated March 19, 2026, subsequent Quarterly Reports on Form 10-Q and other filings and reports that we may file from time to time with the SEC, copies of which are available on our website at investors.sentinelone.com and on the SEC’s website at www.sec.gov.
You should not rely on these forward-looking statements, as actual outcomes and results may differ materially from those contemplated by these forward-looking statements as a result of such risks and uncertainties. All forward-looking statements in this press release are based on information and estimates available to us as of the date hereof, and are based on current expectations, estimates, forecasts, and projections as well as the beliefs and assumptions of management. We do not assume any obligation to update the forward-looking statements provided to reflect events that occur or circumstances that exist after the date of this press release or to reflect new information or the occurrence of unexpected events, except as required by law. We may not actually achieve the plans, intentions, or expectations disclosed in our forward-looking statements, and you should not place undue reliance on our forward-looking statements.
Non-GAAP Financial Measures
In addition to our results being determined in accordance with GAAP, we believe the following non-GAAP measures are useful in evaluating our operating performance. We use the following non-GAAP financial information to evaluate our ongoing operations and for internal planning and forecasting purposes. We believe that non-GAAP financial information, when taken collectively, with the financial information presented in accordance with GAAP, may be helpful to investors because it provides consistency and comparability with past financial performance. However, non-GAAP financial information is presented for supplemental informational purposes only, has limitations as an analytical tool, and should not be considered in isolation or as a substitute for financial information presented in accordance with GAAP.
Other companies, including companies in our industry, may calculate similarly titled non-GAAP measures differently or may use other measures to evaluate their performance, all of which could reduce the usefulness of our non-GAAP financial measures as tools for comparison. In addition, the utility of free cash flow and adjusted free cash flow as a measure of our liquidity is limited as it does not represent the total increase or decrease in our cash balance for a given period.
Reconciliations between non-GAAP financial measures to the most directly comparable financial measure stated in accordance with GAAP are contained below. Investors are encouraged to review the related GAAP financial measures and the reconciliation of these non-GAAP financial measures to their most directly comparable GAAP financial measures and not rely on any single financial measure to evaluate our business.
As presented in the “Reconciliation of GAAP to Non-GAAP Financial Information” table below, each of the non-GAAP financial measures excludes one or more of the following items:
Stock-based compensation expense
Stock-based compensation expense is a non-cash expense that varies in amount from period to period and is dependent on market forces that are often beyond our control. As a result, management excludes this item from our internal operating forecasts and models. Management believes that non-GAAP measures adjusted for stock-based compensation expense provide investors with a basis to measure our core performance against the performance of other companies without the variability created by stock-based compensation as a result of the variety of equity awards used by other companies and the varying methodologies and assumptions used.
Employer payroll tax on employee stock transactions
Employer payroll tax expenses related to employee stock transactions are tied to the vesting or exercise of underlying equity awards and the price of our common stock at the time of vesting, which varies in amount from period to period and is dependent on market forces that are often beyond our control. As a result, management excludes this item from our internal operating forecasts and models. Management believes that non-GAAP measures adjusted for employer payroll taxes on employee stock transactions provide investors with a basis to measure our core performance against the performance of other companies without the variability created by employer payroll taxes on employee stock transactions as a result of the stock price at the time of employee exercise.
Amortization of acquired intangible assets
Amortization of acquired intangible assets expense is tied to the intangible assets that were acquired in conjunction with acquisitions, which results in non‑cash expenses that may not otherwise have been incurred. Management believes excluding the expense associated with intangible assets from non-GAAP measures allows for a more accurate assessment of our ongoing operations and provides investors with a better comparison of period-over-period operating results.
Acquisition-related compensation costs
Acquisition-related compensation costs include cash-based compensation expenses resulting from the employment retention of certain employees established in accordance with the terms of each acquisition. Acquisition-related cash-based compensation costs have been excluded as they were specifically negotiated as part of the acquisitions in order to retain such employees and relate to cash compensation that was made either in lieu of stock-based compensation or where the grant of stock-based compensation awards was not practicable. In most cases, these acquisition-related compensation costs are not factored into management’s evaluation of potential acquisitions or our performance after completion of acquisitions, because they are not related to our core operating performance. In addition, the frequency and amount of such charges can vary significantly based on the size and timing of acquisitions and the maturities of the businesses being acquired. Excluding acquisition-related compensation costs from non-GAAP measures provides investors with a basis to compare our results against those of other companies without the variability caused by purchase accounting.
Restructuring charges
Restructuring charges primarily relate to severance payments, employee benefits, stock-based compensation, contract termination charges, and asset impairment charges related to facilities. These restructuring charges are excluded from non-GAAP financial measures because they are the result of discrete events that are not considered core-operating activities. We believe that it is appropriate to exclude restructuring charges from non-GAAP financial measures because it enables the comparison of period-over-period operating results from continuing operations.
Gains and losses on strategic investments
Gains and losses on strategic investments relate to the subsequent changes in the recorded value of our strategic investments. These gains and losses are excluded from non-GAAP financial measures because they are the result of discrete events that are not considered core-operating activities. We believe that it is appropriate to exclude gains
and losses from strategic investments from non-GAAP financial measures because it enables the comparison of period-over-period net income (loss).
Provision for income taxes
Certain discrete tax items that are not indicative of our core operating performance are excluded from our non-GAAP results. During the six months ended July 31, 2026, these items primarily consist of interest expense accrued on our liability under the final Assessment Agreement (the Agreement) entered into with the Israeli Tax Authority (ITA). These exclusions provide investors with a clearer view of our underlying financial results and facilitate meaningful comparisons across reporting periods.
Effective in the first quarter of fiscal year 2027, we adopted a 17% non-GAAP tax rate for current and future reporting periods. This rate is subject to change based on shifts in our geographic earnings mix or changes in applicable tax law.
Dilutive shares applying the treasury stock method
During periods in which we incur a net loss under a GAAP basis, we exclude certain potential common stock equivalents from our GAAP diluted shares because their effect would have been anti-dilutive. In periods where we have net income on a non-GAAP basis, these common stock equivalents would have been dilutive. Accordingly, we have included the impact of these common stock equivalents in the calculation of our non-GAAP diluted net income per share applying the treasury stock method.
Non-GAAP Cost of Revenue, Non-GAAP Gross Profit, Non-GAAP Gross Margin, Non-GAAP Income from Operations, Non-GAAP Operating Margin, Non-GAAP Net Income, Non-GAAP Net Income Margin and Non-GAAP Net Income Per Share
We define these non-GAAP financial measures as their respective GAAP measures, excluding the expenses referenced above. We use these non-GAAP financial measures as part of our overall assessment of our performance, including the preparation of our annual operating budget and quarterly forecasts, to evaluate the effectiveness of our business strategies, and to communicate with our board of directors concerning our financial performance.
Free Cash Flow and Adjusted Free Cash Flow
We define free cash flow as cash (used in) provided by operating activities less purchases of property and equipment and capitalized internal-use software costs. We define adjusted free cash flow as free cash flow, excluding the impact of discrete cash income tax payments relating to the Agreement entered into with the ITA. We believe free cash flow and adjusted free cash flow are useful indicators of liquidity that provide our management, board of directors, and investors with information about our future ability to generate or use cash to enhance the strength of our balance sheet and further invest in our business and pursue potential strategic initiatives.
Key Business Metrics
We monitor the following key metrics to help us evaluate our business, identify trends affecting our business, formulate business plans, and make strategic decisions.
Annualized Recurring Revenue (ARR)
We believe that ARR is a key operating metric to measure our business because it is driven by our ability to acquire new subscription, consumption, and usage-based customers, and to maintain and expand our relationship with existing customers. ARR represents the annualized revenue run rate of our subscription, consumption and usage-based agreements at the end of a reporting period, assuming contracts are renewed on their existing terms for customers that are under contracts with us. ARR is not a forecast of future revenue, which can be impacted by contract start and end dates, usage, renewal rates, and other contractual terms.
Customers with ARR of $100,000 or More
We believe that our ability to increase the number of customers with ARR of $100,000 or more is an indicator of our market penetration and strategic demand for our platform. We define a customer as an entity that has an active subscription for access to our platform. We count Managed Service Providers, Managed Security Service Providers, Managed Detection & Response firms, and Original Equipment Manufacturers, who may purchase our products on behalf of multiple companies, as a single customer. We do not count our reseller or distributor channel partners as customers.
Contact:
Investor Relations:
Saad Nazir
investors@sentinelone.com
Press:
Craig VerColen
press@sentinelone.com
Source: SentinelOne
NYSE: S
Category: Investors
SENTINELONE, INC.
CONDENSED CONSOLIDATED BALANCE SHEETS
(in thousands)
(unaudited)
| July 31, | January 31, | ||||||||||
| 2026 | 2026 | ||||||||||
Assets | |||||||||||
Current assets: | |||||||||||
| Cash and cash equivalents | $ | 200,951 | $ | 169,627 | |||||||
Short-term investments | 454,297 | 459,041 | |||||||||
Accounts receivable, net | 219,893 | 289,079 | |||||||||
Deferred contract acquisition costs, current | 72,549 | 70,981 | |||||||||
Prepaid expenses and other current assets | 50,641 | 61,857 | |||||||||
Total current assets | 998,331 | 1,050,585 | |||||||||
Property and equipment, net | 88,663 | 84,008 | |||||||||
| Long-term investments | 157,998 | 140,898 | |||||||||
| Deferred contract acquisition costs, non-current | 86,016 | 89,659 | |||||||||
| Intangible assets, net | 108,145 | 129,548 | |||||||||
| Goodwill | 912,671 | 912,671 | |||||||||
| Other assets | 29,637 | 30,733 | |||||||||
Total assets | $ | 2,381,461 | $ | 2,438,102 | |||||||
| Liabilities and Stockholders’ Equity | |||||||||||
Current liabilities: | |||||||||||
| Accounts payable | $ | 8,933 | $ | 10,299 | |||||||
Accrued payroll and benefits | 85,387 | 79,006 | |||||||||
Deferred revenue, current | 500,547 | 549,790 | |||||||||
Accrued expenses and other current liabilities | 93,922 | 117,260 | |||||||||
Total current liabilities | 688,789 | 756,355 | |||||||||
| Deferred revenue, non-current | 77,014 | 83,277 | |||||||||
| Other liabilities | 167,154 | 161,325 | |||||||||
Total liabilities | 932,957 | 1,000,957 | |||||||||
| Stockholders’ equity: | |||||||||||
| Preferred stock | — | — | |||||||||
Class A common stock | 34 | 33 | |||||||||
| Class B common stock | 1 | 1 | |||||||||
| Additional paid-in capital | 3,695,877 | 3,513,017 | |||||||||
| Accumulated other comprehensive income | 376 | 2,314 | |||||||||
| Accumulated deficit | (2,247,784) | (2,078,220) | |||||||||
| Total stockholders’ equity | 1,448,504 | 1,437,145 | |||||||||
| Total liabilities and stockholders’ equity | $ | 2,381,461 | $ | 2,438,102 | |||||||
SENTINELONE, INC. CONDENSED CONSOLIDATED STATEMENTS OF OPERATIONS (in thousands, except share and per share data) (unaudited) | ||
Three Months Ended July 31, | Six Months Ended July 31, | ||||||||||||||||||||||
| 2026 | 2025 | 2026 | 2025 | ||||||||||||||||||||
Revenue | $ | 291,981 | $ | 242,183 | $ | 568,638 | $ | 471,212 | |||||||||||||||
Cost of revenue(1) | 81,563 | 60,474 | 159,528 | 117,006 | |||||||||||||||||||
| Gross profit | 210,418 | 181,709 | 409,110 | 354,206 | |||||||||||||||||||
| Operating expenses: | |||||||||||||||||||||||
Research and development(1) | 96,882 | 79,091 | 192,652 | 151,344 | |||||||||||||||||||
Sales and marketing(1) | 123,545 | 127,879 | 255,656 | 261,760 | |||||||||||||||||||
General and administrative(1) | 56,327 | 51,474 | 106,824 | 100,153 | |||||||||||||||||||
Restructuring(1) | 24,425 | 3,883 | 24,457 | 9,050 | |||||||||||||||||||
Total operating expenses | 301,179 | 262,327 | 579,589 | 522,307 | |||||||||||||||||||
| Loss from operations | (90,761) | (80,618) | (170,479) | (168,101) | |||||||||||||||||||
| Interest income, net | 6,151 | 12,196 | 12,978 | 24,486 | |||||||||||||||||||
| Other income (expense), net | (2,414) | (327) | 76 | 165 | |||||||||||||||||||
| Loss before income taxes | (87,024) | (68,749) | (157,425) | (143,450) | |||||||||||||||||||
| Provision for income taxes | 6,376 | 3,270 | 12,139 | 136,762 | |||||||||||||||||||
| Net loss | $ | (93,400) | $ | (72,019) | $ | (169,564) | $ | (280,212) | |||||||||||||||
Net loss per share attributable to Class A and Class B common stockholders, basic and diluted | $ | (0.27) | $ | (0.22) | $ | (0.50) | $ | (0.85) | |||||||||||||||
| Weighted-average shares used in computing net loss per share attributable to Class A and Class B common stockholders, basic and diluted | 341,527,623 | 330,938,421 | 339,301,479 | 329,481,933 | |||||||||||||||||||
(1) Includes stock-based compensation expense as follows: | |||||||||||||||||||||||
| Cost of revenue | $ | 6,199 | $ | 5,399 | $ | 12,094 | $ | 10,064 | |||||||||||||||
| Research and development | 28,401 | 24,289 | 57,349 | 45,230 | |||||||||||||||||||
| Sales and marketing | 21,472 | 21,338 | 41,757 | 44,253 | |||||||||||||||||||
| General and administrative | 25,221 | 22,858 | 44,982 | 43,028 | |||||||||||||||||||
| Restructuring | 10,821 | — | 10,821 | (36) | |||||||||||||||||||
| Total stock-based compensation expense | $ | 92,114 | $ | 73,884 | $ | 167,003 | $ | 142,539 | |||||||||||||||
SENTINELONE, INC.
CONDENSED CONSOLIDATED STATEMENTS OF CASH FLOWS
(in thousands)
(unaudited)
Six Months Ended July 31, | |||||||||||
| 2026 | 2025 | ||||||||||
CASH FLOW FROM OPERATING ACTIVITIES: | |||||||||||
| Net loss | $ | (169,564) | $ | (280,212) | |||||||
| Adjustments to reconcile net loss to net cash provided by operating activities: | |||||||||||
Depreciation and amortization | 35,808 | 23,117 | |||||||||
Amortization of deferred contract acquisition costs | 41,149 | 37,507 | |||||||||
Non-cash operating lease costs | 2,178 | 2,120 | |||||||||
| Stock-based compensation expense | 167,003 | 142,539 | |||||||||
| Change in fair value of derivative instruments and related foreign currency loss on tax liabilities, net | 2,438 | — | |||||||||
| Net (gain) loss on strategic investments | (5,058) | 3 | |||||||||
Accretion of discounts, and amortization of premiums on investments, net | (1,223) | (4,856) | |||||||||
| Asset impairment charges | 502 | 2,176 | |||||||||
Other | 361 | 277 | |||||||||
| Changes in operating assets and liabilities, net of effects of acquisitions: | |||||||||||
| Accounts receivable | 68,823 | 56,409 | |||||||||
| Prepaid expenses and other assets | (1,259) | 3,159 | |||||||||
Deferred contract acquisition costs | (39,074) | (36,076) | |||||||||
| Accounts payable | (1,022) | 1,547 | |||||||||
Accrued expenses and other liabilities | (16,921) | 144,040 | |||||||||
| Accrued payroll and benefits | 6,381 | (13,063) | |||||||||
| Operating lease liabilities | (3,068) | (2,119) | |||||||||
| Deferred revenue | (55,506) | (25,337) | |||||||||
| Net cash provided by operating activities | 31,948 | 51,231 | |||||||||
| CASH FLOW FROM INVESTING ACTIVITIES: | |||||||||||
| Purchases of property and equipment | (494) | (410) | |||||||||
Purchases of intangible assets | (112) | (100) | |||||||||
| Capitalization of internal-use software | (13,975) | (12,525) | |||||||||
| Purchases of investments | (260,446) | (208,090) | |||||||||
Proceeds from sales, maturities and return of capital of investments | 252,003 | 286,767 | |||||||||
| Cash paid for acquisitions, net of cash acquired | (952) | — | |||||||||
Net cash (used in) provided by investing activities | (23,976) | 65,642 | |||||||||
CASH FLOW FROM FINANCING ACTIVITIES: | |||||||||||
| Repurchases of common stock | — | (52,693) | |||||||||
Proceeds from exercise of stock options | 3,148 | 15,229 | |||||||||
| Proceeds from issuance of common stock under the employee stock purchase plan | 7,512 | 9,065 | |||||||||
Net cash provided by (used in) financing activities | 10,660 | (28,399) | |||||||||
NET CHANGE IN CASH, CASH EQUIVALENTS, AND RESTRICTED CASH | 18,632 | 88,474 | |||||||||
CASH, CASH EQUIVALENTS, AND RESTRICTED CASH–Beginning of period | 196,158 | 193,302 | |||||||||
CASH, CASH EQUIVALENTS, AND RESTRICTED CASH–End of period | $ | 214,790 | $ | 281,776 | |||||||
SENTINELONE, INC.
RECONCILIATION OF GAAP TO NON-GAAP FINANCIAL INFORMATION
(in thousands, except percentages and per share data)
(unaudited)
| Three Months Ended July 31, | Six Months Ended July 31, | ||||||||||||||||||||||
| 2026 | 2025 | 2026 | 2025 | ||||||||||||||||||||
| Cost of revenue reconciliation: | |||||||||||||||||||||||
| GAAP cost of revenue | $ | 81,563 | $ | 60,474 | $ | 159,528 | $ | 117,006 | |||||||||||||||
| Stock-based compensation expense | (6,199) | (5,399) | (12,094) | (10,064) | |||||||||||||||||||
| Employer payroll tax on employee stock transactions | (202) | (187) | (433) | (417) | |||||||||||||||||||
| Amortization of acquired intangible assets | (8,227) | (4,195) | (16,186) | (8,254) | |||||||||||||||||||
| Acquisition-related compensation | (5) | (17) | (10) | (37) | |||||||||||||||||||
| Non-GAAP cost of revenue | $ | 66,930 | $ | 50,676 | $ | 130,805 | $ | 98,234 | |||||||||||||||
| Gross profit reconciliation: | |||||||||||||||||||||||
| GAAP gross profit | $ | 210,418 | $ | 181,709 | $ | 409,110 | $ | 354,206 | |||||||||||||||
| Stock-based compensation expense | 6,199 | 5,399 | 12,094 | 10,064 | |||||||||||||||||||
| Employer payroll tax on employee stock transactions | 202 | 187 | 433 | 417 | |||||||||||||||||||
| Amortization of acquired intangible assets | 8,227 | 4,195 | 16,186 | 8,254 | |||||||||||||||||||
| Acquisition-related compensation | 5 | 17 | 10 | 37 | |||||||||||||||||||
| Non-GAAP gross profit | $ | 225,051 | $ | 191,507 | $ | 437,833 | $ | 372,978 | |||||||||||||||
| Gross margin reconciliation: | |||||||||||||||||||||||
| GAAP gross margin | 72 | % | 75 | % | 72 | % | 75 | % | |||||||||||||||
| Stock-based compensation expense | 2 | % | 2 | % | 2 | % | 2 | % | |||||||||||||||
| Employer payroll tax on employee stock transactions | — | % | — | % | — | % | — | % | |||||||||||||||
| Amortization of acquired intangible assets | 3 | % | 2 | % | 3 | % | 2 | % | |||||||||||||||
| Acquisition-related compensation | — | % | — | % | — | % | — | % | |||||||||||||||
| Non-GAAP gross margin | 77 | % | 79 | % | 77 | % | 79 | % | |||||||||||||||
| Research and development expense reconciliation: | |||||||||||||||||||||||
| GAAP research and development expense | $ | 96,882 | $ | 79,091 | $ | 192,652 | $ | 151,344 | |||||||||||||||
| Stock-based compensation expense | (28,401) | (24,289) | (57,349) | (45,230) | |||||||||||||||||||
| Employer payroll tax on employee stock transactions | (277) | (211) | (668) | (742) | |||||||||||||||||||
| Acquisition-related compensation | (2,321) | (667) | (4,560) | (1,341) | |||||||||||||||||||
| Non-GAAP research and development expense | $ | 65,883 | $ | 53,924 | $ | 130,075 | $ | 104,031 | |||||||||||||||
| Sales and marketing expense reconciliation: | |||||||||||||||||||||||
| GAAP sales and marketing expense | $ | 123,545 | $ | 127,879 | $ | 255,656 | $ | 261,760 | |||||||||||||||
| Stock-based compensation expense | (21,472) | (21,338) | (41,757) | (44,253) | |||||||||||||||||||
| Employer payroll tax on employee stock transactions | (620) | (487) | (1,091) | (1,179) | |||||||||||||||||||
| Amortization of acquired intangible assets | (2,553) | (2,253) | (5,022) | (4,433) | |||||||||||||||||||
| Acquisition-related compensation | (1,023) | (8) | (2,102) | (25) | |||||||||||||||||||
| Non-GAAP sales and marketing expense | $ | 97,877 | $ | 103,793 | $ | 205,684 | $ | 211,870 | |||||||||||||||
SENTINELONE, INC.
RECONCILIATION OF GAAP TO NON-GAAP FINANCIAL INFORMATION
(in thousands, except percentages and per share data)
(unaudited)
| General and administrative expense reconciliation: | |||||||||||||||||||||||
| GAAP general and administrative expense | $ | 56,327 | $ | 51,474 | $ | 106,824 | $ | 100,153 | |||||||||||||||
| Stock-based compensation expense | (25,221) | (22,858) | (44,982) | (43,028) | |||||||||||||||||||
| Employer payroll tax on employee stock transactions | (343) | (202) | (841) | (1,497) | |||||||||||||||||||
| Non-GAAP general and administrative expense | $ | 30,763 | $ | 28,414 | $ | 61,001 | $ | 55,628 | |||||||||||||||
| Restructuring expense reconciliation: | |||||||||||||||||||||||
| GAAP restructuring expense | $ | 24,425 | $ | 3,883 | $ | 24,457 | $ | 9,050 | |||||||||||||||
| Stock-based compensation expense | (10,821) | — | (10,821) | 36 | |||||||||||||||||||
| Other restructuring charges | (13,604) | (3,883) | (13,636) | (9,086) | |||||||||||||||||||
| Non-GAAP restructuring expense | $ | — | $ | — | $ | — | $ | — | |||||||||||||||
| Operating loss reconciliation: | |||||||||||||||||||||||
| GAAP operating loss | $ | (90,761) | $ | (80,618) | $ | (170,479) | $ | (168,101) | |||||||||||||||
| Stock-based compensation expense | 92,114 | 73,884 | 167,003 | 142,539 | |||||||||||||||||||
| Employer payroll tax on employee stock transactions | 1,442 | 1,087 | 3,033 | 3,835 | |||||||||||||||||||
| Amortization of acquired intangible assets | 10,780 | 6,448 | 21,208 | 12,687 | |||||||||||||||||||
| Acquisition-related compensation | 3,349 | 692 | 6,672 | 1,403 | |||||||||||||||||||
| Other restructuring charges | 13,604 | 3,883 | 13,636 | 9,086 | |||||||||||||||||||
| Non-GAAP operating income | $ | 30,528 | $ | 5,376 | $ | 41,073 | $ | 1,449 | |||||||||||||||
| Operating margin reconciliation: | |||||||||||||||||||||||
| GAAP operating margin | (31) | % | (33) | % | (30) | % | (36) | % | |||||||||||||||
| Stock-based compensation expense | 32 | % | 31 | % | 29 | % | 30 | % | |||||||||||||||
| Employer payroll tax on employee stock transactions | — | % | — | % | 1 | % | 1 | % | |||||||||||||||
| Amortization of acquired intangible assets | 4 | % | 3 | % | 4 | % | 3 | % | |||||||||||||||
| Acquisition-related compensation | 1 | % | — | % | 1 | % | — | % | |||||||||||||||
| Other restructuring charges | 5 | % | 2 | % | 2 | % | 2 | % | |||||||||||||||
| Non-GAAP operating margin* | 10 | % | 2 | % | 7 | % | — | % | |||||||||||||||
| Provision for income taxes reconciliation: | |||||||||||||||||||||||
| GAAP provision for income taxes | $ | 6,376 | $ | 3,270 | $ | 12,139 | $ | 136,762 | |||||||||||||||
| Income tax adjustments | (534) | — | (3,798) | (131,283) | |||||||||||||||||||
Non-GAAP provision for income taxes (1) | $ | 5,842 | $ | 3,270 | $ | 8,341 | $ | 5,479 | |||||||||||||||
| Net income (loss) reconciliation: | |||||||||||||||||||||||
| GAAP net loss | $ | (93,400) | $ | (72,019) | $ | (169,564) | $ | (280,212) | |||||||||||||||
| Stock-based compensation expense | 92,114 | 73,884 | 167,003 | 142,539 | |||||||||||||||||||
| Employer payroll tax on employee stock transactions | 1,442 | 1,087 | 3,033 | 3,835 | |||||||||||||||||||
SENTINELONE, INC.
RECONCILIATION OF GAAP TO NON-GAAP FINANCIAL INFORMATION (CONTINUED)
(in thousands, except percentages and per share data)
(unaudited)
| Amortization of acquired intangible assets | 10,780 | 6,448 | 21,208 | 12,687 | |||||||||||||||||||
| Acquisition-related compensation | 3,349 | 692 | 6,672 | 1,403 | |||||||||||||||||||
| Other restructuring charges | 13,604 | 3,883 | 13,636 | 9,086 | |||||||||||||||||||
| Net (gain) loss on strategic investments | 50 | (795) | (5,058) | (792) | |||||||||||||||||||
Provision for income taxes (1) | 534 | — | 3,798 | 131,283 | |||||||||||||||||||
Non-GAAP net income | $ | 28,473 | $ | 13,180 | $ | 40,728 | $ | 19,829 | |||||||||||||||
| Net income (loss) margin reconciliation: | |||||||||||||||||||||||
GAAP net loss margin | (32) | % | (30) | % | (30) | % | (59) | % | |||||||||||||||
| Stock-based compensation expense | 32 | % | 31 | % | 29 | % | 30 | % | |||||||||||||||
| Employer payroll tax on employee stock transactions | — | % | — | % | 1 | % | 1 | % | |||||||||||||||
| Amortization of acquired intangible assets | 4 | % | 3 | % | 4 | % | 3 | % | |||||||||||||||
| Acquisition-related compensation | 1 | % | — | % | 1 | % | — | % | |||||||||||||||
| Other restructuring charges | 5 | % | 2 | % | 2 | % | 2 | % | |||||||||||||||
| Net (gain) loss on strategic investments | — | % | — | % | (1) | % | — | % | |||||||||||||||
Provision for income taxes (1) | — | % | — | % | 1 | % | 28 | % | |||||||||||||||
Non-GAAP net income margin* | 10 | % | 5 | % | 7 | % | 4 | % | |||||||||||||||
| GAAP basic and diluted shares | 341,527,623 | 330,938,421 | 339,301,479 | 329,481,933 | |||||||||||||||||||
| Dilutive shares under the treasury stock method | 14,370,524 | 9,074,635 | 9,685,516 | 10,212,588 | |||||||||||||||||||
| Non-GAAP diluted shares | 355,898,147 | 340,013,056 | 348,986,995 | 339,694,521 | |||||||||||||||||||
| Diluted EPS reconciliation: | |||||||||||||||||||||||
| GAAP net loss per share, basic and diluted | $ | (0.27) | $ | (0.22) | $ | (0.50) | $ | (0.85) | |||||||||||||||
| Stock-based compensation expense | 0.26 | 0.22 | 0.48 | 0.42 | |||||||||||||||||||
| Employer payroll tax on employee stock transactions | — | — | 0.01 | 0.01 | |||||||||||||||||||
| Amortization of acquired intangible assets | 0.03 | 0.02 | 0.06 | 0.04 | |||||||||||||||||||
| Acquisition-related compensation | 0.01 | — | 0.02 | — | |||||||||||||||||||
| Other restructuring charges | 0.04 | 0.01 | 0.04 | 0.03 | |||||||||||||||||||
| Net (gain) loss on strategic investments | — | — | (0.01) | — | |||||||||||||||||||
Provision for income taxes (1) | — | — | 0.01 | 0.39 | |||||||||||||||||||
Adjustment to fully diluted earnings per share (2) | 0.01 | 0.01 | 0.01 | 0.02 | |||||||||||||||||||
| Non-GAAP net income per share, diluted | $ | 0.08 | $ | 0.04 | $ | 0.12 | $ | 0.06 | |||||||||||||||
*Certain figures may not sum due to rounding.
(1) Effective in the first quarter of fiscal year 2027, we adopted a long-term projected non-GAAP tax rate of 17% to calculate non-GAAP net income. The projected rate reflects our expectations of its long-term tax structure and jurisdictional mix of income.
(2) For periods in which we had diluted non-GAAP net income per share, the sum of the impact of individual reconciling items may not total to diluted non-GAAP net income per share because the basic share counts used to calculate GAAP net loss per share differ from the diluted share counts used to calculate non-GAAP net income per share, and because of rounding differences. The GAAP net loss per share calculation uses a lower share count as it excludes dilutive shares which are included in calculating the non-GAAP net income per share.
SENTINELONE, INC.
SELECTED CASH FLOW INFORMATION
(in thousands)
(unaudited)
Reconciliation of cash (used in) provided by operating activities to free cash flow and adjusted free cash flow:
| Three Months Ended July 31, | Six Months Ended July 31, | ||||||||||||||||||||||
| 2026 | 2025 | 2026 | 2025 | ||||||||||||||||||||
| GAAP net cash (used in) provided by operating activities | $ | (6,545) | $ | (1,043) | $ | 31,948 | $ | 51,231 | |||||||||||||||
| Less: Purchases of property and equipment | (70) | (264) | (494) | (410) | |||||||||||||||||||
| Less: Capitalized internal-use software | (6,621) | (5,841) | (13,975) | (12,525) | |||||||||||||||||||
| Free cash flow | (13,236) | (7,148) | 17,479 | 38,296 | |||||||||||||||||||
| Add: Cash income tax payments relating to the ITA Agreement | — | — | 30,658 | — | |||||||||||||||||||
| Adjusted free cash flow | $ | (13,236) | $ | (7,148) | $ | 48,137 | $ | 38,296 | |||||||||||||||
| Net cash provided by (used in) investing activities | $ | 39,909 | $ | 131,234 | $ | (23,976) | $ | 65,642 | |||||||||||||||
| Net cash provided by (used in) financing activities | $ | 9,778 | $ | (40,676) | $ | 10,660 | $ | (28,399) | |||||||||||||||
| Operating cash flow margin | (2) | % | 0 | % | 6 | % | 11 | % | |||||||||||||||
| Free cash flow margin | (5) | % | (3) | % | 3 | % | 8 | % | |||||||||||||||
| Adjusted free cash flow margin | (5) | % | (3) | % | 8 | % | 8 | % | |||||||||||||||

1 Q2 FY2027 Earnings Presentation August 27, 2026
2SentinelOne® Safe Harbor This presentation includes express and implied “forward-looking statements”, including forward-looking statements within the meaning of the Private Securities Litigation Reform Act of 1995. Forward-looking statements include all statements that are not historical facts, and in some cases, can be identified by terms such as “anticipate,” “believe,” “can,” “continue,” “could,” “estimate,” “expect,” “intend,” “may,” “might,” “plan,” “potential,” “predict,” “project,” “should,” “will,” “would,” or the negative of these terms, and similar expressions that concern our expectations, strategy, plans or intentions. Forward-looking statements contained in this presentation include, but are not limited to, statements concerning our estimates of market size and opportunity, our strategic plans or objectives, our growth prospects, projections (including our long-term model), actual or perceived defects, errors or vulnerabilities in our platform; our ability to successfully integrate any acquisitions and strategic investments; risks associated with managing our rapid growth; general global political, economic, and macroeconomic climate, intense competition in the market we compete in, fluctuations in our operating results, our ability to attract new and retain existing customers, or renew and expand our relationships with them; the ability of our platform to effectively interoperate within our customers’ IT infrastructure; disruptions or other business interruptions that affect the availability of our platform including cybersecurity incidents; the failure to timely develop and achieve market acceptance of new products and subscriptions as well as existing products, subscriptions and support offerings; rapidly evolving technological developments in the market for security products and subscription and support offerings; length of sales cycles; and risks of securities class action litigation. By their nature, these statements are subject to numerous risks and uncertainties, including factors beyond our control, that could cause actual results, performance or achievement to differ materially and adversely from those anticipated or implied in the statements. Such risks and uncertainties are described in the “Risk Factors” of our most recent Form 10-K, most recent Form 10-Q, and subsequent filings with the Securities and Exchange Commission. Although our management believes that the expectations reflected in our statements are reasonable, we cannot guarantee that the future results, levels of activity, performance or events and circumstances described in the forward-looking statements will be achieved or occur. Recipients are cautioned not to place undue reliance on these forward-looking statements, which speak only as of the date such statements are made and should not be construed as statements of fact. Except to the extent required by federal securities laws, we undertake no obligation to update these forward-looking statements to reflect events or circumstances after the date hereof, or to reflect the occurrence of unanticipated events. Certain information contained in this presentation and statements made orally during this presentation relate to or are based on studies, publications, surveys and other data obtained from third-party sources and SentinelOne’s own internal estimates and research. While SentinelOne believes these third-party studies, publications, surveys and other data to be reliable as of the date of this presentation, it has not independently verified, and makes no representations as to the adequacy, fairness, accuracy or completeness of, any information obtained from third-party sources. In addition, no independent source has evaluated the reasonableness or accuracy of SentinelOne’s internal estimates or research and no reliance should be made on any information or statements made in this presentation relating to or based on such internal estimates and research.
3SentinelOne® Financial Information Use of Non-GAAP Financial Measures In addition to our results determined in accordance with U.S. generally accepted accounting principles (“GAAP”), we believe non-GAAP measures used in this presentation, such as non-GAAP Gross Margin, non-GAAP Operating Margin, non-GAAP Net Income Margin, Free Cash Flow Margin, and Adjusted Free Cash Flow Margin are useful in evaluating our operating performance. We use such non-GAAP financial information to evaluate our ongoing operations and for internal planning and forecasting purposes. We believe that non-GAAP financial information, when taken collectively, may be helpful to investors because it provides consistency and comparability with past financial performance. However, non-GAAP financial information is presented for supplemental informational purposes only, has limitations as an analytical tool, and should not be considered in isolation or as a substitute for financial information presented in accordance with GAAP. Other companies, including companies in our industry, may calculate similarly titled non-GAAP measures differently or may use other measures to evaluate their performance, all of which could reduce the usefulness of our non-GAAP financial measures as tools for comparison. In addition, the utility of Free Cash Flow Margin and Adjusted Free Cash Flow Margin as a measure of our liquidity are limited as it does not represent the total increase or decrease in our cash balance for a given period. Investors are encouraged to review the related GAAP financial measures and the reconciliation of these non-GAAP financial measures to their most directly comparable GAAP financial measures and not rely on any single financial measure to evaluate our business. Please see the appendix included at the end of this presentation for a discussion of non-GAAP financial measures and a reconciliation of historical non-GAAP measures to historical GAAP measures. Our Fiscal Year Our fiscal year end is January 31, and our fiscal quarters end on April 30, July 31, October 31 and January 31.
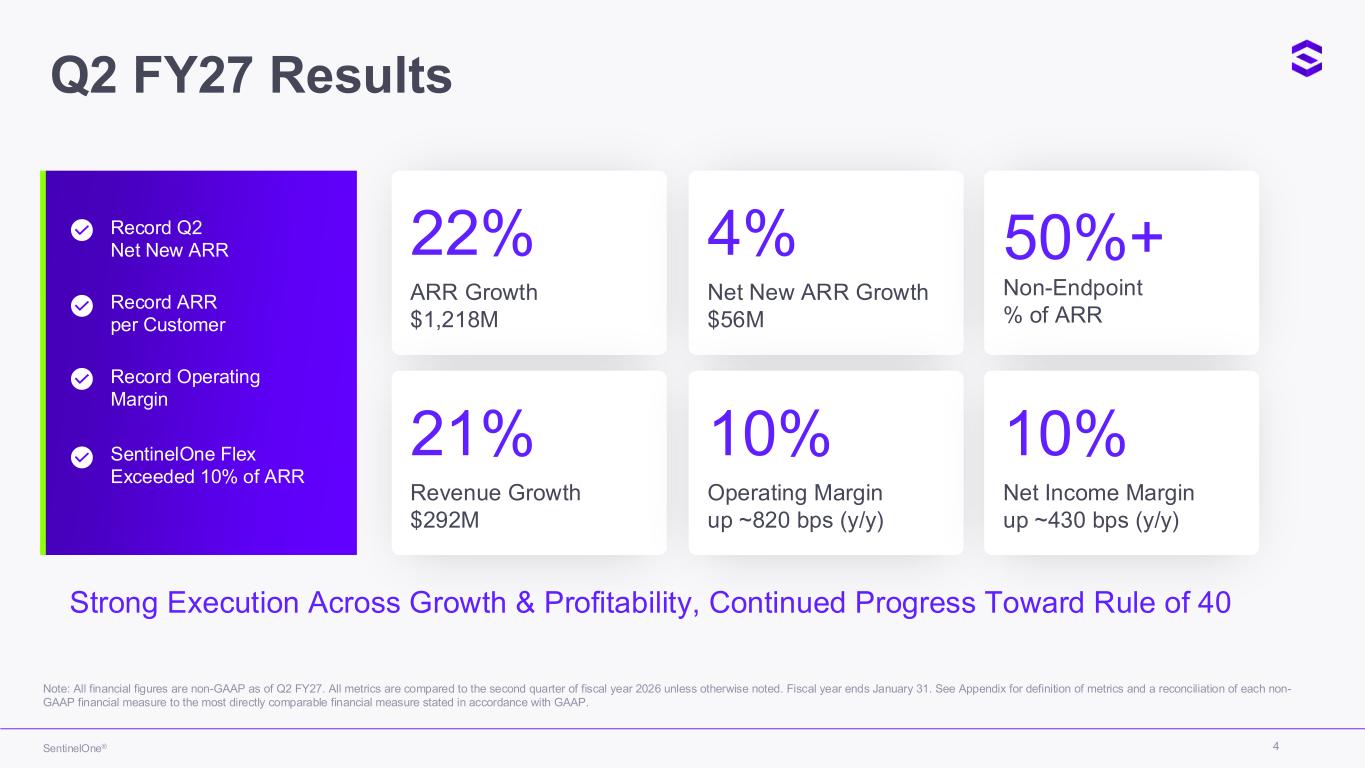
4SentinelOne® Note: All financial figures are non-GAAP as of Q2 FY27. All metrics are compared to the second quarter of fiscal year 2026 unless otherwise noted. Fiscal year ends January 31. See Appendix for definition of metrics and a reconciliation of each non- GAAP financial measure to the most directly comparable financial measure stated in accordance with GAAP. Strong Execution Across Growth & Profitability, Continued Progress Toward Rule of 40 Record Q2 Net New ARR Record ARR per Customer Record Operating Margin SentinelOne Flex Exceeded 10% of ARR 22% ARR Growth $1,218M 4% Net New ARR Growth $56M 50%+ Non-Endpoint % of ARR 21% Revenue Growth $292M 10% Operating Margin up ~820 bps (y/y) 10% Net Income Margin up ~430 bps (y/y) Q2 FY27 Results
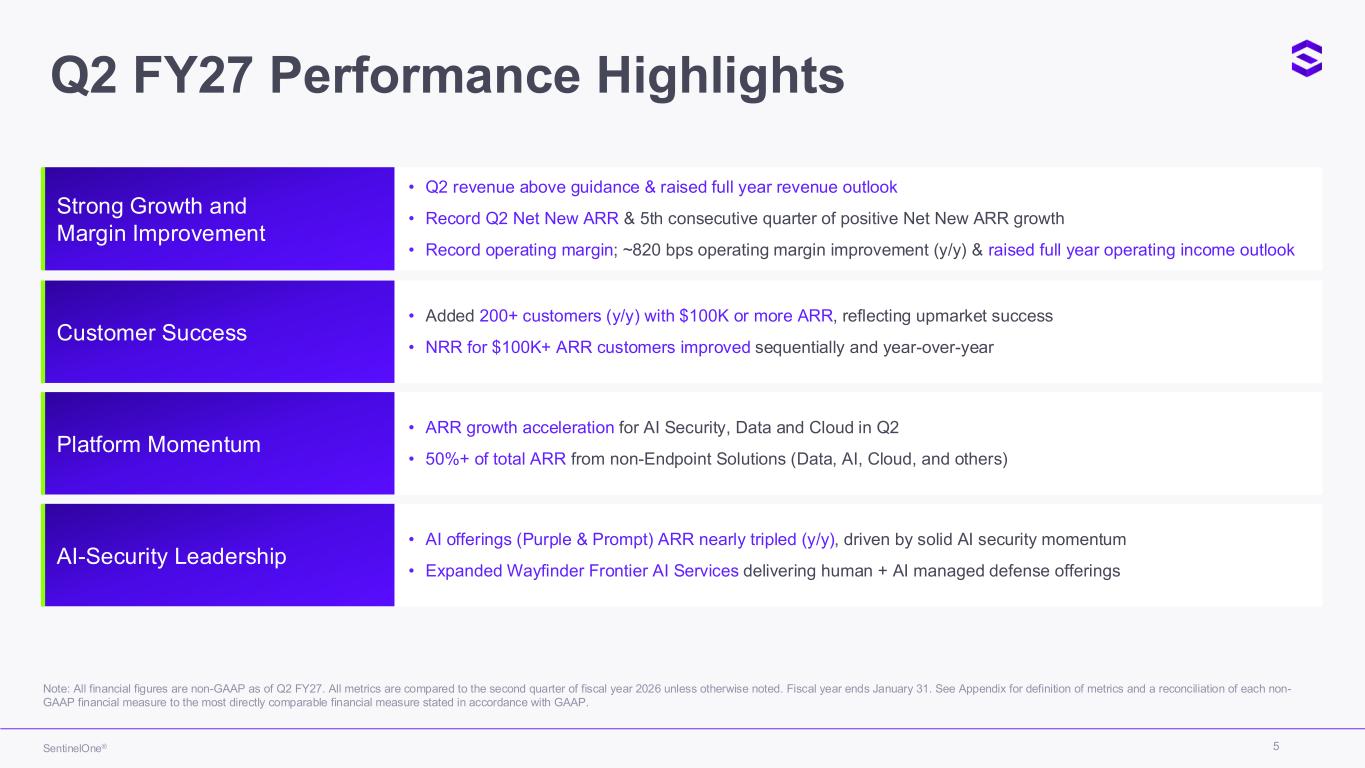
5SentinelOne® Strong Growth and Margin Improvement • Q2 revenue above guidance & raised full year revenue outlook • Record Q2 Net New ARR & 5th consecutive quarter of positive Net New ARR growth • Record operating margin; ~820 bps operating margin improvement (y/y) & raised full year operating income outlook Customer Success • Added 200+ customers (y/y) with $100K or more ARR, reflecting upmarket success • NRR for $100K+ ARR customers improved sequentially and year-over-year Platform Momentum • ARR growth acceleration for AI Security, Data and Cloud in Q2 • 50%+ of total ARR from non-Endpoint Solutions (Data, AI, Cloud, and others) AI-Security Leadership • AI offerings (Purple & Prompt) ARR nearly tripled (y/y), driven by solid AI security momentum • Expanded Wayfinder Frontier AI Services delivering human + AI managed defense offerings Note: All financial figures are non-GAAP as of Q2 FY27. All metrics are compared to the second quarter of fiscal year 2026 unless otherwise noted. Fiscal year ends January 31. See Appendix for definition of metrics and a reconciliation of each non- GAAP financial measure to the most directly comparable financial measure stated in accordance with GAAP. Q2 FY27 Performance Highlights
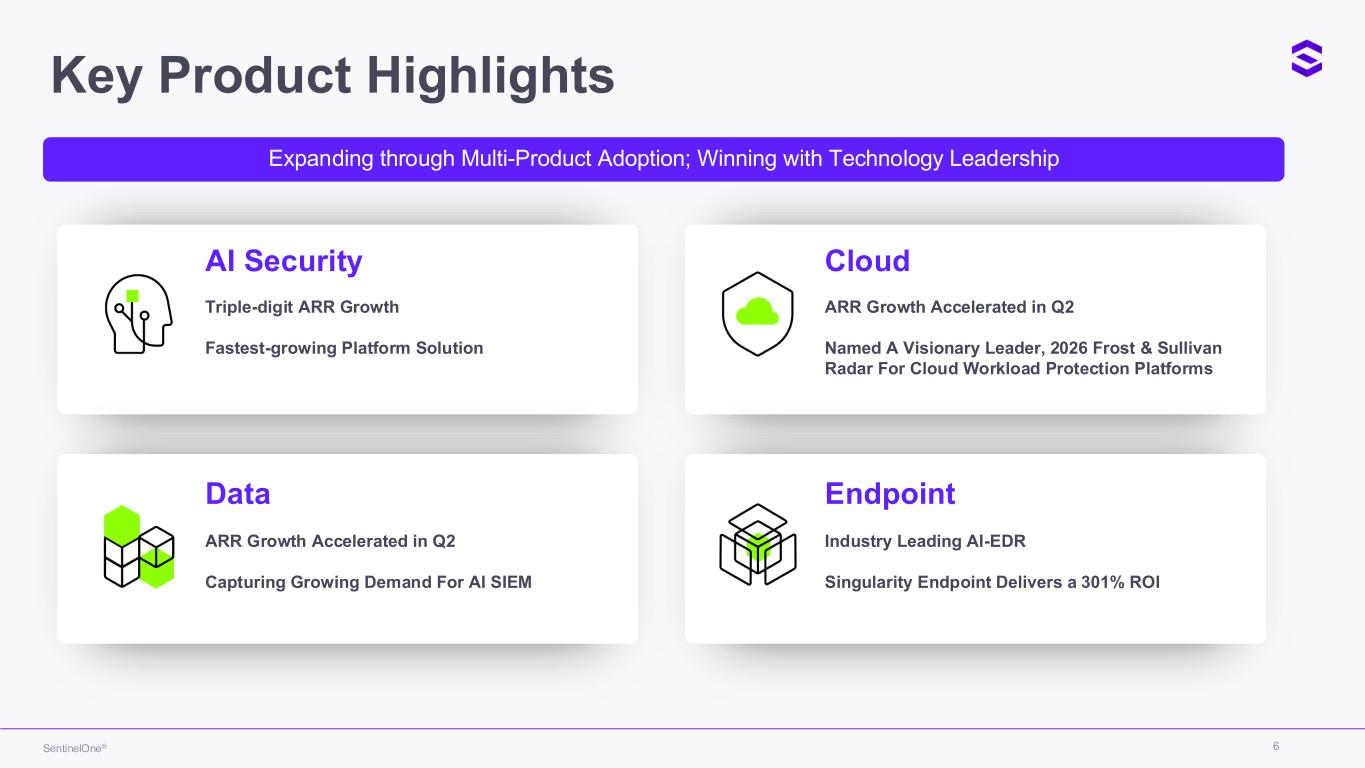
6SentinelOne® Triple-digit ARR Growth Fastest-growing Platform Solution AI Security Cloud ARR Growth Accelerated in Q2 Capturing Growing Demand For AI SIEM Data Endpoint Key Product Highlights Expanding through Multi-Product Adoption; Winning with Technology Leadership ARR Growth Accelerated in Q2 Named A Visionary Leader, 2026 Frost & Sullivan Radar For Cloud Workload Protection Platforms Industry Leading AI-EDR Singularity Endpoint Delivers a 301% ROI

7 Singularity Platform & Market Opportunity
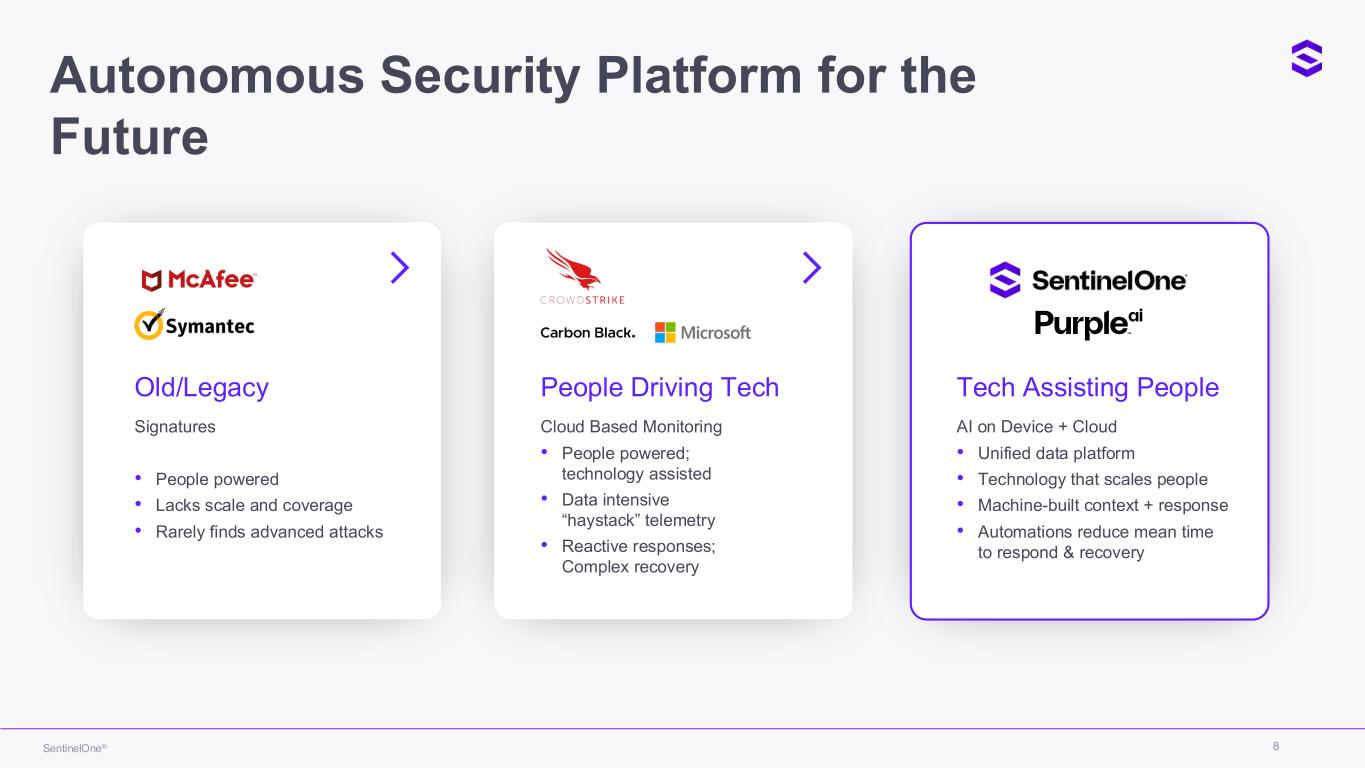
8SentinelOne® Signatures • People powered • Lacks scale and coverage • Rarely finds advanced attacks Old/Legacy Cloud Based Monitoring • People powered; technology assisted • Data intensive “haystack” telemetry • Reactive responses; Complex recovery People Driving Tech AI on Device + Cloud • Unified data platform • Technology that scales people • Machine-built context + response • Automations reduce mean time to respond & recovery Tech Assisting People Autonomous Security Platform for the Future
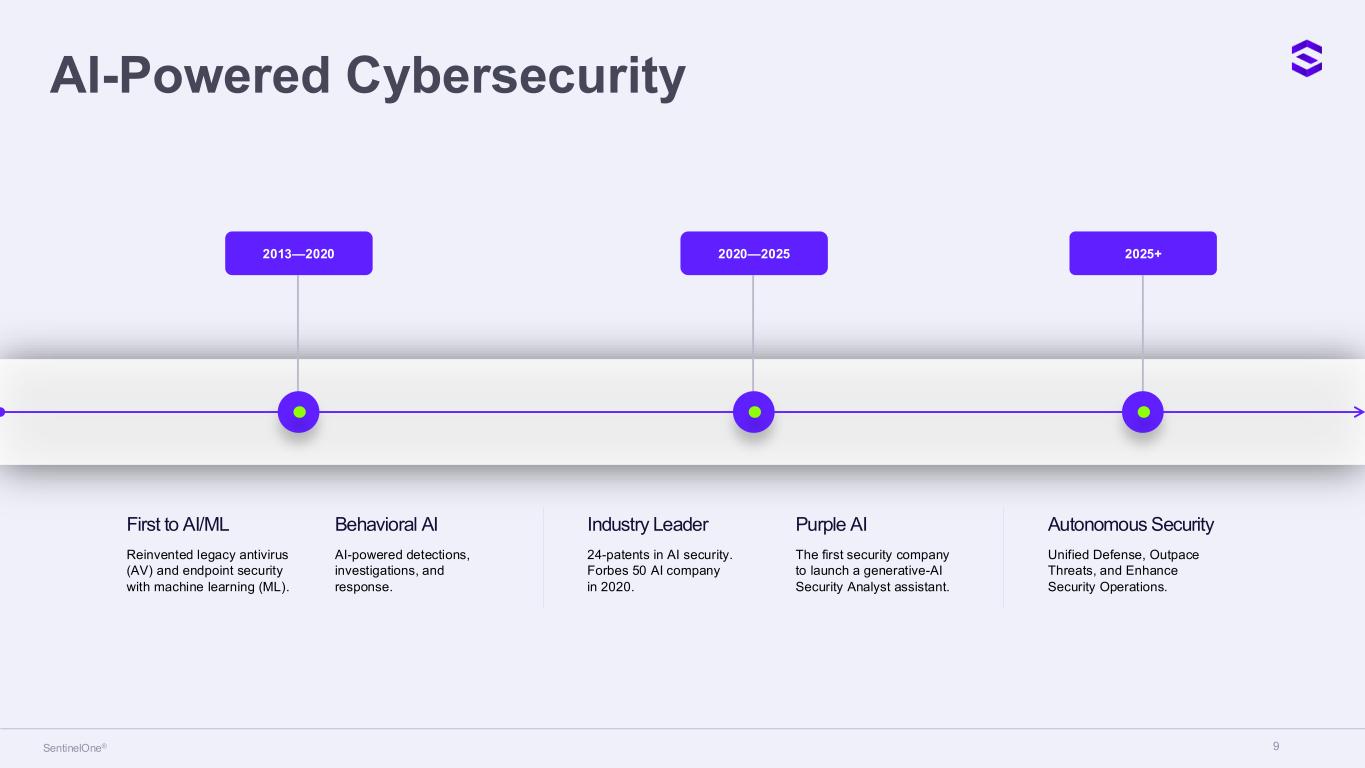
9SentinelOne® 2013—2020 Reinvented legacy antivirus (AV) and endpoint security with machine learning (ML). First to AI/ML Behavioral AI AI-powered detections, investigations, and response. 2020—2025 Industry Leader 24-patents in AI security. Forbes 50 AI company in 2020. Purple AI The first security company to launch a generative-AI Security Analyst assistant. 2025+ Autonomous Security Unified Defense, Outpace Threats, and Enhance Security Operations. AI-Powered Cybersecurity
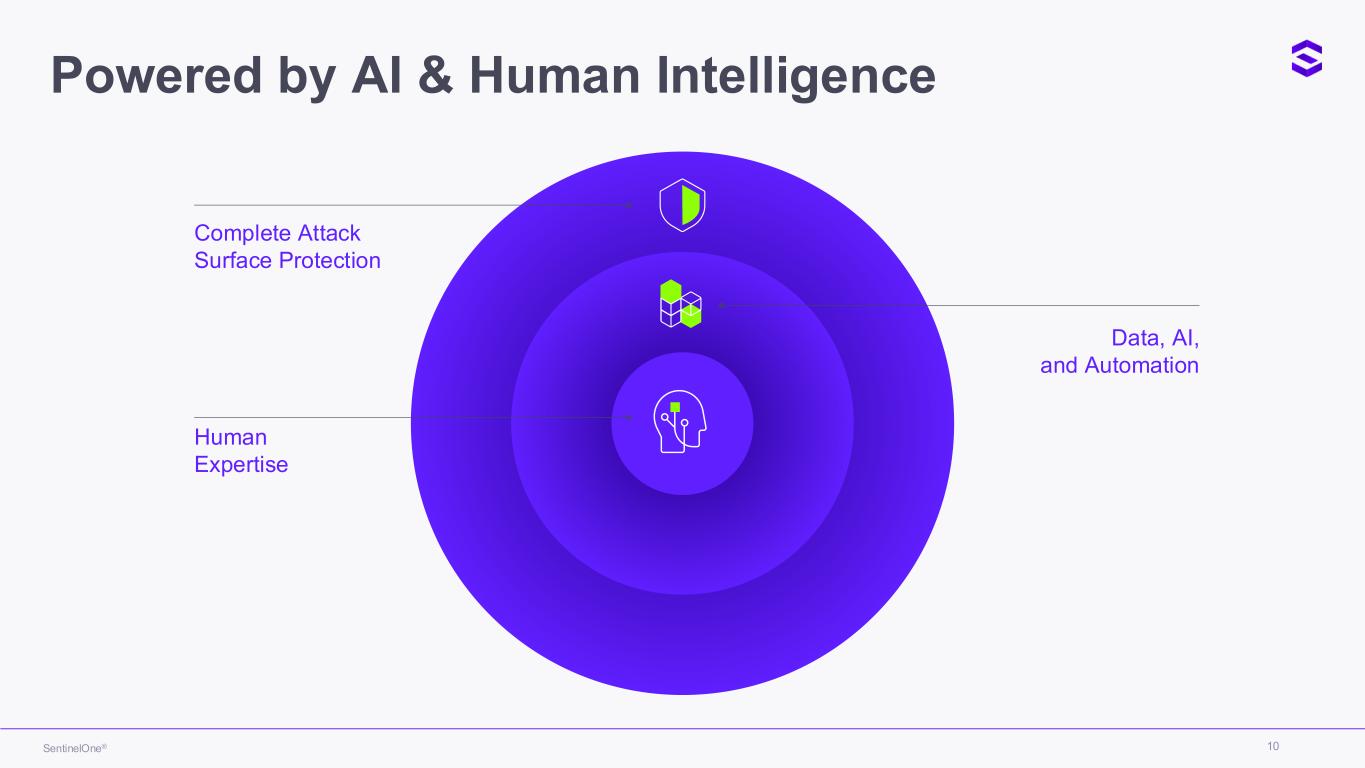
10SentinelOne® Complete Attack Surface Protection Data, AI, and Automation Human Expertise Powered by AI & Human Intelligence
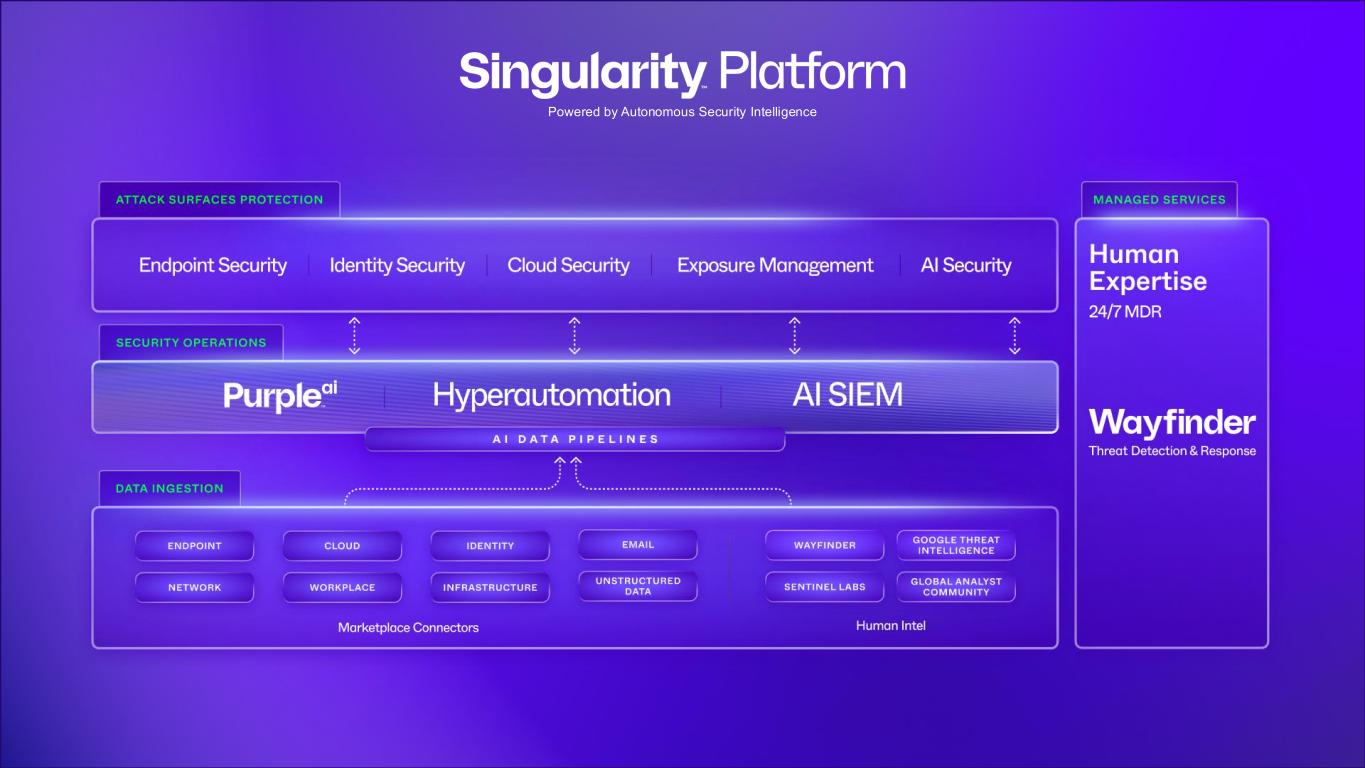
11 Powered by Autonomous Security Intelligence
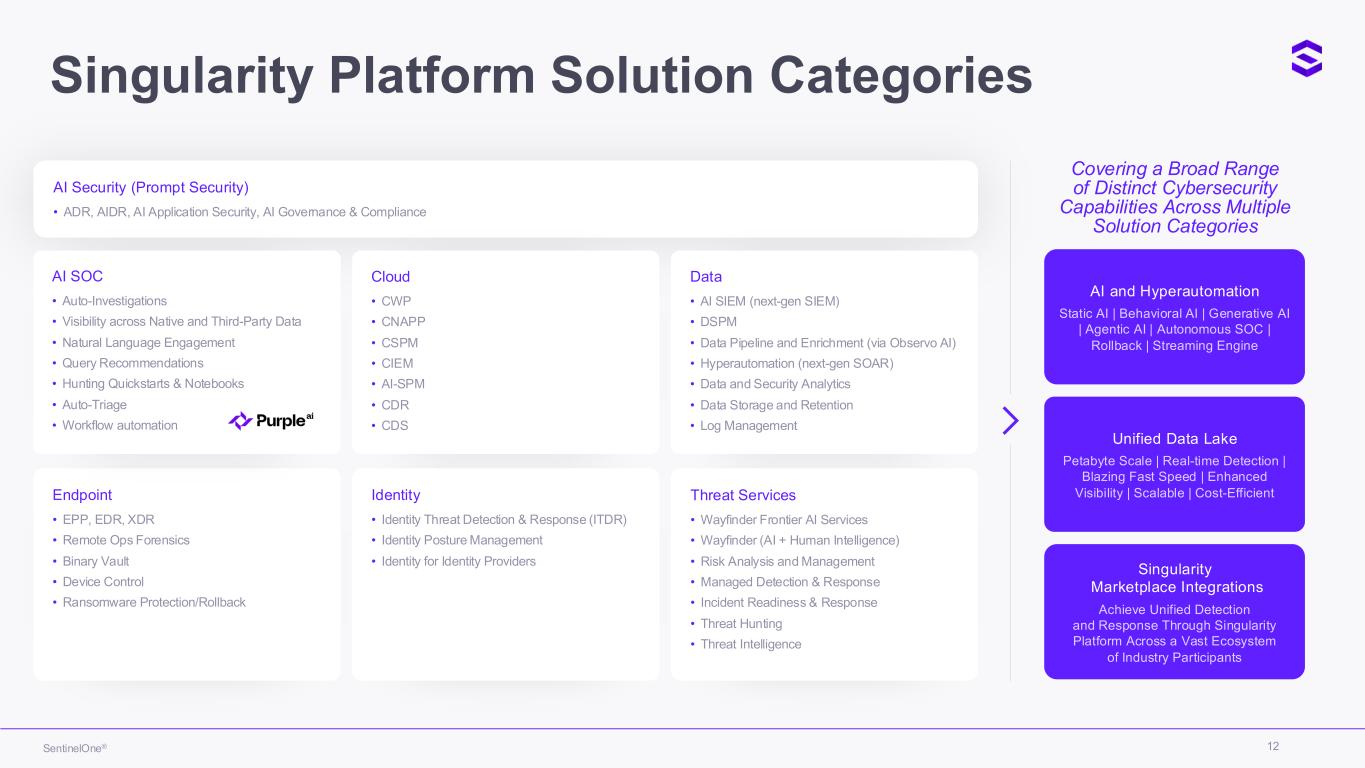
12SentinelOne® AI and Hyperautomation Covering a Broad Range of Distinct Cybersecurity Capabilities Across Multiple Solution Categories Unified Data Lake Singularity Marketplace Integrations AI Security (Prompt Security) • ADR, AIDR, AI Application Security, AI Governance & Compliance Cloud • CWP • CNAPP • CSPM • CIEM • AI-SPM • CDR • CDS Endpoint • EPP, EDR, XDR • Remote Ops Forensics • Binary Vault • Device Control • Ransomware Protection/Rollback Data • AI SIEM (next-gen SIEM) • DSPM • Data Pipeline and Enrichment (via Observo AI) • Hyperautomation (next-gen SOAR) • Data and Security Analytics • Data Storage and Retention • Log Management Identity • Identity Threat Detection & Response (ITDR) • Identity Posture Management • Identity for Identity Providers Threat Services • Wayfinder Frontier AI Services • Wayfinder (AI + Human Intelligence) • Risk Analysis and Management • Managed Detection & Response • Incident Readiness & Response • Threat Hunting • Threat Intelligence AI SOC • Auto-Investigations • Visibility across Native and Third-Party Data • Natural Language Engagement • Query Recommendations • Hunting Quickstarts & Notebooks • Auto-Triage • Workflow automation Singularity Platform Solution Categories
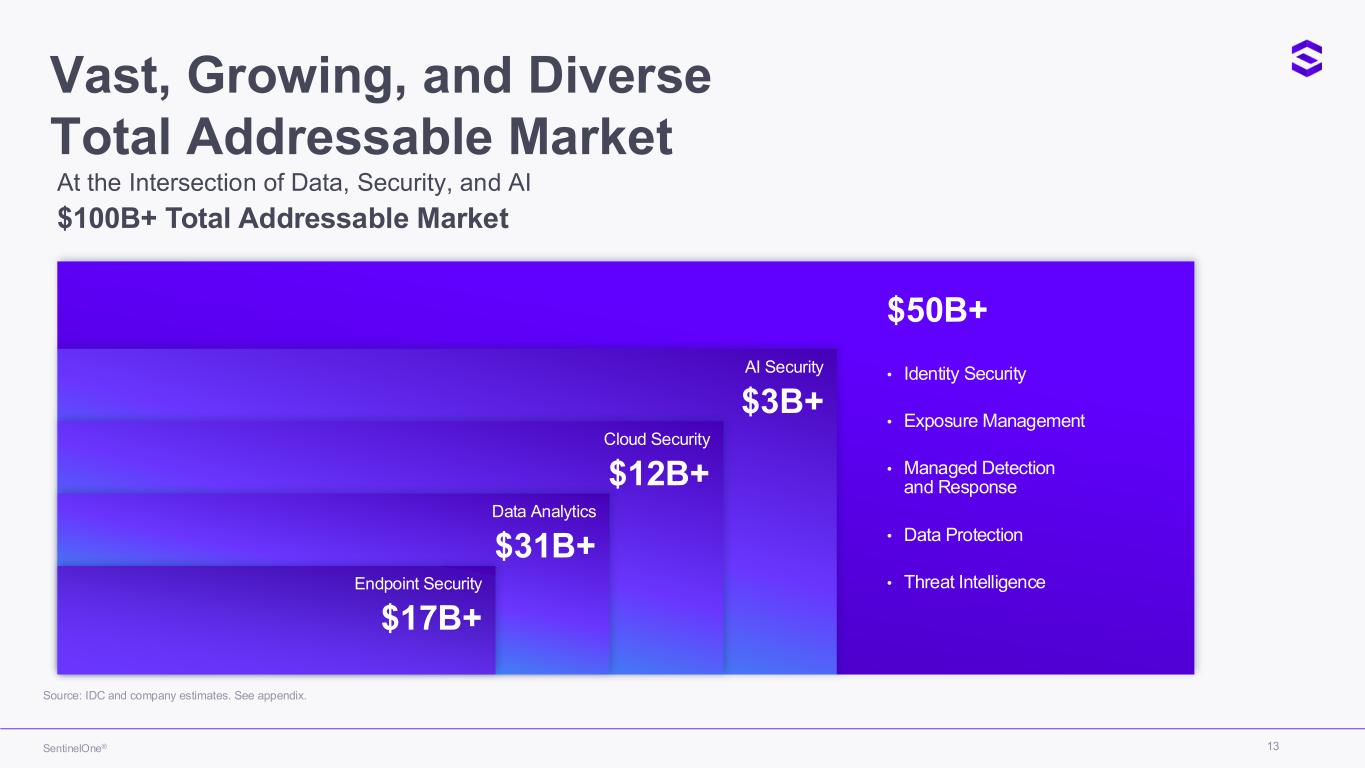
13SentinelOne® Cloud Security $12B+ Data Analytics $31B+ Endpoint Security $17B+ AI Security $3B+ $50B+ • Identity Security • Exposure Management • Managed Detection and Response • Data Protection • Threat Intelligence At the Intersection of Data, Security, and AI Source: IDC and company estimates. See appendix. $100B+ Total Addressable Market Vast, Growing, and Diverse Total Addressable Market
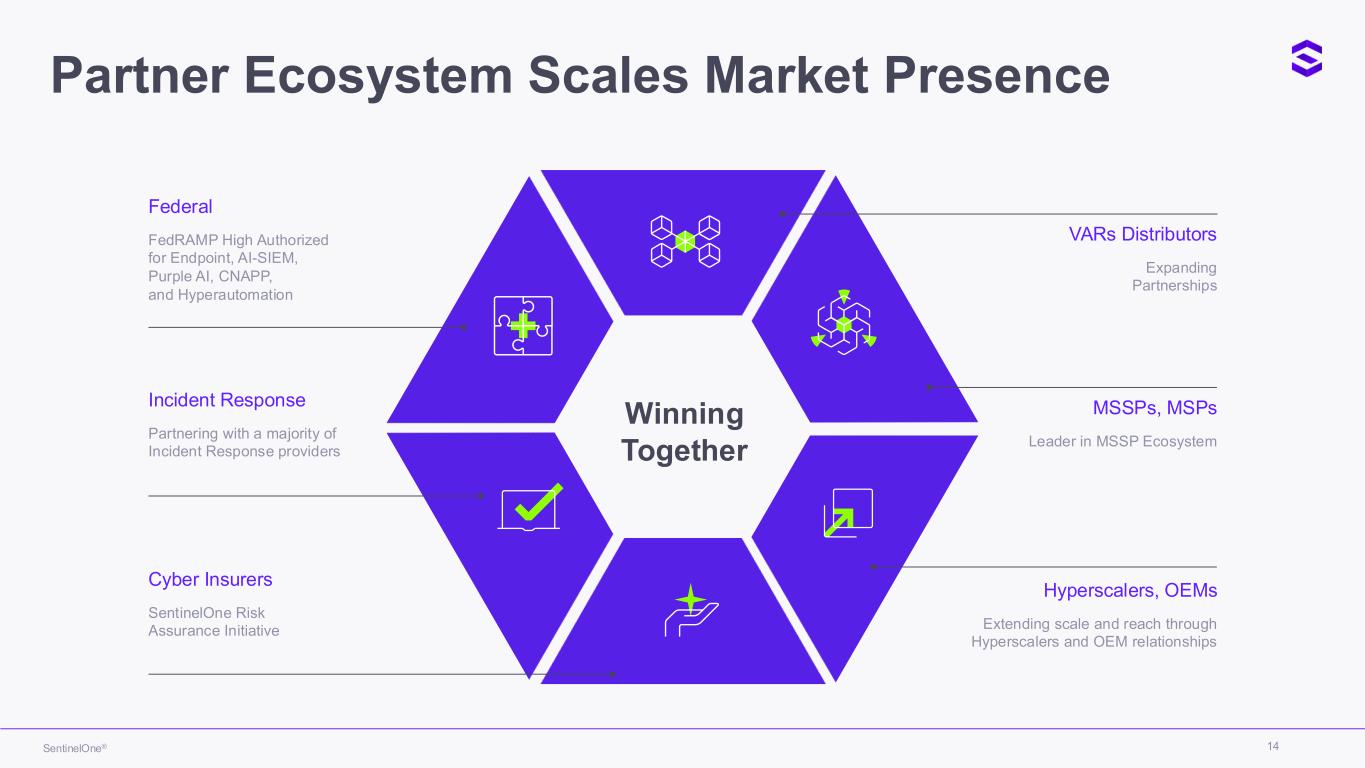
14SentinelOne® Winning Together FedRAMP High Authorized for Endpoint, AI-SIEM, Purple AI, CNAPP, and Hyperautomation Partnering with a majority of Incident Response providers SentinelOne Risk Assurance Initiative Federal Incident Response Cyber Insurers Expanding Partnerships Leader in MSSP Ecosystem Extending scale and reach through Hyperscalers and OEM relationships VARs Distributors MSSPs, MSPs Hyperscalers, OEMs Partner Ecosystem Scales Market Presence

15 Recognized Technology Leadership Industry Accolades & Recognitions
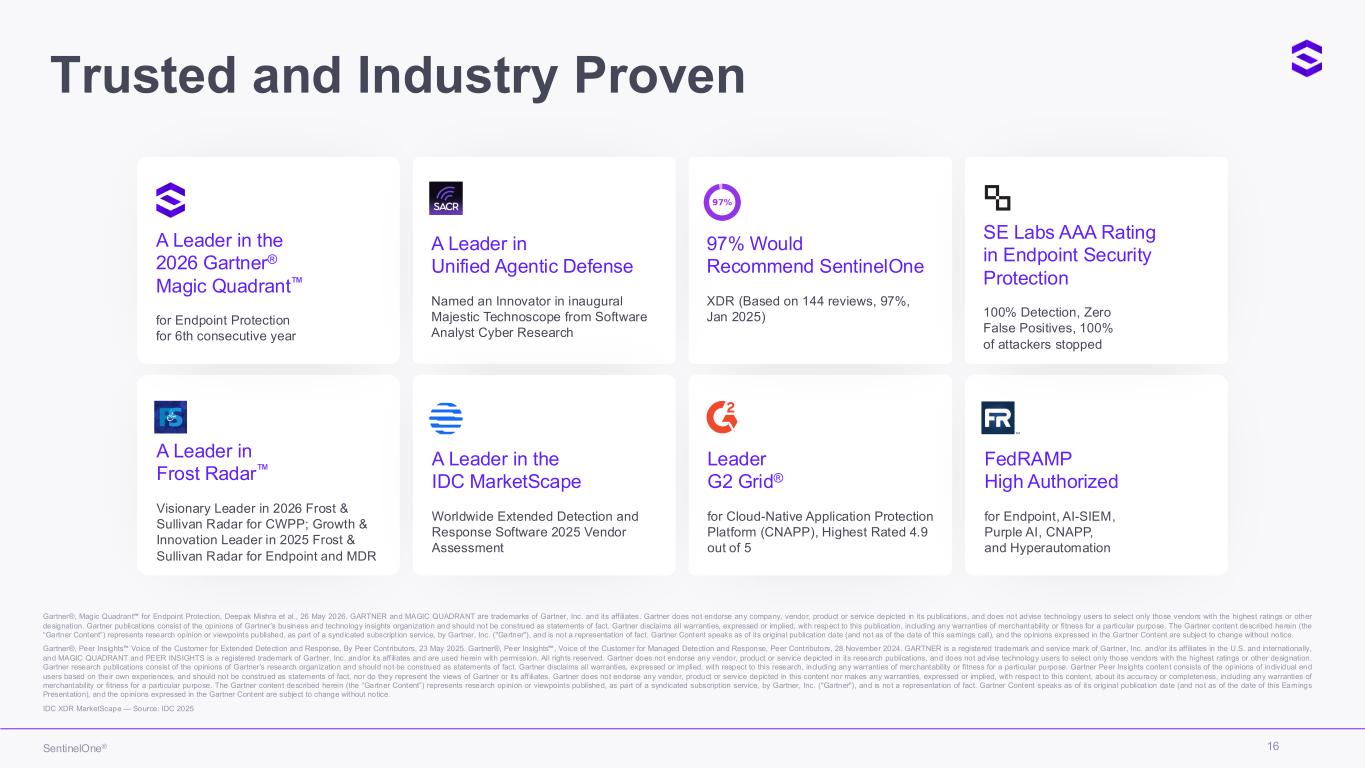
16SentinelOne® Leader G2 Grid® for Cloud-Native Application Protection Platform (CNAPP), Highest Rated 4.9 out of 5 FedRAMP High Authorized for Endpoint, AI-SIEM, Purple AI, CNAPP, and Hyperautomation A Leader in Frost Radar Visionary Leader in 2026 Frost & Sullivan Radar for CWPP; Growth & Innovation Leader in 2025 Frost & Sullivan Radar for Endpoint and MDR A Leader in the 2026 Gartner® Magic Quadrant for Endpoint Protection for 6th consecutive year 97% Would Recommend SentinelOne XDR (Based on 144 reviews, 97%, Jan 2025) A Leader in Unified Agentic Defense Named an Innovator in inaugural Majestic Technoscope from Software Analyst Cyber Research A Leader in the IDC MarketScape Worldwide Extended Detection and Response Software 2025 Vendor Assessment SE Labs AAA Rating in Endpoint Security Protection 100% Detection, Zero False Positives, 100% of attackers stopped Gartner®, Magic Quadrant for Endpoint Protection, Deepak Mishra et al., 26 May 2026, GARTNER and MAGIC QUADRANT are trademarks of Gartner, Inc. and its aff iliates. Gartner does not endorse any company, vendor, product or service depicted in its publications, and does not advise technology users to select only those vendors with the highest ratings or other designation. Gartner publications consist of the opinions of Gartner’s business and technology insights organization and should not be construed as statements of fact. Gartner disclaims all warranties, expressed or implied, with respect to this publication, including any warranties of merchantability or fitness for a particular purpose. The Gartner content described herein (the “Gartner Content”) represents research opinion or viewpoints published, as part of a syndicated subscription service, by Gartner, Inc. ("Gartner"), and is not a representation of fact. Gartner Content speaks as of its original publication date (and not as of the date of this earnings call), and the opinions expressed in the Gartner Content are subject to change without notice. Gartner®, Peer Insights Voice of the Customer for Extended Detection and Response, By Peer Contributors, 23 May 2025. Gartner®, Peer Insights , Voice of the Customer for Managed Detection and Response, Peer Contributors, 28 November 2024. GARTNER is a registered trademark and service mark of Gartner, Inc. and/or its aff iliates in the U.S. and internationally, and MAGIC QUADRANT and PEER INSIGHTS is a registered trademark of Gartner, Inc. and/or its aff iliates and are used herein with permission. All rights reserved. Gartner does not endorse any vendor, product or service depicted in its research publications, and does not advise technology users to select only those vendors with the highest ratings or other designation. Gartner research publications consist of the opinions of Gartner’s research organization and should not be construed as statements of fact. Gartner disclaims all warranties, expressed or implied, with respect to this research, including any warranties of merchantability or fitness for a particular purpose. Gartner Peer Insights content consists of the opinions of individual end users based on their own experiences, and should not be construed as statements of fact, nor do they represent the views of Gartner or its aff iliates. Gartner does not endorse any vendor, product or service depicted in this content nor makes any warranties, expressed or implied, with respect to this content, about its accuracy or completeness, including any warranties of merchantability or fitness for a particular purpose. The Gartner content described herein (the “Gartner Content”) represents research opinion or viewpoints published, as part of a syndicated subscription service, by Gartner, Inc. ("Gartner"), and is not a representation of fact. Gartner Content speaks as of its original publication date (and not as of the date of this Earnings Presentation), and the opinions expressed in the Gartner Content are subject to change without notice. IDC XDR MarketScape — Source: IDC 2025 Trusted and Industry Proven
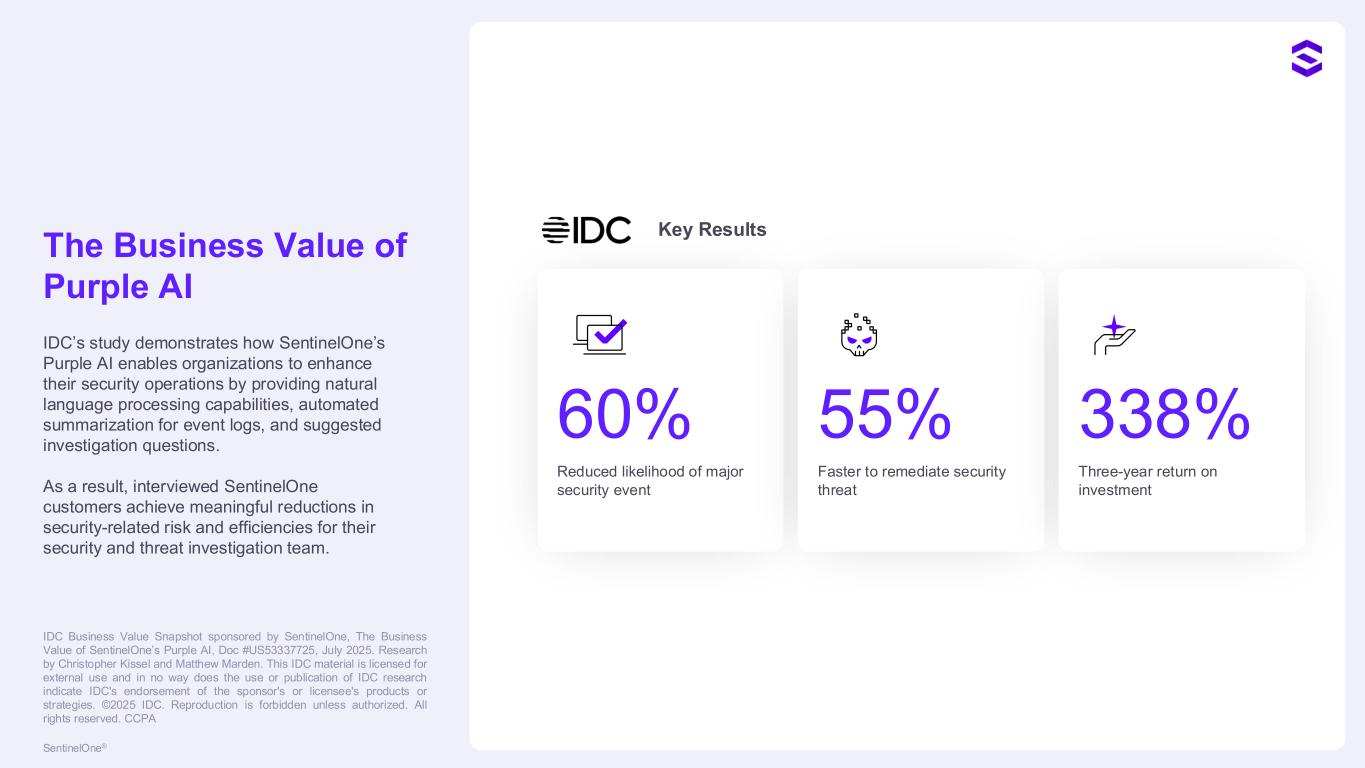
17SentinelOne® The Business Value of Purple AI IDC’s study demonstrates how SentinelOne’s Purple AI enables organizations to enhance their security operations by providing natural language processing capabilities, automated summarization for event logs, and suggested investigation questions. As a result, interviewed SentinelOne customers achieve meaningful reductions in security-related risk and efficiencies for their security and threat investigation team. IDC Business Value Snapshot sponsored by SentinelOne, The Business Value of SentinelOne’s Purple AI, Doc #US53337725, July 2025. Research by Christopher Kissel and Matthew Marden. This IDC material is licensed for external use and in no way does the use or publication of IDC research indicate IDC's endorsement of the sponsor's or licensee's products or strategies. ©2025 IDC. Reproduction is forbidden unless authorized. All rights reserved. CCPA 60% Reduced likelihood of major security event 55% Faster to remediate security threat 338% Three-year return on investment Key Results
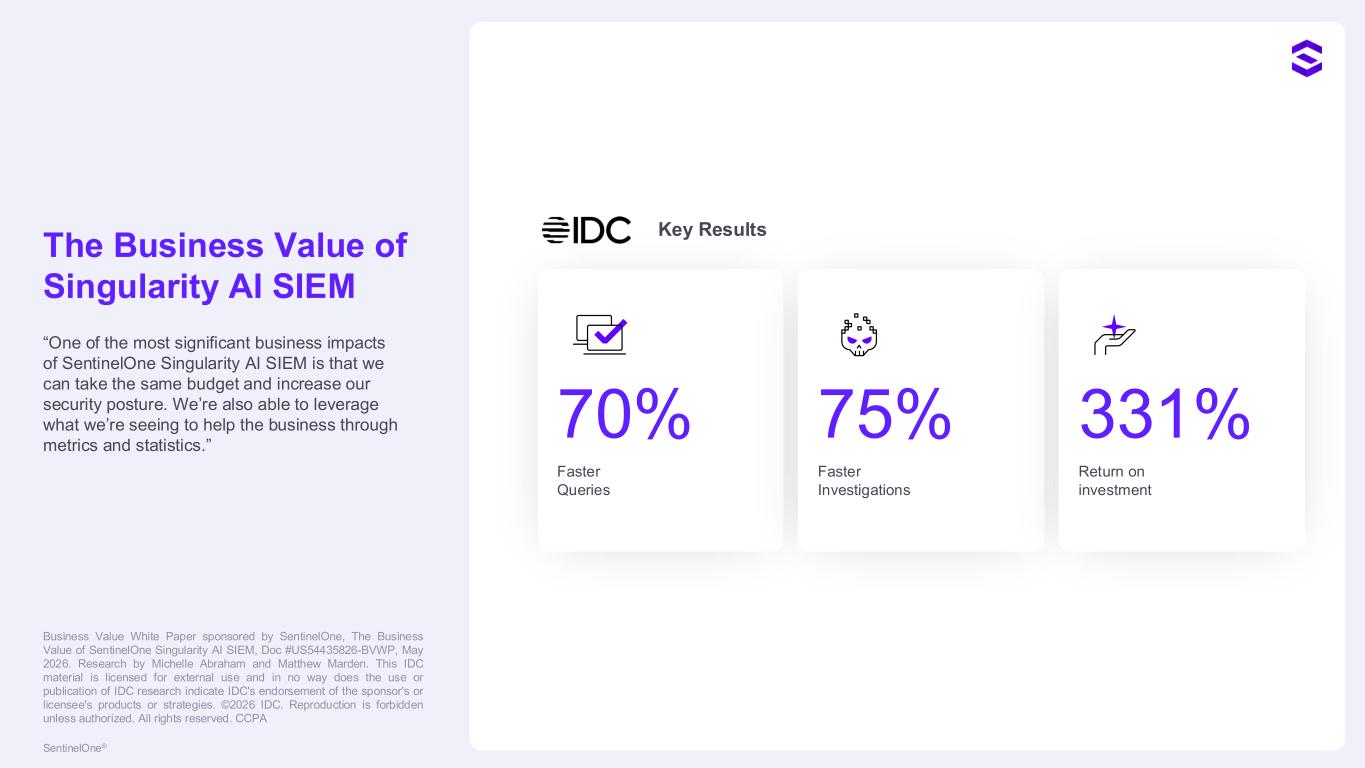
18SentinelOne® The Business Value of Singularity AI SIEM “One of the most significant business impacts of SentinelOne Singularity AI SIEM is that we can take the same budget and increase our security posture. We’re also able to leverage what we’re seeing to help the business through metrics and statistics.” 70% Faster Queries 75% Faster Investigations 331% Return on investment Key Results Business Value White Paper sponsored by SentinelOne, The Business Value of SentinelOne Singularity AI SIEM, Doc #US54435826-BVWP, May 2026. Research by Michelle Abraham and Matthew Marden. This IDC material is licensed for external use and in no way does the use or publication of IDC research indicate IDC's endorsement of the sponsor's or licensee's products or strategies. ©2026 IDC. Reproduction is forbidden unless authorized. All rights reserved. CCPA
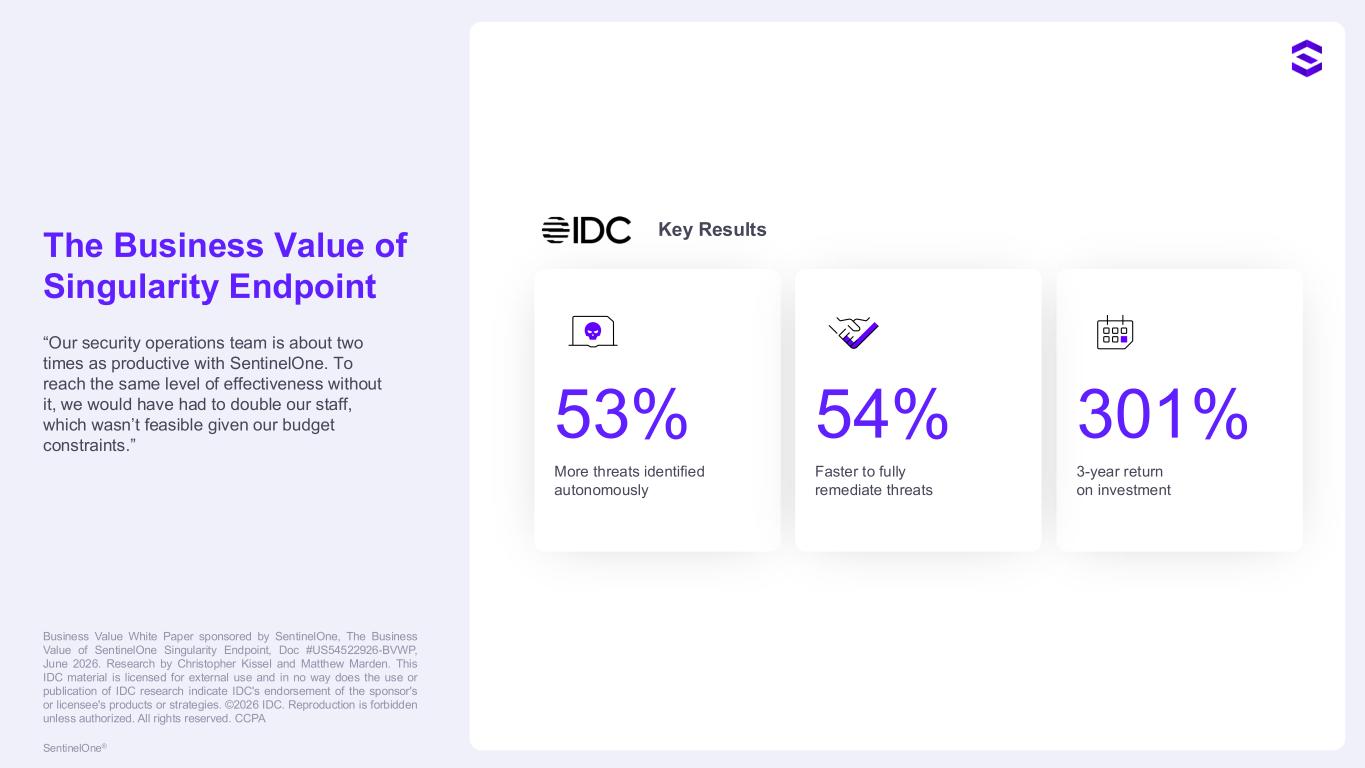
19SentinelOne® The Business Value of Singularity Endpoint “Our security operations team is about two times as productive with SentinelOne. To reach the same level of effectiveness without it, we would have had to double our staff, which wasn’t feasible given our budget constraints.” 301% 3-year return on investment 53% More threats identified autonomously 54% Faster to fully remediate threats Key Results Business Value White Paper sponsored by SentinelOne, The Business Value of SentinelOne Singularity Endpoint, Doc #US54522926-BVWP, June 2026. Research by Christopher Kissel and Matthew Marden. This IDC material is licensed for external use and in no way does the use or publication of IDC research indicate IDC's endorsement of the sponsor's or licensee's products or strategies. ©2026 IDC. Reproduction is forbidden unless authorized. All rights reserved. CCPA
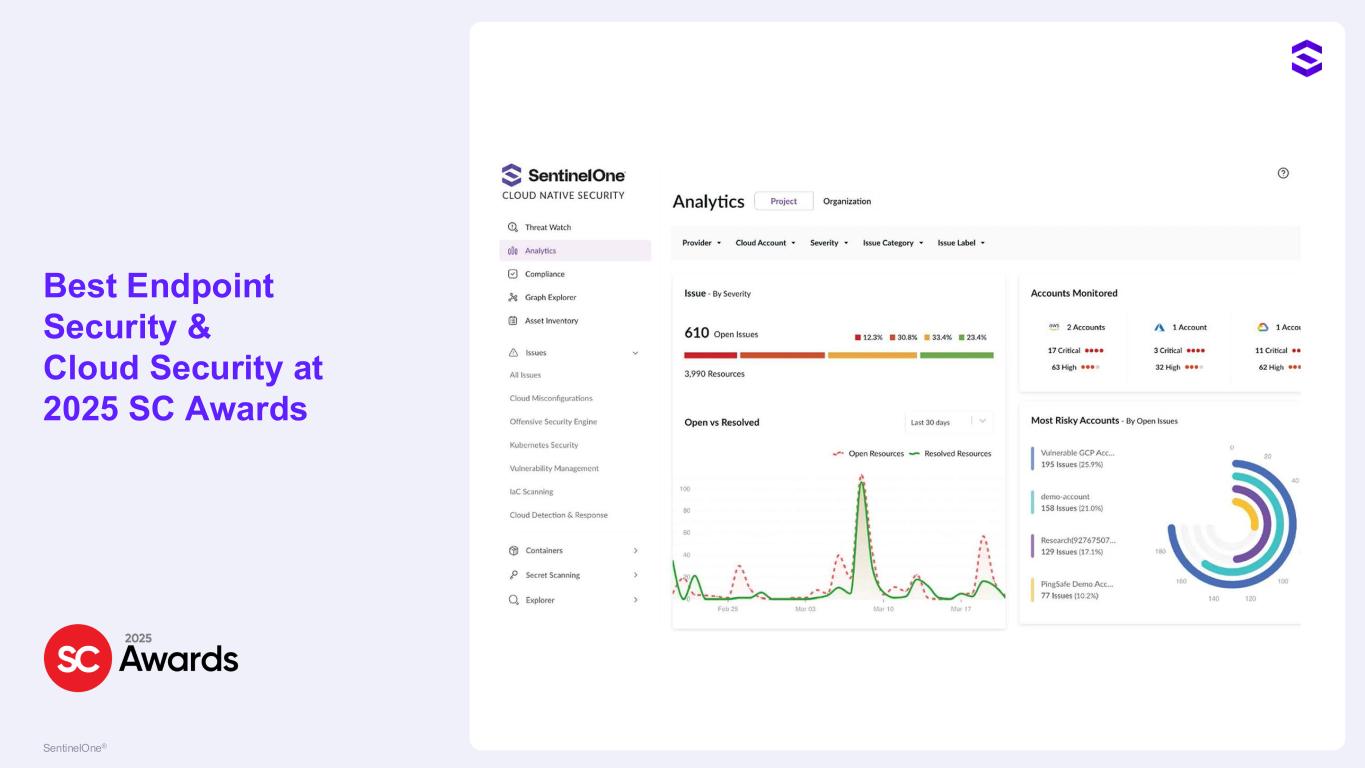
20SentinelOne® Best Endpoint Security & Cloud Security at 2025 SC Awards
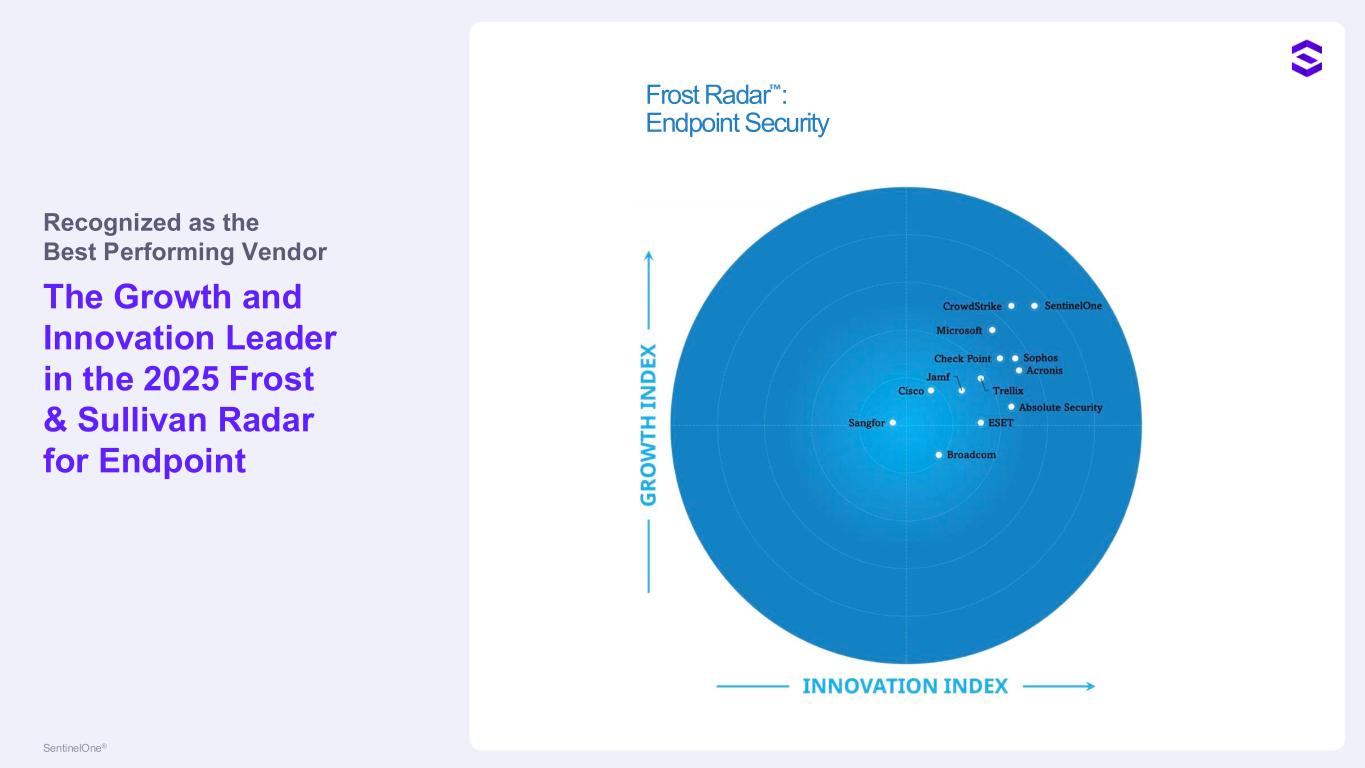
21SentinelOne® Recognized as the Best Performing Vendor The Growth and Innovation Leader in the 2025 Frost & Sullivan Radar for Endpoint Frost Radar : Endpoint Security
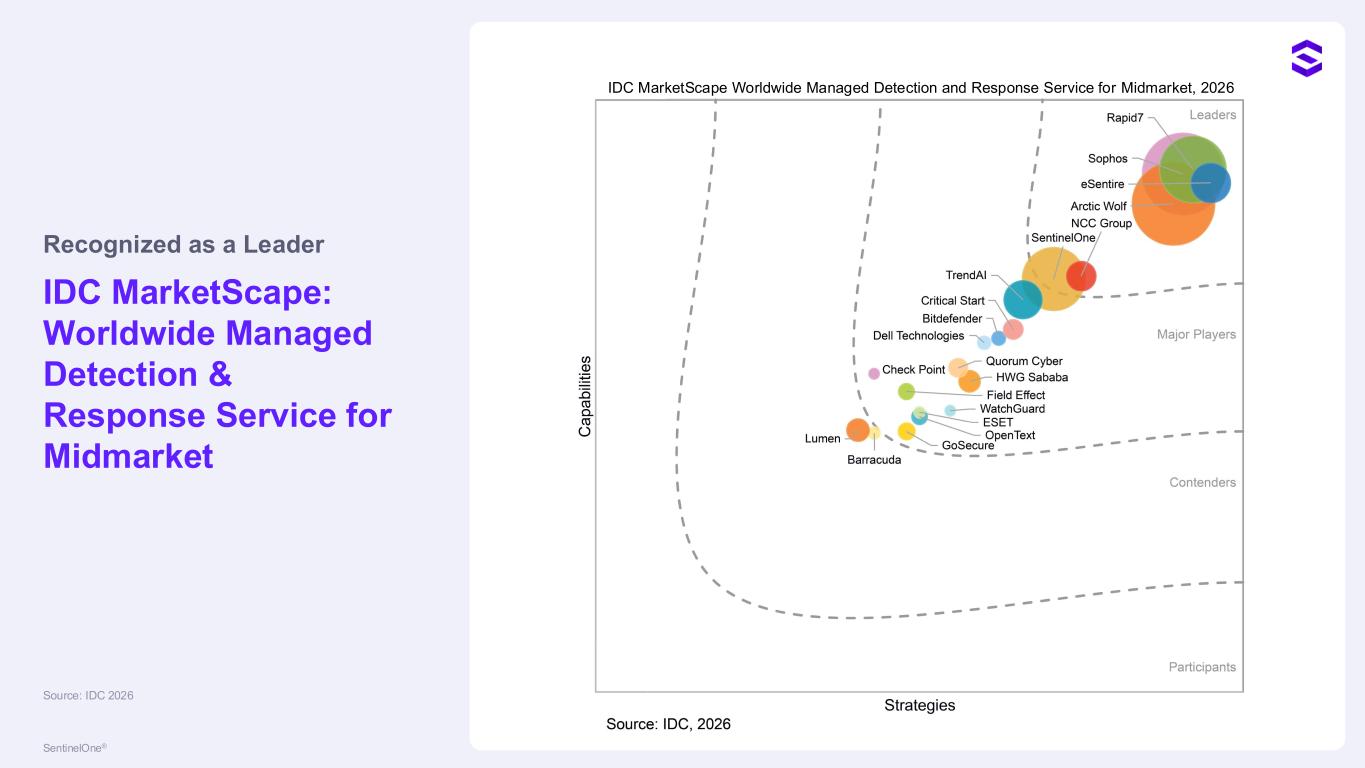
22SentinelOne® Recognized as a Leader IDC MarketScape: Worldwide Managed Detection & Response Service for Midmarket Source: IDC 2026 IDC MarketScape Worldwide Managed Detection and Response Service for Midmarket, 2026
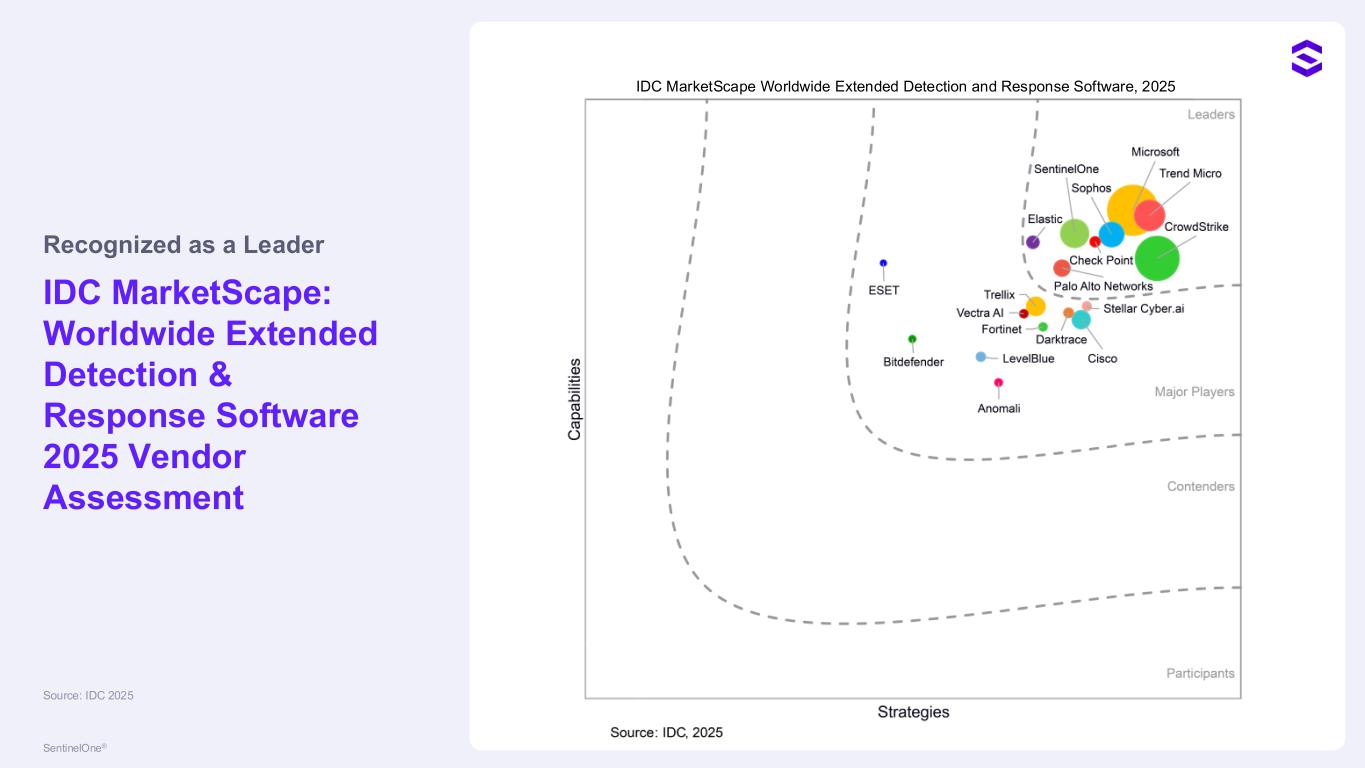
23SentinelOne® Recognized as a Leader IDC MarketScape: Worldwide Extended Detection & Response Software 2025 Vendor Assessment Source: IDC 2025 IDC MarketScape Worldwide Extended Detection and Response Software, 2025

24SentinelOne® Trust | Accountability | Ingenuity | OneSentinel | Relentlessness | Community Our Values A Culture Built on Trust
25SentinelOne® Best-in-class Portfolio Across Security, AI and Data Alumni Acquired by Cisco Acquired by Rubrik Acquired by Rapid7 Acquired by Kela

26 Q2 FY2027 Financial Overview
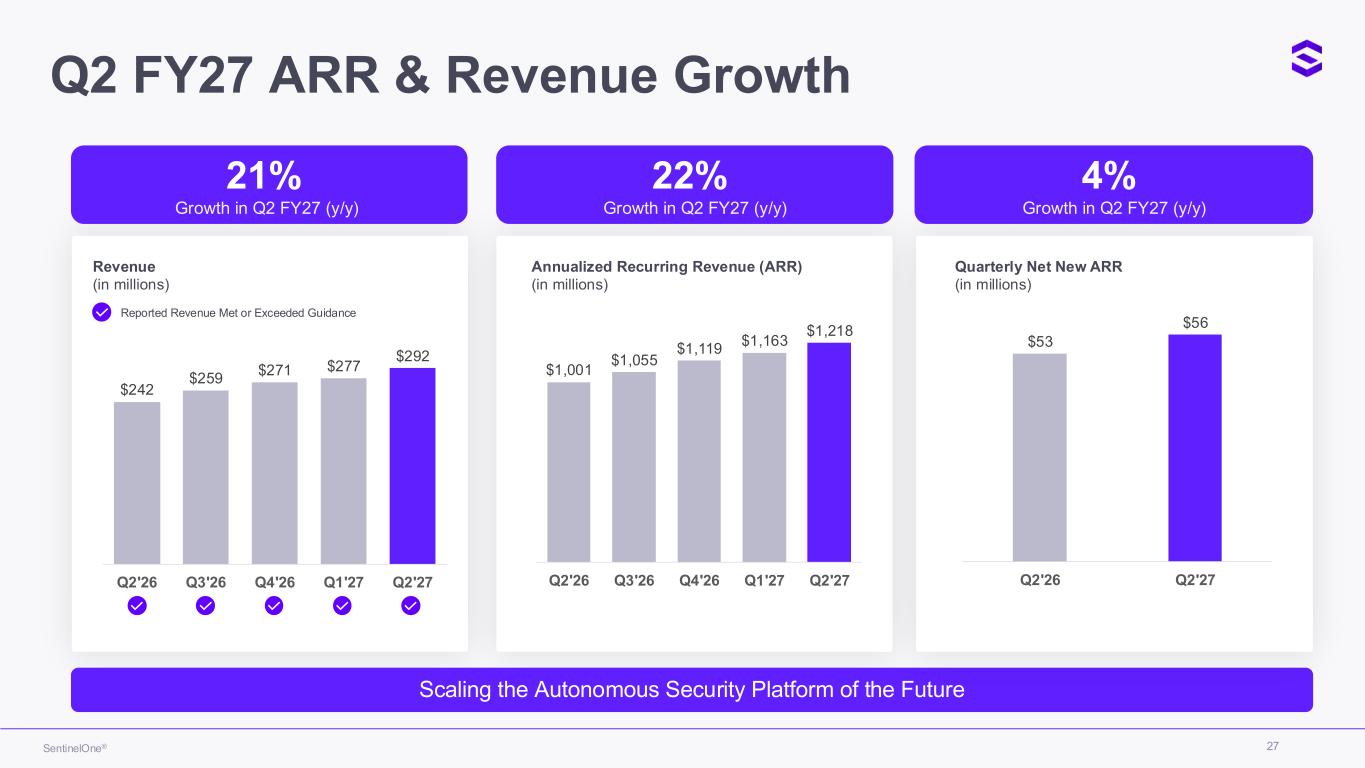
27SentinelOne® $242 $259 $271 $277 $292 0 50 10 150 20 250 30 350 Q2'26 Q3'26 Q4'26 Q1'27 Q2'27 Revenue (in millions) Reported Revenue Met or Exceeded Guidance Scaling the Autonomous Security Platform of the Future $1,001 $1,055 $1,119 $1,163 $1,218 $0 $200 $400 $600 $800 $1, 00 $1, 200 $1, 400 Q2'26 Q3'26 Q4'26 Q1'27 Q2'27 Annualized Recurring Revenue (ARR) (in millions) $53 $56 $20 $25 $30 $35 $40 $45 $50 $5 $60 Q2'26 Q2'27 Quarterly Net New ARR (in millions) 21% Growth in Q2 FY27 (y/y) 22% Growth in Q2 FY27 (y/y) 4% Growth in Q2 FY27 (y/y) Q2 FY27 ARR & Revenue Growth
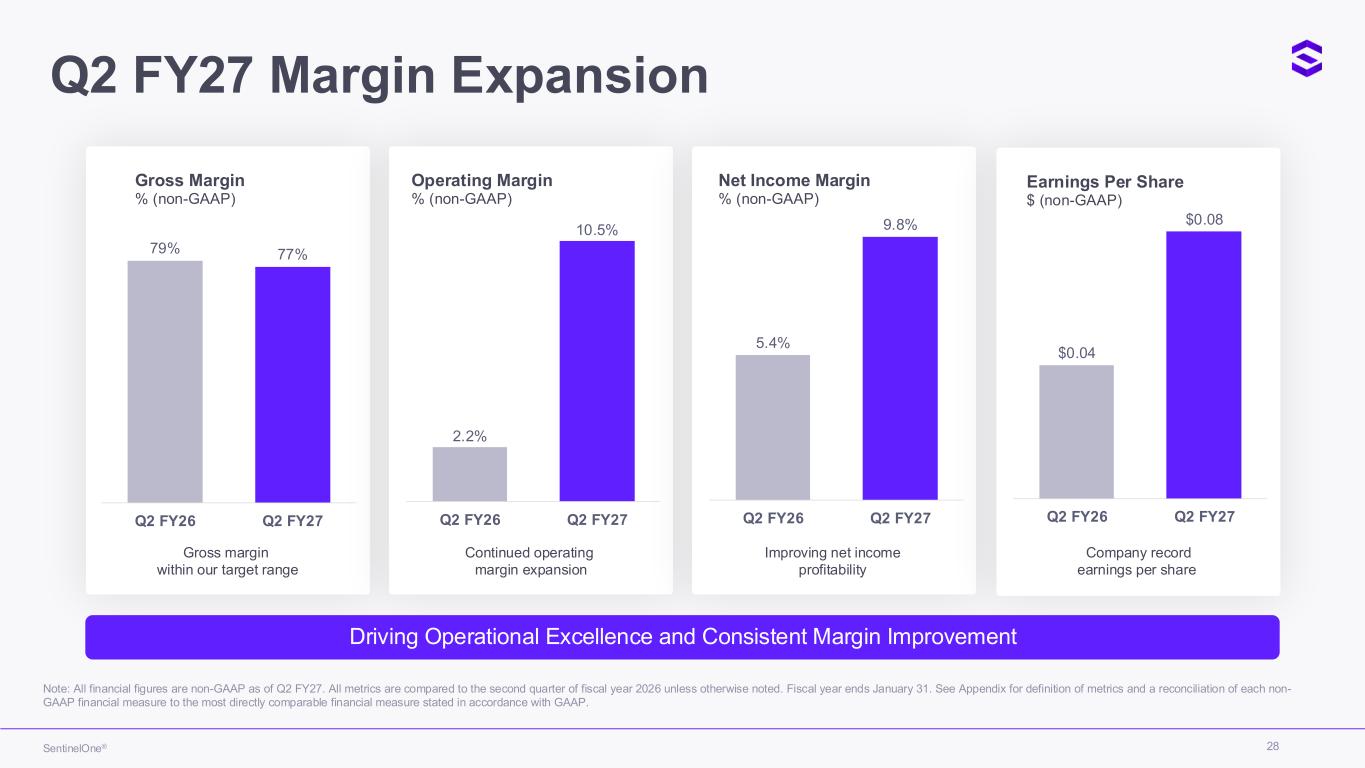
28SentinelOne® Gross margin within our target range Gross Margin % (non-GAAP) 79% 77% 0% 10% 20% 30% 40% 50% 60% 70% 80% 90% Q2 FY26 Q2 FY27 Continued operating margin expansion Operating Margin % (non-GAAP) 2.2% 10.5% 0.0% 2.0% 4.0% 6.0% 8.0% 10.0% 12.0% Q2 FY26 Q2 FY27 Improving net income profitability 5.4% 9.8% 0.0% 2.0% 4.0% 6.0% 8.0% 10.0% 12.0% Q2 FY26 Q2 FY27 Company record earnings per share Earnings Per Share $ (non-GAAP) $0.04 $0.08 0.0% 1.0% 2.0% 3.0% 4.0% 5.0% 6.0% 7.0% 8.0% 9.0% Q2 FY26 Q2 FY27 Driving Operational Excellence and Consistent Margin Improvement Note: All financial figures are non-GAAP as of Q2 FY27. All metrics are compared to the second quarter of fiscal year 2026 unless otherwise noted. Fiscal year ends January 31. See Appendix for definition of metrics and a reconciliation of each non- GAAP financial measure to the most directly comparable financial measure stated in accordance with GAAP. Q2 FY27 Margin Expansion Net Income Margin % (non-GAAP)
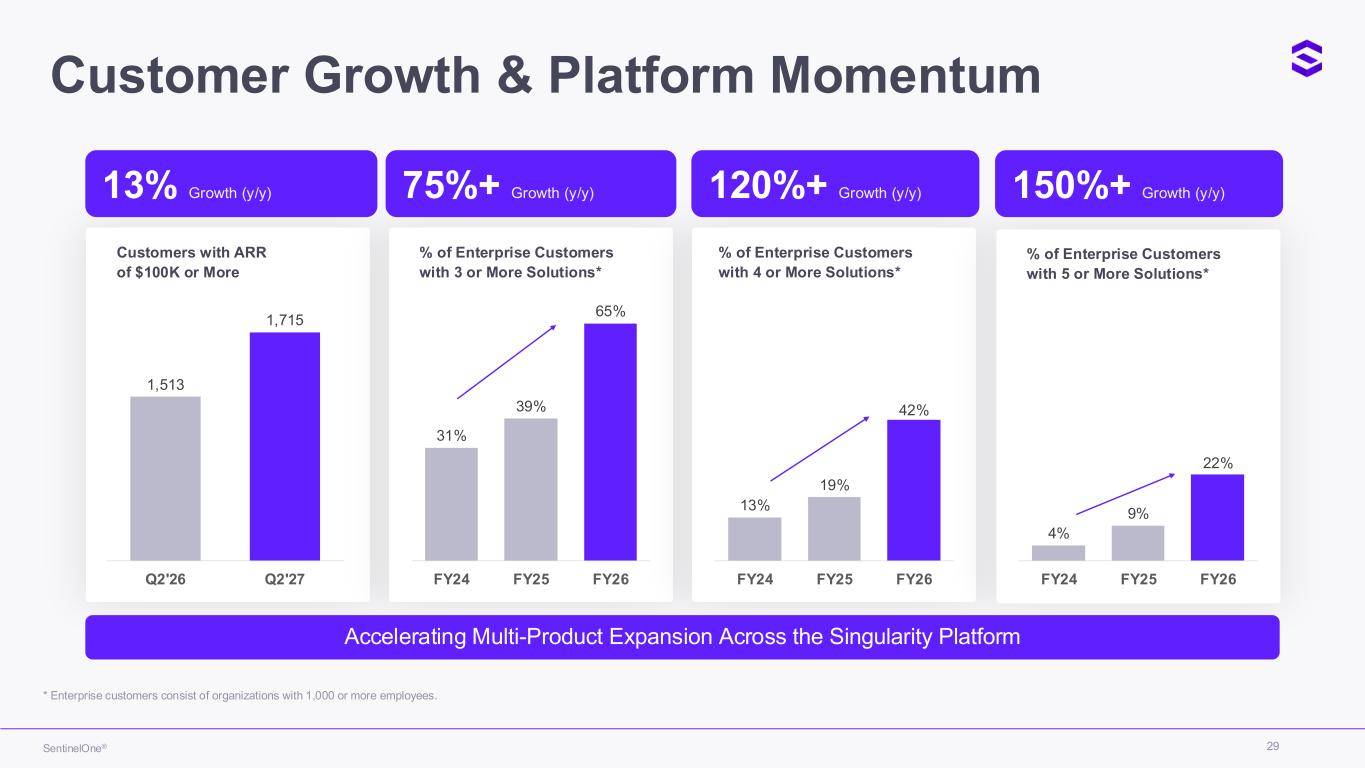
29SentinelOne® Accelerating Multi-Product Expansion Across the Singularity Platform * Enterprise customers consist of organizations with 1,000 or more employees. 1,513 1,715 Q2'26 Q2'27 31% 39% 65% FY24 FY25 FY26 13% 19% 42% FY24 FY25 FY26 4% 9% 22% FY24 FY25 FY26 Customers with ARR of $100K or More % of Enterprise Customers with 3 or More Solutions* % of Enterprise Customers with 4 or More Solutions* % of Enterprise Customers with 5 or More Solutions* 13% Growth (y/y) 75%+ Growth (y/y) 120%+ Growth (y/y) 150%+ Growth (y/y) Customer Growth & Platform Momentum
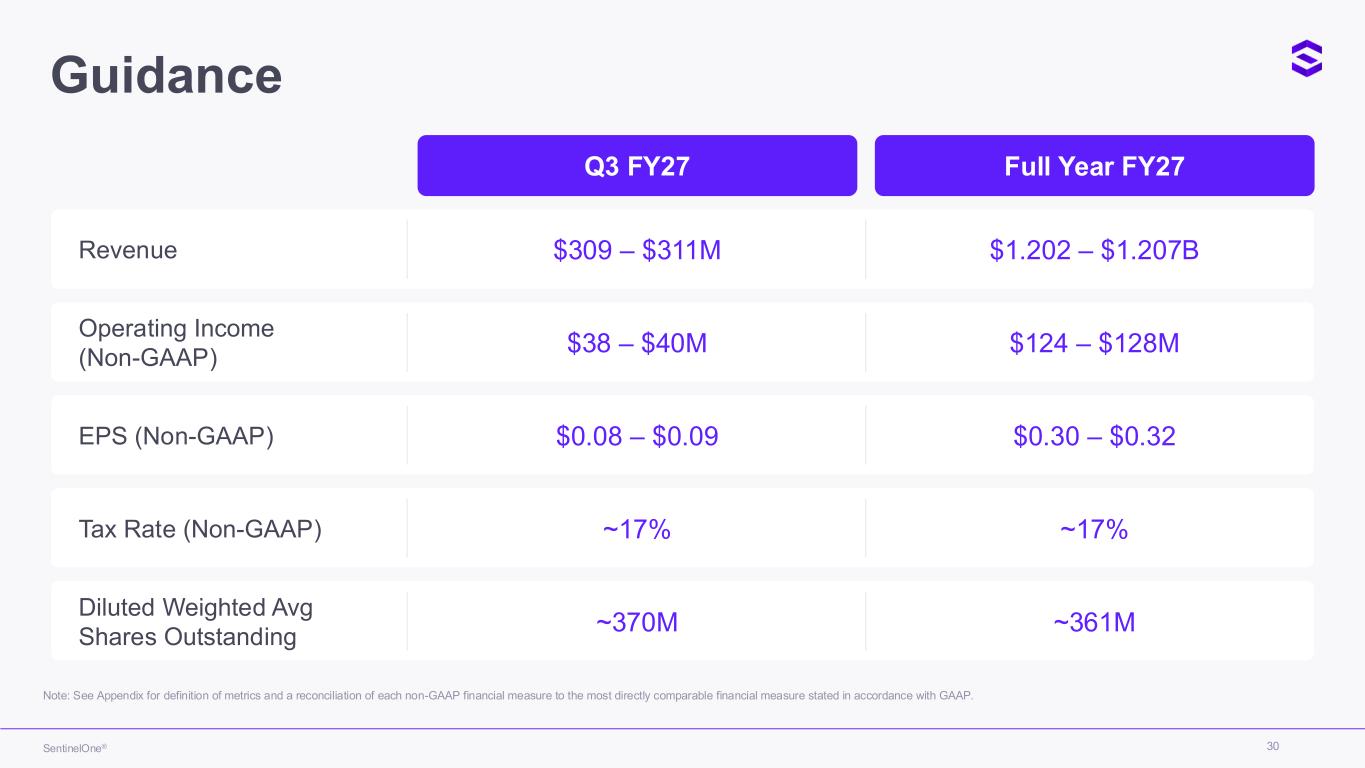
30SentinelOne® Q3 FY27 Full Year FY27 Revenue $309 – $311M $1.202 – $1.207B Operating Income (Non-GAAP) $38 – $40M $124 – $128M EPS (Non-GAAP) $0.08 – $0.09 $0.30 – $0.32 Tax Rate (Non-GAAP) ~17% ~17% Diluted Weighted Avg Shares Outstanding ~370M ~361M Note: See Appendix for definition of metrics and a reconciliation of each non-GAAP financial measure to the most directly comparable financial measure stated in accordance with GAAP. Guidance

31 Appendix
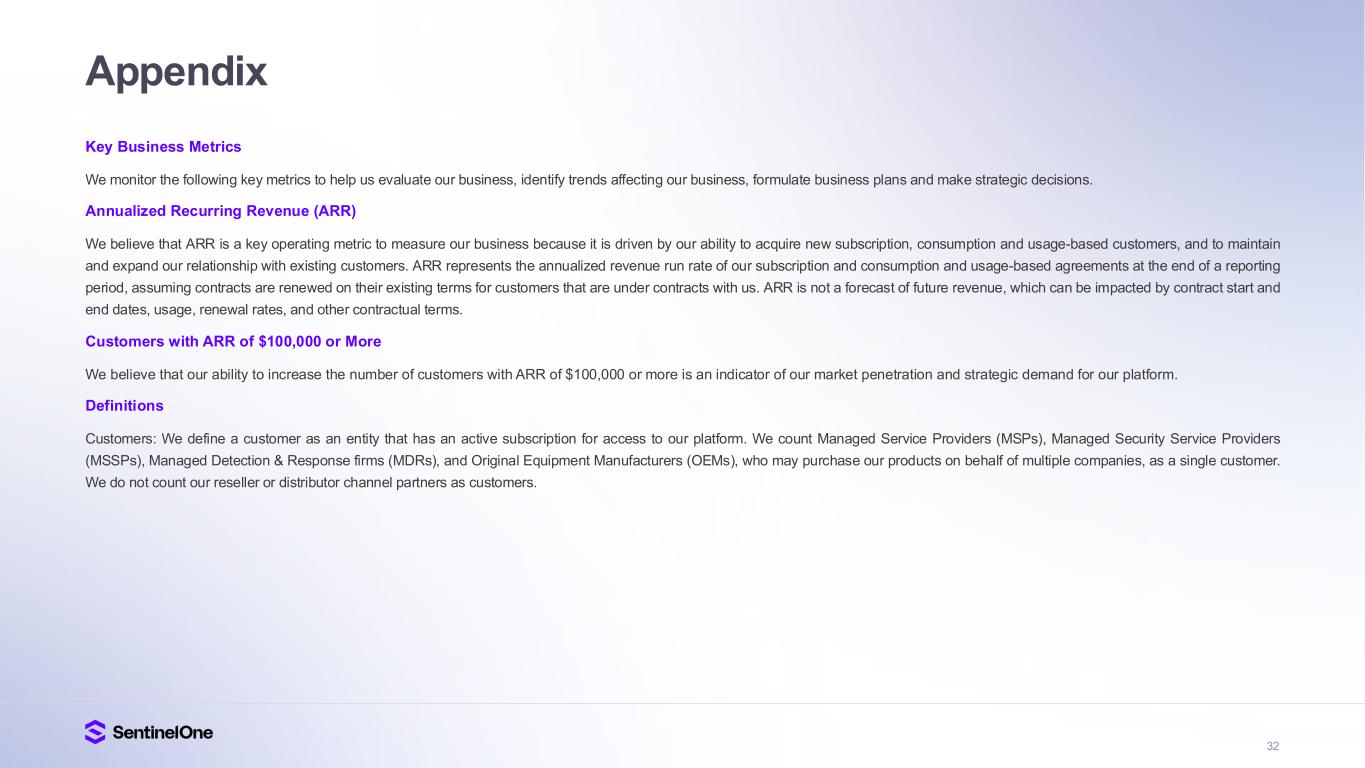
32 Appendix Key Business Metrics We monitor the following key metrics to help us evaluate our business, identify trends affecting our business, formulate business plans and make strategic decisions. Annualized Recurring Revenue (ARR) We believe that ARR is a key operating metric to measure our business because it is driven by our ability to acquire new subscription, consumption and usage-based customers, and to maintain and expand our relationship with existing customers. ARR represents the annualized revenue run rate of our subscription and consumption and usage-based agreements at the end of a reporting period, assuming contracts are renewed on their existing terms for customers that are under contracts with us. ARR is not a forecast of future revenue, which can be impacted by contract start and end dates, usage, renewal rates, and other contractual terms. Customers with ARR of $100,000 or More We believe that our ability to increase the number of customers with ARR of $100,000 or more is an indicator of our market penetration and strategic demand for our platform. Definitions Customers: We define a customer as an entity that has an active subscription for access to our platform. We count Managed Service Providers (MSPs), Managed Security Service Providers (MSSPs), Managed Detection & Response firms (MDRs), and Original Equipment Manufacturers (OEMs), who may purchase our products on behalf of multiple companies, as a single customer. We do not count our reseller or distributor channel partners as customers.
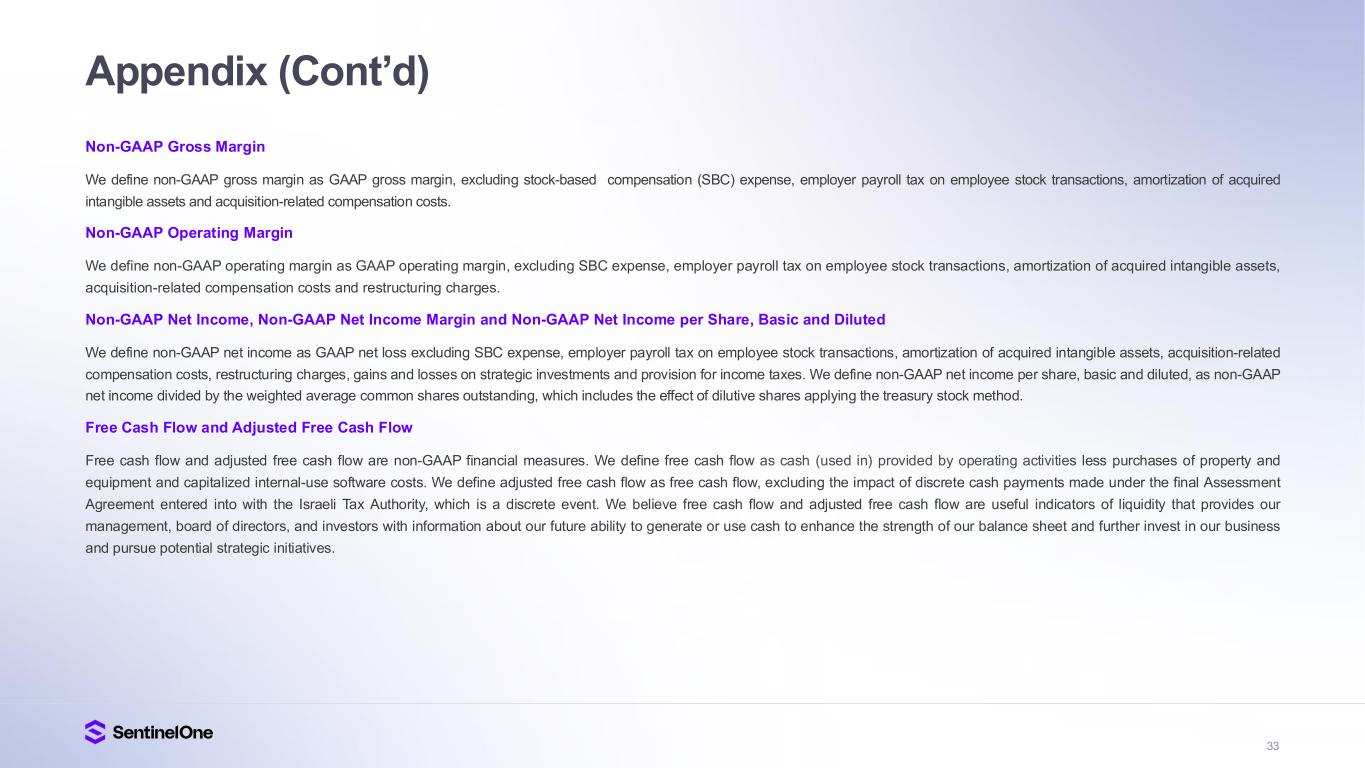
33 Appendix (Cont’d) Non-GAAP Gross Margin We define non-GAAP gross margin as GAAP gross margin, excluding stock-based compensation (SBC) expense, employer payroll tax on employee stock transactions, amortization of acquired intangible assets and acquisition-related compensation costs. Non-GAAP Operating Margin We define non-GAAP operating margin as GAAP operating margin, excluding SBC expense, employer payroll tax on employee stock transactions, amortization of acquired intangible assets, acquisition-related compensation costs and restructuring charges. Non-GAAP Net Income, Non-GAAP Net Income Margin and Non-GAAP Net Income per Share, Basic and Diluted We define non-GAAP net income as GAAP net loss excluding SBC expense, employer payroll tax on employee stock transactions, amortization of acquired intangible assets, acquisition-related compensation costs, restructuring charges, gains and losses on strategic investments and provision for income taxes. We define non-GAAP net income per share, basic and diluted, as non-GAAP net income divided by the weighted average common shares outstanding, which includes the effect of dilutive shares applying the treasury stock method. Free Cash Flow and Adjusted Free Cash Flow Free cash flow and adjusted free cash flow are non-GAAP financial measures. We define free cash flow as cash (used in) provided by operating activities less purchases of property and equipment and capitalized internal-use software costs. We define adjusted free cash flow as free cash flow, excluding the impact of discrete cash payments made under the final Assessment Agreement entered into with the Israeli Tax Authority, which is a discrete event. We believe free cash flow and adjusted free cash flow are useful indicators of liquidity that provides our management, board of directors, and investors with information about our future ability to generate or use cash to enhance the strength of our balance sheet and further invest in our business and pursue potential strategic initiatives.
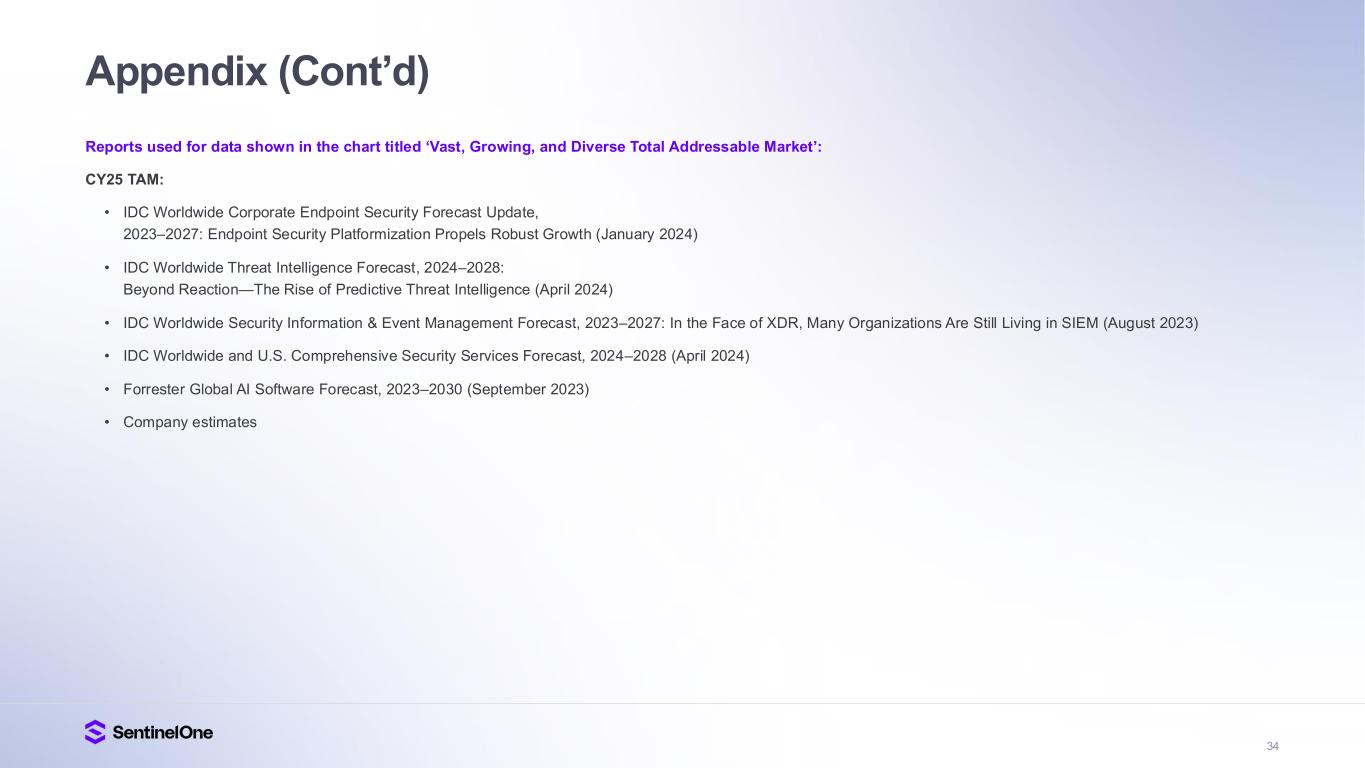
34 Appendix (Cont’d) Reports used for data shown in the chart titled ‘Vast, Growing, and Diverse Total Addressable Market’: CY25 TAM: • IDC Worldwide Corporate Endpoint Security Forecast Update, 2023–2027: Endpoint Security Platformization Propels Robust Growth (January 2024) • IDC Worldwide Threat Intelligence Forecast, 2024–2028: Beyond Reaction—The Rise of Predictive Threat Intelligence (April 2024) • IDC Worldwide Security Information & Event Management Forecast, 2023–2027: In the Face of XDR, Many Organizations Are Still Living in SIEM (August 2023) • IDC Worldwide and U.S. Comprehensive Security Services Forecast, 2024–2028 (April 2024) • Forrester Global AI Software Forecast, 2023–2030 (September 2023) • Company estimates
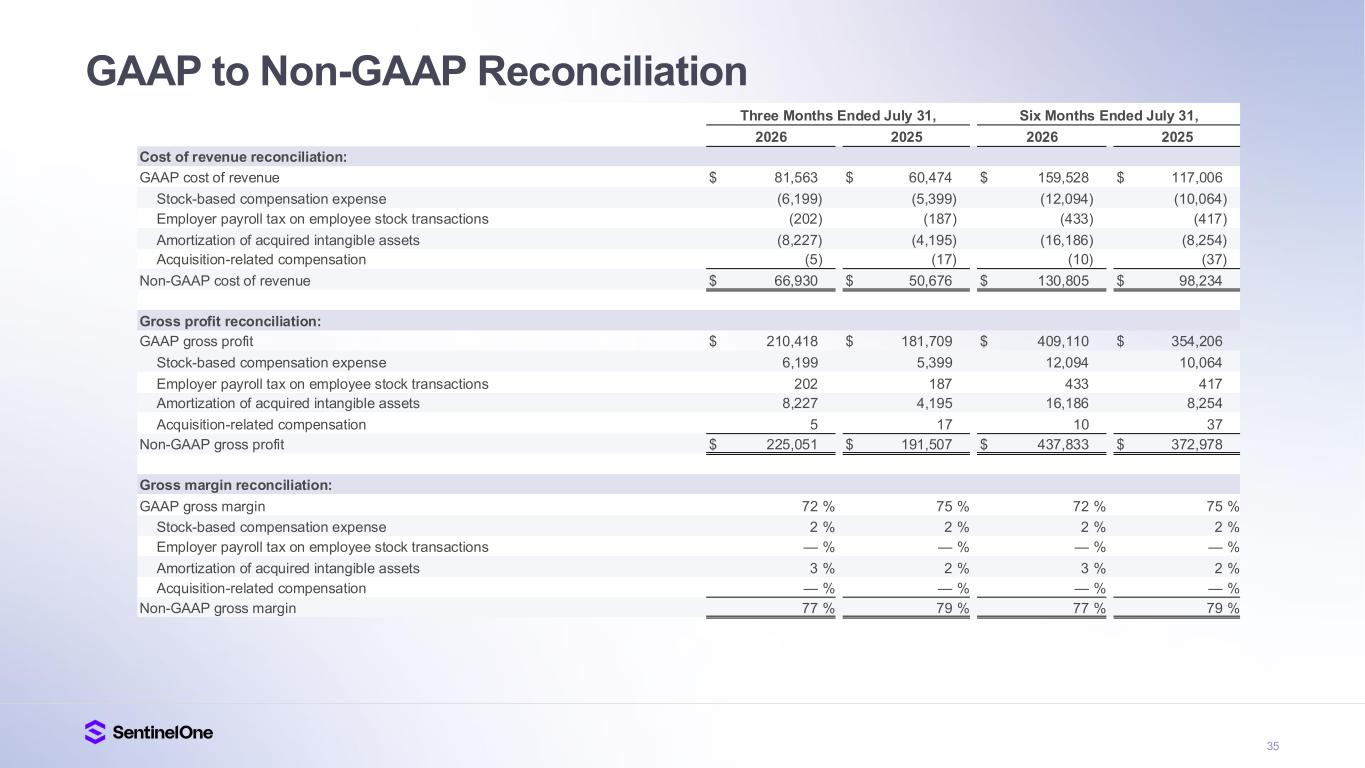
35 GAAP to Non-GAAP Reconciliation Three Months Ended July 31, Six Months Ended July 31, 2026 2025 2026 2025 Cost of revenue reconciliation: GAAP cost of revenue $ 81,563 $ 60,474 $ 159,528 $ 117,006 Stock-based compensation expense (6,199) (5,399) (12,094) (10,064) Employer payroll tax on employee stock transactions (202) (187) (433) (417) Amortization of acquired intangible assets (8,227) (4,195) (16,186) (8,254) Acquisition-related compensation (5) (17) (10) (37) Non-GAAP cost of revenue $ 66,930 $ 50,676 $ 130,805 $ 98,234 Gross profit reconciliation: GAAP gross profit $ 210,418 $ 181,709 $ 409,110 $ 354,206 Stock-based compensation expense 6,199 5,399 12,094 10,064 Employer payroll tax on employee stock transactions 202 187 433 417 Amortization of acquired intangible assets 8,227 4,195 16,186 8,254 Acquisition-related compensation 5 17 10 37 Non-GAAP gross profit $ 225,051 $ 191,507 $ 437,833 $ 372,978 Gross margin reconciliation: GAAP gross margin 72 % 75 % 72 % 75 % Stock-based compensation expense 2 % 2 % 2 % 2 % Employer payroll tax on employee stock transactions — % — % — % — % Amortization of acquired intangible assets 3 % 2 % 3 % 2 % Acquisition-related compensation — % — % — % — % Non-GAAP gross margin 77 % 79 % 77 % 79 %
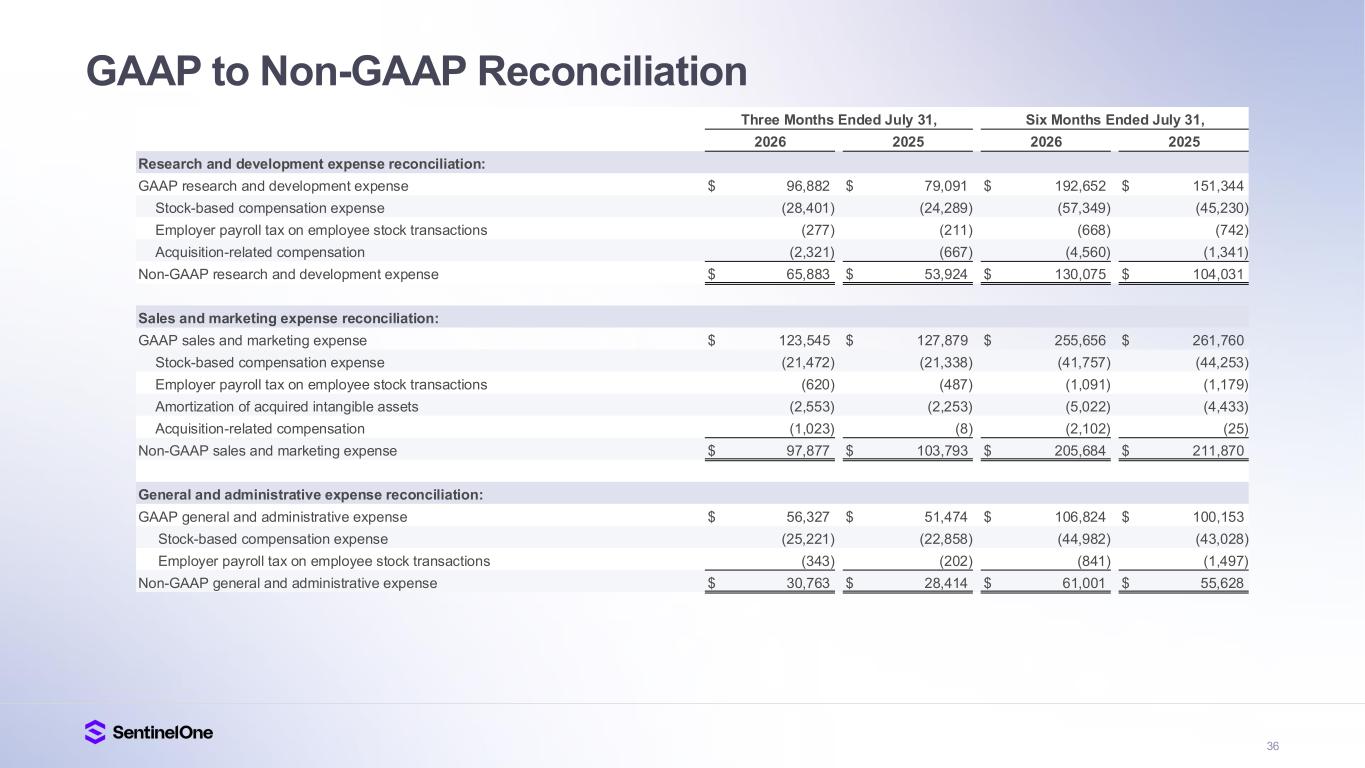
36 GAAP to Non-GAAP Reconciliation Three Months Ended July 31, Six Months Ended July 31, 2026 2025 2026 2025 Research and development expense reconciliation: GAAP research and development expense $ 96,882 $ 79,091 $ 192,652 $ 151,344 Stock-based compensation expense (28,401) (24,289) (57,349) (45,230) Employer payroll tax on employee stock transactions (277) (211) (668) (742) Acquisition-related compensation (2,321) (667) (4,560) (1,341) Non-GAAP research and development expense $ 65,883 $ 53,924 $ 130,075 $ 104,031 Sales and marketing expense reconciliation: GAAP sales and marketing expense $ 123,545 $ 127,879 $ 255,656 $ 261,760 Stock-based compensation expense (21,472) (21,338) (41,757) (44,253) Employer payroll tax on employee stock transactions (620) (487) (1,091) (1,179) Amortization of acquired intangible assets (2,553) (2,253) (5,022) (4,433) Acquisition-related compensation (1,023) (8) (2,102) (25) Non-GAAP sales and marketing expense $ 97,877 $ 103,793 $ 205,684 $ 211,870 General and administrative expense reconciliation: GAAP general and administrative expense $ 56,327 $ 51,474 $ 106,824 $ 100,153 Stock-based compensation expense (25,221) (22,858) (44,982) (43,028) Employer payroll tax on employee stock transactions (343) (202) (841) (1,497) Non-GAAP general and administrative expense $ 30,763 $ 28,414 $ 61,001 $ 55,628
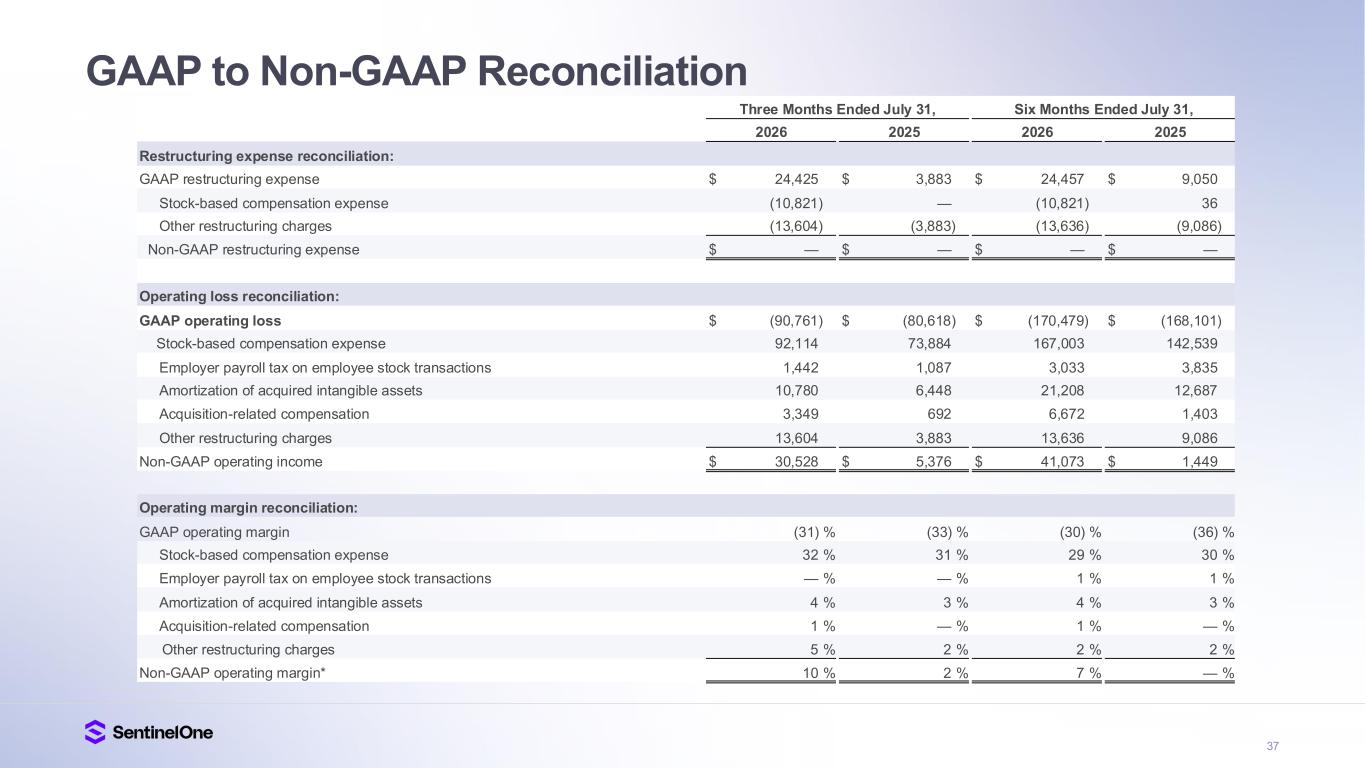
37 GAAP to Non-GAAP Reconciliation Three Months Ended July 31, Six Months Ended July 31, 2026 2025 2026 2025 Restructuring expense reconciliation: GAAP restructuring expense $ 24,425 $ 3,883 $ 24,457 $ 9,050 Stock-based compensation expense (10,821) — (10,821) 36 Other restructuring charges (13,604) (3,883) (13,636) (9,086) Non-GAAP restructuring expense $ — $ — $ — $ — Operating loss reconciliation: GAAP operating loss $ (90,761) $ (80,618) $ (170,479) $ (168,101) Stock-based compensation expense 92,114 73,884 167,003 142,539 Employer payroll tax on employee stock transactions 1,442 1,087 3,033 3,835 Amortization of acquired intangible assets 10,780 6,448 21,208 12,687 Acquisition-related compensation 3,349 692 6,672 1,403 Other restructuring charges 13,604 3,883 13,636 9,086 Non-GAAP operating income $ 30,528 $ 5,376 $ 41,073 $ 1,449 Operating margin reconciliation: GAAP operating margin (31) % (33) % (30) % (36) % Stock-based compensation expense 32 % 31 % 29 % 30 % Employer payroll tax on employee stock transactions — % — % 1 % 1 % Amortization of acquired intangible assets 4 % 3 % 4 % 3 % Acquisition-related compensation 1 % — % 1 % — % Other restructuring charges 5 % 2 % 2 % 2 % Non-GAAP operating margin* 10 % 2 % 7 % — %
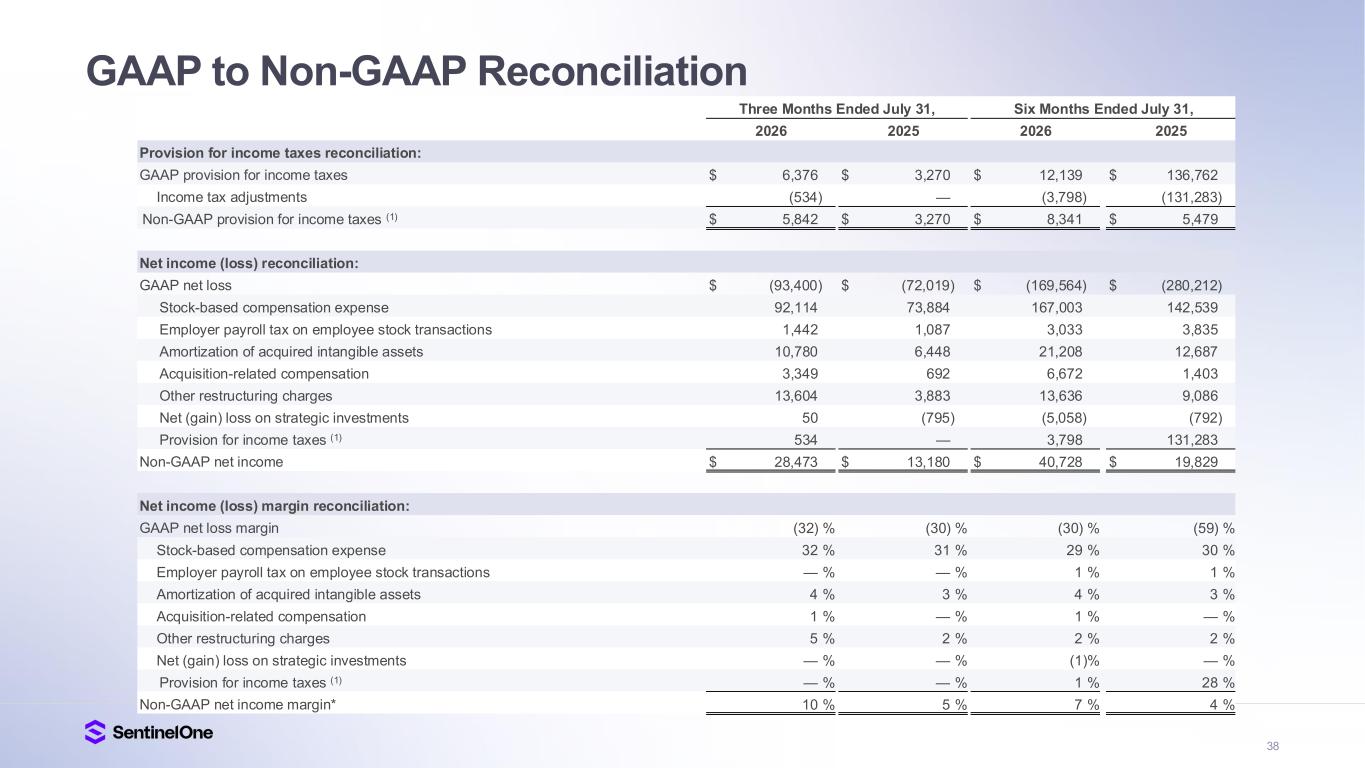
38 GAAP to Non-GAAP Reconciliation Three Months Ended July 31, Six Months Ended July 31, 2026 2025 2026 2025 Provision for income taxes reconciliation: GAAP provision for income taxes $ 6,376 $ 3,270 $ 12,139 $ 136,762 Income tax adjustments (534) — (3,798) (131,283) Non-GAAP provision for income taxes (1) $ 5,842 $ 3,270 $ 8,341 $ 5,479 Net income (loss) reconciliation: GAAP net loss $ (93,400) $ (72,019) $ (169,564) $ (280,212) Stock-based compensation expense 92,114 73,884 167,003 142,539 Employer payroll tax on employee stock transactions 1,442 1,087 3,033 3,835 Amortization of acquired intangible assets 10,780 6,448 21,208 12,687 Acquisition-related compensation 3,349 692 6,672 1,403 Other restructuring charges 13,604 3,883 13,636 9,086 Net (gain) loss on strategic investments 50 (795) (5,058) (792) Provision for income taxes (1) 534 — 3,798 131,283 Non-GAAP net income $ 28,473 $ 13,180 $ 40,728 $ 19,829 Net income (loss) margin reconciliation: GAAP net loss margin (32) % (30) % (30) % (59) % Stock-based compensation expense 32 % 31 % 29 % 30 % Employer payroll tax on employee stock transactions — % — % 1 % 1 % Amortization of acquired intangible assets 4 % 3 % 4 % 3 % Acquisition-related compensation 1 % — % 1 % — % Other restructuring charges 5 % 2 % 2 % 2 % Net (gain) loss on strategic investments — % — % (1)% — % Provision for income taxes (1) — % — % 1 % 28 % Non-GAAP net income margin* 10 % 5 % 7 % 4 %
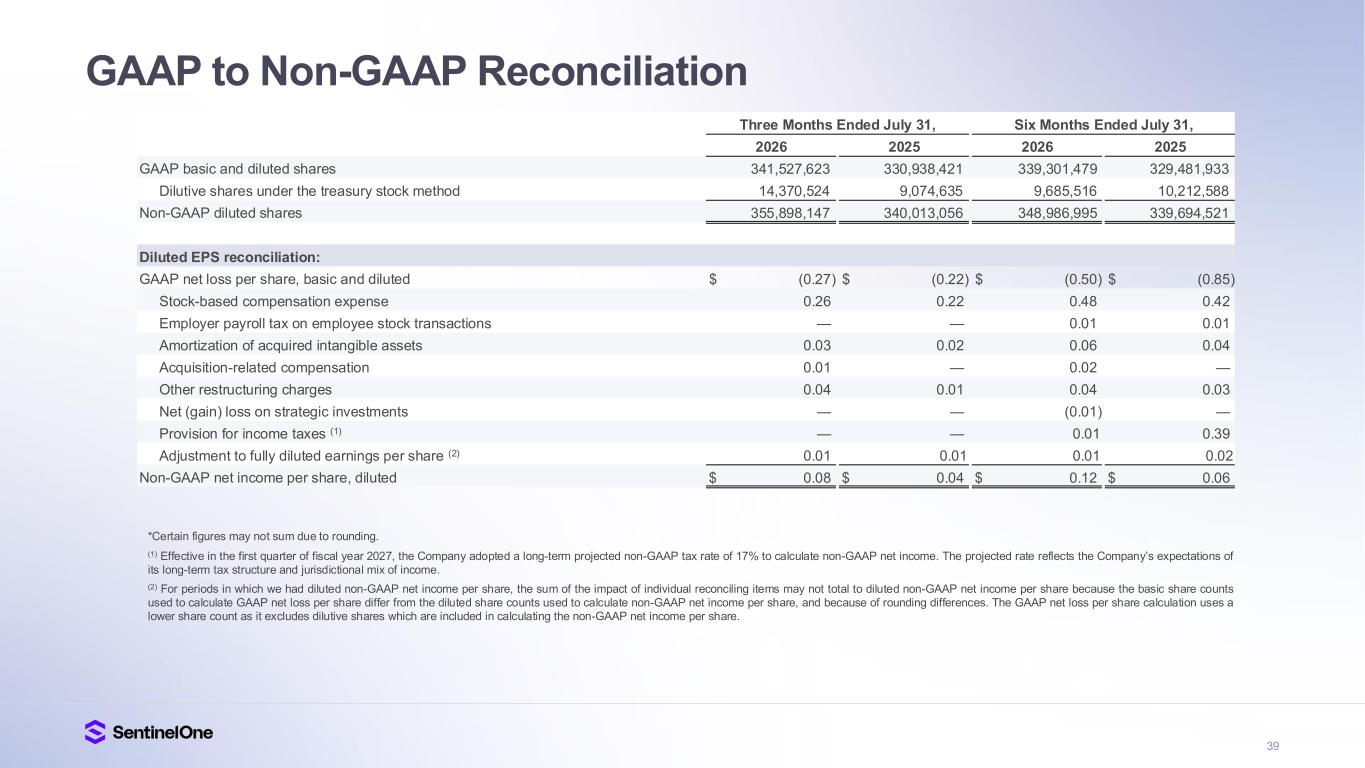
39 GAAP to Non-GAAP Reconciliation Three Months Ended July 31, Six Months Ended July 31, 2026 2025 2026 2025 GAAP basic and diluted shares 341,527,623 330,938,421 339,301,479 329,481,933 Dilutive shares under the treasury stock method 14,370,524 9,074,635 9,685,516 10,212,588 Non-GAAP diluted shares 355,898,147 340,013,056 348,986,995 339,694,521 Diluted EPS reconciliation: GAAP net loss per share, basic and diluted $ (0.27) $ (0.22) $ (0.50) $ (0.85) Stock-based compensation expense 0.26 0.22 0.48 0.42 Employer payroll tax on employee stock transactions — — 0.01 0.01 Amortization of acquired intangible assets 0.03 0.02 0.06 0.04 Acquisition-related compensation 0.01 — 0.02 — Other restructuring charges 0.04 0.01 0.04 0.03 Net (gain) loss on strategic investments — — (0.01) — Provision for income taxes (1) — — 0.01 0.39 Adjustment to fully diluted earnings per share (2) 0.01 0.01 0.01 0.02 Non-GAAP net income per share, diluted $ 0.08 $ 0.04 $ 0.12 $ 0.06 *Certain figures may not sum due to rounding. (1) Effective in the first quarter of fiscal year 2027, the Company adopted a long-term projected non-GAAP tax rate of 17% to calculate non-GAAP net income. The projected rate reflects the Company’s expectations of its long-term tax structure and jurisdictional mix of income. (2) For periods in which we had diluted non-GAAP net income per share, the sum of the impact of individual reconciling items may not total to diluted non-GAAP net income per share because the basic share counts used to calculate GAAP net loss per share differ from the diluted share counts used to calculate non-GAAP net income per share, and because of rounding differences. The GAAP net loss per share calculation uses a lower share count as it excludes dilutive shares which are included in calculating the non-GAAP net income per share.
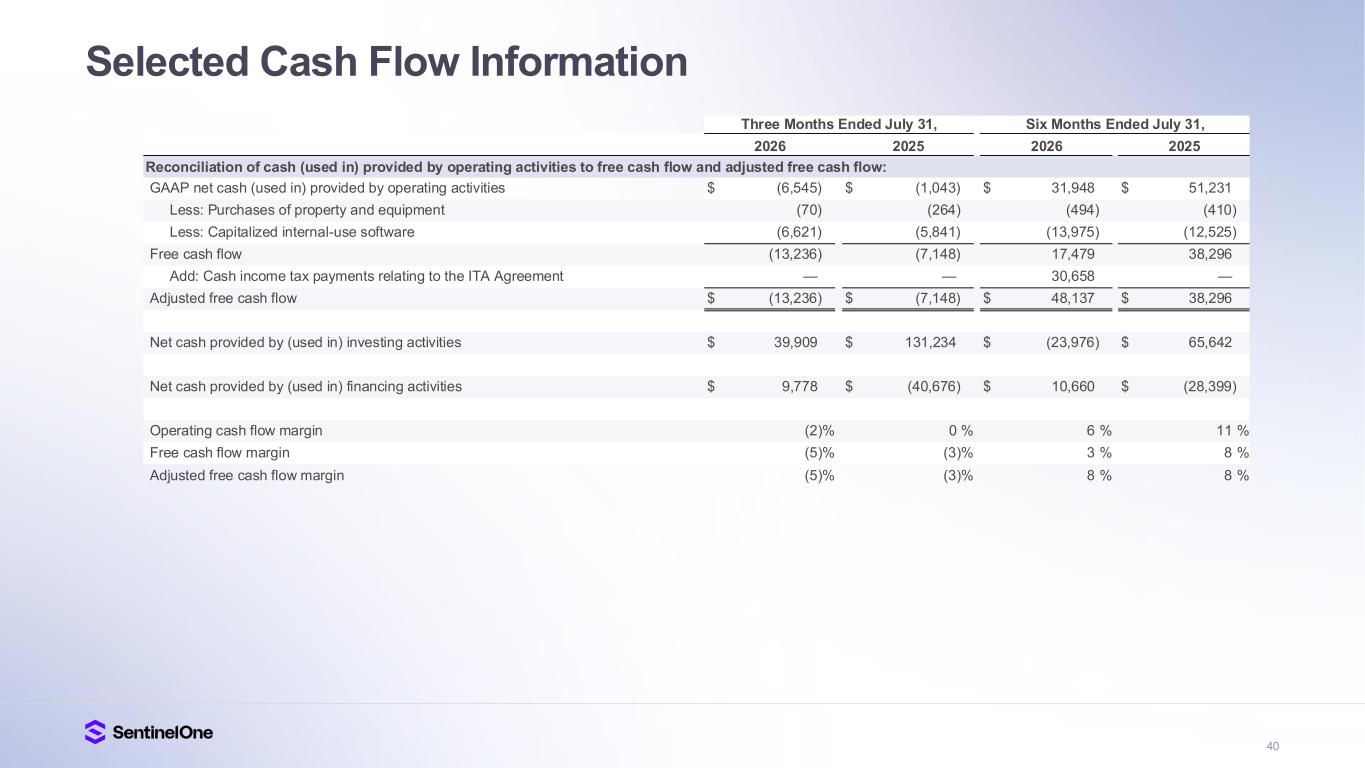
40 Selected Cash Flow Information Three Months Ended July 31, Six Months Ended July 31, 2026 2025 2026 2025 Reconciliation of cash (used in) provided by operating activities to free cash flow and adjusted free cash flow: GAAP net cash (used in) provided by operating activities $ (6,545) $ (1,043) $ 31,948 $ 51,231 Less: Purchases of property and equipment (70) (264) (494) (410) Less: Capitalized internal-use software (6,621) (5,841) (13,975) (12,525) Free cash flow (13,236) (7,148) 17,479 38,296 Add: Cash income tax payments relating to the ITA Agreement — — 30,658 — Adjusted free cash flow $ (13,236) $ (7,148) $ 48,137 $ 38,296 Net cash provided by (used in) investing activities $ 39,909 $ 131,234 $ (23,976) $ 65,642 Net cash provided by (used in) financing activities $ 9,778 $ (40,676) $ 10,660 $ (28,399) Operating cash flow margin (2)% 0 % 6 % 11 % Free cash flow margin (5)% (3)% 3 % 8 % Adjusted free cash flow margin (5)% (3)% 8 % 8 %
41SentinelOne®