
SERV 8-K
Serve Robotics Inc. /DE/ (SERV)
8-K
2025-11-12
For: 2025-11-12
View Original
Added on
April 05, 2026
UNITED STATES
SECURITIES AND EXCHANGE COMMISSION
Washington, D.C. 20549
FORM 8-K
CURRENT REPORT
Pursuant to Section 13 or 15(d) of the Securities Exchange Act of 1934
Date of Report (Date of earliest event reported): November 12, 2025

(Exact Name of Registrant as Specified in Charter)
| (State or Other Jurisdiction of Incorporation) | (Commission File Number) | (IRS Employer Identification No.) | ||||||||||||
| (Address of Principal Executive Offices) | (Zip Code) | |||||||
(818 ) 860-1352
(Registrant’s telephone number, including area code)
N/A
(Former Name or Former Address, if Changed Since Last Report)
Check the appropriate box below if the Form 8-K filing is intended to simultaneously satisfy the filing obligation of the registrant under any of the following provisions:
Securities registered pursuant to Section 12(b) of the Act:
| Title of each class | Trading Symbol(s) | Name of each exchange on which registered | ||||||||||||
The | ||||||||||||||
Indicate by check mark whether the registrant is an emerging growth company as defined in Rule 405 of the Securities Act of 1933 (§230.405 of this chapter) or Rule 12b-2 of the Securities Exchange Act of 1934 (§240.12b-2 of this chapter).
Emerging growth company ☒
If an emerging growth company, indicate by check mark if the registrant has elected not to use the extended transition period for complying with any new or revised financial accounting standards provided pursuant to Section 13(a) of the Exchange Act. ☐
Item 2.02. Results of Operations and Financial Condition.
On November 12, 2025, Serve Robotics Inc. (the “Company”) announced its financial results for the three months ended September 30, 2025. The full text of the press release issued in connection with the announcement is furnished as Exhibit 99.1 to this Current Report on Form 8-K.
Item 7.01. Regulation FD Disclosure.
On November 12, 2025, the Company made available on its website a revised Company investor presentation. A copy of the presentation is furnished as Exhibit 99.2 to this Current Report on Form 8-K.
The information in this Form 8-K (including Exhibits 99.1 and 99.2) shall not be deemed “filed” for purposes of Section 18 of the Securities Exchange Act of 1934, as amended (the “Exchange Act”), or otherwise subject to the liabilities of that section, nor shall it be deemed incorporated by reference in any filing under the Securities Act of 1933, as amended, or the Exchange Act, except as expressly set forth by specific reference in such a filing.
Item 9.01 Financial Statements and Exhibits.
(d)List of Exhibits.
Exhibit Number | Description | |||||||
| 99.1 | ||||||||
| 99.2 | ||||||||
| 104 | Cover Page Interactive Data File (embedded within the Inline XBRL document) | |||||||
1
SIGNATURES
Pursuant to the requirements of the Securities Exchange Act of 1934, the registrant has duly caused this report to be signed on its behalf by the undersigned hereunto duly authorized.
| Serve Robotics Inc. | |||||
Dated: November 12, 2025 | /s/ Ali Kashani | ||||
| Ali Kashani | |||||
| Chief Executive Officer and Director | |||||
Dated: November 12, 2025 | /s/ Brian Read | ||||
| Brian Read | |||||
| Chief Financial Officer | |||||
2
Exhibit 99.1

Serve Robotics Announces Third Quarter 2025 Results
•Delivery Volume growth of 66% quarter over quarter, a 300% increase from third quarter 2024
•Entered new multi-year strategic partnership with DoorDash to roll out deliveries across the U.S.
•Launched Chicago market, strengthening national presence; serving over 3,600 restaurants and a population of 3 million across the U.S.
•Third quarter revenue of $687 thousand, a 209% increase compared to third quarter 2024
•Ended the quarter with a strong liquidity position of $210 million and subsequently raised $100 million in a registered direct share offering
•10x revenue growth in 2026 based on preliminary projections
SAN FRANCISCO, November 12, 2025 -- Serve Robotics Inc. (the “Company” or “Serve”) (Nasdaq: SERV), a leading autonomous sidewalk delivery company, today announced financial results for the third quarter ended September 30, 2025.
“In Q3, our team once again delivered on our promises. Significantly, we’re on track to achieve our goal of deploying 2,000 robots before the end of the year,” said Dr. Ali Kashani, Serve’s co-founder and CEO. “We are now a national leader in sidewalk robotics, advancing towards a 10x increase in revenue next year. This positions Serve to establish the foundation for a future with a million robots deployed globally.”
“The relentless execution of our scale plan continues to drive consistent revenue growth,” said Brian Read, CFO of Serve. “We will continue to invest in key capabilities that strengthen our industry-leading autonomy and robotics platform, including integration of our recent Phantom Auto and Vayu acquisitions, to expand our increasingly diverse revenue stack.”
Business Highlights
•Continued Fleet Growth: Crossed the threshold of 1,000 robots deployed. Daily supply hours increased by over 713% compared to third quarter 2024.
•Continued Volume Growth: During third quarter 2025, delivery volume increased 66% sequentially from second quarter 2025.
•Expanded Reach: Significantly increased geographical coverage with the launch of the Chicago market. Coupled with recent expansion in Dallas, Miami, and Los Angeles, we now operate in areas encompassing over 3 million people and over 1 million households.
•Partnership Expansion: Launched new multi-year strategic partnership with DoorDash, expected to expand the potential volume of delivery orders available to Serve. Expanded existing partnerships with brands including Shake Shack and Little Caesars, and added new partners, including Jersey Mike’s Subs. Now delivering for over 3,600 restaurants across the U.S.
•Strategic acquisitions: Deepened competitive moat by acquiring Vayu, a pioneer in AI foundation model-based autonomy, as well as ultra-low latency teleoperation technology provider Phantom Auto. Investments expected to reduce data infrastructure costs and improve operational metrics over time.
Financial Highlights
•Revenue: Revenue of $687 thousand was in line with previous guidance. Fleet revenues increased 31% on a sequential basis to $433 thousand, including a 120% increase in branding revenues.
•Balance Sheet: Maintained a strong liquidity position of $210 million as of September 30, 2025. In October 2025, the Company completed an equity offering generating gross proceeds of $100 million.
•Outstanding Shares: Approximately 67.8 million shares of common stock outstanding as of September 30, 2025.
Outlook
•Guidance for FY2025: We anticipate generating over $2.5 million in revenue in 2025.
•Guidance for FY 2026: While full year guidance is expected to be provided in early 2026, current indications suggest we will deliver roughly 10x revenue growth in 2026.
•Fleet Scale: We expect to deploy our 2,000th robot ahead of schedule in mid-December 2025.
Quarterly Conference Call
Company management will host a conference call and webcast today at 2:00 p.m. PT / 5:00 p.m. ET to discuss the financial results and provide a corporate update. A live webcast and replay can be accessed from the investor relations page of Serve’s website at investors.serverobotics.com.
Individuals interested in listening to the conference call may do so by dialing 1-800-715-9871 and referencing conference ID 1738329.
Serve develops advanced, AI-powered, low-emissions sidewalk delivery robots that endeavor to make delivery sustainable and economical. Spun off from Uber in 2021 as an independent company, Serve has completed well over 100,000 deliveries for enterprise partners such as Uber Eats and 7-Eleven. Serve has scalable multi-year contracts, including a signed agreement to deploy up to 2,000 delivery robots on the Uber Eats platform across multiple U.S. markets, and an agreement to deliver on the DoorDash platform.
For further information about Serve (Nasdaq: SERV), please visit www.serverobotics.com or follow us on social media via X (Twitter), Instagram, or LinkedIn @serverobotics.
Supplemental Financial Information
The key metrics and financial tables outlined below are metrics that provide management with additional understanding of the drivers of business performance and the Company’s ability to deliver stockholder return. Investors should not place undue reliance on these metrics as indicators of future or expected results. The Company’s presentation of these metrics may differ from similarly titled metrics presented by other companies and therefore comparability may be limited.
Table 1
Key Metrics
(unaudited)
| Three Months Ended | Nine Months Ended | ||||||||||||||||||||||||||||
| September 30, 2025 | June 30, 2025 | September 30, 2024 | September 30, 2025 | September 30, 2024 | |||||||||||||||||||||||||
Daily Active Robots (1) | 312 | 160 | 59 | 182 | 49 | ||||||||||||||||||||||||
Daily Supply Hours (2) | 3,781 | 1,723 | 465 | 2,062 | 384 | ||||||||||||||||||||||||
(1)Daily Active Robots: The Company defines daily active robots as the average number of robots performing daily deliveries during the period.
(2)Daily Supply Hours: The Company defines daily supply hours as the average number of hours the Company’s robots are ready to accept offers and perform daily deliveries during the period.
Table 2
Disaggregation of Revenue
2
(in thousands)
(unaudited)
| Three Months Ended | Nine Months Ended | ||||||||||||||||||||||
| September 30, 2025 | June 30, 2025 | September 30, 2024 | September 30, 2025 | September 30, 2024 | |||||||||||||||||||
| Software services | $ | 254 | $ | 312 | $ | 39 | $ | 795 | $ | 1,186 | |||||||||||||
| Fleet services | 433 | 330 | 183 | 974 | 451 | ||||||||||||||||||
| $ | 687 | $ | 642 | $ | 222 | $ | 1,769 | $ | 1,637 | ||||||||||||||
Forward Looking Statements
This Serve Robotics Inc. press release contains “forward-looking statements,” within the meaning of Section 27A of the Securities Act of 1933, Section 21E of the Securities Exchange Act of 1934 and the Private Securities Litigation Reform Act of 1995. Forward-looking statements may be identified by the context of the statement and generally arise when we or our management are discussing our beliefs, estimates or expectations. Such statements generally include the words “believes,” “plans,” “intends,” “targets,” “may,” “could,” “should,” “will,” “expects,” “estimates,” “suggests,” “anticipates,” “outlook,” “continues,” “guidance,” “projects,” or similar expressions. These statements are not historical facts or guarantees of future performance, but represent management’s belief at the time the statements were made regarding future events which are subject to certain risks, uncertainties and other factors, many of which are outside of our control. Actual results and outcomes may differ materially from what is expressed or forecast in such forward-looking statements. Forward-looking statements include, without limitation, statements regarding the Company’s future revenue generation, timing of the Company’s robot deployment, the Company’s ability to expand to additional markets, capabilities of the Company’s robots, the Company’s operational efficiency, and the Company’s timing and ability to scale to commercial production.
The forward-looking statements contained in this press release are also subject to other risks and uncertainties, including those more fully described in our filings with the Securities and Exchange Commission (“SEC”), including in the sections entitled “Risk Factors” and “Management’s Discussion and Analysis of Financial Condition and Results of Operations” in our Annual Report on Form 10-K for the year ended December 31, 2024, and in the Company’s subsequent SEC filings. The Company can give no assurance that the plans, intentions, expectations or strategies as reflected in or suggested by those forward-looking statements will be attained or achieved. The forward-looking statements in this presentation are based on information available to the Company as of the date hereof, and the Company disclaims any obligation to update any forward-looking statements, except as required by law. These forward-looking statements should not be relied upon as representing the Company’s views as of any date subsequent to the date of this presentation.
Non-GAAP Measures of Financial Performance
To supplement the Company’s financial statements, which are presented on the basis of U.S. generally accepted accounting principles (“GAAP”), the following non-GAAP measures of financial performance are included in this release: non-GAAP general and administrative expense, non-GAAP research and development expense, non-GAAP operations expense, non-GAAP sales and marketing expense, non-GAAP operating expense, adjusted EBITDA, non-GAAP net loss and non-GAAP basic and diluted net loss per Common share.
The Company believes that providing this non-GAAP information in addition to the GAAP financial information allows investors to view the financial results in the way the Company views its operating results. The Company also believes that providing this information allows investors to not only better understand the Company’s financial performance but also better evaluate the information used by management to evaluate and measure such performance.
As such, the Company believes that disclosing non-GAAP financial measures to the readers of its financial statements provides the reader with useful supplemental information that allows for greater transparency in the review of the company’s financial and operational performance. The Company defines its non-GAAP measures by excluding stock-based compensation, amortization, transaction costs and finance lease purchase option.
3
Reconciliations of GAAP to these adjusted non-GAAP financial measures are included in the tables presented. When analyzing the Company’s operating results, investors should not consider non-GAAP measures as substitutes for the comparable financial measures prepared in accordance with GAAP.
To the extent that the Company presents any forward-looking non-GAAP financial measures, the Company does not present a quantitative reconciliation of such measures to the most directly comparable GAAP financial measure (or otherwise present such forward-looking GAAP measures) because it is impractical to do so.
Contacts
Media
Aduke Thelwell, VP of Communications
Investor Relations
Sheldon Hanai, Head of Investor Relations
4
Table 3
Serve Robotics Inc.
Condensed Consolidated Balance Sheets
(in thousands)
(unaudited)
| September 30, 2025 | December 31, 2024 | ||||||||||
| ASSETS | |||||||||||
| Current assets: | |||||||||||
| Cash and cash equivalents | $ | 116,839 | $ | 123,266 | |||||||
| Short-term marketable securities | 93,608 | - | |||||||||
| Accounts receivable, net | 805 | 87 | |||||||||
| Inventory | - | 310 | |||||||||
| Prepaid expenses | 7,626 | 1,397 | |||||||||
| Other receivables | 688 | 192 | |||||||||
| Other current assets | 133 | - | |||||||||
| Total current assets | 219,699 | 125,252 | |||||||||
| Property and equipment, net | 30,057 | 11,963 | |||||||||
| Intangible assets, net | 36,310 | - | |||||||||
Goodwill | 8,810 | - | |||||||||
| Operating lease right-of-use assets | 4,021 | 1,808 | |||||||||
| Other non-current assets | 612 | 578 | |||||||||
| Total assets | $ | 299,509 | $ | 139,601 | |||||||
| LIABILITIES AND STOCKHOLDERS’ EQUITY (DEFICIT) | |||||||||||
| Current liabilities: | |||||||||||
| Accounts payable | $ | 7,748 | $ | 4,902 | |||||||
| Accrued liabilities | 3,343 | 655 | |||||||||
| Deferred revenue | 3 | 20 | |||||||||
| Operating lease liabilities, current | 1,669 | 666 | |||||||||
| Financing lease liabilities, current | - | 564 | |||||||||
| Total current liabilities | 12,763 | 6,807 | |||||||||
| Operating lease liabilities, non-current | 2,478 | 1,113 | |||||||||
| Total liabilities | 15,241 | 7,920 | |||||||||
| Stockholders’ equity: | |||||||||||
| Ordinary and preferred shares | 7 | 5 | |||||||||
| Additional paid-in capital | 458,808 | 239,201 | |||||||||
Accumulated other comprehensive income (loss) | 65 | - | |||||||||
| Accumulated deficit | (174,612) | (107,525) | |||||||||
| Total stockholders’ equity | 284,268 | 131,681 | |||||||||
| Total liabilities and stockholders’ equity | $ | 299,509 | $ | 139,601 | |||||||
5
Table 4
Serve Robotics Inc.
Condensed Consolidated Statement of Operations
(in thousands, except share and per share data)
(unaudited)
| Three Months Ended | Nine Months Ended | ||||||||||||||||||||||||||||
| September 30, 2025 | June 30, 2025 | September 30, 2024 | September 30, 2025 | September 30, 2024 | |||||||||||||||||||||||||
| Revenues | $ | 687 | $ | 642 | $ | 222 | $ | 1,769 | $ | 1,637 | |||||||||||||||||||
| Cost of revenues | 5,066 | 3,501 | 378 | 10,476 | 1,056 | ||||||||||||||||||||||||
| Gross profit (loss) | (4,379) | (2,859) | (156) | (8,707) | 581 | ||||||||||||||||||||||||
| Operating expenses: | |||||||||||||||||||||||||||||
| General and administrative | 13,153 | 8,078 | 1,980 | 25,981 | 4,861 | ||||||||||||||||||||||||
| Operations | 2,987 | 2,124 | 917 | 6,780 | 2,330 | ||||||||||||||||||||||||
| Research and development | 13,414 | 9,120 | 5,008 | 29,414 | 17,434 | ||||||||||||||||||||||||
| Sales and marketing | 883 | 463 | 384 | 1,585 | 668 | ||||||||||||||||||||||||
| Total operating expenses | 30,437 | 19,785 | 8,289 | 63,760 | 25,293 | ||||||||||||||||||||||||
| Loss from operations | (34,816) | (22,644) | (8,445) | (72,467) | (24,712) | ||||||||||||||||||||||||
| Other income (expense): | |||||||||||||||||||||||||||||
| Interest income | 1,707 | 1,794 | 483 | 5,293 | 789 | ||||||||||||||||||||||||
| Interest expense | - | - | (34) | (3) | (1,926) | ||||||||||||||||||||||||
| Realized gain on foreign currency translation | 4 | - | - | 4 | - | ||||||||||||||||||||||||
| Realized gain on investments | 85 | - | - | 85 | - | ||||||||||||||||||||||||
| Change in fair value of derivative liability | - | - | - | - | (222) | ||||||||||||||||||||||||
| Total other income (expense) | 1,796 | 1,794 | 449 | 5,379 | (1,359) | ||||||||||||||||||||||||
| Provision for income taxes | - | - | - | - | - | ||||||||||||||||||||||||
| Net loss | (33,020) | (20,850) | (7,996) | (67,088) | (26,071) | ||||||||||||||||||||||||
Other comprehensive loss: | |||||||||||||||||||||||||||||
Unrealized loss on foreign currency translation | (343) | 343 | - | - | 343 | ||||||||||||||||||||||||
Unrealized gain on investments | 110 | (45) | - | 65 | (45) | ||||||||||||||||||||||||
Comprehensive loss | $ | (33,253) | $ | (20,552) | $ | (7,996) | $ | (67,023) | $ | (25,773) | |||||||||||||||||||
| Weighted average common shares outstanding - basic and diluted | 61,343,218 | 57,514,808 | 40,586,781 | 58,472,679 | 33,267,589 | ||||||||||||||||||||||||
| Net loss per common share - basic and diluted | $ | (0.54) | $ | (0.36) | $ | (0.20) | $ | (1.15) | $ | (0.78) | |||||||||||||||||||
6
Table 5
Serve Robotics Inc.
Condensed Consolidated Statement of Cash Flows
(in thousands)
(unaudited)
| Nine Months Ended September 30, | |||||||||||
| 2025 | 2024 | ||||||||||
| Cash flows from operating activities: | |||||||||||
| Net loss | $ | (67,088) | $ | (26,071) | |||||||
| Adjustments to reconcile net loss to net cash used in operating activities: | |||||||||||
| Depreciation & amortization | 3,387 | 37 | |||||||||
| Stock-based compensation | 14,919 | 9,930 | |||||||||
Accretion of discount on available-for-sale securities | (548) | - | |||||||||
| Amortization of debt discount | - | 1,678 | |||||||||
| Change in fair value of derivative liability | - | 222 | |||||||||
Changes in operating assets and liabilities, net of effects of business acquired: | |||||||||||
| Accounts receivable, net | (718) | (10) | |||||||||
| Inventory | - | 447 | |||||||||
| Prepaid expenses | (6,229) | (2,776) | |||||||||
Other receivables | (496) | (180) | |||||||||
Other current assets | (133) | - | |||||||||
| Accounts payable | 3,479 | 1,556 | |||||||||
| Accrued liabilities | 2,688 | (111) | |||||||||
Deferred revenue | (17) | 14 | |||||||||
Operating lease liabilities, net | 155 | (15) | |||||||||
| Net cash used in operating activities | (50,601) | (15,279) | |||||||||
| Cash flows from investing activities: | |||||||||||
Purchases of property and equipment | (20,831) | (5,395) | |||||||||
Purchases of marketable securities | (125,785) | - | |||||||||
Proceeds from maturity of marketable securities | 32,500 | - | |||||||||
Acquisition, net of cash acquired | (7,504) | - | |||||||||
Security deposits | (119) | - | |||||||||
Capitalized software | (405) | - | |||||||||
| Net cash used in investing activities | (122,144) | (5,395) | |||||||||
7
| Cash flows from financing activities: | |||||||||||
| Proceeds from issuance of common stock, net of offering costs | 75,847 | 35,849 | |||||||||
Proceeds from issuance of common stock under the 2025 Equity Distribution Agreement, net of offering costs | 78,767 | - | |||||||||
| Proceeds from issuance of prefunded warrants to purchase common stock in connection with private placement, net of issuance costs | - | 17,116 | |||||||||
Proceeds from exercise of warrants | 11,381 | 16,325 | |||||||||
Proceeds from convertible notes payable, net of offering costs | - | 4,845 | |||||||||
Proceeds from exercise of options | 405 | 87 | |||||||||
| Proceeds from short-swing profit disgorgement | 48 | - | |||||||||
Repayments of note payable | - | (1,250) | |||||||||
Repayments of notes payable, related party | - | (70) | |||||||||
Repayment of financing lease liability | (186) | (1,322) | |||||||||
| Net cash provided by financing activities | 166,262 | 71,580 | |||||||||
Effect of exchange rate changes on cash and cash equivalents | 56 | - | |||||||||
| Net change in cash and cash equivalents | $ | (6,427) | $ | 50,906 | |||||||
| Cash and cash equivalents at beginning of period | $ | 123,266 | $ | 7 | |||||||
| Cash and cash equivalents at end of period | $ | 116,839 | $ | 50,913 | |||||||
8
Table 6
Reconciliation of GAAP Net Losses to Adjusted EBITDA
(in thousands)
(unaudited)
| Three Months Ended | Nine Months Ended | |||||||||||||||||||||||||
| September 30, 2025 | June 30, 2025 | September 30, 2024 | September 30, 2025 | September 30, 2024 | ||||||||||||||||||||||
| Net loss on GAAP basis | (33,020) | (20,850) | (7,996) | (67,088) | (26,071) | |||||||||||||||||||||
| Interest income | (1,707) | (1,794) | (483) | (5,293) | (789) | |||||||||||||||||||||
| Interest expense | - | - | 34 | 3 | 1,926 | |||||||||||||||||||||
| Depreciation & amortization | 2,095 | 817 | 9 | 3,387 | 37 | |||||||||||||||||||||
| Stock-based compensation | 6,642 | 4,398 | 2,195 | 14,919 | 9,930 | |||||||||||||||||||||
Acquisition related expenses | 1,040 | 239 | - | 1,279 | - | |||||||||||||||||||||
| Finance lease purchase option | - | 2,246 | - | 2,246 | - | |||||||||||||||||||||
| Adjusted EBITDA | (24,950) | (14,944) | (6,241) | (50,547) | (14,967) | |||||||||||||||||||||
9
Table 7
Reconciliation of GAAP Measures to Non-GAAP Measures
(in thousands, except share and per share data)
(unaudited)
| Three Months Ended | Nine Months Ended | |||||||||||||||||||||||||
| September 30, 2025 | June 30, 2025 | September 30, 2024 | September 30, 2025 | September 30, 2024 | ||||||||||||||||||||||
| GAAP cost of sales | $ | 5,066 | $ | 3,501 | $ | 378 | $ | 10,476 | $ | 1,056 | ||||||||||||||||
| Stock-based compensation | - | - | - | - | - | |||||||||||||||||||||
| Non-GAAP cost of sales | 5,066 | 3,501 | 378 | 10,476 | 1,056 | |||||||||||||||||||||
| GAAP general & administrative expense | $ | 13,153 | $ | 8,078 | $ | 1,980 | $ | 25,981 | $ | 4,861 | ||||||||||||||||
| Stock-based compensation | 3,712 | 2,061 | 386 | 7,597 | 617 | |||||||||||||||||||||
| Finance lease purchase option | - | 2,246 | - | 2,246 | - | |||||||||||||||||||||
Acquisition related expenses | 1,040 | 239 | - | 1,279 | - | |||||||||||||||||||||
Amortization expense | 913 | 23 | - | 936 | - | |||||||||||||||||||||
| Non-GAAP general and administrative expense | 7,488 | 3,509 | 1,594 | 13,923 | 4,244 | |||||||||||||||||||||
| GAAP operations expense | $ | 2,987 | $ | 2,124 | $ | 917 | $ | 6,780 | $ | 2,330 | ||||||||||||||||
| Stock-based compensation | 147 | 96 | 47 | 323 | 191 | |||||||||||||||||||||
| Non-GAAP operations expense | 2,840 | 2,028 | 870 | 6,457 | 2,139 | |||||||||||||||||||||
| GAAP research and development expense | $ | 13,414 | $ | 9,120 | $ | 5,008 | $ | 29,414 | $ | 17,434 | ||||||||||||||||
| Stock-based compensation | 2,680 | 2,159 | 1,741 | 6,767 | 9,046 | |||||||||||||||||||||
| Non-GAAP research and development expense | 10,734 | 6,961 | 3,267 | 22,647 | 8,388 | |||||||||||||||||||||
| GAAP sales and marketing expense | $ | 883 | $ | 463 | $ | 384 | $ | 1,585 | $ | 668 | ||||||||||||||||
| Stock-based compensation | 103 | 83 | 21 | 232 | 76 | |||||||||||||||||||||
Amortization expense | 2 | - | - | 2 | - | |||||||||||||||||||||
| Non-GAAP sales and marketing expense | 778 | 380 | 363 | 1,351 | 592 | |||||||||||||||||||||
| GAAP operating expense | $ | 30,437 | $ | 19,785 | $ | 8,289 | $ | 63,760 | $ | 25,293 | ||||||||||||||||
| Stock-based compensation | 6,642 | 4,398 | 2,195 | 14,919 | 9,930 | |||||||||||||||||||||
| Finance lease purchase option | - | 2,246 | - | 2,246 | - | |||||||||||||||||||||
| Acquisition related expenses | 1,040 | 239 | - | 1,279 | - | |||||||||||||||||||||
Amortization expense | 915 | 23 | - | 938 | - | |||||||||||||||||||||
| Non-GAAP operating expenses | 21,840 | 12,879 | 6,094 | 44,378 | 15,363 | |||||||||||||||||||||
| GAAP net loss | $ | (33,020) | $ | (20,850) | $ | (7,996) | $ | (67,088) | $ | (26,071) | ||||||||||||||||
| Stock-based compensation | 6,642 | 4,398 | 2,195 | 14,919 | 9,930 | |||||||||||||||||||||
| Finance lease purchase option | - | 2,246 | - | 2,246 | - | |||||||||||||||||||||
Acquisition related expenses | 1,040 | 239 | - | 1,279 | - | |||||||||||||||||||||
Amortization expense | 915 | 23 | - | 938 | - | |||||||||||||||||||||
| Non-GAAP net loss | (24,423) | (13,944) | (5,801) | (47,706) | (16,141) | |||||||||||||||||||||
| Weighted average common shares outstanding - basic and diluted | 61,343,218 | 57,514,808 | 40,586,781 | 58,472,679 | 33,267,589 | |||||||||||||||||||||
| GAAP basic and diluted net loss per Common share | $ | (0.54) | $ | (0.36) | $ | (0.20) | $ | (1.15) | $ | (0.78) | ||||||||||||||||
| Non-GAAP basic and diluted net loss per Common share | $ | (0.40) | $ | (0.24) | $ | (0.14) | $ | (0.82) | $ | (0.49) | ||||||||||||||||
10
© 2025 Serve Robotics Inc. All rights reserved. Investor Presentation November 2025
Disclaimer FORWARD LOOKING STATEMENTS This Serve Robotics Inc. (the “Company”) investor presentation contains “forward-looking statements,” within the meaning of Section 27A of the Securities Act of 1933, as amended, Section 21E of the Securities Exchange Act of 1934, as amended, and the Private Securities Litigation Reform Act of 1995. Forward-looking statements may be identified by the context of the statement and generally arise when we or our management are discussing our beliefs, estimates or expectations. Such statements generally include the words “believes,” “plans,” “intends,” “targets,” “may,” “could,” “should,” “will,” “expects,” “estimates,” “suggests,” “anticipates,” “outlook,” “continues,” “guidance,” “projects” or similar expressions. These statements are not historical facts or guarantees of future performance, but represent management’s belief at the time the statements were made regarding future events which are subject to certain risks, uncertainties and other factors, many of which are outside of our control. Actual results and outcomes may differ materially from what is expressed or forecast in such forward-looking statements. Forward-looking statements include, without limitation, statements regarding the Company’s partnership with Magna, the Company’s future revenue generation, timing of the Company’s robot deployment, the Company’s ability to expand to additional markets, capabilities of the Company’s robots, outcomes of planned acquisitions, and the Company’s timing and ability to scale to commercial production. The forward-looking statements contained in this investor presentation are also subject to other risks and uncertainties, including those more fully described in our filings with the Securities and Exchange Commission (“SEC”), including in the sections entitled “Risk Factors” and “Management’s Discussion and Analysis of Financial Condition and Results of Operations'' in our Annual Report on Form 10-K for the year ended December 31, 2024 and in the Company’s subsequent SEC filings. The Company can give no assurance that the plans, intentions, expectations or strategies as reflected in or suggested by those forward-looking statements will be attained or achieved. The forward-looking statements in this presentation are based on information available to the Company as of the date hereof, and the Company disclaims any obligation to update any forward-looking statements, except as required by law. These forward-looking statements should not be relied upon as representing the Company’s views as of any date subsequent to the date of this presentation. INDUSTRY AND MARKET DATA In this presentation, the Company relies on and refers to information and statistics regarding the sectors in which the Company competes and other industry data. the Company obtained this information and statistics from third-party sources, including reports by market research firms. Although the Company believes these sources are reliable, the Company has not independently verified the information and does not guarantee its accuracy and completeness. The Company has supplemented this information where necessary with information from discussions with customers and the Company’s own internal estimates, taking into account publicly available information about other industry participants and the Company’s management’s best view as to information that is not publicly available. TRADEMARKS AND TRADE NAMES The Company owns or has rights to various trademarks, service marks and trade names that it uses in connection with the operation of its business. This presentation also contains trademarks, service marks and trade names of third parties, which are the property of their respective owners The use or display of third parties’ trademarks, service marks. trade names or products in this presentation is not intended in. and does not imply. a relationship with the Company or an endorsement or sponsorship by or of the Company. Solely for convenience, the trademarks. service marks and trade names referred to in this presentation may appear without the ©, ™ or SM symbols, but such references are not intended to indicate, in any way, that the Company will not assert, to the fullest extent under applicable law, its rights or the right of the applicable licensor in these trademarks, service marks and trade names. 2
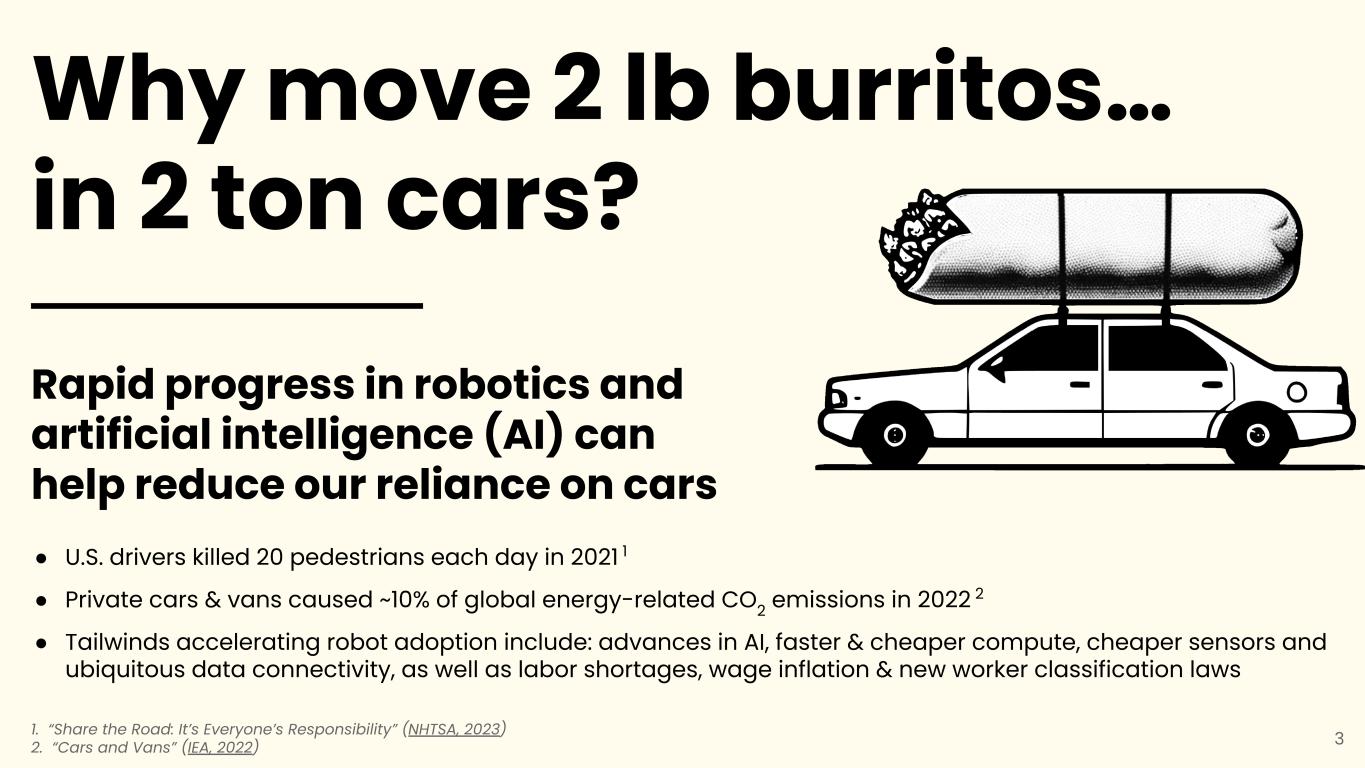
Rapid progress in robotics and artificial intelligence (AI) can help reduce our reliance on cars ● U.S. drivers killed 20 pedestrians each day in 2021 1 ● Private cars & vans caused ~10% of global energy-related CO2 emissions in 2022 2 ● Tailwinds accelerating robot adoption include: advances in AI, faster & cheaper compute, cheaper sensors and ubiquitous data connectivity, as well as labor shortages, wage inflation & new worker classification laws 1. “Share the Road: It’s Everyone’s Responsibility” (NHTSA, 2023) 2. “Cars and Vans” (IEA, 2022) Why move 2 lb burritos… in 2 ton cars? 3
https://youtu.be/n9MJorTjpxU 4
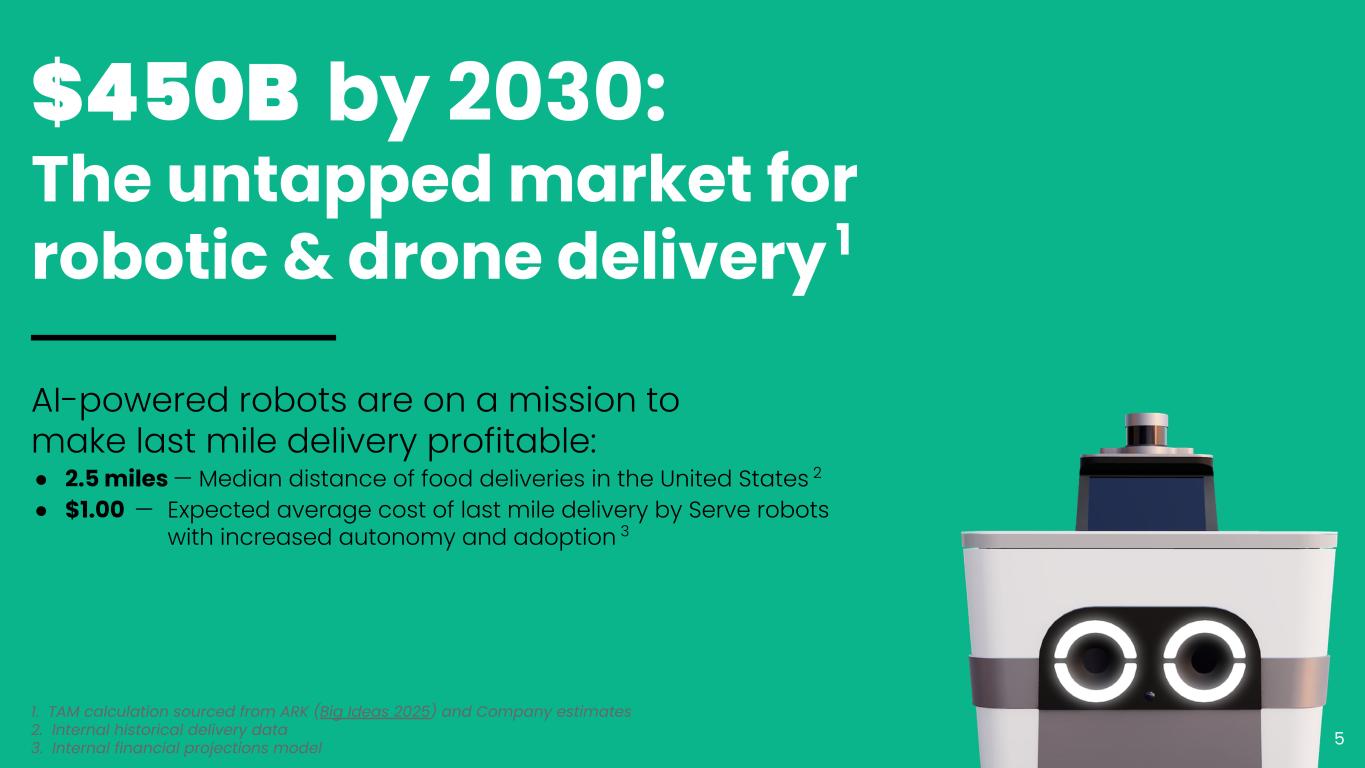
$450B by 2030: The untapped market for robotic & drone delivery 1 1. TAM calculation sourced from ARK (Big Ideas 2025) and Company estimates 2. Internal historical delivery data 3. Internal financial projections model AI-powered robots are on a mission to make last mile delivery profitable: ● 2.5 miles — Median distance of food deliveries in the United States 2 ● $1.00 — Expected average cost of last mile delivery by Serve robots with increased autonomy and adoption 3 5
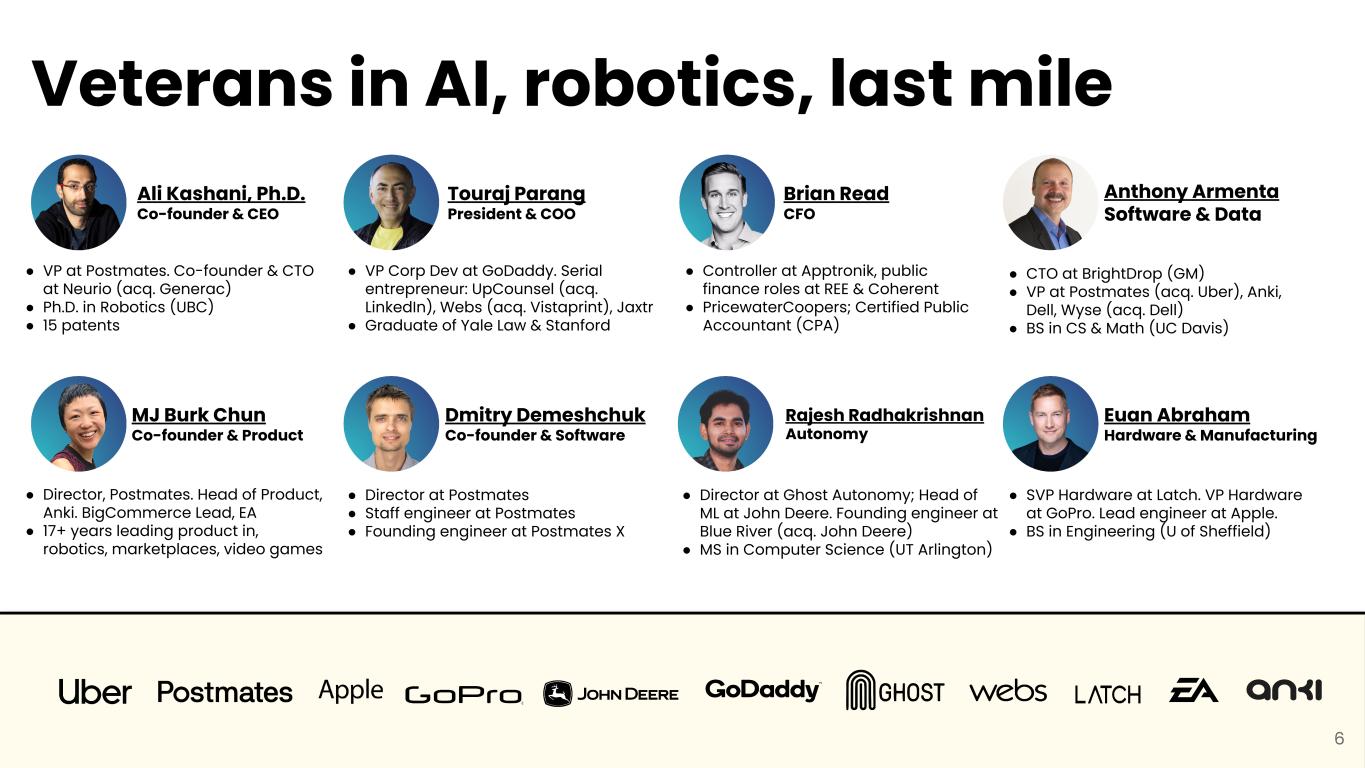
6 Veterans in AI, robotics, last mile ● VP at Postmates. Co-founder & CTO at Neurio (acq. Generac) ● Ph.D. in Robotics (UBC) ● 15 patents Ali Kashani, Ph.D. Co-founder & CEO ● Director at Postmates ● Staff engineer at Postmates ● Founding engineer at Postmates X Dmitry Demeshchuk Co-founder & Software ● Director, Postmates. Head of Product, Anki. BigCommerce Lead, EA ● 17+ years leading product in, robotics, marketplaces, video games MJ Burk Chun Co-founder & Product ● VP Corp Dev at GoDaddy. Serial entrepreneur: UpCounsel (acq. LinkedIn), Webs (acq. Vistaprint), Jaxtr ● Graduate of Yale Law & Stanford Touraj Parang President & COO ● SVP Hardware at Latch. VP Hardware at GoPro. Lead engineer at Apple. ● BS in Engineering (U of Sheffield) Euan Abraham Hardware & Manufacturing Brian Read CFO ● Controller at Apptronik, public finance roles at REE & Coherent ● PricewaterCoopers; Certified Public Accountant (CPA) Rajesh Radhakrishnan Autonomy ● Director at Ghost Autonomy; Head of ML at John Deere. Founding engineer at Blue River (acq. John Deere) ● MS in Computer Science (UT Arlington) ● CTO at BrightDrop (GM) ● VP at Postmates (acq. Uber), Anki, Dell, Wyse (acq. Dell) ● BS in CS & Math (UC Davis) Anthony Armenta Software & Data
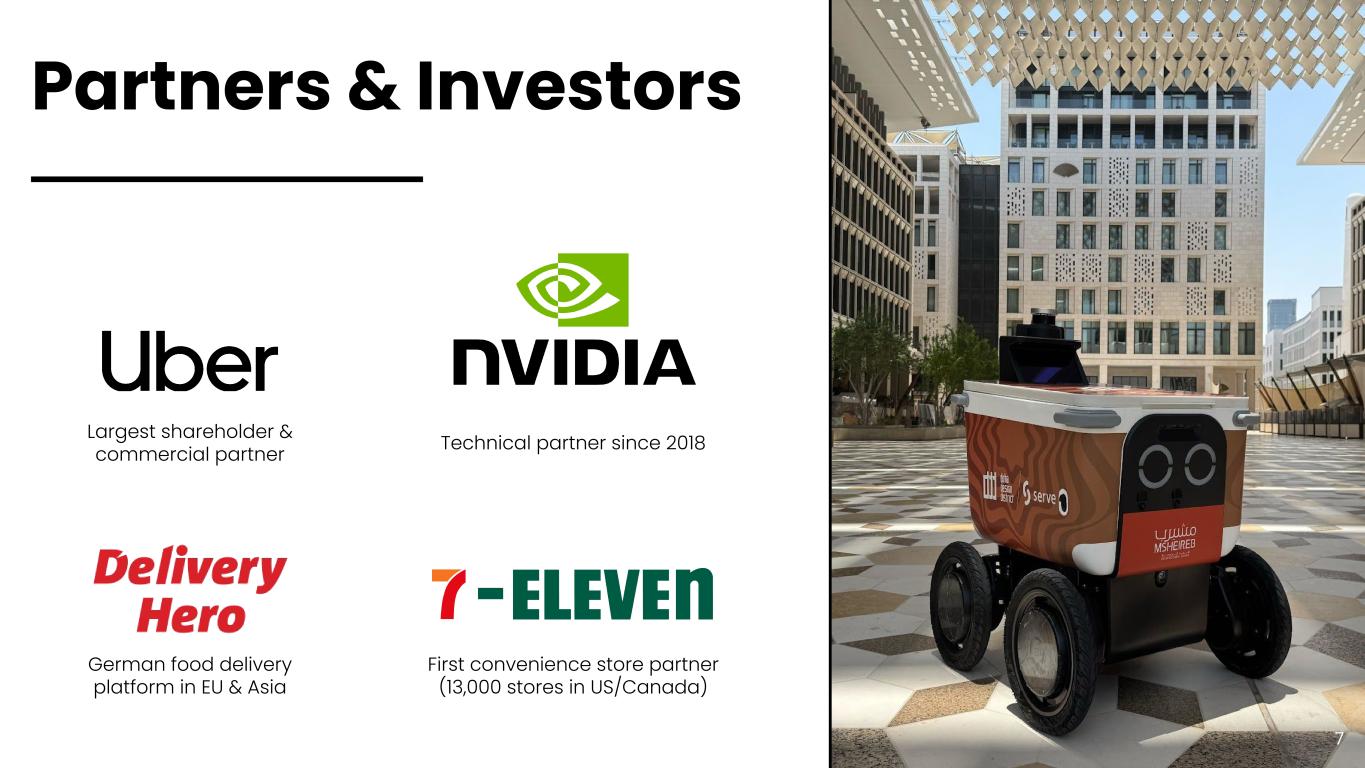
Partners & Investors 7 Technical partner since 2018Largest shareholder & commercial partner German food delivery platform in EU & Asia First convenience store partner (13,000 stores in US/Canada)
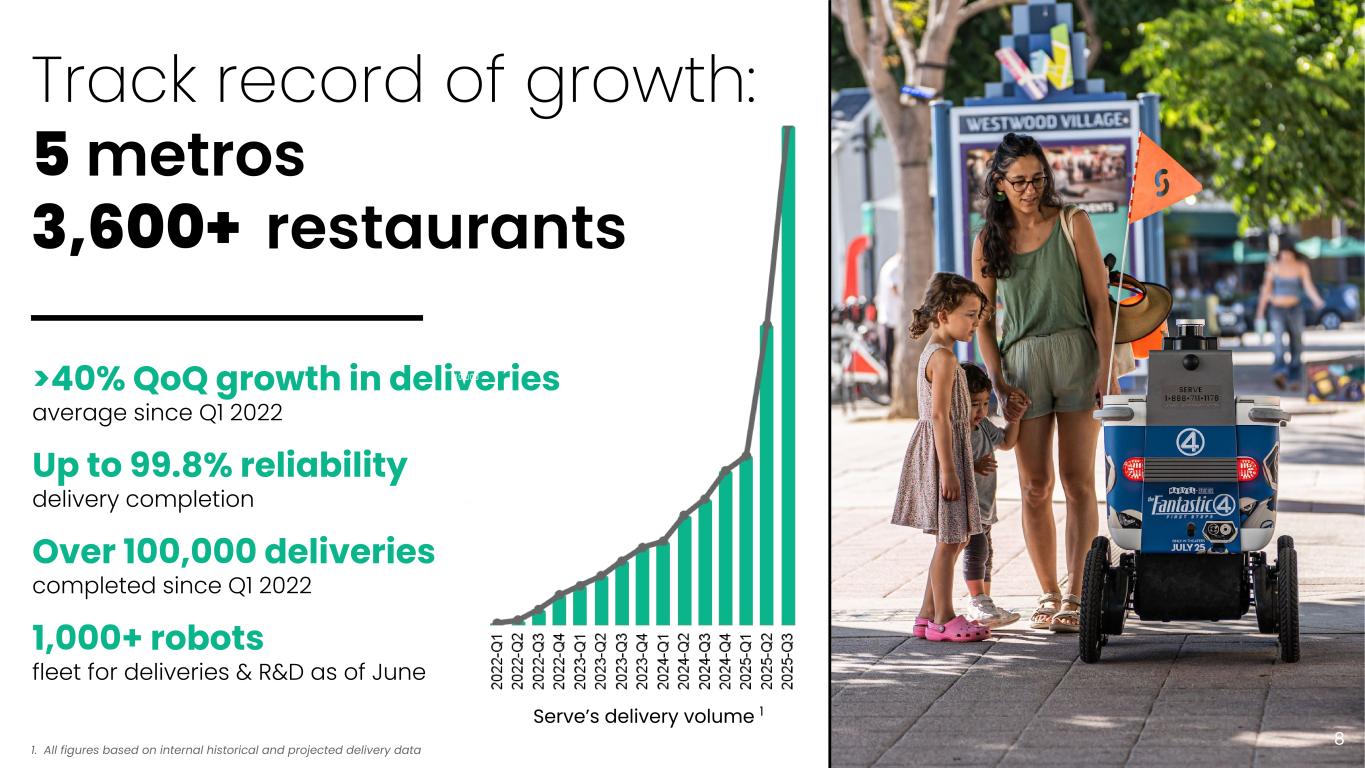
Track record of growth: 5 metros 3,600+ restaurants 8 Serve’s delivery volume 1 >40% QoQ growth in deliveries average since Q1 2022 Up to 99.8% reliability delivery completion Over 100,000 deliveries completed since Q1 2022 1,000+ robots fleet for deliveries & R&D as of June 1. All figures based on internal historical and projected delivery data Serve’s Los Angeles Fleet
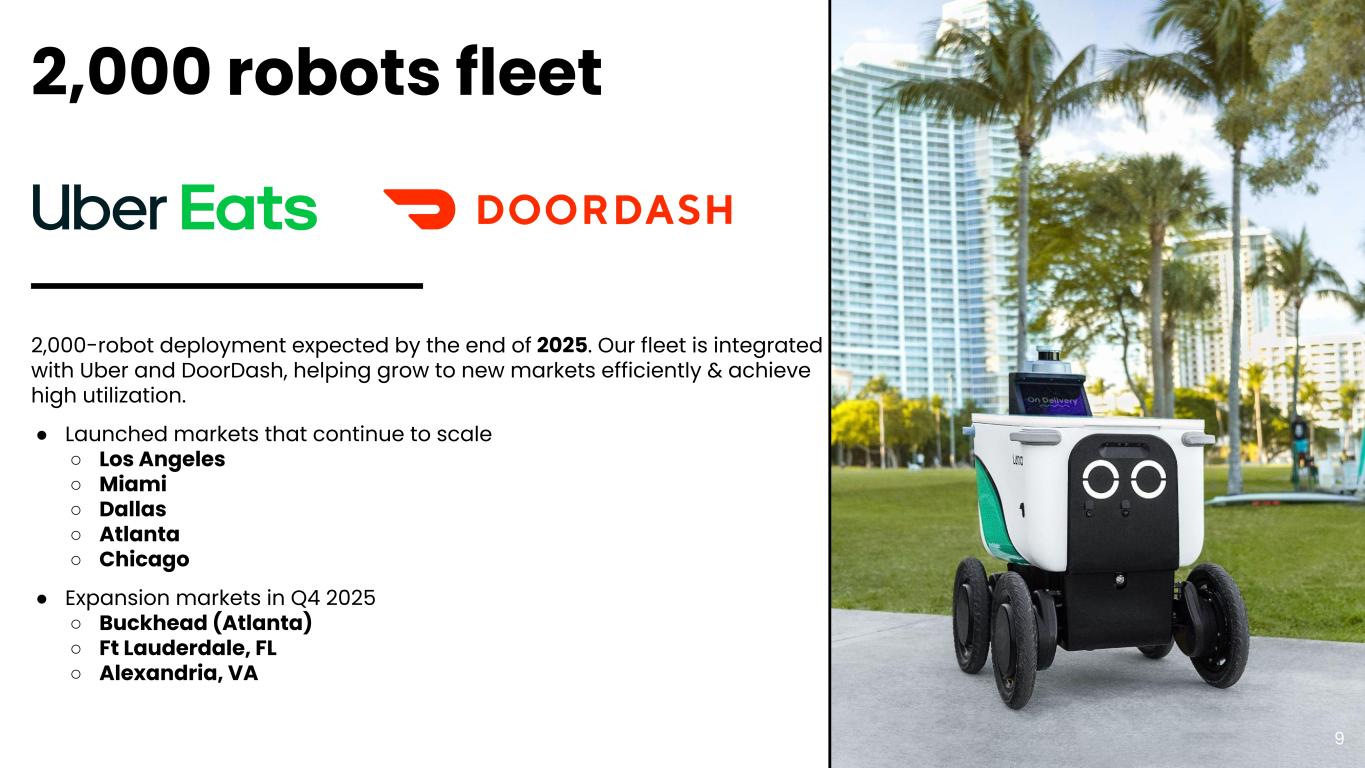
2,000 robots fleet 9 2,000-robot deployment expected by the end of 2025. Our fleet is integrated with Uber and DoorDash, helping grow to new markets efficiently & achieve high utilization. ● Launched markets that continue to scale ○ Los Angeles ○ Miami ○ Dallas ○ Atlanta ○ Chicago ● Expansion markets in Q4 2025 ○ Buckhead (Atlanta) ○ Ft Lauderdale, FL ○ Alexandria, VA
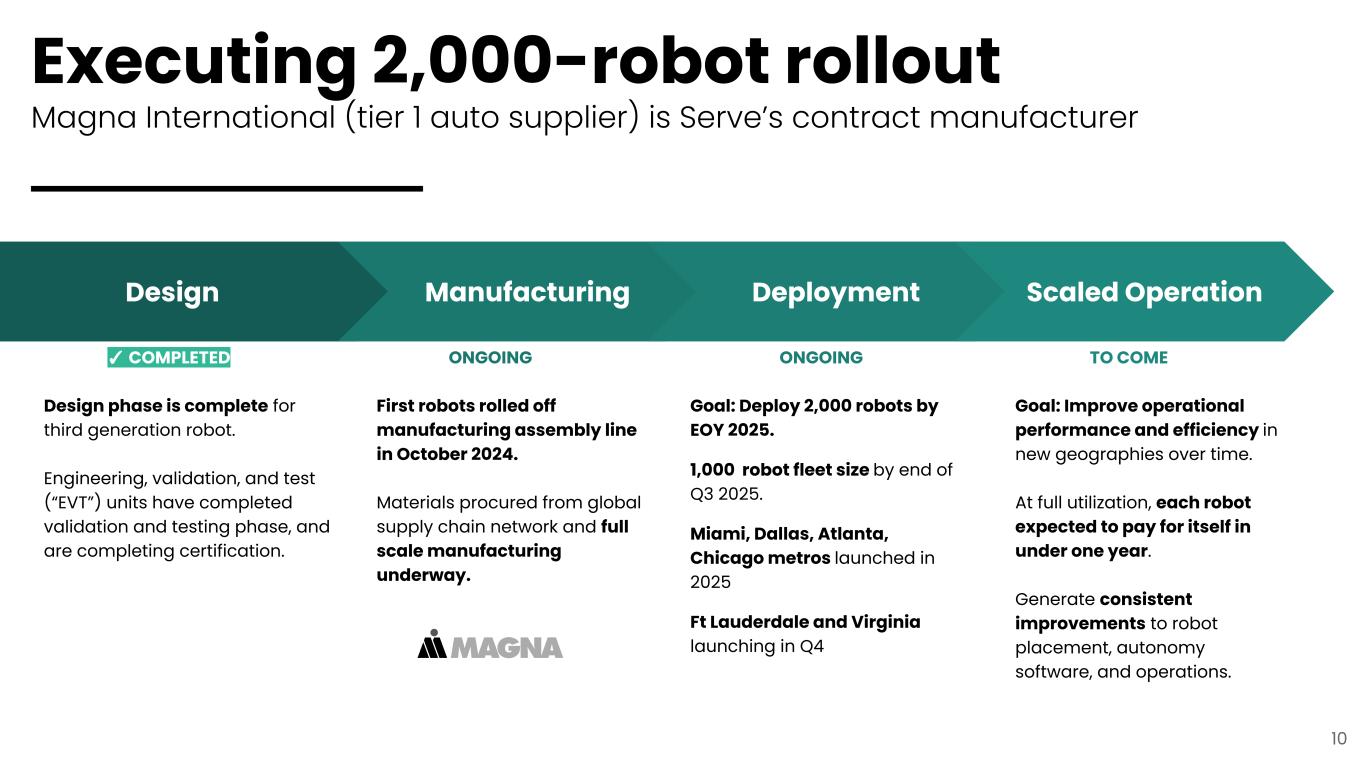
First robots rolled off manufacturing assembly line in October 2024. Materials procured from global supply chain network and full scale manufacturing underway. Design Design phase is complete for third generation robot. Engineering, validation, and test (“EVT”) units have completed validation and testing phase, and are completing certification. Manufacturing Deployment Goal: Deploy 2,000 robots by EOY 2025. 1,000 robot fleet size by end of Q3 2025. Miami, Dallas, Atlanta, Chicago metros launched in 2025 Ft Lauderdale and Virginia launching in Q4 Scaled Operation Goal: Improve operational performance and efficiency in new geographies over time. At full utilization, each robot expected to pay for itself in under one year. Generate consistent improvements to robot placement, autonomy software, and operations. Executing 2,000-robot rollout Magna International (tier 1 auto supplier) is Serve’s contract manufacturer ✓ COMPLETED ONGOING ONGOING TO COME 10
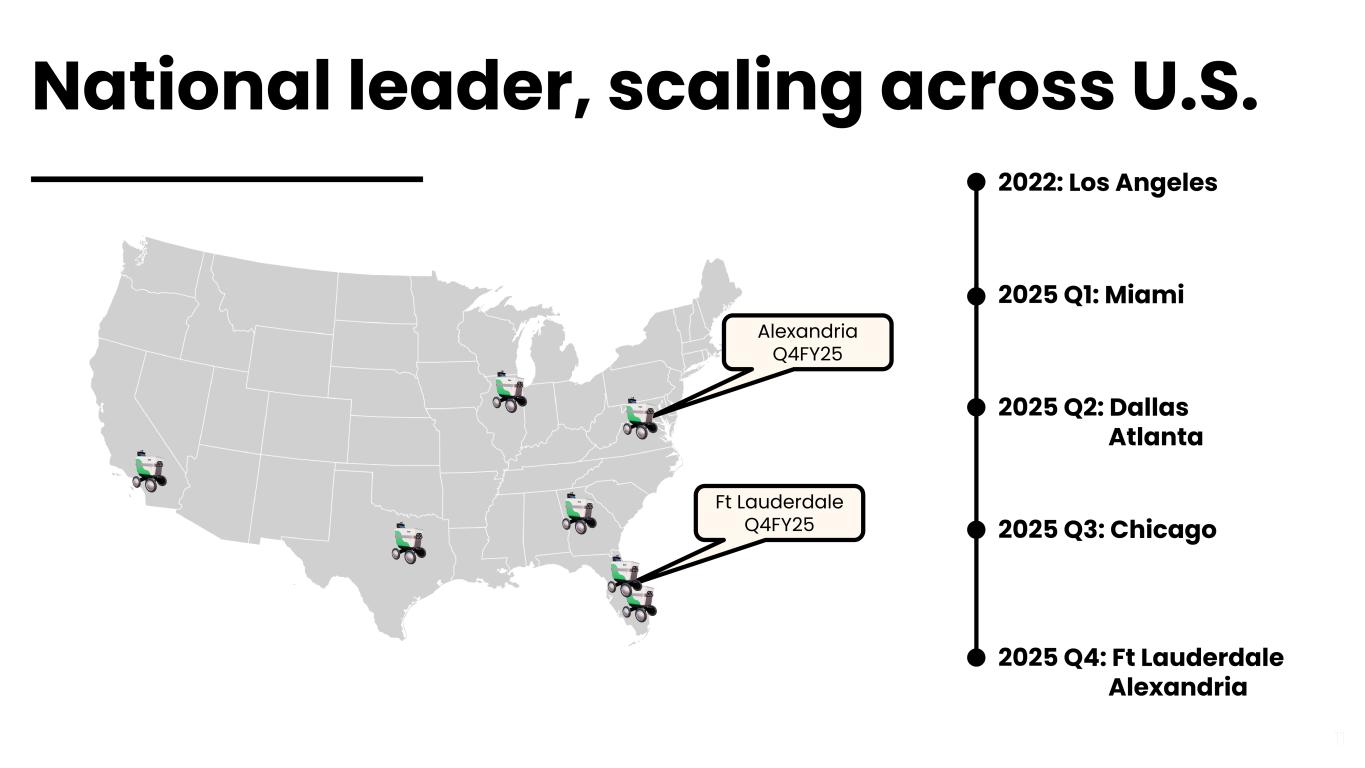
National leader, scaling across U.S. 11 Ft Lauderdale Q4FY25 Alexandria Q4FY25 2022: Los Angeles 2025 Q1: Miami 2025 Q2: Dallas Atlanta 2025 Q3: Chicago 2025 Q4: Ft Lauderdale Alexandria
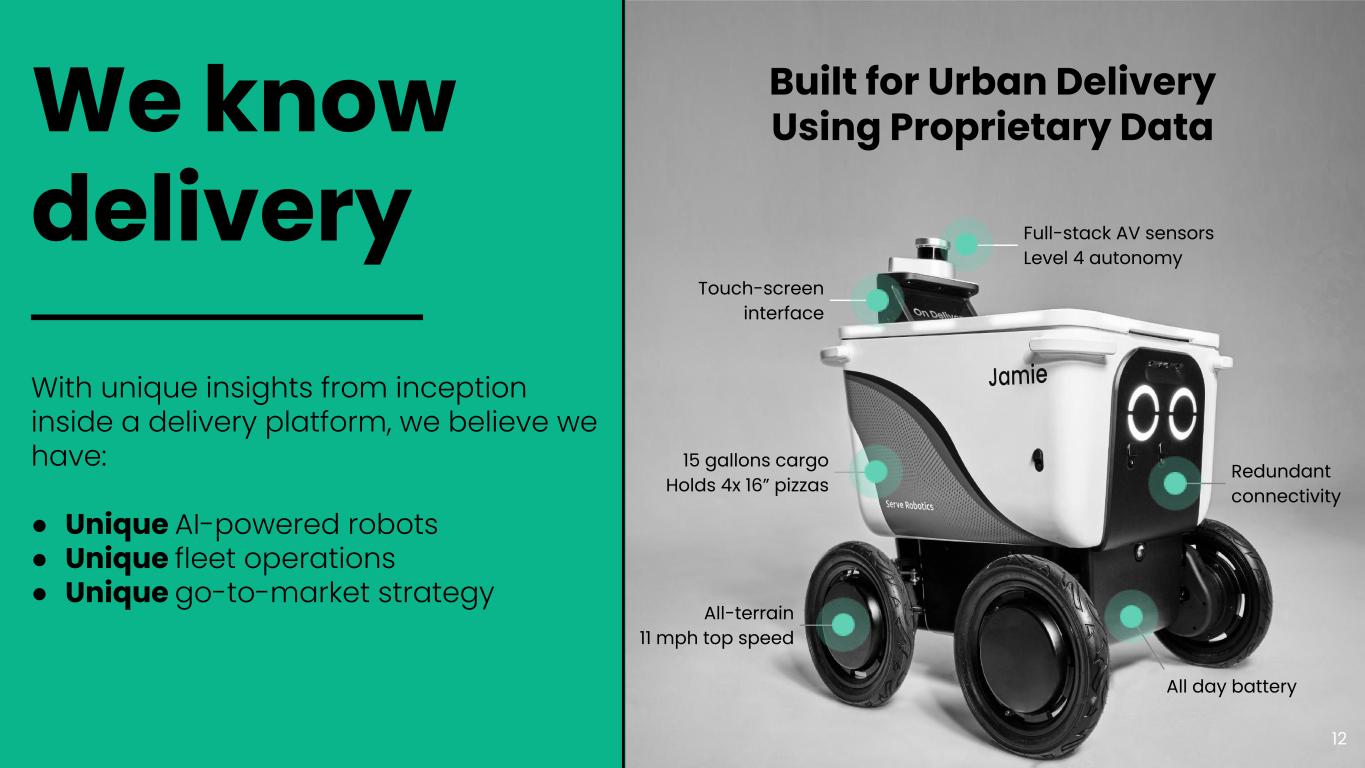
We know delivery With unique insights from inception inside a delivery platform, we believe we have: ● Unique AI-powered robots ● Unique fleet operations ● Unique go-to-market strategy All-terrain 11 mph top speed Redundant connectivity All day battery Touch-screen interface Full-stack AV sensors Level 4 autonomy 15 gallons cargo Holds 4x 16” pizzas Built for Urban Delivery Using Proprietary Data 12
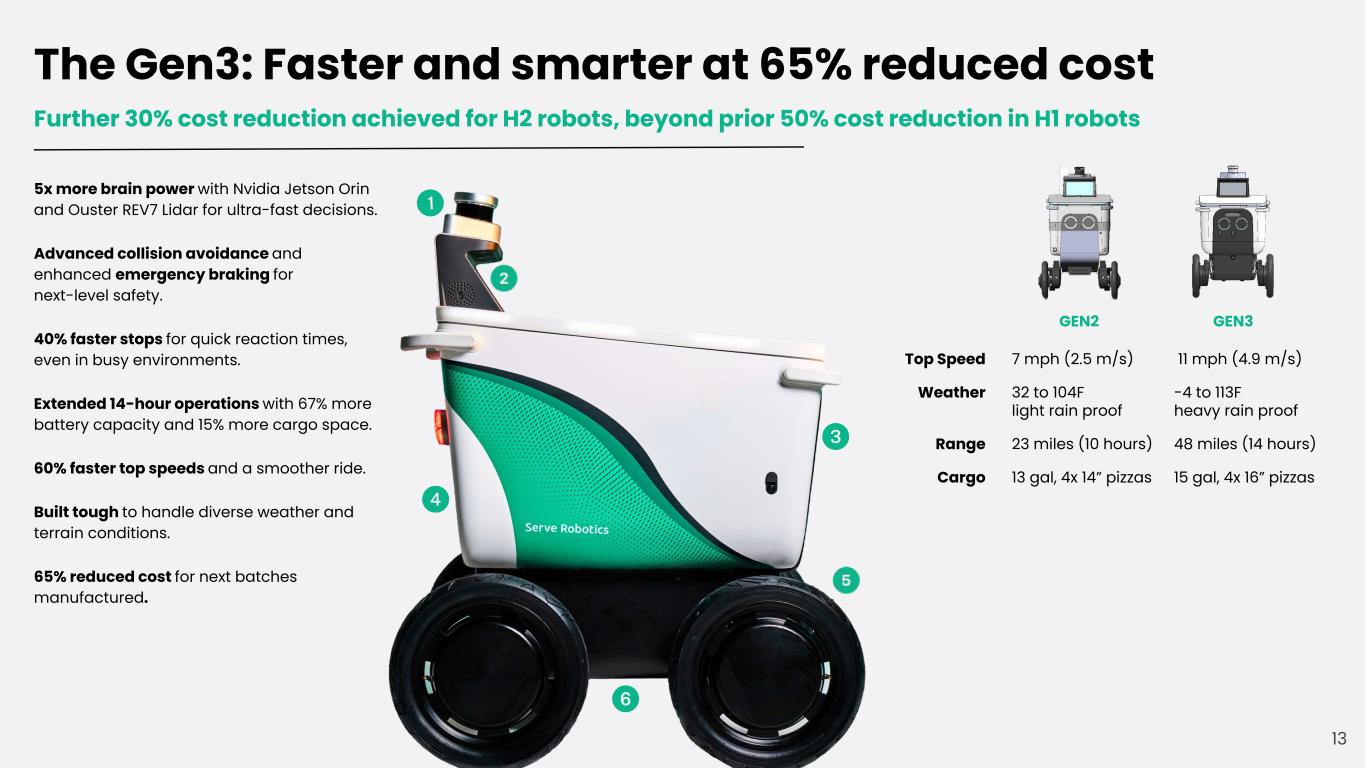
GEN2 5x more brain power with Nvidia Jetson Orin and Ouster REV7 Lidar for ultra-fast decisions. Advanced collision avoidance and enhanced emergency braking for next-level safety. 40% faster stops for quick reaction times, even in busy environments. Extended 14-hour operations with 67% more battery capacity and 15% more cargo space. 60% faster top speeds and a smoother ride. Built tough to handle diverse weather and terrain conditions. 65% reduced cost for next batches manufactured. The Gen3: Faster and smarter at 65% reduced cost Top Speed Weather Range Cargo 7 mph (2.5 m/s) 32 to 104F light rain proof 23 miles (10 hours) 13 gal, 4x 14” pizzas Further 30% cost reduction achieved for H2 robots, beyond prior 50% cost reduction in H1 robots GEN3 11 mph (4.9 m/s) -4 to 113F heavy rain proof 48 miles (14 hours) 15 gal, 4x 16” pizzas 13
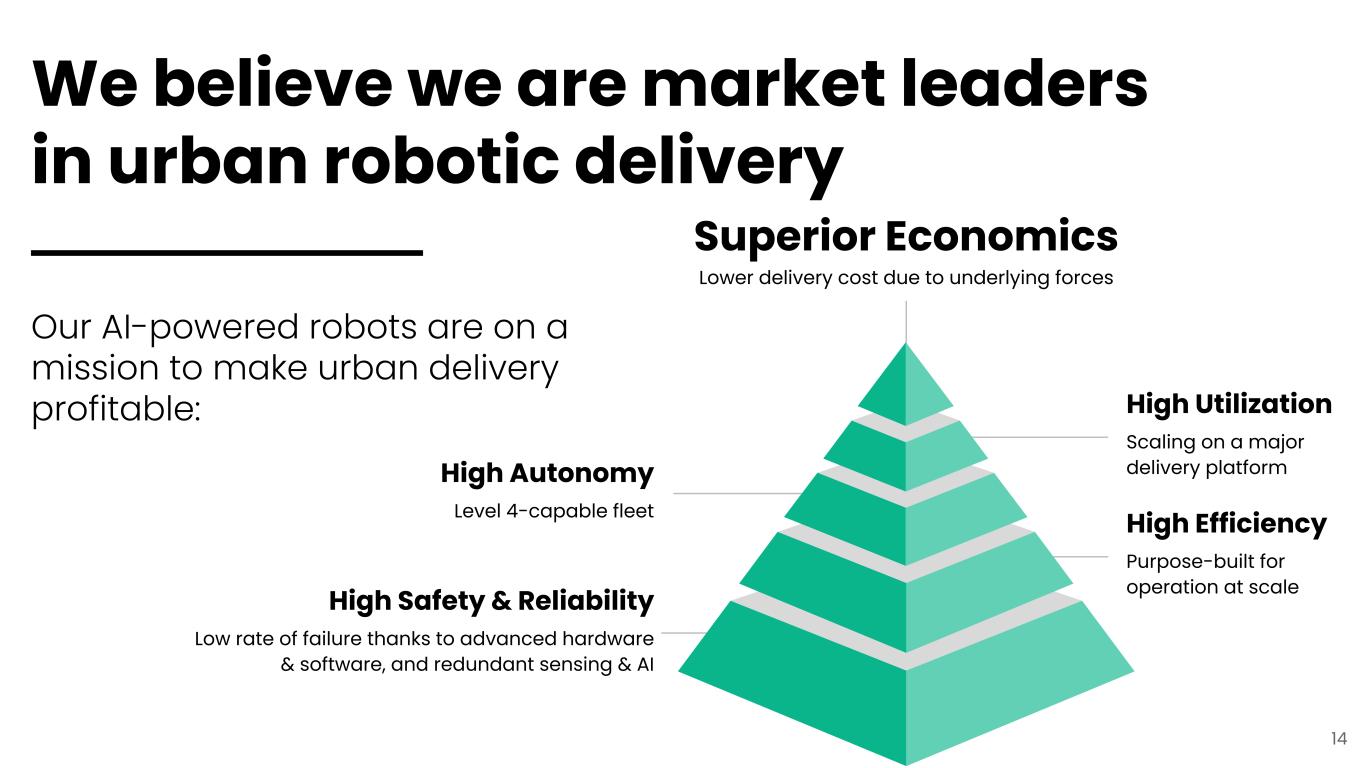
High Safety & Reliability Low rate of failure thanks to advanced hardware & software, and redundant sensing & AI Superior Economics Lower delivery cost due to underlying forces High Autonomy Level 4-capable fleet High Utilization Scaling on a major delivery platform High Efficiency Purpose-built for operation at scale We believe we are market leaders in urban robotic delivery Our AI-powered robots are on a mission to make urban delivery profitable: 14
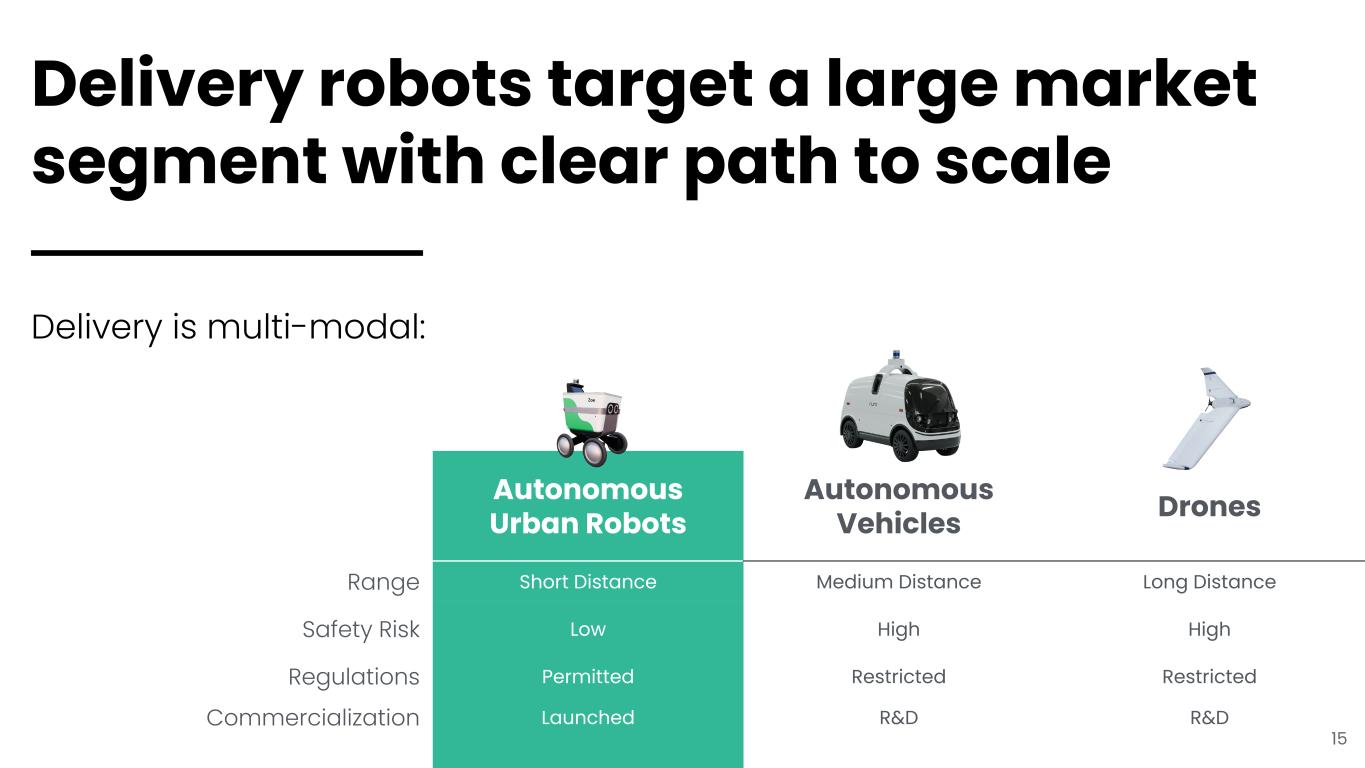
Autonomous Urban Robots Autonomous Vehicles Drones Range Short Distance Medium Distance Long Distance Safety Risk Low High High Regulations Permitted Restricted Restricted Commercialization Launched R&D R&D Delivery robots target a large market segment with clear path to scale Delivery is multi-modal: 15
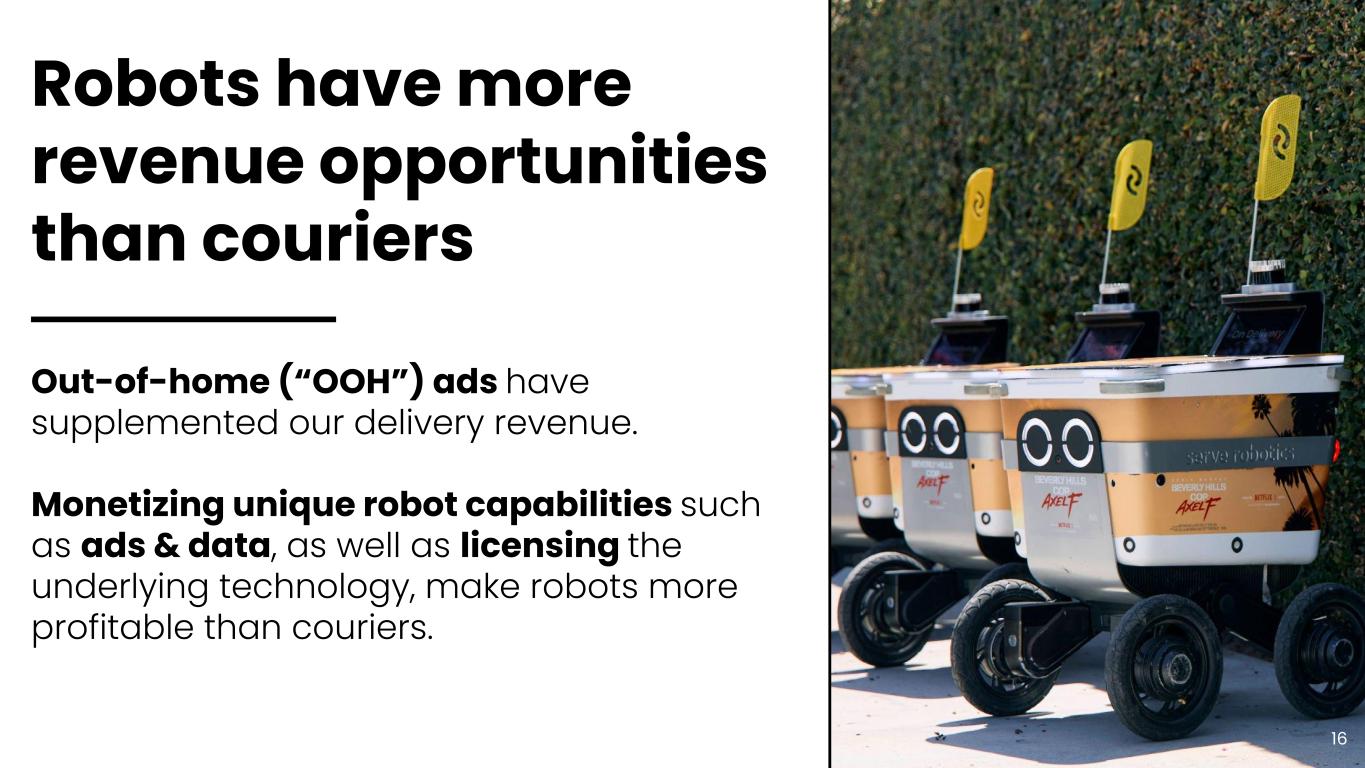
Robots have more revenue opportunities than couriers Out-of-home (“OOH”) ads have supplemented our delivery revenue. Monetizing unique robot capabilities such as ads & data, as well as licensing the underlying technology, make robots more profitable than couriers. 161
Software & Data Platform Magna International has licensed our technology to accelerate development of its new robotic products As a leading urban robotic delivery company, we believe we are well-positioned to become a platform of choice for companies building new non-competing robots and services for complex public spaces. We believe this provides us with an additional monetization opportunity. 17
We are among the first AV companies to bring Level 4 delivery robots to market Level 2 & 3 — R.C. Robots ● Humans always in the loop to maintain safe operation ● Safety risk due to reliance on data networks and human drivers ● Poor economics, hard to scale, and low barrier to entry Level 4 — Serve Robots ● No human in the loop for safety, within designated Operational Design Domain (ODD) ● Safety via redundancy ● Compelling economics, and strong moat through deep tech ● Regulatory tailwinds Level 5 — 100% Self-Driving ● No human in the loop at any time ● Not commercially viable today ● Strong regulatory headwinds ● Capital intensive Level 4 autonomy commercialized 18
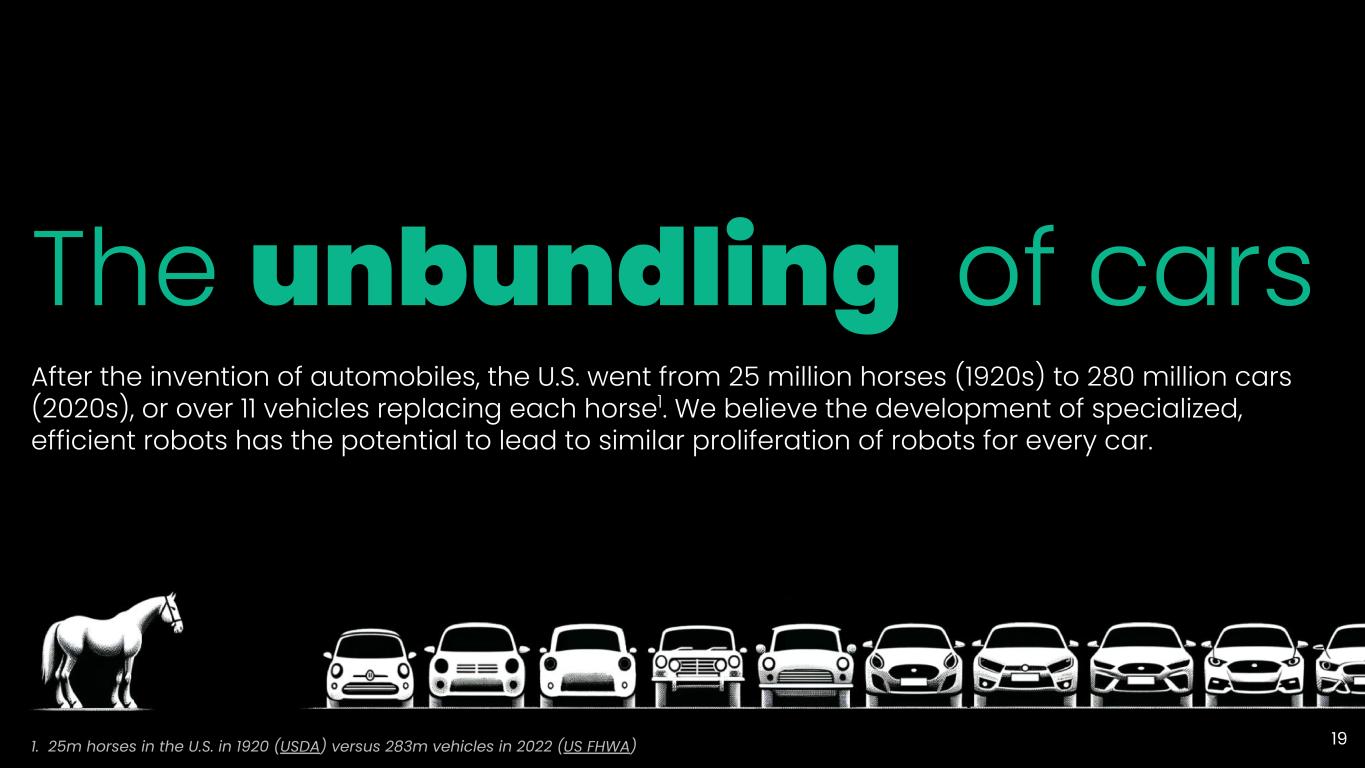
The unbundling of cars After the invention of automobiles, the U.S. went from 25 million horses (1920s) to 280 million cars (2020s), or over 11 vehicles replacing each horse1. We believe the development of specialized, efficient robots has the potential to lead to similar proliferation of robots for every car. 1. 25m horses in the U.S. in 1920 (USDA) versus 283m vehicles in 2022 (US FHWA) 19
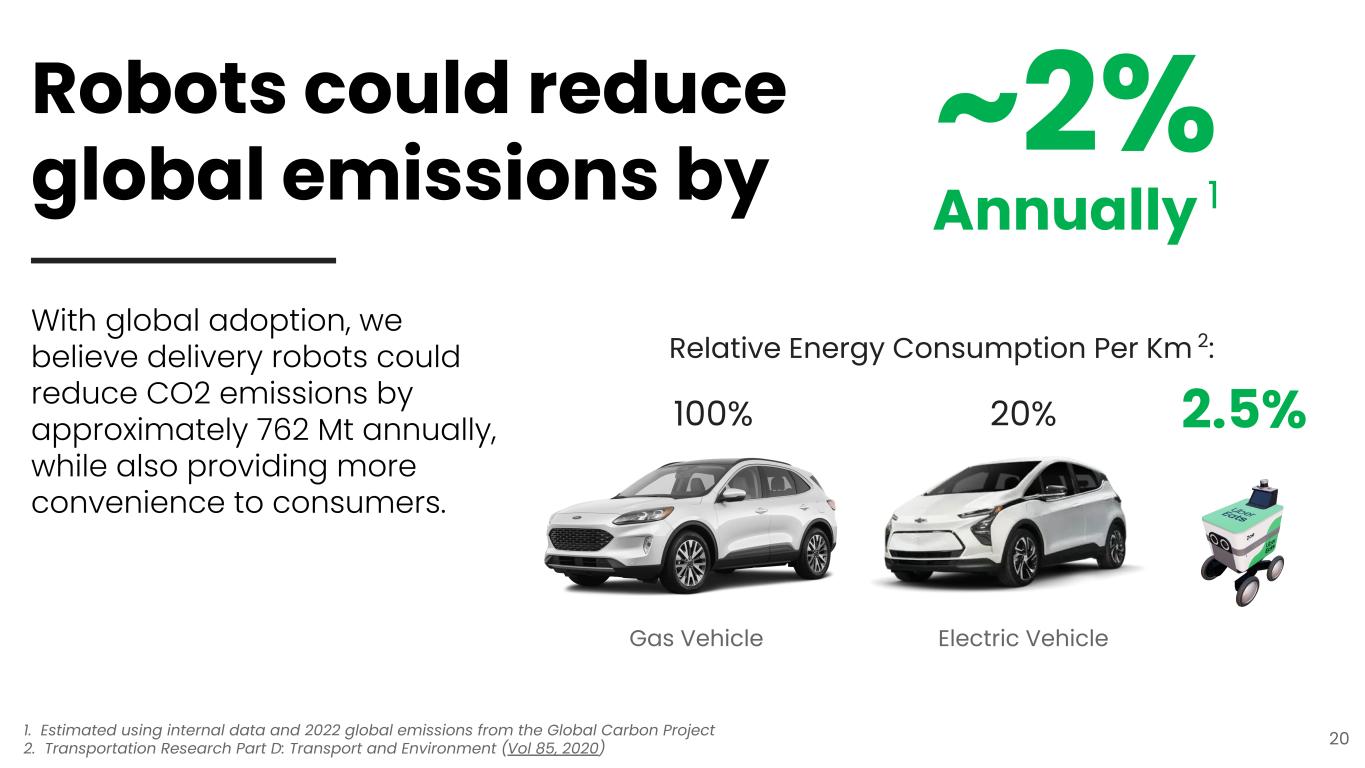
2.5% 100% Gas Vehicle 20% Electric Vehicle Relative Energy Consumption Per Km 2: With global adoption, we believe delivery robots could reduce CO2 emissions by approximately 762 Mt annually, while also providing more convenience to consumers. 20 Robots could reduce global emissions by ~2% Annually 1 1. Estimated using internal data and 2022 global emissions from the Global Carbon Project 2. Transportation Research Part D: Transport and Environment (Vol 85, 2020)
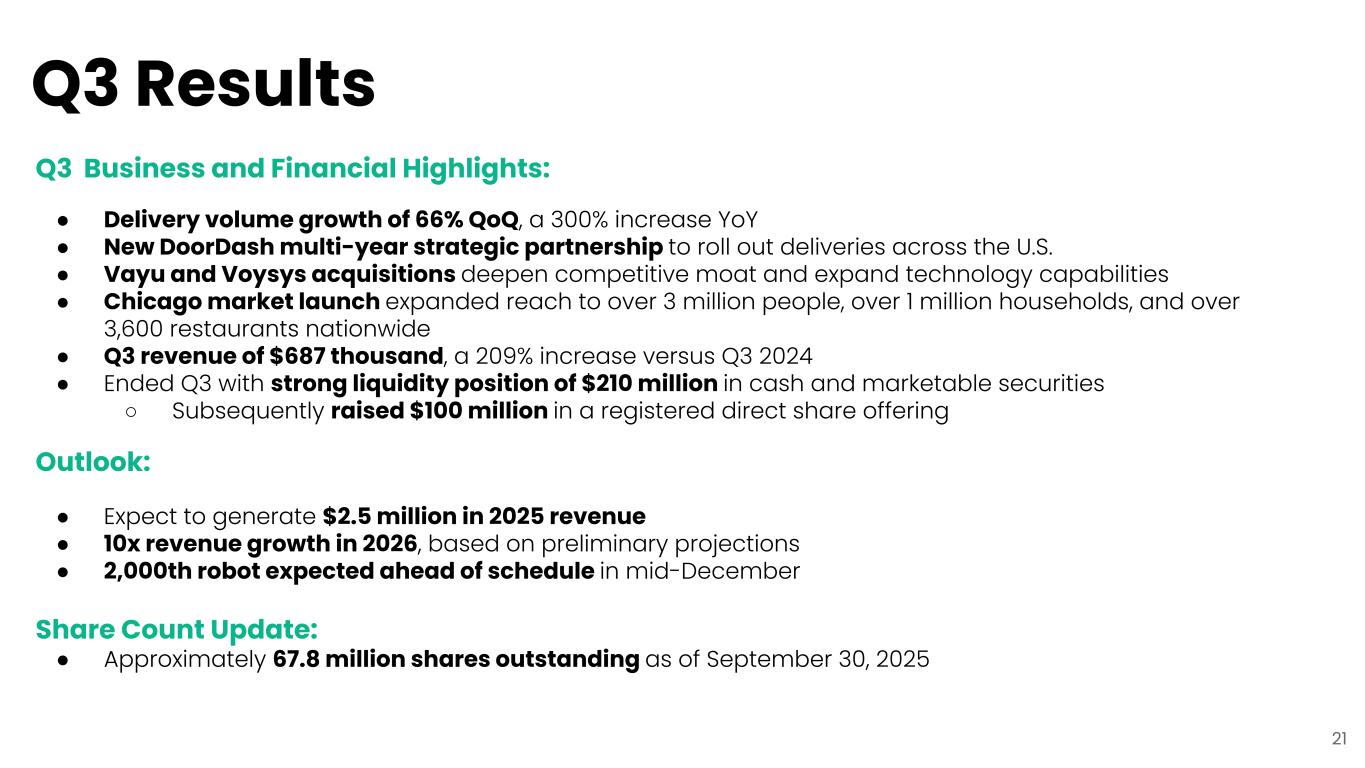
Q3 Business and Financial Highlights: ● Delivery volume growth of 66% QoQ, a 300% increase YoY ● New DoorDash multi-year strategic partnership to roll out deliveries across the U.S. ● Vayu and Voysys acquisitions deepen competitive moat and expand technology capabilities ● Chicago market launch expanded reach to over 3 million people, over 1 million households, and over 3,600 restaurants nationwide ● Q3 revenue of $687 thousand, a 209% increase versus Q3 2024 ● Ended Q3 with strong liquidity position of $210 million in cash and marketable securities ○ Subsequently raised $100 million in a registered direct share offering Outlook: ● Expect to generate $2.5 million in 2025 revenue ● 10x revenue growth in 2026, based on preliminary projections ● 2,000th robot expected ahead of schedule in mid-December Share Count Update: ● Approximately 67.8 million shares outstanding as of September 30, 2025 Q3 Results 21

Thank you!