
SNAP 8-K
Snap Inc (SNAP)
8-K
2026-02-04
For: 2026-02-04
View Original
Added on
April 11, 2026
UNITED STATES
SECURITIES AND EXCHANGE COMMISSION
WASHINGTON, D.C. 20549
________________________
FORM 8-K
________________________
CURRENT REPORT
Pursuant to Section 13 or 15(d) of the Securities Exchange Act of 1934
Date of Report (Date of earliest event reported): February 4, 2026
________________________
(Exact name of Registrant as Specified in Its Charter)
________________________
(State or Other Jurisdiction of Incorporation) | (Commission File Number) | (IRS Employer Identification No.) | |||||||||
| (Address of Principal Executive Offices) | (Zip Code) | ||||||||||
Registrant’s Telephone Number, Including Area Code: (310 ) 399-3339
Not Applicable
(Former Name or Former Address, if Changed Since Last Report)
________________________
Check the appropriate box below if the Form 8-K filing is intended to simultaneously satisfy the filing obligation of the registrant under any of the following provisions:
Written communications pursuant to Rule 425 under the Securities Act (17 CFR 230.425) | |||||
Soliciting material pursuant to Rule 14a-12 under the Exchange Act (17 CFR 240.14a-12) | |||||
Pre-commencement communications pursuant to Rule 14d-2(b) under the Exchange Act (17 CFR 240.14d-2(b)) | |||||
Pre-commencement communications pursuant to Rule 13e-4(c) under the Exchange Act (17 CFR 240.13e-4(c)) | |||||
Securities registered pursuant to Section 12(b) of the Act:
| Title of each class | Trading Symbol(s) | Name of each exchange on which registered | ||||||||||||
Indicate by check mark whether the registrant is an emerging growth company as defined in Rule 405 of the Securities Act of 1933 (§ 230.405 of this chapter) or Rule 12b-2 of the Securities Exchange Act of 1934 (§ 240.12b-2 of this chapter).
Emerging growth company o
If an emerging growth company, indicate by check mark if the registrant has elected not to use the extended transition period for complying with any new or revised financial accounting standards provided pursuant to Section 13(a) of the Exchange Act. o
Item 2.02 Results of Operations and Financial Condition.
On February 4, 2026, Snap Inc. reported financial results for the three months and full year ended December 31, 2025. A copy of the press release and the investor letter are furnished as Exhibit 99.1 and Exhibit 99.2, respectively, to this Current Report on Form 8-K and incorporated by reference.
The press release and investor letter are furnished and shall not be deemed “filed” for purposes of Section 18 of the Securities Exchange Act of 1934, as amended, or subject to the liabilities of that section or Sections 11 and 12(a)(2) of the Securities Act of 1933, as amended. The information shall not be deemed incorporated by reference into any other filing with the Securities and Exchange Commission made by Snap Inc., whether made before or after today’s date, regardless of any general incorporation language in such filing.
Item 8.01 Other Events.
On February 4, 2026, Snap Inc. announced its board of directors had authorized a stock repurchase program of up to $500 million of its Class A common stock. Repurchases of Class A common stock may be made from time to time, either through open market transactions (including through Rule 10b5-1 trading plans) or through privately negotiated transactions in accordance with applicable securities laws. Repurchases under the program have been authorized for 12 months but the program may be initiated, modified, suspended, or terminated at any time during such period. A copy of the press release is furnished as Exhibit 99.1 to this report and incorporated by reference.
Item 9.01 Financial Statements and Exhibits.
(d) Exhibits.
Exhibit Number | Description | |||||||
99.1 | ||||||||
99.2 | ||||||||
104 | Cover Page Interactive Data File (embedded within the Inline XBRL document) | |||||||
1
SIGNATURES
Pursuant to the requirements of the Securities Exchange Act of 1934, the registrant has duly caused this report to be signed on its behalf by the undersigned hereunto duly authorized.
| SNAP INC. | ||||||||
Date: February 4, 2026 | By: | /s/ Derek Andersen | ||||||
| Derek Andersen | ||||||||
| Chief Financial Officer | ||||||||
2
Exhibit 99.1
Snap Inc. Announces Fourth Quarter and Full Year 2025 Financial Results
Fourth quarter revenue increased 10% year-over-year to $1,716 million
Fourth quarter gross margin of 59%, up 4 percentage points sequentially and 2 percentage points year-over-year
Fourth quarter operating cash flow was $270 million and Free Cash Flow was $206 million
Fourth quarter net income of $45 million and Adjusted EBITDA of $358 million
SANTA MONICA, Calif. – February 4, 2026 – Snap Inc. (NYSE: SNAP) today announced financial results for the quarter and full year ended December 31, 2025.
“Our Q4 results began to reflect the impact of our strategic pivot toward profitable growth, translating into revenue diversification and meaningful margin expansion,” said Evan Spiegel, CEO. “This progress reflects our commitment to building a more financially efficient and profitable business while continuing to invest in the future of augmented reality and the consumer launch of Specs.”
Snap Inc. also announced today its board of directors has authorized a stock repurchase program of up to $500 million of its Class A common stock. Repurchases of the Class A common stock may be made from time to time, either through open market transactions (including through Rule 10b5-1 trading plans) or through privately negotiated transactions in accordance with applicable securities laws. The timing and actual number of shares repurchased will depend on a variety of factors, including stock price, trading volume, market and economic conditions, and other general business considerations. Repurchases under the program have been authorized for 12 months but the program may be initiated, modified, suspended, or terminated at any time during such period.
The goal of the program is to utilize the company’s strong balance sheet to opportunistically offset a portion of the dilution related to the issuance of restricted stock units to employees as part of the overall compensation program designed to foster an ownership culture.
Repurchases under this program will be funded from existing cash and cash equivalents. As of December 31, 2025, Snap had $2.9 billion in cash, cash equivalents, and marketable securities.
Annual Financial Summary
•Revenue was $5,931 million in 2025, compared to $5,361 million in the prior year, an increase of 11% year-over-year.
•Net loss was $460 million in 2025, compared to $698 million in the prior year.
•Adjusted EBITDA was $689 million in 2025, compared to $509 million in the prior year.
•Operating cash flow was $656 million in 2025, compared to $413 million in the prior year.
•Free Cash Flow was $437 million in 2025, compared to $219 million in the prior year.
Q4 2025 Financial Summary
•Revenue was $1,716 million, compared to $1,557 million in the prior year, an increase of 10% year-over-year.
•Net income was $45 million, compared to $9 million in the prior year.
•Adjusted EBITDA was $358 million, compared to $276 million in the prior year.
•Operating cash flow was $270 million, compared to $231 million in the prior year.
•Free Cash Flow was $206 million, compared to $182 million in the prior year.
1
Three Months Ended December 31, | Percent Change | Year Ended December 31, | Percent Change | ||||||||||||||||||||||||||||||||
| 2025 | 2024 | 2025 | 2024 | ||||||||||||||||||||||||||||||||
| (Unaudited) | (dollars in thousands, except per share amounts) | ||||||||||||||||||||||||||||||||||
| Revenue | $ | 1,716,461 | $ | 1,557,283 | 10 | % | $ | 5,931,447 | $ | 5,361,398 | 11 | % | |||||||||||||||||||||||
| Operating income (loss) | $ | 49,717 | $ | (26,877) | 285 | % | $ | (532,167) | $ | (787,294) | 32 | % | |||||||||||||||||||||||
| Net income (loss) | $ | 45,209 | $ | 9,101 | 397 | % | $ | (460,489) | $ | (697,856) | 34 | % | |||||||||||||||||||||||
Adjusted EBITDA (1) | $ | 357,746 | $ | 276,007 | 30 | % | $ | 689,479 | $ | 508,605 | 36 | % | |||||||||||||||||||||||
| Net cash provided by (used in) operating activities | $ | 269,578 | $ | 230,633 | 17 | % | $ | 656,170 | $ | 413,480 | 59 | % | |||||||||||||||||||||||
Free Cash Flow (2) | $ | 205,556 | $ | 182,358 | 13 | % | $ | 437,189 | $ | 218,654 | 100 | % | |||||||||||||||||||||||
Diluted net income (loss) per share attributable to common stockholders | $ | 0.03 | $ | 0.01 | 200 | % | $ | (0.27) | $ | (0.42) | 36 | % | |||||||||||||||||||||||
(1)See page 11 for a reconciliation of net income (loss) to Adjusted EBITDA. Total restructuring charges for the year ended December 31, 2024, and excluded from Adjusted EBITDA, was $72.0 million. No restructuring charges were incurred during the year ended December 31, 2025 and the three months ended December 31, 2024.
(2)See page 11 for a reconciliation of net cash provided by (used in) operating activities to Free Cash Flow.
2
Q4 2025 Summary & Key Highlights
We deepened engagement with our community:
•The Snapchat community continues to grow, reaching 946 million global monthly active users (MAU) in Q4, an increase of 51 million or 6% year-over-year.
•The number of US Snapchatters posting to Spotlight increased 47% year-over-year in Q4.
•The number of Spotlight reposts and shares increased 69% year-over-year in the US, demonstrating improved content relevance in Spotlight discovery.
•We introduced Comic Bitmoji, a new style available to Snapchat+ subscribers that brings back the charm of classic avatars, while keeping all the benefits of today’s 3D Bitmoji infrastructure.
•We rolled out Quick Cut, our Lens-powered video creation tool that helps Snapchatters quickly turn their favorite Memories into beat-synced, ready-to-share Snaps in seconds.
•We made Snapchat available for download on Amazon Fire Tablets through the Amazon Appstore.
We are focused on accelerating and diversifying our revenue growth:
•Revenue from In-App Optimizations grew 89% year-over-year, supported by advances in foundational app models, broader adoption of the App Power Pack, and new immersive formats such as Playables.
•Revenue from Dynamic Product Ads increased 19% year-over-year, driven by expansion among large advertisers and continued migration of spend from static formats into higher-performing dynamic solutions.
•Other Revenue increased 62% year-over-year to $232 million in Q4, with subscribers growing 71% year-over-year to reach 24 million in Q4.
•In Q4, Sponsored Snaps click-through rates grew 7% and click-through purchases grew 17% from Q3 to Q4, during which numerous format and ranking improvements were introduced.
•Our Smart Campaign Solution suite, which uses AI to identify incremental high-value audiences and dynamically allocate spend across objectives, contributed to a more than 8% lift in conversions, making performance advertising on Snapchat simpler, more efficient, and more accessible.
•In Q4, total active advertisers increased 28% year-over-year, driven in part by simplified onboarding, improved campaign workflows, and increased performance.
•We strengthened our SMB offering through new partnerships, including a global integration with Wix, which allows ecommerce businesses to seamlessly create campaigns, manage catalogs, and improve measurement.
We invested in our augmented reality platform:
•Our community used AR Lenses in our Snapchat camera 8 billion times per day, and over 450,000 developers have built more than 5 million Lenses with Snap’s world-leading AR tools.
•In Q4, more than 350 million Snapchatters engaged with AR every day on average.
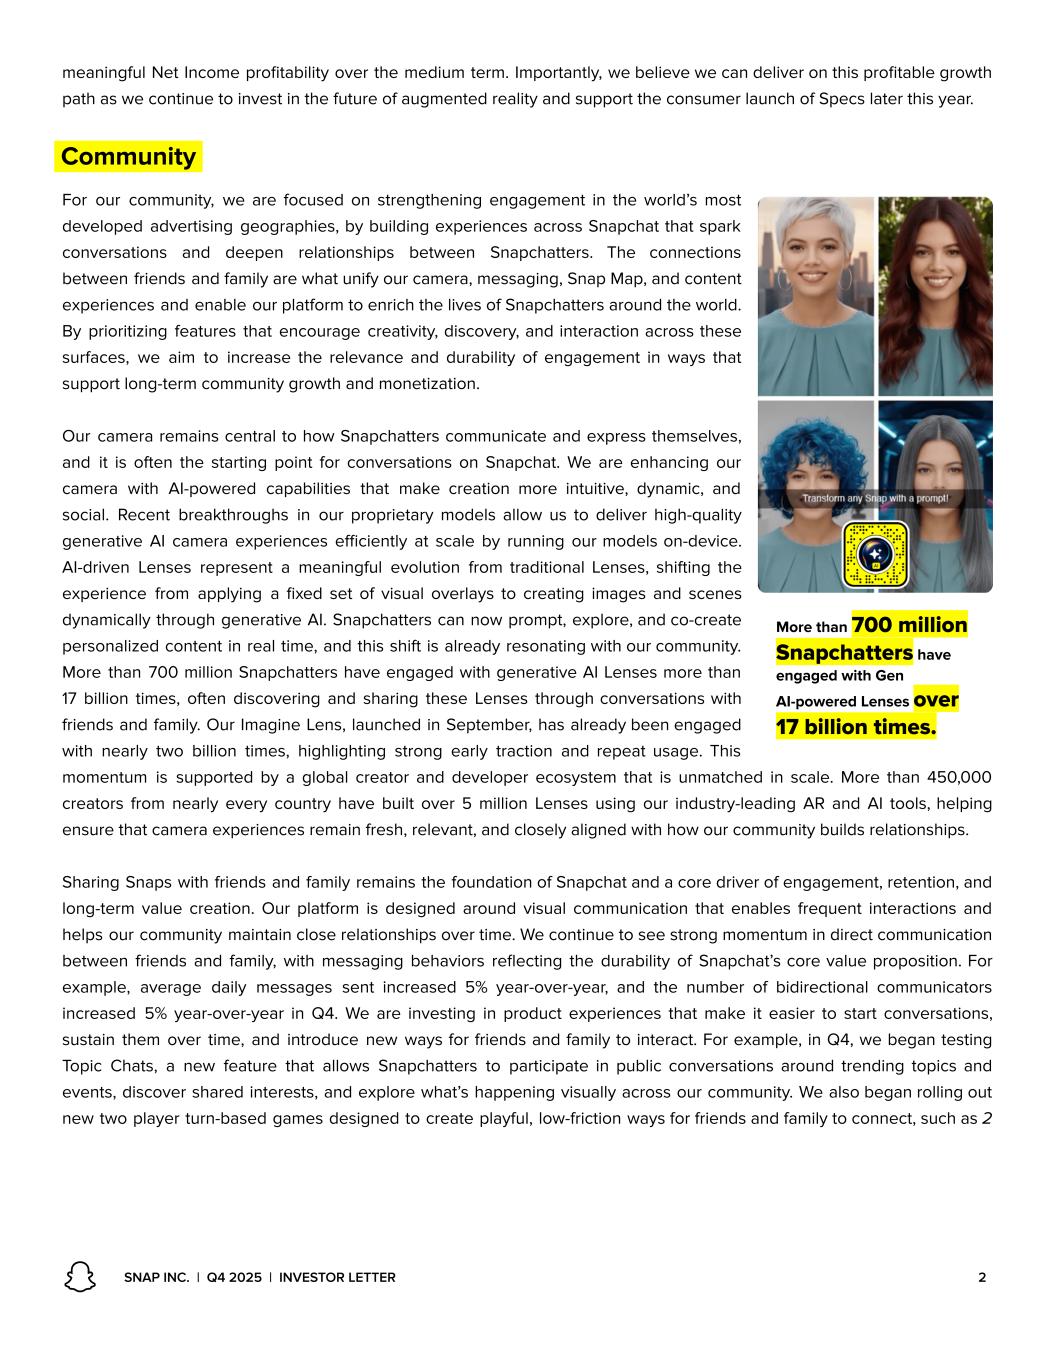
•More than 700 million users have engaged with Gen AI Lenses over 17 billion times, underscoring the growing demand for AI-powered creative tools on our service.
•Snapchatters engaged with our Imagine Lens nearly two billion times since launch in September, highlighting strong engagement with our latest AR experiences powered by generative AI.
•We launched new Lens Studio features including Selfie Attachments, which now support animated attachments, allowing developers to bring props to life rather than just having static elements.
•We updated Head Generator in Lens Studio to a new version that delivers higher fidelity character heads and significantly improved adherence to developer image prompts.
•We enhanced our Character Controller in Lens Studio by adding new features such as jump buffering and remote asset support to improve gameplay feel, reduce lens size, and improve performance in multiplayer sessions.
•We introduced the Animate It Lens, our first open prompt video generation Lens that leverages Snap’s internally developed AI video generation model to create short, shareable videos in seconds.
3
•We collaborated with Disney on an innovative Zootopia 2 co-promotional campaign featuring Zootopia 2 themed AR Lenses within the Snap platform and at a mall pop-up and Snap was involved in Disney’s recreating a Snap Lens moment in the film.
We are making computers more human with Specs:
•We began testing Snap Cloud, Powered by Supabase, a leading backend-as-a-service platform, to make advanced backend capabilities easy and accessible in Snap’s AR authoring tool, Lens Studio.
•We announced that Lenses built today on Spectacles will be compatible on Specs, which will launch for the public this year.
•To prepare for the launch of our next generation of Specs this year, partners and developers have been building compelling AR experiences:
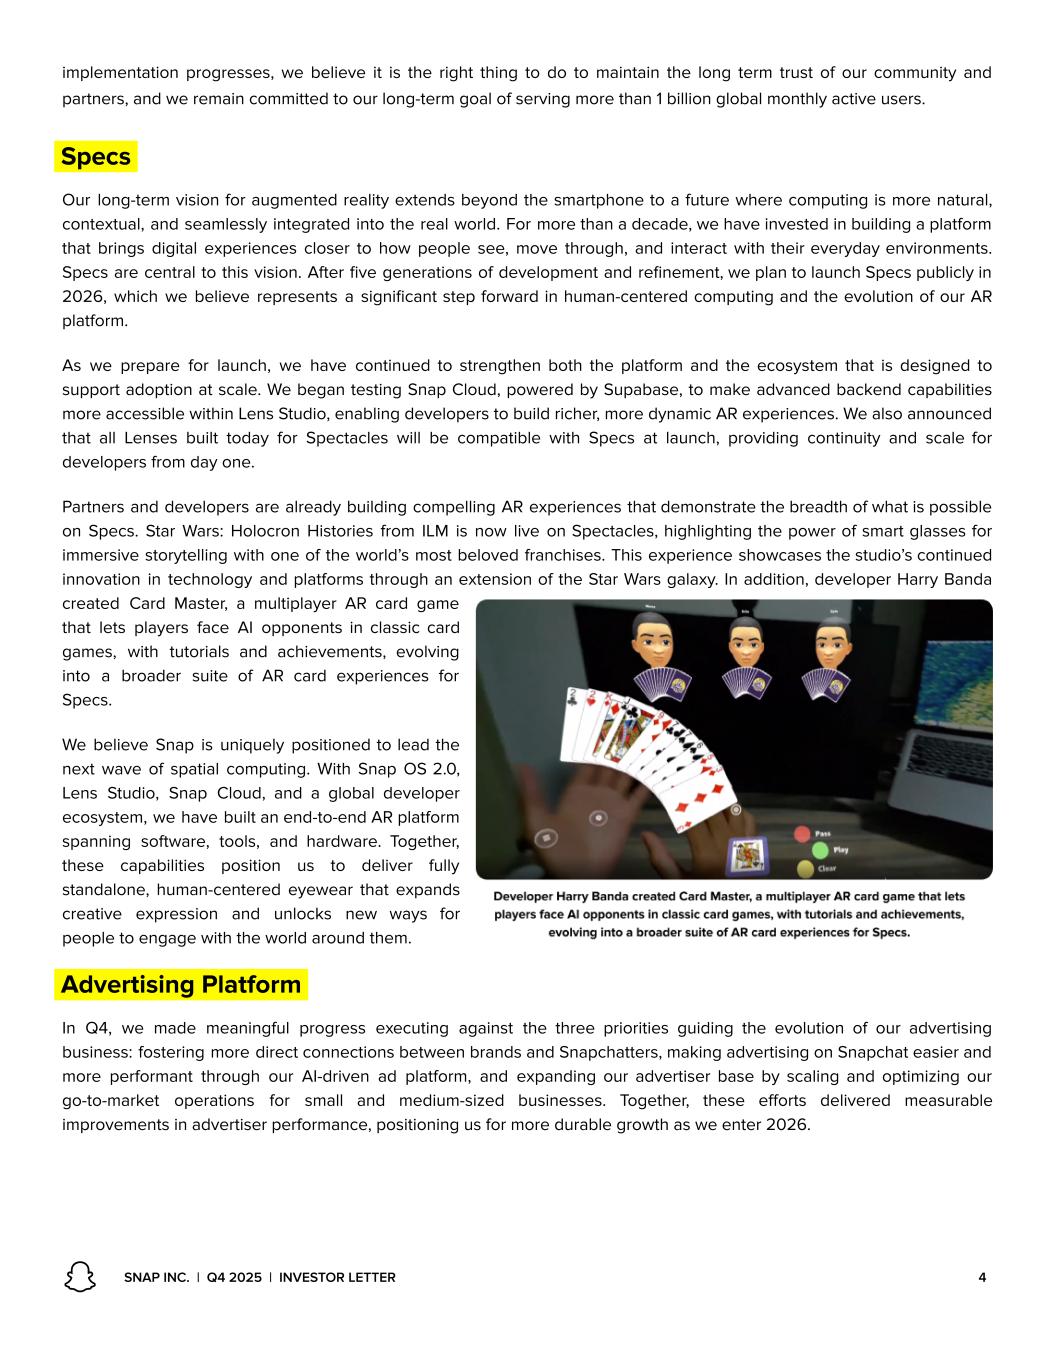
◦Star Wars: Holocron Histories, created by Industrial Light & Magic and Synth Riders, is now live.
◦Developer Harry Banda created Card Master, a multiplayer AR card game that lets players face AI opponents in classic card games, with tutorials and achievements, evolving into a broader suite of AR card experiences for Specs.
◦Developer Arthur Ibanda created HandymanAI, an AI-powered AR assistant that uses camera context and voice input to guide users through everyday repair and DIY tasks with step-by-step instructions, tools lists, and visual references.
4
Q1 2026 and Full Year 2026 Outlook
Snap Inc. will discuss its Q1 2026 and full year 2026 outlook during its Q4 2025 Earnings Call (details below) and in its investor letter available at investor.snap.com.
Conference Call Information
Snap Inc. will host a conference call to discuss the results at 2:00 p.m. Pacific / 5:00 p.m. Eastern today. The live audio webcast along with supplemental information will be accessible at investor.snap.com. A recording of the webcast will also be available following the conference call.
Snap Inc. uses its websites (including snap.com and investor.snap.com) as means of disclosing material non-public information and for complying with its disclosure obligation under Regulation FD.
Definitions
Free Cash Flow is defined as net cash provided by (used in) operating activities, reduced by purchases of property and equipment.
Common shares outstanding plus shares underlying stock-based awards includes common shares outstanding, restricted stock units, restricted stock awards, and outstanding stock options.
Adjusted EBITDA is defined as net income (loss), excluding interest income; interest expense; other income (expense), net; income tax benefit (expense); depreciation and amortization; stock-based compensation expense; payroll and other tax expense related to stock-based compensation; and certain other items impacting net income (loss) from time to time.
A Daily Active User (DAU) is defined as a registered and logged-in Snapchat user who visits Snapchat through our applications or websites at least once during a defined 24-hour period. We calculate average DAUs for a particular quarter by adding the number of DAUs on each day of that quarter and dividing that sum by the number of days in that quarter.
Average revenue per user (ARPU) is defined as quarterly revenue divided by the average DAUs.
A Monthly Active User (MAU) is defined as a registered and logged-in Snapchat user who visits Snapchat through our applications or websites at least once during the 30-day period ending on the calendar month-end. We calculate average Monthly Active Users for a particular quarter by calculating the average of the MAUs as of each calendar month-end in that quarter.
Note: For adjustments and additional information regarding the non-GAAP financial measures and other items discussed, please see “Non-GAAP Financial Measures,” “Reconciliation of GAAP to Non-GAAP Financial Measures,” and “Supplemental Financial Information and Business Metrics.”
About Snap Inc.
Snap Inc. is a technology company. We believe the camera presents the greatest opportunity to improve the way people live and communicate. We contribute to human progress by empowering people to express themselves, live in the moment, learn about the world, and have fun together. For more information, visit snap.com.
Contact
Investors and Analysts:
Press:
Forward-Looking Statements
This press release contains forward-looking statements within the meaning of Section 27A of the Securities Act of 1933, as amended, or the Securities Act, and Section 21E of the Securities Exchange Act of 1934, as amended, or the Exchange Act,
5
about us and our industry that involve substantial risks and uncertainties. All statements other than statements of historical facts contained in this press release, including statements regarding guidance, our future results of operations or financial condition, future stock repurchase programs or stock dividends, business strategy and plans, user growth and engagement, product initiatives, objectives of management for future operations, and advertiser and partner offerings, are forward-looking statements. In some cases, you can identify forward-looking statements because they contain words such as “anticipate,” “believe,” “contemplate,” “continue,” “could,” “estimate,” “expect,” “going to,” “intend,” “may,” “plan,” “potential,” “predict,” “project,” “should,” “target,” “will,” or “would” or the negative of these words or other similar terms or expressions. We caution you that the foregoing may not include all of the forward-looking statements made in this press release.
You should not rely on forward-looking statements as predictions of future events. We have based the forward-looking statements contained in this press release primarily on our current expectations and projections about future events and trends, including our financial outlook, macroeconomic uncertainty, and geo-political events and conflicts, that we believe may continue to affect our business, financial condition, results of operations, and prospects. These forward-looking statements are subject to risks and uncertainties related to: our financial performance; our ability to attain and sustain profitability; our ability to generate and sustain positive cash flow; our ability to attract and retain users, partners, and advertisers; competition and new market entrants; managing our growth and future expenses; compliance with new laws, regulations, and executive actions; our ability to maintain, protect, and enhance our intellectual property; our ability to succeed in existing and new market segments; our ability to attract and retain qualified team members and key personnel; our ability to repay or refinance outstanding debt, or to access additional financing; future acquisitions, divestitures, or investments; and the potential adverse impact of climate change, natural disasters, health epidemics, macroeconomic conditions, and war or other armed conflict, as well as risks, uncertainties, and other factors described in “Risk Factors” and elsewhere in our most recent periodic report filed with the U.S. Securities and Exchange Commission, or SEC, which is available on the SEC’s website at www.sec.gov. Additional information will be made available in our periodic report that will be filed with the SEC for the period covered by this press release and other filings that we make from time to time with the SEC. In addition, any forward-looking statements contained in this press release are based on assumptions that we believe to be reasonable as of this date. We undertake no obligation to update any forward-looking statements to reflect events or circumstances after the date of this press release or to reflect new information or the occurrence of unanticipated events, including future developments related to geo-political events and conflicts and macroeconomic conditions, except as required by law.
Non-GAAP Financial Measures
To supplement our consolidated financial statements, which are prepared and presented in accordance with GAAP, we use certain non-GAAP financial measures, as described below, to understand and evaluate our core operating performance. These non-GAAP financial measures, which may be different than similarly titled measures used by other companies, are presented to enhance investors’ overall understanding of our financial performance and should not be considered a substitute for, or superior to, the financial information prepared and presented in accordance with GAAP.
We use the non-GAAP financial measure of Free Cash Flow, which is defined as net cash provided by (used in) operating activities, reduced by purchases of property and equipment. We believe Free Cash Flow is an important liquidity measure of the cash that is available, after capital expenditures, for operational expenses and investment in our business and is a key financial indicator used by management. Additionally, we believe that Free Cash Flow is an important measure since we use third-party infrastructure partners to host our services and therefore we do not incur significant capital expenditures to support revenue generating activities. Free Cash Flow is useful to investors as a liquidity measure because it measures our ability to generate or use cash. Once our business needs and obligations are met, cash can be used to maintain a strong balance sheet and invest in future growth.
We use the non-GAAP financial measure of Adjusted EBITDA, which is defined as net income (loss), excluding interest income; interest expense; other income (expense), net; income tax benefit (expense); depreciation and amortization; stock-based compensation expense; payroll and other tax expense related to stock-based compensation; and certain other items impacting net income (loss) from time to time. We believe that Adjusted EBITDA helps identify underlying trends in our business that could otherwise be masked by the effect of the expenses that we exclude in Adjusted EBITDA.
We believe that these non-GAAP financial measures provide useful information about our financial performance, enhance the overall understanding of our past performance and future prospects, and allow for greater transparency with respect to key metrics used by our management for financial and operational decision-making. We are presenting these non-GAAP measures to assist investors in seeing our financial performance through the eyes of management, and because we believe
6
that these measures provide an additional tool for investors to use in comparing our core financial performance over multiple periods with other companies in our industry.
For a reconciliation of these non-GAAP financial measures to the most directly comparable GAAP financial measure, please see “Reconciliation of GAAP to Non-GAAP Financial Measures.”
Snap Inc., “Snapchat,” and our other registered and common law trade names, trademarks, and service marks are the property of Snap Inc. or our subsidiaries.
7
SNAP INC.
CONSOLIDATED STATEMENTS OF CASH FLOWS
(in thousands, unaudited)
Three Months Ended December 31, | Year Ended December 31, | ||||||||||||||||||||||
| 2025 | 2024 | 2025 | 2024 | ||||||||||||||||||||
| Cash flows from operating activities | |||||||||||||||||||||||
| Net income (loss) | $ | 45,209 | $ | 9,101 | $ | (460,489) | $ | (697,856) | |||||||||||||||
Adjustments to reconcile net income (loss) to net cash provided by (used in) operating activities: | |||||||||||||||||||||||
| Depreciation and amortization | 43,381 | 39,581 | 163,633 | 158,074 | |||||||||||||||||||
| Stock-based compensation | 257,238 | 257,731 | 1,016,825 | 1,041,023 | |||||||||||||||||||
| Amortization of debt issuance costs and debt discount (premium) | (898) | 2,721 | 6,880 | 9,388 | |||||||||||||||||||
| Losses (gains) on debt and equity securities, net | 1,166 | (3,706) | 16,940 | 8,460 | |||||||||||||||||||
| (Gain) loss on extinguishment of debt | — | — | (96,734) | 6,672 | |||||||||||||||||||
| Other | 11,577 | (10,324) | 26,119 | (20,825) | |||||||||||||||||||
| Change in operating assets and liabilities, net of effect of acquisitions: | |||||||||||||||||||||||
| Accounts receivable, net of allowance | (133,859) | (167,355) | (31,827) | (94,005) | |||||||||||||||||||
| Prepaid expenses and other current assets | (20,545) | (303) | (66,744) | (36,544) | |||||||||||||||||||
| Operating lease right-of-use assets | 14,385 | 12,892 | 57,214 | 54,127 | |||||||||||||||||||
| Other assets | 651 | (6,945) | 7,705 | (9,952) | |||||||||||||||||||
| Accounts payable | 67,736 | 11,559 | 45,918 | (100,728) | |||||||||||||||||||
| Accrued expenses and other current liabilities | 3,761 | 103,620 | 12,814 | 150,391 | |||||||||||||||||||
| Operating lease liabilities | (10,269) | (18,409) | (34,429) | (62,663) | |||||||||||||||||||
| Other liabilities | (9,955) | 470 | (7,655) | 7,918 | |||||||||||||||||||
| Net cash provided by (used in) operating activities | 269,578 | 230,633 | 656,170 | 413,480 | |||||||||||||||||||
| Cash flows from investing activities | |||||||||||||||||||||||
| Purchases of property and equipment | (64,022) | (48,275) | (218,981) | (194,826) | |||||||||||||||||||
| Purchases of strategic investments | (2,500) | — | (22,500) | (2,000) | |||||||||||||||||||
| Sales of strategic investments | — | 183 | 11,050 | 1,755 | |||||||||||||||||||
| Cash paid for acquisitions, net of cash acquired | — | — | (35,499) | — | |||||||||||||||||||
| Purchases of marketable securities | (260,479) | (342,078) | (1,275,796) | (2,287,668) | |||||||||||||||||||
| Sales of marketable securities | 201,578 | — | 741,266 | 354,311 | |||||||||||||||||||
| Maturities of marketable securities | 191,842 | 241,378 | 977,159 | 1,411,444 | |||||||||||||||||||
| Other | (3,581) | — | (3,581) | (100) | |||||||||||||||||||
| Net cash provided by (used in) investing activities | 62,838 | (148,792) | 173,118 | (717,084) | |||||||||||||||||||
| Cash flows from financing activities | |||||||||||||||||||||||
| Proceeds from issuance of notes, net of issuance costs | — | — | 2,014,193 | 740,350 | |||||||||||||||||||
| Purchase of capped calls | — | — | — | (68,850) | |||||||||||||||||||
| Proceeds from termination of capped calls | — | — | — | 62,683 | |||||||||||||||||||
| Proceeds from the exercise of stock options | 374 | — | 374 | 12,798 | |||||||||||||||||||
| Repurchases of Class A non-voting common stock | (250,293) | — | (750,866) | (311,069) | |||||||||||||||||||
| Deferred payments for acquisitions | (5,000) | — | (72,539) | (3,695) | |||||||||||||||||||
| Repurchases of convertible notes | — | — | (1,994,550) | (859,042) | |||||||||||||||||||
| Repayment of convertible notes | — | — | (36,240) | — | |||||||||||||||||||
| Other | (1,599) | — | (8,497) | (1,799) | |||||||||||||||||||
| Net cash provided by (used in) financing activities | (256,518) | — | (848,125) | (428,624) | |||||||||||||||||||
| Change in cash, cash equivalents, and restricted cash | 75,898 | 81,841 | (18,837) | (732,228) | |||||||||||||||||||
| Cash, cash equivalents, and restricted cash, beginning of period | 955,499 | 968,393 | 1,050,234 | 1,782,462 | |||||||||||||||||||
| Cash, cash equivalents, and restricted cash, end of period | $ | 1,031,397 | $ | 1,050,234 | $ | 1,031,397 | $ | 1,050,234 | |||||||||||||||
8
SNAP INC.
CONSOLIDATED STATEMENTS OF OPERATIONS
(in thousands, except per share amounts, unaudited)
Three Months Ended December 31, | Year Ended December 31, | ||||||||||||||||||||||
| 2025 | 2024 | 2025 | 2024 | ||||||||||||||||||||
| Revenue | $ | 1,716,461 | $ | 1,557,283 | $ | 5,931,447 | $ | 5,361,398 | |||||||||||||||
| Costs and expenses: | |||||||||||||||||||||||
| Cost of revenue | 702,443 | 671,660 | 2,669,575 | 2,474,237 | |||||||||||||||||||
| Research and development | 472,693 | 422,937 | 1,793,601 | 1,691,683 | |||||||||||||||||||
| Sales and marketing | 249,280 | 248,214 | 1,021,305 | 1,063,675 | |||||||||||||||||||
| General and administrative | 242,328 | 241,349 | 979,133 | 919,097 | |||||||||||||||||||
| Total costs and expenses | 1,666,744 | 1,584,160 | 6,463,614 | 6,148,692 | |||||||||||||||||||
| Operating income (loss) | 49,717 | (26,877) | (532,167) | (787,294) | |||||||||||||||||||
| Interest income | 31,687 | 38,573 | 134,159 | 153,466 | |||||||||||||||||||
| Interest expense | (36,498) | (5,813) | (121,998) | (21,552) | |||||||||||||||||||
| Other income (expense), net | (6,946) | 8,382 | 68,870 | (16,846) | |||||||||||||||||||
| Income (loss) before income taxes | 37,960 | 14,265 | (451,136) | (672,226) | |||||||||||||||||||
| Income tax benefit (expense) | 7,249 | (5,164) | (9,353) | (25,630) | |||||||||||||||||||
| Net income (loss) | $ | 45,209 | $ | 9,101 | $ | (460,489) | $ | (697,856) | |||||||||||||||
Net income (loss) per share attributable to Class A, Class B, and Class C common stockholders: | |||||||||||||||||||||||
| Basic | $ | 0.03 | $ | 0.01 | $ | (0.27) | $ | (0.42) | |||||||||||||||
| Diluted | $ | 0.03 | $ | 0.01 | $ | (0.27) | $ | (0.42) | |||||||||||||||
Weighted average shares used in computation of net income (loss) per share: | |||||||||||||||||||||||
| Basic | 1,710,465 | 1,681,160 | 1,694,598 | 1,659,147 | |||||||||||||||||||
| Diluted | 1,720,347 | 1,717,119 | 1,694,598 | 1,659,147 | |||||||||||||||||||
9
SNAP INC.
CONSOLIDATED BALANCE SHEETS
(in thousands, except par value)
| December 31, 2025 | December 31, 2024 | ||||||||||
| (unaudited) | |||||||||||
| Assets | |||||||||||
| Current assets | |||||||||||
| Cash and cash equivalents | $ | 1,030,435 | $ | 1,046,534 | |||||||
| Marketable securities | 1,910,137 | 2,329,745 | |||||||||
| Accounts receivable, net of allowance | 1,372,237 | 1,348,472 | |||||||||
| Prepaid expenses and other current assets | 272,065 | 182,006 | |||||||||
| Total current assets | 4,584,874 | 4,906,757 | |||||||||
| Property and equipment, net | 578,075 | 489,088 | |||||||||
| Operating lease right-of-use assets | 506,216 | 530,441 | |||||||||
| Intangible assets, net | 66,613 | 86,363 | |||||||||
| Goodwill | 1,720,769 | 1,689,785 | |||||||||
| Other assets | 221,255 | 233,914 | |||||||||
| Total assets | $ | 7,677,802 | $ | 7,936,348 | |||||||
| Liabilities and Stockholders’ Equity | |||||||||||
| Current liabilities | |||||||||||
| Accounts payable | $ | 219,793 | $ | 173,197 | |||||||
| Operating lease liabilities | 48,479 | 24,885 | |||||||||
| Accrued expenses and other current liabilities | 971,627 | 1,009,254 | |||||||||
| Short-term debt, net | 46,969 | 36,212 | |||||||||
| Total current liabilities | 1,286,868 | 1,243,548 | |||||||||
| Long-term debt, net | 3,489,860 | 3,607,717 | |||||||||
| Operating lease liabilities, noncurrent | 557,823 | 575,082 | |||||||||
| Other liabilities | 61,756 | 59,240 | |||||||||
| Total liabilities | 5,396,307 | 5,485,587 | |||||||||
| Commitments and contingencies | |||||||||||
| Stockholders’ equity | |||||||||||
Class A non-voting common stock, $0.00001 par value. 3,000,000 shares authorized, 1,502,073 shares issued, 1,457,403 shares outstanding as of December 31, 2025, and 3,000,000 shares authorized, 1,483,718 shares issued, 1,436,495 shares outstanding as of December 31, 2024. | 15 | 14 | |||||||||
Class B voting common stock, $0.00001 par value. 700,000 shares authorized, 22,523 shares issued and outstanding as of December 31, 2025 and December 31, 2024. | — | — | |||||||||
Class C voting common stock, $0.00001 par value. 260,888 shares authorized, 231,627 shares issued and outstanding as of December 31, 2025 and December 31, 2024. | 2 | 2 | |||||||||
Treasury stock, at cost. 44,670 and 47,222 shares of Class A non-voting common stock as of December 31, 2025 and December 31, 2024, respectively. | (435,722) | (460,620) | |||||||||
| Additional paid-in capital | 16,637,324 | 15,644,132 | |||||||||
| Accumulated deficit | (13,946,816) | (12,735,461) | |||||||||
| Accumulated other comprehensive income (loss) | 26,692 | 2,694 | |||||||||
| Total stockholders’ equity | 2,281,495 | 2,450,761 | |||||||||
| Total liabilities and stockholders’ equity | $ | 7,677,802 | $ | 7,936,348 | |||||||
10
SNAP INC.
RECONCILIATION OF GAAP TO NON-GAAP FINANCIAL MEASURES
(in thousands, unaudited)
Three Months Ended December 31, | Year Ended December 31, | ||||||||||||||||||||||
| 2025 | 2024 | 2025 | 2024 | ||||||||||||||||||||
| Free Cash Flow reconciliation: | |||||||||||||||||||||||
| Net cash provided by (used in) operating activities | $ | 269,578 | $ | 230,633 | $ | 656,170 | $ | 413,480 | |||||||||||||||
| Less: | |||||||||||||||||||||||
| Purchases of property and equipment | (64,022) | (48,275) | (218,981) | (194,826) | |||||||||||||||||||
| Free Cash Flow | $ | 205,556 | $ | 182,358 | $ | 437,189 | $ | 218,654 | |||||||||||||||
Three Months Ended December 31, | Year Ended December 31, | ||||||||||||||||||||||
| 2025 | 2024 | 2025 | 2024 | ||||||||||||||||||||
| Adjusted EBITDA reconciliation: | |||||||||||||||||||||||
| Net income (loss) | $ | 45,209 | $ | 9,101 | $ | (460,489) | $ | (697,856) | |||||||||||||||
| Add (deduct): | |||||||||||||||||||||||
| Interest income | (31,687) | (38,573) | (134,159) | (153,466) | |||||||||||||||||||
| Interest expense | 36,498 | 5,813 | 121,998 | 21,552 | |||||||||||||||||||
| Other (income) expense, net | 6,946 | (8,382) | (68,870) | 16,846 | |||||||||||||||||||
| Income tax (benefit) expense | (7,249) | 5,164 | 9,353 | 25,630 | |||||||||||||||||||
| Depreciation and amortization | 43,381 | 39,581 | 163,633 | 154,459 | |||||||||||||||||||
| Stock-based compensation expense | 257,238 | 257,731 | 1,016,825 | 1,031,621 | |||||||||||||||||||
| Payroll and other tax expense related to stock-based compensation | 7,410 | 5,572 | 41,188 | 37,768 | |||||||||||||||||||
Restructuring charges (1) | — | — | — | 72,051 | |||||||||||||||||||
| Adjusted EBITDA | $ | 357,746 | $ | 276,007 | $ | 689,479 | $ | 508,605 | |||||||||||||||
(1)Restructuring charges during 2024 primarily include $70.2 million of cash severance, stock-based compensation expense, and other charges associated with the 2024 restructuring. These charges are not reflective of underlying trends in our business.
Total depreciation and amortization expense by function:
Three Months Ended December 31, | Year Ended December 31, | ||||||||||||||||||||||
| 2025 | 2024 | 2025 | 2024 | ||||||||||||||||||||
Depreciation and amortization expense (1): | |||||||||||||||||||||||
| Cost of revenue | $ | 1,818 | $ | 1,123 | $ | 5,759 | $ | 6,110 | |||||||||||||||
| Research and development | 26,568 | 24,351 | 101,531 | 99,656 | |||||||||||||||||||
| Sales and marketing | 5,945 | 5,333 | 21,363 | 19,947 | |||||||||||||||||||
| General and administrative | 9,050 | 8,774 | 34,980 | 32,361 | |||||||||||||||||||
| Total | $ | 43,381 | $ | 39,581 | $ | 163,633 | $ | 158,074 | |||||||||||||||
(1)Depreciation and amortization expense for the year ended December 31, 2024 includes restructuring charges.
11
SNAP INC.
RECONCILIATION OF GAAP TO NON-GAAP FINANCIAL MEASURES (continued)
(in thousands, except per share amounts, unaudited)
Total stock-based compensation expense by function:
Three Months Ended December 31, | Year Ended December 31, | ||||||||||||||||||||||
| 2025 | 2024 | 2025 | 2024 | ||||||||||||||||||||
Stock-based compensation expense (1): | |||||||||||||||||||||||
| Cost of revenue | $ | 2,009 | $ | 1,626 | $ | 7,426 | $ | 6,034 | |||||||||||||||
| Research and development | 185,456 | 165,330 | 680,602 | 683,830 | |||||||||||||||||||
| Sales and marketing | 43,627 | 56,463 | 198,013 | 216,672 | |||||||||||||||||||
| General and administrative | 26,146 | 34,312 | 130,784 | 134,487 | |||||||||||||||||||
| Total | $ | 257,238 | $ | 257,731 | $ | 1,016,825 | $ | 1,041,023 | |||||||||||||||
(1)Stock-based compensation expense for the year ended December 31, 2024 includes restructuring charges.
12
SNAP INC.
SUPPLEMENTAL FINANCIAL INFORMATION AND BUSINESS METRICS
(dollars and shares in thousands, except per user amounts, unaudited)
| Q3 2024 | Q4 2024 | Q1 2025 | Q2 2025 | Q3 2025 | Q4 2025 | ||||||||||||||||||||||||||||||
| (NM = Not Meaningful) | |||||||||||||||||||||||||||||||||||
| Cash Flows and Shares | |||||||||||||||||||||||||||||||||||
| Net cash provided by (used in) operating activities | $ | 115,872 | $ | 230,633 | $ | 151,610 | $ | 88,494 | $ | 146,488 | $ | 269,578 | |||||||||||||||||||||||
| Net cash provided by (used in) operating activities - YoY (year-over-year) | NM | 40 | % | 72 | % | 514 | % | 26 | % | 17 | % | ||||||||||||||||||||||||
| Net cash provided by (used in) operating activities - TTM (trailing twelve months) | $ | 347,421 | $ | 413,480 | $ | 476,738 | $ | 586,609 | $ | 617,225 | $ | 656,170 | |||||||||||||||||||||||
| Purchases of property and equipment | $ | (44,041) | $ | (48,275) | $ | (37,214) | $ | (64,701) | $ | (53,044) | $ | (64,022) | |||||||||||||||||||||||
| Purchases of property and equipment - YoY | (40) | % | (10) | % | (26) | % | 24 | % | 20 | % | 33 | % | |||||||||||||||||||||||
| Purchases of property and equipment - TTM | $ | (200,270) | $ | (194,826) | $ | (181,592) | $ | (194,231) | $ | (203,234) | $ | (218,981) | |||||||||||||||||||||||
| Free Cash Flow | $ | 71,831 | $ | 182,358 | $ | 114,396 | $ | 23,793 | $ | 93,444 | $ | 205,556 | |||||||||||||||||||||||
| Free Cash Flow - YoY | 218 | % | 65 | % | 202 | % | 132 | % | 30 | % | 13 | % | |||||||||||||||||||||||
| Free Cash Flow - TTM | $ | 147,151 | $ | 218,654 | $ | 295,146 | $ | 392,378 | $ | 413,991 | $ | 437,189 | |||||||||||||||||||||||
| Common shares outstanding | 1,672,212 | 1,690,645 | 1,686,678 | 1,682,350 | 1,710,909 | 1,711,554 | |||||||||||||||||||||||||||||
| Common shares outstanding - YoY | 2 | % | 3 | % | 3 | % | 2 | % | 2 | % | 1 | % | |||||||||||||||||||||||
| Shares underlying stock-based awards | 132,783 | 135,036 | 136,044 | 144,011 | 150,460 | 168,060 | |||||||||||||||||||||||||||||
| Shares underlying stock-based awards - YoY | (14) | % | (15) | % | (7) | % | — | % | 13 | % | 24 | % | |||||||||||||||||||||||
| Total common shares outstanding plus shares underlying stock-based awards | 1,804,995 | 1,825,681 | 1,822,722 | 1,826,361 | 1,861,369 | 1,879,614 | |||||||||||||||||||||||||||||
| Total common shares outstanding plus shares underlying stock-based awards - YoY | 1 | % | 1 | % | 2 | % | 2 | % | 3 | % | 3 | % | |||||||||||||||||||||||
| Results of Operations | |||||||||||||||||||||||||||||||||||
| Revenue | $ | 1,372,574 | $ | 1,557,283 | $ | 1,363,217 | $ | 1,344,930 | $ | 1,506,839 | $ | 1,716,461 | |||||||||||||||||||||||
| Revenue - YoY | 15 | % | 14 | % | 14 | % | 9 | % | 10 | % | 10 | % | |||||||||||||||||||||||
| Revenue - TTM | $ | 5,165,402 | $ | 5,361,398 | $ | 5,529,842 | $ | 5,638,004 | $ | 5,772,269 | $ | 5,931,447 | |||||||||||||||||||||||
Revenue by region (1) | |||||||||||||||||||||||||||||||||||
| North America | $ | 857,621 | $ | 968,943 | $ | 831,691 | $ | 820,600 | $ | 897,814 | $ | 1,025,498 | |||||||||||||||||||||||
| North America - YoY | 9 | % | 8 | % | 12 | % | 7 | % | 5 | % | 6 | % | |||||||||||||||||||||||
| North America - TTM | $ | 3,267,854 | $ | 3,337,255 | $ | 3,425,815 | $ | 3,478,855 | $ | 3,519,048 | $ | 3,575,603 | |||||||||||||||||||||||
| Europe | $ | 248,902 | $ | 287,031 | $ | 224,015 | $ | 265,343 | $ | 297,950 | $ | 341,134 | |||||||||||||||||||||||
| Europe - YoY | 24 | % | 20 | % | 14 | % | 15 | % | 20 | % | 19 | % | |||||||||||||||||||||||
| Europe - TTM | $ | 912,834 | $ | 961,612 | $ | 989,783 | $ | 1,025,291 | $ | 1,074,339 | $ | 1,128,442 | |||||||||||||||||||||||
| Rest of World | $ | 266,051 | $ | 301,309 | $ | 307,511 | $ | 258,987 | $ | 311,075 | $ | 349,829 | |||||||||||||||||||||||
| Rest of World - YoY | 32 | % | 35 | % | 20 | % | 8 | % | 17 | % | 16 | % | |||||||||||||||||||||||
| Rest of World - TTM | $ | 984,714 | $ | 1,062,531 | $ | 1,114,244 | $ | 1,133,858 | $ | 1,178,882 | $ | 1,227,402 | |||||||||||||||||||||||
| Operating income (loss) | $ | (173,210) | $ | (26,877) | $ | (193,846) | $ | (259,676) | $ | (128,362) | $ | 49,717 | |||||||||||||||||||||||
| Operating income (loss) - YoY | 54 | % | 89 | % | 42 | % | (2) | % | 26 | % | 285 | % | |||||||||||||||||||||||
| Operating income (loss) - Margin | (13) | % | (2) | % | (14) | % | (19) | % | (9) | % | 3 | % | |||||||||||||||||||||||
| Operating income (loss) - TTM | $ | (1,009,130) | $ | (787,294) | $ | (647,908) | $ | (653,609) | $ | (608,761) | $ | (532,167) | |||||||||||||||||||||||
| Net income (loss) | $ | (153,247) | $ | 9,101 | $ | (139,587) | $ | (262,570) | $ | (103,541) | $ | 45,209 | |||||||||||||||||||||||
| Net income (loss) - YoY | 58 | % | 104 | % | 54 | % | (6) | % | 32 | % | 397 | % | |||||||||||||||||||||||
| Net income (loss) - Margin | (11) | % | 1 | % | (10) | % | (20) | % | (7) | % | 3 | % | |||||||||||||||||||||||
| Net income (loss) - TTM | $ | (955,204) | $ | (697,856) | $ | (532,353) | $ | (546,303) | $ | (496,597) | $ | (460,489) | |||||||||||||||||||||||
| Adjusted EBITDA | $ | 131,962 | $ | 276,007 | $ | 108,425 | $ | 41,270 | $ | 182,038 | $ | 357,746 | |||||||||||||||||||||||
| Adjusted EBITDA - YoY | 229 | % | 73 | % | 137 | % | (25) | % | 38 | % | 30 | % | |||||||||||||||||||||||
Adjusted EBITDA - Margin (2) | 10 | % | 18 | % | 8 | % | 3 | % | 12 | % | 21 | % | |||||||||||||||||||||||
| Adjusted EBITDA - TTM | $ | 391,747 | $ | 508,605 | $ | 571,371 | $ | 557,664 | $ | 607,740 | $ | 689,479 | |||||||||||||||||||||||
(1)Total revenue for geographic reporting is apportioned to each region based on our determination of the geographic location in which advertising impressions are delivered, as this approximates revenue based on user activity. This allocation is consistent with how we determine ARPU.
(2)We define Adjusted EBITDA margin as Adjusted EBITDA divided by GAAP revenue.
13
SNAP INC.
SUPPLEMENTAL FINANCIAL INFORMATION AND BUSINESS METRICS (continued)
(dollars and shares in thousands, except per user amounts, unaudited)
| Q3 2024 | Q4 2024 | Q1 2025 | Q2 2025 | Q3 2025 | Q4 2025 | ||||||||||||||||||||||||||||||
| Other | |||||||||||||||||||||||||||||||||||
DAU (in millions) (1) | 443 | 453 | 460 | 469 | 477 | 474 | |||||||||||||||||||||||||||||
DAU - YoY (2) | 9 | % | 9 | % | 9 | % | 9 | % | 8 | % | 5 | % | |||||||||||||||||||||||
| DAU by region (in millions) | |||||||||||||||||||||||||||||||||||
| North America | 100 | 100 | 99 | 98 | 98 | 94 | |||||||||||||||||||||||||||||
| North America - YoY | — | % | (1) | % | (1) | % | (2) | % | (3) | % | (5) | % | |||||||||||||||||||||||
| Europe | 99 | 99 | 99 | 100 | 100 | 98 | |||||||||||||||||||||||||||||
| Europe - YoY | 4 | % | 4 | % | 3 | % | 3 | % | 1 | % | (1) | % | |||||||||||||||||||||||
| Rest of World | 244 | 254 | 262 | 271 | 280 | 282 | |||||||||||||||||||||||||||||
| Rest of World - YoY | 16 | % | 17 | % | 16 | % | 15 | % | 15 | % | 11 | % | |||||||||||||||||||||||
MAU (in millions) | 883 | 895 | 913 | 932 | 943 | 946 | |||||||||||||||||||||||||||||
MAU - YoY (2) | 7 | % | 7 | % | 7 | % | 7 | % | 7 | % | 6 | % | |||||||||||||||||||||||
| ARPU | $ | 3.10 | $ | 3.44 | $ | 2.96 | $ | 2.87 | $ | 3.16 | $ | 3.62 | |||||||||||||||||||||||
| ARPU - YoY | 6 | % | 5 | % | 5 | % | — | % | 2 | % | 5 | % | |||||||||||||||||||||||
| ARPU by region | |||||||||||||||||||||||||||||||||||
| North America | $ | 8.54 | $ | 9.73 | $ | 8.41 | $ | 8.33 | $ | 9.20 | $ | 10.88 | |||||||||||||||||||||||
| North America - YoY | 9 | % | 9 | % | 13 | % | 9 | % | 8 | % | 12 | % | |||||||||||||||||||||||
| Europe | $ | 2.52 | $ | 2.89 | $ | 2.26 | $ | 2.65 | $ | 2.99 | $ | 3.47 | |||||||||||||||||||||||
| Europe - YoY | 19 | % | 16 | % | 11 | % | 13 | % | 19 | % | 20 | % | |||||||||||||||||||||||
| Rest of World | $ | 1.09 | $ | 1.19 | $ | 1.17 | $ | 0.96 | $ | 1.11 | $ | 1.24 | |||||||||||||||||||||||
| Rest of World - YoY | 14 | % | 16 | % | 4 | % | (6) | % | 2 | % | 5 | % | |||||||||||||||||||||||
| Employees (full-time; excludes part-time, contractors, and temporary personnel) | 4,800 | 4,911 | 5,061 | 5,206 | 5,194 | 5,261 | |||||||||||||||||||||||||||||
| Employees - YoY | (11) | % | (7) | % | 5 | % | 10 | % | 8 | % | 7 | % | |||||||||||||||||||||||
| Depreciation and amortization expense | |||||||||||||||||||||||||||||||||||
| Cost of revenue | $ | 965 | $ | 1,123 | $ | 1,420 | $ | 1,505 | $ | 1,016 | $ | 1,818 | |||||||||||||||||||||||
| Research and development | 24,798 | 24,351 | 22,987 | 24,849 | 27,127 | 26,568 | |||||||||||||||||||||||||||||
| Sales and marketing | 4,953 | 5,333 | 4,823 | 5,108 | 5,487 | 5,945 | |||||||||||||||||||||||||||||
| General and administrative | 8,134 | 8,774 | 8,485 | 8,561 | 8,884 | 9,050 | |||||||||||||||||||||||||||||
| Total | $ | 38,850 | $ | 39,581 | $ | 37,715 | $ | 40,023 | $ | 42,514 | $ | 43,381 | |||||||||||||||||||||||
| Depreciation and amortization expense - YoY | (6) | % | (24) | % | (10) | % | 6 | % | 9 | % | 10 | % | |||||||||||||||||||||||
| Stock-based compensation expense | |||||||||||||||||||||||||||||||||||
| Cost of revenue | $ | 1,333 | $ | 1,626 | $ | 1,434 | $ | 1,656 | $ | 2,327 | $ | 2,009 | |||||||||||||||||||||||
| Research and development | 172,516 | 165,330 | 156,688 | 166,809 | 171,649 | 185,456 | |||||||||||||||||||||||||||||
| Sales and marketing | 53,345 | 56,463 | 54,440 | 48,710 | 51,236 | 43,627 | |||||||||||||||||||||||||||||
| General and administrative | 33,035 | 34,312 | 34,776 | 34,711 | 35,151 | 26,146 | |||||||||||||||||||||||||||||
| Total | $ | 260,229 | $ | 257,731 | $ | 247,338 | $ | 251,886 | $ | 260,363 | $ | 257,238 | |||||||||||||||||||||||
| Stock-based compensation expense - YoY | (27) | % | (23) | % | (6) | % | (3) | % | — | % | — | % | |||||||||||||||||||||||
(1)Numbers may not foot due to rounding.
(2)In the first quarter of 2025, we refined our processes and controls to allow us to more accurately record user activity that would not otherwise be recorded during such period due to delays in receiving user metric information resulting from carrier or other user connectivity issues during the measurement period. For additional information concerning these refinements, see the “Note Regarding User Metrics and Other Data” in our Quarterly Report filed on Form 10-Q for the first quarter of 2025. As a result of such refinements, our DAUs and MAUs may not be directly comparable to those in prior periods.
14
Exhibit 99.2
Introduction Last fall, we embarked on a new chapter for our company with the articulation of the Crucible Moment faced by our business.Atthattime,welaidoutourplanstoaccelerateanddiversifyourrevenuegrowth,pivotourbusinesstowardmore profitablegrowth,anddeliveronthecommerciallaunchofSpecsin2026.Theimpactsofthisstrategicdirectionbeganto manifest in the operating results of our business in Q4, and we are excited to build on this momentum in the year ahead. Over the last 3 years, we have grown Monthly Active Users(MAU)bymorethan150million,reaching946millioninthe most recent quarter, and bringing us within striking distance of our goal to reach 1billionglobalMAU.Wehavealready achievedimmensereachanddepthofengagementinmanyoftheworld’smostattractiveadvertisinggeographies,andwe believethisaffordsusasignificantopportunitytogrowourtoplineandexpandaveragerevenueperuser(ARPU)overtime. Growing our community in these prosperous geographies remains apriority,andweremaincommittedtoourlongterm goal of reaching1billionMAU,butgoingforwardwewillseektostrikeabetterbalancebetweenthepaceofcommunity growth and rate of topline growth in order to pivot our business to more profitable growth. For the advertising business, our focus will be on threecoreinitiatives.Thefirstisfosteringdirectconnectionsbetween BrandsandSnapchattersbyleveragingourcoreproductcapabilitiesacrossSnapchat.Thesecondwillbemakingiteasier and more performant for advertisers to connect with Snapchatters by leveraging AI tooling and capabilities end-to-end throughouradplatformincludingcreativedevelopment,campaignsetup,andperformanceoptimization.Finally,weplanto grow our advertiser base by scaling and optimizing our go-to-market operations that support the success of small and mediumsizedbusinesses(SMBs).Ultimately,wewillgradetheperformanceofouradvertisingbusinessbasedontherate of growth in advertising revenue, with a focus on gaining share over time. The Other Revenue portion of our business has become an outsized source of growth, and is playing a critical role in diversifying our topline.Intheyearahead,wewillfocusongrowingexistingsubscriptionoffers,includingSnapchat+and Memories Storage Plans, while innovating to bring compelling new offers to our platform. This momentum is already materializing, with subscribers growing 71% year-over-year to reach 24 million in Q4. In the year ahead, growth in subscribers will be a critical input metric to track our progress, and we will ultimately grade ourperformancebasedon growth of the annualized run rate for Other Revenue. Wearefocusingonthreesignificantcatalystsforgrossmarginexpansiontodriveprofitablegrowth.First,withcommunity growthfocusedonmonetizablemarkets,andwithourcosttoserveincreasinglycalibratedtothemonetizationpotentialof eachmarket,weexpectthatourinfrastructurecostswillpivotfrombeingasourceofgrossmarginpressuretobecomea margin accretive investment. Second, as more of our ad revenue is derived from higher margin placements such as SponsoredSnapsandPromotedPlaces,weexpectadvertisingmarginstoimprove.Third,weexpectthatthegrowingscale of our subscription business, which is built on a foundation of existing engagement and infrastructure investment, will become increasingly accretivetooverallgrossmargins.IntheCrucibleMomentlettersharedlastfall,wesetanearterm goaltoachieve60%grossmargins.Wehavealreadymademeaningfulprogresstowardthatgoalbyachievinga59%gross margin in Q4, and we believe there is a clear path to exceed this goal in 2026. We are excited about our plans to accelerate toplinegrowth,diversifyourrevenuestreams,andbuildamorefinancially efficient business in the year ahead. Ultimately, we will grade our performance on our progress toward achieving SNAP INC. | Q4 2025 | INVESTOR LETTER 1
meaningfulNetIncomeprofitabilityoverthemediumterm.Importantly,webelievewecandeliveronthisprofitablegrowth path as we continue to invest in the future of augmented reality and support the consumer launch of Specs later this year. Community For our community, we are focused on strengthening engagement in the world’s most developed advertising geographies,bybuildingexperiencesacrossSnapchatthatspark conversations and deepen relationships between Snapchatters. The connections betweenfriendsandfamilyarewhatunifyourcamera,messaging,SnapMap,andcontent experiencesandenableourplatformtoenrichthelivesofSnapchattersaroundtheworld. By prioritizing features that encourage creativity,discovery,andinteractionacrossthese surfaces, we aim to increase the relevance and durability of engagement in ways that support long-term community growth and monetization. Our cameraremainscentraltohowSnapchatterscommunicateandexpressthemselves, and it is often the starting point for conversations on Snapchat. We are enhancing our camera with AI-powered capabilities that make creation more intuitive, dynamic, and social. Recent breakthroughs in our proprietary models allow us to deliver high-quality generative AI camera experiences efficiently at scale by running ourmodelson-device. AI-driven Lenses represent a meaningful evolution from traditional Lenses, shifting the experience from applying a fixed set of visual overlays to creating images and scenes dynamicallythroughgenerativeAI.Snapchatterscannowprompt,explore,andco-create personalizedcontentinrealtime,andthisshiftisalreadyresonatingwithourcommunity. More than 700millionSnapchattershaveengagedwithgenerativeAILensesmorethan 17 billion times, often discovering and sharing these Lenses throughconversationswith friendsandfamily.OurImagineLens,launchedinSeptember,hasalreadybeenengaged with nearly two billion times, highlighting strong early traction and repeat usage. This momentum is supported by a global creator and developer ecosystem that is unmatched in scale. More than 450,000 creators from nearly every country have built over 5 million Lenses using our industry-leading AR and AI tools,helping ensure that camera experiences remain fresh, relevant, and closely aligned with how our community builds relationships. SharingSnapswithfriendsandfamilyremainsthefoundationofSnapchatandacoredriverofengagement,retention,and long-term value creation. Our platform is designed around visual communication that enables frequent interactions and helpsourcommunitymaintaincloserelationshipsovertime.Wecontinuetoseestrongmomentumindirectcommunication between friends and family, with messaging behaviors reflecting the durability of Snapchat’scorevalueproposition.For example, average daily messages sent increased 5% year-over-year, and the number of bidirectional communicators increased 5% year-over-year in Q4. We are investing in product experiences that make it easier to start conversations, sustain them over time, and introduce new waysforfriendsandfamilytointeract.Forexample,inQ4,webegantesting Topic Chats, a new feature that allows Snapchatters to participate in public conversations around trending topics and events,discoversharedinterests,andexplorewhat’shappeningvisuallyacrossourcommunity.Wealsobeganrollingout newtwoplayerturn-basedgamesdesignedtocreateplayful,low-frictionwaysforfriendsandfamilytoconnect,suchas2 SNAP INC. | Q4 2025 | INVESTOR LETTER 2
PlayerMiniGolfandMagicJump.InQ4,theseexperiencescontributedtomorethan200 millionSnapchattersplayingGameseverymonthonaverage,representinganincreaseof 90% year-over-year. The Snap Map has become an increasingly important driver of engagementbyhelping Snapchatters stay connected to friends,localcommunities,andplacesintherealworld. SnapchattersusetheSnapMaptoseewherefriendsarespendingtime,discoverwhatis happening nearby, and engage with local businesses and events. Monthly active Snap Mapusersreached435millioninQ4,up6%year-over-year,creatingnaturalopportunities forbothorganicengagementandmonetizationthroughadplacementssuchasPromoted Places. Wehavebuiltadifferentiatedcontentplatformpoweredbyauthenticcontentthatisnative to Snapchat and that reinforces human connection through content sharing as a conversation starter. Our systems increasingly surface timely, relevant content by identifying emerging trends and original formats across Spotlight and Stories and matching them to the right audiences. In Q4, enhancements to our ranking and trend-detectionmodelscontributedtoimprovedcontentfreshnessandengagement.For example,thenumberofSpotlightrepostsandsharesincreased69%year-over-yearinthe US,reflectingourabilitytosurfacetimelycontentatscale.Inaddition,Snapchatcontinues to be a platform where both established and emerging creators can growanaudience and build a sustainable business. For example, RandaAdami,anaildesignerandtravel creator,grewherfollowerbasebymorethan20xoverthelastsixmonthsbyconsistently posting to Spotlight and leveraging engagement tools such as Q&A and Spotlight comments to strengthen connections with her viewers. As we continue to innovate across these surfaces, we are seeing the impact of better calibrating our investments in community growth and cost to serve with the long term monetizationpotentialofeachmarket.InQ4,globalmonthlyactiveusersincreasedby3 millionquarter-over-quarterto946million,whileglobaldailyactiveusersdeclinedby3millionquarter-over-quarterto474 million5. The decline in Global DAU in Q4 reflects, in part, our decision to substantially reduce our community growth marketing investments inordertofocusonmoreprofitablegrowth.ImprovingARPUthroughmoredirectmonetizationof ourcoreproductremainsakeypriority,includingcontinuedgrowthinSnapchat+,theexpansionofSponsoredSnapsand Promoted Places, the launch of Lens+, and Memories Storage Plans. While these initiatives involve trade-offs with engagement, they are strengthening topline performance, supporting more stable and retentive subscription-based revenue streams, and improving the gross margin profile of our business. Theregulatoryenvironmentalsopresentsnear-termrisktoengagementmetrics.InQ4,weimplementedplatform-levelage verificationinAustraliainaccordancewithanewlawrequiringuserstobeatleast16yearsold,resultingintheremovalof approximately400,000accounts.WehavesincebeguntestingnewsignalsfromApple’sDeclaredAgeRangeAPI,andwe plantotestGoogle’ssolutiononceitbecomesavailable.Whiletheseactionsmayadverselyaffectengagementmetricsas SNAP INC. | Q4 2025 | INVESTOR LETTER 3
implementation progresses, we believe it is the right thing to do to maintain the long term trust of our community and partners, and we remain committed to our long-term goal of serving more than 1 billion global monthly active users. Specs Our long-termvisionforaugmentedrealityextendsbeyondthesmartphonetoafuturewherecomputingismorenatural, contextual,andseamlesslyintegratedintotherealworld.Formorethanadecade,wehaveinvestedinbuildingaplatform that brings digital experiences closer to how people see, move through, and interact withtheireverydayenvironments. Specsarecentraltothisvision.Afterfivegenerationsofdevelopmentandrefinement,weplantolaunchSpecspubliclyin 2026, which we believe represents a significantstepforwardinhuman-centeredcomputingandtheevolutionofourAR platform. As we prepare for launch, we have continued to strengthen both the platform and the ecosystem that is designed to supportadoptionatscale.WebegantestingSnapCloud,poweredbySupabase,tomakeadvancedbackendcapabilities moreaccessiblewithinLensStudio,enablingdeveloperstobuildricher,moredynamicARexperiences.Wealsoannounced that all Lenses built today for Spectacles will be compatible with Specs at launch, providing continuity and scale for developers from day one. PartnersanddevelopersarealreadybuildingcompellingARexperiencesthatdemonstratethebreadthofwhatispossible on Specs. Star Wars: Holocron Histories from ILM is now live onSpectacles,highlightingthepowerofsmartglassesfor immersivestorytellingwithoneoftheworld’smostbelovedfranchises.Thisexperienceshowcasesthestudio’scontinued innovation in technology andplatformsthroughanextensionoftheStarWarsgalaxy.Inaddition,developerHarryBanda created Card Master, a multiplayer AR card game that lets players face AI opponents in classic card games, with tutorials and achievements, evolving into a broader suite of AR card experiences for Specs. We believe Snap is uniquely positionedtoleadthe next wave of spatial computing. With Snap OS2.0, Lens Studio, Snap Cloud, and a global developer ecosystem,wehavebuiltanend-to-endARplatform spanning software, tools, and hardware. Together, these capabilities position us to deliver fully standalone, human-centered eyewear that expands creative expression and unlocks new ways for people to engage with the world around them. Advertising Platform In Q4, we made meaningful progress executing against the three priorities guiding the evolution of our advertising business:fosteringmoredirectconnectionsbetweenbrandsandSnapchatters,makingadvertisingonSnapchateasierand more performant through our AI-driven ad platform, and expanding our advertiser base by scaling and optimizing our go-to-market operations for small and medium-sized businesses. Together, these efforts delivered measurable improvements in advertiser performance, positioning us for more durable growth as we enter 2026. SNAP INC. | Q4 2025 | INVESTOR LETTER 4
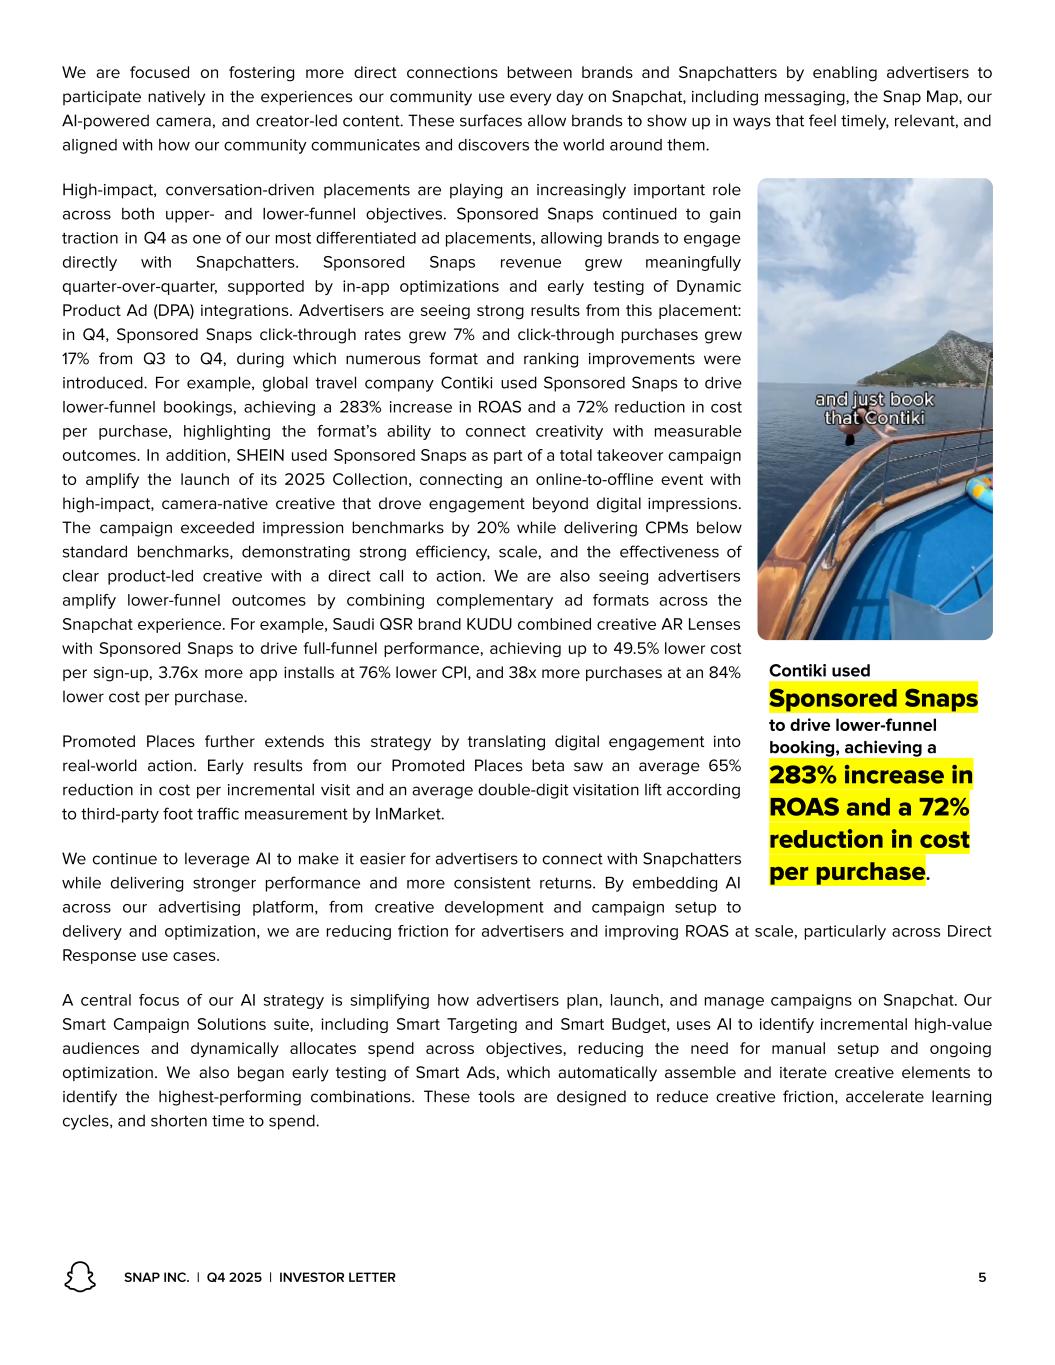
We are focused on fostering more direct connections between brands and Snapchatters by enabling advertisers to participatenativelyintheexperiencesourcommunityuseeverydayonSnapchat,includingmessaging,theSnapMap,our AI-poweredcamera,andcreator-ledcontent.Thesesurfacesallowbrandstoshowupinwaysthatfeeltimely,relevant,and aligned with how our community communicates and discovers the world around them. High-impact, conversation-driven placements are playing an increasingly important role across both upper- and lower-funnel objectives. Sponsored Snaps continued to gain tractioninQ4asoneofourmostdifferentiatedadplacements,allowingbrandstoengage directly with Snapchatters. Sponsored Snaps revenue grew meaningfully quarter-over-quarter, supported by in-app optimizations and early testing of Dynamic ProductAd(DPA)integrations.Advertisersareseeingstrongresultsfromthisplacement: in Q4, Sponsored Snaps click-through rates grew 7% and click-throughpurchasesgrew 17% from Q3 to Q4, during which numerous format and ranking improvements were introduced. For example, global travel company Contiki usedSponsoredSnapstodrive lower-funnel bookings, achieving a 283% increaseinROASanda72%reductionincost per purchase, highlighting the format’s ability to connect creativity with measurable outcomes.Inaddition,SHEINusedSponsoredSnapsaspartofatotaltakeovercampaign to amplify the launch of its 2025 Collection, connecting an online-to-offline event with high-impact, camera-native creative that drove engagement beyond digitalimpressions. The campaign exceeded impression benchmarks by 20% while delivering CPMs below standard benchmarks, demonstrating strong efficiency, scale, and the effectiveness of clear product-led creative with a direct call to action. We are also seeing advertisers amplify lower-funnel outcomes by combining complementary ad formats across the Snapchatexperience.Forexample,SaudiQSRbrandKUDUcombinedcreativeARLenses withSponsoredSnapstodrivefull-funnelperformance,achievingupto49.5%lowercost persign-up,3.76xmoreappinstallsat76%lowerCPI,and38xmorepurchasesatan84% lower cost per purchase. Promoted Places further extends this strategy by translating digital engagement into real-world action. Early results from our Promoted Places beta saw an average 65% reductionincostperincrementalvisitandanaveragedouble-digitvisitationliftaccording to third-party foot traffic measurement by InMarket. WecontinuetoleverageAItomakeiteasierforadvertiserstoconnectwithSnapchatters while delivering stronger performance and more consistent returns. By embedding AI across our advertising platform, from creative development and campaign setup to delivery and optimization, wearereducingfrictionforadvertisersandimprovingROASatscale,particularlyacrossDirect Response use cases. A central focus of our AI strategy is simplifying how advertisers plan, launch,andmanagecampaignsonSnapchat.Our Smart Campaign Solutions suite, including Smart Targeting and Smart Budget,usesAItoidentifyincrementalhigh-value audiences and dynamically allocates spend across objectives, reducing the need for manual setup and ongoing optimization. We also began early testing of Smart Ads, which automatically assemble and iterate creative elements to identify the highest-performing combinations. These tools are designed to reduce creative friction, accelerate learning cycles, and shorten time to spend. SNAP INC. | Q4 2025 | INVESTOR LETTER 5
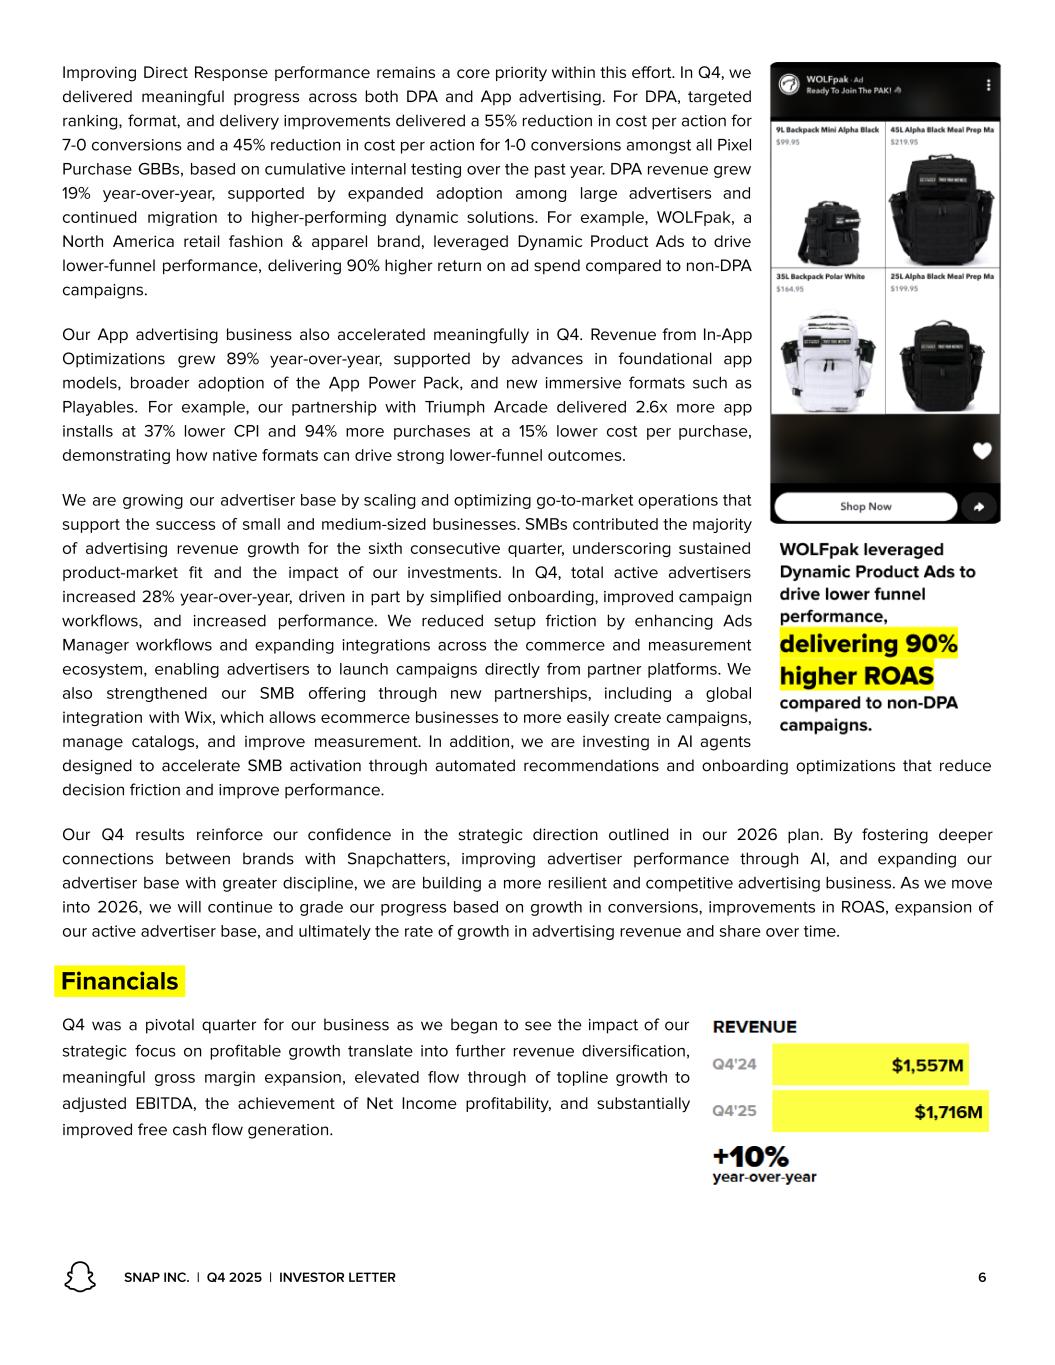
ImprovingDirectResponseperformanceremainsacoreprioritywithinthiseffort.InQ4,we delivered meaningful progress across both DPA and App advertising. For DPA, targeted ranking,format,anddeliveryimprovementsdelivereda55%reductionincostperactionfor 7-0conversionsanda45%reductionincostperactionfor1-0conversionsamongstallPixel PurchaseGBBs,basedoncumulativeinternaltestingoverthepastyear.DPArevenuegrew 19% year-over-year, supported by expanded adoption among large advertisers and continued migration to higher-performing dynamic solutions. For example, WOLFpak, a North America retail fashion & apparel brand, leveraged Dynamic Product Ads to drive lower-funnelperformance,delivering90%higherreturnonadspendcomparedtonon-DPA campaigns. Our App advertising business also accelerated meaningfully in Q4. RevenuefromIn-App Optimizations grew 89% year-over-year, supported by advances in foundational app models, broader adoption of the App Power Pack, and new immersive formats such as Playables. For example, our partnership with Triumph Arcade delivered 2.6x more app installs at 37% lower CPI and 94% more purchases at a 15% lower cost per purchase, demonstrating how native formats can drive strong lower-funnel outcomes. Wearegrowingouradvertiserbasebyscalingandoptimizinggo-to-marketoperationsthat supportthesuccessofsmallandmedium-sizedbusinesses.SMBscontributedthemajority of advertising revenue growth for the sixth consecutive quarter, underscoring sustained product-market fit and the impact of our investments. In Q4, total active advertisers increased28%year-over-year,driveninpartbysimplifiedonboarding,improvedcampaign workflows, and increased performance. We reduced setup friction by enhancing Ads Manager workflows and expanding integrations across the commerce and measurement ecosystem, enabling advertisers to launch campaigns directly frompartnerplatforms.We also strengthened our SMB offering through new partnerships, including a global integrationwithWix,whichallowsecommercebusinessestomoreeasilycreatecampaigns, manage catalogs, and improve measurement. In addition, we are investing in AI agents designed to accelerate SMB activation through automated recommendations and onboarding optimizations that reduce decision friction and improve performance. Our Q4 results reinforce our confidence in the strategic direction outlined in our 2026 plan. By fostering deeper connections between brands with Snapchatters, improving advertiser performance through AI, and expanding our advertiserbasewithgreaterdiscipline,wearebuildingamoreresilientandcompetitiveadvertisingbusiness.Aswemove into 2026, wewillcontinuetogradeourprogressbasedongrowthinconversions,improvementsinROAS,expansionof our active advertiser base, and ultimately the rate of growth in advertising revenue and share over time. Financials Q4 was a pivotal quarter for our business as we begantoseetheimpactofour strategic focus on profitable growth translate into further revenue diversification, meaningful gross margin expansion, elevated flow through of topline growth to adjusted EBITDA, the achievement of Net Income profitability, and substantially improved free cash flow generation. SNAP INC. | Q4 2025 | INVESTOR LETTER 6
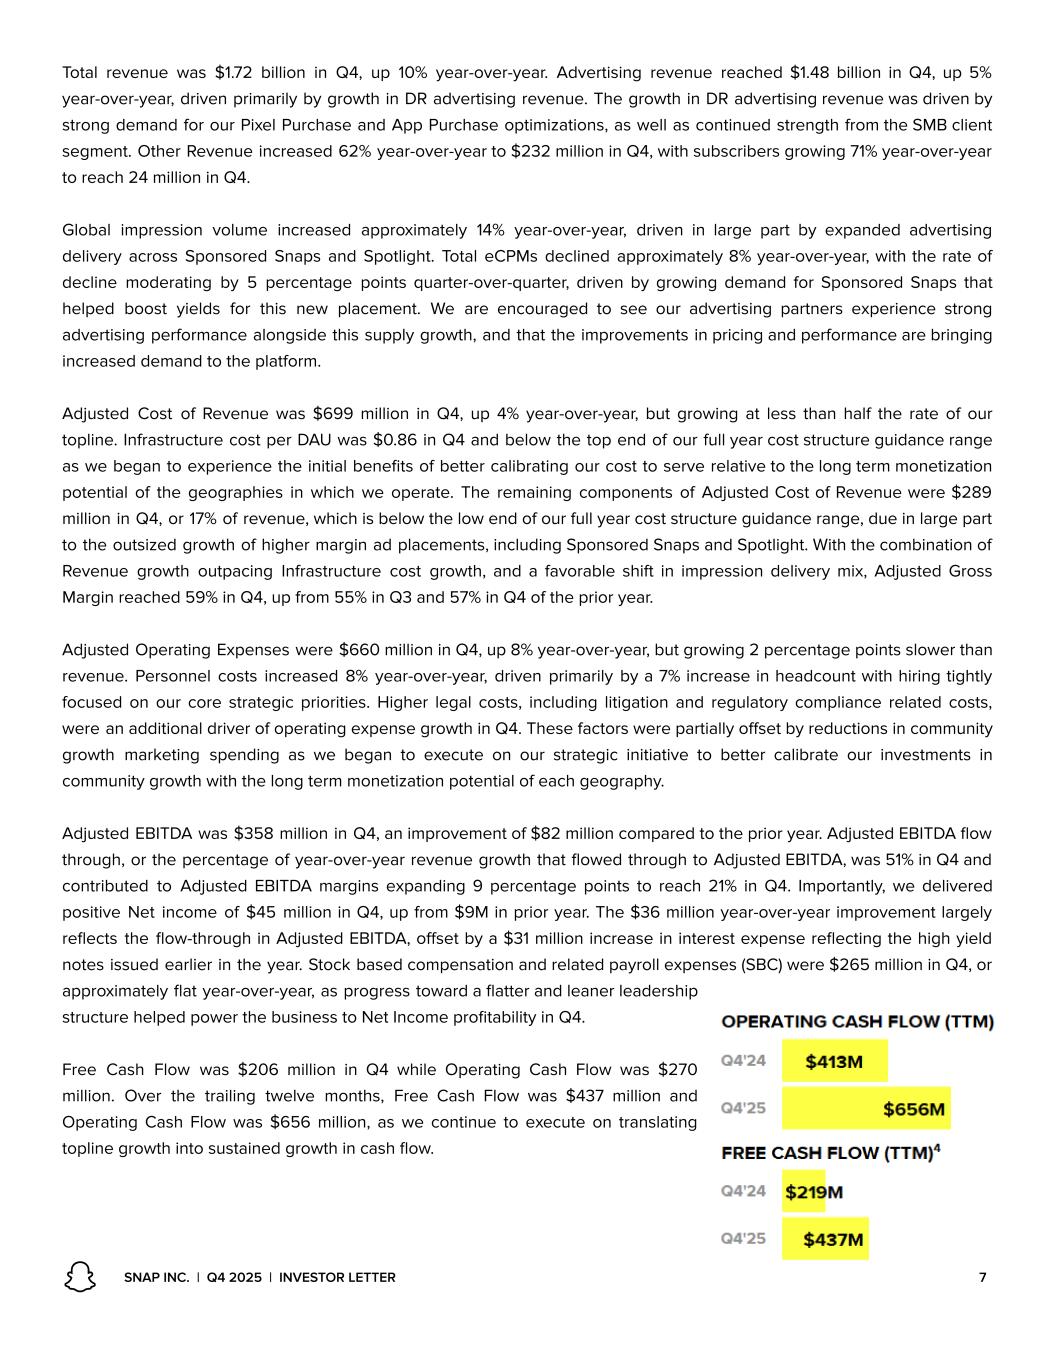
Total revenue was $1.72 billion in Q4, up 10% year-over-year. Advertising revenue reached $1.48 billion in Q4, up 5% year-over-year,drivenprimarilybygrowthinDRadvertisingrevenue.ThegrowthinDRadvertisingrevenuewasdrivenby strongdemandforourPixelPurchaseandAppPurchaseoptimizations,aswellascontinuedstrengthfromtheSMBclient segment.OtherRevenueincreased62%year-over-yearto$232millioninQ4,withsubscribersgrowing71%year-over-year to reach 24 million in Q4. Global impression volume increased approximately 14% year-over-year, driven in large part by expanded advertising delivery across Sponsored Snaps and Spotlight. Total eCPMs declined approximately8%year-over-year,withtherateof decline moderating by 5 percentage points quarter-over-quarter, driven by growing demand for Sponsored Snaps that helped boost yields for this new placement. We are encouraged to see our advertising partners experience strong advertisingperformancealongsidethissupplygrowth,andthattheimprovementsinpricingandperformancearebringing increased demand to the platform. Adjusted Cost of Revenue was $699 million in Q4, up 4% year-over-year, but growing at less than half the rate of our topline.InfrastructurecostperDAUwas$0.86inQ4andbelowthetopendofourfullyearcoststructureguidancerange aswebegantoexperiencetheinitialbenefitsofbettercalibratingourcosttoserverelativetothelongtermmonetization potential of the geographies in which we operate. The remaining components of AdjustedCostofRevenuewere$289 millioninQ4,or17%ofrevenue,whichisbelowthelowendofourfullyearcoststructureguidancerange,dueinlargepart totheoutsizedgrowthofhighermarginadplacements,includingSponsoredSnapsandSpotlight.Withthecombinationof Revenue growth outpacing Infrastructure cost growth, and a favorable shift in impression delivery mix, Adjusted Gross Margin reached 59% in Q4, up from 55% in Q3 and 57% in Q4 of the prior year. AdjustedOperatingExpenseswere$660millioninQ4,up8%year-over-year,butgrowing2percentagepointsslowerthan revenue. Personnel costs increased 8% year-over-year, driven primarily bya7%increaseinheadcountwithhiringtightly focused on our core strategic priorities. Higher legal costs, including litigation and regulatory compliance related costs, wereanadditionaldriverofoperatingexpensegrowthinQ4.Thesefactorswerepartiallyoffsetbyreductionsincommunity growth marketing spending as we began to execute on our strategic initiative to better calibrate our investments in community growth with the long term monetization potential of each geography. AdjustedEBITDAwas$358millioninQ4,animprovementof$82millioncomparedtotheprioryear.AdjustedEBITDAflow through,orthepercentageofyear-over-yearrevenuegrowththatflowedthroughtoAdjustedEBITDA,was51%inQ4and contributed to Adjusted EBITDA margins expanding 9 percentage points to reach 21% in Q4. Importantly, we delivered positive Net income of $45 millioninQ4,upfrom$9Minprioryear.The$36millionyear-over-yearimprovementlargely reflects the flow-throughinAdjustedEBITDA,offsetbya$31millionincreaseininterestexpensereflectingthehighyield notesissuedearlierintheyear.Stockbasedcompensationandrelatedpayrollexpenses(SBC)were$265millioninQ4,or approximatelyflatyear-over-year,asprogresstowardaflatterandleanerleadership structure helped power the business to Net Income profitability in Q4. Free Cash Flow was $206 million in Q4 while Operating Cash Flow was $270 million. Over the trailing twelve months, Free Cash Flow was $437 million and Operating Cash Flow was $656 million, as we continue to execute on translating topline growth into sustained growth in cash flow. SNAP INC. | Q4 2025 | INVESTOR LETTER 7
Wecontinuedtomanageoursharecountcarefully,withsharerepurchasescompletedthroughout2025helpinglimitshare count growth to 3% in Q4. We endedQ4withapproximately$2.9billionincashandmarketablesecurities,andjust$47 million in convertible notes set to mature in fiscal 2026. Given the strength of ourbalancesheet,ourprogresstowards sustainedfreecashflowgeneration,andourdesiretoopportunisticallymanageoursharecountforthebenefitofourlong term shareholders, we have authorized a new share repurchase program in the amount of $500 million. For the full year, we generated $5.93billioninrevenue,reflecting11%year-over-yeargrowth,drivenbyacombinationof ongoing strength in our SMBadvertisingsegmentaswellastherapidgrowthinoursubscriptionbusiness.Wedelivered $689millioninAdjustedEBITDA,representingAdjustedEBITDAflow-throughof32%in2025.Importantly,wecamewithin orbelowourfull-yearcoststructureguidanceacrossallkeymetricsaswemanagedourinvestmentlevelsinbalancewith the rate of revenue growth realized by our business throughout the year. Financial Outlook As we begin 2026, we are focused on accelerating topline growth, furtherdiversifyingourrevenuestreams,expanding gross margins, and making meaningful progress toward Net Income profitability. Our investment plans for 2026 reflect these priorities, and our intention is to calibrate our investments to revenue growth as we move through the year. Our Infrastructure investmentlevelsfor2026willbedrivenbyourstrategicinitiativetobetteralignourcosttoservewiththe longtermmonetizationpotentialofeachgeographyinwhichweoperate.Asaresult,ourfullyearcoststructureguidance rangeforInfrastructurecostsis$1.6billionto$1.65billion,whichwouldrepresentflatyear-over-yearinfrastructurecostsat the low end. WeestimatethattheremainingcomponentsofAdjustedCostofRevenuewillbeacombined16%to17%of revenue in each quarter of 2026, which would represent a 1-2 percentagepointimprovementover2025,drivenbythe benefit of outsized growth in higher margin ad placements. PersonnelcostsarethelargestcomponentofAdjustedOperatingExpensesandweexpectheadcountgrowthin2026to be roughly inline with the 7% headcount growth we experienced in Q4 2025, with hiring tightly focused on our core strategic priorities. We anticipatecontinuedelevatedlegalandregulatoryrelatedcosts,andweplantomakemeaningful proactive investments in community safety that will contribute to Adjusted Operating Expense growth. In addition, our Adjusted Operating Expenserangefor2026includesincrementalinvestmentsinproductdevelopmentandgo-to-market support for the consumer launch of Specs later this year. These factors will be partially offset by reduced spendingon communitygrowthmarketingasweadjusttheseinvestmentstobetterreflectthelongtermmonetizationpotentialofeach geography.Asaresult,weestimatethatfull-yearAdjustedOperatingExpenseswillbeapproximately$3.0billion.ForSBC and related expenses, we estimate approximately $1.2 billion in 2026. ForQ1specifically,ourguidancerangeforrevenueis$1.50billionto$1.53billion.OurQ1revenueguidancerangeexcludes anypotentialrevenuefromthePerplexityintegrationaswehaveyettomutuallyagreeonapathtoabroaderrollout.Given thisrevenuerange,andourinvestmentplansfortheyearahead,weestimatethatAdjustedEBITDAwillbebetween$170 millionand$190millioninQ1.Aswebegin2026,weareexcitedtoexecuteonourpivottowardprofitablegrowthandto makeincrementalprogresstowardourmediumtermgoalofdeliveringmeaningfulNetIncomeprofitability.Theimpactsof thisstrategicdirectionarealreadyevidentinourQ4results,andweareincrediblyproudoftheworkourteamisdoingto build on this momentum in Q1. SNAP INC. | Q4 2025 | INVESTOR LETTER 8
1. Adjusted Gross Profit is a non-GAAP measure, which we define as GAAP revenuelessAdjustedCostofRevenue.AdjustedGrossMarginisanon-GAAPmeasure,which we define as GAAP revenue less Adjusted Cost of Revenue divided by GAAP revenue. Adjusted Cost of Revenue is a non-GAAP measure and excludes stock-based compensation expense, payroll and other taxexpenserelatedtostock-basedcompensation,depreciationandamortization,andcertainotheritemsimpactingnetincome (loss) from time to time. See Appendix for reconciliation of GAAP Cost of Revenue to Adjusted Cost of Revenue. 2. Adjusted Operating Expenses is a non-GAAP measure and excludes stock-based compensation expense, payroll and other tax expense related to stock-based compensation, depreciation and amortization, and certain other items impacting net income (loss) from time to time.SeeAppendixforreconciliationofGAAPOperating Expenses to Adjusted Operating Expenses. 3. Adjusted EBITDA is a non-GAAP measure, which we define as net income (loss), excluding interest income; interest expense; other income (expense), net; income tax benefit (expense); depreciation and amortization; stock-based compensation expense; payroll and other tax expense related to stock-based compensation; andcertain other items impacting net income (loss) from time to time. See Appendix for reconciliation of net income (loss) to Adjusted EBITDA. 4. Free Cash Flow is a non-GAAP measure, which we define as net cash provided by (used in) operating activities,reducedbypurchasesofpropertyandequipment.See Appendix for reconciliation of net cash provided by (used in) operating activities to Free Cash Flow. 5. In the first quarter of 2025, we refined our processes and controls to allow us to moreaccuratelyrecorduseractivitythatwouldnototherwiseberecordedduringsuch period due to delaysinreceivingusermetricinformationresultingfromcarrierorotheruserconnectivityissuesduringthemeasurementperiod.Foradditionalinformation concerning these refinements,seethe“NoteRegardingUserMetricsandOtherData”inourQuarterlyReportfiledonForm10-Qforthefirstquarterof2025.Asaresultof such refinements, our DAUs may not be directly comparable to those in prior periods, as they reflect a comparison to previously reported numbers. SNAP INC. | Q4 2025 | INVESTOR LETTER 9
SNAP INC. | Q4 2025 | INVESTOR LETTER 10
Forward Looking Statements This letter contains forward-lookingstatements within themeaningof Section27Aof theSecurities Act of 1933, as amended, or theSecuritiesAct,and Section 21E of the Securities Exchange Act of 1934, as amended, or the Exchange Act about us and our industry that involve substantial risks and uncertainties. All statements other thanstatementsofhistoricalfactscontainedinthisletter,includingstatementsregardingguidance,ourfutureresultsof operations or financial condition, future stock repurchase programs or stock dividends, business strategy and plans, user growth and engagement, product initiatives, objectives of management for futureoperations, andadvertiser andpartner offerings, areforward-lookingstatements.Insomecases, you can identify forward-looking statements because they contain wordssuchas “anticipate,” “believe,” “contemplate,” “continue,” “could,” “estimate,” “expect,” “going to,” “intend,” “may,” “plan,” “potential,” “predict,” “project,” “should,” “target,” “will,” or “would” or thenegativeof thesewordsor other similar termsor expressions. Wecautionyouthat theforegoingmaynot includeall of theforward-lookingstatementsmadeinthisletter.Youshouldnot rely onforward-lookingstatements as predictionsoffutureevents.Wehavebasedtheforward-lookingstatementscontainedinthisletterprimarilyonour current expectationsandprojectionsabout futureevents andtrends,includingourfinancialoutlook,macroeconomicuncertainty,andgeo-politicalevents and conflicts, that we believe may continue to affect our business, financial condition, results of operations, and prospects. These forward-looking statements are subject to risks anduncertainties relatedto: our financial performance; our abilitytoattainandsustainprofitability;ourabilitytogenerate andsustain positive cashflow;ourabilitytoattractandretainusers,partners,andadvertisers;competitionandnewmarketentrants;managingourgrowth andfutureexpenses; compliancewith newlaws, regulations, andexecutiveactions;ourabilitytomaintain,protect,andenhanceourintellectualproperty; our ability tosucceedinexistingandnewmarketsegments;ourabilitytoattractandretainqualifiedteammembersandkeypersonnel;ourabilitytorepay or refinance outstanding debt, or to access additional financing; future acquisitions, divestitures, or investments; andthepotential adverseimpact of climatechange, natural disasters, health epidemics, macroeconomic conditions, andwar orotherarmedconflict,aswellasrisks,uncertainties,andother factors described in “Risk Factors” and elsewhere in our most recent periodic report filedwith theU.S. Securities andExchangeCommission, or SEC, whichis available ontheSEC’s website at www.sec.gov. Additional informationwill bemadeavailable in SnapInc.’speriodicreportthatwillbefiledwith theSECfor theperiodcoveredby this letter andother filingsthat wemakefromtimeto timewith theSEC. Inaddition,anyforward-lookingstatements contained in this letter are based on assumptions that we believe to be reasonable as of this date. We undertake no obligation to update any forward-lookingstatements to reflect events or circumstancesafter thedate of thisletterortoreflectnewinformationortheoccurrenceofunanticipated events, including future developments related to geo-political events and conflicts and macroeconomic conditions, except as required by law. Non-GAAP Financial Measures To supplement our consolidatedfinancial statements, whichare preparedandpresentedin accordancewith GAAP, weusecertain non-GAAPfinancial measures, as describedbelow, to understandandevaluateourcoreoperatingperformance.Thesenon-GAAPfinancialmeasures,whichmaybedifferent than similarly titled measures used by other companies, are presented to enhance investors’ overall understandingof our financial performanceand should not be considered a substitute for, or superior to, the financial information prepared and presented in accordance with GAAP. We use the non-GAAPfinancial measureof FreeCashFlow, whichisdefinedasnetcashprovidedby(usedin)operatingactivities,reducedbypurchasesofproperty and equipment. We believe Free Cash Flow is an important liquidity measure of the cash that is available, after capital expenditures, for operational expenses and investment in our business and is a key financial indicator used by management. Additionally, we believe that Free Cash Flow is an important measuresinceweusethird-party infrastructurepartners to host our servicesandthereforewedonot incursignificantcapitalexpendituresto support revenuegeneratingactivities.FreeCashFlowisusefultoinvestorsasaliquiditymeasurebecauseitmeasuresourabilitytogenerateorusecash. Onceourbusinessneedsandobligationsaremet,cashcanbeusedtomaintainastrongbalancesheetandinvestinfuturegrowth.Weusethenon-GAAP financial measure of AdjustedEBITDA, whichis definedas net income(loss), excludinginterest income; interest expense; other income(expense), net; incometax benefit (expense); depreciationandamortization; stock-basedcompensationexpense; payroll andother tax expenserelatedtostock-based compensation; andcertain other itemsimpactingnet income(loss) fromtimetotime.WebelievethatAdjustedEBITDAhelpsidentifyunderlyingtrendsin our business that could otherwise be masked by the effect of the expenses that we exclude in AdjustedEBITDA. Weuseother non-GAAPfinancial measures such as Adjusted Cost of Revenue and Adjusted OperatingExpenses. Thesemeasuresare definedas their respectiveGAAPexpenseline items, excludinginterest income; interest expense;otherincome(expense),net;incometaxbenefit(expense);depreciationandamortization;stock-based compensationexpense; payrollandothertaxexpenserelatedtostock-basedcompensation;andcertainotheritemsimpactingnetincome(loss)fromtime to time. Weusethenon-GAAPfinancial measureof AdjustedGross Profit,whichwedefineasGAAPrevenuelessAdjustedCostofRevenue.Weusethe non-GAAP financial measure of Adjusted Gross Margin, whichwedefineas GAAPrevenueless AdjustedCost of Revenuedividedby GAAPrevenue. SimilartoAdjustedEBITDA,webelievethesemeasureshelpidentifyunderlyingtrendsinourbusinessthatcouldotherwisebemaskedbytheeffectofthe expenses we excludein themeasure. Webelievethat thesenon-GAAPfinancial measuresprovideuseful informationabout our financial performance, enhancetheoverall understandingof our past performanceandfutureprospects,andallowforgreatertransparencywithrespecttokeymetricsusedby our management for financial andoperational decision-making. Weare presentingthesenon-GAAPmeasuresto assist investors in seeingourfinancial performancethroughtheeyesof management, andbecausewebelievethatthesemeasuresprovideanadditionaltoolforinvestorstouseincomparing our corefinancial performanceover multiple periodswith other companies in our industry. For a reconciliationofthesenon-GAAPfinancialmeasuresto themost directly comparable GAAPfinancial measure, pleasesee“ReconciliationofGAAPtoNon-GAAPFinancialMeasures”includedasanAppendixto this letter. SnapInc., “Snapchat,” andour other registeredandcommonlawtradenames, trademarks, andservicemarksarethepropertyofSnapInc.or our subsidiaries. SNAP INC. | Q4 2025 | INVESTOR LETTER 11
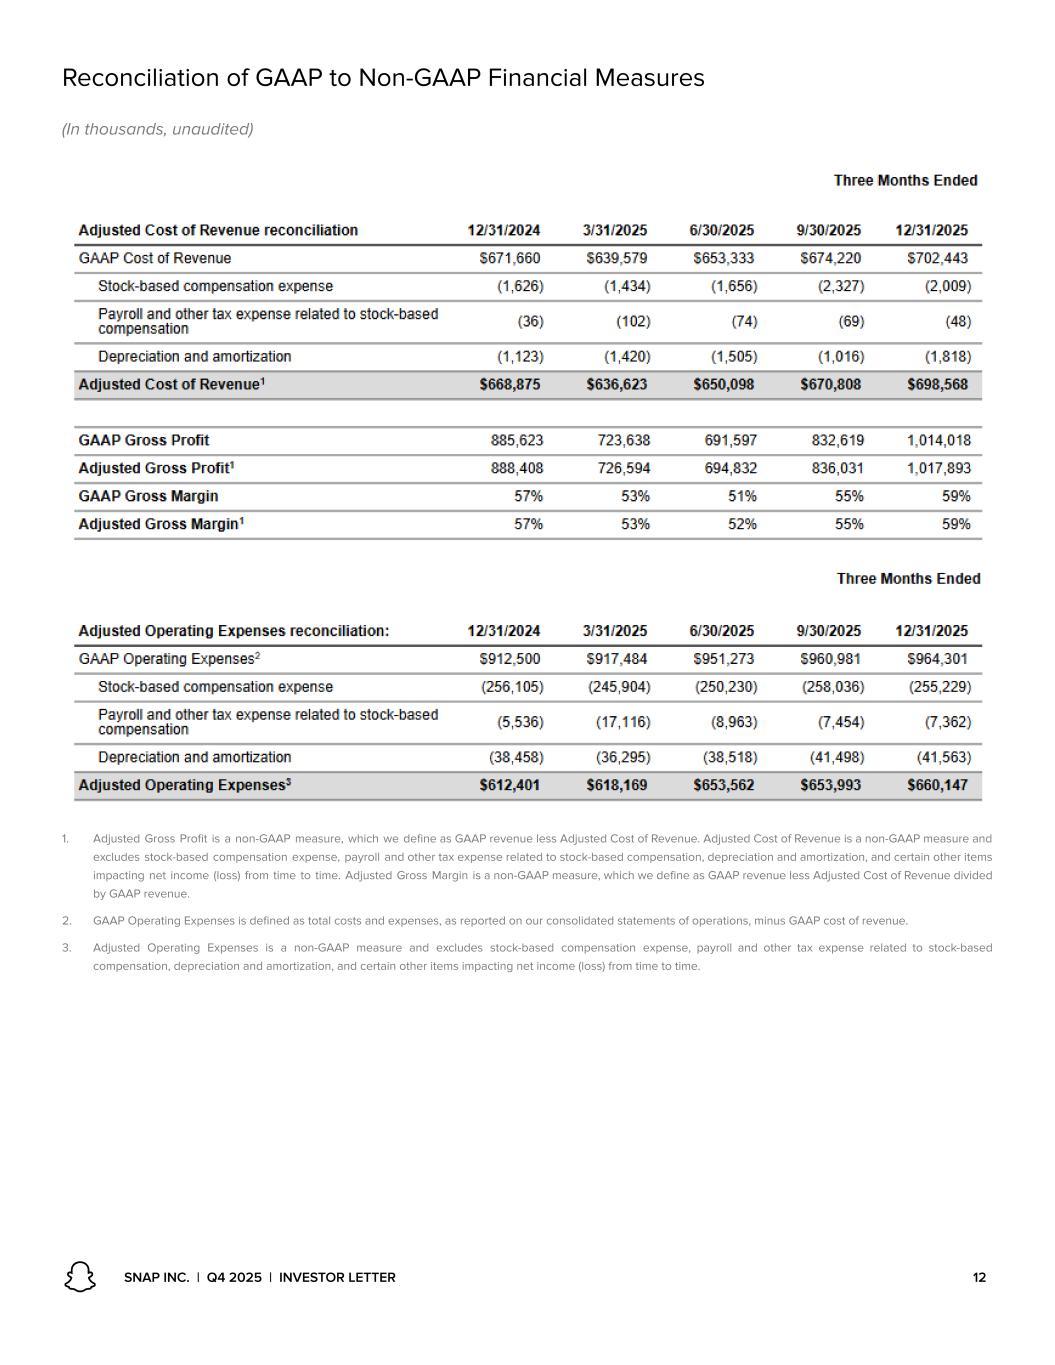
Reconciliation of GAAP to Non-GAAP Financial Measures (In thousands, unaudited) 1. Adjusted Gross Profit is a non-GAAP measure, which we defineasGAAPrevenuelessAdjustedCostofRevenue.AdjustedCostofRevenueisanon-GAAPmeasureand excludes stock-based compensation expense, payroll andothertaxexpenserelatedtostock-basedcompensation,depreciationandamortization,andcertainotheritems impacting net income (loss) from time to time. Adjusted Gross Margin isanon-GAAPmeasure,whichwedefineasGAAPrevenuelessAdjustedCostofRevenuedivided by GAAP revenue. 2. GAAP Operating Expenses is defined as total costs and expenses, as reported on our consolidated statements of operations, minus GAAP cost of revenue. 3. Adjusted Operating Expenses is a non-GAAP measure and excludes stock-based compensation expense, payroll and other tax expense related to stock-based compensation, depreciation and amortization, and certain other items impacting net income (loss) from time to time. SNAP INC. | Q4 2025 | INVESTOR LETTER 12
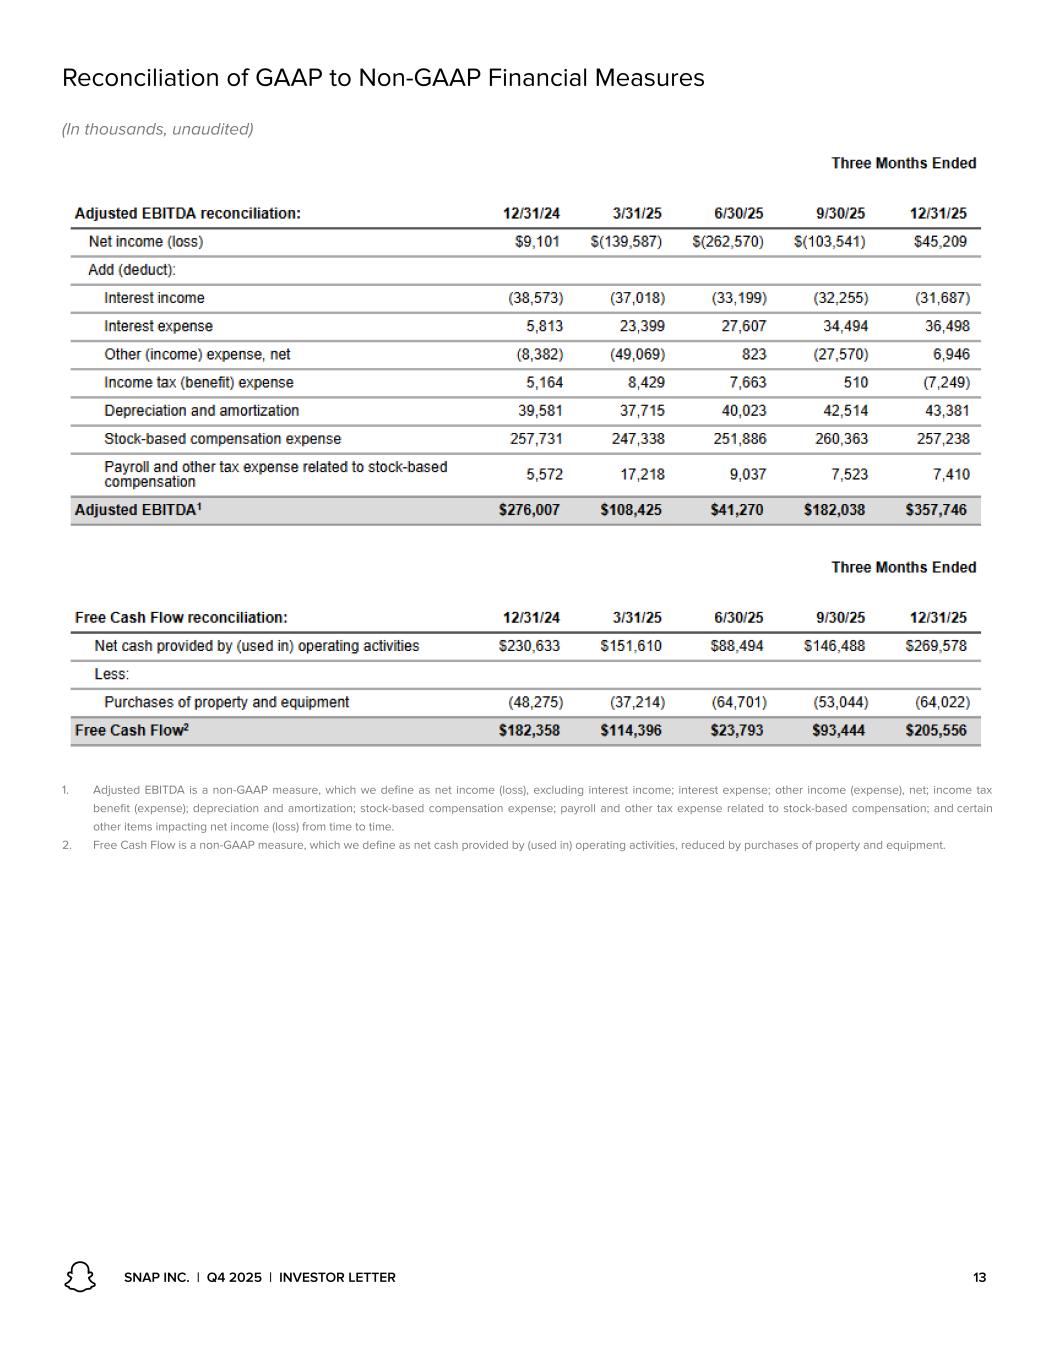
Reconciliation of GAAP to Non-GAAP Financial Measures (In thousands, unaudited) 1. Adjusted EBITDA is a non-GAAP measure, which we define as net income (loss), excluding interest income; interest expense; other income (expense), net; income tax benefit (expense); depreciation and amortization; stock-based compensation expense; payroll and other tax expense related to stock-based compensation; andcertain other items impacting net income (loss) from time to time. 2. Free Cash Flow is a non-GAAP measure, which we define as net cash provided by (used in) operating activities, reduced by purchases of property and equipment. SNAP INC. | Q4 2025 | INVESTOR LETTER 13
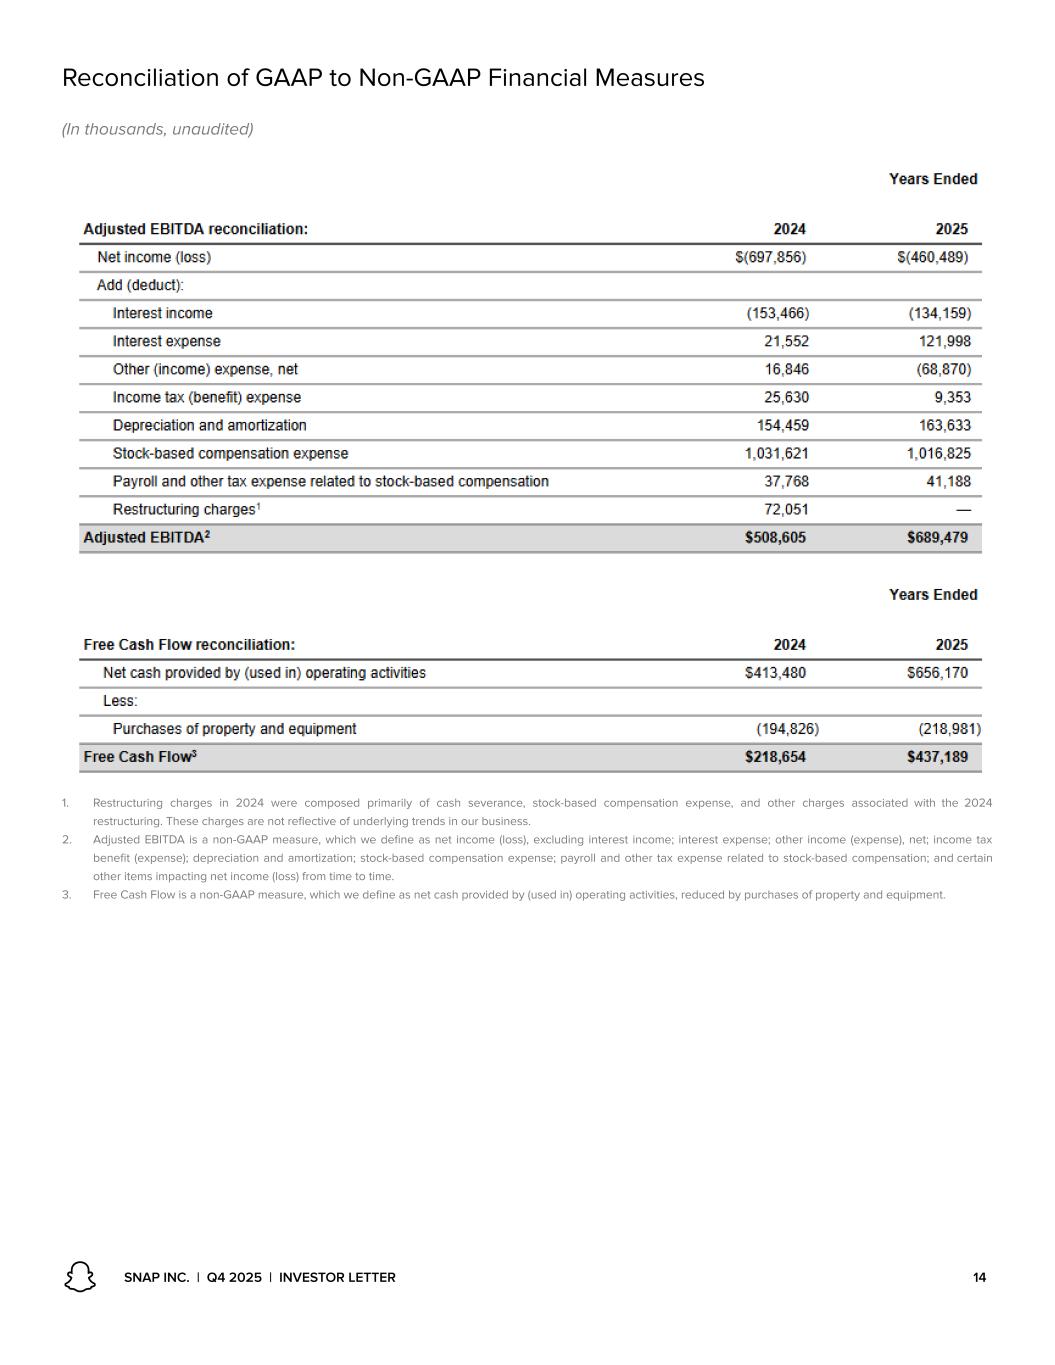
Reconciliation of GAAP to Non-GAAP Financial Measures (In thousands, unaudited) 1. Restructuring charges in 2024 were composed primarily of cash severance, stock-based compensation expense, and other charges associated with the 2024 restructuring. These charges are not reflective of underlying trends in our business. 2. Adjusted EBITDA is a non-GAAP measure, which we define as net income (loss), excluding interest income; interest expense; other income (expense), net; income tax benefit (expense); depreciation and amortization; stock-based compensation expense; payroll and other tax expense related to stock-based compensation; andcertain other items impacting net income (loss) from time to time. 3. Free Cash Flow is a non-GAAP measure, which we define as net cash provided by (used in) operating activities, reduced by purchases of property and equipment. SNAP INC. | Q4 2025 | INVESTOR LETTER 14