
SPNT 8-K
SiriusPoint Ltd (SPNT)
8-K
2021-08-05
For: 2021-07-30
View Original
Added on
April 09, 2026
UNITED STATES
SECURITIES AND EXCHANGE COMMISSION
WASHINGTON, D.C. 20549
FORM 8-K
CURRENT REPORT
Pursuant to Section 13 or 15(d)
of the Securities Exchange Act of 1934
Date of Report (Date of Earliest Event Reported): August 5, 2021 (July 30, 2021 )
(Exact name of registrant as specified in its charter)
| (State or other jurisdiction of incorporation) | (Commission File Number) | (I.R.S. Employer Identification No.) | ||||||||||||
(Address of principal executive offices and Zip Code)
Registrant’s telephone number, including area code: +1 441 542-3300
Not Applicable
(Former name or former address, if changed since last report)
Check the appropriate box below if the Form 8-K filing is intended to simultaneously satisfy the filing obligation of the registrant under any of the following provisions:
| Written communications pursuant to Rule 425 under the Securities Act (17 CFR 230.425) | |||||
| Soliciting material pursuant to Rule 14a-12 under the Exchange Act (17 CFR 240.14a-12) | |||||
| Pre-commencement communications pursuant to Rule 14d-2(b) under the Exchange Act (17 CFR 240.14d-2(b)) | |||||
| Pre-commencement communications pursuant to Rule 13e-4(c) under the Exchange Act (17 CFR 240.13e-4(c)) | |||||
Securities registered pursuant to Section 12(b) of the Act:
| Title of each class | Trading symbol(s) | Name of each exchange on which registered | ||||||
Series B, $0.10 par value, $25.00 liquidation preference per share | ||||||||
Indicate by check mark whether the registrant is an emerging growth company as defined in Rule 405 of the Securities Act of 1933 (17 CFR 230.405) or Rule 12b-2 of the Exchange Act of 1934 (17 CFR 240.12b-2).
Emerging growth company ☐
If an emerging growth company, indicate by check mark if the registrant has elected not to use the extended transition period for complying with any new or revised financial accounting standards provided pursuant to Section 13(a) of the Exchange Act.
☐
| Item 1.01 | Material Definitive Agreement. | ||||
On July 30, 2021, certain property and casualty insurance subsidiaries of SiriusPoint Ltd., Sirius America Insurance Company and SiriusPoint Bermuda Insurance Company Ltd. (together, the “SiriusPoint Cedents”), entered into that certain Master Agreement (the “Master Agreement”), dated as of July 30, 2021, made by and among the SiriusPoint Cedants and Pallas Reinsurance Company Ltd. (“Pallas Re”), a subsidiary in the Compre Group.
Pursuant to the Master Agreement, at the transaction closing, (a) the SiriusPoint Cedents (and/or an affiliate, as the case may be) will enter into a Loss Portfolio Transfer Reinsurance Agreement (the “LPT Agreement”) with Pallas Re, pursuant to which the SiriusPoint Cedents will cede and Pallas Re will assume 100% of the liability with respect to certain long-tail insurance and reinsurance exposures of the SiriusPoint Cedents including asbestos, environmental and workers’ compensation liabilities (the “Subject Business”), valued at $403 million at the time of signing up to an aggregate limit of $645 million over the duration of the contract, and includes an additional release of $14 million of unallocated loss adjustment reserves associated with this transaction; (b) SiriusPoint will pay Pallas Re a reinsurance premium on the Subject Business of approximately $430 million less adjustments to the reinsurance premium up to the closing date; (c) the SiriusPoint Cedents and Pallas Re will enter into a Services Agreement; and (d) the SiriusPoint Cedents, Pallas Re and a trustee or custodian bank, as applicable, will enter into two Trust Agreements and a Security and Control Agreement. The initial deposit in the trust accounts will be the initial loss reserves paid by the SiriusPoint Cedents on the Subject Business from December 31, 2020 through the closing date plus an over collateralization amount; thereafter, Pallas Re will be obligated to maintain certain permitted types of eligible assets in the trust accounts of the SiriusPoint Cedents’ net reserves on the Subject Business for the term of the LPT Agreement.
Pursuant to the LPT Agreement and the Security and Control Agreement, a first priority security interest will be granted in favor of the SiriusPoint Cedents in the Pallas Re administrative account concerning the Subject Business and all assets credited thereto. Pursuant to the LPT Agreement and the Services Agreement, Pallas Re will assume, as soon as practicable after the closing, authority and responsibility for administrative services, including claims handling, for the Subject Business.
The Master Agreement and LPT Agreement include customary representations and warranties, indemnification obligations, covenants and termination rights of the parties. The transaction is anticipated to close during the third quarter of 2021, subject to regulatory approvals and other customary closing conditions. A copy of the press release is attached hereto as Exhibit 99.1.
| Item 2.02 | Results of Operations and Financial Condition. | ||||
On August 5, 2021, SiriusPoint Ltd. issued a press release reporting its financial results for the second quarter ended June 30, 2021 and announcing the availability of its second quarter financial supplement. A copy of the press release and the financial supplement are attached hereto as Exhibit 99.2 and Exhibit 99.3, respectively.
The information contained in this Item 2.02 of this Current Report on Form 8-K, including Exhibit 99.2 and Exhibit 99.3 attached hereto, are being furnished pursuant to this Item 2.02. This information shall not be deemed to be “filed” for purposes of Section 18 of the Securities Exchange Act of 1934, as amended (the "Exchange Act"), or otherwise subject to the liabilities of that Section, or incorporated by reference into any filing under the Securities Act of 1933, as amended, or the Exchange Act, except as shall be expressly set forth by specific reference in such filing.
| Item 7.01 | Regulation FD Disclosure. | ||||
On August 5, 2021, SiriusPoint Ltd. made available to investors the slide presentation attached hereto as Exhibit 99.4, which may be used from time to time by SiriusPoint Ltd. in presentations to investors. The information hereunder is not deemed to be “filed” for purposes of Section 18 of the Securities Exchange Act of 1934, is not otherwise subject to the liabilities of that section and is not incorporated by reference into any filing under the Securities Act of 1933 or the Securities Exchange Act of 1934, except as shall be expressly set forth by specific reference in such a filing.
| Item 9.01 | Financial Statements and Exhibits. | ||||
(d) Exhibits
| Exhibit No. | Description | |||||||
| 99.1 | ||||||||
| 99.2 | ||||||||
| 99.3 | ||||||||
| 99.4 | ||||||||
| 104 | Cover Page Interactive Data File (embedded within the Inline XBRL document) | |||||||
SIGNATURE
Pursuant to the requirements of the Securities Exchange Act of 1934, the registrant has duly caused this report to be signed on its behalf by the undersigned hereunto duly authorized.
| Date: August 5, 2021 | /s/ David W. Junius | ||||||||||
| Name: | David W. Junius | ||||||||||
| Title: | Chief Financial Officer | ||||||||||

Press release
5 August 2021
Compre and SiriusPoint announce strategic deal
Compre, the international specialist legacy group, and SiriusPoint Ltd. (NYSE: SPNT) (“SiriusPoint”) today announce that they have reached an agreement for Compre to acquire a US$417 million portfolio of legacy liabilities, subject to regulatory approval.
The transaction, structured as a loss portfolio transfer, will be underwritten by Compre’s class 3A Bermudian reinsurer, Pallas Reinsurance Company Ltd. (“Pallas Re”) and the portfolio comprises asbestos, environmental and workers’ compensation liabilities.
Compre CEO Will Bridger said: “I am delighted to announce this strategic milestone for Compre and Pallas Re. This transaction will grow our balance sheet significantly and will accelerate our growth strategy in North America. This is a significant step in our ambitious growth plans and further demonstrates our capabilities in executing large transactions. We value our client relationship with SiriusPoint and have greatly enjoyed working with them on this transaction.”
“SiriusPoint is transferring its runoff business to legacy specialists, allowing us to redeploy capital internally to areas of strategic growth,” said Sid Sankaran, Chairman and Chief Executive Officer of SiriusPoint. “Compre is a practitioner we have known and respected for some time. With their new ownership and equity they are in an ideal position to benefit from our runoff portfolio. I am very pleased our transaction creates opportunities for both of our businesses.”
Compre was advised by New York law firm Gerber Ciano Kelly Brady and PwC’s Actuarial team. SiriusPoint was advised by international law firm Clyde & Co.
- Ends -
For further information please contact:
Compre
David Haggie / Richard Adams / Shipra Khanna, Haggie Partners
+44 20 7562 4444
SiriusPoint
Investor Relations
Clare Kerrigan, SiriusPoint
[email protected]
[email protected]
+44 7970695959
Media
Sarah Hills, Rein4ce
+44 7718882011
About Compre:
Compre is a leading legacy specialist with over 30 years of experience in the acquisition and management of discontinued and legacy non-life insurance and reinsurance business. Compre has experience of acquiring most classes of direct and reinsurance business, including general liability, marine and motor liability, and US APH. Compre has operations in Bermuda, Finland, Germany, Malta, Switzerland, the UK and at Lloyd’s.
www.compre-group.com
About SiriusPoint
SiriusPoint Ltd. (SiriusPoint) is a top 20 global insurer and reinsurer providing solutions to clients and brokers in almost 150 countries. Bermuda-headquartered with offices around the world, we are listed on the New York Stock Exchange (SPNT). We write a global portfolio of Accident and Health, Specialty, Property and Runoff, combining data and creative thinking to underwrite risks with skill and discipline. With over $3 billion total capital, SiriusPoint’s operating companies have a financial strength rating of A- (Excellent) from AM Best, S&P and Fitch. For more information, please visit www.siriuspt.com.
SiriusPoint Forward Looking Statement
We make statements in this report that are forward-looking statements within the meaning of the U.S. federal securities laws. We intend these forward-looking statements to be covered by the safe harbor provisions for forward-looking statements in the U.S. Federal securities laws. These statements involve risks and uncertainties that could cause actual results to differ materially from those contained in forward-looking statements made on behalf of SiriusPoint. These risks and uncertainties include the impact of general economic conditions and conditions affecting the insurance and reinsurance industry, the adequacy of our reserves, fluctuation in the results of operations; pandemic or other catastrophic event, such as the ongoing COVID-19 outbreak; the costs, expense and difficulties of the integration of the operations of Third Point Reinsurance Ltd. and Sirius International Insurance Group, Ltd.; our ability to assess underwriting risk, trends in rates for property and casualty insurance and reinsurance, competition, investment market and investment income fluctuations, trends in insured and paid losses, regulatory and legal uncertainties and other risk factors described in SiriusPoint’s Quarterly Reports on Form 10-Q for the periods . Except as required by applicable law or regulation, we disclaim any obligation to publicly update or revise any forward-looking statement to reflect changes in underlying assumptions or factors, or new information, data or methods, future events or other circumstances after the date of this report.
SiriusPoint Announces Second Quarter 2021 Earnings Results
Net Income Available to Common Shareholders of $64.5 million, or $0.37 per Diluted Common Share
Tangible Diluted Book Value per Share of $14.30 as of June 30, 2021
Combined Ratio of 92.8%
Annualized Return on Average Common Equity of 10.6%
HAMILTON, Bermuda, August 5, 2021 - SiriusPoint Ltd. (“SiriusPoint” or the “Company”) (NYSE:SPNT) today announced results for its second quarter ended June 30, 2021.
Second Quarter 2021 Highlights
•Net income of $64.5 million, or $0.37 per diluted common share
•Tangible diluted book value per share increased $0.33, or 2.4%, from the first quarter of 2021 to $14.30
•Combined ratio of 92.8% and net underwriting income of $33.3 million
•Catastrophe losses were $12.7 million or 2.7 percentage points on the Company’s combined ratio
•Annualized return on average common equity of 10.6%
•Net investment income of $77.4 million
•$417 million loss portfolio transfer transaction with Compre
Sid Sankaran, Chairman and Chief Executive Officer, SiriusPoint, said: “I am very pleased with our team’s execution through SiriusPoint's first full quarter. Underwriting this quarter has been keenly focused on remediation. We have made progress on re-balancing the portfolio between reinsurance and insurance to stabilize our book, manage volatility and deliver underwriting profit, over time. We are off to a great start and have established strong momentum that is reflected in the number of deals closed in our first four months of operations. We have attracted experienced and innovative partners and launched businesses including insurtech Joyn Insurance, with Seraina Macia, Banyan Risk, with Tim Usher-Jones, and Hestia Capital with Jean Francois Bahier and Peter Norris. Our existing partnerships with MGUs including Pie, and Arcadian Risk led by industry veteran John Boylan, also continue to add value and offer long term opportunity.”
SiriusPoint also announced today a loss portfolio transfer transaction with Compre, a legacy runoff specialist. The loss portfolio transfer, which is subject to regulatory approval, covers $417 million of loss reserves subject to or associated with the transaction, including much of the legacy Sirius Group Runoff business, including Asbestos and Environmental, for a premium of $430 million.
Mr. Sankaran commented: “Our transaction with Compre underscores the ongoing transformation of SiriusPoint, our focus on optimizing capital allocation and rebalancing towards insurance and higher margin and growth lines, and provides further clarity on SiriusPoint's reserve position.
“With SiriusPoint, we are embarking on a journey to create a company with a sustainable long-term franchise and a focus on book value creation” Mr. Sankaran continued. “Our approach to capital allocation and our ability to be nimble has allowed us to take advantage of current market conditions, but our strategy does not rely on a hard market. We are building a company with a strong entrepreneurial culture under the premise that soft markets are the norm, while planning around long term macro trends that require disciplined investments and a growth mindset.”
Key Financial Metrics
The following table shows certain key financial metrics for the three and six months ended June 30, 2021 and 2020:
| Three months ended | Six months ended | ||||||||||||||||||||||
| June 30, 2021 | June 30, 2020 | June 30, 2021 | June 30, 2020 | ||||||||||||||||||||
| ($ in millions, except for per share data and ratios) | |||||||||||||||||||||||
| Annualized return on average common shareholders’ equity attributable to SiriusPoint common shareholders | 10.6 | % | 38.3 | % | 19.3 | % | (8.6) | % | |||||||||||||||
Net underwriting income (1) | $ | 33.3 | $ | 0.2 | $ | 42.0 | $ | 2.3 | |||||||||||||||
Combined ratio (1) | 92.8 | % | 99.8 | % | 94.2 | % | 99.2 | % | |||||||||||||||
Basic book value per share (2) (4) | $ | 15.59 | $ | 16.88 | $ | 15.59 | $ | 16.88 | |||||||||||||||
Tangible basic book value per share (2) (4) | $ | 14.48 | $ | 16.88 | $ | 14.48 | $ | 16.88 | |||||||||||||||
Diluted book value per share (2) (3) (4) | $ | 15.37 | $ | 16.71 | $ | 15.37 | $ | 16.71 | |||||||||||||||
Tangible diluted book value per share (2) (4) | $ | 14.30 | $ | 16.71 | $ | 14.30 | $ | 16.71 | |||||||||||||||
(1)See the accompanying Segment Reporting for a calculation of net underwriting income and combined ratio.
(2)Basic book value per share, tangible basic book value per share, diluted book value per share and tangible diluted book value per share are non-GAAP financial measures.
(3)In the first quarter of 2021, we changed the method for calculating the dilutive effect of restricted shares, restricted share units and options to calculate the dilutive impact in a manner consistent with how dilution is calculated using the treasury stock method for earnings per share. See the accompanying reconciliations in “Non-GAAP Measures and Reconciliations & Key Performance Indicators”.
(4)Prior year comparatives represent amounts as of December 31, 2020.
Second Quarter 2021 Summary
Underwriting Results
The acquisition of Sirius Group, which occurred on February 26, 2021, has created a highly diversified portfolio with expanded underwriting capabilities, geographic footprint and product offerings. Effective January 1, 2021, the Company reports four operating segments: Accident & Health (“A&H”), Specialty, Property and Runoff & Other.
In addition, effective January 1, 2021, the Company changed its accounting policy for assumed written premium recognition. Previously, the Company estimated ultimate premium written for the entire contract period and recorded this estimate at inception of the contract. The Company changed its accounting policy to recognize premiums written ratably over the term of the related policy or reinsurance treaty. The change in accounting policy had no impact on the previously reported net income (loss) or shareholders’ equity attributable to SiriusPoint common shareholders. Prior period segment results have been adjusted to conform to the current period presentation.
Net premiums earned increased by $325.5 million, or 231.2%, to $466.3 million for the three months ended June 30, 2021 from $140.8 million for the three months ended June 30, 2020, primarily driven by an increase in net premiums earned of $359.9 million as a result of new premiums from the legacy Sirius Group companies.
Net premiums earned increased by $435.2 million, or 151.6%, to $722.3 million for the six months ended June 30, 2021 from $287.1 million for the six months ended June 30, 2020, primarily driven by an increase in net premiums earned of $475.8 million as a result of new premiums from the legacy Sirius Group companies from the date of acquisition.
We generated net underwriting income of $33.3 million and a combined ratio of 92.8% for the three months ended June 30, 2021, compared to net underwriting income of $0.2 million and a combined ratio of 99.8% for the three months ended June 30, 2020. The improvement in net underwriting results was primarily driven by net underwriting income of $25.8 million from the legacy Sirius Group companies, mainly in the Property and A&H segments.
We generated net underwriting income of $42.0 million and a combined ratio of 94.2% for the six months ended June 30, 2021, compared to net underwriting income of $2.3 million and a combined ratio of 99.2% for the six months ended June 30, 2020. The improvement in net underwriting results was primarily driven by net underwriting income of $33.9 million from the legacy Sirius Group companies from the date of acquisition, mainly in the Property and A&H segments.
Catastrophe losses, net of reinsurance and reinstatement premiums, for the three and six months ended June 30, 2021 were $12.7 million and $18.4 million, respectively, or 2.7 and 2.5 percentage points, respectively, on the combined ratio, from European windstorms in the second quarter and winter storm Uri in the first quarter compared to no catastrophe losses recorded for the three and six months ended June 30, 2020.
A&H Segment
Gross premiums written in the A&H segment were $90.6 million for the three months ended June 30, 2021, an increase of $89.3 million compared to the three months ended June 30, 2020, primarily driven by an increase in premiums of $90.6 million as a result of new premiums from the legacy Sirius Group companies.
For the three months ended June 30, 2021, the A&H segment generated net underwriting income of $3.1 million and a combined ratio of 97.0%, compared to a net underwriting loss of $1.7 million for the three months ended June 30, 2020.
Specialty Segment
Gross premiums written in the Specialty segment were $289.3 million for the three months ended June 30, 2021, an increase of $215.5 million, or 292.0%, compared to the three months ended June 30, 2020, primarily driven by an increase in premiums of $150.6 million as a result of new premiums from the legacy Sirius Group companies, and due to new casualty premium of $59.8 million in the period written by our Bermuda incorporated MGU, Arcadian Risk, in which we invest capital and expertise.
The Specialty segment generated a net underwriting loss of $0.1 million and a combined ratio of 100.0% for the three months ended June 30, 2021, compared to a net underwriting loss of $7.9 million and a combined ratio of 108.0% for the three months ended June 30, 2020. The change in underwriting results for the three months ended June 30, 2021, compared to the three months ended June 30, 2020, was primarily driven by lower COVID-19 losses.
Property Segment
Gross premiums written in the Property segment were $213.2 million for the three months ended June 30, 2021, an increase of $140.6 million, or 193.7%, compared to the three months ended June 30, 2020, primarily driven by an increase in premiums of $193.1 million as a result of new premiums from the legacy Sirius Group companies.
The Property segment generated net underwriting income of $30.2 million and a combined ratio of 80.4% for the three months ended June 30, 2021, compared to net underwriting income of $10.4 million and a combined ratio of 74.6% for the three months ended June 30, 2020. The change in underwriting results for the three months ended June 30, 2021, compared to the three months ended June 30, 2020, was primarily driven by net underwriting income of $25.0 million as a result of the legacy Sirius Group companies. Catastrophe losses, net of reinsurance and reinstatement premiums, for the three months ended June 30, 2021 were $12.7 million, primarily from European Windstorms compared to no catastrophe losses recorded for the three months ended June 30, 2020. Net favorable prior year loss reserve development was $8.6 million for the three months ended June 30, 2021 compared to minimal prior year loss reserve development for the three months ended June 30, 2020.
Investments
Net investment income was $77.4 million for the three months ended June 30, 2021, compared to net investment income of $137.2 million for the three months ended June 30, 2020.
Net investment income for the three months ended June 30, 2021 was primarily attributable to net investment income of $44.7 million from our investment in the TP Enhanced Fund, corresponding to a 3.7% return. The return was primarily attributable to long event/fundamental equities, particularly in the enterprise technology and healthcare sectors, as well as corporate and structured credit. In addition, the Company recognized net investment income of $35.5 million on fixed maturity, short term, cash equivalents and alternative investments. This was mainly attributable to unrealized gains of $25.5 million resulting from both market appreciation and favorable foreign exchange developments.
Net investment income for the three months ended June 30, 2020 was primarily attributable to net investment income of $98.6 million from our investment in the TP Enhanced Fund, as well as investment income from our opportunistic credit investments made at the end of the first quarter of 2020 to take advantage of dislocations in the credit market brought on by the COVID-19 pandemic.
Conference Call Details
The Company will hold a conference call to discuss its second quarter 2021 results at 8:30 a.m. Eastern Time on August 6, 2021. The call will be webcast live over the Internet from the Company’s website at www.siriuspt.com under the “Investor Relations” section. Participants should follow the instructions provided on the website to download and install any necessary audio applications. The conference call will also be available by dialing 1-877-300-8521 (domestic) or 1-412-317-6026 (international). Participants should ask for the SiriusPoint Ltd. second quarter 2021 earnings call.
A replay of the live conference call will be available approximately two hours after the call. The replay will be available on the Company’s website at www.siriuspt.com under the “Investor Relations” section.
Safe Harbor Statement Regarding Forward-Looking Statements
This press release includes “forward-looking statements” within the meaning of the Private Securities Litigation Reform Act of 1995, including statements regarding optimizing capital allocation, rebalancing towards insurance, creating a sustainable long-term franchise and book value. Forward-looking statements are subject to known and unknown risks and uncertainties, many of which may be beyond the Company’s control. The Company cautions you that the forward-looking information presented in this press release is not a guarantee of future events, and that actual events may differ materially from those made in or suggested by the forward-looking information contained in this press release. In addition, forward-looking statements generally can be identified by the use of forward-looking terminology such as “may,” “plan,” “seek,” “comfortable with,” “will,” “expect,” “intend,” “estimate,” “anticipate,” “believe” or “continue” or the negative thereof or variations thereon or similar terminology. Actual events, results and outcomes may differ materially from the Company’s expectations due to a variety of known and unknown risks, uncertainties and other factors. Among the risks and uncertainties that could cause actual results to differ from those described in the forward-looking statements are the following: the costs, expense and difficulties of the integration of the operations of Sirius Group; the impact of the novel coronavirus (COVID-19) pandemic or other unpredictable catastrophic events; fluctuations in our results of operations; a downgrade or withdrawal of our financial ratings; inadequacy of loss and loss adjustment expenses reserves; the effects of global climate change; periods characterized by excess underwriting capacity and unfavorable premium rates; reduced returns or losses in SiriusPoint’s investment portfolio; adverse changes in interest rates, foreign currency exchange rates, equity markets, debt markets or market volatility; legal restrictions on certain of SiriusPoint’s insurance and reinsurance subsidiaries’ ability to pay dividends and other distributions to SiriusPoint; SiriusPoint’s significant deferred tax assets, which could become devalued if either SiriusPoint does not generate sufficient future taxable income or applicable corporate tax rates are reduced; the lack of availability of capital; future strategic transactions such as acquisitions, dispositions, mergers, investments or joint ventures; technology breaches; our concentrated exposure in Third Point Enhanced LP (the “TP Enhanced Fund”) whose investment strategy may bear substantial investment risks; conflicts of interest among various members of TP Enhanced Fund, Third Point LLC and SiriusPoint; and other risks and uncertainties listed in the Company's Quarterly Report on Form 10-Q for the quarters ended March 31, 2021 and June 30, 2021, and any subsequent reports filed with the Securities and Exchange Commission. All forward-looking statements speak only as of the date made and the Company undertakes no obligation to update or revise publicly any forward-looking statements, whether as a result of new information, future events or otherwise.
Non-GAAP Financial Measures and Other Financial Metrics
In presenting SiriusPoint’s results, management has included financial measures that are not calculated under standards or rules that comprise accounting principles generally accepted in the United States (“GAAP”). SiriusPoint’s management uses this information in its internal analysis of results and believes that this information may be informative to investors in gauging the quality of SiriusPoint’s financial performance, identifying trends in our results and providing meaningful period-to-period comparisons. Book value per share metrics are non-GAAP financial measures. We believe that long-term growth in book value per share is an important measure of our financial performance because it allows our management and investors to track over time the value created by the retention of earnings. In addition, we believe this metric is used by investors because it provides a basis for comparison with other companies in our industry that also report a similar measure. Reconciliations of such measures to the most comparable GAAP figures are included in the attached financial information in accordance with Regulation G.
About the Company
SiriusPoint is a top 20 global insurer and reinsurer providing solutions to clients and brokers in almost 150 countries. Bermuda-headquartered with offices around the world, we are listed on the New York Stock Exchange (SPNT). We write a global portfolio of Accident & Health, Specialty, Property and Runoff & Other business, combining data and creative thinking to underwrite risks with skill and discipline. With over $3 billion total capital as of June 30, 2021, SiriusPoint’s operating companies have a financial strength rating of A- (Excellent) from AM Best, S&P and Fitch. For more information please visit www.siriuspt.com.
Contacts
Investor Relations
Clare Kerrigan - Corporate Communications and Investor Relations
+1 441 542-3333
SIRIUSPOINT LTD.
CONDENSED CONSOLIDATED BALANCE SHEETS (UNAUDITED)
As of June 30, 2021 and December 31, 2020
(expressed in millions of U.S. dollars, except per share and share amounts)
| June 30, 2021 | December 31, 2020 | ||||||||||
| Assets | |||||||||||
| Investments in related party investment funds, at fair value (cost - $891.9; 2020 - $891.9) | $ | 1,254.4 | $ | 1,055.6 | |||||||
| Debt securities, trading, at fair value (cost - $2,006.3; 2020 - $91.4) | 2,009.3 | 101.3 | |||||||||
| Short-term investments, at fair value (cost - $767.7; 2020 - N/A) | 766.7 | — | |||||||||
| Equity securities, trading, at fair value (cost - $4.9; 2020 - N/A) | 5.0 | — | |||||||||
| Other long-term investments, at fair value (cost - $414.9; 2020 - $4.0) | 463.7 | 4.0 | |||||||||
| Total investments | 4,499.1 | 1,160.9 | |||||||||
| Cash and cash equivalents | 1,032.6 | 526.0 | |||||||||
| Restricted cash and cash equivalents | 1,554.4 | 1,187.9 | |||||||||
| Due from brokers | 55.7 | 94.9 | |||||||||
| Interest and dividends receivable | 11.1 | 0.9 | |||||||||
| Insurance and reinsurance balances receivable, net | 1,515.3 | 441.9 | |||||||||
| Deferred acquisition costs, net and value of business acquired | 212.1 | 68.6 | |||||||||
| Unearned premiums ceded | 247.0 | 20.5 | |||||||||
| Loss and loss adjustment expenses recoverable, net | 516.6 | 14.4 | |||||||||
| Deferred tax asset | 216.3 | 0.4 | |||||||||
| Intangible assets | 176.7 | — | |||||||||
| Other assets | 153.7 | 18.8 | |||||||||
| Total assets | $ | 10,190.6 | $ | 3,535.2 | |||||||
| Liabilities | |||||||||||
| Loss and loss adjustment expense reserves | $ | 4,232.3 | $ | 1,310.1 | |||||||
| Unearned premium reserves | 1,238.1 | 284.8 | |||||||||
| Reinsurance balances payable | 526.3 | 78.1 | |||||||||
| Deposit liabilities | 148.6 | 153.0 | |||||||||
| Securities sold, not yet purchased, at fair value | 10.0 | 12.0 | |||||||||
| Due to brokers | 38.9 | — | |||||||||
| Accounts payable, accrued expenses and other liabilities | 164.1 | 17.6 | |||||||||
| Deferred tax liability | 190.2 | — | |||||||||
| Liability-classified capital instruments | 122.2 | — | |||||||||
| Debt | 836.5 | 114.3 | |||||||||
| Total liabilities | 7,507.2 | 1,969.9 | |||||||||
| Commitments and contingent liabilities | |||||||||||
| Shareholders’ equity | |||||||||||
| Series B preference shares (par value $0.10; authorized and issued: 8,000,000) | 200.0 | — | |||||||||
| Common shares (issued and outstanding: 161,945,750; 2020 - 95,582,733) | 16.2 | 9.6 | |||||||||
| Additional paid-in capital | 1,646.6 | 933.9 | |||||||||
| Retained earnings | 815.8 | 620.4 | |||||||||
| Accumulated other comprehensive income | 1.5 | — | |||||||||
| Shareholders’ equity attributable to SiriusPoint shareholders | 2,680.1 | 1,563.9 | |||||||||
| Noncontrolling interests | 3.3 | 1.4 | |||||||||
| Total shareholders’ equity | 2,683.4 | 1,565.3 | |||||||||
| Total liabilities, noncontrolling interests and shareholders’ equity | $ | 10,190.6 | $ | 3,535.2 | |||||||
SIRIUSPOINT LTD.
CONDENSED CONSOLIDATED STATEMENTS OF INCOME (LOSS) (UNAUDITED)
For the three and six months ended June 30, 2021 and 2020
(expressed in millions of U.S. dollars, except per share and share amounts)
| Three months ended | Six months ended | ||||||||||||||||||||||
| June 30, 2021 | June 30, 2020 | June 30, 2021 | June 30, 2020 | ||||||||||||||||||||
| Revenues | |||||||||||||||||||||||
| Net premiums earned | $ | 466.3 | $ | 140.8 | $ | 722.3 | $ | 287.1 | |||||||||||||||
| Net realized and unrealized investment gains | 23.9 | 36.0 | 55.4 | 47.6 | |||||||||||||||||||
| Net investment income (loss) from investments in related party investment funds | 45.6 | 98.6 | 198.8 | (102.2) | |||||||||||||||||||
| Other net investment income | 7.9 | 2.6 | 9.7 | 6.8 | |||||||||||||||||||
| Net investment income (loss) | 77.4 | 137.2 | 263.9 | (47.8) | |||||||||||||||||||
| Other revenues | 17.8 | — | 26.4 | — | |||||||||||||||||||
| Total revenues | 561.5 | 278.0 | 1,012.6 | 239.3 | |||||||||||||||||||
| Expenses | |||||||||||||||||||||||
| Loss and loss adjustment expenses incurred, net | 255.1 | 89.1 | 403.2 | 176.9 | |||||||||||||||||||
| Acquisition costs, net | 105.6 | 43.7 | 174.6 | 92.9 | |||||||||||||||||||
| Other underwriting expenses | 72.3 | 7.8 | 102.5 | 15.0 | |||||||||||||||||||
| Net corporate and other expenses | 25.7 | 8.9 | 94.0 | 15.3 | |||||||||||||||||||
| Intangible asset amortization | 1.3 | — | 2.1 | — | |||||||||||||||||||
| Interest expense | 9.8 | 2.0 | 14.7 | 4.1 | |||||||||||||||||||
| Foreign exchange (gains) losses | 12.0 | (0.8) | (0.4) | (9.0) | |||||||||||||||||||
| Total expenses | 481.8 | 150.7 | 790.7 | 295.2 | |||||||||||||||||||
| Income (loss) before income tax expense | 79.7 | 127.3 | 221.9 | (55.9) | |||||||||||||||||||
| Income tax expense | (9.6) | (3.3) | (19.4) | (3.7) | |||||||||||||||||||
| Net income (loss) | 70.1 | 124.0 | 202.5 | (59.6) | |||||||||||||||||||
| Net income attributable to noncontrolling interests | (1.6) | — | (1.6) | — | |||||||||||||||||||
| Net income (loss) available to SiriusPoint | 68.5 | 124.0 | 200.9 | (59.6) | |||||||||||||||||||
| Dividends on Series B preference shares | (4.0) | — | (5.5) | — | |||||||||||||||||||
| Net income (loss) available to SiriusPoint common shareholders | $ | 64.5 | $ | 124.0 | $ | 195.4 | $ | (59.6) | |||||||||||||||
| Earnings (loss) per share available to SiriusPoint common shareholders | |||||||||||||||||||||||
| Basic earnings (loss) per share available to SiriusPoint common shareholders | $ | 0.37 | $ | 1.33 | $ | 1.32 | $ | (0.65) | |||||||||||||||
| Diluted earnings (loss) per share available to SiriusPoint common shareholders | $ | 0.37 | $ | 1.33 | $ | 1.30 | $ | (0.65) | |||||||||||||||
| Weighted average number of common shares used in the determination of earnings (loss) per share | |||||||||||||||||||||||
| Basic | 158,832,629 | 92,593,599 | 137,912,915 | 92,392,718 | |||||||||||||||||||
| Diluted | 160,894,216 | 92,738,293 | 139,561,196 | 92,392,718 | |||||||||||||||||||
SIRIUSPOINT LTD.
SEGMENT REPORTING
| Three months ended June 30, 2021 | |||||||||||||||||||||||||||||
| A&H | Specialty | Property | Runoff & Other | Total | |||||||||||||||||||||||||
Gross premiums written (1) | $ | 90.6 | $ | 289.3 | $ | 213.2 | $ | (30.4) | $ | 562.7 | |||||||||||||||||||
Net premiums written (1) | 75.8 | 241.1 | 173.3 | (31.2) | 459.0 | ||||||||||||||||||||||||
Net premiums earned (1) | 103.7 | 231.1 | 154.4 | (22.9) | 466.3 | ||||||||||||||||||||||||
Loss and loss adjustment expenses incurred, net (2) | 52.1 | 151.2 | 74.3 | (22.5) | 255.1 | ||||||||||||||||||||||||
| Acquisition costs, net | 19.8 | 60.8 | 27.6 | (2.6) | 105.6 | ||||||||||||||||||||||||
Other underwriting expenses (2) | 28.7 | 19.2 | 22.3 | 2.1 | 72.3 | ||||||||||||||||||||||||
| Net underwriting income (loss) | $ | 3.1 | $ | (0.1) | $ | 30.2 | $ | 0.1 | 33.3 | ||||||||||||||||||||
| Other revenues | 17.8 | ||||||||||||||||||||||||||||
| Net investment income | 77.4 | ||||||||||||||||||||||||||||
| Net corporate and other expenses | (25.7) | ||||||||||||||||||||||||||||
| Intangible asset amortization | (1.3) | ||||||||||||||||||||||||||||
| Interest expense | (9.8) | ||||||||||||||||||||||||||||
| Foreign exchange losses | (12.0) | ||||||||||||||||||||||||||||
| Income before income tax expense | $ | 79.7 | |||||||||||||||||||||||||||
Underwriting Ratios: (3) | |||||||||||||||||||||||||||||
| Loss ratio | 50.2 | % | 65.4 | % | 48.1 | % | NM | 54.7 | % | ||||||||||||||||||||
| Acquisition cost ratio | 19.1 | % | 26.3 | % | 17.9 | % | NM | 22.6 | % | ||||||||||||||||||||
| Other underwriting expenses ratio | 27.7 | % | 8.3 | % | 14.4 | % | NM | 15.5 | % | ||||||||||||||||||||
Combined ratio (4) | 97.0 | % | 100.0 | % | 80.4 | % | NM | 92.8 | % | ||||||||||||||||||||
| Three months ended June 30, 2020 | |||||||||||||||||||||||||||||
| A&H | Specialty | Property | Runoff & Other | Total | |||||||||||||||||||||||||
Gross premiums written (1) | $ | 1.3 | $ | 73.8 | $ | 72.6 | $ | — | $ | 147.7 | |||||||||||||||||||
Net premiums written (1) | 1.3 | 70.7 | 57.3 | — | 129.3 | ||||||||||||||||||||||||
Net premiums earned (1) | 0.7 | 98.5 | 41.0 | 0.6 | 140.8 | ||||||||||||||||||||||||
Loss and loss adjustment expenses incurred, net (2) | 2.3 | 67.8 | 19.2 | (0.2) | 89.1 | ||||||||||||||||||||||||
| Acquisition costs, net | — | 33.8 | 9.8 | 0.1 | 43.7 | ||||||||||||||||||||||||
Other underwriting expenses (2) | 0.1 | 4.8 | 1.6 | 1.3 | 7.8 | ||||||||||||||||||||||||
| Net underwriting income (loss) | $ | (1.7) | $ | (7.9) | $ | 10.4 | $ | (0.6) | 0.2 | ||||||||||||||||||||
| Net investment income | 137.2 | ||||||||||||||||||||||||||||
| Net corporate and other expenses | (8.9) | ||||||||||||||||||||||||||||
| Interest expense | (2.0) | ||||||||||||||||||||||||||||
| Foreign exchange gains | 0.8 | ||||||||||||||||||||||||||||
| Income before income tax expense | $ | 127.3 | |||||||||||||||||||||||||||
Underwriting Ratios: (3) | |||||||||||||||||||||||||||||
| Loss ratio | 328.6 | % | 68.8 | % | 46.8 | % | NM | 63.3 | % | ||||||||||||||||||||
| Acquisition cost ratio | — | % | 34.3 | % | 23.9 | % | NM | 31.0 | % | ||||||||||||||||||||
| Other underwriting expenses ratio | 14.3 | % | 4.9 | % | 3.9 | % | NM | 5.5 | % | ||||||||||||||||||||
Combined ratio (4) | 342.9 | % | 108.0 | % | 74.6 | % | NM | 99.8 | % | ||||||||||||||||||||
(1)Includes service fee revenue from the Company’s MGUs of $14.0 million for the three months ended June 30, 2021 (2020 - $nil).
(2)Loss and loss adjustment expenses incurred, net and other underwriting expenses include expenses associated with the Company’s MGUs of $3.5 million and $23.6 million, respectively, for the three months ended June 30, 2021 (2020 - $nil and $nil).
(3)Underwriting ratios are calculated by dividing the related expense by net premiums earned.
(4)Ratios considered not meaningful ("NM") to Runoff & Other.
(5)The Company modified the presentation of its operating segments in the first quarter of 2021 to better align with the manner in which management monitors the performance of its operations. This change was primarily due to the Company’s acquisition of Sirius Group. Prior period segment results have been adjusted to conform to the current period presentation.
| Six months ended June 30, 2021 | |||||||||||||||||||||||||||||
| A&H | Specialty | Property | Runoff & Other | Total | |||||||||||||||||||||||||
Gross premiums written (1) | $ | 225.4 | $ | 457.0 | $ | 275.3 | $ | (28.4) | $ | 929.3 | |||||||||||||||||||
Net premiums written (1) | 179.4 | 385.6 | 233.6 | (29.3) | 769.3 | ||||||||||||||||||||||||
Net premiums earned (1) | 138.7 | 370.1 | 234.6 | (21.1) | 722.3 | ||||||||||||||||||||||||
Loss and loss adjustment expenses incurred, net (2) | 66.1 | 238.3 | 119.7 | (20.9) | 403.2 | ||||||||||||||||||||||||
| Acquisition costs, net | 24.9 | 103.1 | 48.8 | (2.2) | 174.6 | ||||||||||||||||||||||||
Other underwriting expenses (2) | 39.3 | 29.1 | 30.5 | 3.6 | 102.5 | ||||||||||||||||||||||||
| Net underwriting income | $ | 8.4 | $ | (0.4) | $ | 35.6 | $ | (1.6) | 42.0 | ||||||||||||||||||||
| Other revenues | 26.4 | ||||||||||||||||||||||||||||
| Net investment income | 263.9 | ||||||||||||||||||||||||||||
| Net corporate and other expenses | (94.0) | ||||||||||||||||||||||||||||
| Intangible asset amortization | (2.1) | ||||||||||||||||||||||||||||
| Interest expense | (14.7) | ||||||||||||||||||||||||||||
| Foreign exchange gains | 0.4 | ||||||||||||||||||||||||||||
| Income before income tax expense | $ | 221.9 | |||||||||||||||||||||||||||
Underwriting Ratios: (3) | |||||||||||||||||||||||||||||
| Loss ratio | 47.7 | % | 64.4 | % | 51.0 | % | NM | 55.8 | % | ||||||||||||||||||||
| Acquisition cost ratio | 18.0 | % | 27.9 | % | 20.8 | % | NM | 24.2 | % | ||||||||||||||||||||
| Other underwriting expenses ratio | 28.3 | % | 7.9 | % | 13.0 | % | NM | 14.2 | % | ||||||||||||||||||||
| Combined ratio | 94.0 | % | 100.2 | % | 84.8 | % | NM | 94.2 | % | ||||||||||||||||||||
| Six months ended June 30, 2020 | |||||||||||||||||||||||||||||
| A&H | Specialty | Property | Runoff & Other | Total | |||||||||||||||||||||||||
Gross premiums written (1) | $ | 2.6 | $ | 153.2 | $ | 117.6 | $ | — | $ | 273.4 | |||||||||||||||||||
Net premiums written (1) | 2.6 | 147.6 | 102.3 | — | 252.5 | ||||||||||||||||||||||||
Net premiums earned (1) | 1.9 | 197.9 | 86.1 | 1.2 | 287.1 | ||||||||||||||||||||||||
Loss and loss adjustment expenses incurred, net (2) | 3.3 | 135.2 | 37.3 | 1.1 | 176.9 | ||||||||||||||||||||||||
| Acquisition costs, net | 0.2 | 67.3 | 25.7 | (0.3) | 92.9 | ||||||||||||||||||||||||
Other underwriting expenses (2) | 0.1 | 9.3 | 3.1 | 2.5 | 15.0 | ||||||||||||||||||||||||
| Net underwriting income (loss) | $ | (1.7) | $ | (13.9) | $ | 20.0 | $ | (2.1) | 2.3 | ||||||||||||||||||||
| Net investment loss | (47.8) | ||||||||||||||||||||||||||||
| Net corporate and other expenses | (15.3) | ||||||||||||||||||||||||||||
| Interest expense | (4.1) | ||||||||||||||||||||||||||||
| Foreign exchange gains | 9.0 | ||||||||||||||||||||||||||||
| Loss before income tax expense | $ | (55.9) | |||||||||||||||||||||||||||
Underwriting Ratios: (3) | |||||||||||||||||||||||||||||
| Loss ratio | 173.7 | % | 68.3 | % | 43.3 | % | NM | 61.6 | % | ||||||||||||||||||||
| Acquisition cost ratio | 10.5 | % | 34.0 | % | 29.8 | % | NM | 32.4 | % | ||||||||||||||||||||
| Other underwriting expenses ratio | 5.3 | % | 4.7 | % | 3.6 | % | NM | 5.2 | % | ||||||||||||||||||||
| Combined ratio | 189.5 | % | 107.0 | % | 76.7 | % | NM | 99.2 | % | ||||||||||||||||||||
(1)Includes service fee revenue from the Company’s MGUs of $24.8 million for the six months ended June 30, 2021 (2020 - $nil).
(2)Loss and loss adjustment expenses incurred, net and other underwriting expenses include expenses associated with the Company’s MGUs of $4.4 million and $30.9 million, respectively, for the six months ended June 30, 2021 (2020 - $nil and $nil).
(3)Underwriting ratios are calculated by dividing the related expense by net premiums earned.
(4)Ratios considered not meaningful ("NM") to Runoff & Other.
(5)The Company modified the presentation of its operating segments in the first quarter of 2021 to better align with the manner in which management monitors the performance of its operations. This change was primarily due to the Company’s acquisition of Sirius Group. Prior period segment results have been adjusted to conform to the current period presentation.
SIRIUSPOINT LTD.
NON-GAAP MEASURES AND RECONCILIATIONS & KEY PERFORMANCE INDICATORS
Key Performance Indicator
Annualized Return on Average Common Shareholders’ Equity Attributable to SiriusPoint Common Shareholders
Annualized return on average common shareholders’ equity attributable to SiriusPoint common shareholders is calculated by dividing annualized net income (loss) available to SiriusPoint common shareholders for the period by the average common shareholders’ equity determined using the common shareholders' equity balances at the beginning and end of the period.
Annualized return on average common shareholders’ equity attributable to SiriusPoint common shareholders for the three and six months ended June 30, 2021 and 2020 was calculated as follows:
| Three months ended | Six months ended | ||||||||||||||||||||||
| June 30, 2021 | June 30, 2020 | June 30, 2021 | June 30, 2020 | ||||||||||||||||||||
($ in millions) | |||||||||||||||||||||||
| Net income (loss) available to SiriusPoint common shareholders | $ | 64.5 | $ | 124.0 | $ | 195.4 | $ | (59.6) | |||||||||||||||
| Common shareholders’ equity attributable to SiriusPoint common shareholders - beginning of period | $ | 2,407.5 | $ | 1,231.7 | $ | 1,563.9 | $ | 1,414.1 | |||||||||||||||
| Common shareholders’ equity attributable to SiriusPoint common shareholders - end of period | 2,480.1 | 1,357.3 | 2,480.1 | 1,357.3 | |||||||||||||||||||
| Average common shareholders’ equity attributable to SiriusPoint common shareholders | $ | 2,443.8 | $ | 1,294.5 | $ | 2,022.0 | $ | 1,385.7 | |||||||||||||||
| Annualized return on average common shareholders’ equity attributable to SiriusPoint common shareholders | 10.6 | % | 38.3 | % | 19.3 | % | (8.6) | % | |||||||||||||||
Net Underwriting Income
We measure segment performance for our underwriting segments based on net underwriting income or loss. Net underwriting income is a pre-tax measure of underwriting profitability that takes into account net premiums earned as revenues, including service fee revenue from the Company’s managing general underwriting subsidiaries, and loss and loss adjustment expenses incurred, net, acquisition costs, net, and other underwriting expenses as expenses. Other underwriting expenses include those operating expenses that are incremental and/or directly attributable to our individual underwriting operations. See the accompanying Segment Reporting above for a calculation of net underwriting income.
Combined Ratio
Combined ratio is calculated by dividing the sum of loss and loss adjustment expenses incurred, net, acquisition costs, net and other underwriting expenses by net premiums earned. This ratio is a key indicator of a company’s underwriting profitability. See the accompanying Segment Reporting above for a calculation of the combined ratio.
Basic Book Value Per Share, Tangible Basic Book Value Per Share, Diluted Book Value Per Share, Tangible Diluted Book Value Per Share
Basic book value per share, as presented, is a non-GAAP financial measure and is calculated by dividing common shareholders’ equity attributable to SiriusPoint common shareholders by the number of common shares outstanding, excluding the total number of issued unvested restricted shares, at period end.
Tangible basic book value per share, as presented, is a non-GAAP financial measure and is calculated by dividing tangible common shareholders’ equity attributable to SiriusPoint common shareholders by the number of common shares outstanding, excluding the total number of unvested restricted shares, at period end. Tangible book value per share is useful to investors because it measures the realizable value of shareholder returns, excluding the impact of intangible assets.
Diluted book value per share and tangible diluted book value per share, as presented, are non-GAAP financial measures and are calculated using the treasury stock method. Under the treasury stock method, we assume that proceeds received from in-the-money options and/or warrants exercised are used to repurchase common shares in the market. The dilutive effect of restricted shares, restricted share units and options are calculated in a manner consistent with how dilution is calculated using the treasury stock method for earnings per share. We have also followed a similar approach for calculating dilution for warrants, Series A preference shares, Upside Rights and other potentially dilutive securities issued as part of our acquisition of Sirius Group.
The following table sets forth the computation of basic book value per share, tangible basic book value per share, diluted book value per share and tangible diluted book value per share as of June 30, 2021 and December 31, 2020:
| June 30, 2021 | December 31, 2020 | ||||||||||
| Basic and diluted book value per share numerator: | ($ in millions, except share and per share amounts) | ||||||||||
| Shareholders' equity attributable to SiriusPoint shareholders | $ | 2,680.1 | $ | 1,563.9 | |||||||
| Less: Series B preference shares | (200.0) | — | |||||||||
| Common shareholders’ equity attributable to SiriusPoint common shareholders - basic | 2,480.1 | 1,563.9 | |||||||||
| Plus: carrying value of Series A preference shares issued in merger | 38.4 | — | |||||||||
| Common shareholders’ equity attributable to SiriusPoint common shareholders - diluted | 2,518.5 | 1,563.9 | |||||||||
| Less: intangible assets | (176.7) | — | |||||||||
| Tangible common shareholders' equity attributable to SiriusPoint common shareholders - basic | 2,303.4 | 1,563.9 | |||||||||
| Tangible common shareholders' equity attributable to SiriusPoint common shareholders - diluted | $ | 2,341.8 | $ | 1,563.9 | |||||||
| Basic and diluted book value per share denominator: | |||||||||||
| Common shares outstanding | 161,945,750 | 95,582,733 | |||||||||
| Unvested restricted shares | (2,879,187) | (2,933,993) | |||||||||
| Basic book value per share denominator | 159,066,563 | 92,648,740 | |||||||||
| Effect of dilutive Series A preference shares issued in merger | 2,088,464 | — | |||||||||
| Effect of dilutive warrants | 24,295 | — | |||||||||
| Effect of dilutive stock options, restricted shares and restricted share units issued to directors and employees | 2,629,954 | 969,386 | |||||||||
| Diluted book value per share denominator | 163,809,276 | 93,618,126 | |||||||||
| Basic book value per share | $ | 15.59 | $ | 16.88 | |||||||
| Tangible basic book value per share | $ | 14.48 | $ | 16.88 | |||||||
| Diluted book value per share | $ | 15.37 | $ | 16.71 | |||||||
| Tangible diluted book value per share | $ | 14.30 | $ | 16.71 | |||||||

SiriusPoint Ltd.
Financial Supplement
June 30, 2021
(UNAUDITED)
This financial supplement is for informational purposes only. It should be read in conjunction with documents filed with the Securities and Exchange Commission by SiriusPoint Ltd., including the Company’s Quarterly Report on Form 10-Q.
| Point House | Clare Kerrigan - Corporate Communications and Investor Relations | |||||||
| 3 Waterloo Lane | Tel: (441) 542-3333 | |||||||
| Pembroke HM 08 | Email: [email protected] | |||||||
| Bermuda | Website: www.siriuspt.com | |||||||
SiriusPoint Ltd.
Basis of Presentation and Non-GAAP Financial Measures:
Unless the context otherwise indicates or requires, as used in this financial supplement references to “we,” “our,” “us,” the “Company,” and "SiriusPoint" refer to SiriusPoint Ltd. and its directly and indirectly owned subsidiaries, as a combined entity, except where otherwise stated or where it is clear that the terms mean only SiriusPoint Ltd. exclusive of its subsidiaries. We have made rounding adjustments to reach some of the figures included in this financial supplement and, unless otherwise indicated, percentages presented in this financial supplement are approximate.
In presenting SiriusPoint’s results, management has included financial measures that are not calculated under standards or rules that comprise accounting principles generally accepted in the United States (GAAP). SiriusPoint’s management uses this information in its internal analysis of results and believes that this information may be informative to investors in gauging the quality of SiriusPoint’s financial performance, identifying trends in our results and providing meaningful period-to-period comparisons. Book value per share metrics are non-GAAP financial measures. We believe that long-term growth in book value per share is an important measure of our financial performance because it allows our management and investors to track over time the value created by the retention of earnings. In addition, we believe this metric is used by investors because it provides a basis for comparison with other companies in our industry that also report a similar measure. Reconciliations of such measures to the most comparable GAAP figures are included in the attached financial information in accordance with Regulation G.
Safe Harbor Statement Regarding Forward-Looking Statements:
This Financial Supplement includes “forward-looking statements” within the meaning of the Private Securities Litigation Reform Act of 1995. Forward-looking statements are subject to known and unknown risks and uncertainties, many of which may be beyond the Company’s control. The Company cautions you that the forward-looking information presented in this Financial Supplement is not a guarantee of future events, and that actual events may differ materially from those made in or suggested by the forward-looking information contained in this Financial Supplement. In addition, forward-looking statements generally can be identified by the use of forward-looking terminology such as “may,” “plan,” “seek,” “comfortable with,” “will,” “expect,” “intend,” “estimate,” “anticipate,” “believe” or “continue” or the negative thereof or variations thereon or similar terminology. Actual events, results and outcomes may differ materially from the Company’s expectations due to a variety of known and unknown risks, uncertainties and other factors. Among the risks and uncertainties that could cause actual results to differ from those described in the forward-looking statements are the following: the costs, expense and difficulties of the integration of the operations of Sirius Group; the impact of the novel coronavirus (COVID-19) pandemic or other unpredictable catastrophic events; fluctuations in our results of operations; a downgrade or withdrawal of our financial ratings; inadequacy of loss and loss adjustment expenses reserves; the effects of global climate change; periods characterized by excess underwriting capacity and unfavorable premium rates; reduced returns or losses in SiriusPoint’s investment portfolio; adverse changes in interest rates, foreign currency exchange rates, equity markets, debt markets or market volatility; legal restrictions on certain of SiriusPoint’s insurance and reinsurance subsidiaries’ ability to pay dividends and other distributions to SiriusPoint; SiriusPoint’s significant deferred tax assets, which could become devalued if either SiriusPoint does not generate sufficient future taxable income or applicable corporate tax rates are reduced; the lack of availability of capital; future strategic transactions such as acquisitions, dispositions, mergers, investments or joint ventures; technology breaches; our concentrated exposure in Third Point Enhanced LP (the “TP Enhanced Fund”) whose investment strategy may bear substantial investment risks; conflicts of interest among various members of TP Enhanced Fund, Third Point LLC and SiriusPoint; and other risks and uncertainties listed in the Company's Quarterly Report on Form 10-Q for the quarters ended March 31, 2021 and June 30, 2021, and any subsequent reports filed with the Securities and Exchange Commission. All forward-looking statements speak only as of the date made and the Company undertakes no obligation to update or revise publicly any forward-looking statements, whether as a result of new information, future events or otherwise.
Page 2 of 19
SiriusPoint Ltd.
Table of Contents
| Key Performance Indicators | ||||||||
| Consolidated Financial Statements | ||||||||
| Condensed Consolidated Statements of Income (Loss) | ||||||||
| Condensed Consolidated Statements of Income - by Quarter | ||||||||
| Operating Segment Information | ||||||||
| Segment Reporting - Three months ended June 30, 2021 | ||||||||
| Segment Reporting - Three months ended June 30, 2020 | ||||||||
| Segment Reporting - Six months ended June 30, 2021 | ||||||||
| Segment Reporting - Six months ended June 30, 2020 | ||||||||
Specialty Segment - by Quarter | ||||||||
Runoff & Other Segment - by Quarter | ||||||||
| Investments | ||||||||
| Other | ||||||||
| Basic and Diluted Book Value per Share - by Quarter | ||||||||
| Earnings per Share - by Quarter | ||||||||
| Annualized Return on Average Common Shareholders’ Equity - by Quarter | ||||||||
Page 3 of 19
SiriusPoint Ltd.
Key Performance Indicators
June 30, 2021 and 2020
(expressed in millions of U.S. dollars, except per share data and ratios)
| Three months ended | Six months ended | ||||||||||||||||||||||
| June 30, 2021 | June 30, 2020 | June 30, 2021 | June 30, 2020 | ||||||||||||||||||||
| Annualized return on average common shareholders’ equity attributable to SiriusPoint common shareholders | 10.6 | % | 38.3 | % | 19.3 | % | (8.6) | % | |||||||||||||||
Net underwriting income (1) | $ | 33.3 | $ | 0.2 | $ | 42.0 | $ | 2.3 | |||||||||||||||
Combined ratio (1) | 92.8 | % | 99.8 | % | 94.2 | % | 99.2 | % | |||||||||||||||
Basic book value per share (2) (4) | $ | 15.59 | $ | 16.88 | $ | 15.59 | $ | 16.88 | |||||||||||||||
Tangible basic book value per share (2) (4) | $ | 14.48 | $ | 16.88 | $ | 14.48 | $ | 16.88 | |||||||||||||||
Diluted book value per share (2) (3) (4) | $ | 15.37 | $ | 16.71 | $ | 15.37 | $ | 16.71 | |||||||||||||||
Tangible diluted book value per share (2) (4) | $ | 14.30 | $ | 16.71 | $ | 14.30 | $ | 16.71 | |||||||||||||||
(1)Refer to accompanying “Segment Reporting - Three and six months ended June 30, 2021 and 2020” for a calculation of net underwriting income and combined ratio.
(2)Basic book value per share, tangible basic book value per share, diluted book value per share and tangible diluted book value per share are non-GAAP financial measures.
(3)In the first quarter of 2021, we changed the method for calculating the dilutive effect of restricted shares, restricted share units and options to calculate the dilutive impact in a manner consistent with how dilution is calculated using the treasury stock method for earnings per share.
(4)Prior year comparatives represent amounts as of December 31, 2020.
Page 4 of 19
SiriusPoint Ltd.
Condensed Consolidated Balance Sheets - by Quarter
(expressed in millions of U.S. dollars)
| June 30, 2021 | March 31, 2021 | December 31, 2020 | September 30, 2020 | June 30, 2020 | ||||||||||||||||||||||||||||
| Assets | ||||||||||||||||||||||||||||||||
| Investments in related party investment funds, at fair value | $ | 1,254.4 | $ | 1,208.8 | $ | 1,055.6 | $ | 869.0 | $ | 758.4 | ||||||||||||||||||||||
| Debt securities, trading, at fair value | 2,009.3 | 2,940.3 | 101.3 | 186.3 | 238.6 | |||||||||||||||||||||||||||
| Short-term investments, at fair value | 766.7 | — | — | — | — | |||||||||||||||||||||||||||
| Equity securities, trading, at fair value | 5.0 | 5.9 | — | — | — | |||||||||||||||||||||||||||
| Other long-term investments, at fair value | 463.7 | 473.1 | 4.0 | 4.0 | 4.0 | |||||||||||||||||||||||||||
| Total investments | 4,499.1 | 4,628.1 | 1,160.9 | 1,059.3 | 1,001.0 | |||||||||||||||||||||||||||
| Cash and cash equivalents | 1,032.6 | 932.4 | 526.0 | 513.8 | 584.8 | |||||||||||||||||||||||||||
| Restricted cash and cash equivalents | 1,554.4 | 1,411.3 | 1,187.9 | 1,101.7 | 887.3 | |||||||||||||||||||||||||||
| Due from brokers | 55.7 | 37.8 | 94.9 | 81.1 | 169.1 | |||||||||||||||||||||||||||
| Interest and dividends receivable | 11.1 | 10.3 | 0.9 | 1.8 | 2.2 | |||||||||||||||||||||||||||
| Insurance and reinsurance balances receivable, net | 1,515.3 | 1,613.8 | 441.9 | 440.5 | 444.7 | |||||||||||||||||||||||||||
| Deferred acquisition costs, net and value of business acquired | 212.1 | 218.8 | 68.6 | 69.3 | 75.9 | |||||||||||||||||||||||||||
| Unearned premiums ceded | 247.0 | 247.7 | 20.5 | 12.9 | 12.7 | |||||||||||||||||||||||||||
| Loss and loss adjustment expenses recoverable, net | 516.6 | 492.6 | 14.4 | 13.6 | 10.1 | |||||||||||||||||||||||||||
| Deferred tax asset | 216.3 | 256.5 | 0.4 | 4.0 | 4.6 | |||||||||||||||||||||||||||
| Intangible assets | 176.7 | 174.2 | — | — | — | |||||||||||||||||||||||||||
| Other assets | 153.7 | 146.2 | 18.8 | 16.2 | 13.2 | |||||||||||||||||||||||||||
| Total assets | $ | 10,190.6 | $ | 10,169.7 | $ | 3,535.2 | $ | 3,314.2 | $ | 3,205.6 | ||||||||||||||||||||||
| Liabilities | ||||||||||||||||||||||||||||||||
| Loss and loss adjustment expense reserves | $ | 4,232.3 | $ | 4,259.3 | $ | 1,310.1 | $ | 1,186.1 | $ | 1,134.0 | ||||||||||||||||||||||
| Unearned premium reserves | 1,238.1 | 1,244.8 | 284.8 | 286.0 | 311.1 | |||||||||||||||||||||||||||
| Reinsurance balances payable | 526.3 | 528.8 | 78.1 | 113.1 | 83.7 | |||||||||||||||||||||||||||
| Deposit liabilities | 148.6 | 150.7 | 153.0 | 155.7 | 168.9 | |||||||||||||||||||||||||||
| Securities sold, not yet purchased, at fair value | 10.0 | 9.2 | 12.0 | 15.4 | 19.6 | |||||||||||||||||||||||||||
| Due to brokers | 38.9 | 26.2 | — | — | 1.5 | |||||||||||||||||||||||||||
| Accounts payable, accrued expenses and other liabilities | 164.1 | 154.4 | 17.6 | 15.1 | 15.3 | |||||||||||||||||||||||||||
| Deferred tax liability | 190.2 | 223.0 | — | — | — | |||||||||||||||||||||||||||
| Liability-classified capital instruments | 122.2 | 135.0 | — | — | — | |||||||||||||||||||||||||||
| Debt | 836.5 | 829.0 | 114.3 | 114.2 | 114.2 | |||||||||||||||||||||||||||
| Total liabilities | 7,507.2 | 7,560.4 | 1,969.9 | 1,885.6 | 1,848.3 | |||||||||||||||||||||||||||
| Shareholders’ equity | ||||||||||||||||||||||||||||||||
| Series B preference shares | 200.0 | 200.0 | — | — | — | |||||||||||||||||||||||||||
| Common shares | 16.2 | 16.2 | 9.6 | 9.5 | 9.5 | |||||||||||||||||||||||||||
| Additional paid-in capital | 1,646.6 | 1,639.6 | 933.9 | 932.0 | 930.5 | |||||||||||||||||||||||||||
| Retained earnings | 815.8 | 751.3 | 620.4 | 486.1 | 417.3 | |||||||||||||||||||||||||||
| Accumulated other comprehensive income | 1.5 | 0.4 | — | — | — | |||||||||||||||||||||||||||
| Shareholders’ equity attributable to SiriusPoint shareholders | 2,680.1 | 2,607.5 | 1,563.9 | 1,427.6 | 1,357.3 | |||||||||||||||||||||||||||
| Noncontrolling interests | 3.3 | 1.8 | 1.4 | 1.0 | — | |||||||||||||||||||||||||||
| Total shareholders’ equity | 2,683.4 | 2,609.3 | 1,565.3 | 1,428.6 | 1,357.3 | |||||||||||||||||||||||||||
| Total liabilities, noncontrolling interests and shareholders’ equity | $ | 10,190.6 | $ | 10,169.7 | $ | 3,535.2 | $ | 3,314.2 | $ | 3,205.6 | ||||||||||||||||||||||
Page 5 of 19
SiriusPoint Ltd.
Condensed Consolidated Statements of Income (Loss)
(expressed in millions of U.S. dollars, except share and per share data)
| Three months ended | Six months ended | ||||||||||||||||||||||
| June 30, 2021 | June 30, 2020 | June 30, 2021 | June 30, 2020 | ||||||||||||||||||||
| Revenues | |||||||||||||||||||||||
| Net premiums earned | $ | 466.3 | $ | 140.8 | $ | 722.3 | $ | 287.1 | |||||||||||||||
| Net realized and unrealized investment gains | 23.9 | 36.0 | 55.4 | 47.6 | |||||||||||||||||||
| Net investment income (loss) from investments in related party investment funds | 45.6 | 98.6 | 198.8 | (102.2) | |||||||||||||||||||
| Other net investment income | 7.9 | 2.6 | 9.7 | 6.8 | |||||||||||||||||||
| Net investment income (loss) | 77.4 | 137.2 | 263.9 | (47.8) | |||||||||||||||||||
| Other revenues | 17.8 | — | 26.4 | — | |||||||||||||||||||
| Total revenues | 561.5 | 278.0 | 1,012.6 | 239.3 | |||||||||||||||||||
| Expenses | |||||||||||||||||||||||
| Loss and loss adjustment expenses incurred, net | 255.1 | 89.1 | 403.2 | 176.9 | |||||||||||||||||||
| Acquisition costs, net | 105.6 | 43.7 | 174.6 | 92.9 | |||||||||||||||||||
| Other underwriting expenses | 72.3 | 7.8 | 102.5 | 15.0 | |||||||||||||||||||
| Net corporate and other expenses | 25.7 | 8.9 | 94.0 | 15.3 | |||||||||||||||||||
| Intangible asset amortization | 1.3 | — | 2.1 | — | |||||||||||||||||||
| Interest expense | 9.8 | 2.0 | 14.7 | 4.1 | |||||||||||||||||||
| Foreign exchange (gains) losses | 12.0 | (0.8) | (0.4) | (9.0) | |||||||||||||||||||
| Total expenses | 481.8 | 150.7 | 790.7 | 295.2 | |||||||||||||||||||
| Income (loss) before income tax expense | 79.7 | 127.3 | 221.9 | (55.9) | |||||||||||||||||||
| Income tax expense | (9.6) | (3.3) | (19.4) | (3.7) | |||||||||||||||||||
| Net income (loss) | 70.1 | 124.0 | 202.5 | (59.6) | |||||||||||||||||||
| Net income attributable to noncontrolling interests | (1.6) | — | (1.6) | — | |||||||||||||||||||
| Net income (loss) available to SiriusPoint | 68.5 | 124.0 | 200.9 | (59.6) | |||||||||||||||||||
| Dividends on Series B preference shares | (4.0) | — | (5.5) | — | |||||||||||||||||||
| Net income (loss) available to SiriusPoint common shareholders | $ | 64.5 | $ | 124.0 | $ | 195.4 | $ | (59.6) | |||||||||||||||
| Earnings (loss) per share available to SiriusPoint common shareholders | |||||||||||||||||||||||
| Basic earnings (loss) per share available to SiriusPoint common shareholders (1) | $ | 0.37 | $ | 1.33 | $ | 1.32 | $ | (0.65) | |||||||||||||||
| Diluted earnings (loss) per share available to SiriusPoint common shareholders (1) | $ | 0.37 | $ | 1.33 | $ | 1.30 | $ | (0.65) | |||||||||||||||
| Weighted average number of common shares used in the determination of earnings (loss) per share | |||||||||||||||||||||||
| Basic | 158,832,629 | 92,593,599 | 137,912,915 | 92,392,718 | |||||||||||||||||||
| Diluted | 160,894,216 | 92,738,293 | 139,561,196 | 92,392,718 | |||||||||||||||||||
(1) Basic earnings per share is based on the weighted average number of common shares and participating securities outstanding during the period. The weighted average number of common shares excludes any dilutive effect of outstanding warrants, options and unvested restricted shares. Diluted earnings per share is based on the weighted average number of common shares and participating securities outstanding and includes any dilutive effects of warrants, options and unvested restricted shares under share plans and are determined using the treasury stock method. U.S. GAAP requires that participating securities, be treated in the same manner as outstanding shares for earnings per share calculations. The Company treats certain of its unvested restricted shares as participating securities. In the event of a net loss, all participating securities, outstanding warrants, options and restricted shares are excluded from both basic and diluted loss per share since their inclusion would be anti-dilutive.
Page 6 of 19
SiriusPoint Ltd.
Condensed Consolidated Statements of Income (Loss) - by Quarter
(expressed in millions of U.S. dollars, except share and per share data)
| June 30, 2021 | March 31, 2021 | December 31, 2020 | September 30, 2020 | June 30, 2020 | ||||||||||||||||||||||||||||
| Revenues | ||||||||||||||||||||||||||||||||
| Net premiums earned | $ | 466.3 | $ | 256.0 | $ | 182.0 | $ | 141.7 | $ | 140.8 | ||||||||||||||||||||||
| Net realized and unrealized investment gains | 23.9 | 31.5 | 14.7 | 7.0 | 36.0 | |||||||||||||||||||||||||||
| Net investment income from investment in related party investment fund | 45.6 | 153.2 | 186.6 | 110.6 | 98.6 | |||||||||||||||||||||||||||
| Other net investment income | 7.9 | 1.8 | 3.5 | 4.4 | 2.6 | |||||||||||||||||||||||||||
| Net investment income | 77.4 | 186.5 | 204.8 | 122.0 | 137.2 | |||||||||||||||||||||||||||
| Other revenues | 17.8 | 8.6 | — | — | — | |||||||||||||||||||||||||||
| Total revenues | 561.5 | 451.1 | 386.8 | 263.7 | 278.0 | |||||||||||||||||||||||||||
| Expenses | ||||||||||||||||||||||||||||||||
| Loss and loss adjustment expenses incurred, net | 255.1 | 148.1 | 177.9 | 110.5 | 89.1 | |||||||||||||||||||||||||||
| Acquisition costs, net | 105.6 | 69.0 | 39.3 | 54.8 | 43.7 | |||||||||||||||||||||||||||
| Other underwriting expenses | 72.3 | 30.2 | 9.7 | 6.1 | 7.8 | |||||||||||||||||||||||||||
| Net corporate and other expenses | 25.7 | 68.3 | 11.0 | 14.9 | 8.9 | |||||||||||||||||||||||||||
| Intangible asset amortization | 1.3 | 0.8 | — | — | — | |||||||||||||||||||||||||||
| Interest expense | 9.8 | 4.9 | 2.1 | 2.1 | 2.0 | |||||||||||||||||||||||||||
| Foreign exchange (gains) losses | 12.0 | (12.4) | 8.3 | 5.9 | (0.8) | |||||||||||||||||||||||||||
| Total expenses | 481.8 | 308.9 | 248.3 | 194.3 | 150.7 | |||||||||||||||||||||||||||
| Income before income tax expense | 79.7 | 142.2 | 138.5 | 69.4 | 127.3 | |||||||||||||||||||||||||||
| Income tax expense | (9.6) | (9.8) | (3.7) | (0.7) | (3.3) | |||||||||||||||||||||||||||
| Net income | 70.1 | 132.4 | 134.8 | 68.7 | 124.0 | |||||||||||||||||||||||||||
| Net income attributable to noncontrolling interests | (1.6) | — | (0.4) | — | — | |||||||||||||||||||||||||||
| Net income available to SiriusPoint | 68.5 | 132.4 | 134.4 | 68.7 | 124.0 | |||||||||||||||||||||||||||
| Dividends on Series B preference shares | (4.0) | (1.5) | — | — | — | |||||||||||||||||||||||||||
| Net income available to SiriusPoint common shareholders | $ | 64.5 | $ | 130.9 | $ | 134.4 | $ | 68.7 | $ | 124.0 | ||||||||||||||||||||||
| Earnings per share available to SiriusPoint common shareholders | ||||||||||||||||||||||||||||||||
| Basic earnings per share available to SiriusPoint common shareholders (1) | $ | 0.37 | $ | 1.07 | $ | 1.43 | $ | 0.74 | $ | 1.33 | ||||||||||||||||||||||
| Diluted earnings per share available to SiriusPoint common shareholders (1) | $ | 0.37 | $ | 1.05 | $ | 1.43 | $ | 0.73 | $ | 1.33 | ||||||||||||||||||||||
| Weighted average number of common shares used in the determination of earnings per share | ||||||||||||||||||||||||||||||||
| Basic | 158,832,629 | 116,760,760 | 92,638,978 | 92,613,393 | 92,593,599 | |||||||||||||||||||||||||||
| Diluted | 160,894,216 | 118,146,341 | 93,165,559 | 92,969,646 | 92,738,293 | |||||||||||||||||||||||||||
(1) Basic earnings per share is based on the weighted average number of common shares and participating securities outstanding during the period. The weighted average number of common shares excludes any dilutive effect of outstanding warrants, options and unvested restricted shares. Diluted earnings per share is based on the weighted average number of common shares and participating securities outstanding and includes any dilutive effects of warrants, options and unvested restricted shares under share plans and are determined using the treasury stock method. U.S. GAAP requires that participating securities, be treated in the same manner as outstanding shares for earnings per share calculations. The Company treats certain of its unvested restricted shares as participating securities. In the event of a net loss, all participating securities, outstanding warrants, options and restricted shares are excluded from both basic and diluted loss per share since their inclusion would be anti-dilutive.
Page 7 of 19
SiriusPoint Ltd.
Segment Reporting - Three months ended June 30, 2021
(expressed in millions of U.S. dollars, except ratios)
| A&H | Specialty | Property | Runoff & Other | Total | |||||||||||||||||||||||||
Gross premiums written (1) | $ | 90.6 | $ | 289.3 | $ | 213.2 | $ | (30.4) | $ | 562.7 | |||||||||||||||||||
Net premiums written (1) | 75.8 | 241.1 | 173.3 | (31.2) | 459.0 | ||||||||||||||||||||||||
Net premiums earned (1) | 103.7 | 231.1 | 154.4 | (22.9) | 466.3 | ||||||||||||||||||||||||
Loss and loss adjustment expenses incurred, net (2) | 52.1 | 151.2 | 74.3 | (22.5) | 255.1 | ||||||||||||||||||||||||
| Acquisition costs, net | 19.8 | 60.8 | 27.6 | (2.6) | 105.6 | ||||||||||||||||||||||||
Other underwriting expenses (2) | 28.7 | 19.2 | 22.3 | 2.1 | 72.3 | ||||||||||||||||||||||||
| Net underwriting income (loss) | $ | 3.1 | $ | (0.1) | $ | 30.2 | $ | 0.1 | 33.3 | ||||||||||||||||||||
| Other revenues | 17.8 | ||||||||||||||||||||||||||||
| Net investment income | 77.4 | ||||||||||||||||||||||||||||
| Net corporate and other expenses | (25.7) | ||||||||||||||||||||||||||||
| Intangible asset amortization | (1.3) | ||||||||||||||||||||||||||||
| Interest expense | (9.8) | ||||||||||||||||||||||||||||
| Foreign exchange losses | (12.0) | ||||||||||||||||||||||||||||
| Income before income tax expense | $ | 79.7 | |||||||||||||||||||||||||||
Underwriting Ratios (3): | |||||||||||||||||||||||||||||
| Loss ratio | 50.2 | % | 65.4 | % | 48.1 | % | NM | 54.7 | % | ||||||||||||||||||||
| Acquisition cost ratio | 19.1 | % | 26.3 | % | 17.9 | % | NM | 22.6 | % | ||||||||||||||||||||
| Other underwriting expenses ratio | 27.7 | % | 8.3 | % | 14.4 | % | NM | 15.5 | % | ||||||||||||||||||||
Combined ratio (4) | 97.0 | % | 100.0 | % | 80.4 | % | NM | 92.8 | % | ||||||||||||||||||||
(1)Includes service fee revenue from the Company’s MGUs of $14.0 million in the three months ended June 30, 2021.
(2)Loss and loss adjustment expenses incurred, net and other underwriting expenses include expenses associated with the Company’s MGUs of $3.5 million and $23.6 million for the three months ended June 30, 2021, respectively.
(3)Underwriting ratios are calculated by dividing the related expense by net premiums earned.
(4)Ratios considered not meaningful ("NM") to Runoff & Other.
(5)The Company modified the presentation of its operating segments in the first quarter of 2021 to better align with the manner in which management monitors the performance of its operations. This change was primarily due to the Company’s acquisition of Sirius Group. Prior period segment results have been adjusted to conform to the current period presentation.
Page 8 of 19
SiriusPoint Ltd.
Segment Reporting - Three months ended June 30, 2020
(expressed in millions of U.S. dollars, except ratios)
| A&H | Specialty | Property | Runoff & Other | Total | |||||||||||||||||||||||||
Gross premiums written (1) | $ | 1.3 | $ | 73.8 | $ | 72.6 | $ | — | $ | 147.7 | |||||||||||||||||||
Net premiums written (1) | 1.3 | 70.7 | 57.3 | — | 129.3 | ||||||||||||||||||||||||
Net premiums earned (1) | 0.7 | 98.5 | 41.0 | 0.6 | 140.8 | ||||||||||||||||||||||||
Loss and loss adjustment expenses incurred, net (1) | 2.3 | 67.8 | 19.2 | (0.2) | 89.1 | ||||||||||||||||||||||||
| Acquisition costs, net | — | 33.8 | 9.8 | 0.1 | 43.7 | ||||||||||||||||||||||||
Other underwriting expenses (1) | 0.1 | 4.8 | 1.6 | 1.3 | 7.8 | ||||||||||||||||||||||||
| Net underwriting income (loss) | $ | (1.7) | $ | (7.9) | $ | 10.4 | $ | (0.6) | 0.2 | ||||||||||||||||||||
| Net investment income | 137.2 | ||||||||||||||||||||||||||||
| Net corporate and other expenses | (8.9) | ||||||||||||||||||||||||||||
| Interest expense | (2.0) | ||||||||||||||||||||||||||||
| Foreign exchange gains | 0.8 | ||||||||||||||||||||||||||||
| Income before income tax expense | $ | 127.3 | |||||||||||||||||||||||||||
Underwriting Ratios (2): | |||||||||||||||||||||||||||||
| Loss ratio | 328.6 | % | 68.8 | % | 46.8 | % | NM | 63.3 | % | ||||||||||||||||||||
| Acquisition cost ratio | — | % | 34.3 | % | 23.9 | % | NM | 31.0 | % | ||||||||||||||||||||
| Other underwriting expenses ratio | 14.3 | % | 4.9 | % | 3.9 | % | NM | 5.5 | % | ||||||||||||||||||||
Combined ratio (3) | 342.9 | % | 108.0 | % | 74.6 | % | NM | 99.8 | % | ||||||||||||||||||||
(1)No MGUs existed in the three months ended June 30, 2020, therefore no service fee revenue or fees are included.
(2)Underwriting ratios are calculated by dividing the related expense by net premiums earned.
(3)Ratios considered not meaningful ("NM") to Runoff & Other.
(4)The Company modified the presentation of its operating segments in the first quarter of 2021 to better align with the manner in which management monitors the performance of its operations. This change was primarily due to the Company’s acquisition of Sirius Group. Prior period segment results have been adjusted to conform to the current period presentation.
Page 9 of 19
SiriusPoint Ltd.
Segment Reporting - Six months ended June 30, 2021
(expressed in millions of U.S. dollars, except ratios)
| A&H | Specialty | Property | Runoff & Other | Total | |||||||||||||||||||||||||
Gross premiums written (1) | $ | 225.4 | $ | 457.0 | $ | 275.3 | $ | (28.4) | $ | 929.3 | |||||||||||||||||||
Net premiums written (1) | 179.4 | 385.6 | 233.6 | (29.3) | 769.3 | ||||||||||||||||||||||||
Net premiums earned (1) | 138.7 | 370.1 | 234.6 | (21.1) | 722.3 | ||||||||||||||||||||||||
Loss and loss adjustment expenses incurred, net (2) | 66.1 | 238.3 | 119.7 | (20.9) | 403.2 | ||||||||||||||||||||||||
| Acquisition costs, net | 24.9 | 103.1 | 48.8 | (2.2) | 174.6 | ||||||||||||||||||||||||
Other underwriting expenses (2) | 39.3 | 29.1 | 30.5 | 3.6 | 102.5 | ||||||||||||||||||||||||
| Net underwriting income (loss) | $ | 8.4 | $ | (0.4) | $ | 35.6 | $ | (1.6) | 42.0 | ||||||||||||||||||||
| Other revenues | 26.4 | ||||||||||||||||||||||||||||
| Net investment income | 263.9 | ||||||||||||||||||||||||||||
| Net corporate and other expenses | (94.0) | ||||||||||||||||||||||||||||
| Intangible asset amortization | (2.1) | ||||||||||||||||||||||||||||
| Interest expense | (14.7) | ||||||||||||||||||||||||||||
| Foreign exchange gains | 0.4 | ||||||||||||||||||||||||||||
| Income before income tax expense | $ | 221.9 | |||||||||||||||||||||||||||
Underwriting Ratios (3): | |||||||||||||||||||||||||||||
| Loss ratio | 47.7 | % | 64.4 | % | 51.0 | % | NM | 55.8 | % | ||||||||||||||||||||
| Acquisition cost ratio | 18.0 | % | 27.9 | % | 20.8 | % | NM | 24.2 | % | ||||||||||||||||||||
| Other underwriting expenses ratio | 28.3 | % | 7.9 | % | 13.0 | % | NM | 14.2 | % | ||||||||||||||||||||
Combined ratio (4) | 94.0 | % | 100.2 | % | 84.8 | % | NM | 94.2 | % | ||||||||||||||||||||
(1)Includes service fee revenue from the Company’s MGUs of $24.8 million in the six months ended June 30, 2021.
(2)Loss and loss adjustment expenses incurred, net and other underwriting expenses include expenses associated with the Company’s MGUs of $4.4 million and $30.9 million for the six months ended June 30, 2021, respectively.
(3)Underwriting ratios are calculated by dividing the related expense by net premiums earned.
(4)Ratios considered not meaningful ("NM") to Runoff & Other.
(5)The Company modified the presentation of its operating segments in the first quarter of 2021 to better align with the manner in which management monitors the performance of its operations. This change was primarily due to the Company’s acquisition of Sirius Group. Prior period segment results have been adjusted to conform to the current period presentation.
Page 10 of 19
SiriusPoint Ltd.
Segment Reporting - Six months ended June 30, 2020
(expressed in millions of U.S. dollars, except ratios)
| A&H | Specialty | Property | Runoff & Other | Total | |||||||||||||||||||||||||
Gross premiums written (1) | $ | 2.6 | $ | 153.2 | $ | 117.6 | $ | — | $ | 273.4 | |||||||||||||||||||
Net premiums written (1) | 2.6 | 147.6 | 102.3 | — | 252.5 | ||||||||||||||||||||||||
Net premiums earned (1) | 1.9 | 197.9 | 86.1 | 1.2 | 287.1 | ||||||||||||||||||||||||
Loss and loss adjustment expenses incurred, net (1) | 3.3 | 135.2 | 37.3 | 1.1 | 176.9 | ||||||||||||||||||||||||
| Acquisition costs, net | 0.2 | 67.3 | 25.7 | (0.3) | 92.9 | ||||||||||||||||||||||||
Other underwriting expenses (1) | 0.1 | 9.3 | 3.1 | 2.5 | 15.0 | ||||||||||||||||||||||||
| Net underwriting income (loss) | $ | (1.7) | $ | (13.9) | $ | 20.0 | $ | (2.1) | 2.3 | ||||||||||||||||||||
| Net investment loss | (47.8) | ||||||||||||||||||||||||||||
| Net corporate and other expenses | (15.3) | ||||||||||||||||||||||||||||
| Interest expense | (4.1) | ||||||||||||||||||||||||||||
| Foreign exchange gains | 9.0 | ||||||||||||||||||||||||||||
| Loss before income tax expense | $ | (55.9) | |||||||||||||||||||||||||||
Underwriting Ratios (2): | |||||||||||||||||||||||||||||
| Loss ratio | 173.7 | % | — | % | 68.3 | % | — | % | 43.3 | % | — | % | NM | 61.6 | % | ||||||||||||||
| Acquisition cost ratio | 10.5 | % | — | % | 34.0 | % | — | % | 29.8 | % | — | % | NM | 32.4 | % | ||||||||||||||
| Other underwriting expenses ratio | 5.3 | % | — | % | 4.7 | % | — | % | 3.6 | % | — | % | NM | 5.2 | % | ||||||||||||||
Combined ratio (3) | 189.5 | % | 107.0 | % | 76.7 | % | NM | 99.2 | % | ||||||||||||||||||||
(1)No MGUs existed in the six months ended June 30, 2020, therefore no service fee revenue or fees are included.
(2)Underwriting ratios are calculated by dividing the related expense by net premiums earned.
(3)Ratios considered not meaningful ("NM") to Runoff & Other.
(4)The Company modified the presentation of its operating segments in the first quarter of 2021 to better align with the manner in which management monitors the performance of its operations. This change was primarily due to the Company’s acquisition of Sirius Group. Prior period segment results have been adjusted to conform to the current period presentation.
Page 11 of 19
SiriusPoint Ltd.
A&H Segment - by Quarter (1)
(expressed in millions of U.S. dollars, except ratios)
| June 30, 2021 | March 31, 2021 | December 31, 2020 | September 30, 2020 | June 30, 2020 | ||||||||||||||||||||||||||||
| Gross premiums written | $ | 90.6 | $ | 134.8 | $ | 0.6 | $ | 0.2 | $ | 1.3 | ||||||||||||||||||||||
| Net premiums written | 75.8 | 103.6 | 0.6 | 0.2 | 1.3 | |||||||||||||||||||||||||||
| Net premiums earned | 103.7 | 35.0 | 0.7 | 0.6 | 0.7 | |||||||||||||||||||||||||||
| Loss and loss adjustment expenses incurred, net | 52.1 | 14.0 | (0.4) | 0.4 | 2.3 | |||||||||||||||||||||||||||
| Acquisition costs, net | 19.8 | 5.1 | — | 0.1 | — | |||||||||||||||||||||||||||
| Other underwriting expenses | 28.7 | 10.6 | — | — | 0.1 | |||||||||||||||||||||||||||
| Net underwriting income (loss) | $ | 3.1 | $ | 5.3 | $ | 1.1 | $ | 0.1 | $ | (1.7) | ||||||||||||||||||||||
| Underwriting Ratios (2): | ||||||||||||||||||||||||||||||||
| Loss ratio | 50.2 | % | 40.0 | % | (57.1) | % | 66.7 | % | 328.6 | % | ||||||||||||||||||||||
| Acquisition cost ratio | 19.1 | % | 14.6 | % | — | % | 16.7 | % | — | % | ||||||||||||||||||||||
| Other underwriting expense ratio | 27.7 | % | 30.3 | % | — | % | — | % | 14.3 | % | ||||||||||||||||||||||
| Combined ratio | 97.0 | % | 84.9 | % | (57.1) | % | 83.3 | % | 342.9 | % | ||||||||||||||||||||||
(1)The Company modified the presentation of its operating segments in the first quarter of 2021 to better align with the manner in which management monitors the performance of its operations. This change was primarily due to the Company’s acquisition of Sirius Group. Prior period segment results have been adjusted to conform to the current period presentation.
(2)Underwriting ratios are calculated by dividing the related expense by net premiums earned.
Page 12 of 19
SiriusPoint Ltd.
Specialty Segment - by Quarter (1)
(expressed in millions of U.S. dollars, except ratios)
| June 30, 2021 | March 31, 2021 | December 31, 2020 | September 30, 2020 | June 30, 2020 | ||||||||||||||||||||||||||||
| Gross premiums written | $ | 289.3 | $ | 167.7 | $ | 136.5 | $ | 79.0 | $ | 73.8 | ||||||||||||||||||||||
| Net premiums written | 241.1 | 144.5 | 125.5 | 76.7 | 70.7 | |||||||||||||||||||||||||||
| Net premiums earned | 231.1 | 139.0 | 122.4 | 87.7 | 98.5 | |||||||||||||||||||||||||||
| Loss and loss adjustment expenses incurred, net | 151.2 | 87.1 | 139.5 | 67.9 | 67.8 | |||||||||||||||||||||||||||
| Acquisition costs, net | 60.8 | 42.3 | 27.2 | 18.0 | 33.8 | |||||||||||||||||||||||||||
| Other underwriting expenses | 19.2 | 9.9 | 6.3 | 3.1 | 4.8 | |||||||||||||||||||||||||||
| Net underwriting loss | $ | (0.1) | $ | (0.3) | $ | (50.6) | $ | (1.3) | $ | (7.9) | ||||||||||||||||||||||
| Underwriting Ratios (2): | ||||||||||||||||||||||||||||||||
| Loss ratio | 65.4 | % | 62.7 | % | 114.0 | % | 77.4 | % | 68.8 | % | ||||||||||||||||||||||
| Acquisition cost ratio | 26.3 | % | 30.4 | % | 22.2 | % | 20.5 | % | 34.3 | % | ||||||||||||||||||||||
| Other underwriting expense ratio | 8.3 | % | 7.1 | % | 5.1 | % | 3.5 | % | 4.9 | % | ||||||||||||||||||||||
| Combined ratio | 100.0 | % | 100.2 | % | 141.3 | % | 101.4 | % | 108.0 | % | ||||||||||||||||||||||
(1)The Company modified the presentation of its operating segments in the first quarter of 2021 to better align with the manner in which management monitors the performance of its operations. This change was primarily due to the Company’s acquisition of Sirius Group. Prior period segment results have been adjusted to conform to the current period presentation.
(2)Underwriting ratios are calculated by dividing the related expense by net premiums earned.
Page 13 of 19
SiriusPoint Ltd.
Property Segment - by Quarter (1)
(expressed in millions of U.S. dollars, except ratios)
| June 30, 2021 | March 31, 2021 | December 31, 2020 | September 30, 2020 | June 30, 2020 | ||||||||||||||||||||||||||||
| Gross premiums written | $ | 213.2 | $ | 62.1 | $ | 27.3 | $ | 42.6 | $ | 72.6 | ||||||||||||||||||||||
| Net premiums written | 173.3 | 60.3 | 21.2 | 36.6 | 57.3 | |||||||||||||||||||||||||||
| Net premiums earned | 154.4 | 80.2 | 35.7 | 49.8 | 41.0 | |||||||||||||||||||||||||||
| Loss and loss adjustment expenses incurred, net | 74.3 | 45.4 | 20.1 | 62.1 | 19.2 | |||||||||||||||||||||||||||
| Acquisition costs, net | 27.6 | 21.2 | 9.9 | 13.0 | 9.8 | |||||||||||||||||||||||||||
| Other underwriting expenses | 22.3 | 8.2 | 1.3 | 1.6 | 1.6 | |||||||||||||||||||||||||||
| Net underwriting income (loss) | $ | 30.2 | $ | 5.4 | $ | 4.4 | $ | (26.9) | $ | 10.4 | ||||||||||||||||||||||
| Underwriting Ratios (2): | ||||||||||||||||||||||||||||||||
| Loss ratio | 48.1 | % | 56.6 | % | 56.3 | % | 124.7 | % | 46.8 | % | ||||||||||||||||||||||
| Acquisition cost ratio | 17.9 | % | 26.4 | % | 27.7 | % | 26.1 | % | 23.9 | % | ||||||||||||||||||||||
| Other underwriting expense ratio | 14.4 | % | 10.2 | % | 3.6 | % | 3.2 | % | 3.9 | % | ||||||||||||||||||||||
| Combined ratio | 80.4 | % | 93.2 | % | 87.6 | % | 154.0 | % | 74.6 | % | ||||||||||||||||||||||
(1)The Company modified the presentation of its operating segments in the first quarter of 2021 to better align with the manner in which management monitors the performance of its operations. This change was primarily due to the Company’s acquisition of Sirius Group. Prior period segment results have been adjusted to conform to the current period presentation.
(2)Underwriting ratios are calculated by dividing the related expense by net premiums earned.
Page 14 of 19
SiriusPoint Ltd.
Runoff & Other Segment - by Quarter (1)
(expressed in millions of U.S. dollars)
| June 30, 2021 | March 31, 2021 | December 31, 2020 | September 30, 2020 | June 30, 2020 | ||||||||||||||||||||||||||||
| Gross premiums written | $ | (30.4) | $ | 2.0 | $ | 26.0 | $ | 2.9 | $ | — | ||||||||||||||||||||||
| Net premiums written | (31.2) | 1.9 | 26.0 | 2.9 | — | |||||||||||||||||||||||||||
| Net premiums earned | (22.9) | 1.8 | 23.3 | 3.6 | 0.6 | |||||||||||||||||||||||||||
| Loss and loss adjustment expenses incurred, net | (22.5) | 1.6 | 18.8 | (20.0) | (0.2) | |||||||||||||||||||||||||||
| Acquisition costs, net | (2.6) | 0.4 | 2.1 | 23.7 | 0.1 | |||||||||||||||||||||||||||
| Other underwriting expenses | 2.1 | 1.5 | 2.0 | 1.4 | 1.3 | |||||||||||||||||||||||||||
| Net underwriting income (loss) | $ | 0.1 | $ | (1.7) | $ | 0.4 | $ | (1.5) | $ | (0.6) | ||||||||||||||||||||||
(1)The Company modified the presentation of its operating segments in the the first quarter of 2021 to better align with the manner in which management monitors the performance of its operations. This change was primarily due to the Company’s acquisition of Sirius Group. Prior period segment results have been adjusted to conform to the current period presentation.
(2)Underwriting ratios are not considered not meaningful to Runoff & Other
Page 15 of 19
SiriusPoint Ltd.
Investments - by Quarter
(expressed in millions of U.S. dollars)
| June 30, 2021 | March 31, 2021 | December 31, 2020 | September 30, 2020 | June 30, 2020 | |||||||||||||||||||||||||||||||||||||||||||||||||||||||
| Fair Value | % | Fair Value | % | Fair Value | % | Fair Value | % | Fair Value | % | ||||||||||||||||||||||||||||||||||||||||||||||||||
| Asset-backed securities | $ | 543.6 | 12.1 | % | $ | 594.6 | 12.8 | % | $ | 1.3 | 0.1 | % | $ | 20.6 | 2.0 | % | $ | 35.7 | 3.5 | % | |||||||||||||||||||||||||||||||||||||||
| Residential mortgage-backed securities | 367.8 | 8.2 | % | 392.2 | 8.5 | % | 8.7 | 0.7 | % | 8.7 | 0.8 | % | 12.7 | 1.3 | % | ||||||||||||||||||||||||||||||||||||||||||||
| Commercial mortgage-backed securities | 123.6 | 2.7 | % | 123.0 | 2.6 | % | — | — | % | — | — | % | — | — | % | ||||||||||||||||||||||||||||||||||||||||||||
| Bank debt | — | — | % | — | — | % | 0.4 | — | % | 0.7 | 0.1 | % | 1.3 | 0.1 | % | ||||||||||||||||||||||||||||||||||||||||||||
| Corporate debt securities | 595.0 | 13.2 | % | 564.6 | 12.2 | % | 37.7 | 3.3 | % | 56.8 | 5.4 | % | 66.9 | 6.7 | % | ||||||||||||||||||||||||||||||||||||||||||||
| U.S. government and government agency | 264.3 | 5.9 | % | 1,140.9 | 24.7 | % | 53.2 | 4.6 | % | 99.5 | 9.3 | % | 100.0 | 10.0 | % | ||||||||||||||||||||||||||||||||||||||||||||
| Non-U.S. government and government agency | 101.5 | 2.3 | % | 121.3 | 2.6 | % | — | — | % | — | — | % | 22.0 | 2.2 | % | ||||||||||||||||||||||||||||||||||||||||||||
| U.S. states, municipalities and political subdivision | 0.7 | — | % | 0.9 | — | % | — | — | % | — | — | % | — | — | % | ||||||||||||||||||||||||||||||||||||||||||||
| Preferred stocks | 12.8 | 0.3 | % | 2.8 | 0.1 | % | — | — | % | — | — | % | — | — | % | ||||||||||||||||||||||||||||||||||||||||||||
| Total debt securities | 2,009.3 | 44.7 | % | 2,940.3 | 63.5 | % | 101.3 | 8.7 | % | 186.3 | 17.6 | % | 238.6 | 23.8 | % | ||||||||||||||||||||||||||||||||||||||||||||
| Fixed income mutual funds | 1.9 | — | % | 1.8 | — | % | — | — | % | — | — | % | — | — | % | ||||||||||||||||||||||||||||||||||||||||||||
| Common stocks | 3.1 | 0.1 | % | 4.1 | 0.1 | % | — | — | % | — | — | % | — | — | % | ||||||||||||||||||||||||||||||||||||||||||||
| Total equity securities | 5.0 | 0.1 | % | 5.9 | 0.1 | % | — | — | % | — | — | % | — | — | % | ||||||||||||||||||||||||||||||||||||||||||||
| Short-term investments | 766.7 | 17.0 | % | — | — | % | — | — | % | — | — | % | — | — | % | ||||||||||||||||||||||||||||||||||||||||||||
| Other long-term investments | 322.5 | 7.2 | % | 311.2 | 6.8 | % | 4.0 | 0.3 | % | 4.0 | 0.4 | % | 4.0 | 0.4 | % | ||||||||||||||||||||||||||||||||||||||||||||
| Investments in funds valued at net asset value | 1,395.6 | 31.0 | % | 1,370.7 | 29.6 | % | 1,055.6 | 91.0 | % | 869.0 | 82.0 | % | 758.4 | 75.8 | % | ||||||||||||||||||||||||||||||||||||||||||||
| Total investments | $ | 4,499.1 | 100.0 | % | $ | 4,628.1 | 100.0 | % | $ | 1,160.9 | 100.0 | % | $ | 1,059.3 | 100.0 | % | $ | 1,001.0 | 100.0 | % | |||||||||||||||||||||||||||||||||||||||
Page 16 of 19
SiriusPoint Ltd.
Basic and Diluted Book Value per Share - by Quarter
(expressed in millions of U.S. dollars, except share and per share data)
| June 30, 2021 | March 31, 2021 | December 31, 2020 | September 30, 2020 | June 30, 2020 | |||||||||||||||||||||||||
| Basic and diluted book value per share numerator: | |||||||||||||||||||||||||||||
| Shareholders' equity attributable to SiriusPoint shareholders | $ | 2,680.1 | $ | 2,607.5 | $ | 1,563.9 | $ | 1,427.6 | $ | 1,357.3 | |||||||||||||||||||
| Less: Series B preference shares | (200.0) | (200.0) | — | — | — | ||||||||||||||||||||||||
| Common shareholders’ equity attributable to SiriusPoint common shareholders - basic | 2,480.1 | 2,407.5 | 1,563.9 | 1,427.6 | 1,357.3 | ||||||||||||||||||||||||
| Plus: carrying value of Series A preference shares issued in merger | 38.4 | 40.8 | — | — | — | ||||||||||||||||||||||||
| Common shareholders’ equity attributable to SiriusPoint common shareholders - diluted | 2,518.5 | 2,448.3 | 1,563.9 | 1,427.6 | 1,357.3 | ||||||||||||||||||||||||
| Less: intangible assets | (176.7) | (174.2) | — | — | — | ||||||||||||||||||||||||
| Tangible common shareholders' equity attributable to SiriusPoint common shareholders - basic | 2,303.4 | 2,233.3 | 1,563.9 | 1,427.6 | 1,357.3 | ||||||||||||||||||||||||
| Tangible common shareholders' equity attributable to SiriusPoint common shareholders - diluted | $ | 2,341.8 | $ | 2,274.1 | $ | 1,563.9 | $ | 1,427.6 | $ | 1,357.3 | |||||||||||||||||||
| Basic and diluted book value per share denominator: | |||||||||||||||||||||||||||||
| Common shares outstanding | 161,945,750 | 161,891,354 | 95,582,733 | 95,314,893 | 94,920,203 | ||||||||||||||||||||||||
| Unvested restricted shares | (2,879,187) | (3,450,338) | (2,933,993) | (2,695,127) | (2,319,354) | ||||||||||||||||||||||||
| Basic book value per share denominator | 159,066,563 | 158,441,016 | 92,648,740 | 92,619,766 | 92,600,849 | ||||||||||||||||||||||||
| Effect of dilutive Series A preference shares issued in merger | 2,088,464 | 1,888,145 | — | — | — | ||||||||||||||||||||||||
| Effect of dilutive warrants (1) | 24,295 | 58,421 | — | — | — | ||||||||||||||||||||||||
| Effect of dilutive stock options, restricted shares and restricted share units issued to directors and employees (2) | 2,629,954 | 2,426,816 | 969,386 | 284,486 | 227,204 | ||||||||||||||||||||||||
| Diluted book value per share denominator | 163,809,276 | 162,814,398 | 93,618,126 | 92,904,252 | 92,828,053 | ||||||||||||||||||||||||
Basic book value per share (2) | $ | 15.59 | $ | 15.19 | $ | 16.88 | $ | 15.41 | $ | 14.66 | |||||||||||||||||||
Tangible basic book value per share (2) | $ | 14.48 | $ | 14.10 | $ | 16.88 | $ | 15.41 | $ | 14.66 | |||||||||||||||||||
Diluted book value per share (2) (3) | $ | 15.37 | $ | 15.04 | $ | 16.71 | $ | 15.37 | $ | 14.62 | |||||||||||||||||||
Tangible diluted book value per share (2) | $ | 14.30 | $ | 13.97 | $ | 16.71 | $ | 15.37 | $ | 14.62 | |||||||||||||||||||
(1)As of December 31, 2020, September 30, 2020 and June 30, 2020, there was no dilution as a result of the Company’s share price being under the lowest exercise price for warrants.
(2)Basic book value per share, tangible basic book value per share, diluted book value per share and tangible diluted book value per share are non-GAAP financial measures. Basic book value per share, as presented, is a non-GAAP financial measure and is calculated by dividing common shareholders’ equity attributable to SiriusPoint common shareholders by the number of common shares outstanding, excluding the total number of issued unvested restricted shares, at period end. Tangible basic book value per share, as presented, is a non-GAAP financial measure and is calculated by dividing tangible common shareholders’ equity attributable to SiriusPoint common shareholders by the number of common shares outstanding, excluding the total number of unvested restricted shares, at period end. Tangible book value per share is useful to investors because it measures the realizable value of shareholder returns, excluding the impact of intangible assets. Diluted book value per share and tangible diluted book value per share, as presented, are non-GAAP financial measures and are calculated using the treasury stock method. Under the treasury stock method, we assume that proceeds received from in-the-money options and/or warrants exercised are used to repurchase common shares in the market. The dilutive effect of restricted shares, restricted share units and options are calculated in a manner consistent with how dilution is calculated using the treasury stock method for earnings per share. We have also followed a similar approach for calculating dilution for warrants, Series A preference shares, Upside Rights and other potentially dilutive securities issued as part of our acquisition of Sirius Group.
(3)In the first quarter of 2021, we changed the method for calculating the dilutive effect of restricted shares, restricted share units and options to calculate the dilutive impact in a manner consistent with how dilution is calculated using the treasury stock method for earnings per share. This change had no impact on previously presented basic book value per share.
Page 17 of 19
SiriusPoint Ltd.
Earnings per Share - by Quarter
(expressed in millions of U.S. dollars, except share and per share data)
| June 30, 2021 | March 31, 2021 | December 31, 2020 | September 30, 2020 | June 30, 2020 | ||||||||||||||||||||||||||||
| Weighted-average number of common shares outstanding: | ||||||||||||||||||||||||||||||||
| Basic number of common shares outstanding | 158,832,629 | 116,760,760 | 92,638,978 | 92,613,393 | 92,593,599 | |||||||||||||||||||||||||||
Dilutive effect of options (1) | 313,758 | 184,470 | — | — | — | |||||||||||||||||||||||||||
Dilutive effect of warrants (1) | 160,075 | 51,650 | — | — | — | |||||||||||||||||||||||||||
| Dilutive effect of restricted share units | 1,587,754 | 1,149,461 | 526,581 | 356,253 | 144,694 | |||||||||||||||||||||||||||
| Diluted number of common shares outstanding | 160,894,216 | 118,146,341 | 93,165,559 | 92,969,646 | 92,738,293 | |||||||||||||||||||||||||||
| Basic earnings per common share: | ||||||||||||||||||||||||||||||||
| Net income available to SiriusPoint common shareholders | $ | 64.5 | $ | 130.9 | $ | 134.4 | $ | 68.7 | $ | 124.0 | ||||||||||||||||||||||
| Net income allocated to SiriusPoint participating common shareholders | (5.4) | (6.5) | (1.6) | (0.5) | (0.7) | |||||||||||||||||||||||||||
| Net income allocated to SiriusPoint common shareholders | $ | 59.1 | $ | 124.4 | $ | 132.8 | $ | 68.2 | $ | 123.3 | ||||||||||||||||||||||
| Basic earnings per share available to SiriusPoint common shareholders | $ | 0.37 | $ | 1.07 | $ | 1.43 | $ | 0.74 | $ | 1.33 | ||||||||||||||||||||||
| Diluted earnings per common share: | ||||||||||||||||||||||||||||||||
| Net income available to SiriusPoint common shareholders | $ | 64.5 | $ | 130.9 | $ | 134.4 | $ | 68.7 | $ | 124.0 | ||||||||||||||||||||||
| Net income allocated to SiriusPoint participating common shareholders | (5.4) | (6.5) | (1.6) | (0.5) | (0.7) | |||||||||||||||||||||||||||
| Net income allocated to SiriusPoint common shareholders | $ | 59.1 | $ | 124.4 | $ | 132.8 | $ | 68.2 | $ | 123.3 | ||||||||||||||||||||||
| Diluted earnings per share available to SiriusPoint common shareholders (2) | $ | 0.37 | $ | 1.05 | $ | 1.43 | $ | 0.73 | $ | 1.33 | ||||||||||||||||||||||
(1)As of December 31, 2020, September 30, 2020 and June 30, 2020, there was no dilution as a result of the Company’s average share price for the quarter being under the lowest exercise price for warrants and options.
(2)Basic earnings per share is based on the weighted average number of common shares and participating securities outstanding during the period. The weighted average number of common shares excludes any dilutive effect of outstanding warrants, options and unvested restricted shares. Diluted earnings per share is based on the weighted average number of common shares and participating securities outstanding and includes any dilutive effects of warrants, options and unvested restricted shares under share plans and are determined using the treasury stock method. U.S. GAAP requires that participating securities, be treated in the same manner as outstanding shares for earnings per share calculations. The Company treats certain of its unvested restricted shares as participating securities. In the event of a net loss, all participating securities, outstanding warrants, options and restricted shares are excluded from both basic and diluted loss per share since their inclusion would be anti-dilutive.
Page 18 of 19
SiriusPoint Ltd.
Annualized Return on Average Common Shareholders’ Equity - by Quarter
(expressed in millions of U.S. dollars, except share and per share data and ratios)
| June 30, 2021 | March 31, 2021 | December 31, 2020 | September 30, 2020 | June 30, 2020 | ||||||||||||||||||||||||||||
| Net income available to SiriusPoint common shareholders | $ | 64.5 | $ | 130.9 | $ | 134.4 | $ | 68.7 | $ | 124.0 | ||||||||||||||||||||||
| Shareholders’ equity attributable to SiriusPoint common shareholders - beginning of period | 2,407.5 | 1,563.9 | 1,427.6 | 1,357.3 | 1,231.7 | |||||||||||||||||||||||||||
| Shareholders’ equity attributable to SiriusPoint common shareholders - end of period | 2,480.1 | 2,407.5 | 1,563.9 | 1,427.6 | 1,357.3 | |||||||||||||||||||||||||||
| Average shareholders’ equity attributable to SiriusPoint common shareholders | $ | 2,443.8 | $ | 1,985.7 | $ | 1,495.7 | $ | 1,392.4 | $ | 1,294.5 | ||||||||||||||||||||||
Annualized return on average common shareholders’ equity attributable to SiriusPoint common shareholders (1) | 10.6 | % | 26.4 | % | 35.9 | % | 19.7 | % | 38.3 | % | ||||||||||||||||||||||
(1)Annualized return on average common shareholders’ equity attributable to SiriusPoint common shareholders is calculated by dividing annualized net income (loss) available to SiriusPoint common shareholders for the period by the average common shareholders’ equity determined using the common shareholders' equity balances at the beginning and end of the period.
Page 19 of 19

August 2021 siriuspt.com A TOP 20 STRONGLY CAPITALIZED AND WELL POSITIONED GLOBAL (RE)INSURER Top 20 Global (re)insurer per S&P Global’s 2020 Global Reinsurance Highlights;
DISCLAIMER For informational purposes only 2 Forward‐ Looking Statements We make statements in this presentation that are “forward‐looking statements” within the meaning of the Private Securities Litigation Reform Act of 1995. The Company cautions you that the forward‐looking information presented in this press release is not a guarantee of future events, and that actual events may differ materially from those made in or suggested by the forward‐ looking information contained in this press release. In addition, forward‐looking statements generally can be identified by the use of forward‐looking terminology such as “may,” “plan,” “seek,” “comfortable with,” “will,” “expect,” “intend,” “estimate,” “anticipate,” “believe” or “continue” or the negative thereof or variations thereon or similar terminology. Actual events, results and outcomes may differ materially from the Company’s expectations due to a variety of known and unknown risks, uncertainties and other factors. Among the risks and uncertainties that could cause actual results to differ from those described in the forward‐looking statements are the following: the costs, expense and difficulties of the integration of the operations of Sirius International Insurance Group, Ltd.; the impact of the novel coronavirus (COVID‐19) pandemic or other unpredictable catastrophic events; fluctuations in our results of operations; a downgrade or withdrawal of our financial ratings; inadequacy of loss and loss adjustment expenses reserves; the effects of global climate change; periods characterized by excess underwriting capacity and unfavorable premium rates; reduced returns or losses in SiriusPoint’s investment portfolio; adverse changes in interest rates, foreign currency exchange rates, equity markets, debt markets or market volatility; legal restrictions on certain of SiriusPoint’s insurance and reinsurance subsidiaries’ ability to pay dividends and other distributions to SiriusPoint; SiriusPoint’s significant deferred tax assets, which could become devalued if either SiriusPoint does not generate sufficient future taxable income or applicable corporate tax rates are reduced; the lack of availability of capital; future strategic transactions such as acquisitions, dispositions, mergers, investments or joint ventures; technology breaches; our concentrated exposure in Third Point Enhanced LP (the “TP Enhanced Fund”) whose investment strategy may bear substantial investment risks; conflicts of interest among various members of TP Enhanced Fund, Third Point LLC and SiriusPoint; and other risks and uncertainties listed in the Company's Quarterly Report on Form 10‐Q for the quarters ended March 31, 2021 and June 30, 2021, and any subsequent reports filed with the Securities and Exchange Commission. All forward‐looking statements speak only as of the date made and the Company undertakes no obligation to update or revise publicly any forward‐looking statements, whether as a result of new information, future events or otherwise.. Non‐GAAP Financial Measures This presentation may also contain non‐GAAP financial information. SiriusPoint’s management uses this information in its internal analysis of results and believes that this information may be informative to investors in gauging the quality of SiriusPoint’s financial performance, identifying trends in our results and providing meaningful period‐to‐period comparisons. Book value per share metrics are non‐GAAP financial measures, and there are no comparable GAAP measures. We believe that long‐term growth in book value per share is an important measure of our financial performance because it allows our management and investors to track over time the value created by the retention of earnings. In addition, we believe this metric is used by investors because it provides a basis for comparison with other companies in our industry that also report a similar measure.

CONTENTS For informational purposes only 3 4 SIRIUSPOINT: A STRONG GLOBAL REINSURER 5 ACCOMPLISHED SENIOR MANAGEMENT TEAM 6 PROVENMANAGEMENT TEAM WITH SHARED VALUES 13 SIRIUSPOINT LTD. ISSUED CAPITAL INSTRUMENTS AS AT JUNE 30, 2021 8 SIRIUSPOINT PLATFORM UNDERWRITING CAPABILITIES, GEOGRAPHIC FOOTPRINT AND PRODUCT OFFERINGS 9 BUSINESS SEGMENTS 10 SIRIUSPOINT INVESTMENT PORTFOLIO 7 OVERVIEW OF SIRIUSPOINT: KEY HIGHLIGHTS 11 GROWING OUR BUSINESS AND ADDING VALUE APPENDIX
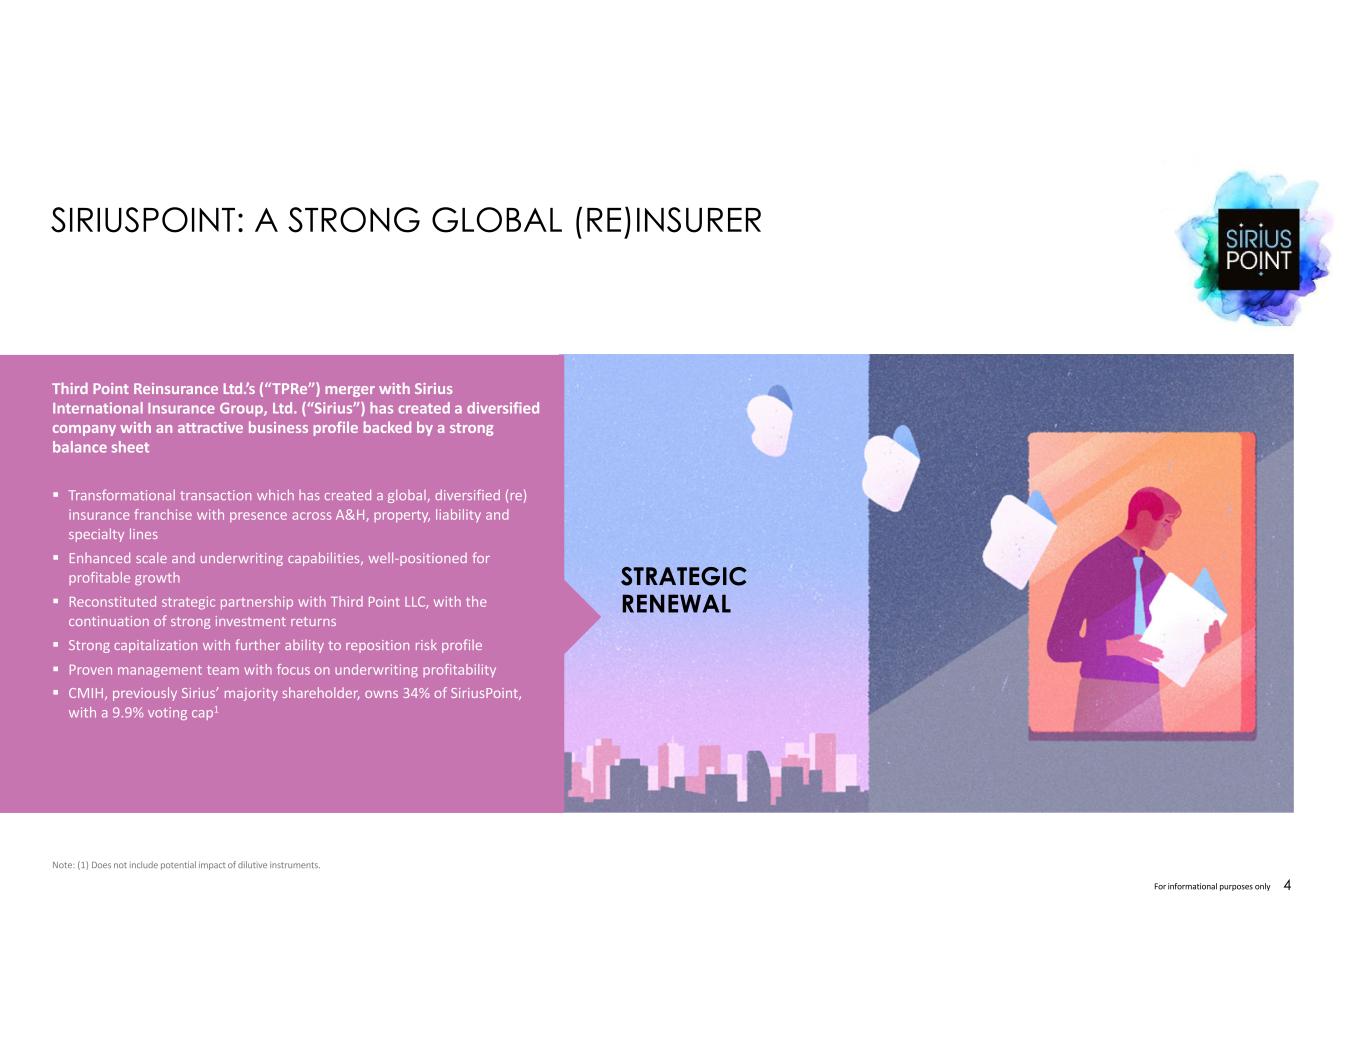
SIRIUSPOINT: A STRONG GLOBAL (RE)INSURER For informational purposes only 4 STRATEGIC RENEWAL Third Point Reinsurance Ltd.’s (“TPRe”) merger with Sirius International Insurance Group, Ltd. (“Sirius”) has created a diversified company with an attractive business profile backed by a strong balance sheet Transformational transaction which has created a global, diversified (re) insurance franchise with presence across A&H, property, liability and specialty lines Enhanced scale and underwriting capabilities, well‐positioned for profitable growth Reconstituted strategic partnership with Third Point LLC, with the continuation of strong investment returns Strong capitalization with further ability to reposition risk profile Proven management team with focus on underwriting profitability CMIH, previously Sirius’ majority shareholder, owns 34% of SiriusPoint, with a 9.9% voting cap1 Note: (1) Does not include potential impact of dilutive instruments.

EXECUTIVE LEADERSHIP TEAM 5 Monica Cramér Manhem President, International Reinsurance Vievette Henry Chief People Officer Prashanth Gangu Chief Operating Officer and President, Insurance and Services SEGMENT LEADERS

PROVEN MANAGEMENT TEAM WITH SHARED VALUES For informational purposes only 6 The SiriusPoint Board is comprised of individuals with deep industry and business experience, including two new appointments which were announced upon the closing of the merger. • Franklin (Tad) Montross, the former Chairman and Chief Executive Officer of General Reinsurance, who brings 43 years of experience in the (re)insurance industry to the SiriusPoint board • Sharon M. Ludlow, a seasoned C‐suite executive and corporate director, with more than 25 years of experience in the Life and Health, and Property and Casualty re‐insurance industries. During the course of her career, Ms. Ludlow served as President and CEO of the Canadian operations of Swiss Re and as President of Aviva Insurance Company of Canada Significant global underwriting talent: • Nick Campbell, Global Head of Specialty • Patrick Chamberland, EVP International Reinsurance • Stuart Liddell, Global President of Accident & Health • Jan Onselius, Chief Underwriting Officer, International Reinsurance • Ian Sawyer, Global Head of Casualty • Warren Trace, Head of US and Canada • Tim Mardon, Global Head of Property Reinsurance
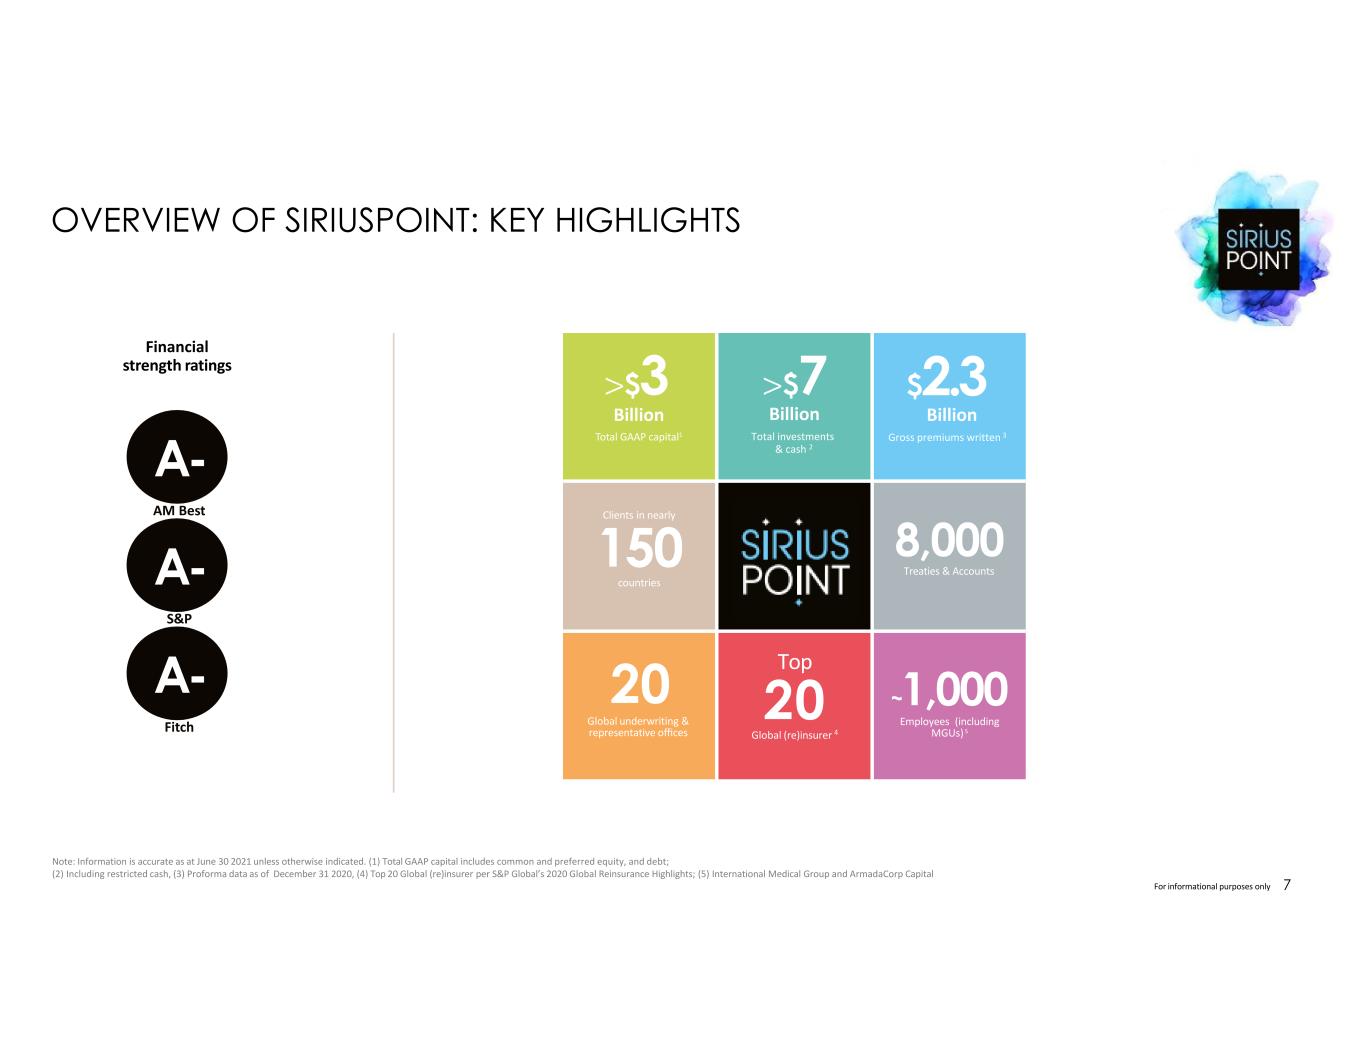
A- AM Best A- S&P A- Fitch Financial strength ratings $3 Billion Total GAAP capital1 $7 Billion Total investments & cash 2 $2.3 Billion Gross premiums written 3 Clients in nearly 150 countries 8,000 Treaties & Accounts 20 Global underwriting & representative offices Top 20 Global (re)insurer 4 ~1,000 Employees (including MGUs)5 OVERVIEW OF SIRIUSPOINT: KEY HIGHLIGHTS For informational purposes only 7 Note: Information is accurate as at June 30 2021 unless otherwise indicated. (1) Total GAAP capital includes common and preferred equity, and debt; (2) Including restricted cash, (3) Proforma data as of December 31 2020, (4) Top 20 Global (re)insurer per S&P Global’s 2020 Global Reinsurance Highlights; (5) International Medical Group and ArmadaCorp Capital
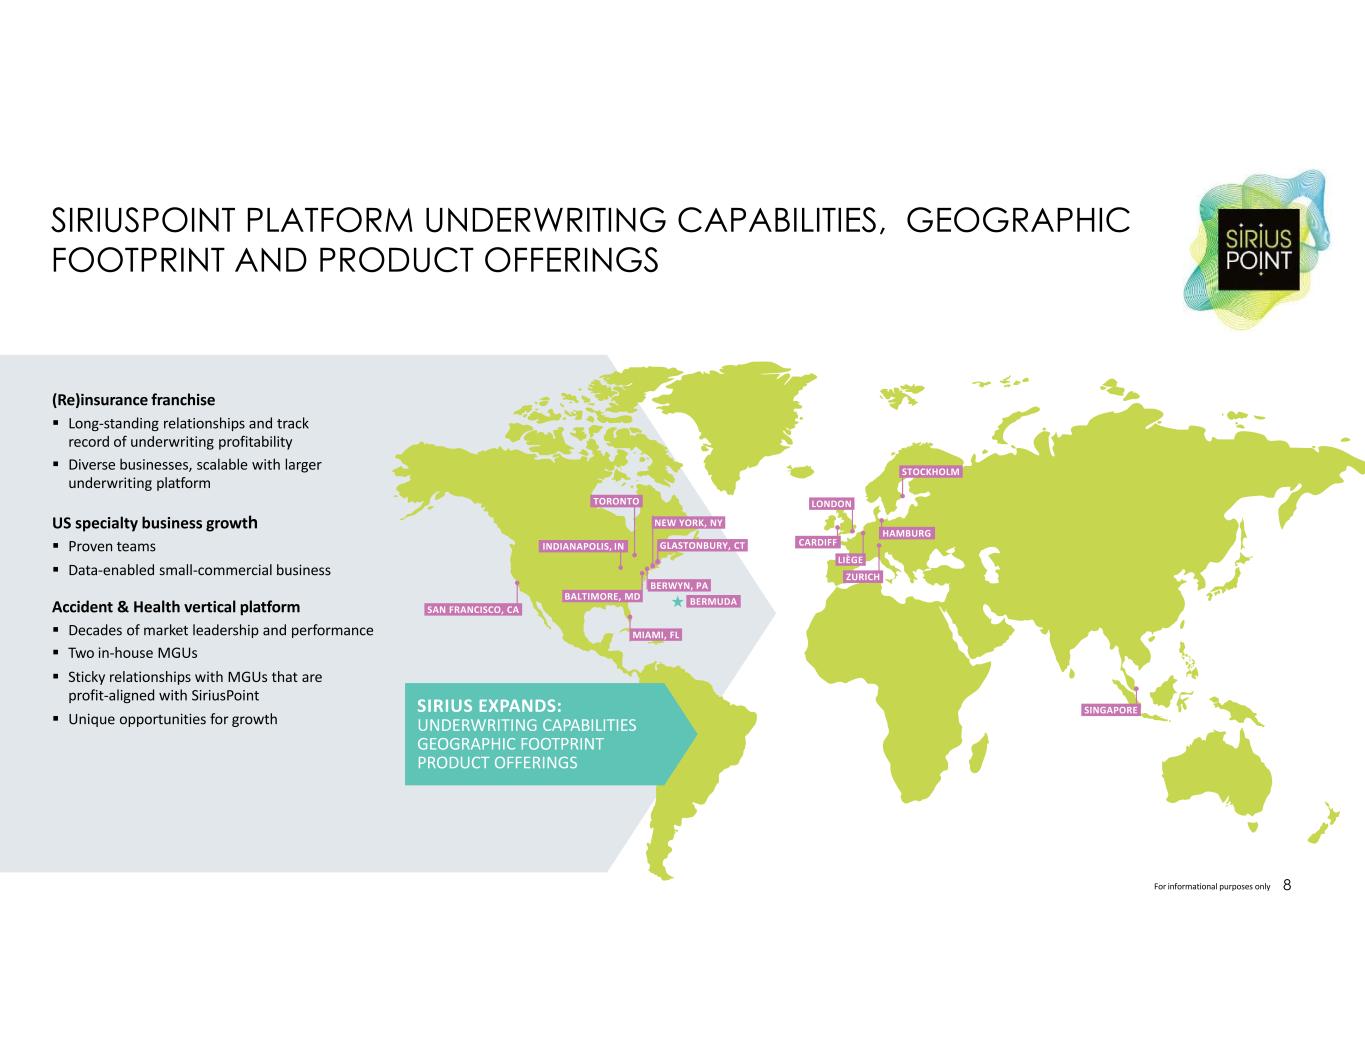
SIRIUSPOINT PLATFORM UNDERWRITING CAPABILITIES, GEOGRAPHIC FOOTPRINT AND PRODUCT OFFERINGS For informational purposes only 8 (Re)insurance franchise Long‐standing relationships and track record of underwriting profitability Diverse businesses, scalable with larger underwriting platform US specialty business growth Proven teams Data‐enabled small‐commercial business Accident & Health vertical platform Decades of market leadership and performance Two in‐house MGUs Sticky relationships with MGUs that are profit‐aligned with SiriusPoint Unique opportunities for growth GLASTONBURY, CT BERWYN, PA LONDON BALTIMORE, MD MIAMI, FL BERMUDA SIRIUS EXPANDS: UNDERWRITING CAPABILITIES GEOGRAPHIC FOOTPRINT PRODUCT OFFERINGS NEW YORK, NY SAN FRANCISCO, CA INDIANAPOLIS, IN TORONTO CARDIFF STOCKHOLM HAMBURG ZURICH LIÈGE SINGAPORE
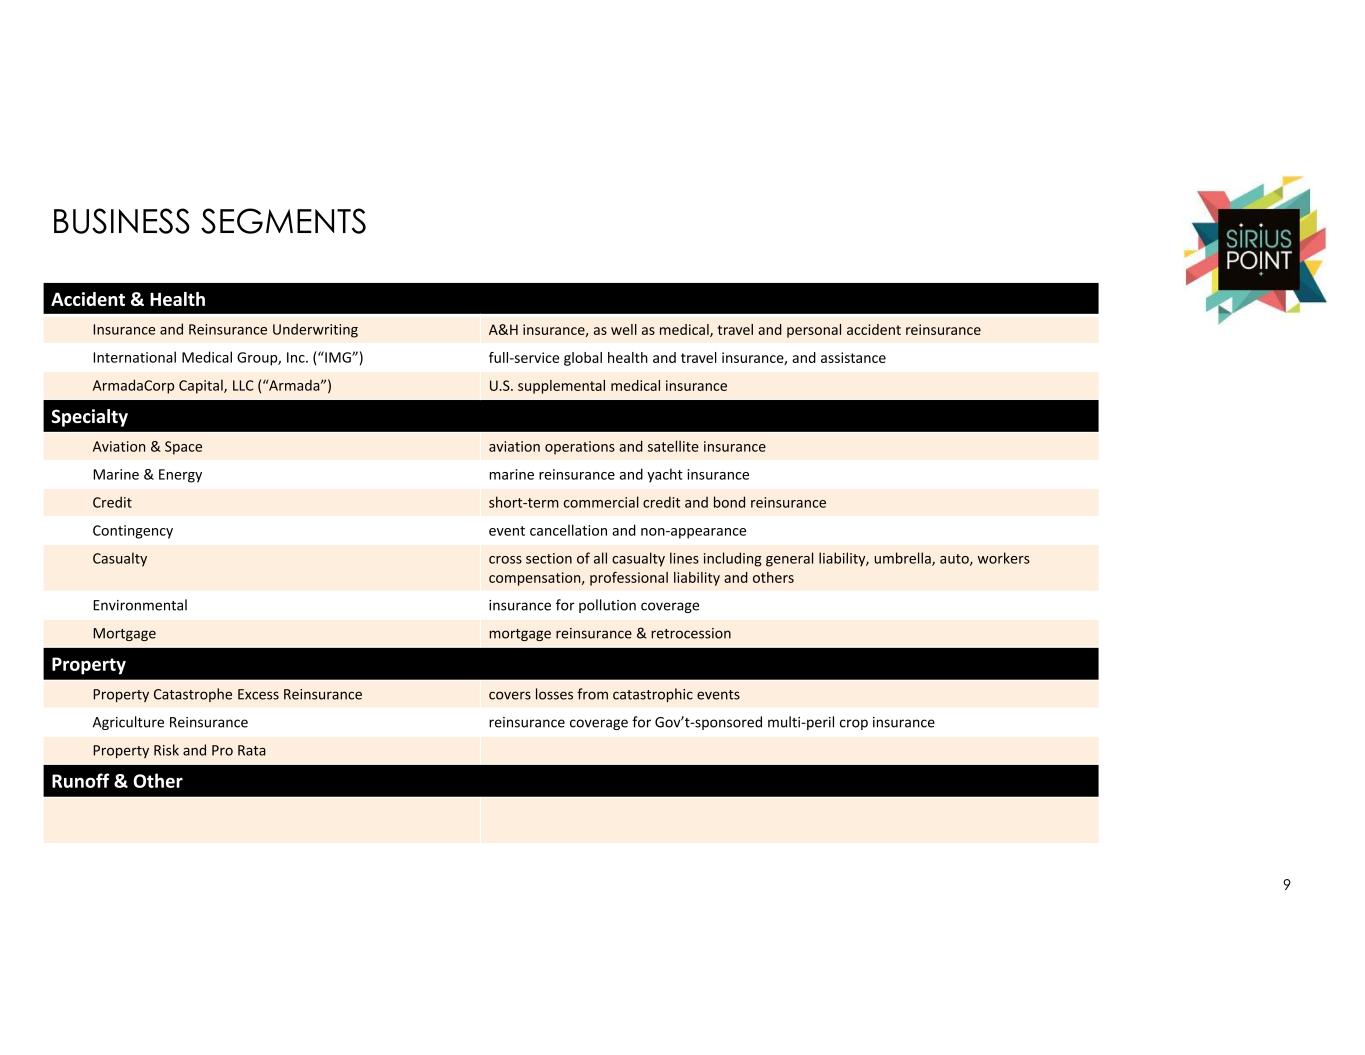
BUSINESS SEGMENTS 9 Accident & Health Insurance and Reinsurance Underwriting A&H insurance, as well as medical, travel and personal accident reinsurance International Medical Group, Inc. (“IMG”) full‐service global health and travel insurance, and assistance ArmadaCorp Capital, LLC (“Armada”) U.S. supplemental medical insurance Specialty Aviation & Space aviation operations and satellite insurance Marine & Energy marine reinsurance and yacht insurance Credit short‐term commercial credit and bond reinsurance Contingency event cancellation and non‐appearance Casualty cross section of all casualty lines including general liability, umbrella, auto, workers compensation, professional liability and others Environmental insurance for pollution coverage Mortgage mortgage reinsurance & retrocession Property Property Catastrophe Excess Reinsurance covers losses from catastrophic events Agriculture Reinsurance reinsurance coverage for Gov’t‐sponsored multi‐peril crop insurance Property Risk and Pro Rata Runoff & Other
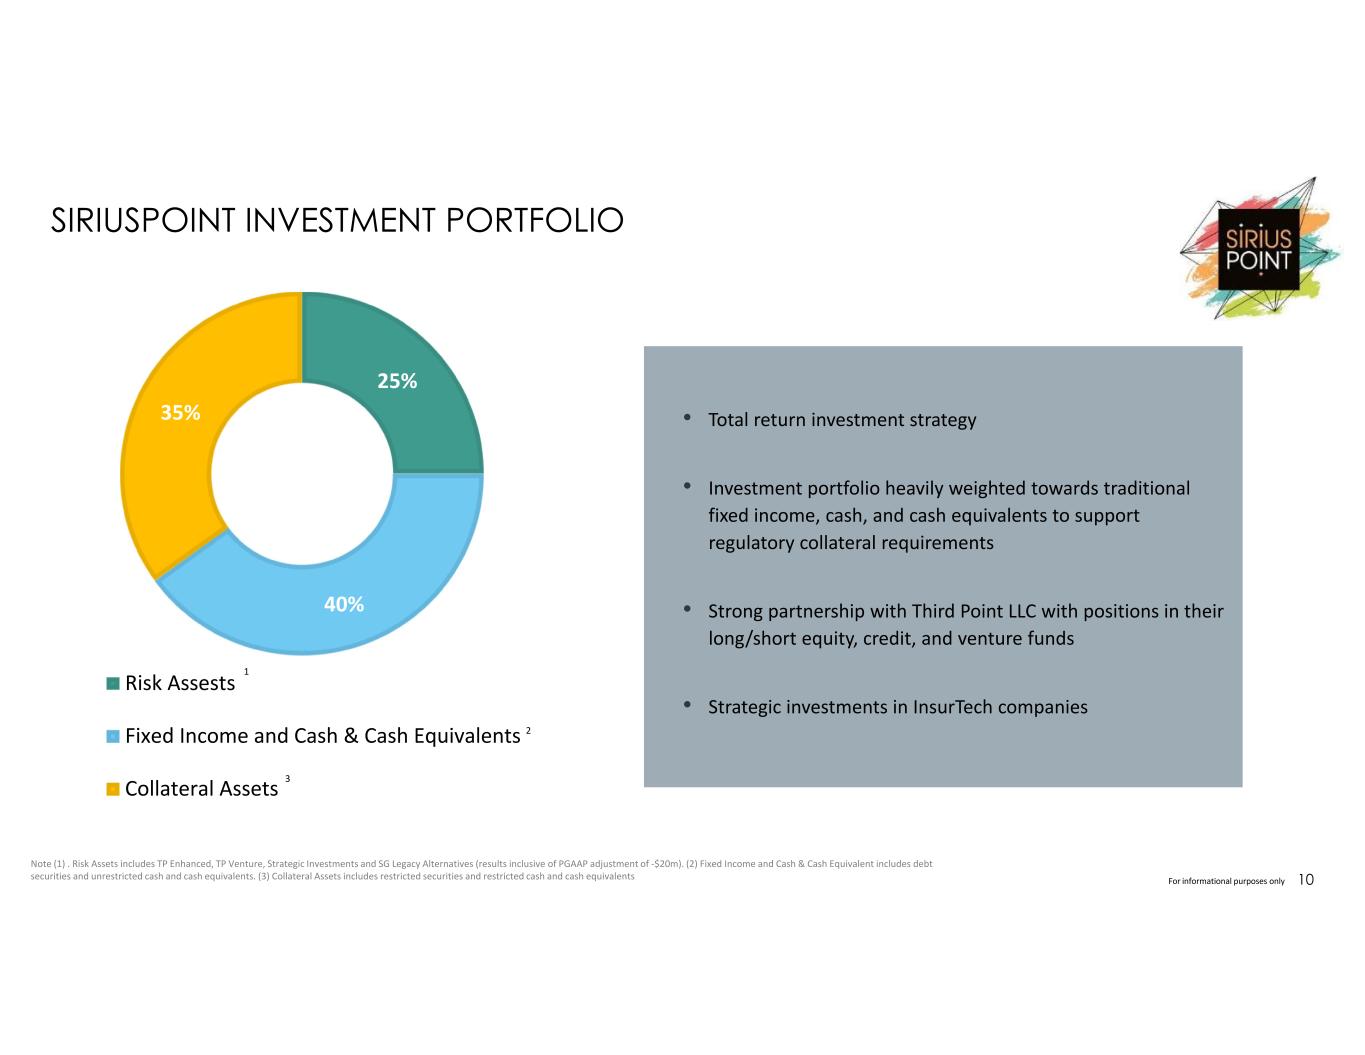
SIRIUSPOINT INVESTMENT PORTFOLIO For informational purposes only 10 • Total return investment strategy • Investment portfolio heavily weighted towards traditional fixed income, cash, and cash equivalents to support regulatory collateral requirements • Strong partnership with Third Point LLC with positions in their long/short equity, credit, and venture funds • Strategic investments in InsurTech companies Note (1) . Risk Assets includes TP Enhanced, TP Venture, Strategic Investments and SG Legacy Alternatives (results inclusive of PGAAP adjustment of ‐$20m). (2) Fixed Income and Cash & Cash Equivalent includes debt securities and unrestricted cash and cash equivalents. (3) Collateral Assets includes restricted securities and restricted cash and cash equivalents 1 2 3 25% 40% 35% Risk Assests Fixed Income and Cash & Cash Equivalents Collateral Assets 1 2 3

Transitioning to a Specialty (Re)insurer Attracting experienced talent Expanding into higher margin business lines Improving profitability Capital markets expertise to drive value via strategic partnerships Best‐in‐class investment manager Designed to deliver attractive risk adjusted returns VISION: TO GROW OUR BUSINESS, CREATE VALUE AND POSITIVELY IMPACT A CHANGING WORLD BY BEING THE MOST ADAPTIVE (RE)INSURER IN THE MARKET GROWING OUR BUSINESS AND CREATING VALUE For informational purposes only 11

PRESENTATION TITLE OES HERE APPENDIX 12For informational purposes only
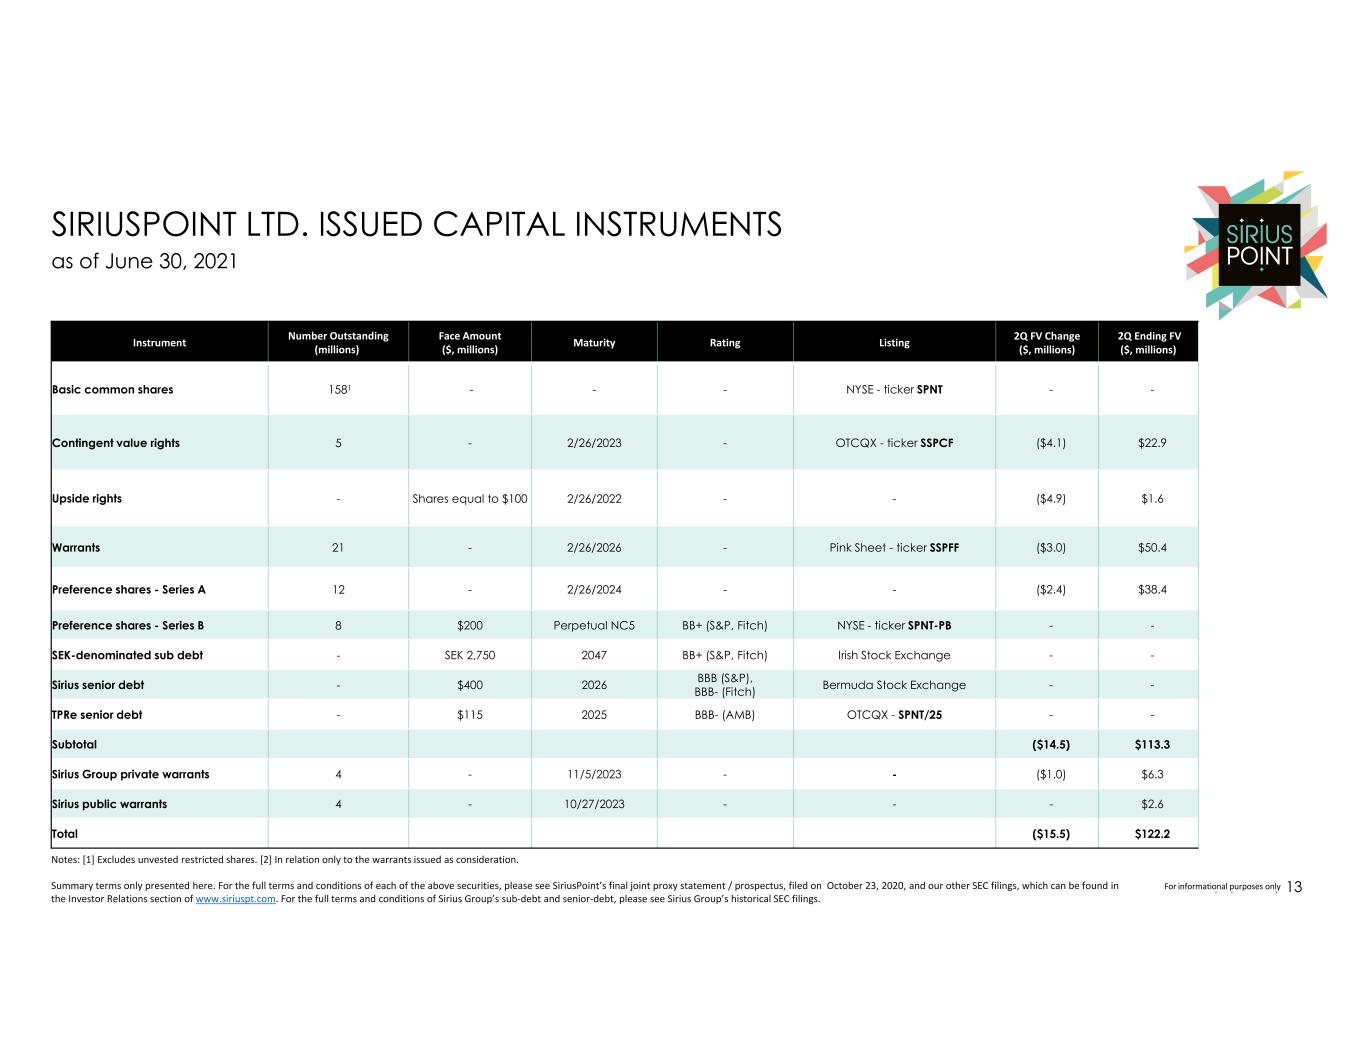
For information purposes only SIRIUSPOINT LTD. ISSUED CAPITAL INSTRUMENTS Notes: [1] Excludes unvested restricted shares. [2] In relation only to the warrants issued as consideration. Summary terms only presented here. For the full terms and conditions of each of the above securities, please see SiriusPoint’s final joint proxy statement / prospectus, filed on October 23, 2020, and our other SEC filings, which can be found in the Investor Relations section of www.siriuspt.com. For the full terms and conditions of Sirius Group’s sub‐debt and senior‐debt, please see Sirius Group’s historical SEC filings. as of June 30, 2021 Instrument Number Outstanding (millions) Face Amount ($, millions) Maturity Rating Listing 2Q FV Change ($, millions) 2Q Ending FV ($, millions) Basic common shares 1581 - - - NYSE - ticker SPNT - - Contingent value rights 5 - 2/26/2023 - OTCQX - ticker SSPCF ($4.1) $22.9 Upside rights - Shares equal to $100 2/26/2022 - - ($4.9) $1.6 Warrants 21 - 2/26/2026 - Pink Sheet - ticker SSPFF ($3.0) $50.4 Preference shares - Series A 12 - 2/26/2024 - - ($2.4) $38.4 Preference shares - Series B 8 $200 Perpetual NC5 BB+ (S&P, Fitch) NYSE - ticker SPNT-PB - - SEK-denominated sub debt - SEK 2,750 2047 BB+ (S&P, Fitch) Irish Stock Exchange - - Sirius senior debt - $400 2026 BBB (S&P), BBB- (Fitch) Bermuda Stock Exchange - - TPRe senior debt - $115 2025 BBB- (AMB) OTCQX - SPNT/25 - - Subtotal ($14.5) $113.3 Sirius Group private warrants 4 - 11/5/2023 - - ($1.0) $6.3 Sirius public warrants 4 - 10/27/2023 - - - $2.6 Total ($15.5) $122.2 13F r informational urposes only

For information purposes only THANK YOU