
SRXH 8-K
SRX Global Inc. (SRXH)
8-K
2021-08-12
For: 2021-08-12
View Original
Added on
April 11, 2026
UNITED STATES
SECURITIES AND EXCHANGE COMMISSION
Washington, D.C. 20549
_______________________
FORM 8-K
_______________________
CURRENT REPORT
PURSUANT TO SECTION 13 OR 15(d)
OF THE SECURITIES EXCHANGE ACT OF 1934
Date of Report (Date of earliest event reported): August 12, 2021
_______________________
(Exact name of Registrant as Specified in its Charter)
_______________________
| (State or other Jurisdiction of Incorporation) | (Commission File Number) | (IRS Employer Identification No.) | ||||||
(Address of Principal Executive Offices) (Zip Code)
_______________________________________________
(Registrant's Telephone Number, Including Area Code): (813 ) 659-5921
N/A
(Former name or former address, if changed since last report.)
_______________________
Check the appropriate box below if the Form 8-K filing is intended to simultaneously satisfy the filing obligation of the registrant under any of the following provisions:
| Written communications pursuant to Rule 425 under the Securities Act (17 CFR 230.425) | |||||
| Soliciting material pursuant to Rule 14a-12 under the Exchange Act (17 CFR 240.14a-12) | |||||
| Pre-commencement communications pursuant to Rule 14d-2(b) under the Exchange Act (17 CFR 240.14d-2(b)) | |||||
| Pre-commencement communications pursuant to Rule 13e-4(c) under the Exchange Act (17 CFR 240.13e-4(c)) | |||||
Securities registered pursuant to Section 12(b) of the Act:
Title of each class | Trading Symbol(s) | Name of each exchange on which registered | ||||||
Indicate by check mark whether the registrant is an emerging growth company as defined in Rule 405 of the Securities Act of 1933 (§230.405 of this chapter) or Rule 12b-2 of the Securities Exchange Act of 1934 (§240.12b-2 of this chapter).
Emerging growth company ☐
If an emerging growth company, indicate by check mark if the registrant has elected not to use the extended transition period for complying with any new or revised financial accounting standards provided pursuant to Section 13(a) of the Exchange Act. ☐
Item 2.02 Results of Operations and Financial Condition
On August 12, 2021, Better Choice Company Inc., a Delaware corporation (the “Company”), announced its financial results for the quarter ended June 30, 2021. A copy of the press release is attached hereto as Exhibit 99.1.
Item 7.01 Regulation FD Disclosure
Better Choice Second Quarter 2021 Financial Results Conference Call
On August 12, 2021, at 8:30 am EDT, the Company will host a conference call to discuss results for the second quarter ended June 30, 2021. Interested parties, including analysts, investors and the media, may listen live via the details below.
| Event: | Better Choice Second Quarter 2021 Earnings Call | ||||
| Date: | Thursday, August 12, 2021 | ||||
| Time: | 8:30 a.m. Eastern Time | ||||
| Live Call: | +1-855-327-6837 (U.S. Toll-Free) or +1-631-891-4304 (International) | ||||
| Webcast: | http://public.viavid.com/index.php?id=145923 | ||||
Updated Investor Presentation
On August 12, 2021, the Company posted an updated investor presentation (the “Investor Presentation”) to its website and it is available in the Company Info section of the Company’s website at https://ir.betterchoicecompany.com/company-information/presentations. A copy of the Investor Presentation is included as Exhibit 99.2 to this Current Report.
The Company intends to use the Investor Presentation in presentations to investors and analysts from time to time in the future. The furnishing of the information in this Current Report is not intended to, and does not, constitute a determination by the Company that the information in this Current Report is material or complete, or that investors should consider this information before making an investment decision with respect to any security of the Company. The information in the materials is presented as of August 12, 2021, and the Company does not assume any obligation to update such information in the future.
The information in Item 7.01 of this Current Report shall not be deemed to be "filed" for the purposes of Section 18 of the Securities and Exchange Act of 1934, as amended (the “Exchange Act”), or otherwise subject to the liabilities of such section, nor shall such information be deemed incorporated by reference in any filing under the Securities Act of 1933, as amended, or the Exchange Act, except as shall be expressly set forth by specific reference in such a filing.
Cautionary Note Regarding Forward-Looking Statements
This Current Report on Form 8-K contains statements that constitute "forward-looking statements" within the meaning of the Private Securities Litigation Reform Act of 1995. Management's projections and expectations are subject to a number of risks and uncertainties that could cause actual performance to differ materially from that predicted or implied. Forward-looking statements may be identified by the use of words such as "expect," "anticipate," "believe," "estimate," "potential," "should" or similar words intended to identify information that is not historical in nature. Forward-looking statements contained herein include, among others, statements concerning management's expectations about future events and the Company’s operating plans and performance, the effects of the COVID-19 outbreak, including levels of consumer, business and economic confidence generally, the regulatory environment, litigation, sales, and the expected benefits of acquisitions, and such statements are based on the current beliefs and expectations of the Company’s management, as applicable, and are subject to known and unknown risks and uncertainties. There are a number of risks and uncertainties that could cause actual results to differ materially from those contemplated by the forward-looking statements. These statements speak only as of the date they are made, and the Company does not intend to update or otherwise revise the forward-looking information to reflect actual results of operations, changes in financial condition, changes in estimates, expectations or assumptions, changes in general economic or industry conditions or other circumstances arising and/or existing since the preparation of this Current Report on Form 8-K or to reflect the occurrence of any unanticipated events. For further information regarding the risks associated with the Company’s business, please refer to the Company’s filings with the Securities and Exchange Commission, including our Annual Report on Form 10-K for the most recent fiscal year end, Quarterly Reports on Form 10-Q and Current Reports on Form 8-K.
Item 9.01 Financial Statements and Exhibits
(d) Exhibits.
| Exhibits | Description | ||||
2
SIGNATURE
Pursuant to the requirements of the Securities Exchange Act of 1934, the Registrant has duly caused this report to be signed on its behalf by the undersigned hereunto duly authorized.
| Better Choice Company Inc. | |||||||||||
| By: | /s/ Sharla A. Cook | ||||||||||
| Name: | Sharla A. Cook | ||||||||||
| Title: | Chief Financial Officer | ||||||||||
| August 12, 2021 | |||||||||||
3

Better Choice Company Reports Second Quarter 2021 Financial Results
NEW YORK, NY, August 12, 2021 -- Better Choice Company Inc. (NYSE: BTTR) (the “Company” or “Better Choice”), an animal health and wellness company, today reported its financial results for the second quarter ended June 30, 2021.
“We are pleased to share our second quarter 2021 results with the investor community. Our performance in the second quarter of 2021 continued the momentum from our strong Q1 results, as we delivered 11% quarter-over-quarter net revenue growth driven by our international channel. We continue to make meaningful progress on our medium and longer-term strategic initiatives, and remain well positioned with the anticipation of our expanded Halo brand launch in the pet specialty channel in 2022,” said Scott Lerner, CEO of Better Choice.
“We believe we have created a strong foundation for growth through our diverse omni-channel approach. This strategy allows us to market products purpose-built for success in specific channels while simultaneously building our brand across all channels,” continued Mr. Lerner. “Further, like many of our peers in the pet food industry, we believe we are successfully navigating the challenges of operating in an inflationary environment, and I strongly believe that our multi-channel strategy provides a competitive advantage in this regard. With a line of high-quality brands poised for growth and led by a team of industry veterans, I continue to have a high degree of confidence we'll achieve our mission to become the most innovative premium pet food company in the world.”
Second Quarter 2021 and Subsequent Operational Updates
•Successfully completed an uplist to the NYSE American Exchange, raising $40m of gross proceeds at ~3x 2020 net sales and automatically converting $23m of debt into common equity upon listing.
•Significant incremental investment in innovation and developing a three-year pipeline of new offerings to drive organic growth.
•Generated $5.2m of online net sales in Q2 2021, with ~51% of online purchases made via recurring subscription.
•Realized $4.1m International Sales in Q2, representing 72% quarter-over-quarter growth.
•Continued to navigate the COVID-19 pandemic while minimizing cash burn and establishing a strong base for growth in our core channels: E-Commerce, direct-to-consumer ("DTC"), Brick & Mortar and International.
•In July, secured an agreement with Pet Supplies Plus, the third largest pet specialty retailer in the United States, to launch Halo Elevate nationally in 2022.
Financial Results for the Second Quarter and Year-to-Date 2021
•Second Quarter 2021 Gross Sales of $13.1m
•Year-to-date 2021 Gross Sales of $26.5m
•Second Quarter 2021 Net Sales of $11.0m
•Year-to-date 2021 Net Sales of $21.8m
•Second Quarter 2021 Loss from Operations of $3.2m
•Year-to-date 2021 Loss from Operations of $8.3m
•Second Quarter 2021 Net income available to common stockholders of $24.8m
•Year-to-date 2021 Net income available to common stockholders of $11.9m
•Second Quarter 2021 Adjusted EBITDA of $(1.8)m
•Year-to-date 2021 Adjusted EBITDA of $(2.8)m
Conference Call and Webcast Information
The Company will host a conference call and audio webcast at 8:30 a.m. (Eastern Time) to answer questions about the Company's operational and financial highlights for the second quarter of 2021.
| Event: | Better Choice Second Quarter 2021 Earnings Call | ||||
| Date: | Thursday, August 12, 2021 | ||||
| Time: | 8:30 a.m. Eastern Time | ||||
| Live Call: | +1-855-327-6837 (U.S. Toll-Free) or +1-631-891-4304 (International) | ||||
| Webcast: | http://public.viavid.com/index.php?id=145923 | ||||
For interested individuals unable to join the conference call, a dial-in replay of the call will be available until August 26, 2021 and can be accessed by dialing +1-844-512-2921 (U.S. Toll Free) or +1-412-317-6671 (International) and entering replay pin number: 10015865.
Better Choice Company Inc.
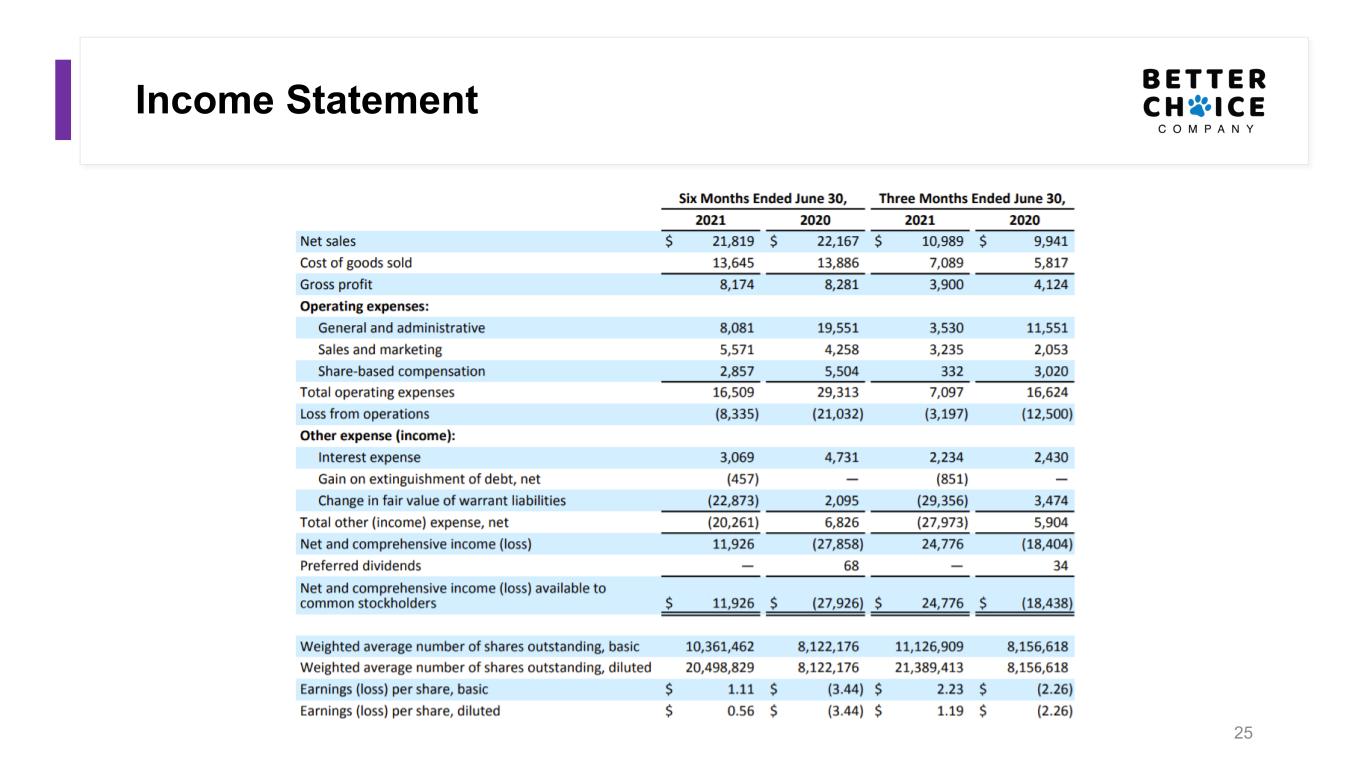
Unaudited Consolidated Statements of Operations and Comprehensive Income (Loss)
(Dollars in thousands, except share and per share amounts)
| Six Months Ended June 30, | Three Months Ended June 30, | ||||||||||||||||||||||
| 2021 | 2020 | 2021 | 2020 | ||||||||||||||||||||
| Net sales | $ | 21,819 | $ | 22,167 | $ | 10,989 | $ | 9,941 | |||||||||||||||
| Cost of goods sold | 13,645 | 13,886 | 7,089 | 5,817 | |||||||||||||||||||
| Gross profit | 8,174 | 8,281 | 3,900 | 4,124 | |||||||||||||||||||
| Operating expenses: | |||||||||||||||||||||||
| General and administrative | 8,081 | 19,551 | 3,530 | 11,551 | |||||||||||||||||||
| Sales and marketing | 5,571 | 4,258 | 3,235 | 2,053 | |||||||||||||||||||
| Share-based compensation | 2,857 | 5,504 | 332 | 3,020 | |||||||||||||||||||
| Total operating expenses | 16,509 | 29,313 | 7,097 | 16,624 | |||||||||||||||||||
| Loss from operations | (8,335) | (21,032) | (3,197) | (12,500) | |||||||||||||||||||
| Other expense (income): | |||||||||||||||||||||||
| Interest expense | 3,069 | 4,731 | 2,234 | 2,430 | |||||||||||||||||||
| Gain on extinguishment of debt, net | (457) | — | (851) | — | |||||||||||||||||||
| Change in fair value of warrant liabilities | (22,873) | 2,095 | (29,356) | 3,474 | |||||||||||||||||||
| Total other (income) expense, net | (20,261) | 6,826 | (27,973) | 5,904 | |||||||||||||||||||
| Net and comprehensive income (loss) | 11,926 | (27,858) | 24,776 | (18,404) | |||||||||||||||||||
| Preferred dividends | — | 68 | — | 34 | |||||||||||||||||||
| Net and comprehensive income (loss) available to common stockholders | $ | 11,926 | $ | (27,926) | $ | 24,776 | $ | (18,438) | |||||||||||||||
| Weighted average number of shares outstanding, basic | 10,361,462 | 8,122,176 | 11,126,909 | 8,156,618 | |||||||||||||||||||
| Weighted average number of shares outstanding, diluted | 20,498,829 | 8,122,176 | 21,389,413 | 8,156,618 | |||||||||||||||||||
| Earnings (loss) per share, basic | $ | 1.11 | $ | (3.44) | $ | 2.23 | $ | (2.26) | |||||||||||||||
| Earnings (loss) per share, diluted | $ | 0.56 | $ | (3.44) | $ | 1.19 | $ | (2.26) | |||||||||||||||
Non-GAAP Measures
Better Choice Company defines Adjusted EBITDA as EBITDA further adjusted to eliminate the impact of certain items that we do not consider indicative of our core operations. Adjusted EBITDA is determined by adding the following items to net and comprehensive income (loss): depreciation and amortization, interest expense, share-based compensation, warrant expense and dividends, loss on disposal of assets, change in fair value of warrant derivative liability, gain or loss on extinguishment of debt, acquisition related expenses, purchase accounting adjustments, equity and debt offering expenses and other non-recurring expenses.
The Company presents Adjusted EBITDA as it is a key measure used by our management and board of directors to evaluate our operating performance, generate future operating plans and make strategic decisions regarding the allocation of capital. We believe that the disclosure of Adjusted EBITDA is useful to investors as this non-GAAP measure forms the basis of how our management team reviews and considers our operating results. By disclosing this non-GAAP measure, we believe that we create for investors a greater understanding of and an enhanced level of transparency into the means by which our management team operates our company. We also believe this measure can assist investors in comparing our performance to that of other companies on a consistent basis without regard to certain items that do not directly affect our ongoing operating performance or cash flows.
Adjusted EBITDA does not represent cash flows from operations as defined by GAAP. Adjusted EBITDA has limitations as a financial measure and you should not consider it in isolation, or as a substitute for, or superior to, financial measures calculated in accordance with GAAP. Because of these limitations, you should consider Adjusted EBITDA alongside other financial performance measures, including various cash flow metrics, net loss, gross margin, and our other GAAP results.
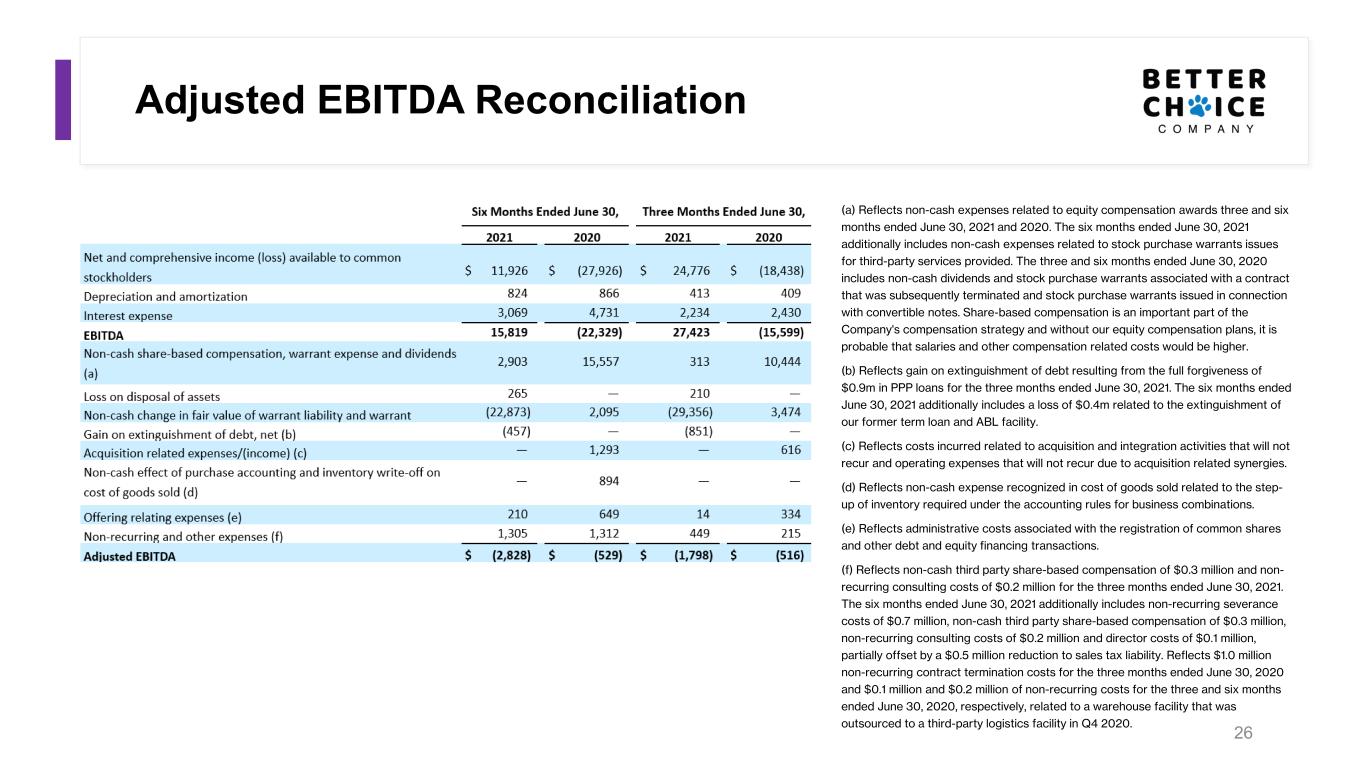
The following table presents a reconciliation of net and comprehensive income (loss), the closest GAAP financial measure, to EBITDA and Adjusted EBITDA for each of the periods indicated:
Better Choice Company Inc.
Reconciliation of Net and Comprehensive Income (Loss) to EBITDA and Adjusted EBITDA
(Dollars in thousands)
| Six Months Ended June 30, | Three Months Ended June 30, | ||||||||||||||||||||||
| 2021 | 2020 | 2021 | 2020 | ||||||||||||||||||||
| Net and comprehensive income (loss) available to common stockholders | $ | 11,926 | $ | (27,926) | $ | 24,776 | $ | (18,438) | |||||||||||||||
| Depreciation and amortization | 824 | 866 | 413 | 409 | |||||||||||||||||||
| Interest expense | 3,069 | 4,731 | 2,234 | 2,430 | |||||||||||||||||||
| EBITDA | 15,819 | (22,329) | 27,423 | (15,599) | |||||||||||||||||||
| Non-cash share-based compensation, warrant expense and dividends (a) | 2,903 | 15,557 | 313 | 10,444 | |||||||||||||||||||
| Loss on disposal of assets | 265 | — | 210 | — | |||||||||||||||||||
| Non-cash change in fair value of warrant liability and warrant derivative liability | (22,873) | 2,095 | (29,356) | 3,474 | |||||||||||||||||||
| Gain on extinguishment of debt, net (b) | (457) | — | (851) | — | |||||||||||||||||||
| Acquisition related expenses/(income) (c) | — | 1,293 | — | 616 | |||||||||||||||||||
| Non-cash effect of purchase accounting and inventory write-off on cost of goods sold (d) | — | 894 | — | — | |||||||||||||||||||
| Offering relating expenses (e) | 210 | 649 | 14 | 334 | |||||||||||||||||||
| Non-recurring and other expenses (f) | 1,305 | 1,312 | 449 | 215 | |||||||||||||||||||
| Adjusted EBITDA | $ | (2,828) | $ | (529) | $ | (1,798) | $ | (516) | |||||||||||||||
| (a) Reflects non-cash expenses related to equity compensation awards three and six months ended June 30, 2021 and 2020. The six months ended June 30, 2021 additionally includes non-cash expenses related to stock purchase warrants issues for third-party services provided. The three and six months ended June 30, 2020 includes non-cash dividends and stock purchase warrants associated with a contract that was subsequently terminated and stock purchase warrants issued in connection with convertible notes. Share-based compensation is an important part of the Company's compensation strategy and without our equity compensation plans, it is probable that salaries and other compensation related costs would be higher. | |||||||||||||||||||||||
| (b) Reflects gain on extinguishment of debt resulting from the full forgiveness of $0.9m in PPP loans for the three months ended June 30, 2021. The six months ended June 30, 2021 additionally includes a loss of $0.4m related to the extinguishment of our former term loan and ABL facility. | |||||||||||||||||||||||
| (c) Reflects costs incurred related to acquisition and integration activities that will not recur and operating expenses that will not recur due to acquisition related synergies. | |||||||||||||||||||||||
| (d) Reflects non-cash expense recognized in cost of goods sold related to the step-up of inventory required under the accounting rules for business combinations. | |||||||||||||||||||||||
| (e) Reflects administrative costs associated with the registration of common shares and other debt and equity financing transactions. | |||||||||||||||||||||||
| (f) Reflects non-cash third party share-based compensation of $0.3 million and non-recurring consulting costs of $0.2 million for the three months ended June 30, 2021. The six months ended June 30, 2021 additionally includes non-recurring severance costs of $0.7 million, non-cash third party share-based compensation of $0.3 million, non-recurring consulting costs of $0.2 million and director costs of $0.1 million, partially offset by a $0.5 million reduction to sales tax liability. Reflects $1.0 million non-recurring contract termination costs for the three months ended June 30, 2020 and $0.1 million and $0.2 million of non-recurring costs for the three and six months ended June 30, 2020, respectively, related to a warehouse facility that was outsourced to a third party logistics facility in Q4 2020. | |||||||||||||||||||||||
Better Choice Company Inc.
Condensed Consolidated Balance Sheets
(Dollars in thousands, except share and per share amounts)
| June 30, 2021 | December 31, 2020 | ||||||||||
| Assets | |||||||||||
| Cash and cash equivalents | $ | 2,484 | $ | 3,926 | |||||||
| Restricted cash | 63 | 63 | |||||||||
| Accounts receivable, net | 5,189 | 4,631 | |||||||||
| Inventories, net | 5,201 | 4,869 | |||||||||
| Deferred IPO costs | 882 | — | |||||||||
| Prepaid expenses and other current assets | 4,040 | 4,074 | |||||||||
| Total Current Assets | 17,859 | 17,563 | |||||||||
| Property and equipment, net | 149 | 252 | |||||||||
| Right-of-use assets, operating leases | 94 | 345 | |||||||||
| Intangible assets, net | 12,350 | 13,115 | |||||||||
| Goodwill | 18,614 | 18,614 | |||||||||
| Other assets | 114 | 1,364 | |||||||||
| Total Assets | $ | 49,180 | $ | 51,253 | |||||||
| Liabilities & Stockholders’ Equity (Deficit) | |||||||||||
| Current Liabilities | |||||||||||
| Term loans, net | $ | 704 | $ | 7,826 | |||||||
| Line of credit | 222 | — | |||||||||
| PPP loans | — | 190 | |||||||||
| Accrued and other liabilities | 2,231 | 3,400 | |||||||||
| Accounts payable | 4,758 | 3,137 | |||||||||
| Operating lease liability | 56 | 173 | |||||||||
| Warrant liability | 16,977 | 39,850 | |||||||||
| Total Current Liabilities | 24,948 | 54,576 | |||||||||
| Non-current Liabilities | |||||||||||
| Notes payable, net | — | 18,910 | |||||||||
| Term loans, net | 4,999 | — | |||||||||
| Lines of credit, net | 4,935 | 5,023 | |||||||||
| PPP loans | — | 662 | |||||||||
| Operating lease liability | 38 | 184 | |||||||||
| Total Non-current Liabilities | 9,972 | 24,779 | |||||||||
| Total Liabilities | 34,920 | 79,355 | |||||||||
| Stockholders’ Equity (Deficit) | |||||||||||
Common Stock, $0.001 par value, 200,000,000 shares authorized, 15,821,559 and 8,651,400 shares issued and outstanding as of June 30, 2021 and December 31, 2020, respectively | 16 | 9 | |||||||||
Series F Preferred Stock, $0.001 par value, 30,000 shares authorized, 17,294 shares and 21,754 shares issued and outstanding as of June 30, 2021 and December 31, 2020, respectively | — | — | |||||||||
| Additional paid-in capital | 263,361 | 232,530 | |||||||||
| Accumulated deficit | (249,117) | (260,641) | |||||||||
| Total Stockholders’ Equity (Deficit) | 14,260 | (28,102) | |||||||||
| Total Liabilities and Stockholders’ Equity (Deficit) | $ | 49,180 | $ | 51,253 | |||||||
The following unaudited pro forma condensed consolidated balance sheet data is presented as if the IPO closed on June 30, 2021, by applying adjustments to the Company’s condensed consolidated balance sheet. It reflects (1) the issuance of 8,000,000 shares of common stock for estimated net proceeds of $36.2 million (of which $0.9 million of offering costs were already included in the June 30, 2021 current asset balance), (2) the conversion of all Series F convertible preferred stock into an aggregate of 5,764,533 shares of common stock and (3) the reclassification of the Series F Warrant liability to equity:
| Actual | Pro Forma Adjustments | Pro Forma | ||||||||||||||||||
| June 30, 2021 | June 30, 2021 | |||||||||||||||||||
| Assets | ||||||||||||||||||||
| Total Current Assets | $ | 17,859 | $ | 36,168 | $ | 54,027 | ||||||||||||||
| Total Non-Current assets | 31,321 | — | 31,321 | |||||||||||||||||
| Total Assets | $ | 49,180 | $ | 36,168 | $ | 85,348 | ||||||||||||||
| Liabilities & Stockholders’ Equity (Deficit) | ||||||||||||||||||||
| Total Liabilities | $ | 34,920 | $ | (16,977) | $ | 17,943 | ||||||||||||||
| Common Stock | 16 | 14 | 30 | |||||||||||||||||
| Series F Preferred Stock | — | — | — | |||||||||||||||||
| Additional paid-in capital | 263,361 | 53,131 | 316,492 | |||||||||||||||||
| Accumulated deficit | (249,117) | — | (249,117) | |||||||||||||||||
| Total Stockholders’ Equity (Deficit) | 14,260 | 53,145 | 67,405 | |||||||||||||||||
| Total Liabilities and Stockholders’ Equity (Deficit) | $ | 49,180 | $ | 36,168 | $ | 85,348 | ||||||||||||||
About Better Choice Company Inc.
Better Choice Company Inc. is a rapidly growing animal health and wellness company committed to leading the industry shift toward pet products and services that help dogs and cats live healthier, happier and longer lives. We take an alternative, nutrition-based approach to animal health relative to conventional dog and cat food offerings and position our portfolio of brands to benefit from the mainstream trends of growing pet humanization and consumer focus on health and wellness. We have a demonstrated, multi-decade track record of success selling trusted animal health and wellness products and leverage our established digital footprint to provide pet parents with the knowledge to make informed decisions about their pet’s health. We sell the majority of our dog food, cat food and treats under the Halo and TruDog brands, which are focused, respectively, on providing sustainably sourced kibble and canned food derived from real whole meat, and minimally processed raw-diet dog food and treats. For more information, please visit https://www.betterchoicecompany.com.
Forward Looking Statements
This press release contains forward-looking statements within the meaning of the Private Securities Litigation Reform Act of 1995. The words “believe,” “may,” “estimate,” “continue,” “anticipate,” “intend,” “should,” “plan,” “could,” “target,” “potential,” “is likely,” “will,” “expect” and similar expressions, as they relate to us, are intended to identify forward-looking statements. The Company has based these forward-looking statements largely on our current expectations and projections about future events and financial trends that we believe may affect our financial condition, results of operations, business strategy and financial needs. Some or all of the results anticipated by these forward-looking statements may not be achieved. Further information on the Company’s risk factors is contained in our filings with the SEC. Any forward-looking statement made by us herein speaks only as of the date on which it is made. Factors or events that could cause our actual results to differ may emerge from time to time, and it is not possible for us to predict all of them. The Company undertakes no obligation to publicly update any forward-looking statement, whether as a result of new information, future developments or otherwise, except as may be required by law.
Company Contact:
Better Choice Company, Inc.
Scott Lerner, CEO
Investor Contact:
KCSA Strategic Communications
Valter Pinto, Managing Director
T: 212-896-1254

1 August 12, 2021 Q2 2021 Earnings Presentation
Safe Harbor This presentation regarding Better Choice Company, Inc. (“the Company”, “Better Choice”, “BTTR”, “we”, “us” or “our”) is strictly confidential and is for you to familiarize yourself with the Company. This presentation contains information, statements, beliefs and opinions which are forward-looking, and which reflect current estimates, expectations and projections about future events, referred to herein and which constitute “forward-looking statements” or “forward-looking information” within the meaning of the Private Securities Litigation Reform Act of 1995. All statements other than statements of historical fact included in this document, regarding our strategy, future operations, financial position, prospects, plans and objectives of management are forward-looking statements. Statements containing the words “could”, “believe”, “expect”, “intend”, “should”, “seek”, “anticipate”, “will”, “positioned”, “project”, “risk”, “plan”, “may”, “estimate” or, in each case, their negative and words of similar meaning are intended to identify forward-looking statements. By their nature, forward-looking statements involve a number of known and unknown risks, uncertainties and assumptions, most of which are difficult to predict and many of which are beyond the Company’s control, concerning, among other things, the Company’s anticipated business strategies, anticipated trends in the Company’s business and anticipated market share, that could cause actual results or events to differ materially from those expressed or implied by the forward-looking statements. These risks, uncertainties and assumptions could adversely affect the outcome and financial effects of the plans and events described herein. In addition, even if the outcome and financial effects of the plans and events described herein are consistent with the forward-looking statements contained in this presentation, those results or developments may not be indicative of results or developments in subsequent periods. Although the Company has attempted to identify important risks and factors that could cause actual actions, events or results to differ materially from those described in forward-looking information, there may be other factors and risks that cause actions, events or results not to be as anticipated, estimated or intended. Forward-looking information contained in this presentation is based on the Company’s current estimates, expectations and projections, which the Company believes are reasonable as of the current date. The Company can give no assurance that these estimates, expectations and projections will prove to have been correct. Given these uncertainties, you should not place undue reliance on these forward-looking statements. All statements contained in this presentation are made only as of the date of this presentation, and the Company undertakes no duty to update this information unless required by law. You are also reminded that during this presentation, certain non-GAAP financial measures, such as Adjusted EBITDA, may be discussed. These measure should not be considered an alternative to net income, or any other measure of financial performance or liquidity presented in accordance with generally accepted accounting principles (GAAP). These measures are not necessarily comparable to a similarly titled measure of another company. Please refer to our reconciliations of these discussed figures with the most comparable GAAP measures. The known risks, uncertainties and factors are described in detail under the caption “Risk Factors” in documents the Company has filed with the Securities and Exchange Commission (the “SEC”). that are incorporated by reference in this presentation. Certain information contained in this presentation may be derived from information provided by industry sources. The Company believes such information is accurate and that the sources from which it has been obtained are reliable. However, the Company cannot guarantee the accuracy of, and has not independently verified, such information. All trademarks, service marks, and trade names appearing in this presentation are the property of their respective holders. 2
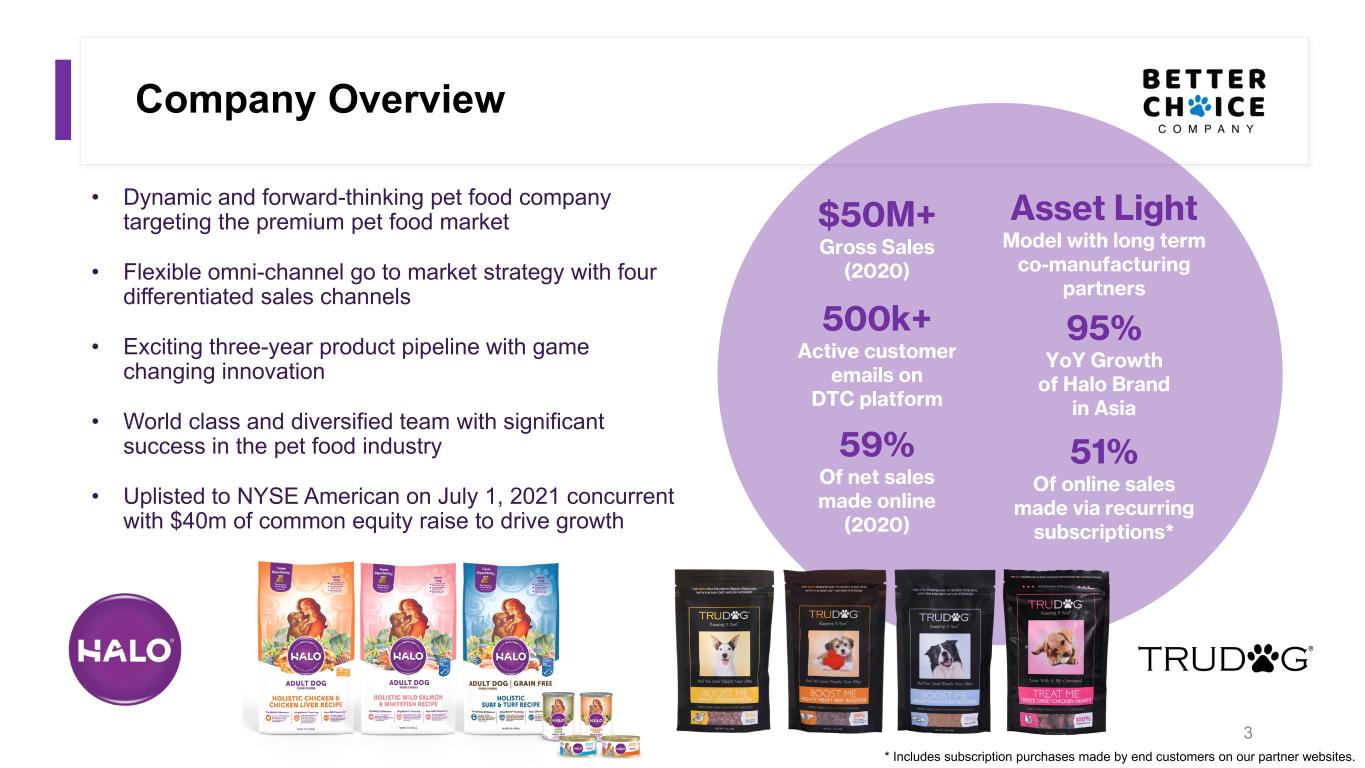
Company Overview 3 * Includes subscription purchases made by end customers on our partner websites. • Dynamic and forward-thinking pet food company targeting the premium pet food market • Flexible omni-channel go to market strategy with four differentiated sales channels • Exciting three-year product pipeline with game changing innovation • World class and diversified team with significant success in the pet food industry • Uplisted to NYSE American on July 1, 2021 concurrent with $40m of common equity raise to drive growth $50M+ Gross Sales (2020) Asset Light Model with long term co-manufacturing partners 500k+ Active customer emails on DTC platform 95% YoY Growth of Halo Brand in Asia 59% Of net sales made online (2020) 51% Of online sales made via recurring subscriptions*
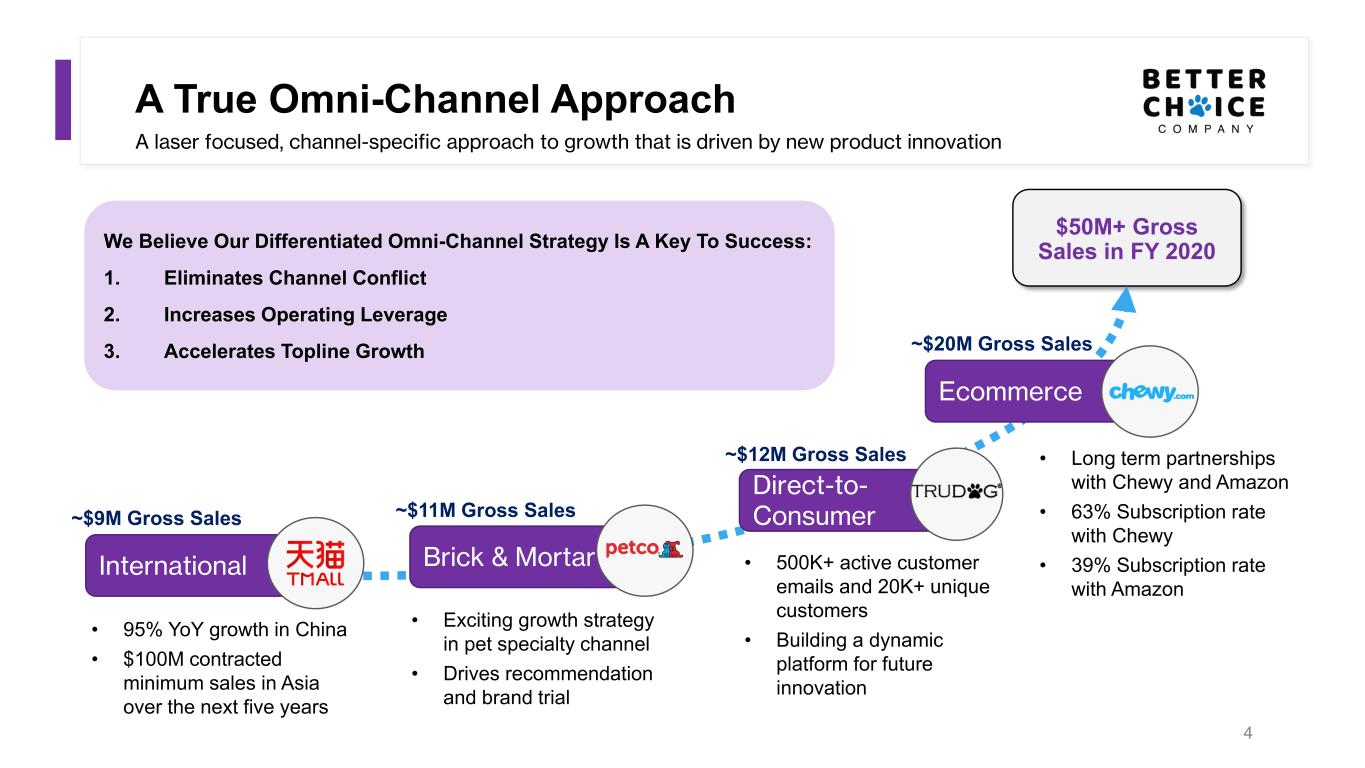
A True Omni-Channel Approach 4 ~$20M Gross Sales ~$12M Gross Sales ~$11M Gross Sales~$9M Gross Sales We Believe Our Differentiated Omni-Channel Strategy Is A Key To Success: 1. Eliminates Channel Conflict 2. Increases Operating Leverage 3. Accelerates Topline Growth A laser focused, channel-specific approach to growth that is driven by new product innovation International Ecommerce $50M+ Gross Sales in FY 2020 Brick & Mortar Direct-to- Consumer • 95% YoY growth in China • $100M contracted minimum sales in Asia over the next five years • Long term partnerships with Chewy and Amazon • 63% Subscription rate with Chewy • 39% Subscription rate with Amazon • Exciting growth strategy in pet specialty channel • Drives recommendation and brand trial • 500K+ active customer emails and 20K+ unique customers • Building a dynamic platform for future innovation
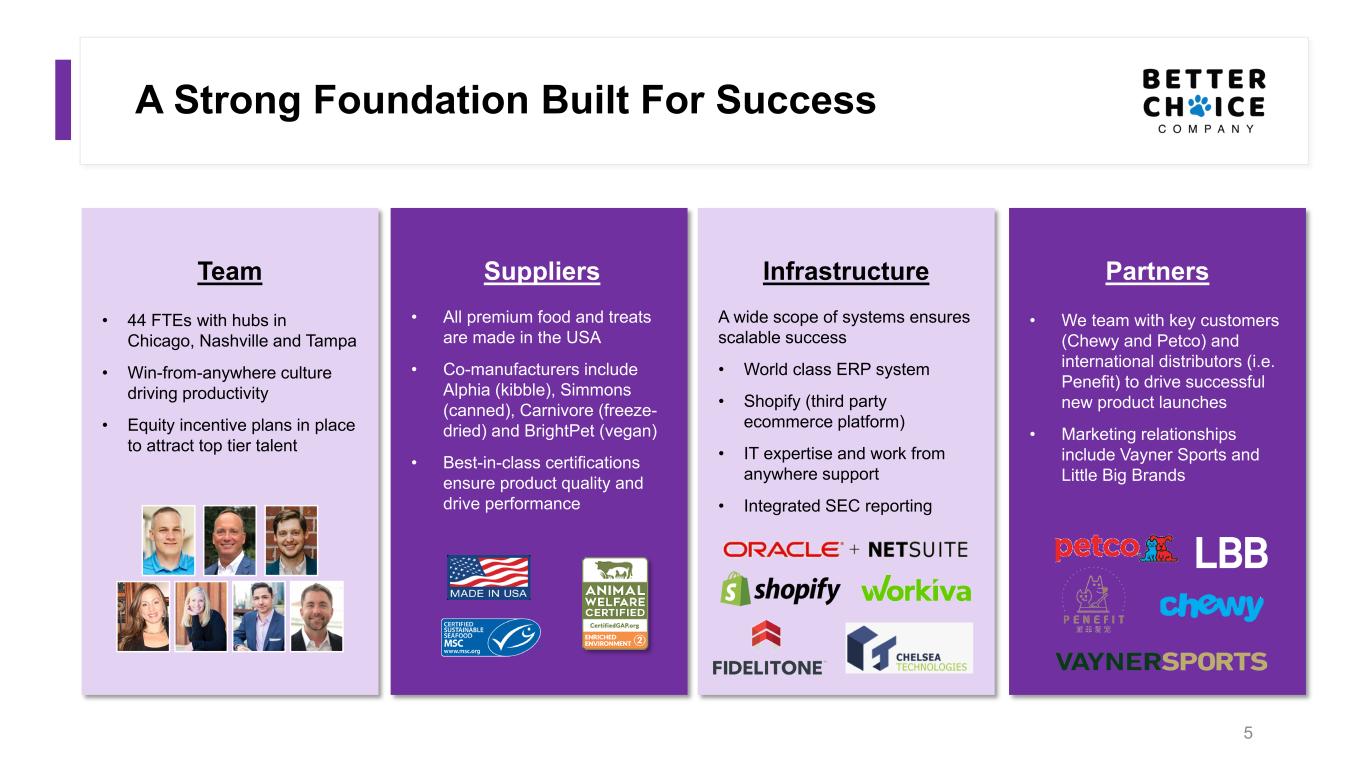
A Strong Foundation Built For Success 5 Infrastructure A wide scope of systems ensures scalable success • World class ERP system • Shopify (third party ecommerce platform) • IT expertise and work from anywhere support • Integrated SEC reporting Suppliers • All premium food and treats are made in the USA • Co-manufacturers include Alphia (kibble), Simmons (canned), Carnivore (freeze- dried) and BrightPet (vegan) • Best-in-class certifications ensure product quality and drive performance Team • 44 FTEs with hubs in Chicago, Nashville and Tampa • Win-from-anywhere culture driving productivity • Equity incentive plans in place to attract top tier talent Partners • We team with key customers (Chewy and Petco) and international distributors (i.e. Penefit) to drive successful new product launches • Marketing relationships include Vayner Sports and Little Big Brands
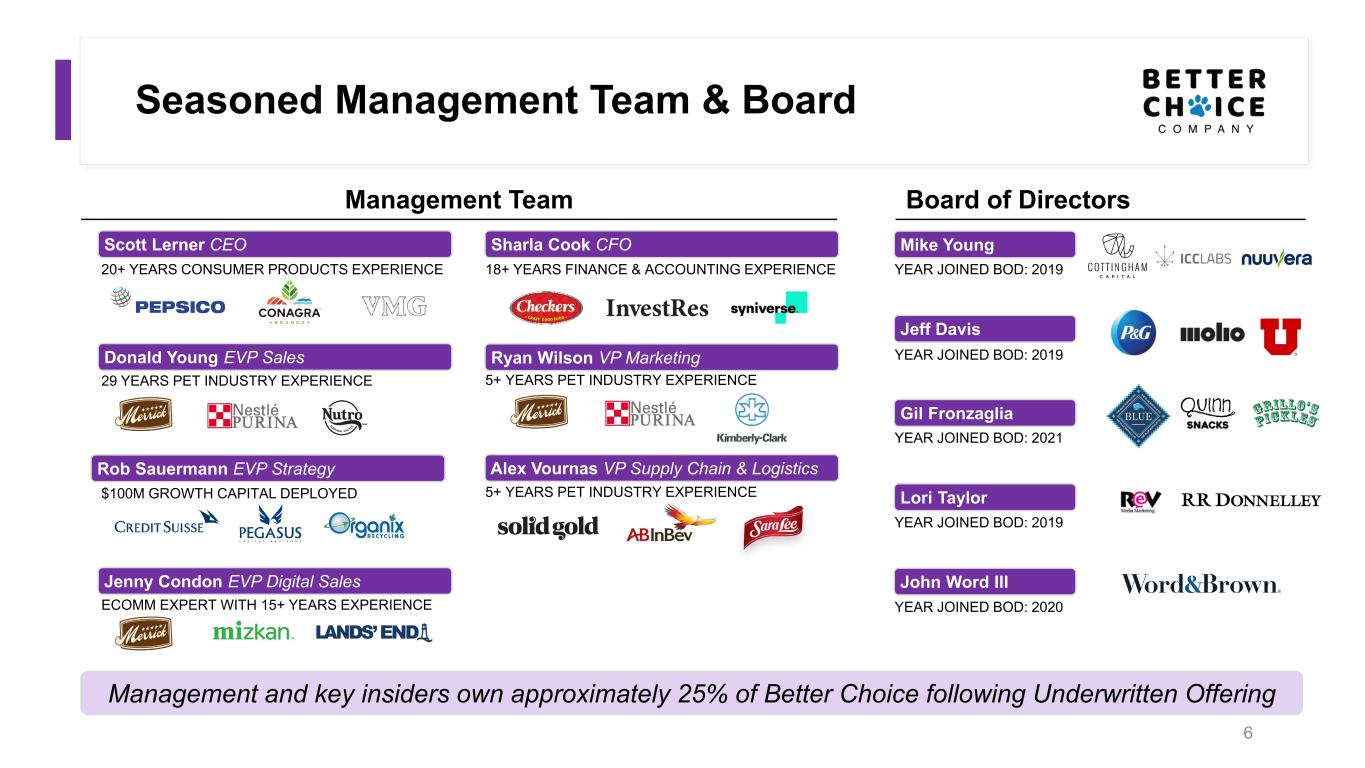
Seasoned Management Team & Board 6 Scott Lerner CEO 20+ YEARS CONSUMER PRODUCTS EXPERIENCE Management Team Board of Directors YEAR JOINED BOD: 2019 Management and key insiders own approximately 25% of Better Choice following Underwritten Offering Donald Young EVP Sales 29 YEARS PET INDUSTRY EXPERIENCE Rob Sauermann EVP Strategy $100M GROWTH CAPITAL DEPLOYED Jenny Condon EVP Digital Sales ECOMM EXPERT WITH 15+ YEARS EXPERIENCE 18+ YEARS FINANCE & ACCOUNTING EXPERIENCE Sharla Cook CFO Ryan Wilson VP Marketing 5+ YEARS PET INDUSTRY EXPERIENCE Alex Vournas VP Supply Chain & Logistics 5+ YEARS PET INDUSTRY EXPERIENCE Mike Young Jeff Davis Gil Fronzaglia Lori Taylor John Word III YEAR JOINED BOD: 2019 YEAR JOINED BOD: 2021 YEAR JOINED BOD: 2019 YEAR JOINED BOD: 2020
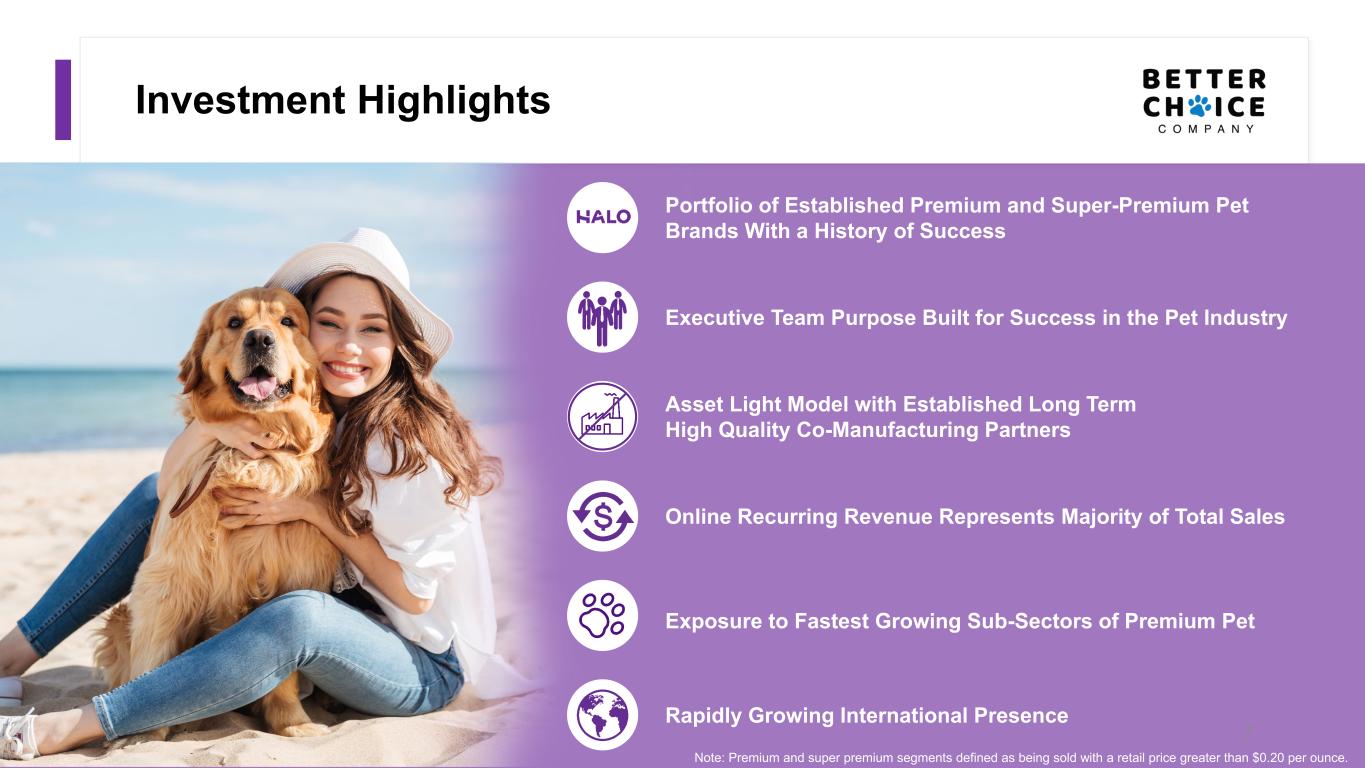
Investment Highlights 7 Note: Premium and super premium segments defined as being sold with a retail price greater than $0.20 per ounce. Executive Team Purpose Built for Success in the Pet Industry Online Recurring Revenue Represents Majority of Total Sales Rapidly Growing International Presence Asset Light Model with Established Long Term High Quality Co-Manufacturing Partners Portfolio of Established Premium and Super-Premium Pet Brands With a History of Success Exposure to Fastest Growing Sub-Sectors of Premium Pet
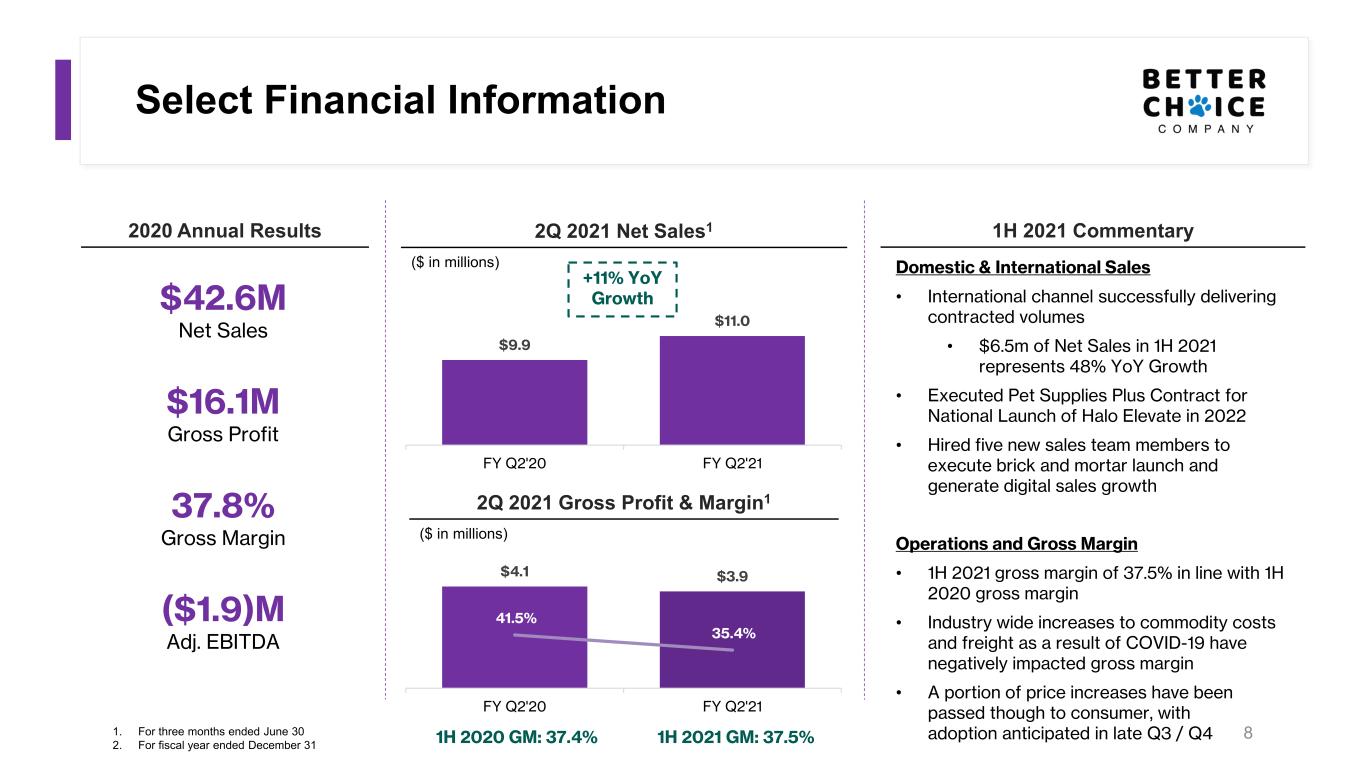
Select Financial Information 8 2020 Annual Results 2Q 2021 Net Sales1 ($ in millions) 2Q 2021 Gross Profit & Margin1 ($ in millions) 1. For three months ended June 30 2. For fiscal year ended December 31 1H 2021 Commentary $16.1M Gross Profit $42.6M Net Sales ($1.9)M Adj. EBITDA Domestic & International Sales • International channel successfully delivering contracted volumes • $6.5m of Net Sales in 1H 2021 represents 48% YoY Growth • Executed Pet Supplies Plus Contract for National Launch of Halo Elevate in 2022 • Hired five new sales team members to execute brick and mortar launch and generate digital sales growth Operations and Gross Margin • 1H 2021 gross margin of 37.5% in line with 1H 2020 gross margin • Industry wide increases to commodity costs and freight as a result of COVID-19 have negatively impacted gross margin • A portion of price increases have been passed though to consumer, with adoption anticipated in late Q3 / Q4 37.8% Gross Margin $9.9 $11.0 FY Q2'20 FY Q2'21 $4.1 $3.9 41.5% 35.4% FY Q2'20 FY Q2'21 1H 2020 GM: 37.4% 1H 2021 GM: 37.5% +11% YoY Growth
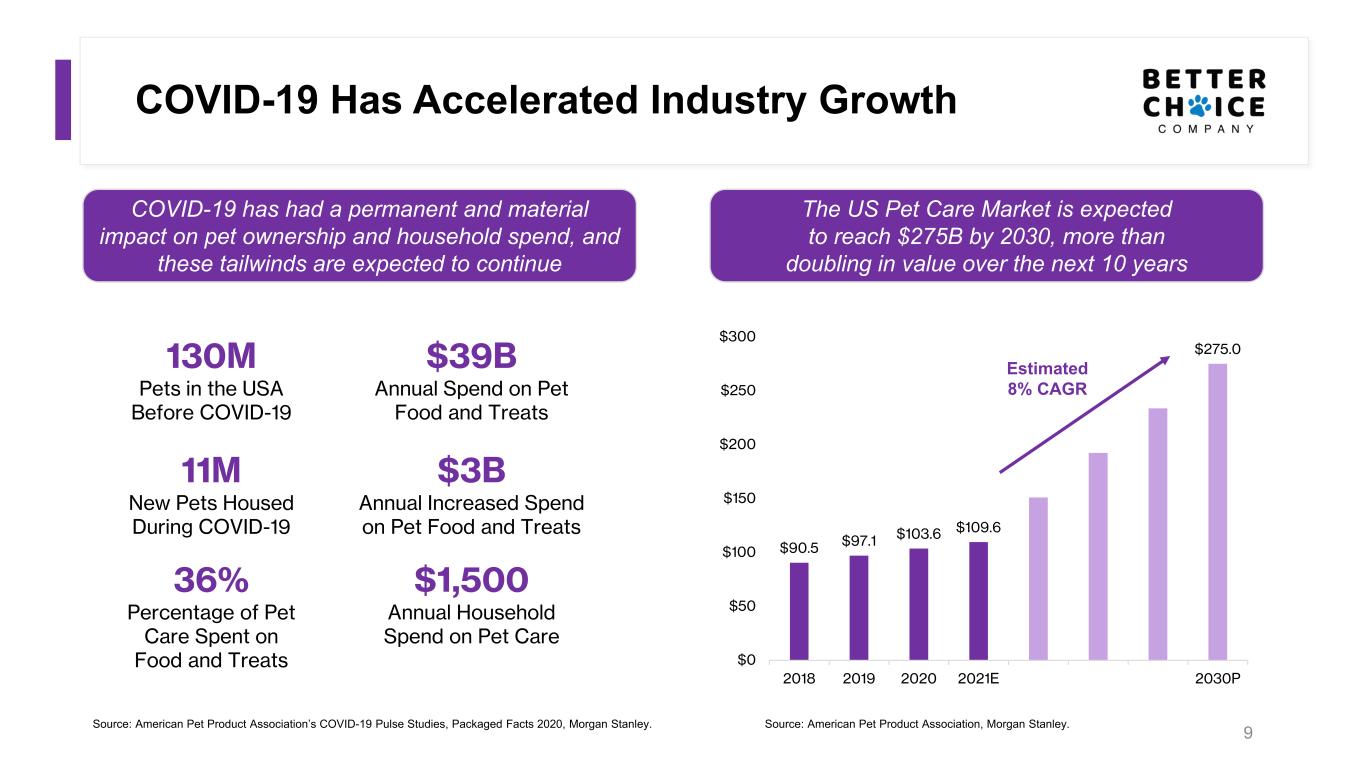
COVID-19 Has Accelerated Industry Growth 9Source: American Pet Product Association, Morgan Stanley. COVID-19 has had a permanent and material impact on pet ownership and household spend, and these tailwinds are expected to continue 11M New Pets Housed During COVID-19 $3B Annual Increased Spend on Pet Food and Treats 130M Pets in the USA Before COVID-19 $39B Annual Spend on Pet Food and Treats 36% Percentage of Pet Care Spent on Food and Treats $1,500 Annual Household Spend on Pet Care The US Pet Care Market is expected to reach $275B by 2030, more than doubling in value over the next 10 years $90.5 $97.1 $103.6 $109.6 $275.0 2018 2019 2020 2021E 2030P $0 $50 $100 $150 $200 $250 $300 Source: American Pet Product Association’s COVID-19 Pulse Studies, Packaged Facts 2020, Morgan Stanley. Estimated 8% CAGR

Millennials Embrace The Humanization of Pets And Are Looking For More Feedback is pervasive: • 95% say their pet is part of the immediate family • 77% say they feel more like pet parents rather than pet owners • 50% are as concerned about their pets’ well being as their human family members 75% of Millennial households own a pet and housed pets at historic levels during COVID-19 pandemic 10

11 Halo is the brand for a new generation of pet parents
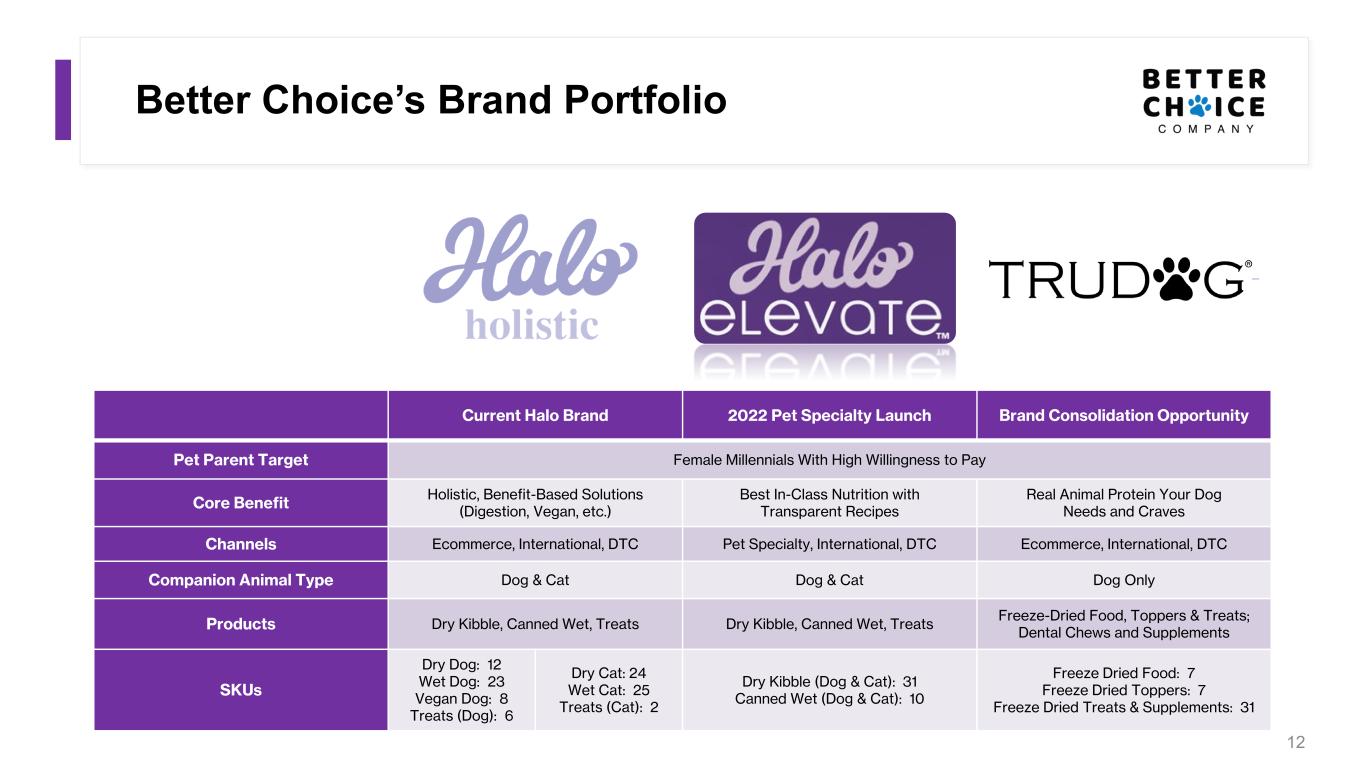
Better Choice’s Brand Portfolio 12 Current Halo Brand 2022 Pet Specialty Launch Brand Consolidation Opportunity Pet Parent Target Female Millennials With High Willingness to Pay Core Benefit Holistic, Benefit-Based Solutions (Digestion, Vegan, etc.) Best In-Class Nutrition with Transparent Recipes Real Animal Protein Your Dog Needs and Craves Channels Ecommerce, International, DTC Pet Specialty, International, DTC Ecommerce, International, DTC Companion Animal Type Dog & Cat Dog & Cat Dog Only Products Dry Kibble, Canned Wet, Treats Dry Kibble, Canned Wet, Treats Freeze-Dried Food, Toppers & Treats; Dental Chews and Supplements SKUs Dry Dog: 12 Wet Dog: 23 Vegan Dog: 8 Treats (Dog): 6 Dry Cat: 24 Wet Cat: 25 Treats (Cat): 2 Dry Kibble (Dog & Cat): 31 Canned Wet (Dog & Cat): 10 Freeze Dried Food: 7 Freeze Dried Toppers: 7 Freeze Dried Treats & Supplements: 31

Maximizing 3 Sales Channels To Drive The Halo Brand Towards $100M of Gross Sales by 2023 13 DTC Brick & Mortar E-Commerce
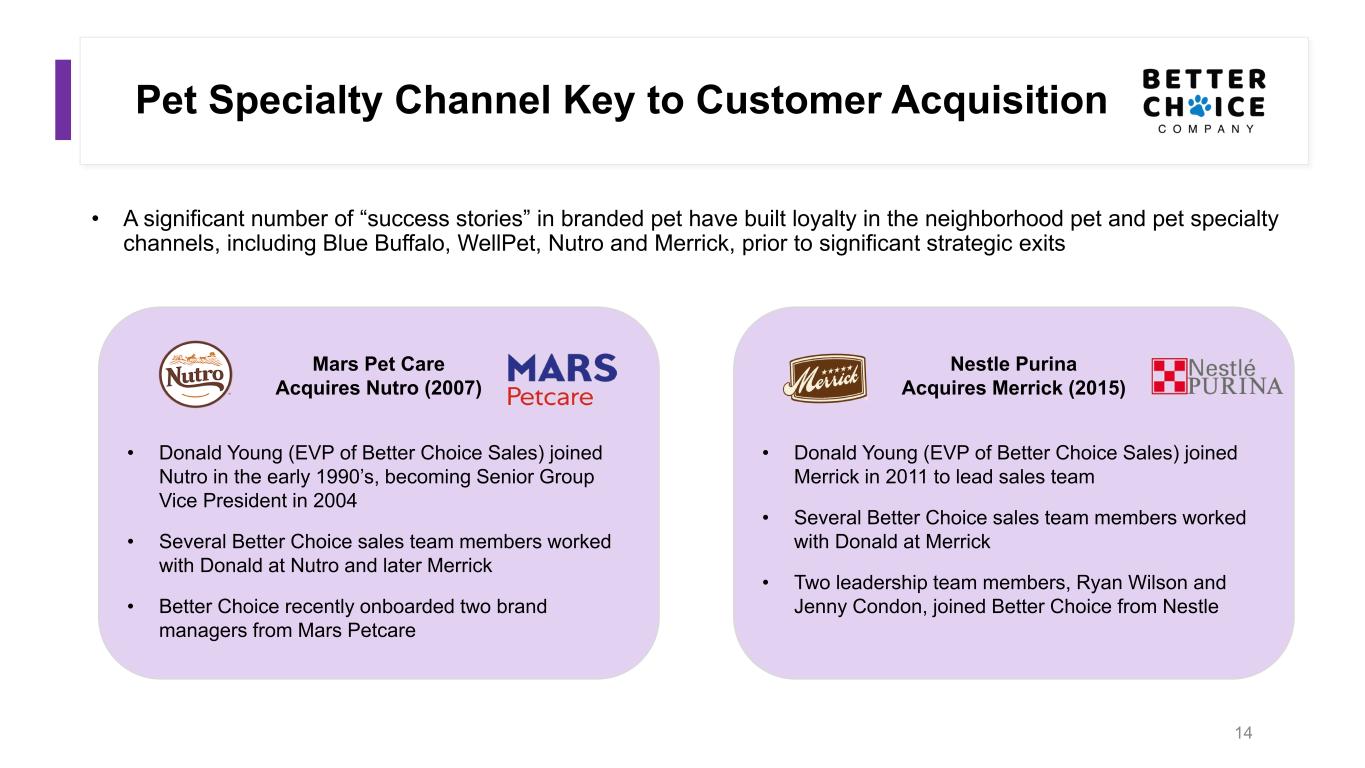
Pet Specialty Channel Key to Customer Acquisition 14 • A significant number of “success stories” in branded pet have built loyalty in the neighborhood pet and pet specialty channels, including Blue Buffalo, WellPet, Nutro and Merrick, prior to significant strategic exits Mars Pet Care Acquires Nutro (2007) • Donald Young (EVP of Better Choice Sales) joined Nutro in the early 1990’s, becoming Senior Group Vice President in 2004 • Several Better Choice sales team members worked with Donald at Nutro and later Merrick • Better Choice recently onboarded two brand managers from Mars Petcare Nestle Purina Acquires Merrick (2015) • Donald Young (EVP of Better Choice Sales) joined Merrick in 2011 to lead sales team • Several Better Choice sales team members worked with Donald at Merrick • Two leadership team members, Ryan Wilson and Jenny Condon, joined Better Choice from Nestle
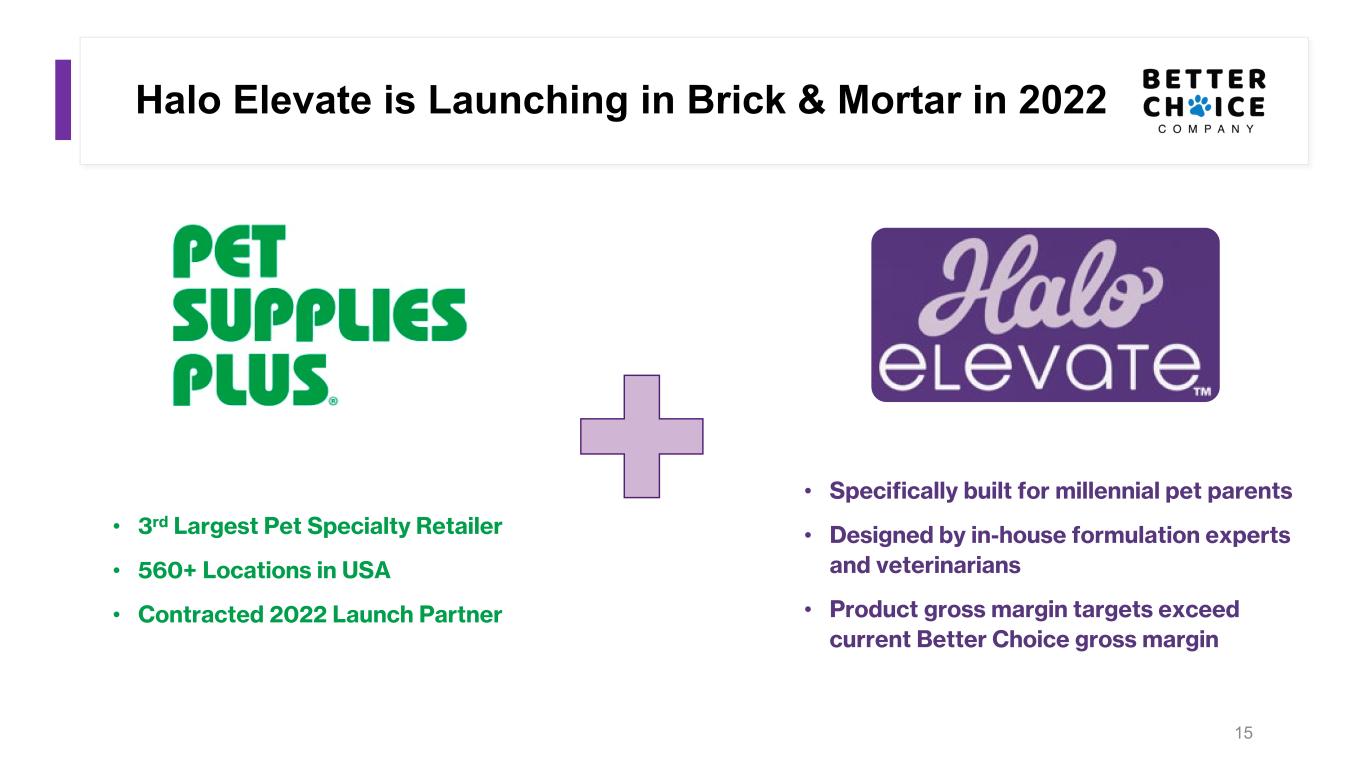
Halo Elevate is Launching in Brick & Mortar in 2022 15 • 3rd Largest Pet Specialty Retailer • 560+ Locations in USA • Contracted 2022 Launch Partner • Specifically built for millennial pet parents • Designed by in-house formulation experts and veterinarians • Product gross margin targets exceed current Better Choice gross margin
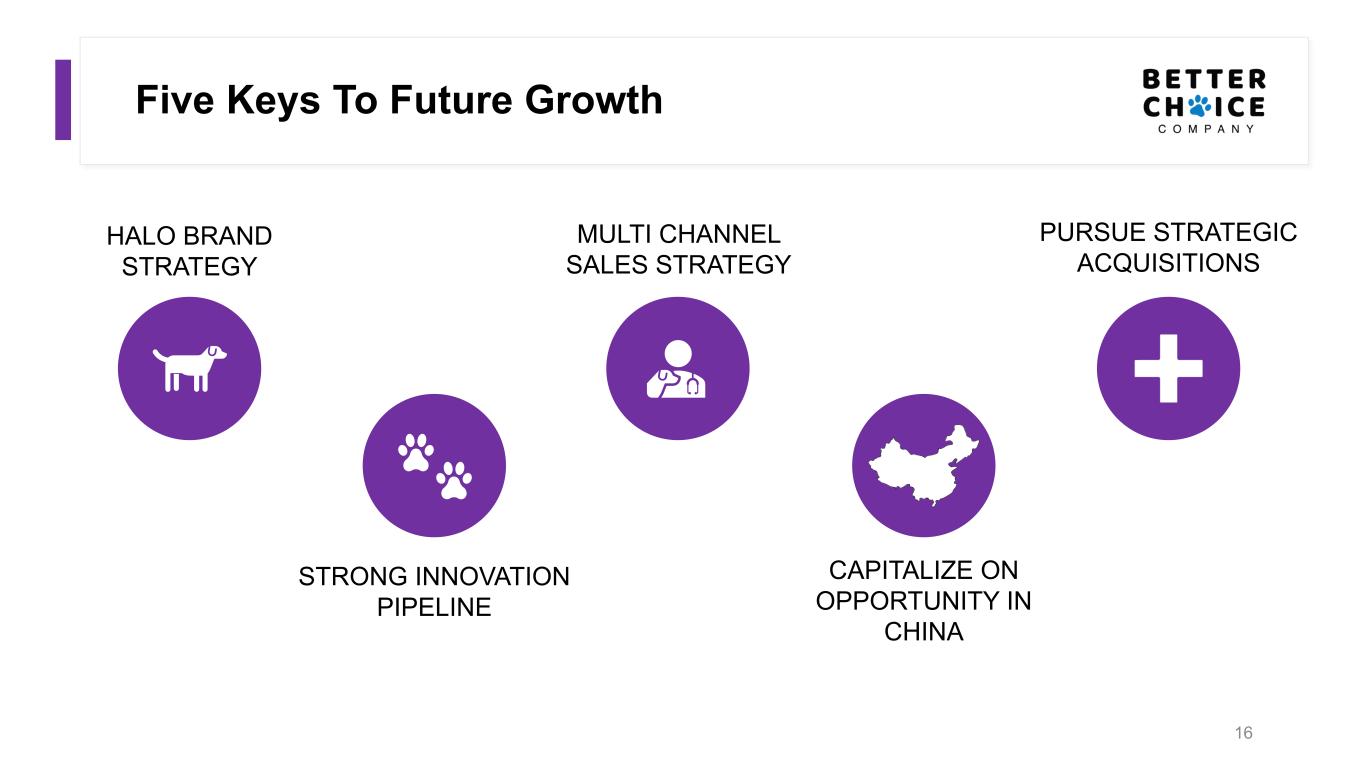
Five Keys To Future Growth 16 HALO BRAND STRATEGY MULTI CHANNEL SALES STRATEGY CAPITALIZE ON OPPORTUNITY IN CHINA STRONG INNOVATION PIPELINE PURSUE STRATEGIC ACQUISITIONS
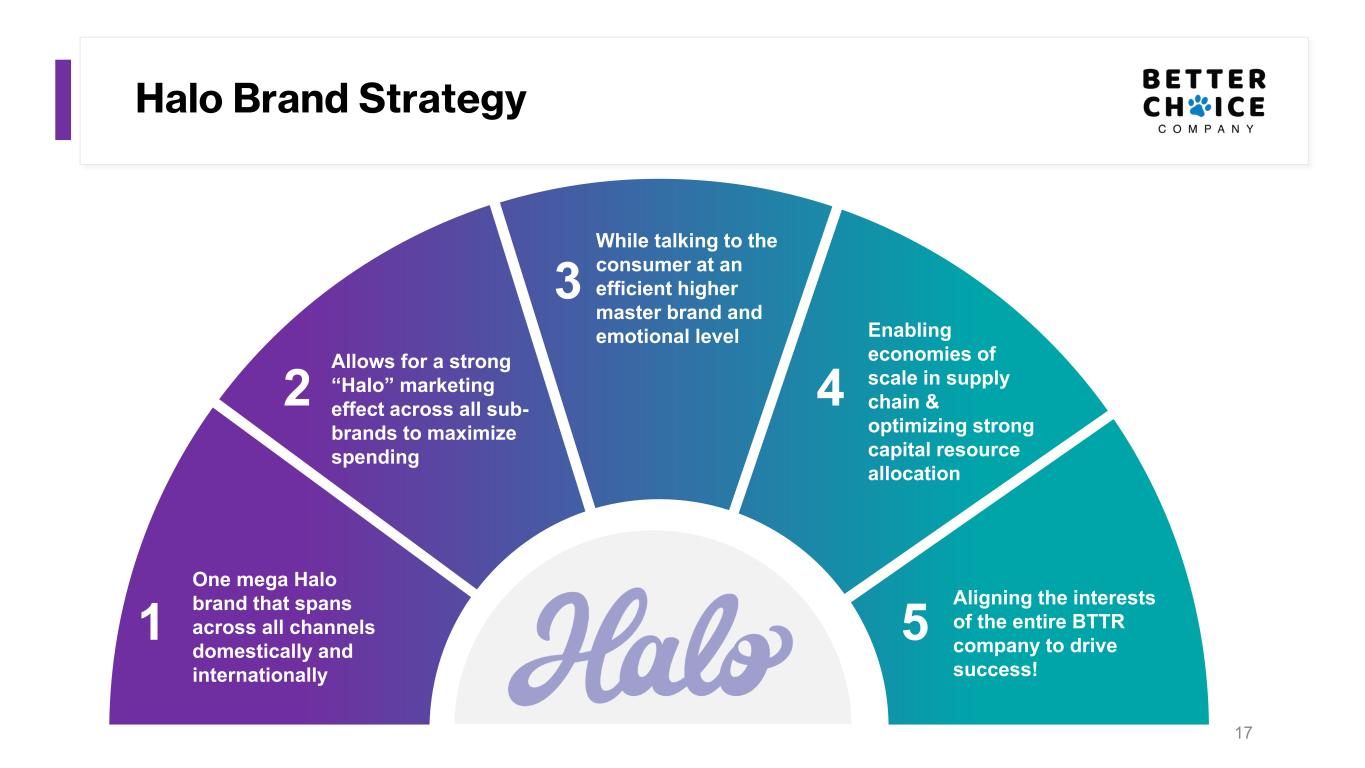
17 Halo Brand Strategy One mega Halo brand that spans across all channels domestically and internationally Allows for a strong “Halo” marketing effect across all sub- brands to maximize spending While talking to the consumer at an efficient higher master brand and emotional level Enabling economies of scale in supply chain & optimizing strong capital resource allocation Aligning the interests of the entire BTTR company to drive success! 1 2 3 4 5
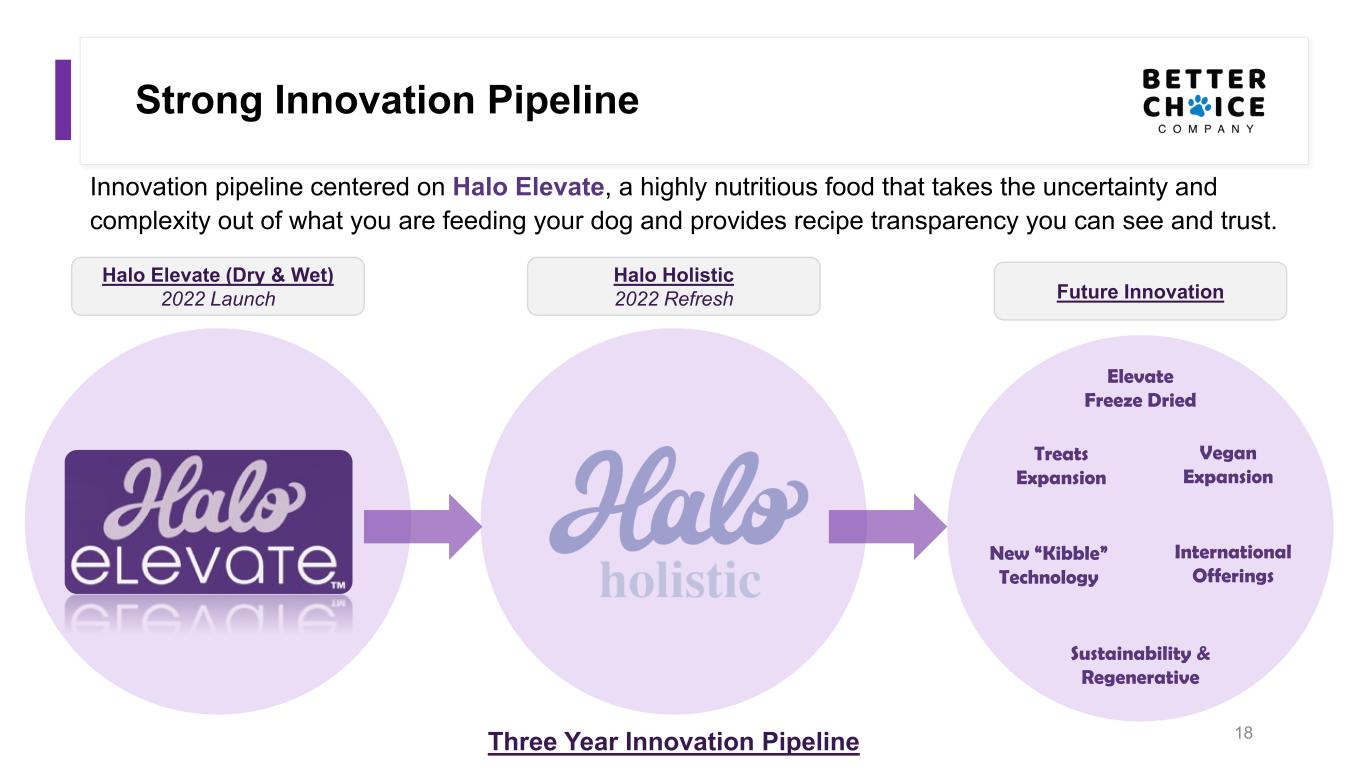
Strong Innovation Pipeline 18 Innovation pipeline centered on Halo Elevate, a highly nutritious food that takes the uncertainty and complexity out of what you are feeding your dog and provides recipe transparency you can see and trust. Future Innovation Halo Holistic 2022 Refresh Halo Elevate (Dry & Wet) 2022 Launch Three Year Innovation Pipeline Elevate Freeze Dried Treats Expansion New “Kibble” Technology Vegan Expansion Sustainability & Regenerative International Offerings
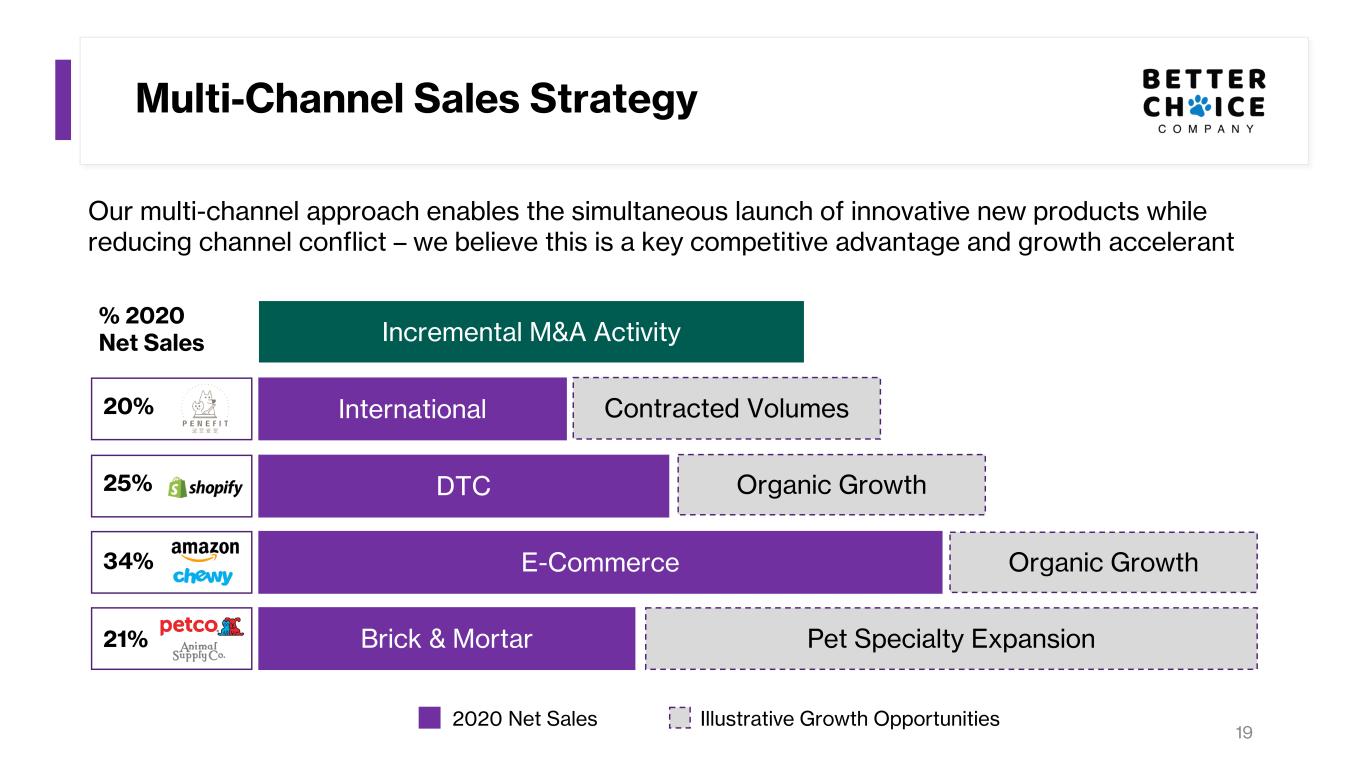
Multi-Channel Sales Strategy 19 Our multi-channel approach enables the simultaneous launch of innovative new products while reducing channel conflict – we believe this is a key competitive advantage and growth accelerant Incremental M&A Activity % 2020 Net Sales International Contracted Volumes20% DTC Organic Growth25% E-Commerce Organic Growth34% Brick & Mortar Pet Specialty Expansion21% 2020 Net Sales Illustrative Growth Opportunities
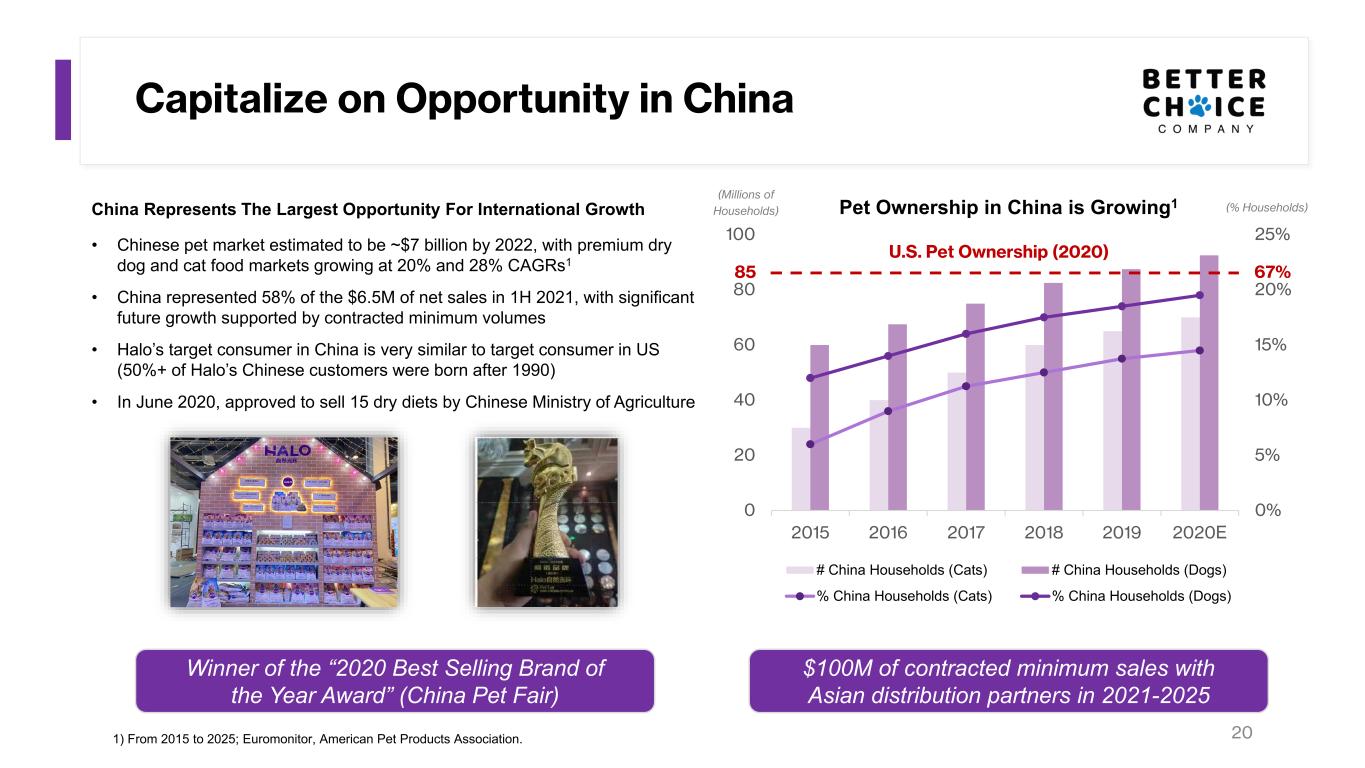
20 Capitalize on Opportunity in China China Represents The Largest Opportunity For International Growth • Chinese pet market estimated to be ~$7 billion by 2022, with premium dry dog and cat food markets growing at 20% and 28% CAGRs1 • China represented 58% of the $6.5M of net sales in 1H 2021, with significant future growth supported by contracted minimum volumes • Halo’s target consumer in China is very similar to target consumer in US (50%+ of Halo’s Chinese customers were born after 1990) • In June 2020, approved to sell 15 dry diets by Chinese Ministry of Agriculture 0 20 40 60 80 100 2015 2016 2017 2018 2019 2020E 0% 5% 10% 15% 20% 25% Pet Ownership in China is Growing1 # China Households (Cats) # China Households (Dogs) % China Households (Cats) % China Households (Dogs) (Millions of Households) 85 (% Households) 67% U.S. Pet Ownership (2020) 1) From 2015 to 2025; Euromonitor, American Pet Products Association. $100M of contracted minimum sales with Asian distribution partners in 2021-2025 Winner of the “2020 Best Selling Brand of the Year Award” (China Pet Fair)
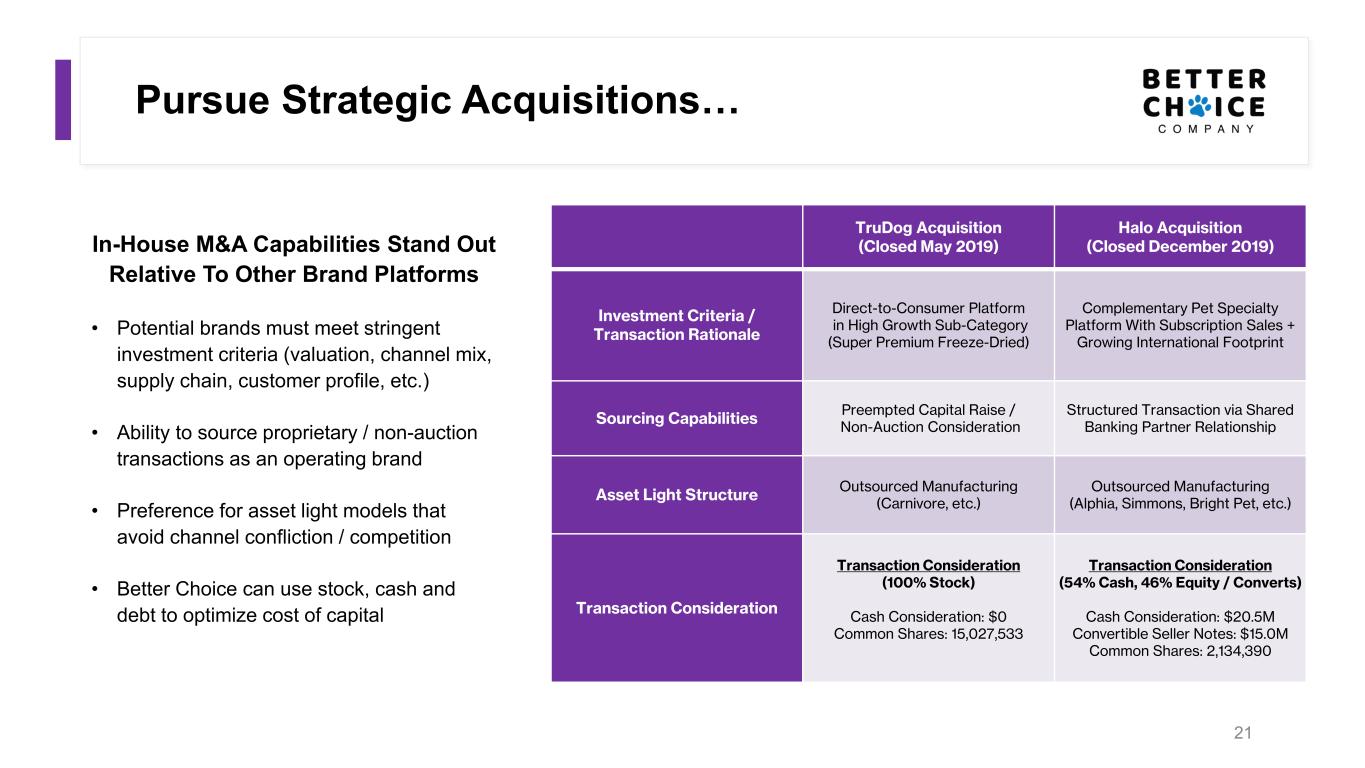
Pursue Strategic Acquisitions… In-House M&A Capabilities Stand Out Relative To Other Brand Platforms • Potential brands must meet stringent investment criteria (valuation, channel mix, supply chain, customer profile, etc.) • Ability to source proprietary / non-auction transactions as an operating brand • Preference for asset light models that avoid channel confliction / competition • Better Choice can use stock, cash and debt to optimize cost of capital 21 TruDog Acquisition (Closed May 2019) Halo Acquisition (Closed December 2019) Investment Criteria / Transaction Rationale Direct-to-Consumer Platform in High Growth Sub-Category (Super Premium Freeze-Dried) Complementary Pet Specialty Platform With Subscription Sales + Growing International Footprint Sourcing Capabilities Preempted Capital Raise / Non-Auction Consideration Structured Transaction via Shared Banking Partner Relationship Asset Light Structure Outsourced Manufacturing (Carnivore, etc.) Outsourced Manufacturing (Alphia, Simmons, Bright Pet, etc.) Transaction Consideration Transaction Consideration (100% Stock) Cash Consideration: $0 Common Shares: 15,027,533 Transaction Consideration (54% Cash, 46% Equity / Converts) Cash Consideration: $20.5M Convertible Seller Notes: $15.0M Common Shares: 2,134,390
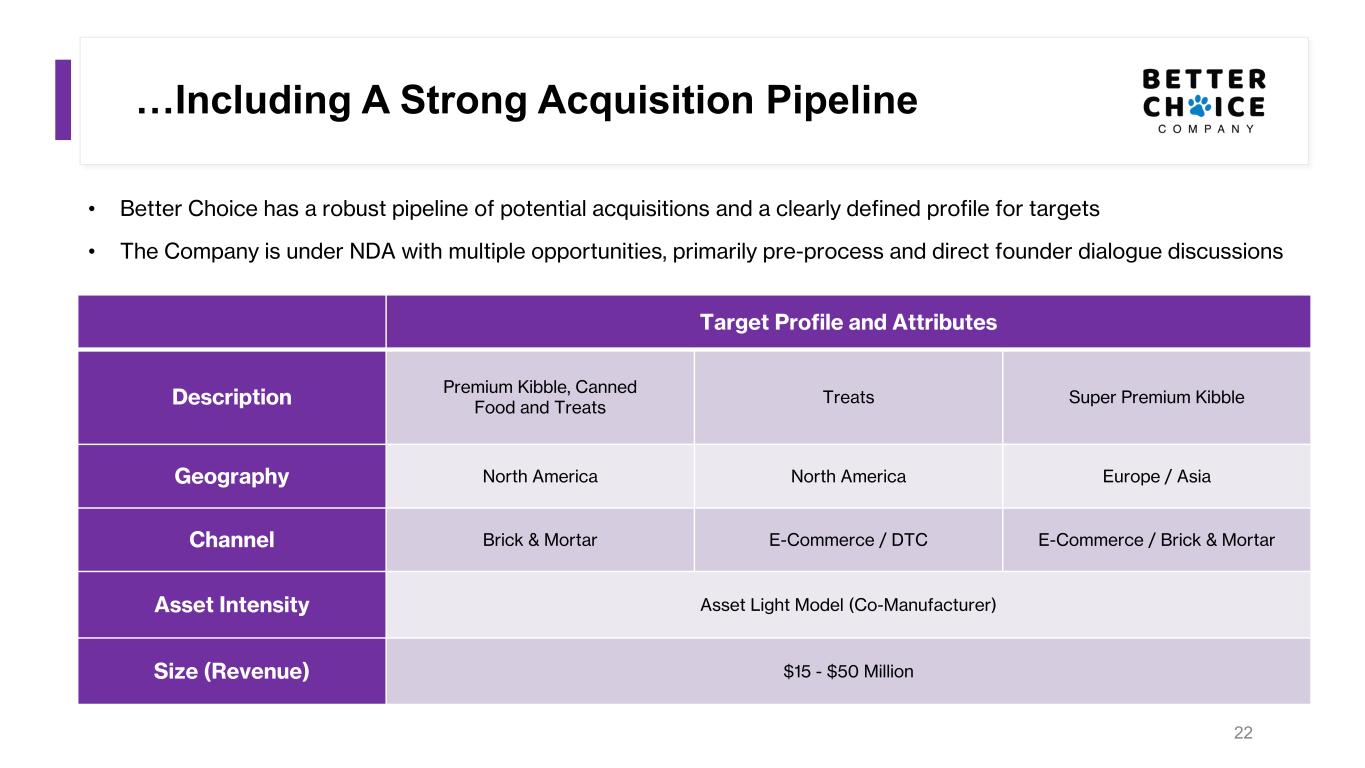
…Including A Strong Acquisition Pipeline 22 Target Profile and Attributes Description Premium Kibble, Canned Food and Treats Treats Super Premium Kibble Geography North America North America Europe / Asia Channel Brick & Mortar E-Commerce / DTC E-Commerce / Brick & Mortar Asset Intensity Asset Light Model (Co-Manufacturer) Size (Revenue) $15 - $50 Million • Better Choice has a robust pipeline of potential acquisitions and a clearly defined profile for targets • The Company is under NDA with multiple opportunities, primarily pre-process and direct founder dialogue discussions
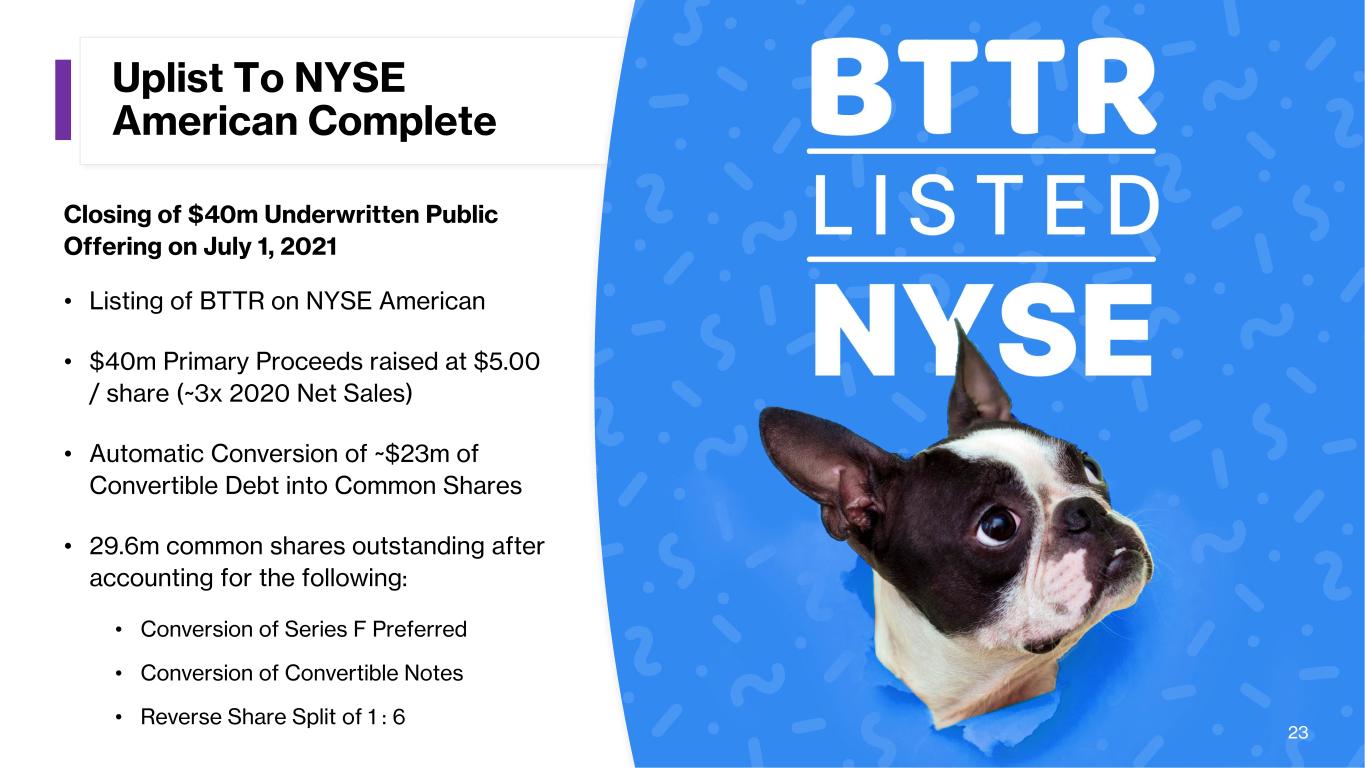
Uplist To NYSE American Complete Closing of $40m Underwritten Public Offering on July 1, 2021 • Listing of BTTR on NYSE American • $40m Primary Proceeds raised at $5.00 / share (~3x 2020 Net Sales) • Automatic Conversion of ~$23m of Convertible Debt into Common Shares • 29.6m common shares outstanding after accounting for the following: • Conversion of Series F Preferred • Conversion of Convertible Notes • Reverse Share Split of 1 : 6 23
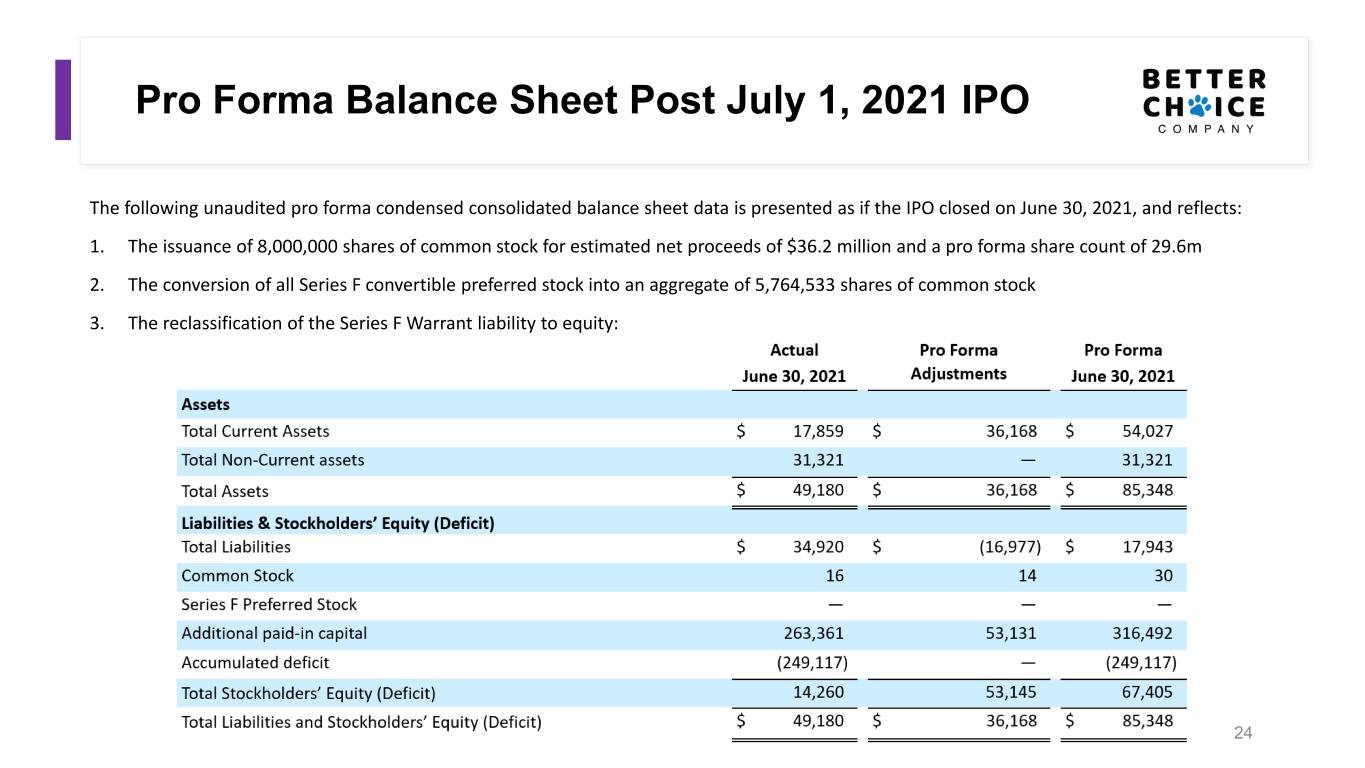
Pro Forma Balance Sheet Post July 1, 2021 IPO 24 The following unaudited pro forma condensed consolidated balance sheet data is presented as if the IPO closed on June 30, 2021, and reflects: 1. The issuance of 8,000,000 shares of common stock for estimated net proceeds of $36.2 million and a pro forma share count of 29.6m 2. The conversion of all Series F convertible preferred stock into an aggregate of 5,764,533 shares of common stock 3. The reclassification of the Series F Warrant liability to equity:
Income Statement 25
Adjusted EBITDA Reconciliation 26 (a) Reflects non-cash expenses related to equity compensation awards three and six months ended June 30, 2021 and 2020. The six months ended June 30, 2021 additionally includes non-cash expenses related to stock purchase warrants issues for third-party services provided. The three and six months ended June 30, 2020 includes non-cash dividends and stock purchase warrants associated with a contract that was subsequently terminated and stock purchase warrants issued in connection with convertible notes. Share-based compensation is an important part of the Company's compensation strategy and without our equity compensation plans, it is probable that salaries and other compensation related costs would be higher. (b) Reflects gain on extinguishment of debt resulting from the full forgiveness of $0.9m in PPP loans for the three months ended June 30, 2021. The six months ended June 30, 2021 additionally includes a loss of $0.4m related to the extinguishment of our former term loan and ABL facility. (c) Reflects costs incurred related to acquisition and integration activities that will not recur and operating expenses that will not recur due to acquisition related synergies. (d) Reflects non-cash expense recognized in cost of goods sold related to the step- up of inventory required under the accounting rules for business combinations. (e) Reflects administrative costs associated with the registration of common shares and other debt and equity financing transactions. (f) Reflects non-cash third party share-based compensation of $0.3 million and non- recurring consulting costs of $0.2 million for the three months ended June 30, 2021. The six months ended June 30, 2021 additionally includes non-recurring severance costs of $0.7 million, non-cash third party share-based compensation of $0.3 million, non-recurring consulting costs of $0.2 million and director costs of $0.1 million, partially offset by a $0.5 million reduction to sales tax liability. Reflects $1.0 million non-recurring contract termination costs for the three months ended June 30, 2020 and $0.1 million and $0.2 million of non-recurring costs for the three and six months ended June 30, 2020, respectively, related to a warehouse facility that was outsourced to a third-party logistics facility in Q4 2020.
Thank You!