
SRX Global Inc 8-K, filed May 13, 2021
SRX Global Inc. (SRXH)
8-K
2021-05-13
For: 2021-05-13
View Original
Added on
April 11, 2026
About this 8-K
SRX Global Inc filed this 8-K on May 13, 2021.
Items reported
- Item 2.02: Financial results
- Item 7.01: Regulation FD disclosure
- Item 9.01: Financial statements and exhibits
UNITED STATES
SECURITIES AND EXCHANGE COMMISSION
Washington, D.C. 20549
_______________________
FORM 8-K
_______________________
CURRENT REPORT
PURSUANT TO SECTION 13 OR 15(d)
OF THE SECURITIES EXCHANGE ACT OF 1934
Date of Report (Date of earliest event reported): May 13, 2021
_______________________
(Exact name of Registrant as Specified in its Charter)
_______________________
| (State or other Jurisdiction of Incorporation) | (Commission File Number) | (IRS Employer Identification No.) | ||||||
(Address of Principal Executive Offices) (Zip Code)
_______________________________________________
(Registrant's Telephone Number, Including Area Code): (813 ) 659-5921
N/A
(Former name or former address, if changed since last report.)
_______________________
Check the appropriate box below if the Form 8-K filing is intended to simultaneously satisfy the filing obligation of the registrant under any of the following provisions:
| Written communications pursuant to Rule 425 under the Securities Act (17 CFR 230.425) | |||||
| Soliciting material pursuant to Rule 14a-12 under the Exchange Act (17 CFR 240.14a-12) | |||||
| Pre-commencement communications pursuant to Rule 14d-2(b) under the Exchange Act (17 CFR 240.14d-2(b)) | |||||
| Pre-commencement communications pursuant to Rule 13e-4(c) under the Exchange Act (17 CFR 240.13e-4(c)) | |||||
Securities registered pursuant to Section 12(b) of the Act:
Title of each class | Trading Symbol(s) | Name of each exchange on which registered | ||||||
| N/A | N/A | N/A | ||||||
Indicate by check mark whether the registrant is an emerging growth company as defined in Rule 405 of the Securities Act of 1933 (§230.405 of this chapter) or Rule 12b-2 of the Securities Exchange Act of 1934 (§240.12b-2 of this chapter).
Emerging growth company ☐
If an emerging growth company, indicate by check mark if the registrant has elected not to use the extended transition period for complying with any new or revised financial accounting standards provided pursuant to Section 13(a) of the Exchange Act. ☐
Item 2.02 Results of Operations and Financial Condition
On May 13, 2021, Better Choice Company Inc., a Delaware corporation (the “Company”), announced its financial results for the quarter ended March 31, 2021. A copy of the press release is attached hereto as Exhibit 99.1.
Item 7.01 Regulation FD Disclosure
Better Choice First Quarter 2021 Financial Results Conference Call
On May 13, 2021, at 8:30 am EDT, the Company will host a conference call to discuss results for the first quarter ended March 31, 2021. Interested parties, including analysts, investors and the media, may listen live via the details below.
| Event: | Better Choice First Quarter 2021 Earnings Call | ||||
| Date: | Thursday, May 13, 2021 | ||||
| Time: | 8:30 a.m. Eastern Time | ||||
| Live Call: | +1-855-327-6837(U.S.Toll-Free)or+1-631-891-4304(International) | ||||
| Webcast: | http://public.viavid.com/index.php?id=144846 | ||||
Updated Investor Presentation
On May 13, 2021, the Company posted an updated investor presentation (the “Investor Presentation”) to its website and it is available in the Company Info section of the Company’s website at https://ir.betterchoicecompany.com/company-information/presentations. A copy of the Investor Presentation is included as Exhibit 99.2 to this Current Report.
The Company intends to use the Investor Presentation in presentations to investors and analysts from time to time in the future. The furnishing of the information in this Current Report is not intended to, and does not, constitute a determination by the Company that the information in this Current Report is material or complete, or that investors should consider this information before making an investment decision with respect to any security of the Company. The information in the materials is presented as of May 13, 2021, and the Company does not assume any obligation to update such information in the future.
The information in Item 7.01 of this Current Report shall not be deemed to be "filed" for the purposes of Section 18 of the Securities and Exchange Act of 1934, as amended (the “Exchange Act”), or otherwise subject to the liabilities of such section, nor shall such information be deemed incorporated by reference in any filing under the Securities Act of 1933, as amended, or the Exchange Act, except as shall be expressly set forth by specific reference in such a filing.
Cautionary Note Regarding Forward-Looking Statements
This Current Report on Form 8-K contains statements that constitute "forward-looking statements" within the meaning of the Private Securities Litigation Reform Act of 1995. Management's projections and expectations are subject to a number of risks and uncertainties that could cause actual performance to differ materially from that predicted or implied. Forward-looking statements may be identified by the use of words such as "expect," "anticipate," "believe," "estimate," "potential," "should" or similar words intended to identify information that is not historical in nature. Forward-looking statements contained herein include, among others, statements concerning management's expectations about future events and the Company’s operating plans and performance, the effects of the COVID-19 outbreak, including levels of consumer, business and economic confidence generally, the regulatory environment, litigation, sales, and the expected benefits of acquisitions, and such statements are based on the current beliefs and expectations of the Company’s management, as applicable, and are subject to known and unknown risks and uncertainties. There are a number of risks and uncertainties that could cause actual results to differ materially from those contemplated by the forward-looking statements. These statements speak only as of the date they are made, and the Company does not intend to update or otherwise revise the forward-looking information to reflect actual results of operations, changes in financial condition, changes in estimates, expectations or assumptions, changes in general economic or industry conditions or other circumstances arising and/or existing since the preparation of this Current Report on Form 8-K or to reflect the occurrence of any unanticipated events. For further information regarding the risks associated with the Company’s business, please refer to the Company’s filings with the Securities and Exchange Commission, including our Annual Report on Form 10-K for the most recent fiscal year end, Quarterly Reports on Form 10-Q and Current Reports on Form 8-K.
Item 9.01 Financial Statements and Exhibits
(d) Exhibits.
| Exhibits | Description | ||||
2
SIGNATURE
Pursuant to the requirements of the Securities Exchange Act of 1934, the Registrant has duly caused this report to be signed on its behalf by the undersigned hereunto duly authorized.
| Better Choice Company Inc. | |||||||||||
| By: | /s/ Scott Lerner | ||||||||||
| Name: | Scott Lerner | ||||||||||
| Title: | Chief Executive Officer | ||||||||||
| May 13, 2021 | |||||||||||
3
Better Choice Company Reports First Quarter 2021 Financial Results
NEW YORK, NY, May 13, 2021 -- Better Choice Company Inc. (OTCQX: BTTR) (the “Company” or “Better Choice”), an animal health and wellness company, today reported its financial results for the First Quarter ended March 31, 2021.
“We are very excited to share our first quarter 2021 results with the investor community. Our performance in the first quarter of 2021 reflects a strong start to the year, which we have been able to deliver while simultaneously focusing on medium and longer-term strategic initiatives. I am very excited to discuss our exciting plans for growth and the progress we have already made as we continue to execute our 2021 plan and look forward to 2022,” said Scott Lerner, CEO of Better Choice.
“We have a strong foundation for growth and our omni-channel approach allows us to market products purpose-built for success in specific channels while simultaneously building our brand across all channels,” continued Mr. Lerner. “For example, we can take learnings from the online environment, which represented 59% of our Q1 2021 sales, to the pet specialty channel, where we see the potential for step-changing growth in 2022. In addition, our international business continues to accelerate, representing 23% of our net sales in Q1 2021 after roughly doubling in 2020 on an annual basis when considering full year Halo sales. If we continue to execute, I strongly believe that we’ll achieve our mission to become the most innovative premium pet food company in the world, with high-quality brands poised for rapid growth led by a team of industry veterans.”
Operational Updates
•Onboarded a new Executive Vice President of Digital Sales, Jenny Condon, and a new Vice President of Supply Chain and Logistics, Alex Vournas.
•Continue to navigate the COVID-19 pandemic while minimizing cash burn and establishing a strong base for growth in our core channels: E-Commerce, direct-to-consumer ("DTC"), Brick & Mortar and International
•Integrated the Halo and TruDog brands, with identified opportunities for future innovation and consolidation.
•Increased investment in long-term brand marketing to coincide with planned pet specialty re-launch in Q1 2022.
•Delivered $6.4m of online net sales in Q1 2021, with ~55% of online purchases made via recurring subscription.
•Secured $25.6m of aggregate minimum purchases with Asian distribution partners from January 1, 2021 through December 31, 2022. Net sales in China were $1.1m in Q1 2021, representing 43% of total international net sales of $2.5m.
•Closed $12.0m credit facility with Wintrust Bank in January 2021, completing the refinancing of the bridge loan and reducing annual cash interest expense by ~$2m.
•Raised $4.1m of cash through an equity raise in January 2021 ahead of planned Summer 2021 Uplist to major US Exchange.
Financial Results for the First Quarter 2021
•First Quarter 2021 Gross Sales of $13.4m
•First Quarter 2021 Net Sales of $10.8m
•First Quarter 2021 Loss from operations of $5.1m
•First Quarter 2021 Adjusted EBITDA of $(1.1)m
Conference Call and Webcast Information
The Company will host a conference call and audio webcast on Thursday, May 13th at 8:30 a.m. (Eastern Time) to answer questions about the Company's operational and financial highlights for the first quarter of 2021.
| Event: | Better Choice First Quarter 2021 Earnings Call | ||||
| Date: | Thursday, May 13, 2021 | ||||
| Time: | 8:30 a.m. Eastern Time | ||||
| Live Call: | +1-855-327-6837(U.S.Toll-Free)or+1-631-891-4304(International) | ||||
| Webcast: | http://public.viavid.com/index.php?id=144846 | ||||
For interested individuals unable to join the conference call, a dial-in replay of the call will be available until April 14, 2021 and can be accessed by dialing +1-844-512-2921 (U.S. Toll Free) or +1-412-317-6671 (International) and entering replay pin number: 10014678.
Better Choice Company Inc.
Unaudited Consolidated Statements of Operations and Comprehensive Loss
(Dollars in thousands, except share and per share amounts)
| Three Months Ended March 31, | |||||||||||
| 2021 | 2020 | ||||||||||
| Net sales | $ | 10,830 | $ | 12,226 | |||||||
| Cost of goods sold | 6,556 | 8,069 | |||||||||
| Gross profit | 4,274 | 4,157 | |||||||||
| Operating expenses: | |||||||||||
| General and administrative | 4,551 | 8,245 | |||||||||
| Share-based compensation | 2,525 | 2,485 | |||||||||
| Sales and marketing | 2,336 | 1,959 | |||||||||
| Total operating expenses | 9,412 | 12,689 | |||||||||
| Loss from operations | (5,138) | (8,532) | |||||||||
| Other expense (income): | |||||||||||
| Interest expense | 835 | 2,301 | |||||||||
| Loss on extinguishment of debt | 394 | — | |||||||||
| Change in fair value of warrant liabilities | 6,483 | (1,379) | |||||||||
| Total other expense, net | 7,712 | 922 | |||||||||
| Net and comprehensive loss | (12,850) | (9,454) | |||||||||
| Preferred dividends | — | 34 | |||||||||
| Net and comprehensive loss available to common stockholders | $ | (12,850) | $ | (9,488) | |||||||
| Weighted average number of shares outstanding, basic and diluted | 57,525,054 | 48,526,396 | |||||||||
| Loss per share, basic and diluted | $ | (0.23) | $ | (0.20) | |||||||
Non-GAAP Measures
Better Choice Company defines Adjusted EBITDA as EBITDA further adjusted to eliminate the impact of certain items that we do not consider indicative of our core operations. Adjusted EBITDA is determined by adding the following items to net and comprehensive loss: depreciation and amortization, interest expense, share-based compensation, warrant expense and dividends, change in fair value of warrant derivative liability, loss on extinguishment of debt, loss on acquisitions, acquisition related expenses, purchase accounting adjustments, equity and debt offering expenses and COVID-19 expenses.
The Company presents Adjusted EBITDA as it is a key measure used by our management and board of directors to evaluate our operating performance, generate future operating plans and make strategic decisions regarding the allocation of capital. We believe that the disclosure of Adjusted EBITDA is useful to investors as this non-GAAP measure forms the basis of how our management team reviews and considers our operating results. By disclosing this non-GAAP measure, we believe that we create for investors a greater understanding of and an enhanced level of transparency into the means by which our management team operates our company. We also believe this measure can assist investors in comparing our performance to that of other companies on a consistent basis without regard to certain items that do not directly affect our ongoing operating performance or cash flows.
Adjusted EBITDA does not represent cash flows from operations as defined by GAAP. Adjusted EBITDA has limitations as a financial measure and you should not consider it in isolation, or as a substitute for, or superior to, financial measures calculated in accordance with GAAP. Because of these limitations, you should consider Adjusted EBITDA alongside other financial performance measures, including various cash flow metrics, net loss, gross margin, and our other GAAP results.
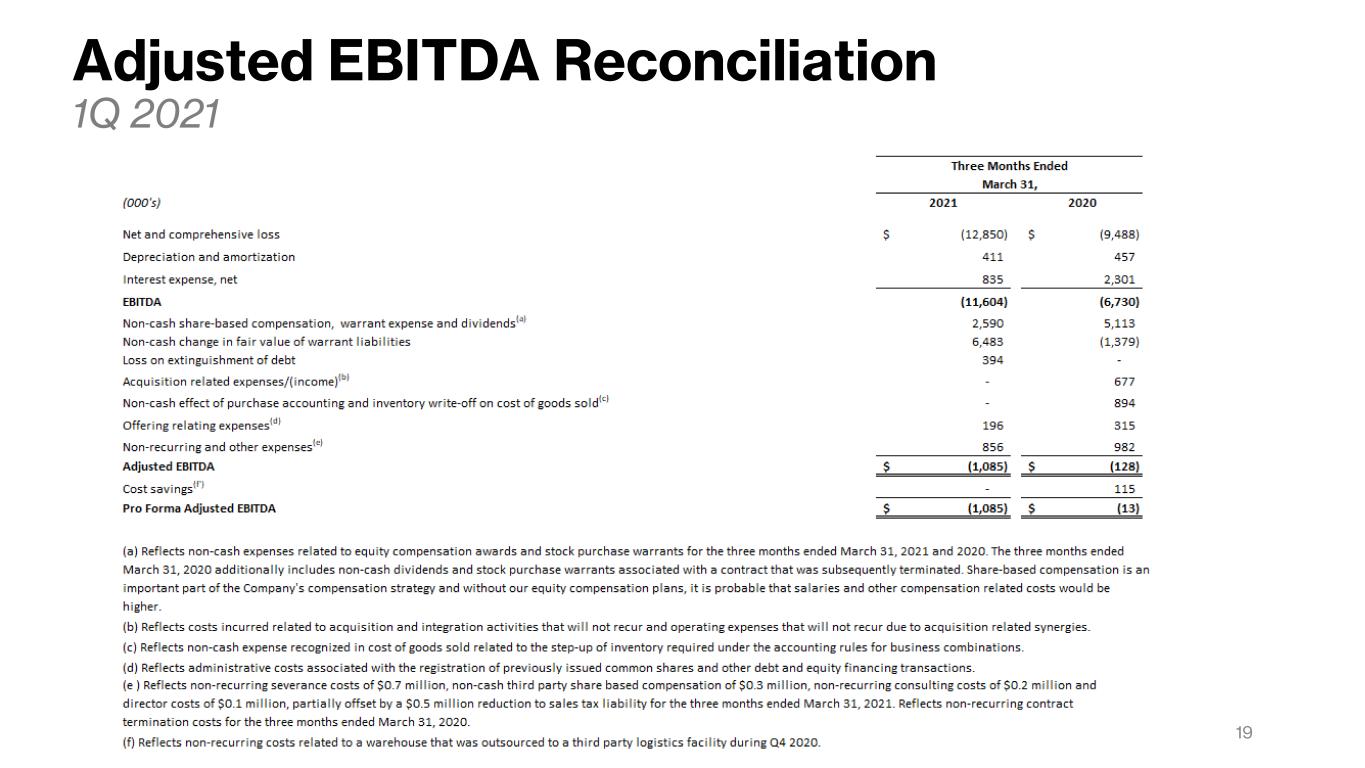
The following table presents a reconciliation of net and comprehensive loss, the closest GAAP financial measure, to EBITDA and Adjusted EBITDA for each of the periods indicated.
Better Choice Company Inc.
Reconciliation of Net Loss to EBITDA and Adjusted EBITDA
(Dollars in thousands)
| Three Months Ended March 31, | Three Months Ended March 31, | ||||||||||
| 2021 | 2020 | ||||||||||
| Net and comprehensive loss | $ | (12,850) | $ | (9,488) | |||||||
| Depreciation and amortization | 411 | 457 | |||||||||
| Interest expense | 835 | 2,301 | |||||||||
| EBITDA | (11,604) | (6,730) | |||||||||
| Non-cash share-based compensation, warrant expense and dividends (a) | 2,590 | 5,113 | |||||||||
| Non-cash change in fair value of warrant liability and warrant derivative liability | 6,483 | (1,379) | |||||||||
| Loss on extinguishment of debt | 394 | — | |||||||||
| Acquisition related expenses/(income) (b) | — | 677 | |||||||||
| Non-cash effect of purchase accounting and inventory write-off on cost of goods sold (c) | — | 894 | |||||||||
| Offering relating expenses (d) | 196 | 315 | |||||||||
| Non-recurring and other expenses (e) | 856 | 982 | |||||||||
| Adjusted EBITDA | $ | (1,085) | $ | (128) | |||||||
| (a) Reflects non-cash expenses related to equity compensation awards and stock purchase warrants for the three months ended March 31, 2021 and 2020. The three months ended March 31, 2020 additionally includes non-cash dividends and stock purchase warrants associated with a contract that was subsequently terminated. Share-based compensation is an important part of the Company's compensation strategy and without our equity compensation plans, it is probable that salaries and other compensation related costs would be higher. | |||||||||||
| (b) Reflects costs incurred related to acquisition and integration activities that will not recur and operating expenses that will not recur due to acquisition related synergies. | |||||||||||
| (c) Reflects non-cash expense recognized in cost of goods sold related to the step-up of inventory required under the accounting rules for business combinations. | |||||||||||
| (d) Reflects administrative costs associated with the registration of previously issued common shares and other debt and equity financing transactions. | |||||||||||
| (e) Reflects non-recurring severance costs of $0.7 million, non-cash third party share-based compensation of $0.3 million, non-recurring consulting costs of $0.2 million and director costs of $0.1 million, partially offset by a $0.5 million reduction to sales tax liability for the three months ended March 31, 2021. Reflects non-recurring contract termination costs for the three months ended March 31, 2020. | |||||||||||
About Better Choice Company Inc.
Better Choice Company Inc. is a rapidly growing animal health and wellness company committed to leading the industry shift toward pet products and services that help dogs and cats live healthier, happier and longer lives. We take an alternative, nutrition-based approach to animal health relative to conventional dog and cat food offerings and position our portfolio of brands to benefit from the mainstream trends of growing pet humanization and consumer focus on health and wellness. We have a demonstrated, multi-decade track record of success selling trusted animal health and wellness products and leverage our established digital footprint to provide pet parents with the knowledge to make informed decisions about their pet’s health. We sell the majority of our dog food, cat food and treats under the Halo and TruDog brands, which are focused, respectively, on providing sustainably sourced kibble and canned food derived from real whole meat, and minimally processed raw-diet dog food and treats. For more information, please visit https://www.betterchoicecompany.com.
Forward Looking Statements
This press release contains forward-looking statements within the meaning of the Private Securities Litigation Reform Act of 1995. The words “believe,” “may,” “estimate,” “continue,” “anticipate,” “intend,” “should,” “plan,” “could,” “target,” “potential,” “is likely,” “will,” “expect” and similar expressions, as they relate to us, are intended to identify forward-looking statements. The Company has based these forward-looking statements largely on our current expectations and projections about future events and financial trends that we believe may affect our financial condition, results of operations, business strategy and financial needs. Some or all of the results anticipated by these forward-looking statements may not be achieved. Further information on the Company’s risk factors is contained in our filings with the SEC. Any forward-looking statement made by us herein speaks only as of the date on which it is made. Factors or events that could cause our actual results to differ may emerge from time to time, and it is not possible for us to predict all of them. The Company undertakes no obligation to publicly update any forward-looking statement, whether as a result of new information, future developments or otherwise, except as may be required by law.
Company Contact:
Better Choice Company, Inc.
Scott Lerner, CEO
Investor Contact:
KCSA Strategic Communications
Valter Pinto, Managing Director
T: 212-896-1254
Valter@KCSA.com

Better Choice Company, Inc. Q1 2021 Financial Results May 13, 2021
Safe Harbor This presentation contains information, statements, beliefs and opinions which are forward-looking, and which reflect current estimates, expectations and projections about future events, referred to herein and which constitute “forward-looking statements” or “forward-looking information” within the meaning of the Private Securities Litigation Reform Act of 1995. All statements other than statements of historical fact included in this document, regarding our strategy, future operations, financial position, prospects, plans and objectives of management are forward-looking statements. Statements containing the words “could”, “believe”, “expect”, “intend”, “should”, “seek”, “anticipate”, “will”, “positioned”, “project”, “risk”, “plan”, “may”, “estimate” or, in each case, their negative and words of similar meaning are intended to identify forward-looking statements. By their nature, forward-looking statements involve a number of known and unknown risks, uncertainties and assumptions, most of which are difficult to predict and many of which are beyond the Company’s control, concerning, among other things, the Company’s anticipated business strategies, anticipated trends in the Company’s business and anticipated market share, that could cause actual results or events to differ materially from those expressed or implied by the forward-looking statements. These risks, uncertainties and assumptions could adversely affect the outcome and financial effects of the plans and events described herein. In addition, even if the outcome and financial effects of the plans and events described herein are consistent with the forward-looking statements contained in this presentation, those results or developments may not be indicative of results or developments in subsequent periods. Although the Company has attempted to identify important risks and factors that could cause actual actions, events or results to differ materially from those described in forward-looking information, there may be other factors and risks that cause actions, events or results not to be as anticipated, estimated or intended. Forward-looking information contained in this presentation is based on the Company’s current estimates, expectations and projections, which the Company believes are reasonable as of the current date. The Company can give no assurance that these estimates, expectations and projections will prove to have been correct. Given these uncertainties, you should not place undue reliance on these forward-looking statements. All statements contained in this presentation are made only as of the date of this presentation, and the Company undertakes no duty to update this information unless required by law. You are also reminded that during this presentation, certain non-GAAP financial measures, such as Adjusted EBITDA, may be discussed. These measure should not be considered an alternative to net income, or any other measure of financial performance or liquidity presented in accordance with generally accepted accounting principles (GAAP). These measures are not necessarily comparable to a similarly titled measure of another company. Please refer to our reconciliations of these discussed figures with the most comparable GAAP measures. 2
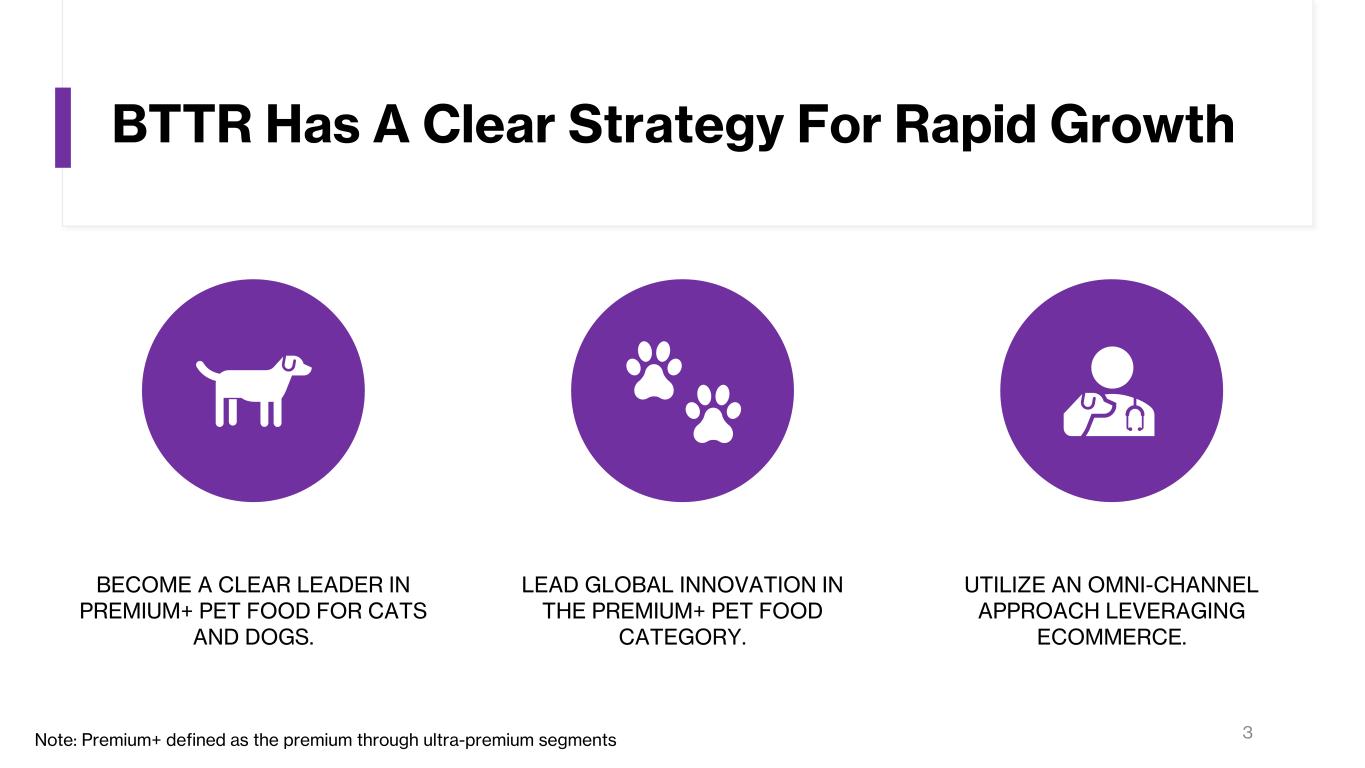
BTTR Has A Clear Strategy For Rapid Growth BECOME A CLEAR LEADER IN PREMIUM+ PET FOOD FOR CATS AND DOGS. LEAD GLOBAL INNOVATION IN THE PREMIUM+ PET FOOD CATEGORY. UTILIZE AN OMNI-CHANNEL APPROACH LEVERAGING ECOMMERCE. 3Note: Premium+ defined as the premium through ultra-premium segments

With A Dynamic Company Culture • Our Mission: Become the most innovative premium pet food company in the world. • Our Vison: The pet food company that excites creativity, optimism, and well-being. • Company Values: o Make products with integrity o Treat pets and their parents with respect o Create long lasting & profitable relationships o Work smarter & faster 4
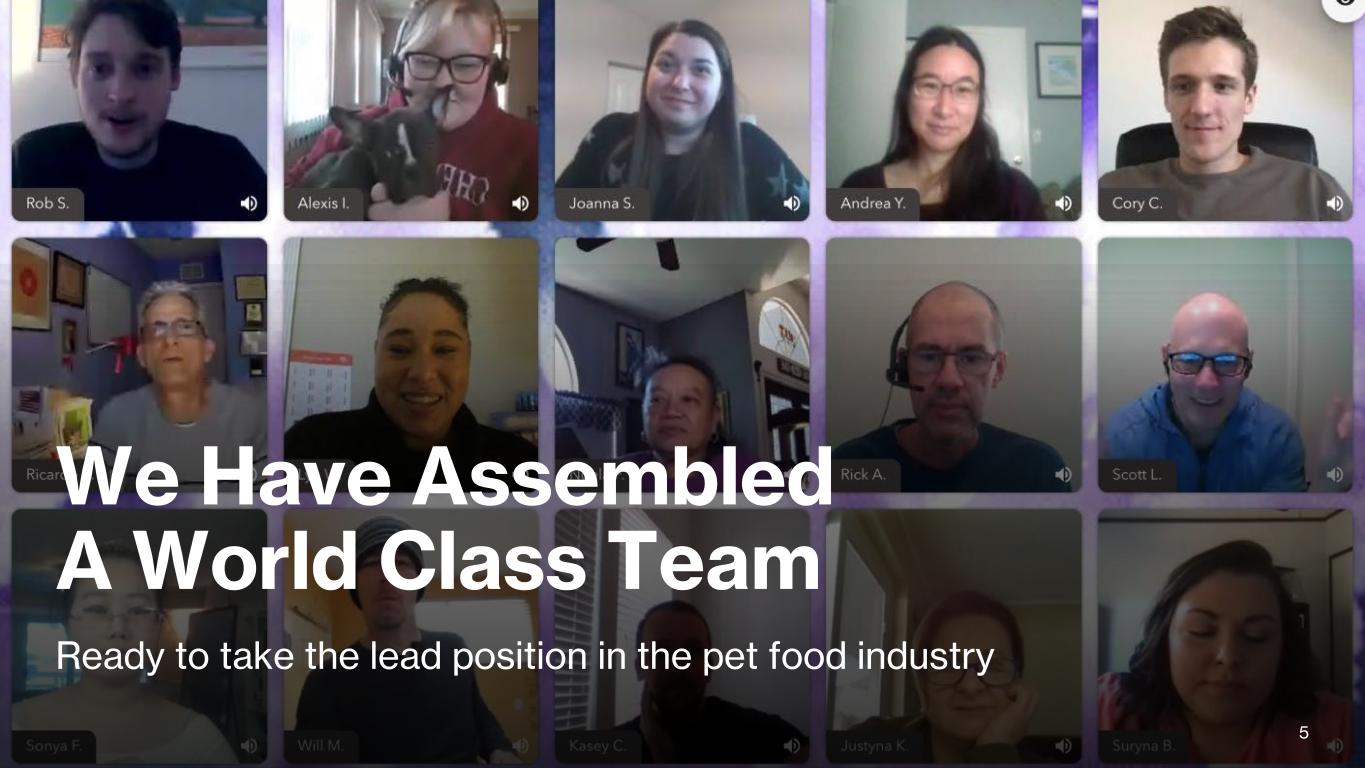
We Have Assembled A World Class Team Ready to take the lead position in the pet food industry 5
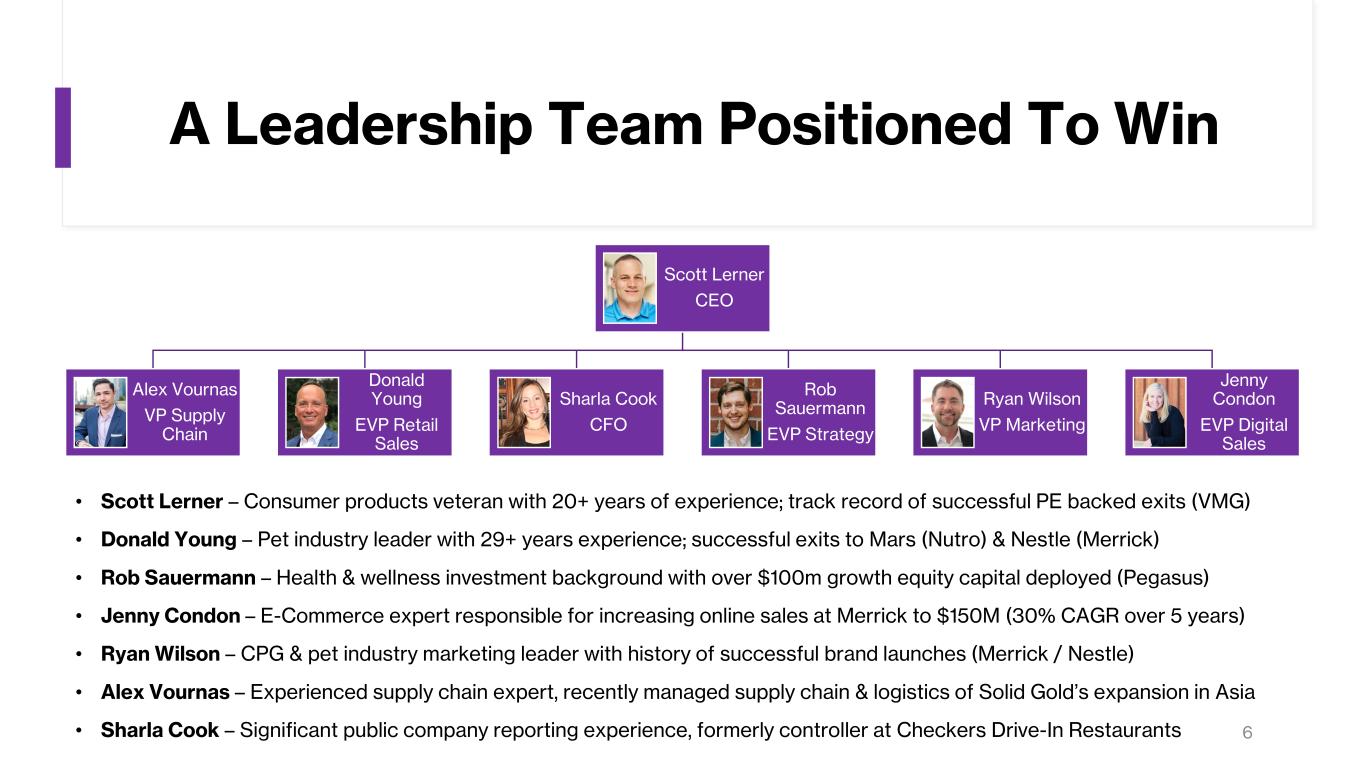
A Leadership Team Positioned To Win Scott Lerner CEO Alex Vournas VP Supply Chain Donald Young EVP Retail Sales Sharla Cook CFO Rob Sauermann EVP Strategy Ryan Wilson VP Marketing Jenny Condon EVP Digital Sales 6 • Scott Lerner – Consumer products veteran with 20+ years of experience; track record of successful PE backed exits (VMG) • Donald Young – Pet industry leader with 29+ years experience; successful exits to Mars (Nutro) & Nestle (Merrick) • Rob Sauermann – Health & wellness investment background with over $100m growth equity capital deployed (Pegasus) • Jenny Condon – E-Commerce expert responsible for increasing online sales at Merrick to $150M (30% CAGR over 5 years) • Ryan Wilson – CPG & pet industry marketing leader with history of successful brand launches (Merrick / Nestle) • Alex Vournas – Experienced supply chain expert, recently managed supply chain & logistics of Solid Gold’s expansion in Asia • Sharla Cook – Significant public company reporting experience, formerly controller at Checkers Drive-In Restaurants
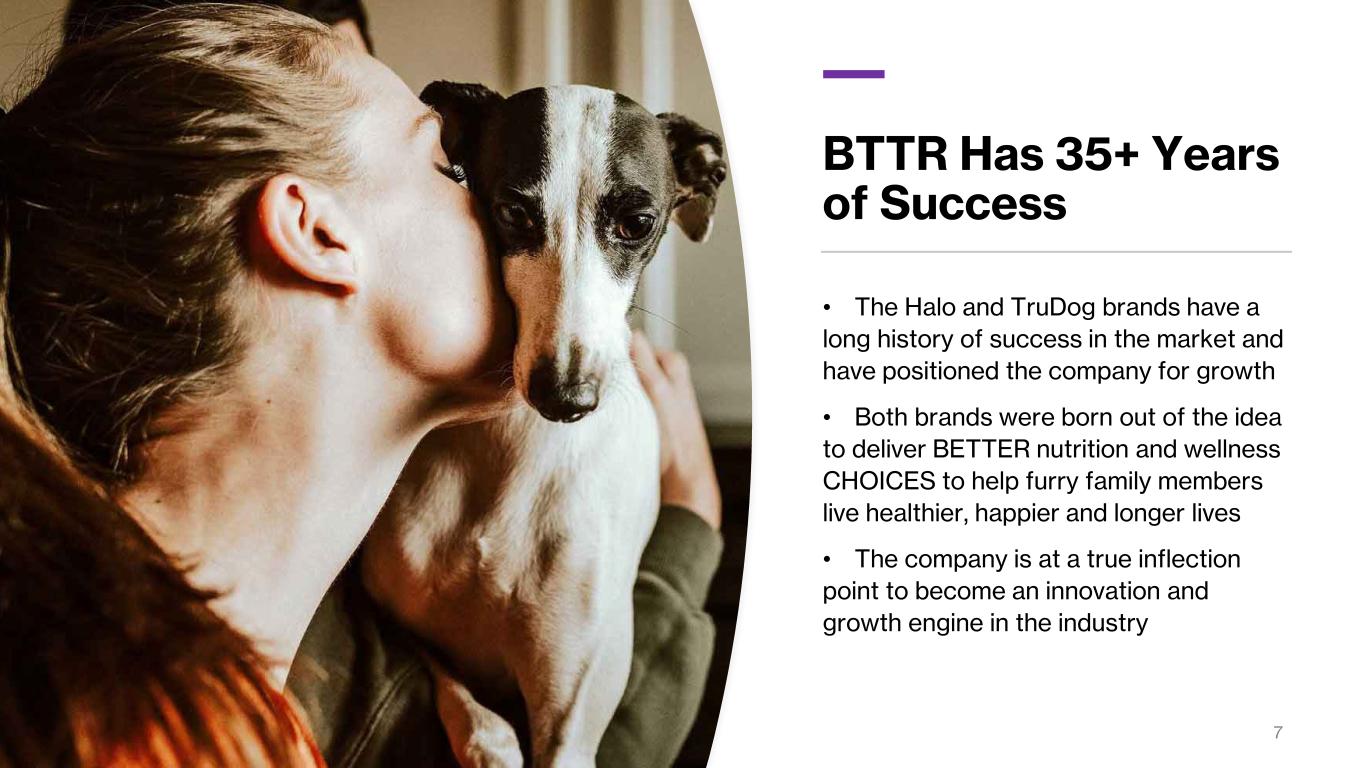
BTTR Has 35+ Years of Success • The Halo and TruDog brands have a long history of success in the market and have positioned the company for growth • Both brands were born out of the idea to deliver BETTER nutrition and wellness CHOICES to help furry family members live healthier, happier and longer lives • The company is at a true inflection point to become an innovation and growth engine in the industry 7
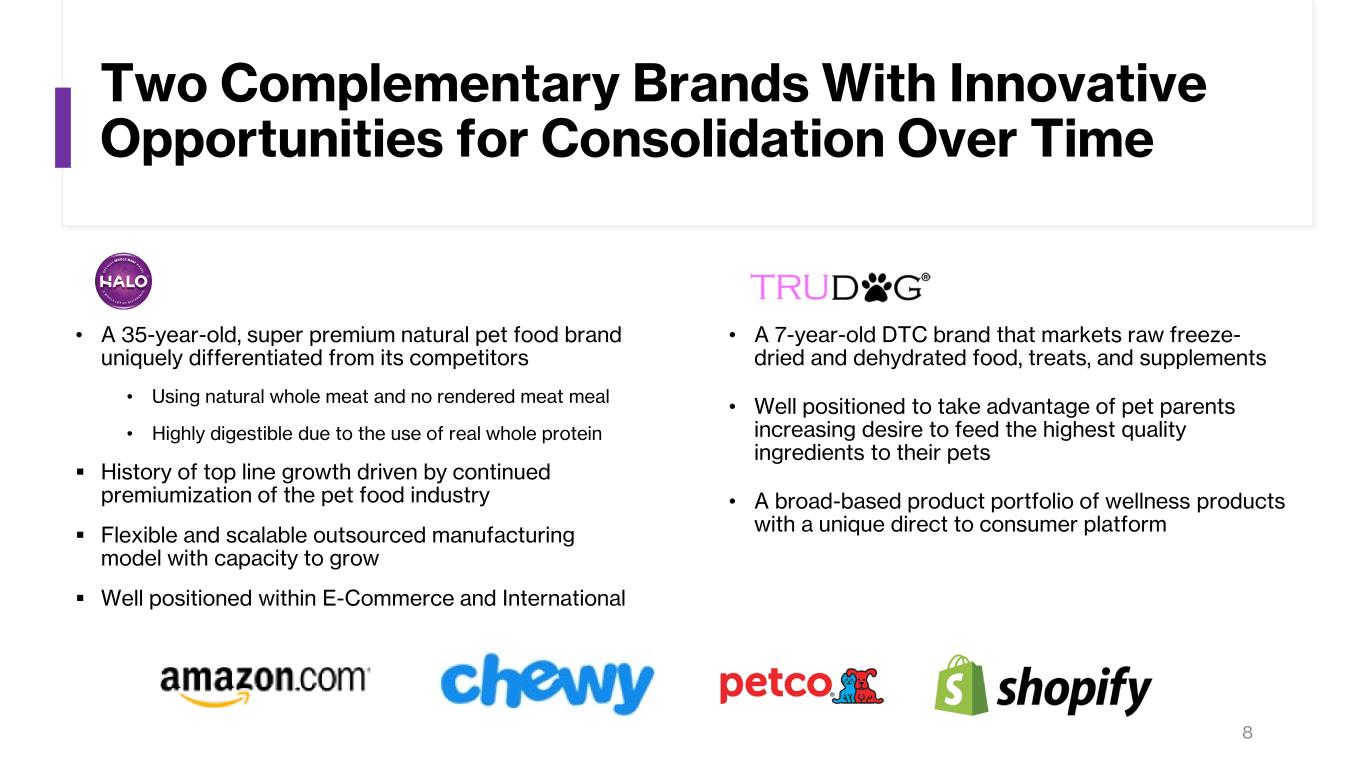
Two Complementary Brands With Innovative Opportunities for Consolidation Over Time • A 35-year-old, super premium natural pet food brand uniquely differentiated from its competitors • Using natural whole meat and no rendered meat meal • Highly digestible due to the use of real whole protein History of top line growth driven by continued premiumization of the pet food industry Flexible and scalable outsourced manufacturing model with capacity to grow Well positioned within E-Commerce and International • A 7-year-old DTC brand that markets raw freeze- dried and dehydrated food, treats, and supplements • Well positioned to take advantage of pet parents increasing desire to feed the highest quality ingredients to their pets • A broad-based product portfolio of wellness products with a unique direct to consumer platform 8
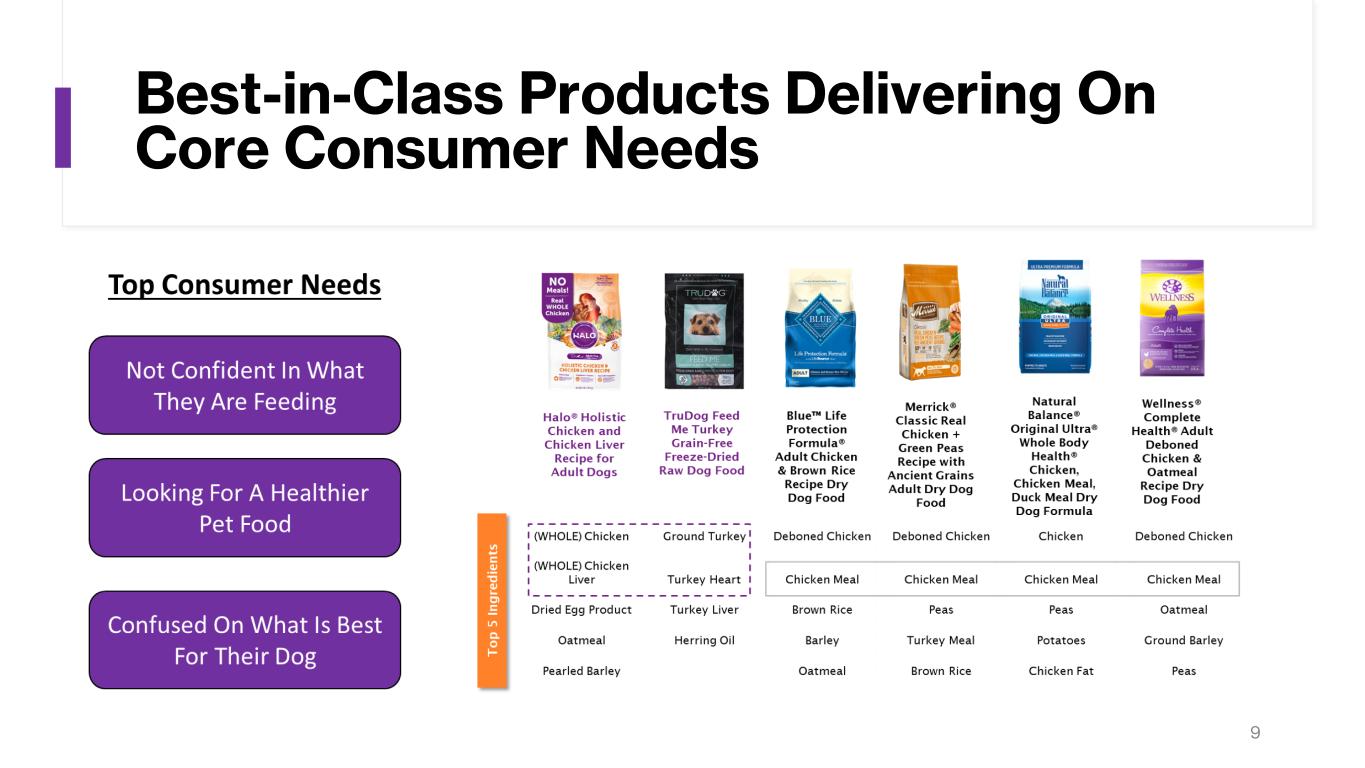
Best-in-Class Products Delivering On Core Consumer Needs 9
10 Simplifying Our Business To Drive Success • Growing 2 differentiated business models is overly complex, costly, and time consuming

One Halo Brand! Driven by creativity and innovation 11
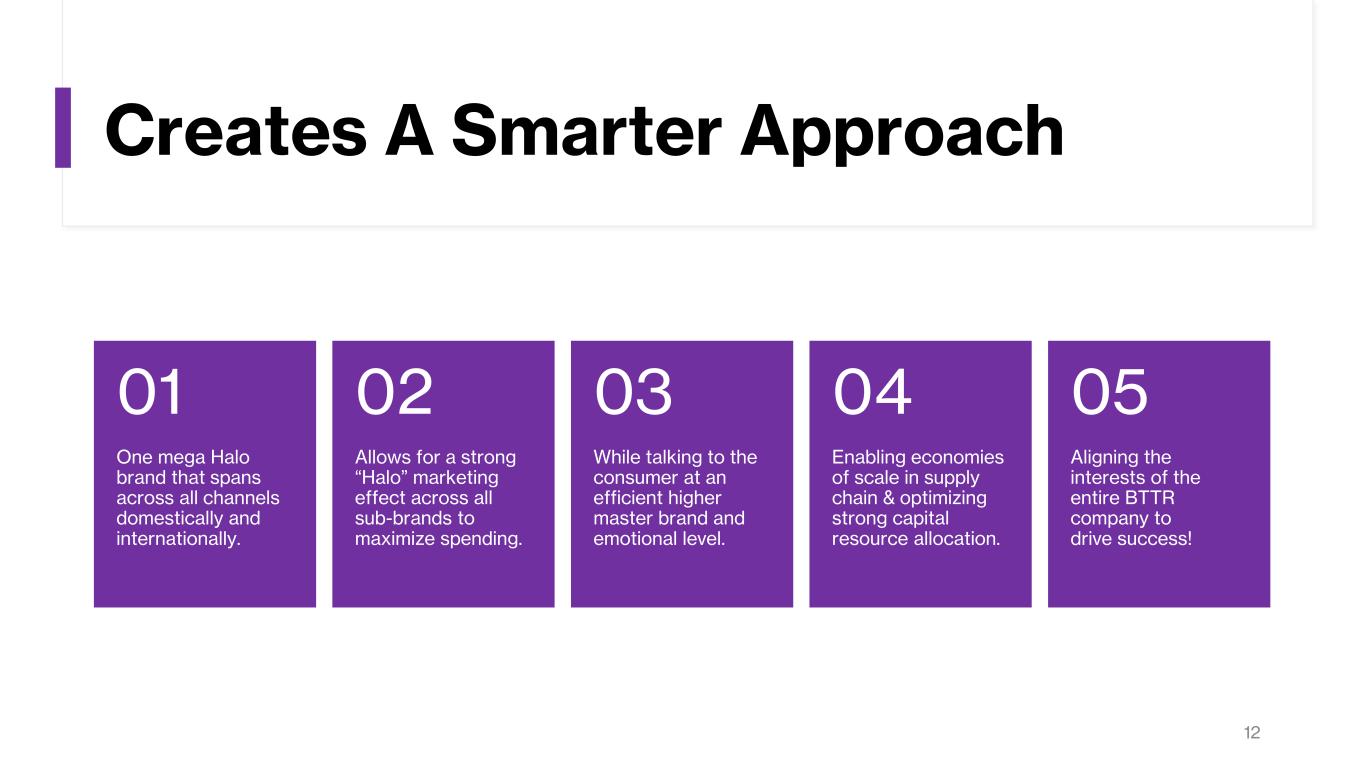
Creates A Smarter Approach 12 One mega Halo brand that spans across all channels domestically and internationally. 01 Allows for a strong “Halo” marketing effect across all sub-brands to maximize spending. 02 While talking to the consumer at an efficient higher master brand and emotional level. 03 Enabling economies of scale in supply chain & optimizing strong capital resource allocation. 04 Aligning the interests of the entire BTTR company to drive success! 05

And Leverages A Differentiated Omni-Channel Strategy Ecommerce Brick & Mortar DTC• Multiple channels allows BTTR to optimize margin by maneuvering revenue from one channel to the next on a monthly basis as needed • By eliminating channel conflict it opens up our ability to share resources from one channel to the next (innovation, data, etc.) 13 Gross Sales FY 2020: ~$20M Q1 2021: $5.9M Gross Sales FY 2020: ~$11M Q1 2021: $2.3M Gross Sales FY 2020: ~$12M Q1 2021: $2.7M + INTERNATIONAL Gross Sales FY 2020: ~$9M Q1 2021: $2.5M
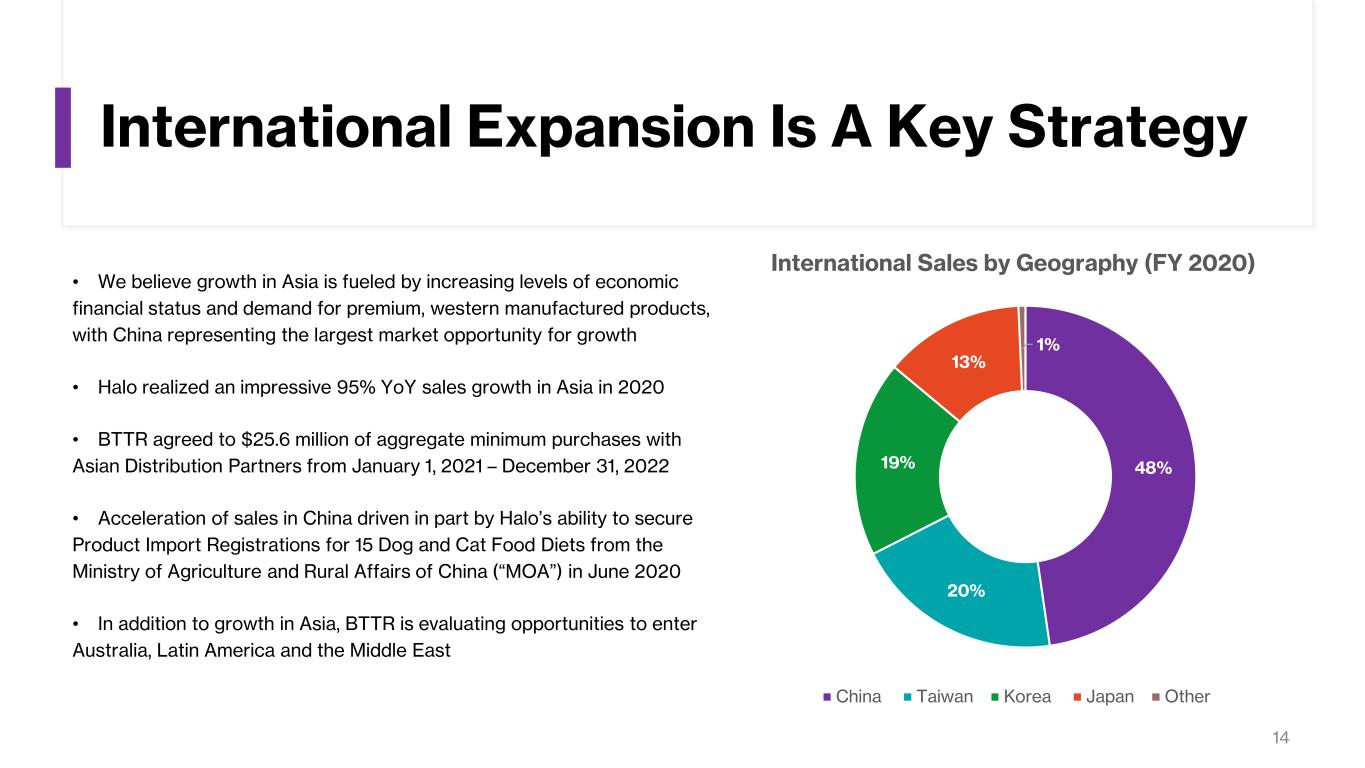
International Expansion Is A Key Strategy • We believe growth in Asia is fueled by increasing levels of economic financial status and demand for premium, western manufactured products, with China representing the largest market opportunity for growth • Halo realized an impressive 95% YoY sales growth in Asia in 2020 • BTTR agreed to $25.6 million of aggregate minimum purchases with Asian Distribution Partners from January 1, 2021 – December 31, 2022 • Acceleration of sales in China driven in part by Halo’s ability to secure Product Import Registrations for 15 Dog and Cat Food Diets from the Ministry of Agriculture and Rural Affairs of China (“MOA”) in June 2020 • In addition to growth in Asia, BTTR is evaluating opportunities to enter Australia, Latin America and the Middle East 14 48% 20% 19% 13% 1% International Sales by Geography (FY 2020) China Taiwan Korea Japan Other
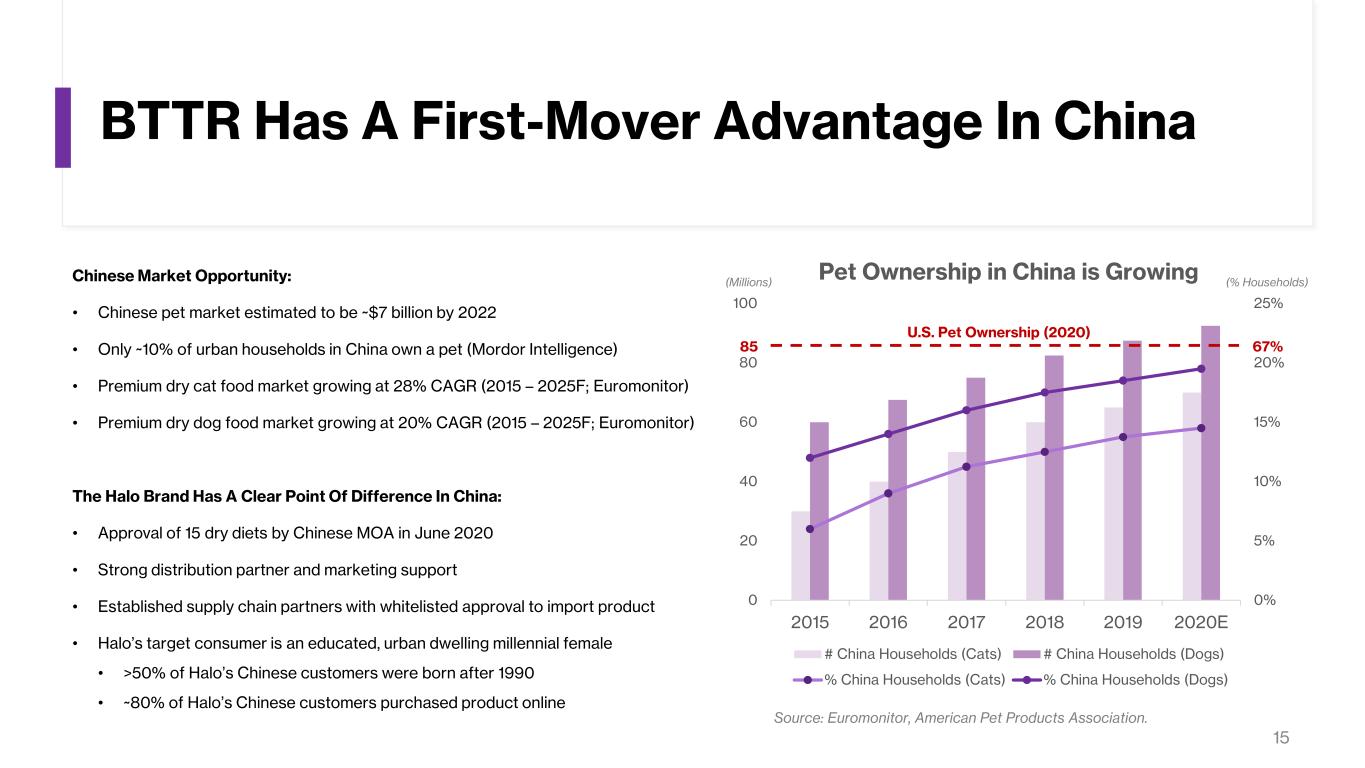
BTTR Has A First-Mover Advantage In China 15 Chinese Market Opportunity: • Chinese pet market estimated to be ~$7 billion by 2022 • Only ~10% of urban households in China own a pet (Mordor Intelligence) • Premium dry cat food market growing at 28% CAGR (2015 – 2025F; Euromonitor) • Premium dry dog food market growing at 20% CAGR (2015 – 2025F; Euromonitor) The Halo Brand Has A Clear Point Of Difference In China: • Approval of 15 dry diets by Chinese MOA in June 2020 • Strong distribution partner and marketing support • Established supply chain partners with whitelisted approval to import product • Halo’s target consumer is an educated, urban dwelling millennial female • >50% of Halo’s Chinese customers were born after 1990 • ~80% of Halo’s Chinese customers purchased product online 0 20 40 60 80 100 2015 2016 2017 2018 2019 2020E 0% 5% 10% 15% 20% 25% Pet Ownership in China is Growing # China Households (Cats) # China Households (Dogs) % China Households (Cats) % China Households (Dogs) (Millions) 85 (% Households) 67% U.S. Pet Ownership (2020) Source: Euromonitor, American Pet Products Association.
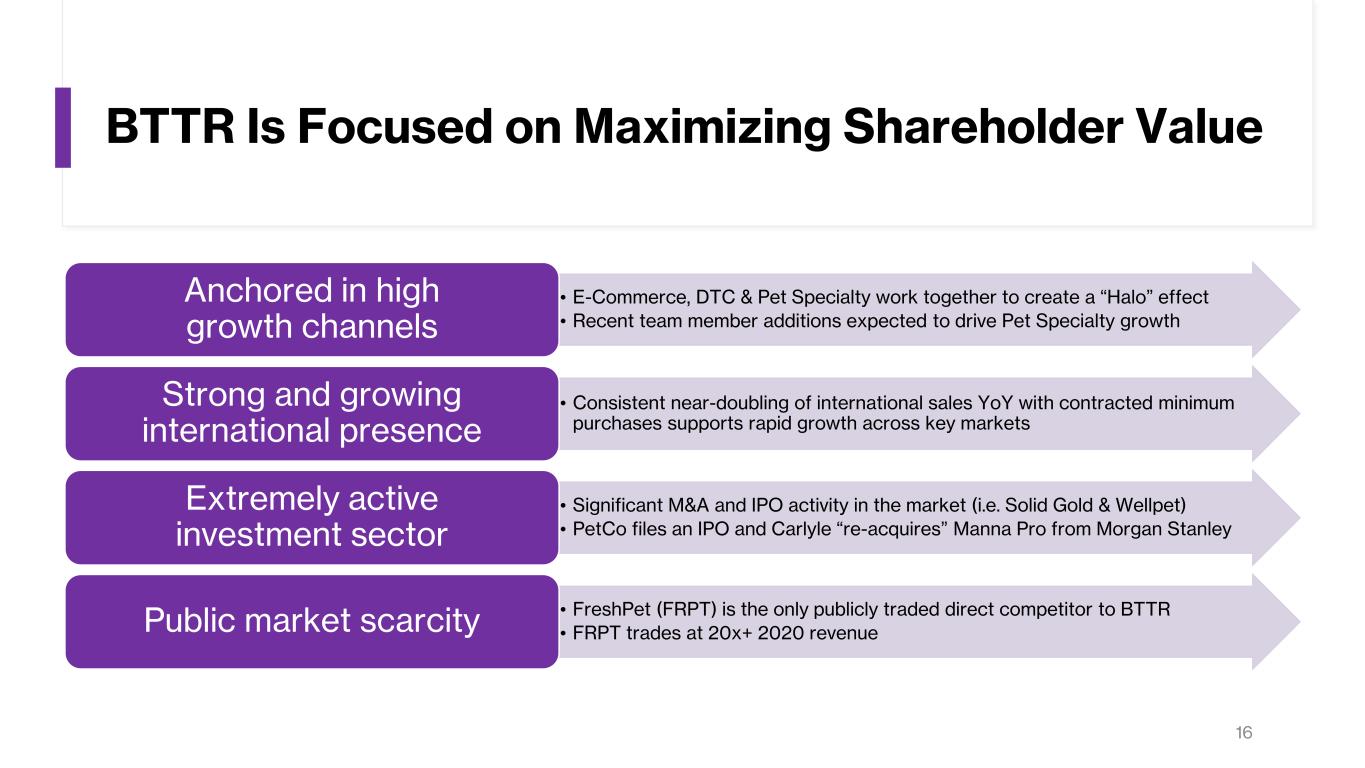
BTTR Is Focused on Maximizing Shareholder Value • E-Commerce, DTC & Pet Specialty work together to create a “Halo” effect • Recent team member additions expected to drive Pet Specialty growth Anchored in high growth channels • Consistent near-doubling of international sales YoY with contracted minimum purchases supports rapid growth across key markets Strong and growing international presence • Significant M&A and IPO activity in the market (i.e. Solid Gold & Wellpet) • PetCo files an IPO and Carlyle “re-acquires” Manna Pro from Morgan Stanley Extremely active investment sector • FreshPet (FRPT) is the only publicly traded direct competitor to BTTR • FRPT trades at 20x+ 2020 revenuePublic market scarcity 16

• We remain committed to locating the right assets that meet our investment criteria • Strong industry contacts increase our ability to source transactions internally and avoid highly competitive auctions • Preference for asset light models that avoid channel confliction / competition with Halo & TruDog brands • Public company structure has historically enabled Better Choice to offer transaction consideration in the form of cash and stock 17 While Simultaneously Sourcing & Evaluating Transformative M&A Transactions 17
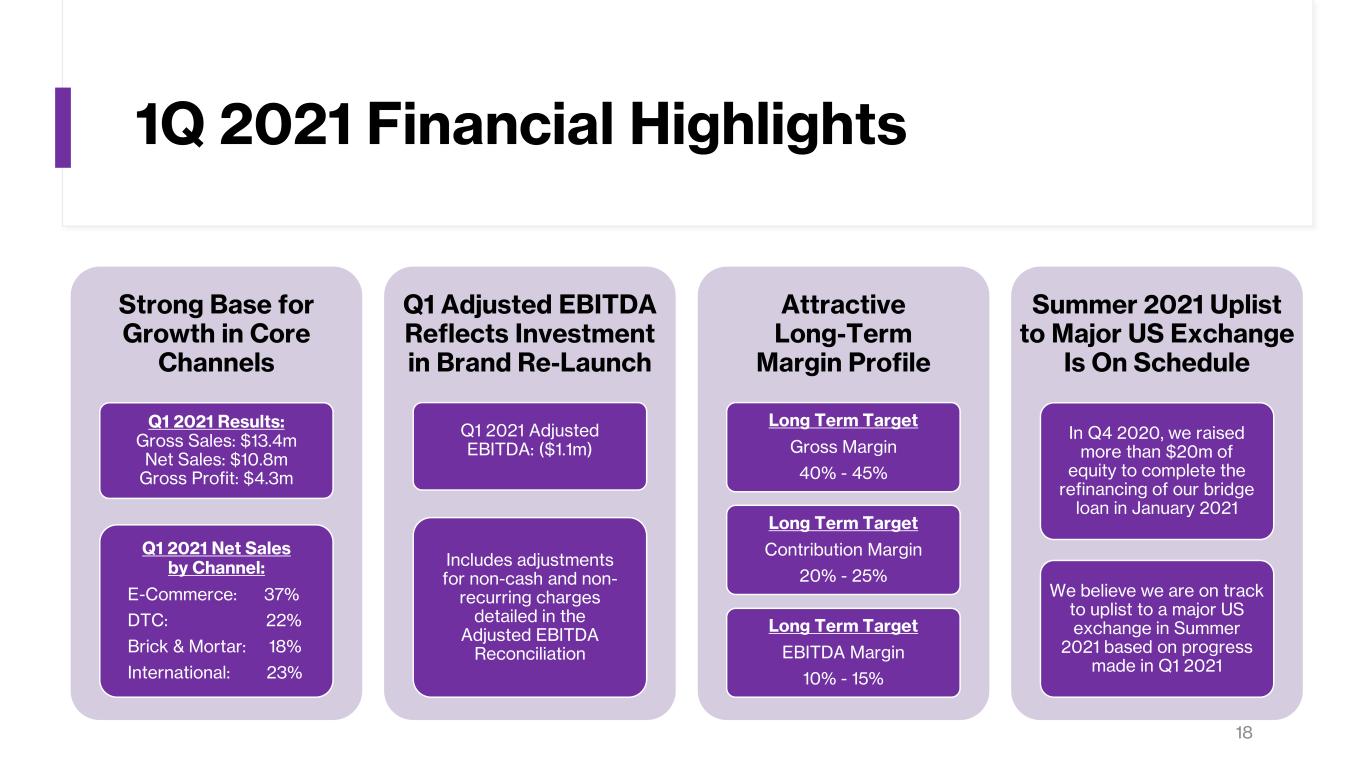
1Q 2021 Financial Highlights Strong Base for Growth in Core Channels Q1 2021 Results: Gross Sales: $13.4m Net Sales: $10.8m Gross Profit: $4.3m Q1 2021 Net Sales by Channel: E-Commerce: 37% DTC: 22% Brick & Mortar: 18% International: 23% Q1 Adjusted EBITDA Reflects Investment in Brand Re-Launch Q1 2021 Adjusted EBITDA: ($1.1m) Includes adjustments for non-cash and non- recurring charges detailed in the Adjusted EBITDA Reconciliation Attractive Long-Term Margin Profile Long Term Target Gross Margin 40% - 45% Long Term Target Contribution Margin 20% - 25% Long Term Target EBITDA Margin 10% - 15% Summer 2021 Uplist to Major US Exchange Is On Schedule In Q4 2020, we raised more than $20m of equity to complete the refinancing of our bridge loan in January 2021 We believe we are on track to uplist to a major US exchange in Summer 2021 based on progress made in Q1 2021 18
1919 Adjusted EBITDA Reconciliation 1Q 2021
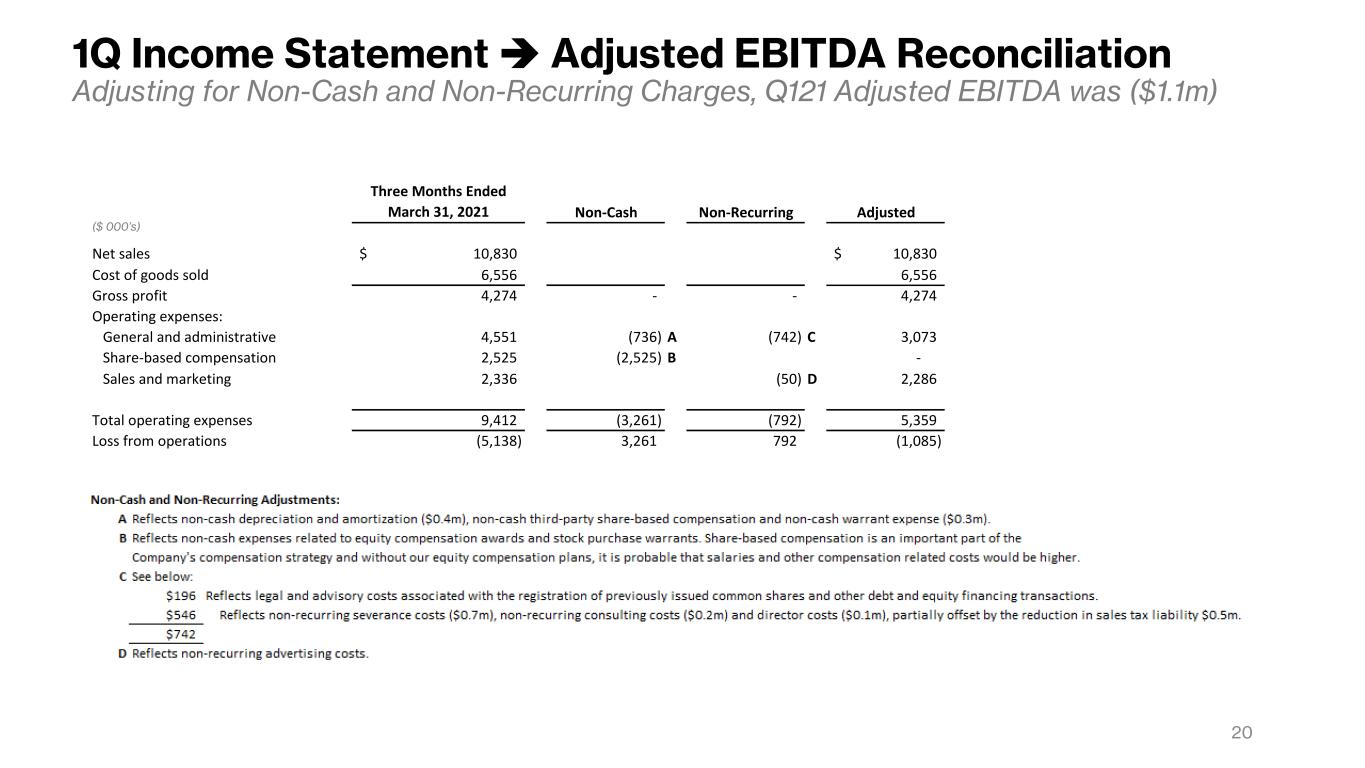
2020 1Q Income Statement Adjusted EBITDA Reconciliation Adjusting for Non-Cash and Non-Recurring Charges, Q121 Adjusted EBITDA was ($1.1m) ($ 000’s) Three Months Ended March 31, 2021 Non-Cash Non-Recurring Adjusted Net sales 10,830$ 10,830$ Cost of goods sold 6,556 6,556 Gross profit 4,274 - - 4,274 Operating expenses: General and administrative 4,551 (736) A (742) C 3,073 Share-based compensation 2,525 (2,525) B - Sales and marketing 2,336 (50) D 2,286 Total operating expenses 9,412 (3,261) (792) 5,359 Loss from operations (5,138) 3,261 792 (1,085)
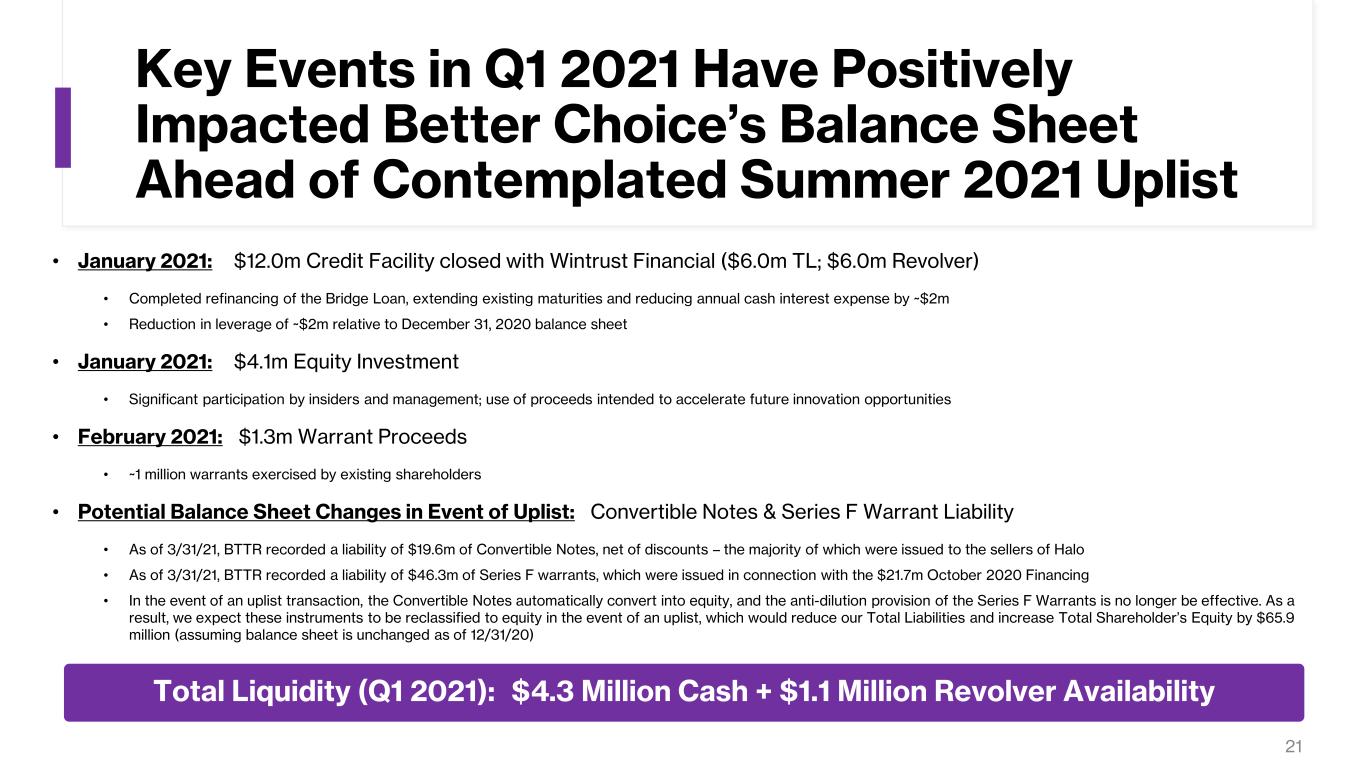
• January 2021: $12.0m Credit Facility closed with Wintrust Financial ($6.0m TL; $6.0m Revolver) • Completed refinancing of the Bridge Loan, extending existing maturities and reducing annual cash interest expense by ~$2m • Reduction in leverage of ~$2m relative to December 31, 2020 balance sheet • January 2021: $4.1m Equity Investment • Significant participation by insiders and management; use of proceeds intended to accelerate future innovation opportunities • February 2021: $1.3m Warrant Proceeds • ~1 million warrants exercised by existing shareholders • Potential Balance Sheet Changes in Event of Uplist: Convertible Notes & Series F Warrant Liability • As of 3/31/21, BTTR recorded a liability of $19.6m of Convertible Notes, net of discounts – the majority of which were issued to the sellers of Halo • As of 3/31/21, BTTR recorded a liability of $46.3m of Series F warrants, which were issued in connection with the $21.7m October 2020 Financing • In the event of an uplist transaction, the Convertible Notes automatically convert into equity, and the anti-dilution provision of the Series F Warrants is no longer be effective. As a result, we expect these instruments to be reclassified to equity in the event of an uplist, which would reduce our Total Liabilities and increase Total Shareholder’s Equity by $65.9 million (assuming balance sheet is unchanged as of 12/31/20) 21 Key Events in Q1 2021 Have Positively Impacted Better Choice’s Balance Sheet Ahead of Contemplated Summer 2021 Uplist 21 Total Liquidity (Q1 2021): $4.3 Million Cash + $1.1 Million Revolver Availability

The New Halo Brand Strategy Simply Works! 1. Easy to execute in market 2. Creates a “Halo” effect 3. Leverages internal scale 4. Allows for selective M&A opportunities over time 22

Thank You 23