
STGW 8-K
Stagwell Inc (STGW)
8-K
2021-03-02
For: 2021-03-02
View Original
Added on
April 10, 2026
UNITED STATES
SECURITIES AND EXCHANGE COMMISSION
WASHINGTON, D.C. 20549
FORM 8-K
Current Report
Pursuant to Section 13 or 15(d) of the Securities Exchange Act of 1934
Date of Report (Date of Earliest Event Reported) — March 2, 2021
(Exact Name of Registrant as Specified in its Charter)
| (Jurisdiction of Incorporation) | (Commission File Number) | (IRS Employer Identification No.) | ||||||
(Address of principal executive offices and zip code)
(646 ) 429-1800
(Registrant’s Telephone Number)
Check the appropriate box below if the Form 8-K filing is intended to simultaneously satisfy the filing obligation of the registrant under any of the following provisions:
| Written communications pursuant to Rule 425 under the Securities Act (17 CFR 230.425) | ||||||||
| Soliciting material pursuant to Rule 14a-12 under the Exchange Act (17 CFR 240.14a-12) | ||||||||
| Pre-commencement communications pursuant to Rule 14d-2(b) under the Exchange Act (17 CFR 240.14d-2(b)) | ||||||||
| Pre-commencement communications pursuant to Rule 13e-4(c) under the Exchange Act (17 CFR 240.13e-4(c)) | ||||||||
Securities registered pursuant to Section 12(b) of the Act:
| Title of each class | Trading symbol(s) | Name of each exchange on which registered | ||||||
Indicate by check mark whether the registrant is an emerging growth company as defined in Rule 405 of the Securities Act of 1933 (§230.405 of this chapter) or Rule 12b-2 of the Securities Exchange Act of 1934 (§240.12b-2 of this chapter).
Emerging growth company ☐
If an emerging growth company, indicate by check mark if the registrant has elected not to use the extended transition period for complying with any new or revised financial accounting standards provided pursuant to Section 13(a) of the Exchange Act. ☐
1
Item 2.02 Results of Operations and Financial Condition
On March 2, 2021, MDC Partners Inc. (the “Company”) issued an earnings release reporting its financial results for the three and twelve months ended December 31, 2020. A copy of this earnings release is attached as Exhibit 99.1 hereto. Following the issuance of this earnings release, the Company will host an earnings call in which its financial results for the three and twelve months ended December 31, 2020 will be discussed. The investor presentation to be used for the call is attached as Exhibit 99.2 hereto.
The Company has posted the materials attached as Exhibit 99.1 and 99.2 on its website (www.mdc-partners.com). The information found on, or otherwise accessible through, the Company’s website is not incorporated into, and does not form a part of, this Current Report on Form 8-K.
The foregoing information (including the exhibits hereto) is being furnished under “Item 2.02 - Results of Operations and Financial Condition”. Such information (including the exhibits hereto) shall not be deemed “filed” for purposes of Section 18 of the Securities Exchange Act of 1934, as amended, nor shall it be deemed incorporated by reference in any filing under the Securities Act of 1933, as amended, except as shall be expressly set forth by specific reference in such filing.
The foregoing information and the exhibits hereto contain forward-looking statements within the meaning of the federal securities laws. These statements are based on present expectations, and are subject to the limitations listed therein and in the Company’s other SEC reports, including that actual events or results may differ materially from those in the forward-looking statements.
2
Item 9.01 Financial Statements and Exhibits.
(d) Exhibits.
104 Cover Page Interactive Data File (embedded within the Inline XBRL document)
3
Signatures
Pursuant to the requirements of the Securities Exchange Act of 1934, the Company has duly caused this report to be signed by the undersigned hereunto duly authorized.
| Date: March 2, 2021 | MDC Partners Inc. | |||||||
| By: | /s/ Frank Lanuto | |||||||
| Frank Lanuto | ||||||||
| Chief Financial Officer | ||||||||

FOR IMMEDIATE ISSUE
| FOR: | MDC Partners Inc. | CONTACT: | Erica Bartsch | ||||||||||||||||||||
| One World Trade Center, Floor 65 | Sloane & Company | ||||||||||||||||||||||
| New York, NY 10007 | 212-446-1875 | ||||||||||||||||||||||
| [email protected] | |||||||||||||||||||||||
MDC PARTNERS INC. REPORTS RESULTS FOR THE THREE AND
TWELVE MONTHS ENDED DECEMBER 31, 2020
TWELVE MONTHS ENDED DECEMBER 31, 2020
Company Delivers 15.8% Sequential Revenue Growth in Fourth Quarter,
Guides 7-9% Revenue Growth in 2021
FOURTH QUARTER & 2020 HIGHLIGHTS:
•Revenue of $328.2 million in the fourth quarter versus $382.0 million in the prior year period, a decline of 14.1%; and $1.20 billion in 2020 versus $1.42 billion in the prior year, a decline of 15.3%.
•Sequential revenue growth of 15.8% from the third quarter of 2020.
•Organic revenue declined 13.7% in the fourth quarter and 13.9% in 2020.
•Net loss attributable to MDC Partners Inc. common shareholders was $243.2 million (inclusive of principally non-cash impairment and other charges of $96.4 million and a $130 million non-cash income tax valuation allowance) in 2020 versus a net loss of $17.6 million in the prior year.
•Adjusted EBITDA of $177.3 million in 2020 versus $174.2 million in the prior year, an increase of 1.8%. Adjusted EBITDA Margin of 14.8% in 2020, increasing 250 basis points from 12.3% in the prior year.
•Excluding the sales of Kingsdale and Sloane, Adjusted EBITDA increased 5.2% in 2020 compared with the prior year.
•Covenant EBITDA of $190.1 million in 2020 versus $180.5 million in 2019, an improvement of 5.3%.
•Net New Business wins totaled $29.5 million in the fourth quarter and $90.3 million in 2020.
New York, NY, March 2, 2021 (NASDAQ: MDCA) – MDC Partners Inc. (“MDC Partners” or the “Company”) today announced financial results for the three and twelve months ended December 31, 2020.
Page 1
“MDC delivered 15.8% sequential revenue growth from the third quarter of 2020, $190 million of Covenant EBITDA in 2020, up 5.3% from prior year and $90 million of net new business in 2020,” said Mark Penn, Chairman and Chief Executive Officer of MDC Partners. “The business continued to see a rebound from pandemic lows, with strong sequential improvement in revenue driven by double-digit growth in most client sectors led by Consumer Products, Technology and Healthcare. While COVID-19 headwinds remain, we expect the rebound to continue into 2021, with 7 to 9% organic revenue growth for the year.”
"Building upon MDC's transformation over the last two years, we recently announced a strategic business combination with The Stagwell Group, which unites the award-winning creative talent of MDC's network with the advanced technology platform of Stagwell, unleashing the power of Talent & Technology around the world.”
Frank Lanuto, Chief Financial Officer, added, “Despite lower revenue in 2020, we expanded Adjusted EBITDA margins by 250 basis points. We continued to lower our leverage, down to 4.4x, and delivered $35 million in cash flow from operations in the quarter, ending the year with $61 million in cash and no revolver borrowings.”
Fourth Quarter and Year-to-Date 2020 Financial Results
Revenue for the fourth quarter of 2020 was $328.2 million versus $382.0 million for the fourth quarter of 2019, a decline of 14.1%. The effect on revenue of foreign exchange was positive 0.7%, the impact of non-GAAP acquisitions (dispositions), net was negative 1.2%, and organic revenue decline was 13.7%. Organic revenue declined primarily due to reduced spending by clients in connection with COVID-19. Net revenue (revenue less billable costs), was $271.4 million for the fourth quarter of 2020 versus $314.0 million for the fourth quarter of 2019, a decline of 13.6%. The effect on net revenue of foreign exchange was positive 0.8%, the impact of non-GAAP acquisitions (dispositions), net was negative 1.2%, and organic net revenue decline was 13.0%.
Revenue in the fourth quarter of 2020 increased 15.8% sequentially from the third quarter of 2020 as client spending activity increased following the initial decline in the third quarter.
Net New Business wins in the fourth quarter of 2020 totaled $29.5 million.
Net loss attributable to MDC Partners Inc. common shareholders for the fourth quarter of 2020 was $237.1 million versus a net loss of $11.1 million for the fourth quarter of 2019. The increase was primarily due to the recognition of impairment charges and an income tax valuation allowance, as well as the decline in revenue. Diluted loss per share attributable to MDC Partners Inc. common shareholders for the fourth quarter of 2020 was $3.23 versus diluted loss per share of $0.15 for the fourth quarter of 2019.
Adjusted EBITDA for the fourth quarter of 2020 was $47.5 million versus $57.0 million for the fourth quarter of 2019, a decrease of 16.6%, primarily due to COVID-19 driven reductions in revenue. In addition, Adjusted EBITDA margin in the fourth quarter of 2020 was 14.5%, down from 14.9% in the fourth quarter of 2019.
Revenue in 2020 was $1.20 billion versus $1.42 billion in 2019, a decline of 15.3%. The effect on revenue of foreign exchange due to the rising US Dollar was negative 0.1%, the impact of non-GAAP acquisitions (dispositions), net was negative 1.3%, and organic revenue decline was 13.9%. Organic revenue declined primarily due to reduced spending by clients in connection with COVID-19. Net revenue (revenue less billable costs), was $1.02 billion in 2020 versus $1.19 billion in 2019, a decline of 13.9%. The effect on net revenue of foreign exchange was negative 0.2%, the impact of non-GAAP acquisitions (dispositions), net was negative 1.4%, and organic net revenue decline was 12.3%.
Page 2
Net New Business wins in 2020 totaled $90.3 million.
Net loss attributable to MDC Partners Inc. common shareholders in 2020 was $243.2 million, an increase versus a net loss of $17.6 million in 2019. The increase was primarily due to the recognition of impairment charges and an income tax valuation allowance, as well as the decline in revenue. Diluted loss per share attributable to MDC Partners Inc. common shareholders in 2020 was $3.34 versus a diluted loss per share of $0.25 in 2019.
Adjusted EBITDA in 2020 was $177.3 million versus $174.2 million in 2019, an increase of 1.8%. The improvement was primarily due to a reduction in expenses to combat the impact of COVID-19 on the business, partially offset by lower revenues. This led to a 250 basis point improvement in Adjusted EBITDA Margin in 2020 to 14.8% from 12.3% in 2019.
Covenant EBITDA for 2020 was $190.1 million versus $180.5 million in 2019, an increase of 5.3%. The change was primarily driven by the increase in Adjusted EBITDA.
Page 3
Financial Outlook
2021 financial guidance is updated as follows:
| 2021 Outlook Commentary * | |||||||||||
| Organic Revenue Growth | We expect approximately 7 to 9% growth in organic revenue. | ||||||||||
| Foreign Exchange Impact, net | No estimated impact at this time. | ||||||||||
| Impact of Non-GAAP Acquisitions (Dispositions), net | Our current expectations are that the impact of acquisitions, net of disposition activity, will have no material impact on revenue. | ||||||||||
| Adjusted EBITDA | The Company expects to complete fiscal year 2021 with approximately $190 million to $200 million of Adjusted EBITDA, approximately 7 to 13% above prior year. | ||||||||||
| * The Company has excluded a quantitative reconciliation with respect to the Company’s 2020 guidance under the “unreasonable efforts” exception in Item 10(e)(1)(i)(B) of Regulation S-K See "Non-GAAP Financial Measures" below for additional information. | |||||||||||
Conference Call
Management will host a conference call on Tuesday, March 2, 2021, at 8:30 a.m. (ET) to discuss its results. The conference call will be accessible by dialing 1-412-902-4266 or toll free 1-888-346-6216. An investor presentation has been posted on our website at www.mdc-partners.com and may be referred to during the conference call.
A recording of the conference call will be accessible within one hour after the end of the conference call until 12:00
a.m. (ET), March 7, 2021, by dialing 1-412-317-0088 or toll free 1-877-344-7529 (passcode 10151483), or by
visiting our website at www.mdc-partners.com
About MDC Partners Inc.
MDC Partners is one of the most influential marketing and communications networks in the world. As "The Place Where Great Talent Lives," MDC Partners is celebrated for its innovative advertising, public relations, branding, digital, social and event marketing agency partners, which are responsible for some of the most memorable and effective campaigns for the world's most respected brands. By leveraging technology, data analytics, insights and strategic consulting solutions, MDC Partners drives creative excellence, business growth and measurable return on marketing investment for over 1,700 clients worldwide. For more information about MDC Partners and its partner firms, visit our website at www.mdc-partners.com and follow us on Twitter at http://www.twitter.com/mdcpartners.
Non-GAAP Financial Measures
In addition to its reported results, MDC Partners has included in this earnings release certain financial results that the Securities and Exchange Commission (SEC) defines as "non-GAAP financial measures." Management
Page 4
believes that such non-GAAP financial measures, when read in conjunction with the Company's reported results, can provide useful supplemental information for investors analyzing period to period comparisons of the Company's results. Such non-GAAP financial measures include the following:
(1) Organic Revenue: “Organic revenue growth” and “organic revenue decline” refer to the positive or negative results, respectively, of subtracting both the foreign exchange and acquisition (disposition) components from total revenue growth. The acquisition (disposition) component is calculated by aggregating prior period revenue for any acquired businesses, less the prior period revenue of any businesses that were disposed of during the current period. The organic revenue growth (decline) component reflects the constant currency impact of (a) the change in revenue of the partner firms that the Company has held throughout each of the comparable periods presented, and (b) “non-GAAP acquisitions (dispositions), net”. Non-GAAP acquisitions (dispositions), net consists of (i) for acquisitions during the current year, the revenue effect from such acquisition as if the acquisition had been owned during the equivalent period in the prior year and (ii) for acquisitions during the previous year, the revenue effect from such acquisitions as if they had been owned during that entire year (or same period as the current reportable period), taking into account their respective pre-acquisition revenues for the applicable periods, and (iii) for dispositions, the revenue effect from such disposition as if they had been disposed of during the equivalent period in the prior year.
(2) Net New Business: Estimate of annualized revenue for new wins less annualized revenue for losses incurred in the period.
(3) Adjusted EBITDA: Adjusted EBITDA is a non-GAAP financial measure that represents Net income (loss) attributable to MDC Partners Inc. common shareholders plus or minus adjustments to operating income (loss) plus depreciation and amortization, stock-based compensation, deferred acquisition consideration adjustments, distributions from non-consolidated affiliates, and other items, net which includes items such as severance expense and other restructuring expenses, including costs for leases that will either be terminated or sublet in connection with the centralization of our New York real estate portfolio.
(4) Covenant EBITDA: Covenant EBITDA is a measure that includes pro forma adjustments for acquisitions, onetime charges, permitted dispositions and other items, as defined in the Company's Credit Agreement. We believe that the presentation of Covenant EBITDA is useful to investors as it eliminates the effect of certain non-cash and other items not necessarily indicative of a company’s underlying operating performance. In addition, the presentation of Covenant EBITDA provides additional information to investors about the calculation of, and compliance with, certain financial covenants in the Company's Credit Agreement.
Included in this earnings release are tables reconciling MDC Partners’ reported results to arrive at certain of these
non-GAAP financial measures.
Page 5
This press release contains forward-looking statements. Statements in this press release that are not historical facts, including without limitation the information under the heading "Financial Outlook" and statements about the Company’s beliefs and expectations, earnings (loss) guidance, recent business and economic trends, potential acquisitions, and estimates of amounts for redeemable noncontrolling interests and deferred acquisition consideration, constitute forward-looking statements. Words such as “estimates”, “expects”, “contemplates”, “will”, “anticipates”, “projects”, “plans”, “intends”, “believes”, “forecasts”, “may”, “should”, and variations of such words or similar expressions are intended to identify forward-looking statements. These statements are based on current plans, estimates and projections, and are subject to change based on a number of factors, including those outlined in this section. Forward-looking statements speak only as of the date they are made, and the Company undertakes no obligation to update publicly any of them in light of new information or future events, if any.
Forward-looking statements involve inherent risks and uncertainties. A number of important factors could cause actual results to differ materially from those contained in any forward-looking statements. Such risk factors include, but are not limited to, the following:
•risks associated with international, national and regional unfavorable economic conditions that could affect the Company or its clients, including as a result of the novel coronavirus pandemic (“COVID-19”);
•the effects of the outbreak of COVID-19, including the measures to reduce its spread, and the impact on the economy and demand for our services, which may precipitate or exacerbate other risks and uncertainties;
•an inability to realize expected benefits of the proposed redomiciliation of the Company from the federal jurisdiction of Canada to the State of Delaware (the “Redomiciliation”) and the subsequent combination of the Company’s business with the business of the subsidiaries of Stagwell Media LP (“Stagwell”) that own and operate a portfolio of marketing services companies (the “Business Combination” and, together with the Redomiciliation, the “Proposed Transactions”) or the occurrence of difficulties in connection with the Proposed Transaction;
•adverse tax consequences in connection with the Proposed Transactions for the Company, its operations and its shareholders, that may differ from the expectations of the Company, including that future changes in tax law, potential increases to corporate tax rates in the United States and disagreements with the tax authorities on the Company’s determination of value and computations of its tax attributes may result in increased tax costs;
•the occurrence of material Canadian federal income tax (including material “emigration tax”) as a result of the Proposed Transactions;
•the impact of uncertainty associated with the Proposed Transactions on the Company’s businesses;
•direct or indirect costs associated with the Proposed Transactions, which could be greater than expected;
•the risk that a condition to completion of the Proposed Transactions may not be satisfied and the Proposed Transactions may not be completed;
•the risk of parties challenging the Proposed Transactions or the impact of the Proposed Transactions on the Company’s debt arrangements;
•the Company’s ability to attract new clients and retain existing clients;
•reduction in client spending and changes in client advertising, marketing and corporate communications requirements;
•financial failure of the Company’s clients;
•the Company’s ability to retain and attract key employees;
•the Company’s ability to achieve the full amount of its stated cost saving initiatives;
•the Company’s implementation of strategic initiatives;
•the Company’s ability to remain in compliance with its debt agreements and the Company’s ability to finance its contingent payment obligations when due and payable, including but not limited to those relating to redeemable noncontrolling interests and deferred acquisition consideration;
Page 6
•the successful completion and integration of acquisitions which complement and expand the Company’s business capabilities; and
•foreign currency fluctuations.
Investors should carefully consider these risk factors and the additional risk factors outlined in more detail in the Company's Annual Report on Form 10-K and in the Company’s other SEC filings.
Page 7
SCHEDULE 1
MDC PARTNERS INC.
UNAUDITED CONSOLIDATED STATEMENTS OF OPERATIONS
(US$ in 000s, Except per Share Amounts)
| Three Months Ended December 31, | Twelve Months Ended December 31, | ||||||||||||||||||||||
| 2020 | 2019 | 2020 | 2019 | ||||||||||||||||||||
| Revenue: | |||||||||||||||||||||||
| Services | $ | 328,168 | $ | 381,975 | $ | 1,199,011 | $ | 1,415,803 | |||||||||||||||
| Operating Expenses: | |||||||||||||||||||||||
| Cost of services sold | 209,043 | 260,725 | 769,899 | 961,076 | |||||||||||||||||||
| Office and general expenses | 136,490 | 94,219 | 341,565 | 328,339 | |||||||||||||||||||
| Depreciation and amortization | 9,468 | 9,460 | 36,905 | 38,329 | |||||||||||||||||||
| Impairment and other losses | 77,240 | 6,655 | 96,399 | 8,599 | |||||||||||||||||||
| 432,241 | 371,059 | 1,244,768 | 1,336,343 | ||||||||||||||||||||
| Operating income (loss) | (104,073) | 10,916 | (45,757) | 79,460 | |||||||||||||||||||
| Other Income (Expenses): | |||||||||||||||||||||||
| Interest expense and finance charges, net | (15,344) | (15,658) | (62,163) | (64,942) | |||||||||||||||||||
| Foreign exchange gain (loss) | 6,274 | 4,349 | (982) | 8,750 | |||||||||||||||||||
| Other, net | (2,223) | 2,158 | 20,500 | (2,401) | |||||||||||||||||||
| (11,293) | (9,151) | (42,645) | (58,593) | ||||||||||||||||||||
| Income (loss) before income taxes and equity in earnings of non-consolidated affiliates | (115,366) | 1,765 | (88,402) | 20,867 | |||||||||||||||||||
| Income tax expense | 109,526 | 4,024 | 116,555 | 10,316 | |||||||||||||||||||
| Income (loss) before equity in earnings of non-consolidated affiliates | (224,892) | (2,259) | (204,957) | 10,551 | |||||||||||||||||||
| Equity in earnings (losses) of non-consolidated affiliates | (1,411) | — | (2,240) | 352 | |||||||||||||||||||
| Net income (loss) | (226,303) | (2,259) | (207,197) | 10,903 | |||||||||||||||||||
| Net income attributable to the noncontrolling interest | (7,154) | (5,419) | (21,774) | (16,156) | |||||||||||||||||||
| Net loss attributable to MDC Partners Inc. | (233,457) | (7,678) | (228,971) | (5,253) | |||||||||||||||||||
| Accretion on and net income allocated to convertible preference shares | (3,651) | (3,373) | (14,179) | (12,304) | |||||||||||||||||||
| Net loss attributable to MDC Partners Inc. common shareholders | $ | (237,108) | $ | (11,051) | $ | (243,150) | $ | (17,557) | |||||||||||||||
| Loss Per Common Share: | |||||||||||||||||||||||
| Basic | |||||||||||||||||||||||
| Net loss attributable to MDC Partners Inc. common shareholders | $ | (3.23) | $ | (0.15) | $ | (3.34) | $ | (0.25) | |||||||||||||||
| Diluted | |||||||||||||||||||||||
| Net loss attributable to MDC Partners Inc. common shareholders | $ | (3.23) | $ | (0.15) | $ | (3.34) | $ | (0.25) | |||||||||||||||
| Weighted Average Number of Common Shares Outstanding: | |||||||||||||||||||||||
| Basic | 73,312,906 | 72,149,204 | 72,862,178 | 69,132,100 | |||||||||||||||||||
| Diluted | 73,312,906 | 72,149,204 | 72,862,178 | 69,132,100 | |||||||||||||||||||
Page 8
SCHEDULE 2
MDC PARTNERS INC.
UNAUDITED REVENUE RECONCILIATION
(US$ in 000s, except percentages)
| Three Months Ended | Twelve Months Ended | ||||||||||||||||||||||
| Revenue $ | % Change | Revenue $ | % Change | ||||||||||||||||||||
| December 31, 2019 | $ | 381,975 | $ | 1,415,803 | |||||||||||||||||||
Organic revenue (1) | (52,180) | (13.7) | % | (197,466) | (13.9) | % | |||||||||||||||||
| Non-GAAP acquisitions (dispositions), net | (4,447) | (1.2) | % | (18,312) | (1.3) | % | |||||||||||||||||
| Foreign exchange impact | 2,820 | 0.7 | % | (1,014) | (0.1) | % | |||||||||||||||||
| Total change | (53,807) | (14.1) | % | (216,792) | (15.3) | % | |||||||||||||||||
| December 31, 2020 | $ | 328,168 | $ | 1,199,011 | |||||||||||||||||||
(1) Organic revenue refers to the positive results of subtracting both the foreign exchange and acquisition (disposition) components from total revenue growth. The acquisition (disposition) component is calculated by aggregating prior period revenue for any acquired businesses, less the prior period revenue of any businesses that were disposed of during the current period. The organic revenue component reflects the constant currency impact of (a) the change in revenue of the partner firms which the Company has held throughout each of the comparable periods presented, and (b) “non-GAAP acquisitions (dispositions), net”. Non-GAAP acquisitions (dispositions), net consists of (i) for acquisitions during the current year, the revenue effect from such acquisition as if the acquisition had been owned during the equivalent period in the prior year and (ii) for acquisitions during the previous year, the revenue effect from such acquisitions as if they had been owned during that entire year (or same period as the current reportable period), taking into account their respective pre-acquisition revenues for the applicable periods, and (iii) for dispositions, the revenue effect from such disposition as if they had been disposed of during the equivalent period in the prior year. See "Non-GAAP Financial Measures" herein.
Note: Actuals may not foot due to rounding.
Page 9
SCHEDULE 3
MDC PARTNERS INC.
UNAUDITED RECONCILIATION OF NET INCOME (LOSS) TO ADJUSTED EBITDA
(US$ in 000s, except percentages)
For the Three Months Ended December 31, 2020
| Integrated Networks - Group A | Integrated Networks - Group B | Media & Data Network | All Other | Corporate | Total | ||||||||||||||||||||||||||||||
| Revenue | $ | 119,228 | $ | 112,325 | $ | 35,834 | $ | 60,781 | $ | — | $ | 328,168 | |||||||||||||||||||||||
| Net loss attributable to MDC Partners Inc. common shareholders | $ | (237,108) | |||||||||||||||||||||||||||||||||
| Adjustments to reconcile to operating loss: | |||||||||||||||||||||||||||||||||||
| Accretion on and net income allocated to convertible preference shares | 3,651 | ||||||||||||||||||||||||||||||||||
| Net income attributable to the noncontrolling interests | 7,154 | ||||||||||||||||||||||||||||||||||
| Equity in losses of non-consolidated affiliates | 1,411 | ||||||||||||||||||||||||||||||||||
| Income tax expense | 109,526 | ||||||||||||||||||||||||||||||||||
| Interest expense and finance charges, net | 15,344 | ||||||||||||||||||||||||||||||||||
| Foreign exchange gain | (6,274) | ||||||||||||||||||||||||||||||||||
| Other, net | 2,223 | ||||||||||||||||||||||||||||||||||
| Operating income (loss) | $ | (25,040) | $ | 1,501 | $ | (10,501) | $ | (41,066) | $ | (28,967) | $ | (104,073) | |||||||||||||||||||||||
| margin | (21.0) | % | 1.3 | % | (29.3) | % | (67.6) | % | (31.7) | % | |||||||||||||||||||||||||
| Adjustments: | |||||||||||||||||||||||||||||||||||
| Depreciation and amortization | 1,559 | 3,478 | 1,975 | 1,743 | 713 | 9,468 | |||||||||||||||||||||||||||||
| Impairment and other losses | 6,391 | 13,998 | 11,725 | 45,126 | — | 77,240 | |||||||||||||||||||||||||||||
| Stock-based compensation | 1,700 | 803 | — | (35) | 1,143 | 3,611 | |||||||||||||||||||||||||||||
| Deferred acquisition consideration adjustments | 39,682 | 1,153 | — | 837 | — | 41,672 | |||||||||||||||||||||||||||||
Distributions from non- consolidated affiliates (1) | — | — | — | — | 902 | 902 | |||||||||||||||||||||||||||||
Other items, net (2) | 985 | 243 | 798 | 214 | 16,485 | 18,725 | |||||||||||||||||||||||||||||
Adjusted EBITDA (3) | $ | 25,277 | $ | 21,176 | $ | 3,997 | $ | 6,819 | $ | (9,724) | $ | 47,545 | |||||||||||||||||||||||
| Adjusted EBITDA margin | 21.2 | % | 18.9 | % | 11.2 | % | 11.2 | % | 14.5 | % | |||||||||||||||||||||||||
(1) Distributions from non-consolidated affiliates includes (i) cash received for profit distributions from non-consolidated affiliates, and (ii) consideration from the sale of ownership interests in non-consolidated affiliates less contributions to date plus undistributed earnings (losses).
(2) Other items, net includes items such as severance expense and other restructuring expenses. See Schedule 11 for a reconciliation of amounts.
(3) Adjusted EBITDA is a non-GAAP financial measure, and as shown above it represents operating income (loss) plus depreciation and amortization, stock-based compensation, deferred acquisition consideration adjustments, distributions from non-consolidated affiliates, impairment and other items. See "Non-GAAP Financial Measures" herein.
Note: Effective in the first quarter of 2020, the Company reorganized its management structure resulting in the aggregation of certain Partner Firms into integrated groups (“Networks”). In connection with our discussions with the SEC, the Company has changed the prior presentation for the Networks. Beginning in the second quarter of 2020, the Company separated the Networks into two reportable segments: Integrated Networks - Group A and Integrated Networks - Group B. Prior periods presented have been recast to reflect the change in reportable segments.
Note: Actuals may not foot due to rounding.
Page 10
SCHEDULE 4
MDC PARTNERS INC.
UNAUDITED RECONCILIATION OF NET INCOME (LOSS) TO ADJUSTED EBITDA
(US$ in 000s, except percentages)
For the Twelve Months Ended December 31, 2020
| Integrated Networks - Group A | Integrated Networks - Group B | Media & Data Network | All Other | Corporate | Total | ||||||||||||||||||||||||||||||
| Revenue | $ | 379,648 | $ | 435,589 | $ | 139,015 | $ | 244,759 | $ | — | $ | 1,199,011 | |||||||||||||||||||||||
| Net loss attributable to MDC Partners Inc. common shareholders | $ | (243,150) | |||||||||||||||||||||||||||||||||
| Adjustments to reconcile to operating income (loss): | |||||||||||||||||||||||||||||||||||
| Accretion on and net income allocated to convertible preference shares | 14,179 | ||||||||||||||||||||||||||||||||||
| Net income attributable to the noncontrolling interests | 21,774 | ||||||||||||||||||||||||||||||||||
| Equity in losses of non-consolidated affiliates | 2,240 | ||||||||||||||||||||||||||||||||||
| Income tax expense | 116,555 | ||||||||||||||||||||||||||||||||||
| Interest expense and finance charges, net | 62,163 | ||||||||||||||||||||||||||||||||||
| Foreign exchange loss | 982 | ||||||||||||||||||||||||||||||||||
| Other, net | (20,500) | ||||||||||||||||||||||||||||||||||
| Operating income (loss) | $ | 14,297 | $ | 34,581 | $ | (7,724) | $ | (23,021) | $ | (63,890) | $ | (45,757) | |||||||||||||||||||||||
| margin | 3.8 | % | 7.9 | % | (5.6) | % | (9.4) | % | (3.8) | % | |||||||||||||||||||||||||
| Adjustments: | |||||||||||||||||||||||||||||||||||
| Depreciation and amortization | 6,467 | 17,204 | 4,376 | 7,478 | 1,380 | 36,905 | |||||||||||||||||||||||||||||
| Impairment and other losses | 6,391 | 31,784 | 11,760 | 45,335 | 1,129 | 96,399 | |||||||||||||||||||||||||||||
| Stock-based compensation | 7,580 | 3,191 | 122 | 304 | 2,982 | 14,179 | |||||||||||||||||||||||||||||
| Deferred acquisition consideration adjustments | 44,073 | (2,706) | 375 | 445 | — | 42,187 | |||||||||||||||||||||||||||||
Distributions from non- consolidated affiliates (1) | — | — | — | — | 2,175 | 2,175 | |||||||||||||||||||||||||||||
Other items, net (2) | 985 | 243 | 798 | 214 | 29,004 | 31,244 | |||||||||||||||||||||||||||||
Adjusted EBITDA (3) | $ | 79,793 | $ | 84,297 | $ | 9,707 | $ | 30,755 | $ | (27,220) | $ | 177,332 | |||||||||||||||||||||||
| Adjusted EBITDA margin | 21.0 | % | 19.4 | % | 7.0 | % | 12.6 | % | 14.8 | % | |||||||||||||||||||||||||
(1) Distributions from non-consolidated affiliates includes (i) cash received for profit distributions from non-consolidated affiliates, and (ii) consideration from the sale of ownership interests in non-consolidated affiliates less contributions to date plus undistributed earnings (losses).
(2) Other items, net includes items such as severance expense and other restructuring expenses. See Schedule 11 for a reconciliation of amounts.
(3) Adjusted EBITDA is a non-GAAP financial measure, and as shown above it represents operating income (loss) plus depreciation and amortization, stock-based compensation, deferred acquisition consideration adjustments, distributions from non-consolidated affiliates, impairment and other items. See "Non-GAAP Financial Measures" herein.
Note: Actuals may not foot due to rounding.
Page 11
SCHEDULE 5
MDC PARTNERS INC.
UNAUDITED RECONCILIATION OF NET INCOME (LOSS) TO ADJUSTED EBITDA
(US$ in 000s, except percentages)
For the Three Months Ended December 31, 2019
| Integrated Networks - Group A | Integrated Networks - Group B | Media & Data Network | All Other | Corporate | Total | ||||||||||||||||||||||||||||||
| Revenue | $ | 115,814 | $ | 136,095 | $ | 42,527 | $ | 87,539 | $ | — | $ | 381,975 | |||||||||||||||||||||||
| Net loss attributable to MDC Partners Inc. common shareholders | $ | (11,051) | |||||||||||||||||||||||||||||||||
| Adjustments to reconcile to operating loss: | |||||||||||||||||||||||||||||||||||
| Accretion on and net income allocated to convertible preference shares | 3,373 | ||||||||||||||||||||||||||||||||||
| Net income attributable to the noncontrolling interests | 5,419 | ||||||||||||||||||||||||||||||||||
| Income tax expense | 4,024 | ||||||||||||||||||||||||||||||||||
| Interest expense and finance charges, net | 15,658 | ||||||||||||||||||||||||||||||||||
| Foreign exchange gain | (4,349) | ||||||||||||||||||||||||||||||||||
| Other, net | (2,158) | ||||||||||||||||||||||||||||||||||
| Operating income (loss) | $ | 6,677 | $ | 9,226 | $ | 3,416 | $ | 6,800 | $ | (15,203) | $ | 10,916 | |||||||||||||||||||||||
| margin | 5.8 | % | 6.8 | % | 8.0 | % | 7.8 | % | 2.9 | % | |||||||||||||||||||||||||
| Adjustments: | |||||||||||||||||||||||||||||||||||
| Depreciation and amortization | 2,139 | 3,940 | 971 | 2,172 | 238 | 9,460 | |||||||||||||||||||||||||||||
| Impairment and other losses | 4,879 | — | 929 | — | 847 | 6,655 | |||||||||||||||||||||||||||||
| Stock-based compensation | 15,856 | 1,072 | 42 | 10 | 1,428 | 18,408 | |||||||||||||||||||||||||||||
| Deferred acquisition consideration adjustments | 2,140 | 5,213 | — | 1,677 | — | 9,030 | |||||||||||||||||||||||||||||
Distributions from non- consolidated affiliates (1) | — | — | — | — | 2,219 | 2,219 | |||||||||||||||||||||||||||||
Other items, net (2) | — | — | — | — | 349 | 349 | |||||||||||||||||||||||||||||
Adjusted EBITDA (3) | $ | 31,691 | $ | 19,451 | $ | 5,358 | $ | 10,659 | $ | (10,122) | $ | 57,037 | |||||||||||||||||||||||
| Adjusted EBITDA margin | 27.4 | % | 14.3 | % | 12.6 | % | 12.2 | % | 14.9 | % | |||||||||||||||||||||||||
(1) Distributions from non-consolidated affiliates includes (i) cash received for profit distributions from non-consolidated affiliates, and (ii) consideration from the sale of ownership interests in non-consolidated affiliates less contributions to date plus undistributed earnings (losses).
(2) Other items, net includes items such as severance expense and other restructuring expenses. See Schedule 11 for a reconciliation of amounts.
(3) Adjusted EBITDA is a non-GAAP financial measure, and as shown above it represents operating income (loss) plus depreciation and amortization, stock-based compensation, deferred acquisition consideration adjustments, distributions from non-consolidated affiliates, impairment and other items. See "Non-GAAP Financial Measures" herein.
Note: Actuals may not foot due to rounding.
Page 12
SCHEDULE 6
MDC PARTNERS INC.
UNAUDITED RECONCILIATION OF NET INCOME (LOSS) TO ADJUSTED EBITDA
(US$ in 000s, except percentages)
For the Twelve Months Ended December 31, 2019
| Integrated Networks - Group A | Integrated Networks - Group B | Media & Data Network | All Other | Corporate | Total | ||||||||||||||||||||||||||||||
| Revenue | $ | 392,101 | $ | 531,717 | $ | 161,451 | $ | 330,534 | $ | — | $ | 1,415,803 | |||||||||||||||||||||||
| Net loss attributable to MDC Partners Inc. common shareholders | $ | (17,557) | |||||||||||||||||||||||||||||||||
| Adjustments to reconcile to operating income (loss): | |||||||||||||||||||||||||||||||||||
| Accretion on and net income allocated to convertible preference shares | 12,304 | ||||||||||||||||||||||||||||||||||
| Net income attributable to the noncontrolling interests | 16,156 | ||||||||||||||||||||||||||||||||||
| Equity in earnings of non-consolidated affiliates | (352) | ||||||||||||||||||||||||||||||||||
| Income tax expense | 10,316 | ||||||||||||||||||||||||||||||||||
| Interest expense and finance charges, net | 64,942 | ||||||||||||||||||||||||||||||||||
| Foreign exchange gain | (8,750) | ||||||||||||||||||||||||||||||||||
| Other, net | 2,401 | ||||||||||||||||||||||||||||||||||
| Operating income (loss) | $ | 35,230 | $ | 61,417 | $ | 2,376 | $ | 26,205 | $ | (45,768) | $ | 79,460 | |||||||||||||||||||||||
| margin | 9.0 | % | 11.6 | % | 1.5 | % | 7.9 | % | 5.6 | % | |||||||||||||||||||||||||
| Additional adjustments to reconcile to Adjusted EBITDA: | |||||||||||||||||||||||||||||||||||
| Depreciation and amortization | 8,559 | 15,904 | 4,303 | 8,695 | 868 | 38,329 | |||||||||||||||||||||||||||||
| Impairment and other losses | 4,879 | 1,933 | 929 | 11 | 847 | 8,599 | |||||||||||||||||||||||||||||
| Stock-based compensation | 24,420 | 4,303 | 63 | 374 | 1,880 | 31,040 | |||||||||||||||||||||||||||||
| Deferred acquisition consideration adjustments | 1,734 | 1,261 | 75 | 2,333 | — | 5,403 | |||||||||||||||||||||||||||||
Distributions from non- consolidated affiliates (1) | — | (250) | — | — | 2,298 | 2,048 | |||||||||||||||||||||||||||||
Other items, net (2) | — | — | — | — | 9,274 | 9,274 | |||||||||||||||||||||||||||||
Adjusted EBITDA (3) | $ | 74,822 | $ | 84,568 | $ | 7,746 | $ | 37,618 | $ | (30,601) | $ | 174,153 | |||||||||||||||||||||||
| Adjusted EBITDA margin | 19.1 | % | 15.9 | % | 4.8 | % | 11.4 | % | 12.3 | % | |||||||||||||||||||||||||
(1) Distributions from non-consolidated affiliates includes (i) cash received for profit distributions from non-consolidated affiliates, and (ii) consideration from the sale of ownership interests in non-consolidated affiliates less contributions to date plus undistributed earnings (losses).
(2) Other items, net includes items such as severance expense and other restructuring expenses. See Schedule 11 for a reconciliation of amounts.
(3) Adjusted EBITDA is a non-GAAP financial measure, and as shown above it represents operating income (loss) plus depreciation and amortization, stock-based compensation, deferred acquisition consideration adjustments, distributions from non-consolidated affiliates, impairment and other items. See "Non-GAAP Financial Measures" herein.
Note: Actuals may not foot due to rounding.
Page 13
SCHEDULE 7
MDC PARTNERS INC.
UNAUDITED RECONCILIATION OF NET INCOME (LOSS) TO COVENANT EBITDA
(US$ in 000s)
| 2020 | Covenant EBITDA (LTM) (1) | ||||||||||||||||||||||||||||
| Q1 | Q2 | Q3 | Q4 | Q4-2020 - LTM | |||||||||||||||||||||||||
| Net income (loss) attributable to MDC Partners Inc. common shareholders | $ | (2,437) | $ | (4,102) | $ | 360 | $ | (237,108) | $ | (243,287) | |||||||||||||||||||
| Adjustments to reconcile to operating income (loss): | |||||||||||||||||||||||||||||
| Accretion on and net income allocated to convertible preference shares | 3,440 | 3,509 | 3,716 | 3,651 | 14,316 | ||||||||||||||||||||||||
| Net income attributable to the noncontrolling interests | 791 | 3,101 | 10,728 | 7,154 | 21,774 | ||||||||||||||||||||||||
| Equity in losses of non-consolidated affiliates | — | 798 | 31 | 1,411 | 2,240 | ||||||||||||||||||||||||
| Income tax expense (benefit) | 13,500 | (7,923) | 1,452 | 109,526 | 116,555 | ||||||||||||||||||||||||
| Interest expense and finance charges, net | 15,612 | 15,941 | 15,266 | 15,344 | 62,163 | ||||||||||||||||||||||||
| Foreign exchange loss (gain) | 14,757 | (5,342) | (2,159) | (6,274) | 982 | ||||||||||||||||||||||||
| Other, net | (16,334) | (5,884) | (505) | 2,223 | (20,500) | ||||||||||||||||||||||||
| Operating income (loss) | 29,329 | 98 | 28,889 | (104,073) | (45,757) | ||||||||||||||||||||||||
| Adjustments to reconcile to Adjusted EBITDA: | |||||||||||||||||||||||||||||
| Depreciation and amortization | 9,206 | 8,899 | 9,332 | 9,468 | 36,905 | ||||||||||||||||||||||||
| Impairment and other losses | 161 | 18,839 | 159 | 77,240 | 96,399 | ||||||||||||||||||||||||
| Stock-based compensation | 3,070 | 1,039 | 6,459 | 3,611 | 14,179 | ||||||||||||||||||||||||
| Deferred acquisition consideration adjustments | (4,600) | 2,312 | 2,803 | 41,672 | 42,187 | ||||||||||||||||||||||||
| Distributions from non-consolidated affiliates | (14) | 1,079 | 208 | 902 | 2,175 | ||||||||||||||||||||||||
Other items, net (2) | 2,416 | 3,895 | 6,208 | 18,725 | 31,244 | ||||||||||||||||||||||||
| Adjusted EBITDA | 39,568 | 36,161 | 54,058 | 47,545 | 177,332 | ||||||||||||||||||||||||
| Adjustments to reconcile to Covenant EBITDA: | |||||||||||||||||||||||||||||
Proforma dispositions (3) | (124) | — | — | — | (124) | ||||||||||||||||||||||||
| Severance due to eliminated positions | 2,133 | 5,233 | 2,336 | 1,987 | 11,689 | ||||||||||||||||||||||||
Other adjustments, net (4) | 357 | 207 | 77 | 585 | 1,226 | ||||||||||||||||||||||||
| Covenant adjusted EBITDA | $ | 41,934 | $ | 41,601 | $ | 56,471 | $ | 50,117 | $ | 190,123 | |||||||||||||||||||
(1) Covenant EBITDA is a measure that includes pro forma adjustments for acquisitions, one-time charges, permitted dispositions and other adjustments, as defined in the Company's Credit Agreement. Covenant EBITDA is calculated as the aggregate of operating results for the rolling last twelve months (LTM). Each quarter is presented to provide the information utilized to calculate Covenant EBITDA. Historical Covenant EBITDA may be re-casted in the current period for any proforma adjustments related to acquisitions and/or dispositions in the current period. See "Non-GAAP Financial Measures" herein.
(2) Other items, net includes items such as severance expense and other restructuring expenses. See Schedule 11 for a reconciliation of amounts.
(3) Represents Kingsdale and Sloane EBITDA for the respective period.
(4) Other adjustments, net primarily includes one-time professional fees and costs associated with real estate consolidation.
Note: Actuals may not foot due to rounding.
Page 14
SCHEDULE 8
MDC PARTNERS INC.
UNAUDITED RECONCILIATION OF NET INCOME (LOSS) TO COVENANT EBITDA
(US$ in 000s)
| 2019 | Covenant EBITDA (LTM) (1) | ||||||||||||||||||||||||||||
| Q1 | Q2 | Q3 | Q4 | Q4-2019 LTM | |||||||||||||||||||||||||
| Net income (loss) attributable to MDC Partners Inc. common shareholders | $ | (2,496) | $ | 1,048 | $ | (5,058) | $ | (11,051) | $ | (17,557) | |||||||||||||||||||
| Adjustments to reconcile to operating income: | |||||||||||||||||||||||||||||
| Accretion on and net income allocated to convertible preference shares | 2,383 | 3,242 | 3,306 | 3,373 | 12,304 | ||||||||||||||||||||||||
| Net income attributable to the noncontrolling interests | 429 | 3,043 | 7,265 | 5,419 | 16,156 | ||||||||||||||||||||||||
| Equity in (earnings) of non-consolidated affiliates | (83) | (206) | (63) | — | (352) | ||||||||||||||||||||||||
| Income tax expense | 746 | 2,089 | 3,457 | 4,024 | 10,316 | ||||||||||||||||||||||||
| Interest expense and finance charges, net | 16,761 | 16,413 | 16,110 | 15,658 | 64,942 | ||||||||||||||||||||||||
| Foreign exchange loss (gain) | (5,442) | (2,932) | 3,973 | (4,349) | (8,750) | ||||||||||||||||||||||||
| Other, net | 3,383 | 745 | 431 | (2,158) | 2,401 | ||||||||||||||||||||||||
| Operating income | 15,681 | 23,442 | 29,421 | 10,916 | 79,460 | ||||||||||||||||||||||||
| Adjustments to reconcile to Adjusted EBITDA: | |||||||||||||||||||||||||||||
| Depreciation and amortization | 8,838 | 10,663 | 9,368 | 9,460 | 38,329 | ||||||||||||||||||||||||
| Impairment and other losses | — | — | 1,944 | 6,655 | 8,599 | ||||||||||||||||||||||||
| Stock-based compensation | 2,972 | 3,634 | 6,026 | 18,408 | 31,040 | ||||||||||||||||||||||||
| Deferred acquisition consideration adjustments | (7,643) | 2,073 | 1,943 | 9,030 | 5,403 | ||||||||||||||||||||||||
| Distributions from non-consolidated affiliates | — | 31 | (202) | 2,219 | 2,048 | ||||||||||||||||||||||||
Other items, net (2) | 1,626 | 6,594 | 705 | 349 | 9,274 | ||||||||||||||||||||||||
| Adjusted EBITDA | 21,474 | 46,437 | 49,205 | 57,037 | 174,153 | ||||||||||||||||||||||||
| Adjustments to reconcile to Covenant EBITDA: | |||||||||||||||||||||||||||||
Proforma acquisitions/dispositions (3) | (2,701) | (729) | (996) | (1,294) | (5,720) | ||||||||||||||||||||||||
| Severance due to eliminated positions | 1,534 | 2,346 | 1,956 | 3,221 | 9,057 | ||||||||||||||||||||||||
Other adjustments, net (4) | 1,412 | 989 | 228 | 368 | 2,997 | ||||||||||||||||||||||||
| $ | 21,719 | $ | 49,043 | $ | 50,393 | $ | 59,332 | $ | 180,487 | ||||||||||||||||||||
(1) Covenant EBITDA is a measure that includes pro forma adjustments for acquisitions, one-time charges, permitted dispositions and other adjustments, as defined in the Company's Credit Agreement. Covenant EBITDA is calculated as the aggregate of operating results for the rolling last twelve months (LTM). Each quarter is presented to provide the information utilized to calculate Covenant EBITDA. Historical Covenant EBITDA may be re-casted in the current period for any proforma adjustments related to acquisitions and/or dispositions in the current period. See "Non-GAAP Financial Measures" herein.
(2) Other items, net includes items such as severance expense and other restructuring expenses. See Schedule 10 for a reconciliation of amounts.
(3) Represents Kingsdale EBITDA for the respective period.
(4) Other adjustments, net primarily includes one-time professional fees and costs associated with real estate consolidation.
Note: Actuals may not foot due to rounding.
Page 15
SCHEDULE 9
MDC PARTNERS INC.
UNAUDITED CONSOLIDATED BALANCE SHEETS
(US$ in 000s)
| December 31, 2020 | December 31, 2019 | ||||||||||
| ASSETS | |||||||||||
| Current Assets: | |||||||||||
| Cash and cash equivalents | $ | 60,757 | $ | 106,933 | |||||||
| Accounts receivable, less allowance for doubtful accounts of $5,473 and $3,304 | 374,892 | 449,288 | |||||||||
| Expenditures billable to clients | 10,552 | 30,133 | |||||||||
| Other current assets | 40,939 | 35,613 | |||||||||
| Total Current Assets | 487,140 | 621,967 | |||||||||
| Fixed assets, at cost, less accumulated depreciation of $136,166 and $129,579 | 90,413 | 81,054 | |||||||||
| Right-of-use assets - operating leases | 214,188 | 223,622 | |||||||||
| Goodwill | 668,211 | 731,691 | |||||||||
| Other intangible assets, net | 33,844 | 54,893 | |||||||||
| Deferred tax assets | 179 | 84,900 | |||||||||
| Other assets | 17,339 | 30,179 | |||||||||
| Total Assets | $ | 1,511,314 | $ | 1,828,306 | |||||||
| LIABILITIES, REDEEMABLE NONCONTROLLING INTERESTS, AND SHAREHOLDERS’ DEFICIT | |||||||||||
| Current Liabilities: | |||||||||||
| Accounts payable | $ | 168,398 | $ | 200,148 | |||||||
| Accruals and other liabilities | 274,968 | 353,575 | |||||||||
| Advance billings | 152,956 | 171,742 | |||||||||
| Current portion of lease liabilities - operating leases | 41,208 | 48,659 | |||||||||
| Current portion of deferred acquisition consideration | 53,730 | 45,521 | |||||||||
| Total Current Liabilities | 691,260 | 819,645 | |||||||||
| Long-term debt | 843,184 | 887,630 | |||||||||
| Long-term portion of deferred acquisition consideration | 29,335 | 29,699 | |||||||||
| Long-term lease liabilities - operating leases | 247,243 | 219,163 | |||||||||
| Other liabilities | 82,065 | 25,771 | |||||||||
| Total Liabilities | 1,893,087 | 1,981,908 | |||||||||
| Redeemable Noncontrolling Interests | 27,137 | 36,973 | |||||||||
| Commitments, Contingencies, and Guarantees | |||||||||||
| Shareholders’ Deficit: | |||||||||||
| Convertible preference shares, 145,000 authorized, issued and outstanding at December 31, 2020 and 2019 | 152,746 | 152,746 | |||||||||
| Common stock and other paid-in capital | 104,367 | 101,469 | |||||||||
| Accumulated deficit | (709,751) | (480,779) | |||||||||
| Accumulated other comprehensive income (loss) | 2,739 | (4,269) | |||||||||
| MDC Partners Inc. Shareholders' Deficit | (449,899) | (230,833) | |||||||||
| Noncontrolling interests | 40,989 | 40,258 | |||||||||
| Total Shareholders' Deficit | (408,910) | (190,575) | |||||||||
| Total Liabilities, Redeemable Noncontrolling Interests and Shareholders' Deficit | $ | 1,511,314 | $ | 1,828,306 | |||||||
Page 16
SCHEDULE 10
MDC PARTNERS INC.
UNAUDITED SUMMARY CASH FLOW DATA
(US$ in 000s)
| Twelve Months Ended December 31, | |||||||||||
| 2020 | 2019 | ||||||||||
| Net cash provided by operating activities | $ | 32,559 | $ | 86,539 | |||||||
| Net cash provided by (used in) investing activities | (8,287) | 115 | |||||||||
| Net cash used in financing activities | (73,426) | (11,729) | |||||||||
| Effect of exchange rate changes on cash, cash equivalents, and cash held in trusts | 2,978 | 1 | |||||||||
| Net increase (decrease) in cash, and cash equivalents | $ | (46,176) | $ | 74,926 | |||||||
| Change in cash and cash equivalents held in trusts classified within held for sale | — | (3,307) | |||||||||
| Change in cash and cash equivalents classified within assets held for sale | — | 4,441 | |||||||||
| Net increase (decrease) in cash and cash equivalents | (46,176) | 76,060 | |||||||||
| Cash and cash equivalents at beginning of period | 106,933 | 30,873 | |||||||||
| Cash and cash equivalents at end of period | $ | 60,757 | $ | 106,933 | |||||||
| Supplemental disclosures: | |||||||||||
| Cash income taxes paid | $ | 7,946 | $ | 2,296 | |||||||
| Cash interest paid | $ | 57,752 | $ | 62,223 | |||||||
Note: Actuals may not foot due to rounding
Page 17
SCHEDULE 11
MDC PARTNERS INC.
UNAUDITED RECONCILIATION OF COMPONENTS OF NON- GAAP MEASURES
(US$ in 000s)
| 2019 | 2020 | ||||||||||||||||||||||||||||||||||
| Q1 | Q2 | Q3 | Q4 | YTD | Q1 | Q2 | Q3 | Q4 | YTD | ||||||||||||||||||||||||||
| NON-GAAP ACQUISITIONS (DISPOSITIONS), NET | |||||||||||||||||||||||||||||||||||
| GAAP revenue from current year acquisitions | $ | — | $ | 698 | $ | 1,347 | $ | 1,396 | $ | 3,441 | $ | — | $ | — | $ | — | $ | — | $ | — | |||||||||||||||
GAAP revenue from prior year acquisitions (1) | 15,685 | 1,519 | 1,109 | 291 | 18,604 | — | — | — | — | — | |||||||||||||||||||||||||
| Foreign exchange impact | — | — | 470 | (248) | 222 | (248) | — | — | — | (248) | |||||||||||||||||||||||||
Contribution to organic revenue (growth) decline (2) | (4,008) | (440) | (2,185) | (1,694) | (8,327) | (411) | — | — | — | (411) | |||||||||||||||||||||||||
Prior year revenue from dispositions (3) | (1,825) | (5,995) | (3,178) | (4,505) | (15,503) | (5,024) | (4,106) | (4,076) | (4,447) | (17,653) | |||||||||||||||||||||||||
| Non-GAAP acquisitions (dispositions), net | $ | 9,852 | $ | (4,218) | $ | (2,437) | $ | (4,760) | $ | (1,563) | $ | (5,683) | $ | (4,106) | $ | (4,076) | $ | (4,447) | $ | (18,312) | |||||||||||||||
| 2019 | 2020 | ||||||||||||||||||||||||||||||||||
| Q1 | Q2 | Q3 | Q4 | YTD | Q1 | Q2 | Q3 | Q4 | YTD | ||||||||||||||||||||||||||
| OTHER ITEMS, NET | |||||||||||||||||||||||||||||||||||
| Severance and other restructuring expenses | $ | — | $ | 6,703 | $ | 705 | $ | — | $ | 7,408 | $ | 1,334 | $ | 2,969 | $ | 3,270 | 1,072 | $ | 8,645 | ||||||||||||||||
| Strategic review process costs | 1,626 | (109) | — | 349 | 1,866 | 1,082 | 926 | 2,938 | 17,653 | 22,599 | |||||||||||||||||||||||||
| Total other items, net | $ | 1,626 | $ | 6,594 | $ | 705 | $ | 349 | $ | 9,274 | $ | 2,416 | $ | 3,895 | $ | 6,208 | $ | 18,725 | $ | 31,244 | |||||||||||||||
| 2019 | 2020 | ||||||||||||||||||||||||||||||||||
| Q1 | Q2 | Q3 | Q4 | YTD | Q1 | Q2 | Q3 | Q4 | YTD | ||||||||||||||||||||||||||
| CASH INTEREST, NET & OTHER | |||||||||||||||||||||||||||||||||||
| Cash interest paid | $ | (1,629) | $ | (30,014) | $ | (882) | $ | (29,698) | $ | (62,223) | $ | (145) | $ | (28,591) | $ | (575) | $ | (28,441) | $ | (57,752) | |||||||||||||||
| Bond interest accrual adjustment | (14,625) | 14,625 | (14,625) | 14,625 | — | (14,625) | 13,894 | (14,035) | 14,376 | (390) | |||||||||||||||||||||||||
| Adjusted cash interest paid | (16,254) | (15,389) | (15,507) | (15,073) | (62,223) | (14,770) | (14,697) | (14,610) | (14,065) | (58,142) | |||||||||||||||||||||||||
| Interest income | 149 | 138 | 165 | 162 | 614 | 114 | 190 | 114 | 99 | 517 | |||||||||||||||||||||||||
| Total cash interest, net & other | $ | (16,105) | $ | (15,251) | $ | (15,342) | $ | (14,911) | $ | (61,609) | $ | (14,656) | $ | (14,507) | $ | (14,496) | $ | (13,966) | $ | (57,625) | |||||||||||||||
| 2019 | 2020 | ||||||||||||||||||||||||||||||||||
| Q1 | Q2 | Q3 | Q4 | YTD | Q1 | Q2 | Q3 | Q4 | YTD | ||||||||||||||||||||||||||
| CAPITAL EXPENDITURES, NET | |||||||||||||||||||||||||||||||||||
| Capital expenditures | $ | (3,606) | $ | (4,317) | $ | (5,863) | $ | (4,810) | $ | (18,596) | $ | (1,546) | $ | (2,144) | $ | (24,187) | $ | (9,426) | $ | (37,303) | |||||||||||||||
| 2019 | 2020 | ||||||||||||||||||||||||||||||||||
| Q1 | Q2 | Q3 | Q4 | YTD | Q1 | Q2 | Q3 | Q4 | YTD | ||||||||||||||||||||||||||
| MISCELLANEOUS OTHER DISCLOSURES | |||||||||||||||||||||||||||||||||||
| Net income attributable to the noncontrolling interests | $ | 429 | $ | 3,043 | $ | 7,265 | $ | 5,419 | $ | 16,156 | $ | 791 | $ | 3,101 | $ | 10,728 | $ | 7,154 | $ | 21,774 | |||||||||||||||
| Cash taxes | $ | 1,677 | $ | 1,817 | $ | 137 | $ | (1,335) | $ | 2,296 | $ | 849 | $ | 1,717 | $ | 134 | $ | 5,246 | $ | 7,946 | |||||||||||||||
(1) GAAP revenue from prior year acquisitions for 2019 relate to acquisitions which occurred 2018.
(2) Contribution to organic revenue growth (decline) represents the change in revenue, measured on a constant currency basis, relative to the comparable pre-acquisition period for acquired businesses that are included in the Company's organic revenue growth (decline) calculation.
(3) Prior year revenue from dispositions reflects the incremental impact on revenue for the comparable period after the Company's disposition of such disposed business, plus revenue from each business disposed of by the Company in the previous year through the twelve month anniversary of the disposition.
Note: Actuals may not foot due to rounding.
Page 18

Management Presentation Fourth Quarter & Full Year 2020 Results March 2, 2021

2 This presentation contains forward-looking statements. Statements in this presentation that are not historical facts, including without limitation the information under the heading "Financial Outlook" and statements about the Company’s beliefs and expectations, earnings (loss) guidance, recent business and economic trends, potential acquisitions, and estimates of amounts for redeemable noncontrolling interests and deferred acquisition consideration, constitute forward-looking statements. Words such as “estimates”, “expects”, “contemplates”, “will”, “anticipates”, “projects”, “plans”, “intends”, “believes”, “forecasts”, “may”, “should”, and variations of such words or similar expressions are intended to identify forward-looking statements. These statements are based on current plans, estimates and projections, and are subject to change based on a number of factors, including those outlined in this section. Forward-looking statements speak only as of the date they are made, and the Company undertakes no obligation to update publicly any of them in light of new information or future events, if any. Forward-looking statements involve inherent risks and uncertainties. A number of important factors could cause actual results to differ materially from those contained in any forward-looking statements. Such risk factors include, but are not limited to, the following: • risks associated with international, national and regional unfavorable economic conditions that could affect the Company or its clients, including as a result of the novel coronavirus pandemic (“COVID-19”); • the effects of the outbreak of COVID-19, including the measures to reduce its spread, and the impact on the economy and demand for our services, which may precipitate or exacerbate other risks and uncertainties; • an inability to realize expected benefits of the proposed redomiciliation of the Company from the federal jurisdiction of Canada to the State of Delaware (the “Redomiciliation”) and the subsequent combination of the Company’s business with the business of the subsidiaries of Stagwell Media LP (“Stagwell”) that own and operate a portfolio of marketing services companies (the “Business Combination” and, together with the Redomiciliation, the “Proposed Transactions”) or the occurrence of difficulties in connection with the Proposed Transaction; • adverse tax consequences in connection with the Proposed Transactions for the Company, its operations and its shareholders, that may differ from the expectations of the Company, including that future changes in tax law, potential increases to corporate tax rates in the United States and disagreements with the tax authorities on the Company’s determination of value and computations of its tax attributes may result in increased tax costs; • the occurrence of material Canadian federal income tax (including material “emigration tax”) as a result of the Proposed Transactions; • the impact of uncertainty associated with the Proposed Transactions on the Company’s businesses; • direct or indirect costs associated with the Proposed Transactions, which could be greater than expected; • the risk that a condition to completion of the Proposed Transactions may not be satisfied and the Proposed Transactions may not be completed; • the risk of parties challenging the Proposed Transactions or the impact of the Proposed Transactions on the Company’s debt arrangements; • the Company’s ability to attract new clients and retain existing clients; • reduction in client spending and changes in client advertising, marketing and corporate communications requirements; • financial failure of the Company’s clients; • the Company’s ability to retain and attract key employees; FORWARD LOOKING STATEMENTS & OTHER INFORMATION
3 • the Company’s ability to achieve the full amount of its stated cost saving initiatives; • the Company’s implementation of strategic initiatives; • the Company’s ability to remain in compliance with its debt agreements and the Company’s ability to finance its contingent payment obligations when due and payable, including but not limited to those relating to redeemable noncontrolling interests and deferred acquisition consideration; • the successful completion and integration of acquisitions which complement and expand the Company’s business capabilities; and • foreign currency fluctuations. Investors should carefully consider these risk factors and the additional risk factors outlined in more detail in the Company's Annual Report on Form 10-K and in the Company’s other SEC filings. . FORWARD LOOKING STATEMENTS & OTHER INFORMATION (Cont.)
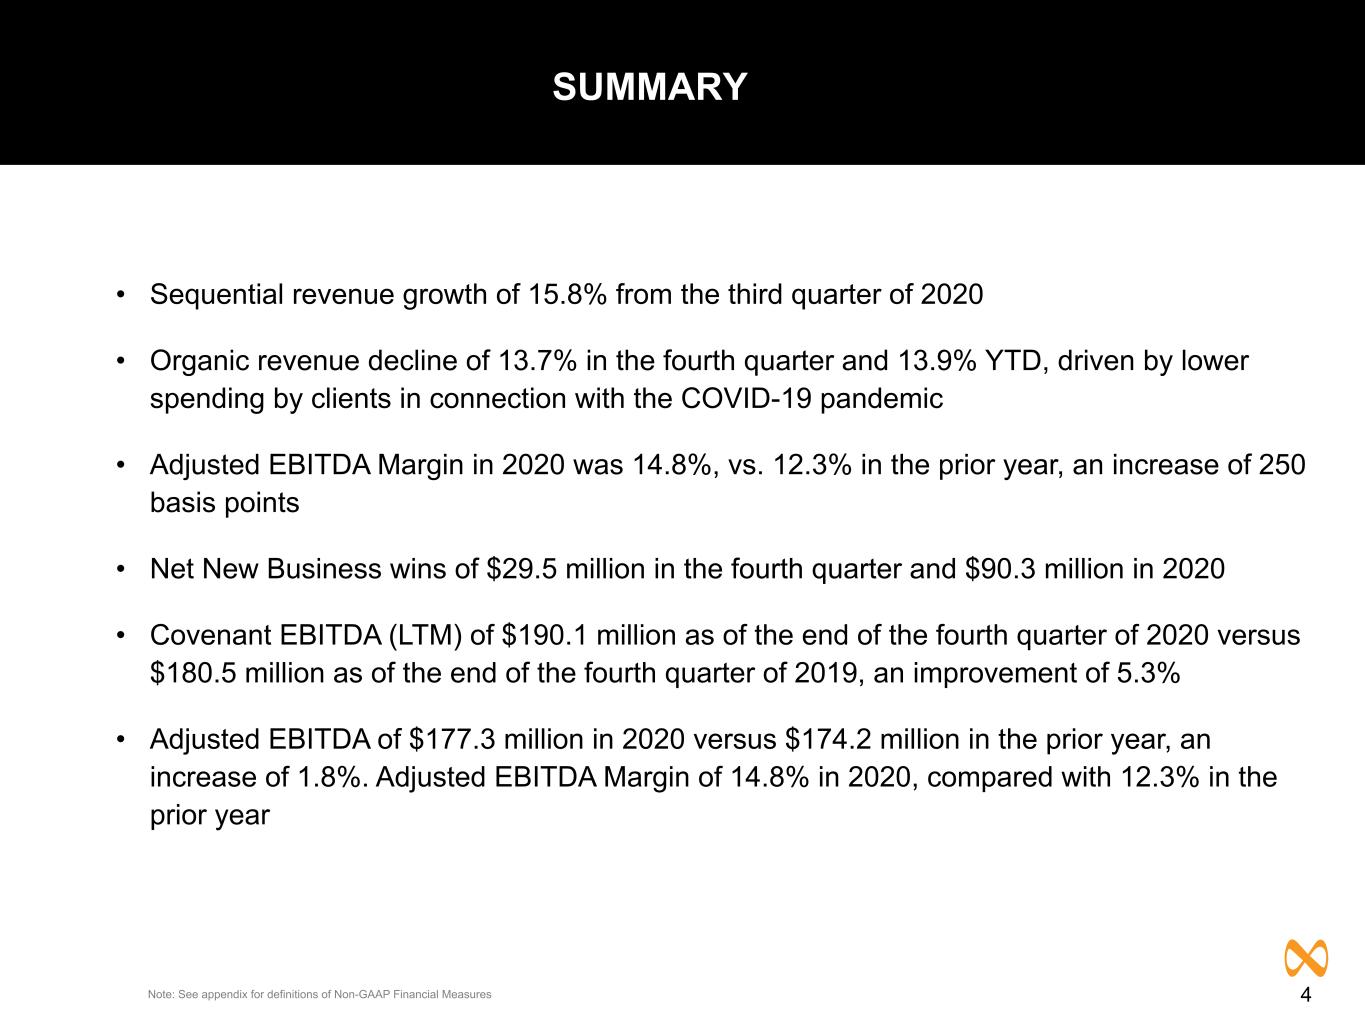
4 • Sequential revenue growth of 15.8% from the third quarter of 2020 • Organic revenue decline of 13.7% in the fourth quarter and 13.9% YTD, driven by lower spending by clients in connection with the COVID-19 pandemic • Adjusted EBITDA Margin in 2020 was 14.8%, vs. 12.3% in the prior year, an increase of 250 basis points • Net New Business wins of $29.5 million in the fourth quarter and $90.3 million in 2020 • Covenant EBITDA (LTM) of $190.1 million as of the end of the fourth quarter of 2020 versus $180.5 million as of the end of the fourth quarter of 2019, an improvement of 5.3% • Adjusted EBITDA of $177.3 million in 2020 versus $174.2 million in the prior year, an increase of 1.8%. Adjusted EBITDA Margin of 14.8% in 2020, compared with 12.3% in the prior year SUMMARY Note: See appendix for definitions of Non-GAAP Financial Measures
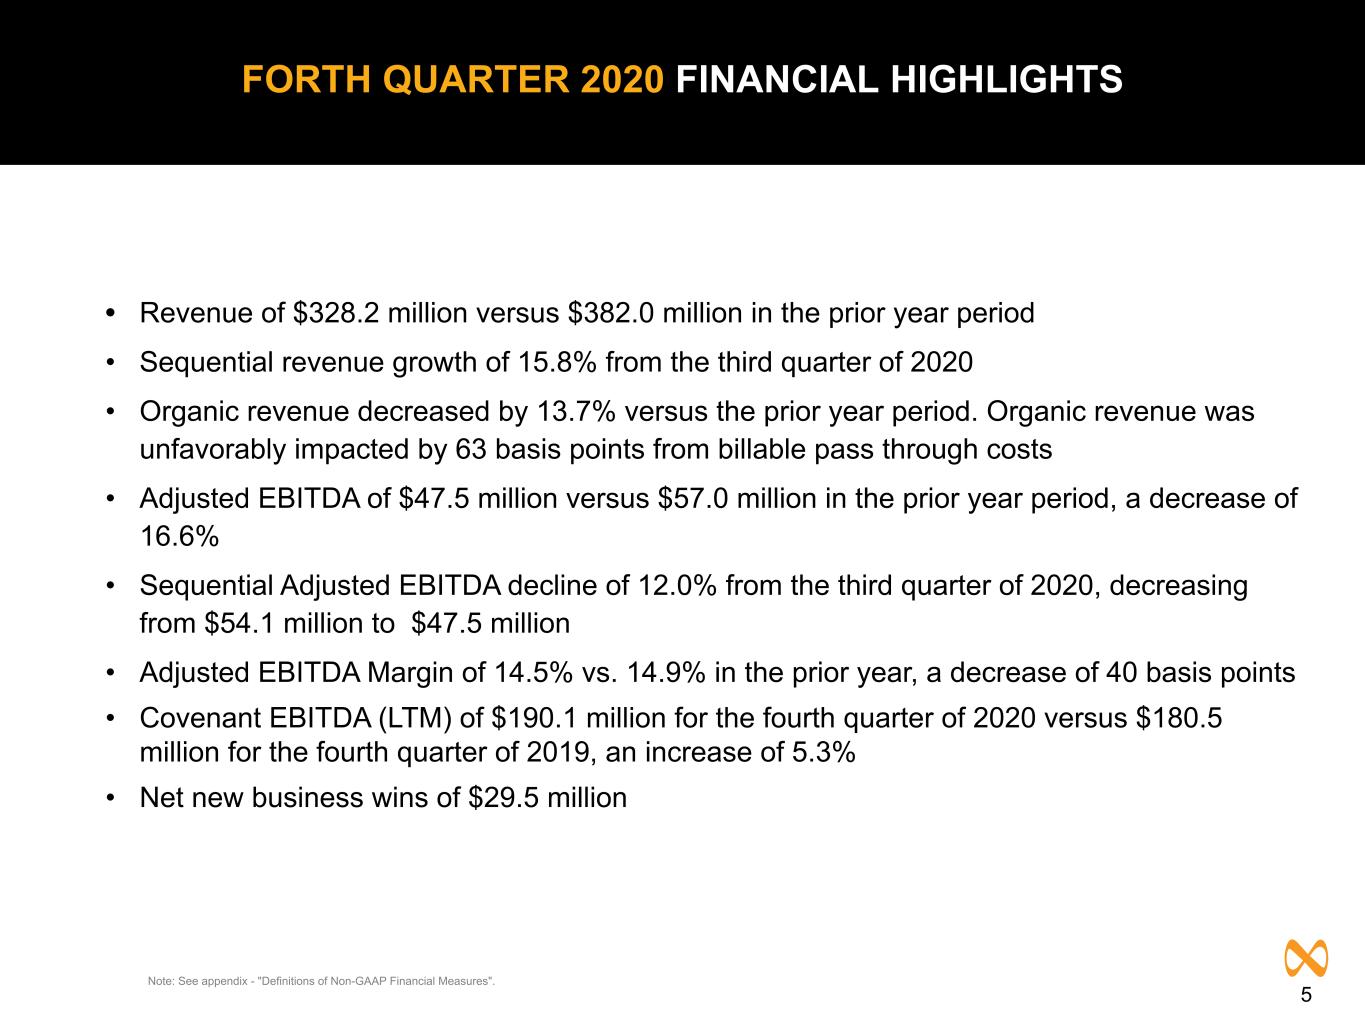
5 • Revenue of $328.2 million versus $382.0 million in the prior year period • Sequential revenue growth of 15.8% from the third quarter of 2020 • Organic revenue decreased by 13.7% versus the prior year period. Organic revenue was unfavorably impacted by 63 basis points from billable pass through costs • Adjusted EBITDA of $47.5 million versus $57.0 million in the prior year period, a decrease of 16.6% • Sequential Adjusted EBITDA decline of 12.0% from the third quarter of 2020, decreasing from $54.1 million to $47.5 million • Adjusted EBITDA Margin of 14.5% vs. 14.9% in the prior year, a decrease of 40 basis points • Covenant EBITDA (LTM) of $190.1 million for the fourth quarter of 2020 versus $180.5 million for the fourth quarter of 2019, an increase of 5.3% • Net new business wins of $29.5 million Note: See appendix - "Definitions of Non-GAAP Financial Measures". FORTH QUARTER 2020 FINANCIAL HIGHLIGHTS
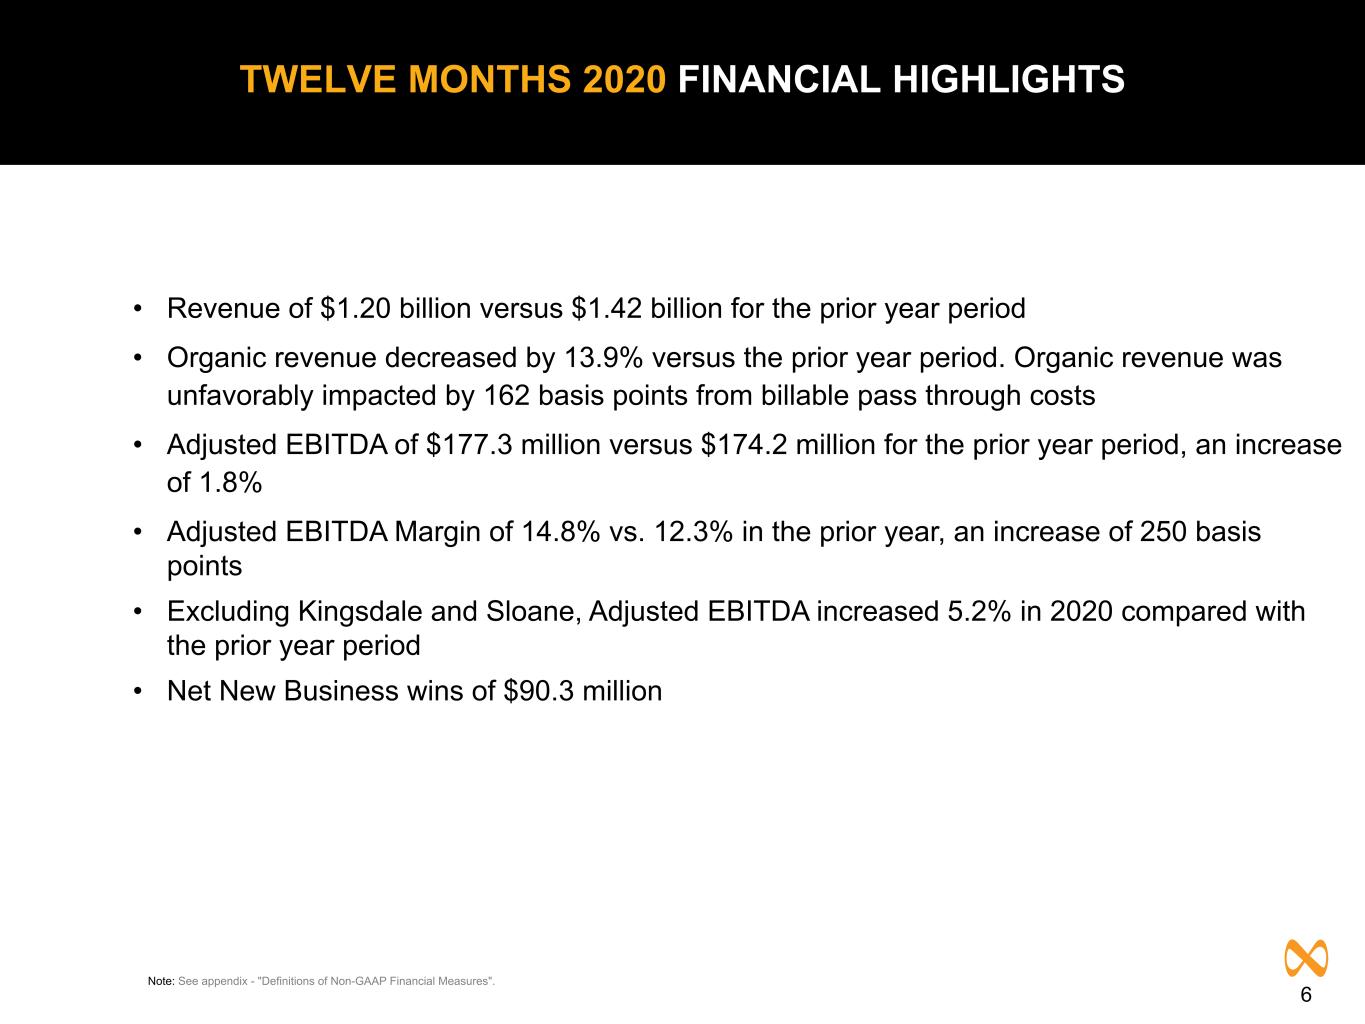
6 • Revenue of $1.20 billion versus $1.42 billion for the prior year period • Organic revenue decreased by 13.9% versus the prior year period. Organic revenue was unfavorably impacted by 162 basis points from billable pass through costs • Adjusted EBITDA of $177.3 million versus $174.2 million for the prior year period, an increase of 1.8% • Adjusted EBITDA Margin of 14.8% vs. 12.3% in the prior year, an increase of 250 basis points • Excluding Kingsdale and Sloane, Adjusted EBITDA increased 5.2% in 2020 compared with the prior year period • Net New Business wins of $90.3 million Note: See appendix - "Definitions of Non-GAAP Financial Measures". TWELVE MONTHS 2020 FINANCIAL HIGHLIGHTS
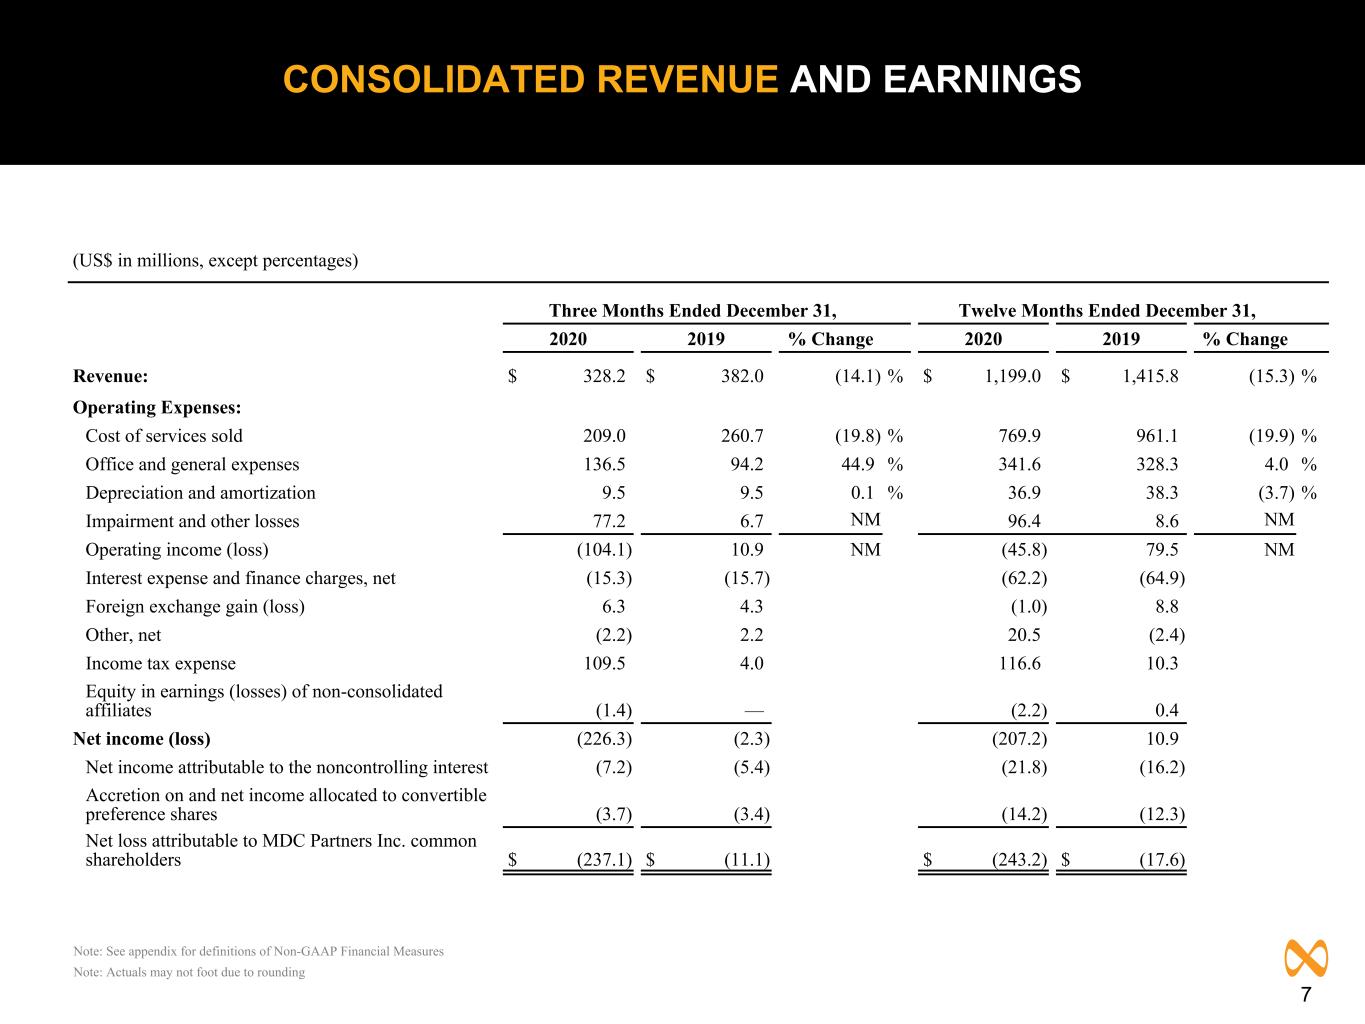
7 (US$ in millions, except percentages) Three Months Ended December 31, Twelve Months Ended December 31, 2020 2019 % Change 2020 2019 % Change Revenue: $ 328.2 $ 382.0 (14.1) % $ 1,199.0 $ 1,415.8 (15.3) % Operating Expenses: Cost of services sold 209.0 260.7 (19.8) % 769.9 961.1 (19.9) % Office and general expenses 136.5 94.2 44.9 % 341.6 328.3 4.0 % Depreciation and amortization 9.5 9.5 0.1 % 36.9 38.3 (3.7) % Impairment and other losses 77.2 6.7 NM 96.4 8.6 NM Operating income (loss) (104.1) 10.9 NM (45.8) 79.5 NM Interest expense and finance charges, net (15.3) (15.7) (62.2) (64.9) Foreign exchange gain (loss) 6.3 4.3 (1.0) 8.8 Other, net (2.2) 2.2 20.5 (2.4) Income tax expense 109.5 4.0 116.6 10.3 Equity in earnings (losses) of non-consolidated affiliates (1.4) — (2.2) 0.4 Net income (loss) (226.3) (2.3) (207.2) 10.9 Net income attributable to the noncontrolling interest (7.2) (5.4) (21.8) (16.2) Accretion on and net income allocated to convertible preference shares (3.7) (3.4) (14.2) (12.3) Net loss attributable to MDC Partners Inc. common shareholders $ (237.1) $ (11.1) $ (243.2) $ (17.6) CONSOLIDATED REVENUE AND EARNINGS Note: Actuals may not foot due to rounding Note: See appendix for definitions of Non-GAAP Financial Measures
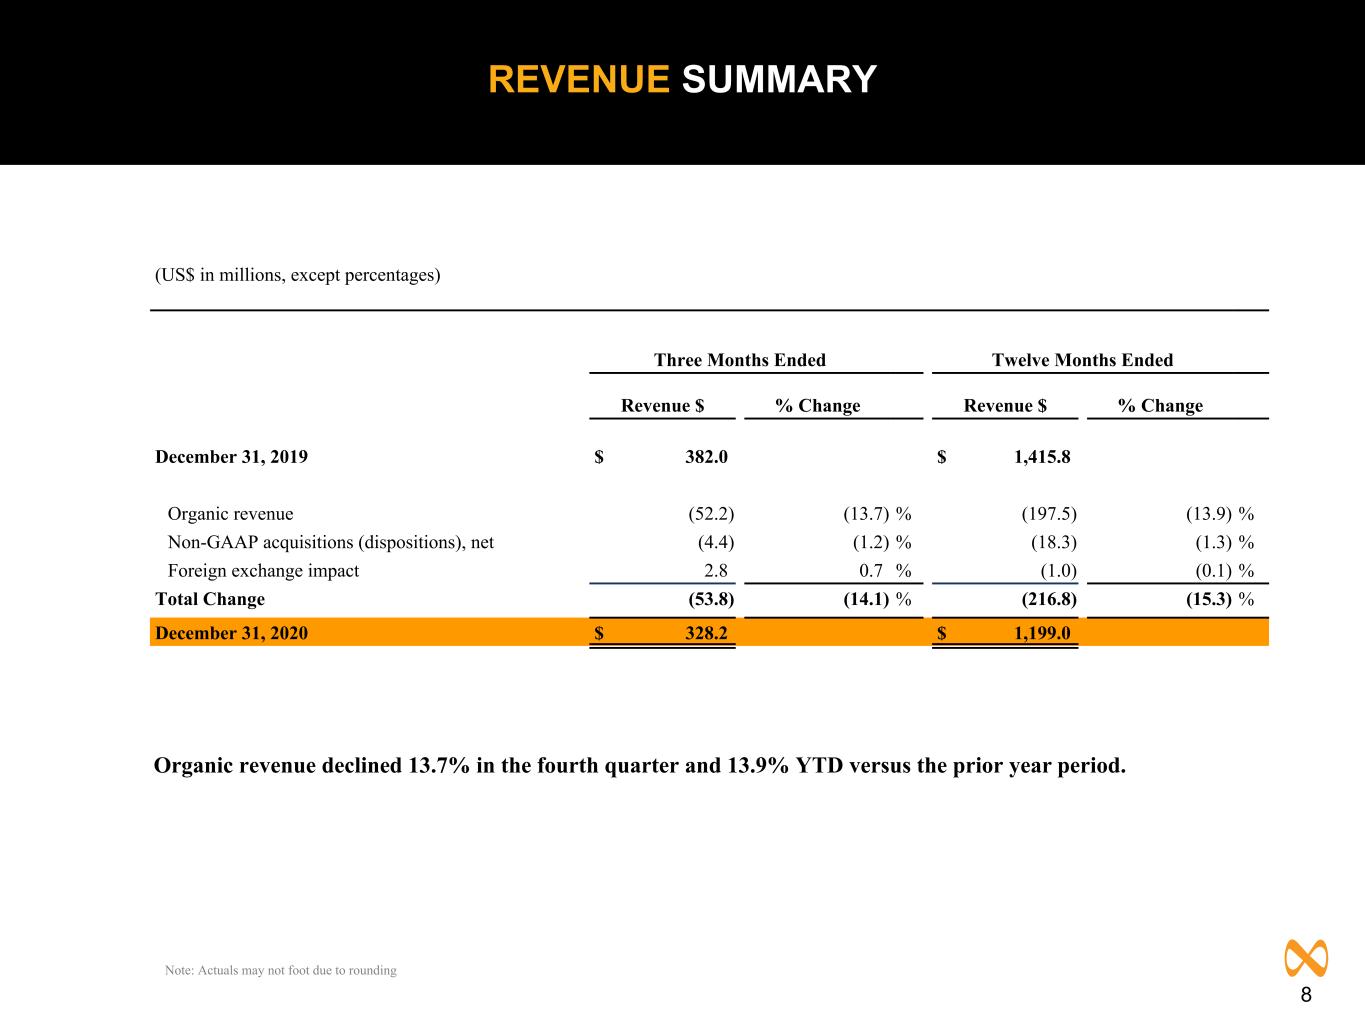
8 Organic revenue declined 13.7% in the fourth quarter and 13.9% YTD versus the prior year period. (US$ in millions, except percentages) Three Months Ended Twelve Months Ended Revenue $ % Change Revenue $ % Change December 31, 2019 $ 382.0 $ 1,415.8 Organic revenue (52.2) (13.7) % (197.5) (13.9) % Non-GAAP acquisitions (dispositions), net (4.4) (1.2) % (18.3) (1.3) % Foreign exchange impact 2.8 0.7 % (1.0) (0.1) % Total Change (53.8) (14.1) % (216.8) (15.3) % December 31, 2020 $ 328.2 $ 1,199.0 REVENUE SUMMARY Note: Actuals may not foot due to rounding
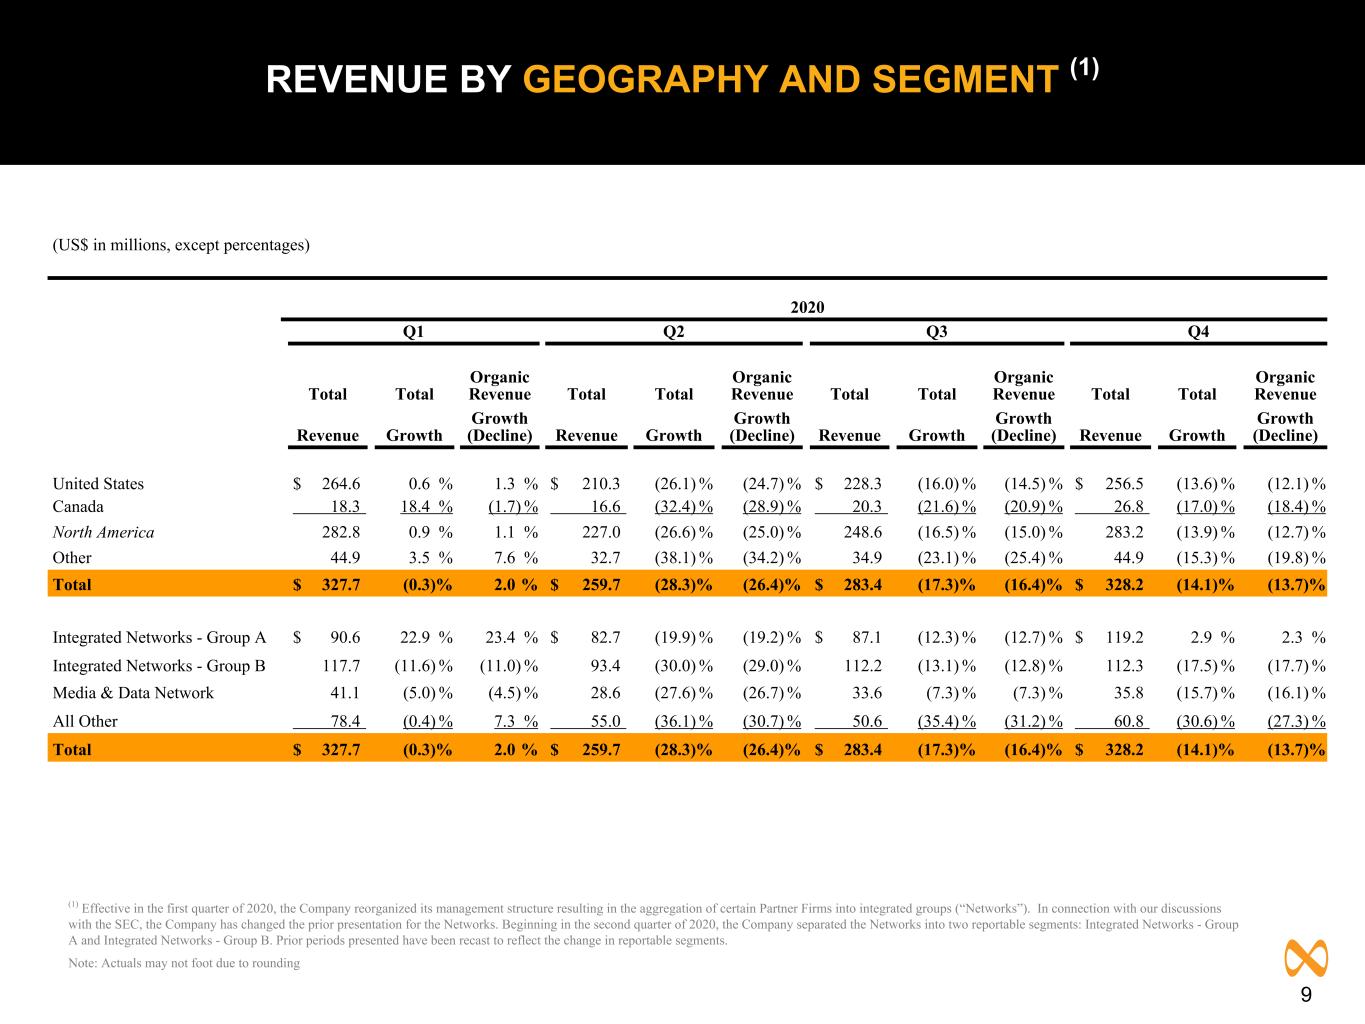
9 REVENUE BY GEOGRAPHY AND SEGMENT (1) (US$ in millions, except percentages) 2020 Q1 Q2 Q3 Q4 Total Total Organic Revenue Total Total Organic Revenue Total Total Organic Revenue Total Total Organic Revenue Revenue Growth Growth (Decline) Revenue Growth Growth (Decline) Revenue Growth Growth (Decline) Revenue Growth Growth (Decline) United States $ 264.6 0.6 % 1.3 % $ 210.3 (26.1) % (24.7) % $ 228.3 (16.0) % (14.5) % $ 256.5 (13.6) % (12.1) % Canada 18.3 18.4 % (1.7) % 16.6 (32.4) % (28.9) % 20.3 (21.6) % (20.9) % 26.8 (17.0) % (18.4) % North America 282.8 0.9 % 1.1 % 227.0 (26.6) % (25.0) % 248.6 (16.5) % (15.0) % 283.2 (13.9) % (12.7) % Other 44.9 3.5 % 7.6 % 32.7 (38.1) % (34.2) % 34.9 (23.1) % (25.4) % 44.9 (15.3) % (19.8) % Total $ 327.7 (0.3) % 2.0 % $ 259.7 (28.3) % (26.4) % $ 283.4 (17.3) % (16.4) % $ 328.2 (14.1) % (13.7) % Integrated Networks - Group A $ 90.6 22.9 % 23.4 % $ 82.7 (19.9) % (19.2) % $ 87.1 (12.3) % (12.7) % $ 119.2 2.9 % 2.3 % Integrated Networks - Group B 117.7 (11.6) % (11.0) % 93.4 (30.0) % (29.0) % 112.2 (13.1) % (12.8) % 112.3 (17.5) % (17.7) % Media & Data Network 41.1 (5.0) % (4.5) % 28.6 (27.6) % (26.7) % 33.6 (7.3) % (7.3) % 35.8 (15.7) % (16.1) % All Other 78.4 (0.4) % 7.3 % 55.0 (36.1) % (30.7) % 50.6 (35.4) % (31.2) % 60.8 (30.6) % (27.3) % Total $ 327.7 (0.3) % 2.0 % $ 259.7 (28.3) % (26.4) % $ 283.4 (17.3) % (16.4) % $ 328.2 (14.1) % (13.7) % (1) Effective in the first quarter of 2020, the Company reorganized its management structure resulting in the aggregation of certain Partner Firms into integrated groups (“Networks”). In connection with our discussions with the SEC, the Company has changed the prior presentation for the Networks. Beginning in the second quarter of 2020, the Company separated the Networks into two reportable segments: Integrated Networks - Group A and Integrated Networks - Group B. Prior periods presented have been recast to reflect the change in reportable segments. Note: Actuals may not foot due to rounding
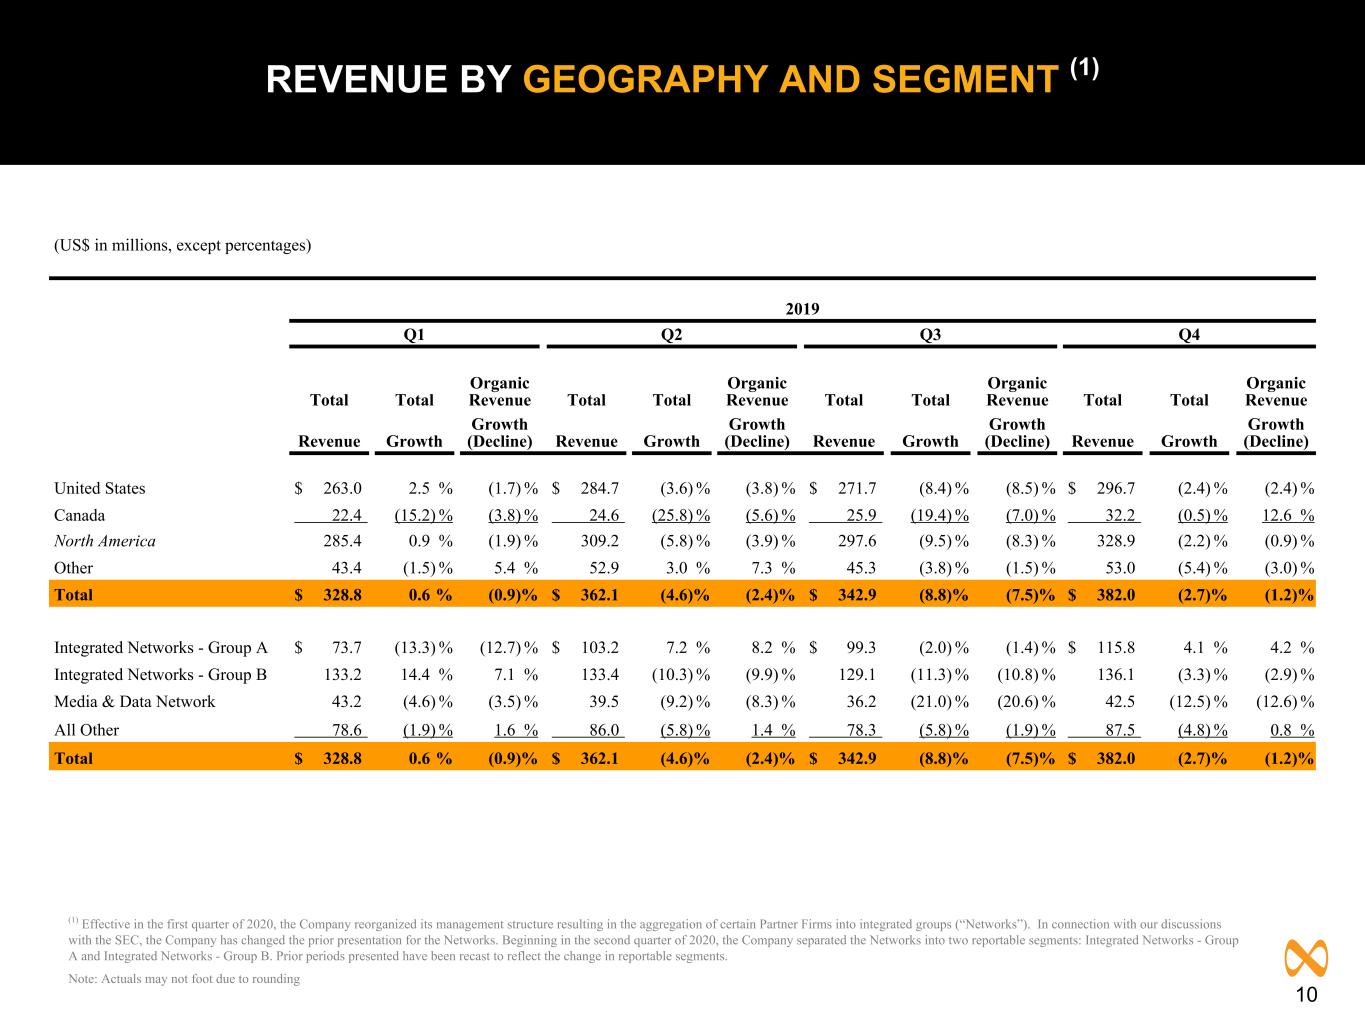
10 REVENUE BY GEOGRAPHY AND SEGMENT (1) (US$ in millions, except percentages) 2019 Q1 Q2 Q3 Q4 Total Total Organic Revenue Total Total Organic Revenue Total Total Organic Revenue Total Total Organic Revenue Revenue Growth Growth (Decline) Revenue Growth Growth (Decline) Revenue Growth Growth (Decline) Revenue Growth Growth (Decline) United States $ 263.0 2.5 % (1.7) % $ 284.7 (3.6) % (3.8) % $ 271.7 (8.4) % (8.5) % $ 296.7 (2.4) % (2.4) % Canada 22.4 (15.2) % (3.8) % 24.6 (25.8) % (5.6) % 25.9 (19.4) % (7.0) % 32.2 (0.5) % 12.6 % North America 285.4 0.9 % (1.9) % 309.2 (5.8) % (3.9) % 297.6 (9.5) % (8.3) % 328.9 (2.2) % (0.9) % Other 43.4 (1.5) % 5.4 % 52.9 3.0 % 7.3 % 45.3 (3.8) % (1.5) % 53.0 (5.4) % (3.0) % Total $ 328.8 0.6 % (0.9) % $ 362.1 (4.6) % (2.4) % $ 342.9 (8.8) % (7.5) % $ 382.0 (2.7) % (1.2) % Integrated Networks - Group A $ 73.7 (13.3) % (12.7) % $ 103.2 7.2 % 8.2 % $ 99.3 (2.0) % (1.4) % $ 115.8 4.1 % 4.2 % Integrated Networks - Group B 133.2 14.4 % 7.1 % 133.4 (10.3) % (9.9) % 129.1 (11.3) % (10.8) % 136.1 (3.3) % (2.9) % Media & Data Network 43.2 (4.6) % (3.5) % 39.5 (9.2) % (8.3) % 36.2 (21.0) % (20.6) % 42.5 (12.5) % (12.6) % All Other 78.6 (1.9) % 1.6 % 86.0 (5.8) % 1.4 % 78.3 (5.8) % (1.9) % 87.5 (4.8) % 0.8 % Total $ 328.8 0.6 % (0.9) % $ 362.1 (4.6) % (2.4) % $ 342.9 (8.8) % (7.5) % $ 382.0 (2.7) % (1.2) % (1) Effective in the first quarter of 2020, the Company reorganized its management structure resulting in the aggregation of certain Partner Firms into integrated groups (“Networks”). In connection with our discussions with the SEC, the Company has changed the prior presentation for the Networks. Beginning in the second quarter of 2020, the Company separated the Networks into two reportable segments: Integrated Networks - Group A and Integrated Networks - Group B. Prior periods presented have been recast to reflect the change in reportable segments. Note: Actuals may not foot due to rounding
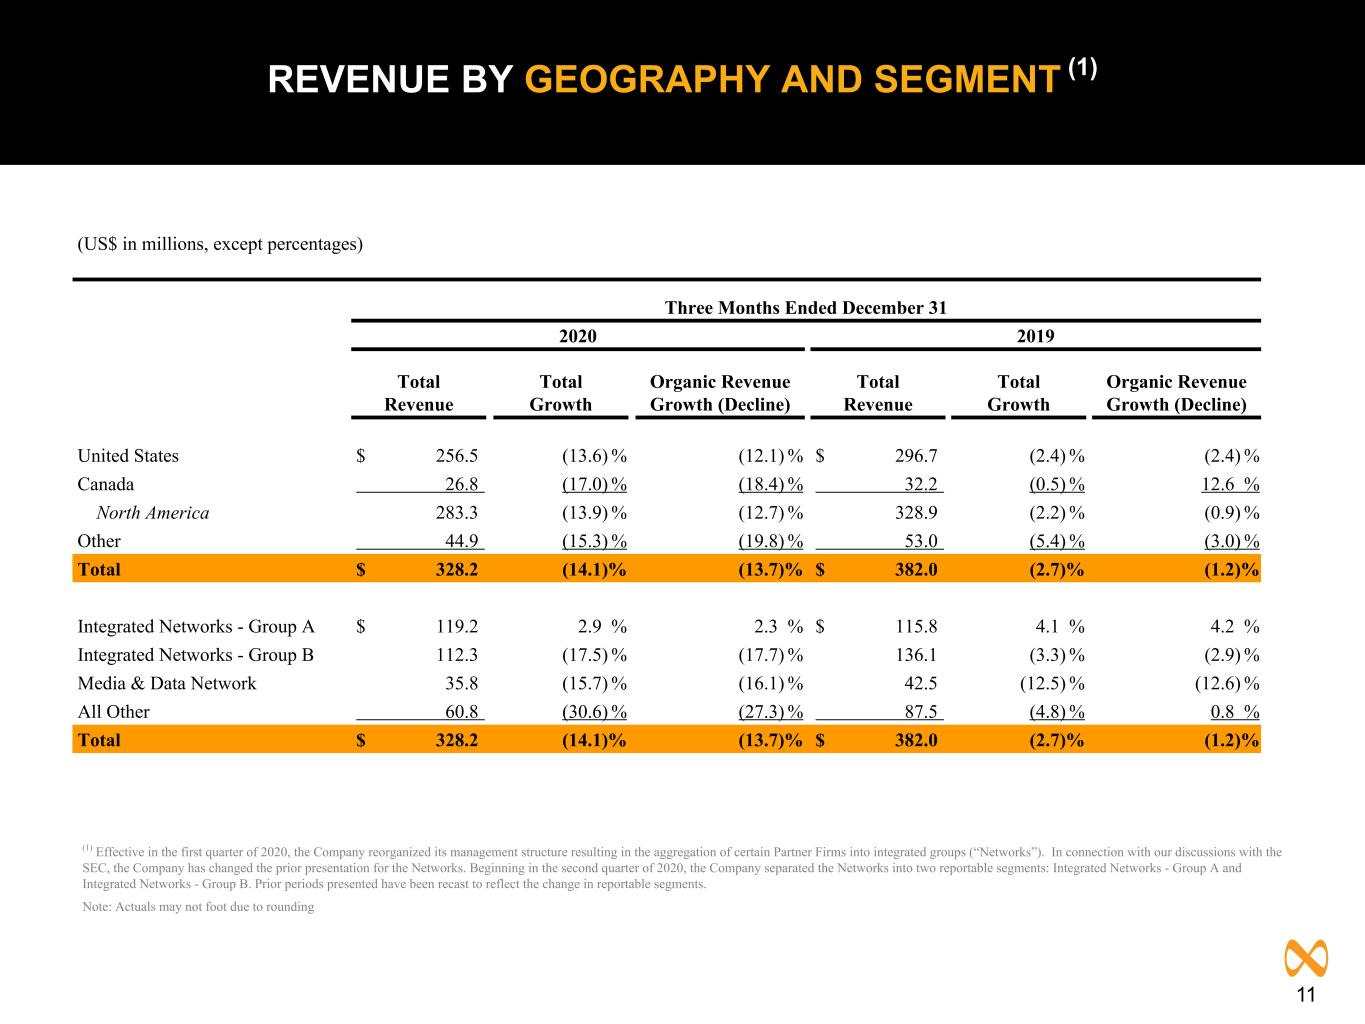
11 (US$ in millions, except percentages) Three Months Ended December 31 2020 2019 Total Total Organic Revenue Total Total Organic Revenue Revenue Growth Growth (Decline) Revenue Growth Growth (Decline) United States $ 256.5 (13.6) % (12.1) % $ 296.7 (2.4) % (2.4) % Canada 26.8 (17.0) % (18.4) % 32.2 (0.5) % 12.6 % North America 283.3 (13.9) % (12.7) % 328.9 (2.2) % (0.9) % Other 44.9 (15.3) % (19.8) % 53.0 (5.4) % (3.0) % Total $ 328.2 (14.1) % (13.7) % $ 382.0 (2.7) % (1.2) % Integrated Networks - Group A $ 119.2 2.9 % 2.3 % $ 115.8 4.1 % 4.2 % Integrated Networks - Group B 112.3 (17.5) % (17.7) % 136.1 (3.3) % (2.9) % Media & Data Network 35.8 (15.7) % (16.1) % 42.5 (12.5) % (12.6) % All Other 60.8 (30.6) % (27.3) % 87.5 (4.8) % 0.8 % Total $ 328.2 (14.1) % (13.7) % $ 382.0 (2.7) % (1.2) % REVENUE BY GEOGRAPHY AND SEGMENT (1) (1) Effective in the first quarter of 2020, the Company reorganized its management structure resulting in the aggregation of certain Partner Firms into integrated groups (“Networks”). In connection with our discussions with the SEC, the Company has changed the prior presentation for the Networks. Beginning in the second quarter of 2020, the Company separated the Networks into two reportable segments: Integrated Networks - Group A and Integrated Networks - Group B. Prior periods presented have been recast to reflect the change in reportable segments. Note: Actuals may not foot due to rounding
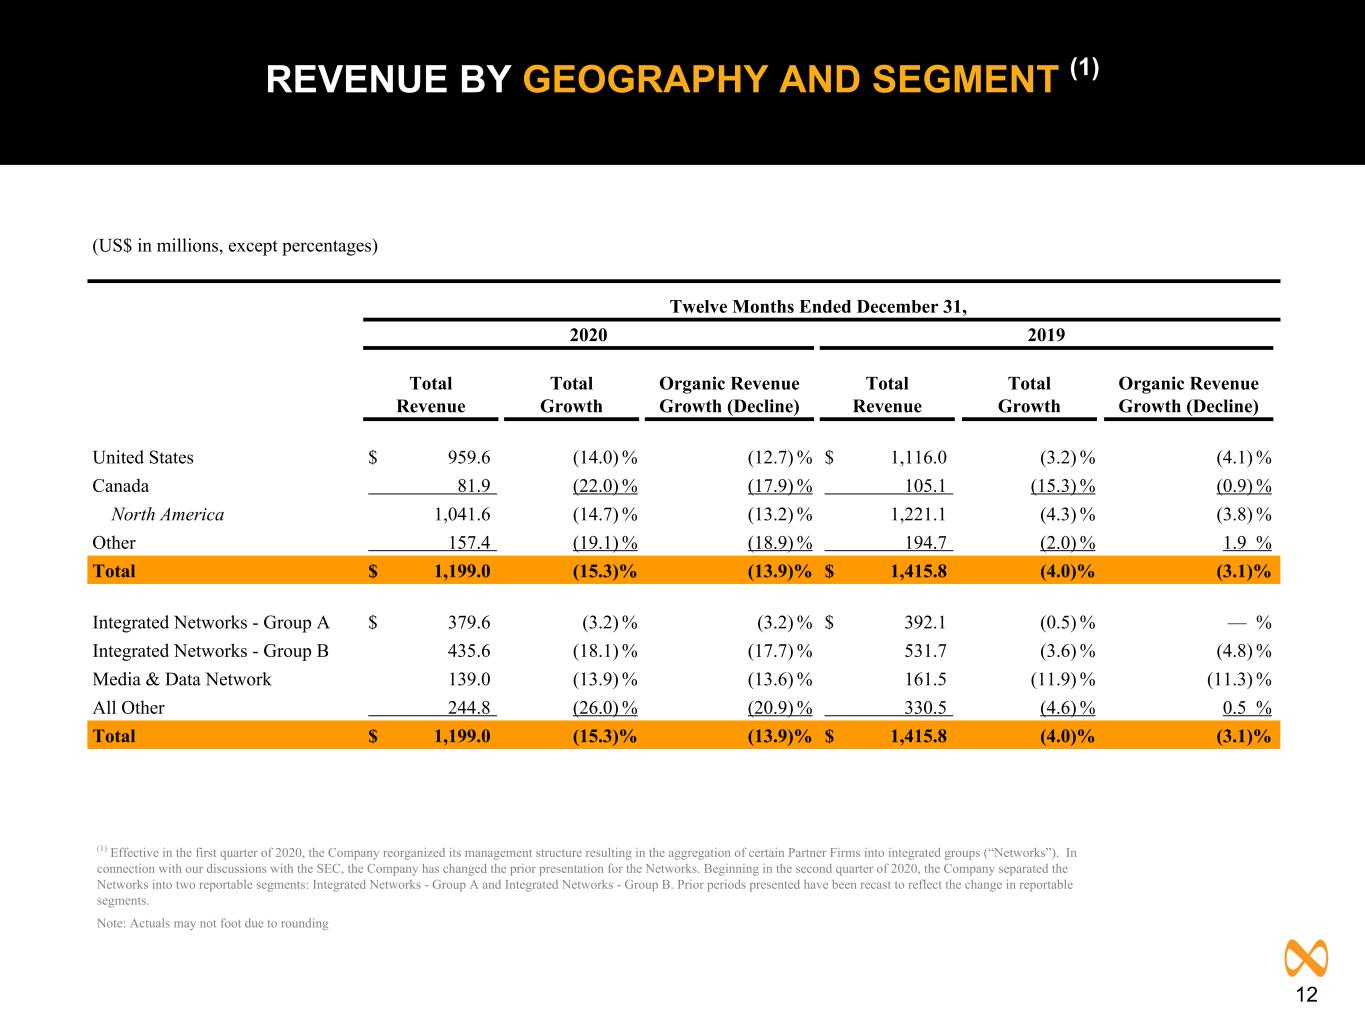
12 (US$ in millions, except percentages) Twelve Months Ended December 31, 2020 2019 Total Total Organic Revenue Total Total Organic Revenue Revenue Growth Growth (Decline) Revenue Growth Growth (Decline) United States $ 959.6 (14.0) % (12.7) % $ 1,116.0 (3.2) % (4.1) % Canada 81.9 (22.0) % (17.9) % 105.1 (15.3) % (0.9) % North America 1,041.6 (14.7) % (13.2) % 1,221.1 (4.3) % (3.8) % Other 157.4 (19.1) % (18.9) % 194.7 (2.0) % 1.9 % Total $ 1,199.0 (15.3) % (13.9) % $ 1,415.8 (4.0) % (3.1) % Integrated Networks - Group A $ 379.6 (3.2) % (3.2) % $ 392.1 (0.5) % — % Integrated Networks - Group B 435.6 (18.1) % (17.7) % 531.7 (3.6) % (4.8) % Media & Data Network 139.0 (13.9) % (13.6) % 161.5 (11.9) % (11.3) % All Other 244.8 (26.0) % (20.9) % 330.5 (4.6) % 0.5 % Total $ 1,199.0 (15.3) % (13.9) % $ 1,415.8 (4.0) % (3.1) % REVENUE BY GEOGRAPHY AND SEGMENT (1) (1) Effective in the first quarter of 2020, the Company reorganized its management structure resulting in the aggregation of certain Partner Firms into integrated groups (“Networks”). In connection with our discussions with the SEC, the Company has changed the prior presentation for the Networks. Beginning in the second quarter of 2020, the Company separated the Networks into two reportable segments: Integrated Networks - Group A and Integrated Networks - Group B. Prior periods presented have been recast to reflect the change in reportable segments. Note: Actuals may not foot due to rounding
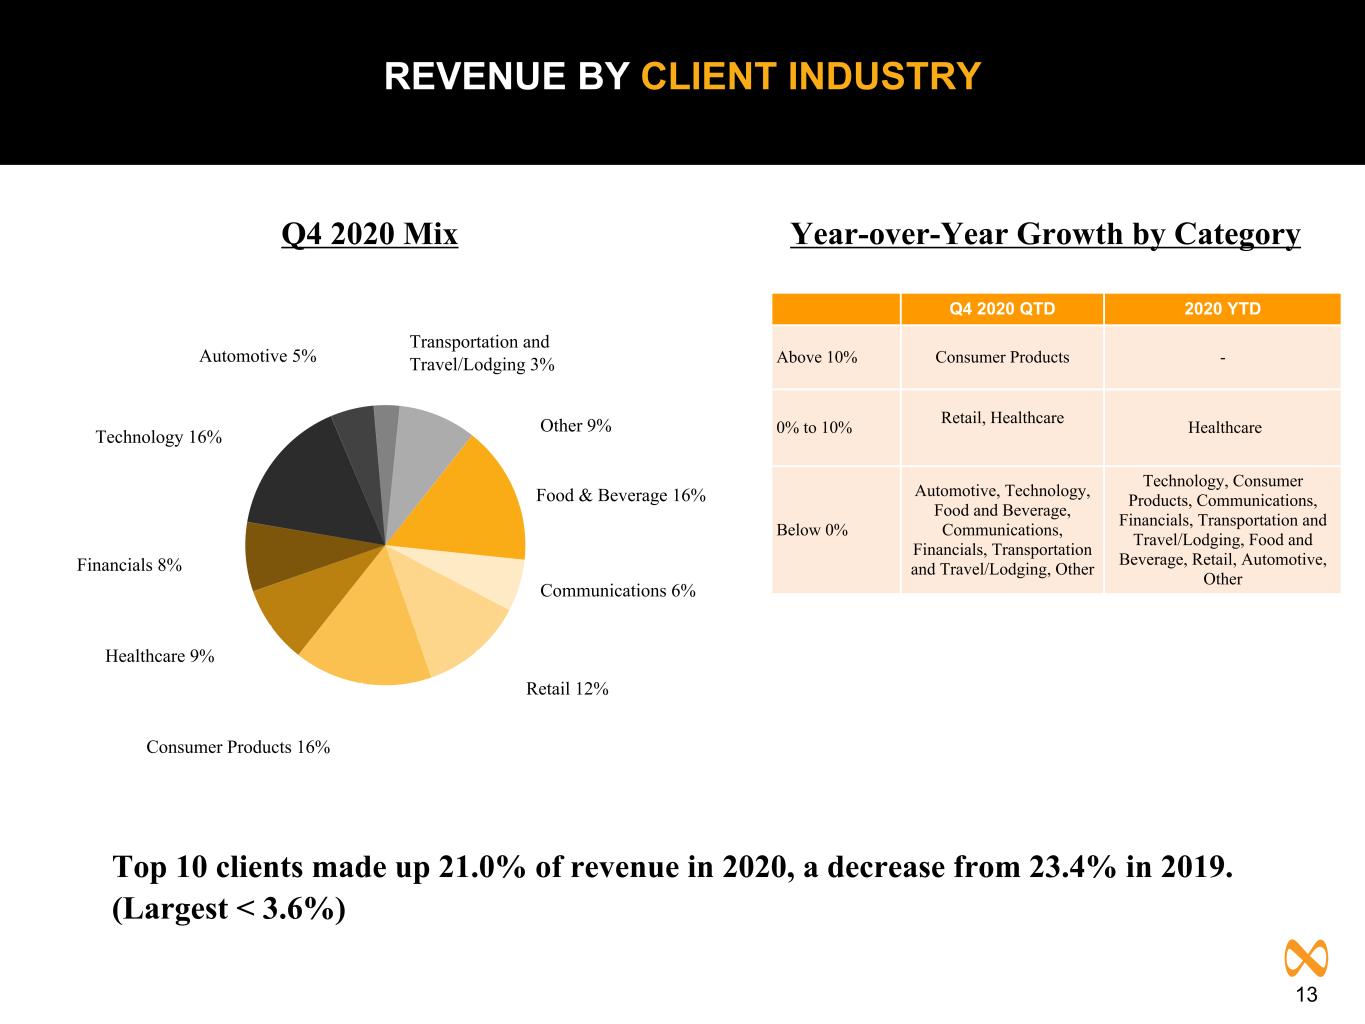
13 Top 10 clients made up 21.0% of revenue in 2020, a decrease from 23.4% in 2019. (Largest < 3.6%) REVENUE BY CLIENT INDUSTRY Q4 2020 QTD 2020 YTD Above 10% Consumer Products - 0% to 10% Retail, Healthcare Healthcare Below 0% Automotive, Technology, Food and Beverage, Communications, Financials, Transportation and Travel/Lodging, Other Technology, Consumer Products, Communications, Financials, Transportation and Travel/Lodging, Food and Beverage, Retail, Automotive, Other Year-over-Year Growth by CategoryQ4 2020 Mix Other 9% Food & Beverage 16% Communications 6% Retail 12% Consumer Products 16% Healthcare 9% Financials 8% Technology 16% Automotive 5% Transportation and Travel/Lodging 3%
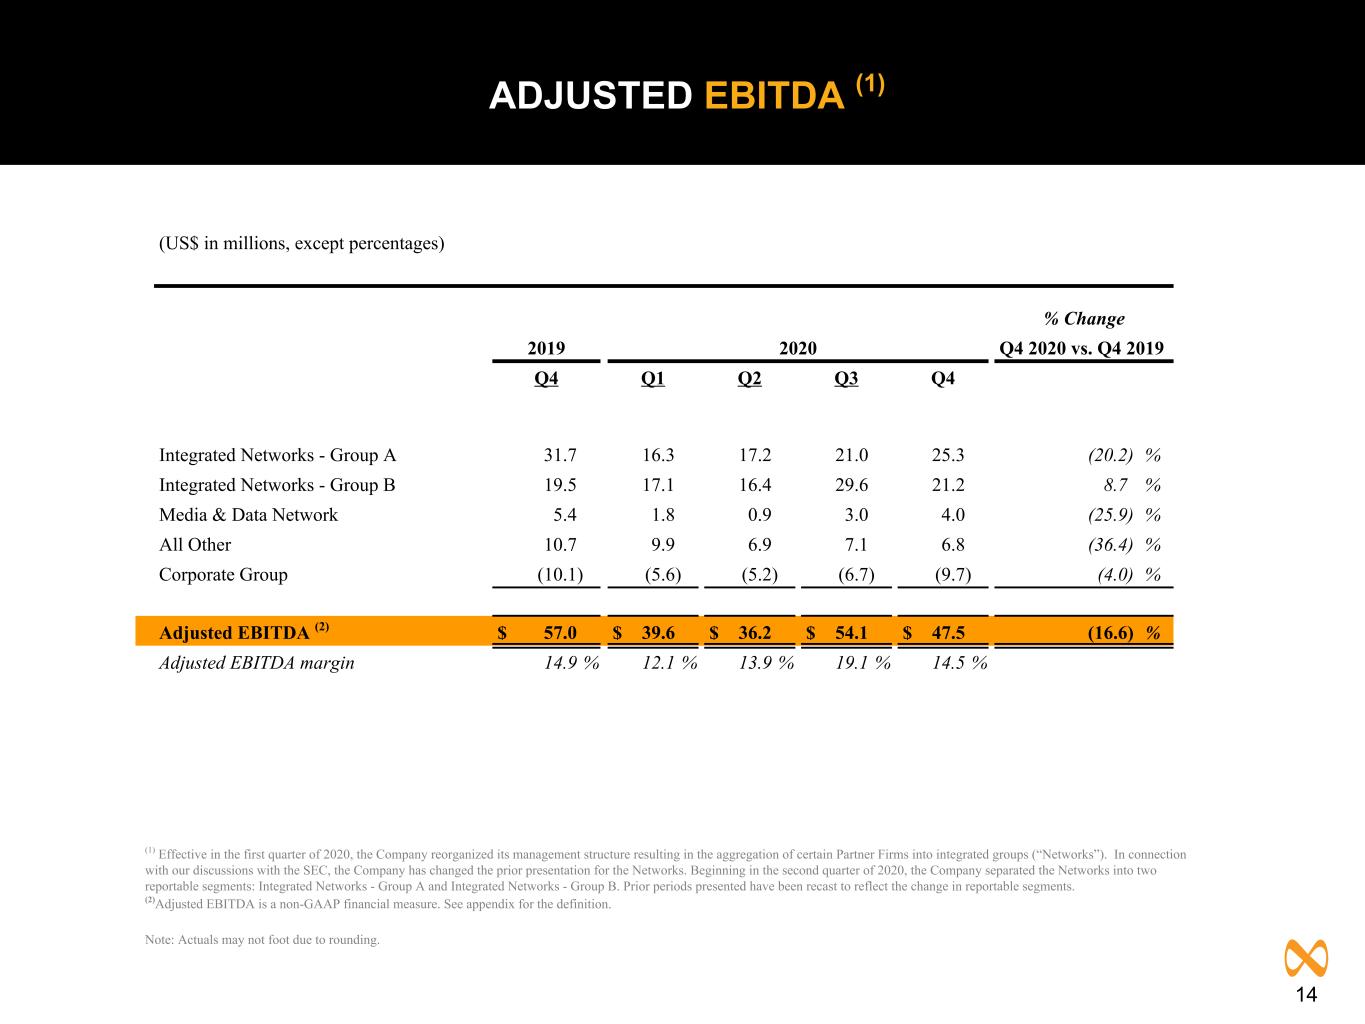
14 ADJUSTED EBITDA (1) (US$ in millions, except percentages) % Change 2019 2020 Q4 2020 vs. Q4 2019 Q4 Q1 Q2 Q3 Q4 Integrated Networks - Group A 31.7 16.3 17.2 21.0 25.3 (20.2) % Integrated Networks - Group B 19.5 17.1 16.4 29.6 21.2 8.7 % Media & Data Network 5.4 1.8 0.9 3.0 4.0 (25.9) % All Other 10.7 9.9 6.9 7.1 6.8 (36.4) % Corporate Group (10.1) (5.6) (5.2) (6.7) (9.7) (4.0) % Adjusted EBITDA (2) $ 57.0 $ 39.6 $ 36.2 $ 54.1 $ 47.5 (16.6) % Adjusted EBITDA margin 14.9 % 12.1 % 13.9 % 19.1 % 14.5 % (1) Effective in the first quarter of 2020, the Company reorganized its management structure resulting in the aggregation of certain Partner Firms into integrated groups (“Networks”). In connection with our discussions with the SEC, the Company has changed the prior presentation for the Networks. Beginning in the second quarter of 2020, the Company separated the Networks into two reportable segments: Integrated Networks - Group A and Integrated Networks - Group B. Prior periods presented have been recast to reflect the change in reportable segments. (2)Adjusted EBITDA is a non-GAAP financial measure. See appendix for the definition. Note: Actuals may not foot due to rounding.
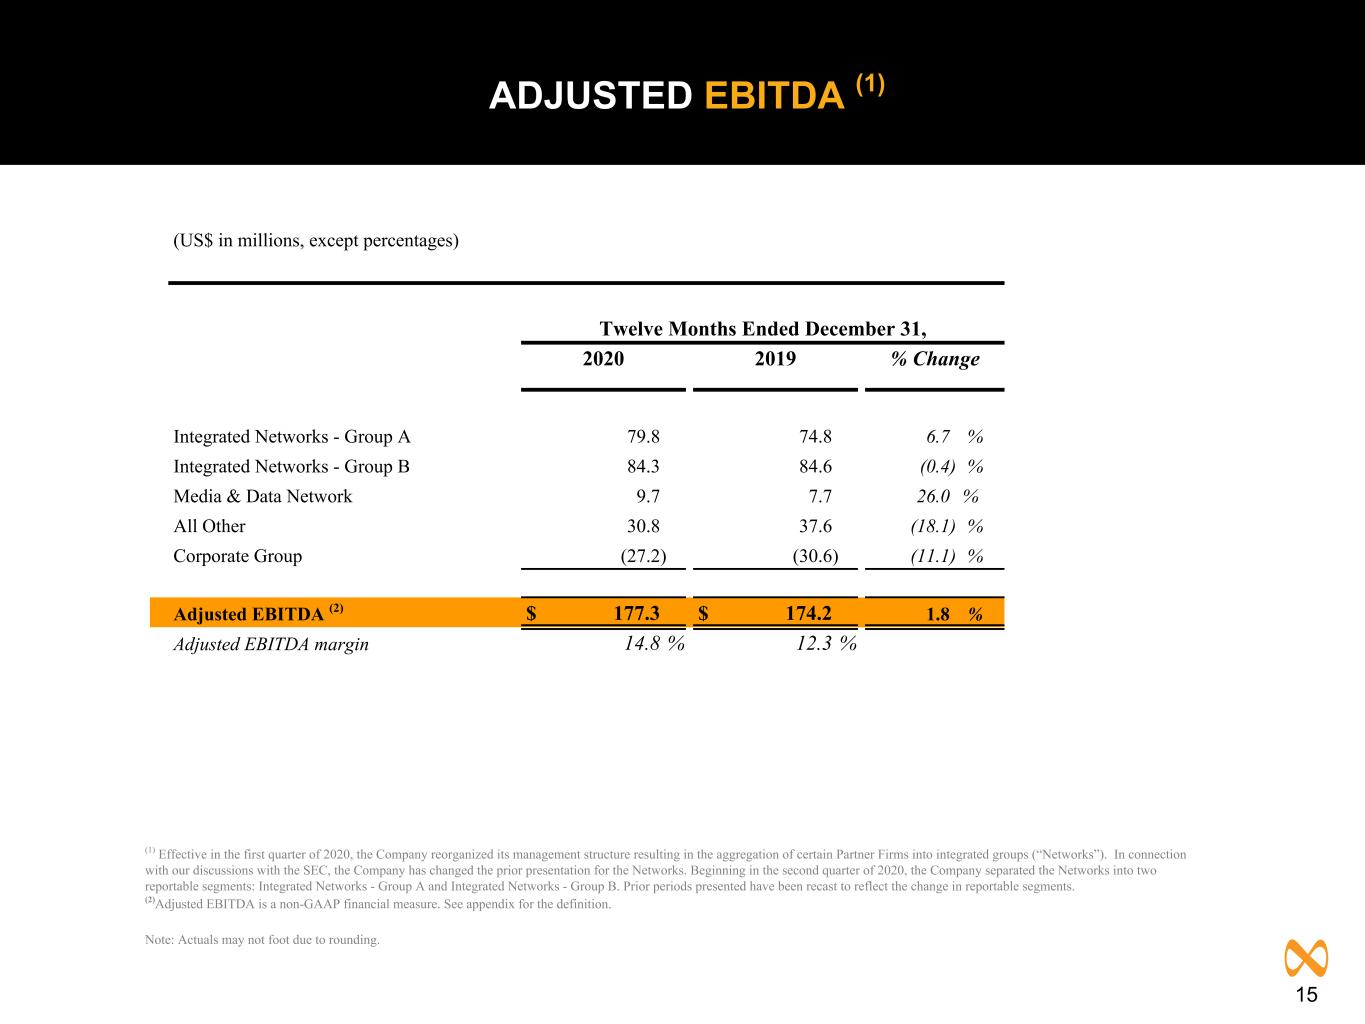
15 ADJUSTED EBITDA (1) (US$ in millions, except percentages) Twelve Months Ended December 31, 2020 2019 % Change Integrated Networks - Group A 79.8 74.8 6.7 % Integrated Networks - Group B 84.3 84.6 (0.4) % Media & Data Network 9.7 7.7 26.0 % All Other 30.8 37.6 (18.1) % Corporate Group (27.2) (30.6) (11.1) % Adjusted EBITDA (2) $ 177.3 $ 174.2 1.8 % Adjusted EBITDA margin 14.8 % 12.3 % (1) Effective in the first quarter of 2020, the Company reorganized its management structure resulting in the aggregation of certain Partner Firms into integrated groups (“Networks”). In connection with our discussions with the SEC, the Company has changed the prior presentation for the Networks. Beginning in the second quarter of 2020, the Company separated the Networks into two reportable segments: Integrated Networks - Group A and Integrated Networks - Group B. Prior periods presented have been recast to reflect the change in reportable segments. (2)Adjusted EBITDA is a non-GAAP financial measure. See appendix for the definition. Note: Actuals may not foot due to rounding.
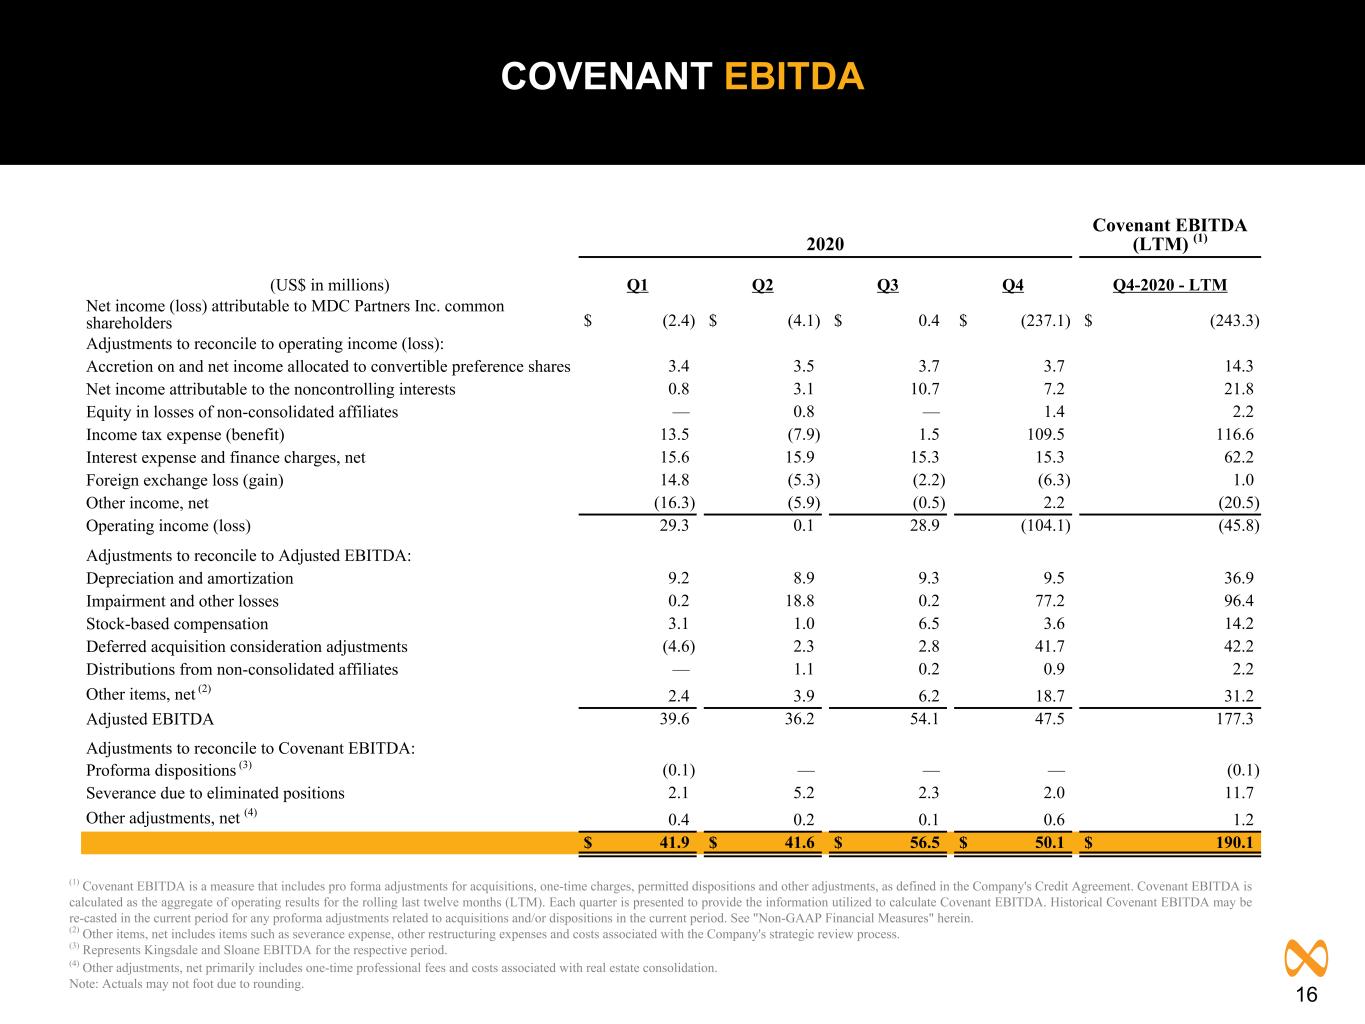
16 COVENANT EBITDA 2020 Covenant EBITDA (LTM) (1) (US$ in millions) Q1 Q2 Q3 Q4 Q4-2020 - LTM Net income (loss) attributable to MDC Partners Inc. common shareholders $ (2.4) $ (4.1) $ 0.4 $ (237.1) $ (243.3) Adjustments to reconcile to operating income (loss): Accretion on and net income allocated to convertible preference shares 3.4 3.5 3.7 3.7 14.3 Net income attributable to the noncontrolling interests 0.8 3.1 10.7 7.2 21.8 Equity in losses of non-consolidated affiliates — 0.8 — 1.4 2.2 Income tax expense (benefit) 13.5 (7.9) 1.5 109.5 116.6 Interest expense and finance charges, net 15.6 15.9 15.3 15.3 62.2 Foreign exchange loss (gain) 14.8 (5.3) (2.2) (6.3) 1.0 Other income, net (16.3) (5.9) (0.5) 2.2 (20.5) Operating income (loss) 29.3 0.1 28.9 (104.1) (45.8) Adjustments to reconcile to Adjusted EBITDA: Depreciation and amortization 9.2 8.9 9.3 9.5 36.9 Impairment and other losses 0.2 18.8 0.2 77.2 96.4 Stock-based compensation 3.1 1.0 6.5 3.6 14.2 Deferred acquisition consideration adjustments (4.6) 2.3 2.8 41.7 42.2 Distributions from non-consolidated affiliates — 1.1 0.2 0.9 2.2 Other items, net (2) 2.4 3.9 6.2 18.7 31.2 Adjusted EBITDA 39.6 36.2 54.1 47.5 177.3 Adjustments to reconcile to Covenant EBITDA: Proforma dispositions (3) (0.1) — — — (0.1) Severance due to eliminated positions 2.1 5.2 2.3 2.0 11.7 Other adjustments, net (4) 0.4 0.2 0.1 0.6 1.2 $ 41.9 $ 41.6 $ 56.5 $ 50.1 $ 190.1 (1) Covenant EBITDA is a measure that includes pro forma adjustments for acquisitions, one-time charges, permitted dispositions and other adjustments, as defined in the Company's Credit Agreement. Covenant EBITDA is calculated as the aggregate of operating results for the rolling last twelve months (LTM). Each quarter is presented to provide the information utilized to calculate Covenant EBITDA. Historical Covenant EBITDA may be re-casted in the current period for any proforma adjustments related to acquisitions and/or dispositions in the current period. See "Non-GAAP Financial Measures" herein. (2) Other items, net includes items such as severance expense, other restructuring expenses and costs associated with the Company's strategic review process. (3) Represents Kingsdale and Sloane EBITDA for the respective period. (4) Other adjustments, net primarily includes one-time professional fees and costs associated with real estate consolidation. Note: Actuals may not foot due to rounding.
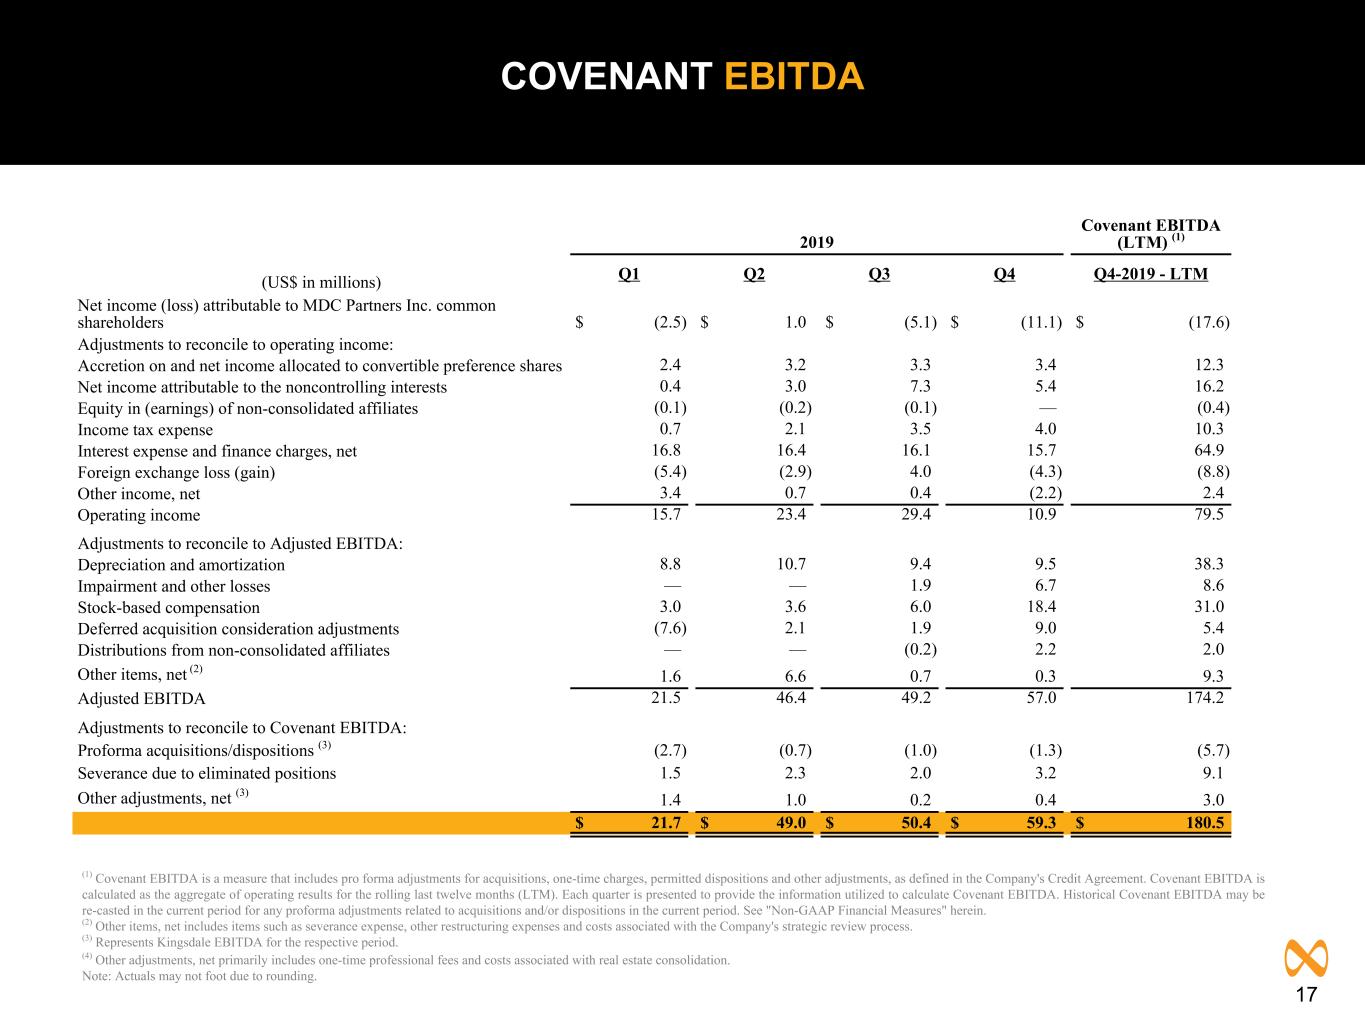
17 COVENANT EBITDA 2019 Covenant EBITDA (LTM) (1) (US$ in millions) Q1 Q2 Q3 Q4 Q4-2019 - LTM Net income (loss) attributable to MDC Partners Inc. common shareholders $ (2.5) $ 1.0 $ (5.1) $ (11.1) $ (17.6) Adjustments to reconcile to operating income: Accretion on and net income allocated to convertible preference shares 2.4 3.2 3.3 3.4 12.3 Net income attributable to the noncontrolling interests 0.4 3.0 7.3 5.4 16.2 Equity in (earnings) of non-consolidated affiliates (0.1) (0.2) (0.1) — (0.4) Income tax expense 0.7 2.1 3.5 4.0 10.3 Interest expense and finance charges, net 16.8 16.4 16.1 15.7 64.9 Foreign exchange loss (gain) (5.4) (2.9) 4.0 (4.3) (8.8) Other income, net 3.4 0.7 0.4 (2.2) 2.4 Operating income 15.7 23.4 29.4 10.9 79.5 Adjustments to reconcile to Adjusted EBITDA: Depreciation and amortization 8.8 10.7 9.4 9.5 38.3 Impairment and other losses — — 1.9 6.7 8.6 Stock-based compensation 3.0 3.6 6.0 18.4 31.0 Deferred acquisition consideration adjustments (7.6) 2.1 1.9 9.0 5.4 Distributions from non-consolidated affiliates — — (0.2) 2.2 2.0 Other items, net (2) 1.6 6.6 0.7 0.3 9.3 Adjusted EBITDA 21.5 46.4 49.2 57.0 174.2 Adjustments to reconcile to Covenant EBITDA: Proforma acquisitions/dispositions (3) (2.7) (0.7) (1.0) (1.3) (5.7) Severance due to eliminated positions 1.5 2.3 2.0 3.2 9.1 Other adjustments, net (3) 1.4 1.0 0.2 0.4 3.0 $ 21.7 $ 49.0 $ 50.4 $ 59.3 $ 180.5 (1) Covenant EBITDA is a measure that includes pro forma adjustments for acquisitions, one-time charges, permitted dispositions and other adjustments, as defined in the Company's Credit Agreement. Covenant EBITDA is calculated as the aggregate of operating results for the rolling last twelve months (LTM). Each quarter is presented to provide the information utilized to calculate Covenant EBITDA. Historical Covenant EBITDA may be re-casted in the current period for any proforma adjustments related to acquisitions and/or dispositions in the current period. See "Non-GAAP Financial Measures" herein. (2) Other items, net includes items such as severance expense, other restructuring expenses and costs associated with the Company's strategic review process. (3) Represents Kingsdale EBITDA for the respective period. (4) Other adjustments, net primarily includes one-time professional fees and costs associated with real estate consolidation. Note: Actuals may not foot due to rounding.
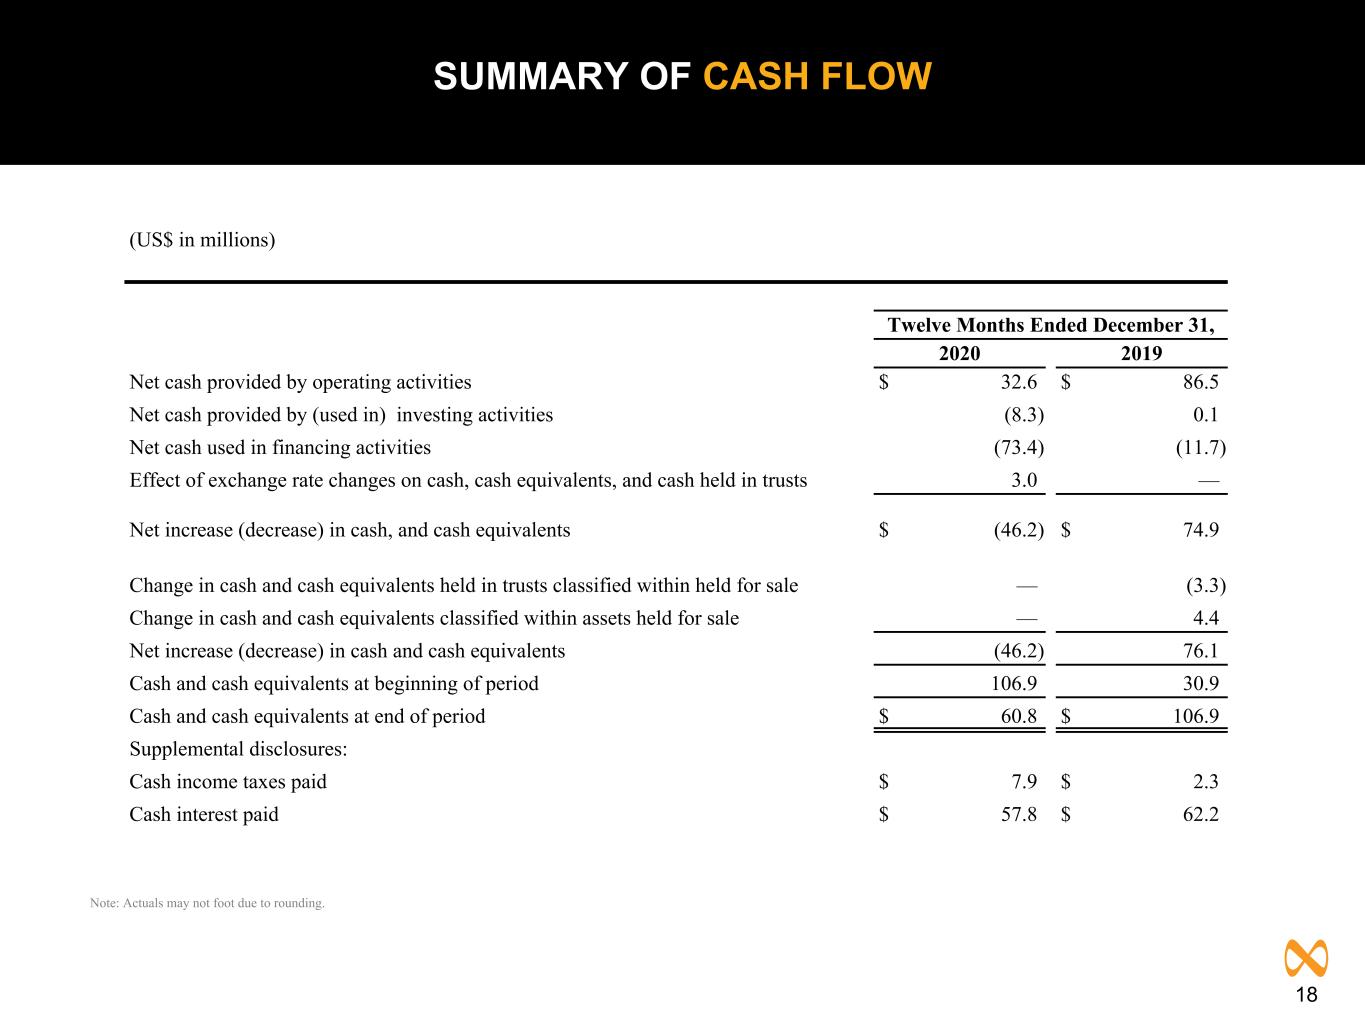
18 SUMMARY OF CASH FLOW (US$ in millions) Twelve Months Ended December 31, 2020 2019 Net cash provided by operating activities $ 32.6 $ 86.5 Net cash provided by (used in) investing activities (8.3) 0.1 Net cash used in financing activities (73.4) (11.7) Effect of exchange rate changes on cash, cash equivalents, and cash held in trusts 3.0 — Net increase (decrease) in cash, and cash equivalents $ (46.2) $ 74.9 Change in cash and cash equivalents held in trusts classified within held for sale — (3.3) Change in cash and cash equivalents classified within assets held for sale — 4.4 Net increase (decrease) in cash and cash equivalents (46.2) 76.1 Cash and cash equivalents at beginning of period 106.9 30.9 Cash and cash equivalents at end of period $ 60.8 $ 106.9 Supplemental disclosures: Cash income taxes paid $ 7.9 $ 2.3 Cash interest paid $ 57.8 $ 62.2 Note: Actuals may not foot due to rounding.
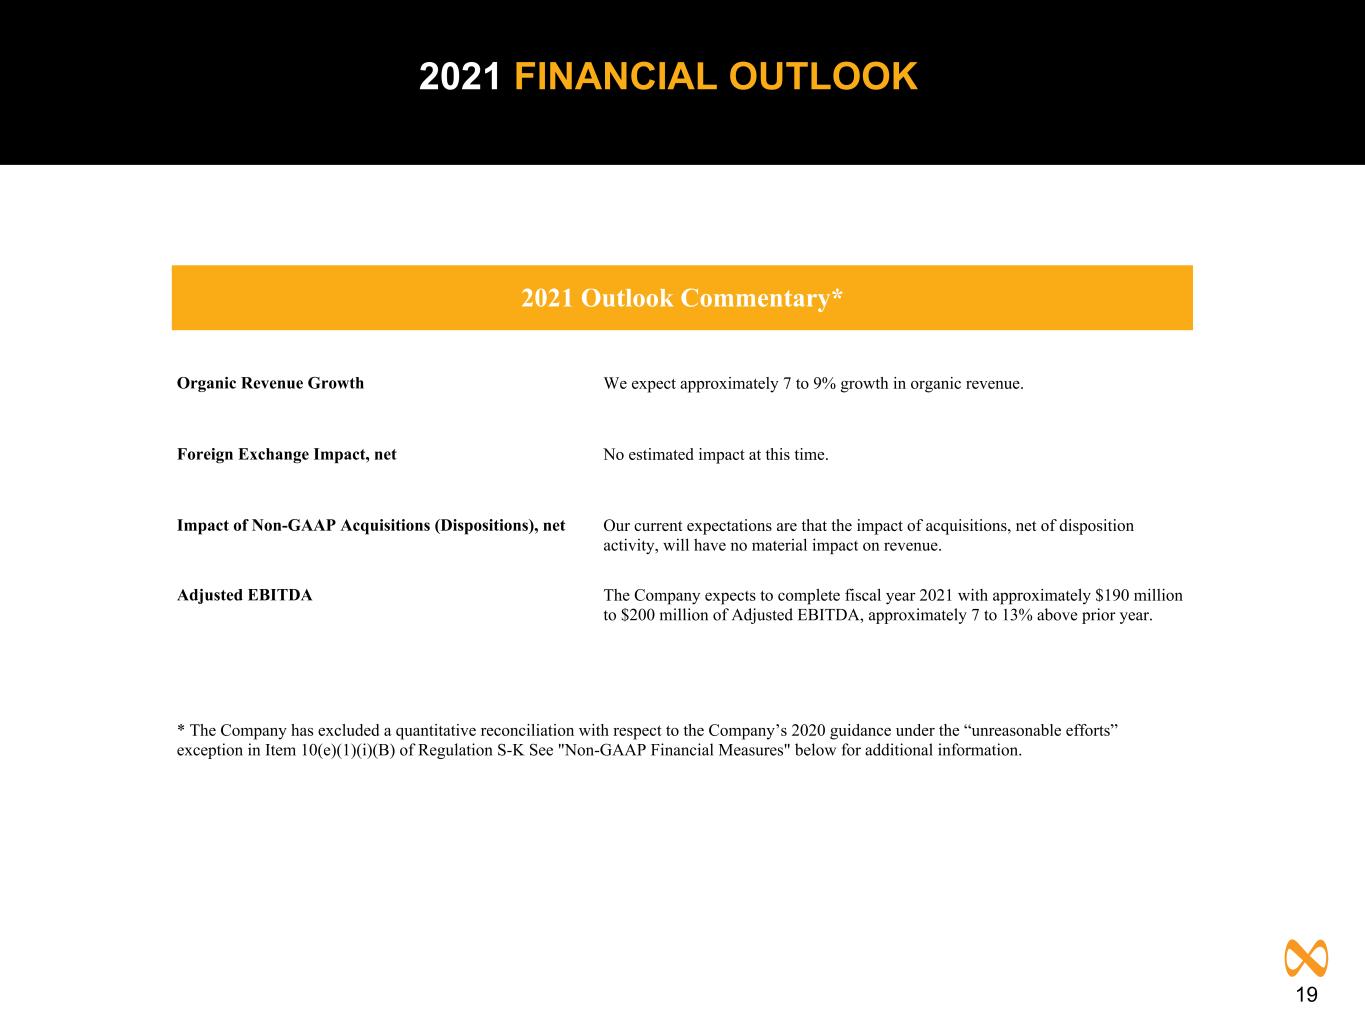
19 2021 FINANCIAL OUTLOOK 2020 Outlook Commentary* Organic Revenue Growth We expect approximately 7 to 9% growth in organic revenue. Foreign Exchange Impact, net No estimated impact at this time. Impact of Non-GAAP Acquisitions (Dispositions), net Our current expectations are that the impact of acquisitions, net of disposition activity, will have no material impact on revenue. Adjusted EBITDA The Company expects to complete fiscal year 2021 with approximately $190 million to $200 million of Adjusted EBITDA, approximately 7 to 13% above prior year. * The Company has excluded a quantitative reconciliation with respect to the Company’s 2020 guidance under the “unreasonable efforts” exception in Item 10(e)(1)(i)(B) of Regulation S-K See "Non-GAAP Financial Measures" below for additional information. 2021 Outlook Commentary*
20 APPENDIX
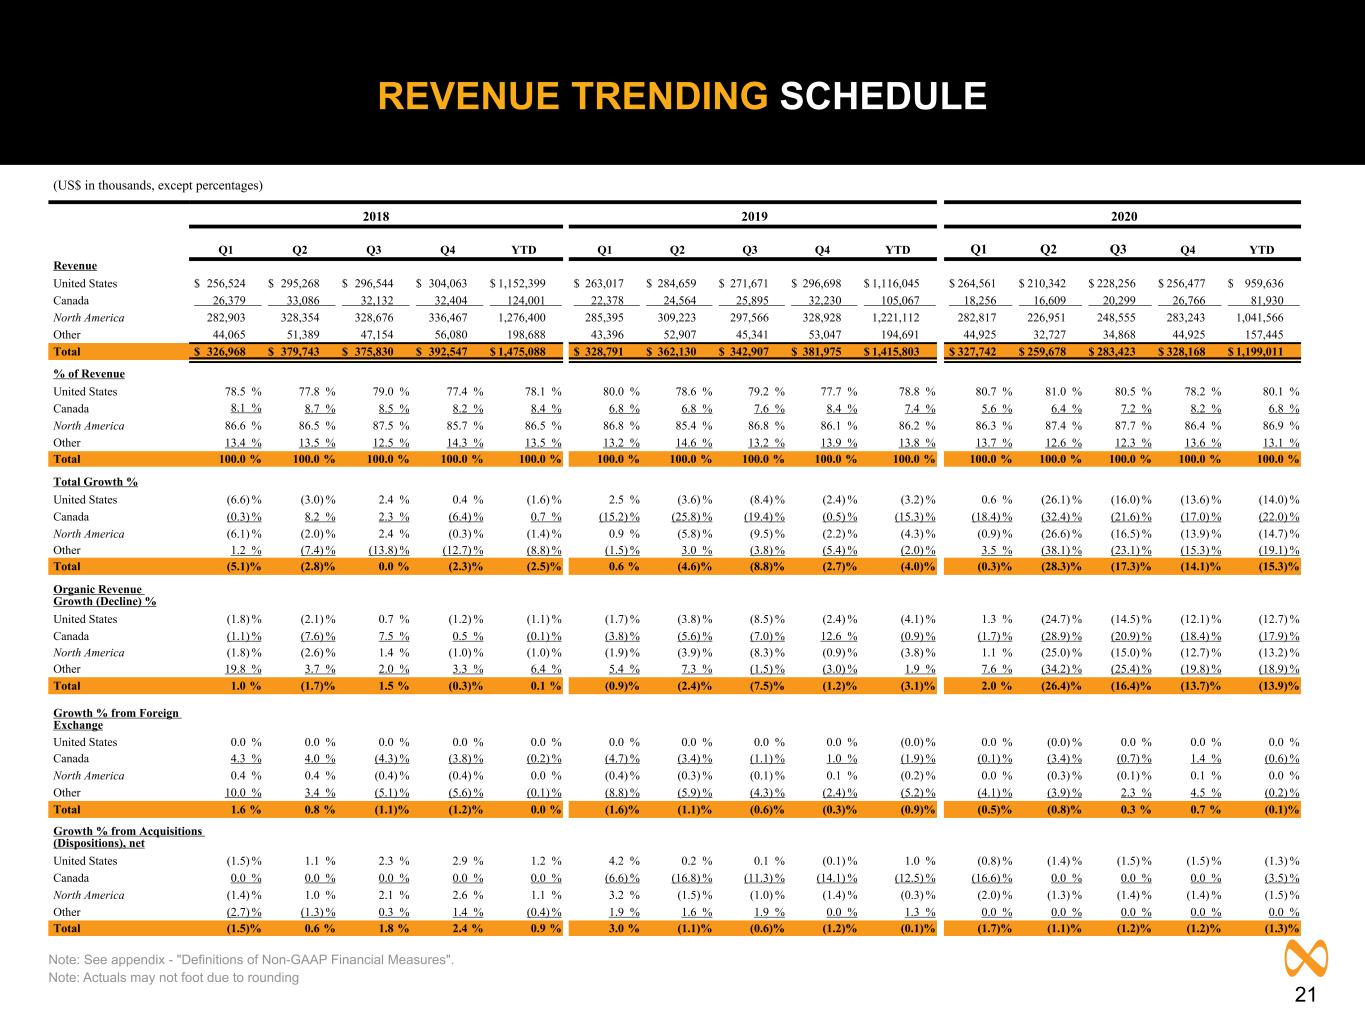
21 REVENUE TRENDING SCHEDULE Note: See appendix - "Definitions of Non-GAAP Financial Measures". Note: Actuals may not foot due to rounding (US$ in thousands, except percentages) 2018 2019 2020 Q1 Q2 Q3 Q4 YTD Q1 Q2 Q3 Q4 YTD Q1 Q2 Q3 Q4 YTD Revenue United States $ 256,524 $ 295,268 $ 296,544 $ 304,063 $ 1,152,399 $ 263,017 $ 284,659 $ 271,671 $ 296,698 $ 1,116,045 $ 264,561 $ 210,342 $ 228,256 $ 256,477 $ 959,636 Canada 26,379 33,086 32,132 32,404 124,001 22,378 24,564 25,895 32,230 105,067 18,256 16,609 20,299 26,766 81,930 North America 282,903 328,354 328,676 336,467 1,276,400 285,395 309,223 297,566 328,928 1,221,112 282,817 226,951 248,555 283,243 1,041,566 Other 44,065 51,389 47,154 56,080 198,688 43,396 52,907 45,341 53,047 194,691 44,925 32,727 34,868 44,925 157,445 Total $ 326,968 $ 379,743 $ 375,830 $ 392,547 $ 1,475,088 $ 328,791 $ 362,130 $ 342,907 $ 381,975 $ 1,415,803 $ 327,742 $ 259,678 $ 283,423 $ 328,168 $ 1,199,011 % of Revenue United States 78.5 % 77.8 % 79.0 % 77.4 % 78.1 % 80.0 % 78.6 % 79.2 % 77.7 % 78.8 % 80.7 % 81.0 % 80.5 % 78.2 % 80.1 % Canada 8.1 % 8.7 % 8.5 % 8.2 % 8.4 % 6.8 % 6.8 % 7.6 % 8.4 % 7.4 % 5.6 % 6.4 % 7.2 % 8.2 % 6.8 % North America 86.6 % 86.5 % 87.5 % 85.7 % 86.5 % 86.8 % 85.4 % 86.8 % 86.1 % 86.2 % 86.3 % 87.4 % 87.7 % 86.4 % 86.9 % Other 13.4 % 13.5 % 12.5 % 14.3 % 13.5 % 13.2 % 14.6 % 13.2 % 13.9 % 13.8 % 13.7 % 12.6 % 12.3 % 13.6 % 13.1 % Total 100.0 % 100.0 % 100.0 % 100.0 % 100.0 % 100.0 % 100.0 % 100.0 % 100.0 % 100.0 % 100.0 % 100.0 % 100.0 % 100.0 % 100.0 % Total Growth % United States (6.6) % (3.0) % 2.4 % 0.4 % (1.6) % 2.5 % (3.6) % (8.4) % (2.4) % (3.2) % 0.6 % (26.1) % (16.0) % (13.6) % (14.0) % Canada (0.3) % 8.2 % 2.3 % (6.4) % 0.7 % (15.2) % (25.8) % (19.4) % (0.5) % (15.3) % (18.4) % (32.4) % (21.6) % (17.0) % (22.0) % North America (6.1) % (2.0) % 2.4 % (0.3) % (1.4) % 0.9 % (5.8) % (9.5) % (2.2) % (4.3) % (0.9) % (26.6) % (16.5) % (13.9) % (14.7) % Other 1.2 % (7.4) % (13.8) % (12.7) % (8.8) % (1.5) % 3.0 % (3.8) % (5.4) % (2.0) % 3.5 % (38.1) % (23.1) % (15.3) % (19.1) % Total (5.1) % (2.8) % 0.0 % (2.3) % (2.5) % 0.6 % (4.6) % (8.8) % (2.7) % (4.0) % (0.3) % (28.3) % (17.3) % (14.1) % (15.3) % Organic Revenue Growth (Decline) % United States (1.8) % (2.1) % 0.7 % (1.2) % (1.1) % (1.7) % (3.8) % (8.5) % (2.4) % (4.1) % 1.3 % (24.7) % (14.5) % (12.1) % (12.7) % Canada (1.1) % (7.6) % 7.5 % 0.5 % (0.1) % (3.8) % (5.6) % (7.0) % 12.6 % (0.9) % (1.7) % (28.9) % (20.9) % (18.4) % (17.9) % North America (1.8) % (2.6) % 1.4 % (1.0) % (1.0) % (1.9) % (3.9) % (8.3) % (0.9) % (3.8) % 1.1 % (25.0) % (15.0) % (12.7) % (13.2) % Other 19.8 % 3.7 % 2.0 % 3.3 % 6.4 % 5.4 % 7.3 % (1.5) % (3.0) % 1.9 % 7.6 % (34.2) % (25.4) % (19.8) % (18.9) % Total 1.0 % (1.7) % 1.5 % (0.3) % 0.1 % (0.9) % (2.4) % (7.5) % (1.2) % (3.1) % 2.0 % (26.4) % (16.4) % (13.7) % (13.9) % Growth % from Foreign Exchange United States 0.0 % 0.0 % 0.0 % 0.0 % 0.0 % 0.0 % 0.0 % 0.0 % 0.0 % (0.0) % 0.0 % (0.0) % 0.0 % 0.0 % 0.0 % Canada 4.3 % 4.0 % (4.3) % (3.8) % (0.2) % (4.7) % (3.4) % (1.1) % 1.0 % (1.9) % (0.1) % (3.4) % (0.7) % 1.4 % (0.6) % North America 0.4 % 0.4 % (0.4) % (0.4) % 0.0 % (0.4) % (0.3) % (0.1) % 0.1 % (0.2) % 0.0 % (0.3) % (0.1) % 0.1 % 0.0 % Other 10.0 % 3.4 % (5.1) % (5.6) % (0.1) % (8.8) % (5.9) % (4.3) % (2.4) % (5.2) % (4.1) % (3.9) % 2.3 % 4.5 % (0.2) % Total 1.6 % 0.8 % (1.1) % (1.2) % 0.0 % (1.6) % (1.1) % (0.6) % (0.3) % (0.9) % (0.5) % (0.8) % 0.3 % 0.7 % (0.1) % Growth % from Acquisitions (Dispositions), net United States (1.5) % 1.1 % 2.3 % 2.9 % 1.2 % 4.2 % 0.2 % 0.1 % (0.1) % 1.0 % (0.8) % (1.4) % (1.5) % (1.5) % (1.3) % Canada 0.0 % 0.0 % 0.0 % 0.0 % 0.0 % (6.6) % (16.8) % (11.3) % (14.1) % (12.5) % (16.6) % 0.0 % 0.0 % 0.0 % (3.5) % North America (1.4) % 1.0 % 2.1 % 2.6 % 1.1 % 3.2 % (1.5) % (1.0) % (1.4) % (0.3) % (2.0) % (1.3) % (1.4) % (1.4) % (1.5) % Other (2.7) % (1.3) % 0.3 % 1.4 % (0.4) % 1.9 % 1.6 % 1.9 % 0.0 % 1.3 % 0.0 % 0.0 % 0.0 % 0.0 % 0.0 % Total (1.5) % 0.6 % 1.8 % 2.4 % 0.9 % 3.0 % (1.1) % (0.6) % (1.2) % (0.1) % (1.7) % (1.1) % (1.2) % (1.2) % (1.3) %
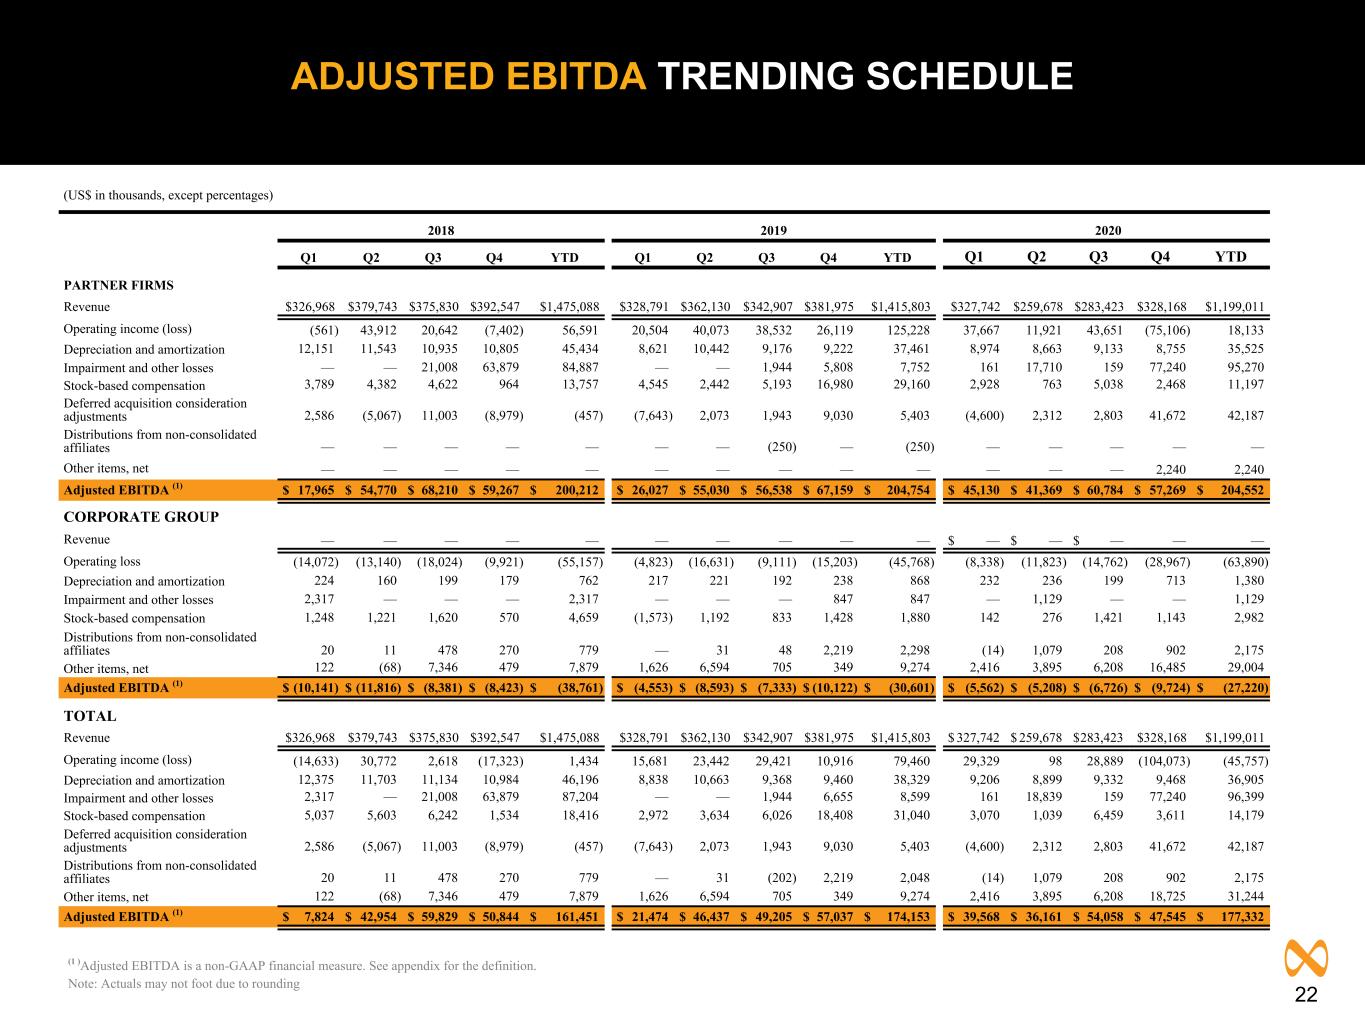
22 ADJUSTED EBITDA TRENDING SCHEDULE (US$ in thousands, except percentages) 2018 2019 2020 Q1 Q2 Q3 Q4 YTD Q1 Q2 Q3 Q4 YTD Q1 Q2 Q3 Q4 YTD PARTNER FIRMS Revenue $326,968 $379,743 $375,830 $392,547 $1,475,088 $328,791 $362,130 $342,907 $381,975 $1,415,803 $327,742 $259,678 $283,423 $328,168 $1,199,011 Operating income (loss) (561) 43,912 20,642 (7,402) 56,591 20,504 40,073 38,532 26,119 125,228 37,667 11,921 43,651 (75,106) 18,133 Depreciation and amortization 12,151 11,543 10,935 10,805 45,434 8,621 10,442 9,176 9,222 37,461 8,974 8,663 9,133 8,755 35,525 Impairment and other losses — — 21,008 63,879 84,887 — — 1,944 5,808 7,752 161 17,710 159 77,240 95,270 Stock-based compensation 3,789 4,382 4,622 964 13,757 4,545 2,442 5,193 16,980 29,160 2,928 763 5,038 2,468 11,197 Deferred acquisition consideration adjustments 2,586 (5,067) 11,003 (8,979) (457) (7,643) 2,073 1,943 9,030 5,403 (4,600) 2,312 2,803 41,672 42,187 Distributions from non-consolidated affiliates — — — — — — — (250) — (250) — — — — — Other items, net — — — — — — — — — — — — — 2,240 2,240 Adjusted EBITDA (1) $ 17,965 $ 54,770 $ 68,210 $ 59,267 $ 200,212 $ 26,027 $ 55,030 $ 56,538 $ 67,159 $ 204,754 $ 45,130 $ 41,369 $ 60,784 $ 57,269 $ 204,552 CORPORATE GROUP Revenue — — — — — — — — — — $ — $ — $ — — — Operating loss (14,072) (13,140) (18,024) (9,921) (55,157) (4,823) (16,631) (9,111) (15,203) (45,768) (8,338) (11,823) (14,762) (28,967) (63,890) Depreciation and amortization 224 160 199 179 762 217 221 192 238 868 232 236 199 713 1,380 Impairment and other losses 2,317 — — — 2,317 — — — 847 847 — 1,129 — — 1,129 Stock-based compensation 1,248 1,221 1,620 570 4,659 (1,573) 1,192 833 1,428 1,880 142 276 1,421 1,143 2,982 Distributions from non-consolidated affiliates 20 11 478 270 779 — 31 48 2,219 2,298 (14) 1,079 208 902 2,175 Other items, net 122 (68) 7,346 479 7,879 1,626 6,594 705 349 9,274 2,416 3,895 6,208 16,485 29,004 Adjusted EBITDA (1) $ (10,141) $ (11,816) $ (8,381) $ (8,423) $ (38,761) $ (4,553) $ (8,593) $ (7,333) $ (10,122) $ (30,601) $ (5,562) $ (5,208) $ (6,726) $ (9,724) $ (27,220) TOTAL Revenue $326,968 $379,743 $375,830 $392,547 $1,475,088 $328,791 $362,130 $342,907 $381,975 $1,415,803 $ 327,742 $ 259,678 $ 283,423 $328,168 $1,199,011 Operating income (loss) (14,633) 30,772 2,618 (17,323) 1,434 15,681 23,442 29,421 10,916 79,460 29,329 98 28,889 (104,073) (45,757) Depreciation and amortization 12,375 11,703 11,134 10,984 46,196 8,838 10,663 9,368 9,460 38,329 9,206 8,899 9,332 9,468 36,905 Impairment and other losses 2,317 — 21,008 63,879 87,204 — — 1,944 6,655 8,599 161 18,839 159 77,240 96,399 Stock-based compensation 5,037 5,603 6,242 1,534 18,416 2,972 3,634 6,026 18,408 31,040 3,070 1,039 6,459 3,611 14,179 Deferred acquisition consideration adjustments 2,586 (5,067) 11,003 (8,979) (457) (7,643) 2,073 1,943 9,030 5,403 (4,600) 2,312 2,803 41,672 42,187 Distributions from non-consolidated affiliates 20 11 478 270 779 — 31 (202) 2,219 2,048 (14) 1,079 208 902 2,175 Other items, net 122 (68) 7,346 479 7,879 1,626 6,594 705 349 9,274 2,416 3,895 6,208 18,725 31,244 Adjusted EBITDA (1) $ 7,824 $ 42,954 $ 59,829 $ 50,844 $ 161,451 $ 21,474 $ 46,437 $ 49,205 $ 57,037 $ 174,153 $ 39,568 $ 36,161 $ 54,058 $ 47,545 $ 177,332 (1 )Adjusted EBITDA is a non-GAAP financial measure. See appendix for the definition. Note: Actuals may not foot due to rounding
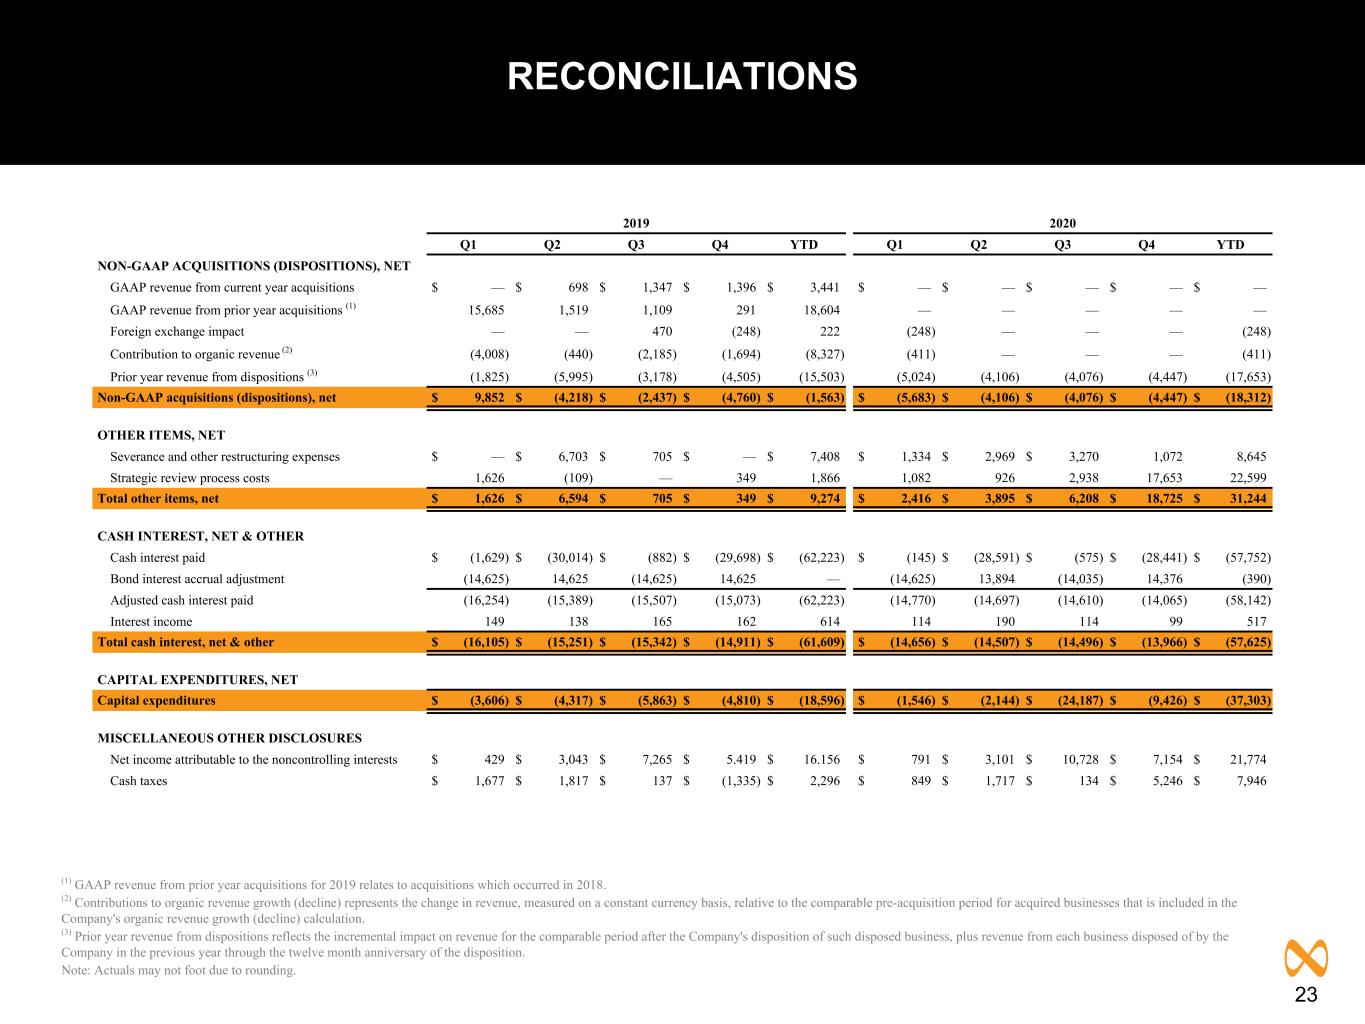
23 RECONCILIATIONS 2019 2020 Q1 Q2 Q3 Q4 YTD Q1 Q2 Q3 Q4 YTD NON-GAAP ACQUISITIONS (DISPOSITIONS), NET GAAP revenue from current year acquisitions $ — $ 698 $ 1,347 $ 1,396 $ 3,441 $ — $ — $ — $ — $ — GAAP revenue from prior year acquisitions (1) 15,685 1,519 1,109 291 18,604 — — — — — Foreign exchange impact — — 470 (248) 222 (248) — — — (248) Contribution to organic revenue (2) (4,008) (440) (2,185) (1,694) (8,327) (411) — — — (411) Prior year revenue from dispositions (3) (1,825) (5,995) (3,178) (4,505) (15,503) (5,024) (4,106) (4,076) (4,447) (17,653) Non-GAAP acquisitions (dispositions), net $ 9,852 $ (4,218) $ (2,437) $ (4,760) $ (1,563) $ (5,683) $ (4,106) $ (4,076) $ (4,447) $ (18,312) OTHER ITEMS, NET Severance and other restructuring expenses $ — $ 6,703 $ 705 $ — $ 7,408 $ 1,334 $ 2,969 $ 3,270 1,072 8,645 Strategic review process costs 1,626 (109) — 349 1,866 1,082 926 2,938 17,653 22,599 Total other items, net $ 1,626 $ 6,594 $ 705 $ 349 $ 9,274 $ 2,416 $ 3,895 $ 6,208 $ 18,725 $ 31,244 CASH INTEREST, NET & OTHER Cash interest paid $ (1,629) $ (30,014) $ (882) $ (29,698) $ (62,223) $ (145) $ (28,591) $ (575) $ (28,441) $ (57,752) Bond interest accrual adjustment (14,625) 14,625 (14,625) 14,625 — (14,625) 13,894 (14,035) 14,376 (390) Adjusted cash interest paid (16,254) (15,389) (15,507) (15,073) (62,223) (14,770) (14,697) (14,610) (14,065) (58,142) Interest income 149 138 165 162 614 114 190 114 99 517 Total cash interest, net & other $ (16,105) $ (15,251) $ (15,342) $ (14,911) $ (61,609) $ (14,656) $ (14,507) $ (14,496) $ (13,966) $ (57,625) CAPITAL EXPENDITURES, NET Capital expenditures $ (3,606) $ (4,317) $ (5,863) $ (4,810) $ (18,596) $ (1,546) $ (2,144) $ (24,187) $ (9,426) $ (37,303) MISCELLANEOUS OTHER DISCLOSURES Net income attributable to the noncontrolling interests $ 429 $ 3,043 $ 7,265 $ 5.419 $ 16.156 $ 791 $ 3,101 $ 10,728 $ 7,154 $ 21,774 Cash taxes $ 1,677 $ 1,817 $ 137 $ (1,335) $ 2,296 $ 849 $ 1,717 $ 134 $ 5,246 $ 7,946 (1) GAAP revenue from prior year acquisitions for 2019 relates to acquisitions which occurred in 2018. (2) Contributions to organic revenue growth (decline) represents the change in revenue, measured on a constant currency basis, relative to the comparable pre-acquisition period for acquired businesses that is included in the Company's organic revenue growth (decline) calculation. (3) Prior year revenue from dispositions reflects the incremental impact on revenue for the comparable period after the Company's disposition of such disposed business, plus revenue from each business disposed of by the Company in the previous year through the twelve month anniversary of the disposition. Note: Actuals may not foot due to rounding.
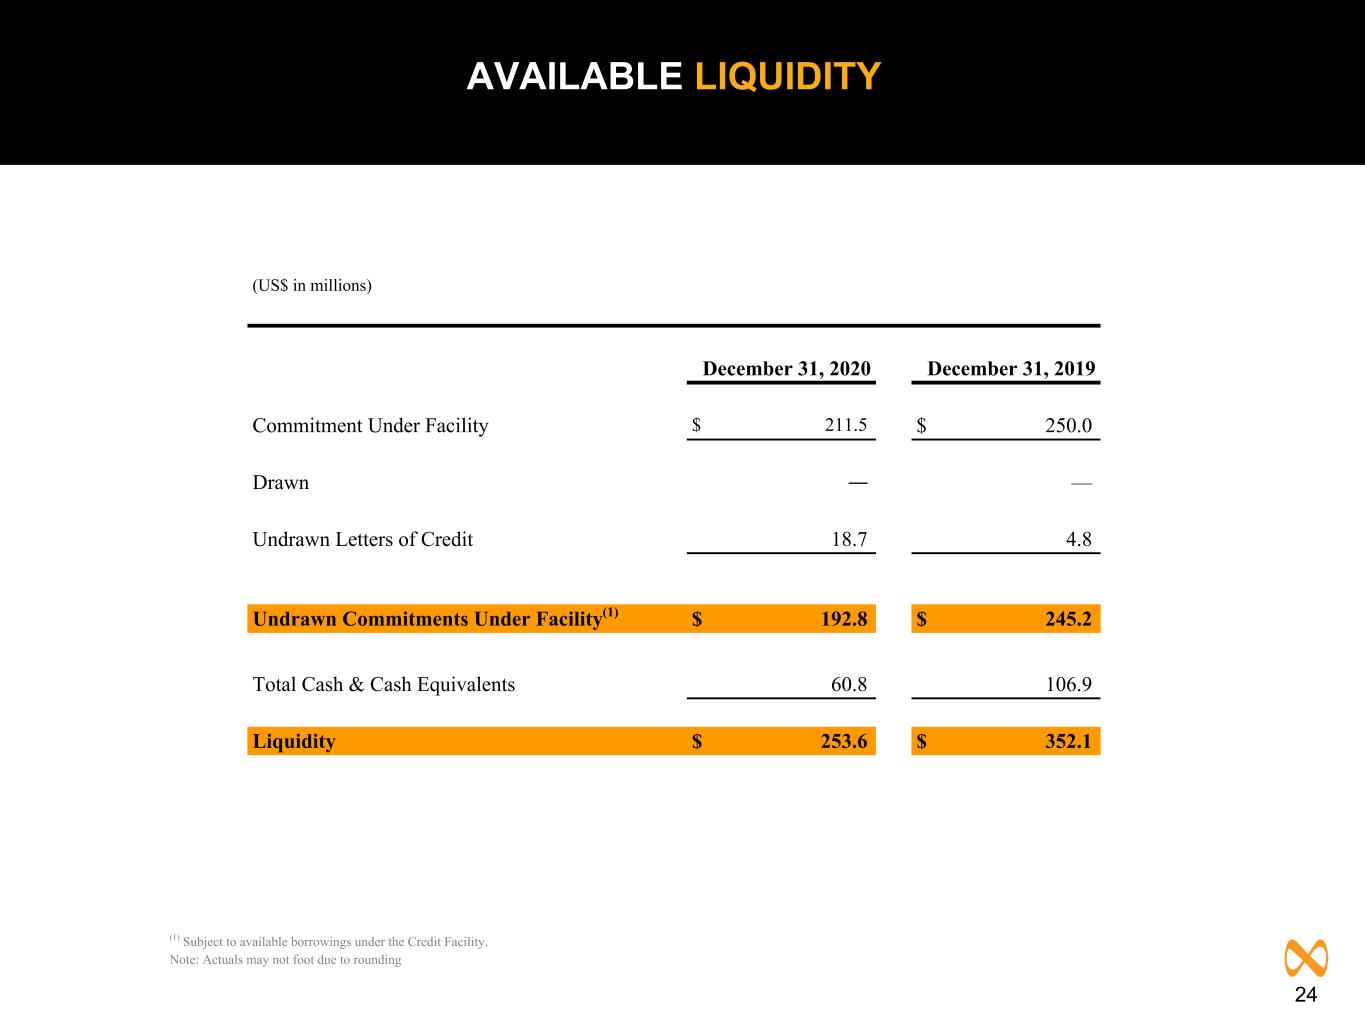
24 AVAILABLE LIQUIDITY (US$ in millions) December 31, 2020 December 31, 2019 Commitment Under Facility $ 211.5 $ 250.0 Drawn — — Undrawn Letters of Credit 18.7 4.8 Undrawn Commitments Under Facility(1) $ 192.8 $ 245.2 Total Cash & Cash Equivalents 60.8 106.9 Liquidity $ 253.6 $ 352.1 (1) Subject to available borrowings under the Credit Facility. Note: Actuals may not foot due to rounding
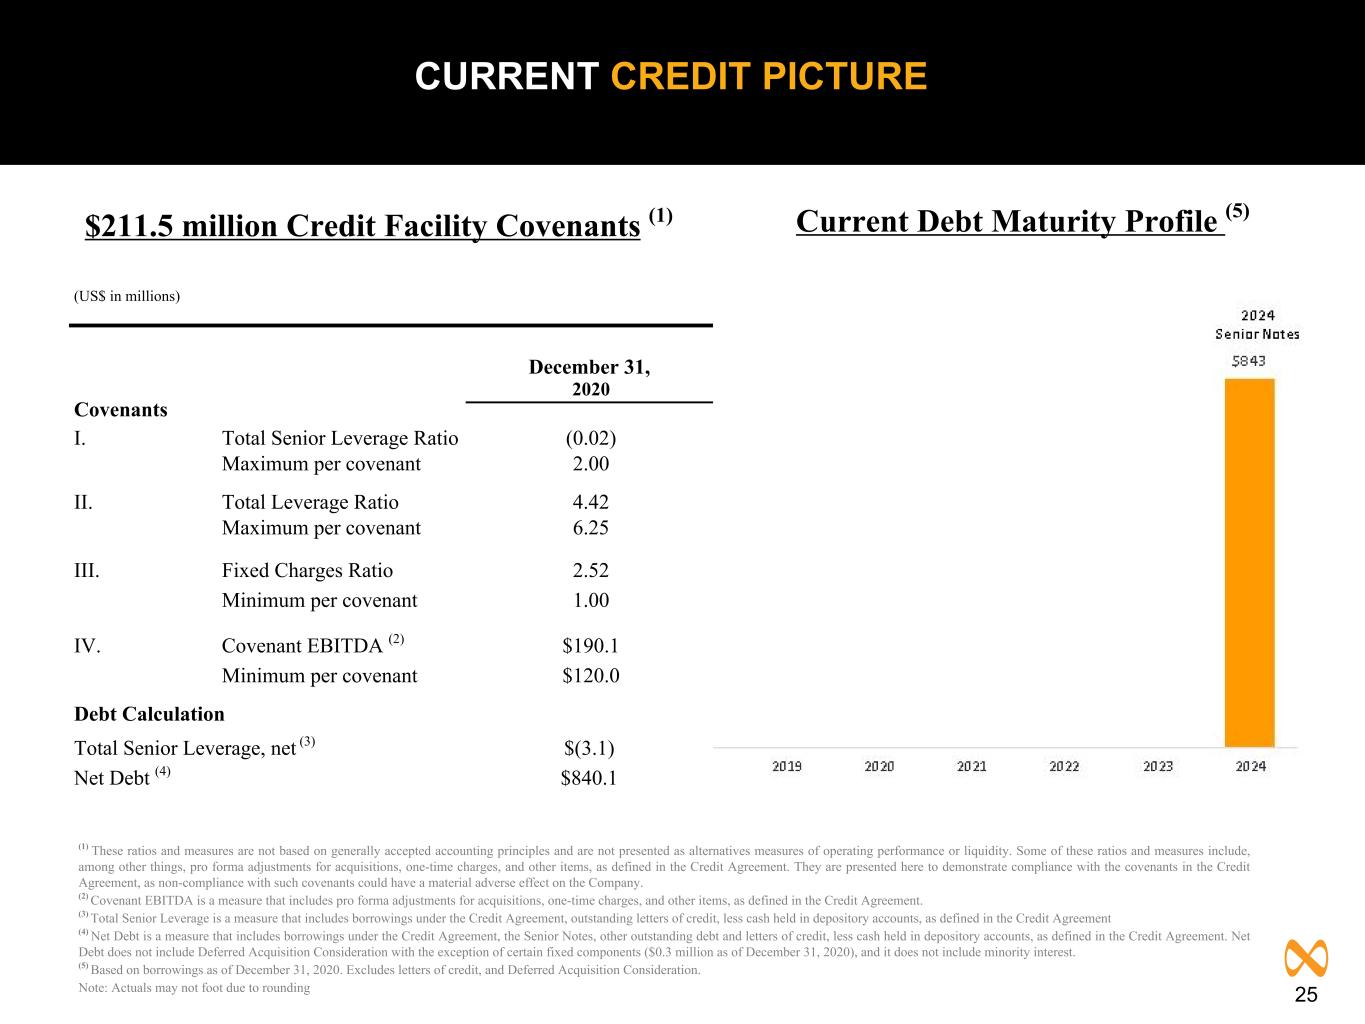
25 CURRENT CREDIT PICTURE Current Debt Maturity Profile (5)$211.5 million Credit Facility Covenants (1) (US$ in millions) December 31, 2020 Covenants I. Total Senior Leverage Ratio (0.02) Maximum per covenant 2.00 II. Total Leverage Ratio 4.42 Maximum per covenant 6.25 III. Fixed Charges Ratio 2.52 Minimum per covenant 1.00 IV. Covenant EBITDA (2) $190.1 Minimum per covenant $120.0 Debt Calculation Total Senior Leverage, net (3) $(3.1) Net Debt (4) $840.1 (1) These ratios and measures are not based on generally accepted accounting principles and are not presented as alternatives measures of operating performance or liquidity. Some of these ratios and measures include, among other things, pro forma adjustments for acquisitions, one-time charges, and other items, as defined in the Credit Agreement. They are presented here to demonstrate compliance with the covenants in the Credit Agreement, as non-compliance with such covenants could have a material adverse effect on the Company. (2) Covenant EBITDA is a measure that includes pro forma adjustments for acquisitions, one-time charges, and other items, as defined in the Credit Agreement. (3) Total Senior Leverage is a measure that includes borrowings under the Credit Agreement, outstanding letters of credit, less cash held in depository accounts, as defined in the Credit Agreement (4) Net Debt is a measure that includes borrowings under the Credit Agreement, the Senior Notes, other outstanding debt and letters of credit, less cash held in depository accounts, as defined in the Credit Agreement. Net Debt does not include Deferred Acquisition Consideration with the exception of certain fixed components ($0.3 million as of December 31, 2020), and it does not include minority interest. (5) Based on borrowings as of December 31, 2020. Excludes letters of credit, and Deferred Acquisition Consideration. Note: Actuals may not foot due to rounding
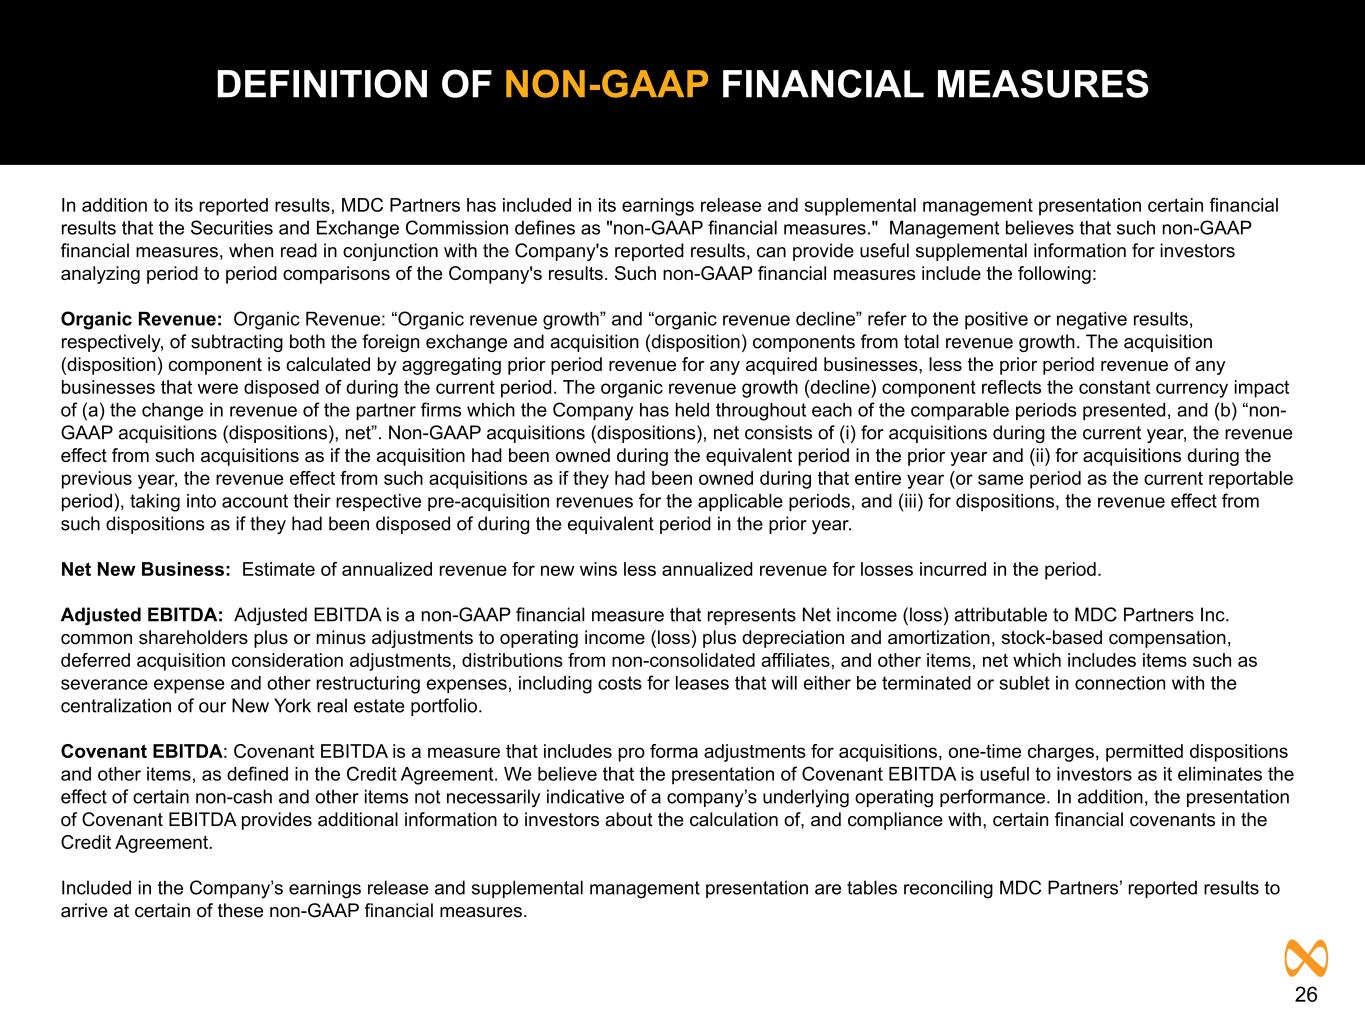
26 DEFINITION OF NON-GAAP FINANCIAL MEASURES In addition to its reported results, MDC Partners has included in its earnings release and supplemental management presentation certain financial results that the Securities and Exchange Commission defines as "non-GAAP financial measures." Management believes that such non-GAAP financial measures, when read in conjunction with the Company's reported results, can provide useful supplemental information for investors analyzing period to period comparisons of the Company's results. Such non-GAAP financial measures include the following: Organic Revenue: Organic Revenue: “Organic revenue growth” and “organic revenue decline” refer to the positive or negative results, respectively, of subtracting both the foreign exchange and acquisition (disposition) components from total revenue growth. The acquisition (disposition) component is calculated by aggregating prior period revenue for any acquired businesses, less the prior period revenue of any businesses that were disposed of during the current period. The organic revenue growth (decline) component reflects the constant currency impact of (a) the change in revenue of the partner firms which the Company has held throughout each of the comparable periods presented, and (b) “non- GAAP acquisitions (dispositions), net”. Non-GAAP acquisitions (dispositions), net consists of (i) for acquisitions during the current year, the revenue effect from such acquisitions as if the acquisition had been owned during the equivalent period in the prior year and (ii) for acquisitions during the previous year, the revenue effect from such acquisitions as if they had been owned during that entire year (or same period as the current reportable period), taking into account their respective pre-acquisition revenues for the applicable periods, and (iii) for dispositions, the revenue effect from such dispositions as if they had been disposed of during the equivalent period in the prior year. Net New Business: Estimate of annualized revenue for new wins less annualized revenue for losses incurred in the period. Adjusted EBITDA: Adjusted EBITDA is a non-GAAP financial measure that represents Net income (loss) attributable to MDC Partners Inc. common shareholders plus or minus adjustments to operating income (loss) plus depreciation and amortization, stock-based compensation, deferred acquisition consideration adjustments, distributions from non-consolidated affiliates, and other items, net which includes items such as severance expense and other restructuring expenses, including costs for leases that will either be terminated or sublet in connection with the centralization of our New York real estate portfolio. Covenant EBITDA: Covenant EBITDA is a measure that includes pro forma adjustments for acquisitions, one-time charges, permitted dispositions and other items, as defined in the Credit Agreement. We believe that the presentation of Covenant EBITDA is useful to investors as it eliminates the effect of certain non-cash and other items not necessarily indicative of a company’s underlying operating performance. In addition, the presentation of Covenant EBITDA provides additional information to investors about the calculation of, and compliance with, certain financial covenants in the Credit Agreement. Included in the Company’s earnings release and supplemental management presentation are tables reconciling MDC Partners’ reported results to arrive at certain of these non-GAAP financial measures.

MDC Partners One World Trade Center, Floor 65 New York, NY 10007 646-429-1800 www.mdc-partners.com