STGW 8-K
Stagwell Inc (STGW)
8-K
2026-07-30
For: 2026-07-30
View Original
Added on
July 30, 2026
UNITED STATES
SECURITIES AND EXCHANGE COMMISSION
WASHINGTON, D.C. 20549
FORM 8-K
Current Report
Pursuant to Section 13 or 15(d) of the Securities Exchange Act of 1934
Date of Report (Date of Earliest Event Reported) — July 30, 2026
(Exact Name of Registrant as Specified in its Charter)
| (Jurisdiction of Incorporation) | (Commission File Number) | (IRS Employer Identification No.) | ||||||
(Address of principal executive offices and zip code)
(646 ) 429-1800
(Registrant’s Telephone Number)
Check the appropriate box below if the Form 8-K filing is intended to simultaneously satisfy the filing obligation of the registrant under any of the following provisions:
| Written communications pursuant to Rule 425 under the Securities Act (17 CFR 230.425) | ||||||||
| Soliciting material pursuant to Rule 14a-12 under the Exchange Act (17 CFR 240.14a-12) | ||||||||
| Pre-commencement communications pursuant to Rule 14d-2(b) under the Exchange Act (17 CFR 240.14d-2(b)) | ||||||||
| Pre-commencement communications pursuant to Rule 13e-4(c) under the Exchange Act (17 CFR 240.13e-4(c)) | ||||||||
Securities registered pursuant to Section 12(b) of the Act:
| Title of each class | Trading symbol(s) | Name of each exchange on which registered | ||||||
Indicate by check mark whether the registrant is an emerging growth company as defined in Rule 405 of the Securities Act of 1933 (§230.405 of this chapter) or Rule 12b-2 of the Securities Exchange Act of 1934 (§240.12b-2 of this chapter).
Emerging growth company ☐
If an emerging growth company, indicate by check mark if the registrant has elected not to use the extended transition period for complying with any new or revised financial accounting standards provided pursuant to Section 13(a) of the Exchange Act. ☐
Item 2.02 Results of Operations and Financial Condition.
On July 30, 2026, Stagwell Inc. (the “Company”) issued a press release announcing its financial results for the three and six months ended June 30, 2026. A copy of this earnings release is attached as Exhibit 99.1 hereto.
The foregoing information (including Exhibit 99.1) is being furnished under “Item 2.02 – Results of Operations and Financial Condition.” Such information (including Exhibit 99.1) shall not be deemed “filed” for purposes of Section 18 of the Securities Exchange Act of 1934, as amended (the “Exchange Act”), nor shall it be deemed incorporated by reference in any filing under the Securities Act of 1933, as amended (the “Securities Act”), or the Exchange Act, except as shall be expressly set forth by specific reference in such filing.
Item 7.01 Regulation FD Disclosure.
On July 30, 2026, the Company will host a conference call in which its financial results for the three and six months ended June 30, 2026 will be discussed. The presentation to be used in connection with the call is attached as Exhibit 99.2 hereto.
The foregoing information (including Exhibit 99.2) is being furnished under “Item 7.01 – Regulation FD Disclosure.” Such information (including Exhibit 99.2) shall not be deemed “filed” for purposes of Section 18 of the Exchange Act, nor shall it be deemed incorporated by reference in any filing under the Securities Act or the Exchange Act, except as shall be expressly set forth by specific reference in such filing.
Item 9.01 Financial Statements and Exhibits.
(d) Exhibits.
104 Cover Page Interactive Data File (embedded within the Inline XBRL document)
Signatures
Pursuant to the requirements of the Securities Exchange Act of 1934, the Company has duly caused this report to be signed by the undersigned hereunto duly authorized.
| Date: July 30, 2026 | Stagwell Inc. | |||||||
| By: | /s/ Ryan J. Greene | |||||||
| Ryan J. Greene | ||||||||
| Chief Financial Officer | ||||||||

FOR IMMEDIATE ISSUE
STAGWELL INC. (NASDAQ: STGW) REPORTS RESULTS FOR THE THREE AND SIX MONTHS ENDED JUNE 30, 2026
Q2 YoY Revenue Growth of 11% to $786 million; Q2 YoY Net Revenue Growth of 6% to $632 million
Q2 YoY Digital Transformation Organic Net Revenue Growth of 18%; Two-Year Digital Transformation Organic Net Revenue Growth Stack of 29%
Q2 EPS of $(0.03); Q2 Adjusted EPS Growth YoY of 39% to $0.25
Q2 Net Loss Attributable to Stagwell Inc. Common Shareholders of $8 million; Q2 Adjusted EBITDA Growth YoY of 15% to $109 million
Record Net New Business of $171 million in Q2; LTM Net New Business of $540 million
Raise Full-Year 2026 Adjusted EPS Guidance to $1.03 to $1.17
New York, NY, July 30, 2026 (NASDAQ: STGW) – Stagwell Inc. (“Stagwell”) today announced financial results for the three and six months ended June 30, 2026.
SECOND QUARTER RESULTS:
•Q2 Revenue of $786 million, an increase of 11% versus the prior year period; YTD Revenue of $1,490 million, an increase of 10%;
•Q2 Revenue increased 10% organically versus the prior year period; YTD Revenue increased 8% organically;
•Q2 Net Revenue of $632 million, an increase of 6% versus the prior year period; YTD Net Revenue of $1,216 million, an increase of 5%;
•Q2 Net Revenue increased 5% organically versus the prior year period; YTD Net Revenue increased 3% organically;
•Q2 Digital Transformation Net Revenue of $107 million, an organic increase of 18% versus the prior year period;
•Two-Year Net Revenue Growth Stack for Digital Transformation of 34%, Two-Year Organic Net Revenue Growth Stack for Digital Transformation of 29%;
•Q2 Net Loss attributable to Stagwell Inc. Common Shareholders of $8 million versus $5 million in the prior year period; YTD Net Loss attributable to Stagwell Inc. Common Shareholders of $21 million versus $8 million in the prior year period;
Page 1
•Q2 Adjusted EBITDA of $109 million, an increase of 15% versus the prior year period; YTD Adjusted EBITDA of $198 million an increase of 12%;
•Q2 Adjusted EBITDA Margin of 17% on net revenue; YTD Adjusted EBITDA Margin of 16%;
•Q2 Loss Per Share attributable to Stagwell Inc. Common Shareholders of $(0.03) versus $(0.02); YTD Loss Per Share attributable to Stagwell Inc. Common Shareholders of $(0.08) versus $(0.06) in the prior year period;
•Q2 Adjusted Earnings Per Share attributable to Stagwell Inc. Common Shareholders of $0.25 versus $0.18; YTD Adjusted Earnings Per Share attributable to Stagwell Inc. Common Shareholders of $0.42 versus $0.30 in the prior year period;
•YTD Net Cash provided by Operating Activities of $64 million versus $55 million in the prior year period;
•Net new business of $171 million in the second quarter, last twelve-month net new business of $540 million
See “Non-GAAP Financial Measures” below for explanations and reconciliations of the Company’s non-GAAP financial measures.
“Our second quarter results demonstrate Stagwell is thriving in today’s AI era. Stagwell's unique combination of software, services and engineers is being embraced by the industry leading to another record-breaking Net New Business quarter of $171 million, highlighted by recent wins with IBM, Adobe, Mondelez and Heineken,” said Mark Penn, Chairman and CEO of Stagwell. “Our organic net revenue growth continues to accelerate, led by 18% growth in our Digital Transformation segment, and 12% growth in Communications as the political cycle starts to ramp up. Strong growth, combined with proactive cost management and share repurchases, means we are raising our adjusted EPS outlook for the year today, and we expect to deliver double-digit growth in the second half, the lions' share of which will be organic."
Ryan Greene, Chief Financial Officer, added: “This was Stagwell's biggest ever second quarter. As we grew our top-line, we controlled costs to expand adjusted EBITDA 15% year-over-year to $109 million. These strong results, combined with continued share repurchases, resulted in 39% growth in adjusted EPS to $0.25. We are firmly on course to deliver on our full-year outlook, including our raised adjusted EPS guidance.”
Financial Outlook
2026 financial guidance is updated as follows:
•Adjusted EPS guidance is raised to $1.03 - $1.17 (from $0.98 - $1.12)
•Total Net Revenue growth of 8% to 12% is reiterated
•Adjusted EBITDA of $475 million to $525 million is reiterated
•Free Cash Flow Conversion of 50% to 60% is reiterated
•Guidance includes anticipated impact from acquisitions or dispositions.
| * The Company has excluded a quantitative reconciliation with respect to the Company’s 2026 guidance under the “unreasonable efforts” exception in Item 10(e)(1)(i)(B) of Regulation S-K. See "Non-GAAP Financial Measures" below for additional information. | |||||
Page 2
Video Webcast
Management will host a video webcast on Thursday, July 30, 2026, at 8:30 a.m. (ET) to discuss results for Stagwell Inc. for the three and six months ended June 30, 2026. The video webcast will be accessible at https://edge.media-server.com/mmc/p/zd4zz6jw/. An investor presentation has been posted on our website at www.stagwellglobal.com and may be referred to during the webcast.
A recording of the webcast will be accessible one hour after the webcast and available for ninety days at www.stagwellglobal.com.
Stagwell Inc.
Stagwell is the global challenger network transforming marketing through AI. We deliver scaled creative performance for the world's most ambitious brands, connecting culture-moving creativity with leading-edge technology to harmonize the art and science of marketing. Led by entrepreneurs, our specialists in 45+ countries are unified under a single purpose: to drive effectiveness and improve business results for our clients. Join us at www.stagwellglobal.com.
Contacts
For Investors:
Ben Allanson
For Press:
Lena Petersen
Non-GAAP Financial Measures
In addition to its reported results, Stagwell Inc. has included in this earnings release certain financial results that the Securities and Exchange Commission (“SEC”) defines as “non-GAAP Financial Measures.” Management believes that such non-GAAP financial measures, when read in conjunction with the Company's reported results, can provide useful supplemental information for investors analyzing period to period comparisons of the Company's results. Such non-GAAP financial measures include the following:
(1) Organic Net Revenue: “Organic net revenue growth” and “Organic net revenue decline” reflects the year-over-year change in the Company's reported net revenue attributable to the Company's management of the entities it owns. We calculate organic net revenue growth (decline) by subtracting the net impact of acquisitions (divestitures) and the impact of foreign currency exchange fluctuations from the aggregate year-over-year increase or decrease in the Company's reported net revenue. The net impact of acquisitions (divestitures) reflects the year-over-year change in the Company’s reported net revenue attributable to the impact of all individual entities that were acquired or divested in the current and prior year. We calculate impact of an acquisition as follows: (a) for an entity acquired during the current year, we present the entity’s current period reported revenue as the impact of the acquisition in the current year; and (b) for an entity acquired in the prior year, we present an amount equal to the entity’s current year net revenue for the same period during which we didn’t own the entity in the prior year as the impact of the acquisition in the current year. We calculate impact of a divestiture as follows: (a) for a divestiture in the current year, we present the entity’s prior year net revenue for the same period during which we no longer owned it in the current year as impact of the divestiture in the current year; and (b) for a divestiture in the prior year, we present the entity’s prior year net revenue for the period during which we owned it in the prior year as impact of the divestiture in the current year. We calculate the impact of any acquisition or divestiture
Page 3
without adjusting for foreign currency exchange fluctuations. The impact of foreign currency exchange fluctuations reflects the year-over-year change in the Company’s reported net revenue attributable to changes in foreign currency exchange rates. We calculate the impact of foreign currency exchange fluctuations for the portion of the reporting period in which we recognized revenue from a foreign entity in both the current year and the prior year. The impact is calculated as the difference between (1) reported prior period net revenue (converted to U.S. dollars at historical foreign currency exchange rates) and (2) prior period net revenue converted to U.S. dollars at current period foreign exchange rates.
(2) Net New Business: Estimate of annualized revenue for new wins less annualized revenue for losses incurred in the period.
(3) Adjusted EBITDA: is defined as Net income (loss) attributable to Stagwell Inc. common shareholders excluding non-operating income or expense, income tax expense or benefit, equity in income or loss of non-consolidated entities and net income or loss attributable to noncontrolling and redeemable noncontrolling interest holders to achieve Operating income (loss), plus depreciation and amortization, stock-based compensation, deferred acquisition consideration adjustments, impairment and other losses, and other items. Other items primarily includes restructuring, certain system implementation costs, working capital administrative fees and acquisition-related expenses. Adjusted EBITDA for our reportable segments is reconciled to Operating income (loss), as Net income (loss) is not relevant for reportable segment financial metric.
(4) Adjusted Diluted EPS: is defined as Adjusted Net Income (loss) attributable to Stagwell Inc. common and Class C shareholders, divided by the diluted weighted average shares outstanding. Adjusted Net Income represents net income (loss) attributable to Stagwell Inc. common and Class C shareholders, excluding amortization, impairment and other losses, stock-based compensation, deferred acquisition consideration adjustments, discrete tax items, and other items (as defined above), allocated between the two share classes based on their respective income allocation percentages using a normalized effective tax rate. The diluted weighted average shares outstanding includes the diluted weighted average common shares outstanding plus Class C common stock, par value $0.00001 per share (the “Class C Common Stock”) as if converted to shares of Class A Common Stock if not included because they were anti-dilutive.
(5) Free Cash Flow: defined as consolidated net cash flow from operations less cash outflow from capital expenditures and capitalized software, excluding material nonrecurring capital purchases. Free Cash Flow Conversion is the percentage of adjusted EBITDA.
Included in this earnings release are tables reconciling reported Stagwell Inc. results to arrive at certain of these non-GAAP financial measures.
Page 4
This document contains forward-looking statements within the meaning of Section 27A of the Securities Act of 1933, as amended (the “Securities Act”), and Section 21E of the Securities Exchange Act of 1934, as amended (the “Exchange Act”). The Company’s representatives may also make forward-looking statements orally or in writing from time to time. Statements in this document that are not historical facts, including, statements about the Company’s beliefs and expectations, future financial performance, growth, and future prospects, the Company’s strategy, business and economic trends and growth, technological leadership and differentiation, potential and completed acquisitions, anticipated and actual operating efficiencies and synergies and estimates of amounts for redeemable noncontrolling interests and deferred acquisition consideration, constitute forward-looking statements. Forward-looking statements, which are generally denoted by words such as “ability,” “aim,” “anticipate,” “assume,” “believe,” “better,” “build,” “consider,” “continue,” “could,” “develop,” “depend,” “drive,” “enhance,” “estimate,” “expect,” “focus,” “forecast,” “future,” “grow,” “guidance,” “improve,” “intend,” “likely,” “maintain,” “may,” “ongoing,” “outlook,” “plan,” “position,” “possible,” “potential,” “probable,” “project,” “seek,” “should,” “target,” “will,” “would” or the negative of such terms or other variations thereof and terms of similar substance used in connection with any discussion of current plans, estimates and projections are subject to change based on a number of factors, including those outlined in this section.
Forward-looking statements in this document are based on certain key expectations and assumptions made by the Company. Although the management of the Company believes that the expectations and assumptions on which such forward-looking statements are based are reasonable, undue reliance should not be placed on the forward-looking statements because the Company can give no assurance that they will prove to be correct. The material assumptions upon which such forward-looking statements are based include, among others, assumptions with respect to general business, economic and market conditions, the competitive environment, anticipated and unanticipated tax consequences and anticipated and unanticipated costs. These forward-looking statements are based on current plans, estimates and projections, and are subject to change based on a number of factors, including those outlined in this section. These forward-looking statements are subject to various risks and uncertainties, many of which are outside the Company’s control. Therefore, you should not place undue reliance on such statements. Forward-looking statements speak only as of the date they are made, and the Company undertakes no obligation to update publicly any of them in light of new information or future events, if any.
Forward-looking statements involve inherent risks and uncertainties. A number of important factors could cause actual results to differ materially from those contained in any forward-looking statements. Such risk factors include, but are not limited to, the following:
•risks associated with international, national and regional unfavorable economic conditions, including the effect of changing tariffs and other trade policies, inflation and other macroeconomic factors that could affect the Company or its clients;
•demand for the Company’s services, which may precipitate or exacerbate other risks and uncertainties;
•inflation and actions taken by central banks to counter inflation;
•the Company’s ability to attract new clients and retain existing clients;
•the impact of a reduction in client spending and changes in client advertising, marketing and corporate communications requirements;
•financial failure of the Company’s clients;
•the Company’s ability to retain and attract key employees;
•the Company’s ability to compete in the markets in which it operates;
•the Company’s ability to achieve its cost saving initiatives;
•the Company’s implementation of strategic initiatives;
•the Company’s ability to remain in compliance with its debt agreements and the Company’s ability to finance its contingent payment obligations when due and payable, including but not limited to those relating to redeemable noncontrolling interests, deferred acquisition consideration and profit interests;
•the Company’s ability to manage its growth effectively;
•the Company’s ability to identify and complete acquisitions or other strategic transactions that complement and expand the Company’s business capabilities and successfully integrate newly acquired businesses into the Company’s operations, retain key employees, and realize cost savings, synergies and other related anticipated benefits within the expected time period;
•the Company’s ability to identify and complete divestitures and to achieve the anticipated benefits therefrom;
•the Company’s ability to develop products incorporating new technologies, including augmented reality, artificial intelligence, and virtual reality, and realize benefits from such products;
•the Company’s use of artificial intelligence, including generative artificial intelligence;
•adverse tax consequences for the Company, its operations and its stockholders, that may differ from the expectations of the Company, including that recent or future changes in tax laws, potential changes to corporate tax rates in the United States and disagreements with tax authorities on the Company’s determinations that may result in increased tax costs;
Page 5
•adverse tax consequences in connection with the business combination that formed the Company in August 2021, including the incurrence of material Canadian federal income tax (including material “emigration tax”);
•the Company’s ability to maintain an effective system of internal control over financial reporting, including the risk that the Company’s internal controls will fail to detect misstatements in its financial statements;
•the Company’s ability to accurately forecast its future financial performance and provide accurate guidance;
•the Company’s ability to protect client data from security incidents or cyberattacks;
•economic disruptions resulting from war and other economic and geopolitical tensions (such as the ongoing military conflicts in Iran and the Middle East, and between Russia and Ukraine), terrorist activities, natural disasters, public health events, and tariff and trade policies;
•stock price volatility; and
•foreign currency fluctuations.
Investors should carefully consider these risk factors, the additional risk factors outlined under the caption “Risk Factors” in this Form 10-K, and in the Company’s other filings with the Securities and Exchange Commission (the“SEC”) which are accessible on the SEC’s website at www.sec.gov.
Page 6
SCHEDULE 1
STAGWELL INC. AND SUBSIDIARIES
UNAUDITED CONSOLIDATED STATEMENTS OF OPERATIONS
(amounts in thousands, except per share amounts)
| Three Months Ended June 30, | Six Months Ended June 30, | ||||||||||||||||||||||
| 2026 | 2025 | 2026 | 2025 | ||||||||||||||||||||
| Revenue | $ | 786,307 | $ | 706,818 | $ | 1,490,450 | $ | 1,358,558 | |||||||||||||||
| Operating expenses | |||||||||||||||||||||||
| Cost of services | 517,064 | 459,216 | 976,595 | 871,303 | |||||||||||||||||||
| Office and general expenses | 213,742 | 183,061 | 404,381 | 362,423 | |||||||||||||||||||
| Depreciation and amortization | 43,955 | 41,369 | 88,286 | 83,375 | |||||||||||||||||||
| 774,761 | 683,646 | 1,469,262 | 1,317,101 | ||||||||||||||||||||
| Operating Income | 11,546 | 23,172 | 21,188 | 41,457 | |||||||||||||||||||
| Other income (expenses): | |||||||||||||||||||||||
| Interest expense, net | (22,328) | (23,455) | (45,594) | (46,811) | |||||||||||||||||||
| Foreign exchange, net | 605 | (1,338) | (2,416) | (118) | |||||||||||||||||||
Other, net | 937 | (360) | 868 | (111) | |||||||||||||||||||
| (20,786) | (25,153) | (47,142) | (47,040) | ||||||||||||||||||||
Loss before income taxes and equity in earnings of non-consolidated affiliates | (9,240) | (1,981) | (25,954) | (5,583) | |||||||||||||||||||
Income tax (benefit) expense | (348) | 2,673 | (3,236) | 4,395 | |||||||||||||||||||
| Loss before equity in earnings of non-consolidated affiliates | (8,892) | (4,654) | (22,718) | (9,978) | |||||||||||||||||||
| Equity in income of non-consolidated affiliates | 191 | 20 | 70 | 19 | |||||||||||||||||||
| Net loss | (8,701) | (4,634) | (22,648) | (9,959) | |||||||||||||||||||
| Net (income) loss attributable to noncontrolling and redeemable noncontrolling interests | 585 | (627) | 1,559 | 1,781 | |||||||||||||||||||
| Net loss attributable to Stagwell Inc. common shareholders | $ | (8,116) | $ | (5,261) | $ | (21,089) | $ | (8,178) | |||||||||||||||
| Loss per common share: | |||||||||||||||||||||||
| Basic | $ | (0.03) | $ | (0.02) | $ | (0.08) | $ | (0.04) | |||||||||||||||
| Diluted | $ | (0.03) | $ | (0.02) | $ | (0.08) | $ | (0.06) | |||||||||||||||
| Weighted average number of common shares outstanding: | |||||||||||||||||||||||
| Basic | 245,908 | 260,774 | 248,328 | 186,843 | |||||||||||||||||||
| Diluted | 245,908 | 260,774 | 248,328 | 265,600 | |||||||||||||||||||
Page 7
SCHEDULE 2
STAGWELL INC.
UNAUDITED COMPONENTS OF NET REVENUE CHANGE
(amounts in thousands)
| Net Revenue - Components of Change | Change | ||||||||||||||||||||||||||||||||||||||||||||||
| Three Months Ended June 30, 2025 | Foreign Currency | Net Acquisitions (Divestitures) | Organic (1) | Total Change | Three Months Ended June 30, 2026 | Organic | Total | ||||||||||||||||||||||||||||||||||||||||
| Marketing Services | $ | 235,304 | $ | 624 | $ | (2,868) | $ | 1,182 | $ | (1,062) | $ | 234,242 | 0.5 | % | (0.5) | % | |||||||||||||||||||||||||||||||
| Digital Transformation | 91,100 | (251) | — | 16,575 | 16,324 | 107,424 | 18.2 | % | 17.9 | % | |||||||||||||||||||||||||||||||||||||
| Media & Commerce | 150,964 | (73) | 2,221 | 1,558 | 3,706 | 154,670 | 1.0 | % | 2.5 | % | |||||||||||||||||||||||||||||||||||||
| Communications | 97,632 | 229 | 2,373 | 11,855 | 14,457 | 112,089 | 12.1 | % | 14.8 | % | |||||||||||||||||||||||||||||||||||||
| The Marketing Cloud | 25,272 | 1,072 | — | 1,034 | 2,106 | 27,378 | 4.1 | % | 8.3 | % | |||||||||||||||||||||||||||||||||||||
| Corporate, eliminations and other | (2,143) | 3 | — | (2,080) | (2,077) | (4,220) | 97.1 | % | 96.9 | % | |||||||||||||||||||||||||||||||||||||
| $ | 598,129 | $ | 1,604 | $ | 1,726 | $ | 30,124 | $ | 33,454 | $ | 631,583 | 5.0 | % | 5.6 | % | ||||||||||||||||||||||||||||||||
(1) See Non-GAAP Financial Measures section above for the definition of Organic Net Revenue.
Page 8
SCHEDULE 3
STAGWELL INC. AND SUBSIDIARIES
UNAUDITED COMPONENTS OF NET REVENUE CHANGE
(amounts in thousands)
| Net Revenue - Components of Change | Change | ||||||||||||||||||||||||||||||||||||||||||||||
| Six Months Ended June 30, 2025 | Foreign Currency | Net Acquisitions (Divestitures) | Organic (1) | Total Change | Six Months Ended June 30, 2026 | Organic | Total | ||||||||||||||||||||||||||||||||||||||||
| Marketing Services | $ | 451,534 | $ | 3,263 | $ | (3,744) | $ | 765 | $ | 284 | $ | 451,818 | 0.2 | % | 0.1 | % | |||||||||||||||||||||||||||||||
| Digital Transformation | 179,604 | (385) | 3,227 | 21,487 | 24,329 | 203,933 | 12.0 | % | 13.5 | % | |||||||||||||||||||||||||||||||||||||
| Media & Commerce | 297,152 | 2,286 | 4,185 | 542 | 7,013 | 304,165 | 0.2 | % | 2.4 | % | |||||||||||||||||||||||||||||||||||||
| Communications | 188,613 | 969 | 2,613 | 16,668 | 20,250 | 208,863 | 8.8 | % | 10.7 | % | |||||||||||||||||||||||||||||||||||||
| The Marketing Cloud | 49,371 | 2,540 | — | 1,966 | 4,506 | 53,877 | 4.0 | % | 9.1 | % | |||||||||||||||||||||||||||||||||||||
| Corporate, eliminations and other | (3,958) | 1 | — | (2,492) | (2,491) | (6,449) | 63.0 | % | 62.9 | % | |||||||||||||||||||||||||||||||||||||
| $ | 1,162,316 | $ | 8,674 | $ | 6,281 | $ | 38,936 | $ | 53,891 | $ | 1,216,207 | 3.3 | % | 4.6 | % | ||||||||||||||||||||||||||||||||
(1) See Non-GAAP Financial Measures section above for the definition of Organic Net Revenue.
Page 9
SCHEDULE 4
STAGWELL INC.
UNAUDITED SEGMENT OPERATING RESULTS
(amounts in thousands)
For the Three Months Ended June 30, 2026
| Marketing Services | Digital Transformation | Media & Commerce | Communications | The Marketing Cloud | Corporate, Elimination and Other | Total | |||||||||||||||||||||||||||||||||||
| Revenue | $ | 277,256 | $ | 117,672 | $ | 179,943 | $ | 188,426 | $ | 27,380 | $ | (4,370) | $ | 786,307 | |||||||||||||||||||||||||||
| Billable costs | 43,014 | 10,248 | 25,273 | 76,337 | 2 | (150) | 154,724 | ||||||||||||||||||||||||||||||||||
Net revenue | 234,242 | 107,424 | 154,670 | 112,089 | 27,378 | (4,220) | 631,583 | ||||||||||||||||||||||||||||||||||
| Staff costs | 131,354 | 67,316 | 98,710 | 61,197 | 18,085 | 7,720 | 384,382 | ||||||||||||||||||||||||||||||||||
| Administrative costs | 25,999 | 7,720 | 24,738 | 14,179 | 7,201 | 2,516 | 82,353 | ||||||||||||||||||||||||||||||||||
| Unbillable and other costs, net | 31,673 | 169 | 15,130 | 1,819 | 7,370 | — | 56,161 | ||||||||||||||||||||||||||||||||||
Adjusted EBITDA (1) | 45,216 | 32,219 | 16,092 | 34,894 | (5,278) | (14,456) | 108,687 | ||||||||||||||||||||||||||||||||||
| Stock-based compensation | 7,929 | 3,656 | 497 | 2,513 | 391 | 3,581 | 18,567 | ||||||||||||||||||||||||||||||||||
| Depreciation and amortization | 12,426 | 5,907 | 7,994 | 6,189 | 6,222 | 5,217 | 43,955 | ||||||||||||||||||||||||||||||||||
| Deferred acquisition consideration | (1,969) | 6,949 | 1,537 | 1,760 | 560 | — | 8,837 | ||||||||||||||||||||||||||||||||||
Other items, net (1) | 3,101 | 277 | 4,821 | 2,091 | 44 | 15,448 | 25,782 | ||||||||||||||||||||||||||||||||||
| Operating income (loss) | $ | 23,729 | $ | 15,430 | $ | 1,243 | $ | 22,341 | $ | (12,495) | $ | (38,702) | $ | 11,546 | |||||||||||||||||||||||||||
(1) See Non-GAAP Financial Measures section above for the definition of Adjusted EBITDA and Other items, net.
Page 10
SCHEDULE 5
STAGWELL INC. AND SUBSIDIARIES
UNAUDITED SEGMENT OPERATING RESULTS
(amounts in thousands)
For the Six Months Ended June 30, 2026
| Marketing Services | Digital Transformation | Media & Commerce | Communications | The Marketing Cloud | Corporate, eliminations and other | Total | |||||||||||||||||||||||||||||||||||
| Revenue | $ | 528,034 | $ | 219,138 | $ | 354,454 | $ | 341,528 | $ | 53,895 | $ | (6,599) | $ | 1,490,450 | |||||||||||||||||||||||||||
| Billable costs | 76,216 | 15,205 | 50,289 | 132,665 | 18 | (150) | 274,243 | ||||||||||||||||||||||||||||||||||
Net revenue | 451,818 | 203,933 | 304,165 | 208,863 | 53,877 | (6,449) | 1,216,207 | ||||||||||||||||||||||||||||||||||
| Staff costs | 263,543 | 131,883 | 195,935 | 118,147 | 34,888 | 20,172 | 764,568 | ||||||||||||||||||||||||||||||||||
| Administrative costs | 48,731 | 14,108 | 47,911 | 26,926 | 12,391 | 6,648 | 156,715 | ||||||||||||||||||||||||||||||||||
| Unbillable and other costs, net | 49,353 | 292 | 28,812 | 3,843 | 14,252 | — | 96,552 | ||||||||||||||||||||||||||||||||||
Adjusted EBITDA (1) | 90,191 | 57,650 | 31,507 | 59,947 | (7,654) | (33,269) | 198,372 | ||||||||||||||||||||||||||||||||||
| Stock-based compensation | 12,932 | 4,693 | 1,641 | 4,910 | 506 | 8,133 | 32,815 | ||||||||||||||||||||||||||||||||||
| Depreciation and amortization | 24,908 | 11,755 | 15,909 | 13,047 | 12,950 | 9,717 | 88,286 | ||||||||||||||||||||||||||||||||||
| Deferred acquisition consideration | (1,969) | 10,102 | 8,638 | 1,760 | 560 | — | 19,091 | ||||||||||||||||||||||||||||||||||
Other items, net (1) | 5,924 | 1,620 | 7,980 | 3,504 | 700 | 17,264 | 36,992 | ||||||||||||||||||||||||||||||||||
| Operating income (loss) | $ | 48,396 | $ | 29,480 | $ | (2,661) | $ | 36,726 | $ | (22,370) | $ | (68,383) | $ | 21,188 | |||||||||||||||||||||||||||
(1) See Non-GAAP Financial Measures section above for the definition of Adjusted EBITDA and Other items, net.
Page 11
SCHEDULE 6
STAGWELL INC. AND SUBSIDIARIES
UNAUDITED SEGMENT OPERATING RESULTS
(amounts in thousands)
For the Three Months Ended June 30, 2025
| Marketing Services | Digital Transformation | Media & Commerce | Communications | The Marketing Cloud | Corporate, eliminations and other | Total | |||||||||||||||||||||||||||||||||||
| Revenue | $ | 275,888 | $ | 97,592 | $ | 164,025 | $ | 146,180 | $ | 25,276 | $ | (2,143) | $ | 706,818 | |||||||||||||||||||||||||||
| Billable costs | 40,584 | 6,492 | 13,061 | 48,548 | 4 | — | 108,689 | ||||||||||||||||||||||||||||||||||
Net revenue | 235,304 | 91,100 | 150,964 | 97,632 | 25,272 | (2,143) | 598,129 | ||||||||||||||||||||||||||||||||||
| Staff costs | 134,397 | 63,537 | 98,038 | 57,311 | 17,136 | 10,851 | 381,270 | ||||||||||||||||||||||||||||||||||
| Administrative costs | 29,393 | 7,176 | 24,325 | 11,530 | 3,313 | (1,299) | 74,438 | ||||||||||||||||||||||||||||||||||
| Unbillable and other costs, net | 26,745 | 3 | 13,395 | 2,584 | 5,403 | — | 48,130 | ||||||||||||||||||||||||||||||||||
Adjusted EBITDA (1) | 44,769 | 20,384 | 15,206 | 26,207 | (580) | (11,695) | 94,291 | ||||||||||||||||||||||||||||||||||
| Stock-based compensation | 8,111 | 759 | 868 | 4,133 | 132 | 5,951 | 19,954 | ||||||||||||||||||||||||||||||||||
| Depreciation and amortization | 12,422 | 5,873 | 7,538 | 6,390 | 5,923 | 3,223 | 41,369 | ||||||||||||||||||||||||||||||||||
| Deferred acquisition consideration | (6,867) | 2,575 | 2,812 | (2,376) | 636 | — | (3,220) | ||||||||||||||||||||||||||||||||||
Other items, net (1) | 3,476 | 836 | 3,127 | 1,652 | 1,211 | 2,714 | 13,016 | ||||||||||||||||||||||||||||||||||
| Operating income (loss) | $ | 27,627 | $ | 10,341 | $ | 861 | $ | 16,408 | $ | (8,482) | $ | (23,583) | $ | 23,172 | |||||||||||||||||||||||||||
(1) See Non-GAAP Financial Measures section above for the definition of Adjusted EBITDA and Other items.
Page 12
SCHEDULE 7
STAGWELL INC.
UNAUDITED SEGMENT OPERATING RESULTS
(amounts in thousands)
For the Six Months Ended June 30, 2025
| Marketing Services | Digital Transformation | Media & Commerce | Communications | The Marketing Cloud | Corporate, Elimination and Other | Total | |||||||||||||||||||||||||||||||||||
| Revenue | $ | 524,940 | $ | 188,479 | $ | 324,447 | $ | 275,268 | $ | 49,382 | $ | (3,958) | $ | 1,358,558 | |||||||||||||||||||||||||||
| Billable costs | 73,406 | 8,875 | 27,295 | 86,655 | 11 | — | 196,242 | ||||||||||||||||||||||||||||||||||
| Net Revenue | 451,534 | 179,604 | 297,152 | 188,613 | 49,371 | (3,958) | 1,162,316 | ||||||||||||||||||||||||||||||||||
| Staff costs | 262,726 | 122,764 | 192,986 | 115,623 | 34,033 | 21,400 | 749,532 | ||||||||||||||||||||||||||||||||||
| Administrative costs | 56,503 | 12,617 | 46,738 | 24,526 | 8,514 | (1,062) | 147,836 | ||||||||||||||||||||||||||||||||||
| Unbillable and other costs, net | 43,571 | 765 | 28,890 | 4,665 | 10,473 | — | 88,364 | ||||||||||||||||||||||||||||||||||
Adjusted EBITDA (1) | 88,734 | 43,458 | 28,538 | 43,799 | (3,649) | (24,296) | 176,584 | ||||||||||||||||||||||||||||||||||
| Stock-based compensation | 10,592 | 2,146 | 2,191 | 5,166 | 343 | 11,059 | 31,497 | ||||||||||||||||||||||||||||||||||
| Depreciation and amortization | 26,736 | 11,318 | 14,686 | 12,986 | 10,981 | 6,668 | 83,375 | ||||||||||||||||||||||||||||||||||
| Deferred acquisition consideration | (4,284) | 5,855 | 1,530 | (1,163) | 1,499 | — | 3,437 | ||||||||||||||||||||||||||||||||||
Other items, net (1) | 933 | 1,062 | 7,058 | 2,061 | 1,325 | 4,379 | 16,818 | ||||||||||||||||||||||||||||||||||
| Operating income (loss) | $ | 54,757 | $ | 23,077 | $ | 3,073 | $ | 24,749 | $ | (17,797) | $ | (46,402) | $ | 41,457 | |||||||||||||||||||||||||||
(1) See Non-GAAP Financial Measures section above for the definition of Adjusted EBITDA and Other items, net.
Page 13
SCHEDULE 8
STAGWELL INC.
UNAUDITED RECONCILIATION OF ADJUSTED DILUTED EARNINGS PER SHARE (NON-GAAP MEASURE)
(amounts in thousands, except per share amounts)
For the Three Months Ended June 30, 2026
| GAAP | Adjustments | Non-GAAP | ||||||||||||||||||
| Net income (loss) attributable to Stagwell Inc. common shareholders and adjusted net income | $ | (8,116) | $ | 69,381 | $ | 61,265 | ||||||||||||||
Diluted - Weighted average number of shares outstanding | 245,908 | — | 245,908 | |||||||||||||||||
Diluted EPS and Adjusted Diluted EPS (1) | $ | (0.03) | $ | 0.25 | ||||||||||||||||
| Adjustments to Net income | ||||||||||||||||||||
| Amortization | $ | 38,352 | ||||||||||||||||||
| Stock-based compensation | 18,567 | |||||||||||||||||||
| Deferred acquisition consideration | 8,837 | |||||||||||||||||||
Other items, net (2) | 25,782 | |||||||||||||||||||
| 91,538 | ||||||||||||||||||||
Adjustment to GAAP income tax expense (3) | (22,157) | |||||||||||||||||||
| $ | 69,381 | |||||||||||||||||||
(1) Adjusted Diluted EPS is defined within the Non-GAAP Financial Measures section of the Executive Summary.
(2) Other items, net, primarily includes restructuring, certain system implementation costs, working capital administrative fees, acquisition-related expense, and other non-recurring expenses.
(3) Represents the difference between the income tax benefit of $0.3 million at an effective tax rate of 3.8% on a GAAP basis and the income tax expense of $21.8 million at an effective tax rate of 26.5% on a non-GAAP basis. The difference reflects the tax impact of non-GAAP adjustments.
Page 14
SCHEDULE 9
STAGWELL INC. AND SUBSIDIARIES
UNAUDITED RECONCILIATION OF ADJUSTED DILUTED EARNINGS PER SHARE (NON-GAAP MEASURE)
(amounts in thousands, except per share amounts)
For the Six Months Ended June 30, 2026
| GAAP | Adjustments | Non-GAAP | ||||||||||||||||||
Net income (loss) attributable to Stagwell Inc. common shareholders | $ | (21,089) | $ | 125,775 | $ | 104,686 | ||||||||||||||
Diluted - Weighted average number of common shares outstanding | 248,328 | — | 248,328 | |||||||||||||||||
Diluted EPS and Adjusted Diluted EPS (1) | $ | (0.08) | $ | 0.42 | ||||||||||||||||
Adjustments to Net income (loss) | ||||||||||||||||||||
| Amortization | $ | 77,270 | ||||||||||||||||||
| Stock-based compensation | 32,815 | |||||||||||||||||||
| Deferred acquisition consideration | 19,091 | |||||||||||||||||||
Other items, net (2) | 36,992 | |||||||||||||||||||
| 166,168 | ||||||||||||||||||||
Adjustment to GAAP income tax expense (3) | (40,393) | |||||||||||||||||||
| $ | 125,775 | |||||||||||||||||||
(1) See Non-GAAP Financial Measures section above for the definition of Adjusted Diluted EPS.
(2) Other items, net, primarily includes restructuring, certain system implementation costs, working capital administrative fees, acquisition-related expense, and other non-recurring expenses.
(3) Represents the difference between the income tax benefit of $3.2 million at an effective tax rate of 12.5% on a GAAP basis and the income tax expense of $37.2 million at an effective tax rate of 26.5% on a non-GAAP basis. The difference reflects the tax impact of non-GAAP adjustments.
Page 15
SCHEDULE 10
STAGWELL INC.
UNAUDITED RECONCILIATION OF ADJUSTED DILUTED EARNINGS PER SHARE (NON-GAAP MEASURE)
(amounts in thousands, except per share amounts)
For the Three Months Ended June 30, 2025
| GAAP | Adjustments | Non-GAAP | ||||||||||||||||||
| Net income (loss) attributable to Stagwell Inc. common shareholders | $ | (5,261) | $ | 51,386 | $ | 46,125 | ||||||||||||||
Diluted - Weighted average number of common shares outstanding | 260,774 | — | 260,774 | |||||||||||||||||
Diluted EPS and Adjusted Diluted EPS (1) | $ | (0.02) | $ | 0.18 | ||||||||||||||||
| Adjustments to Net income | ||||||||||||||||||||
Amortization | $ | 35,593 | ||||||||||||||||||
| Stock-based compensation | 19,954 | |||||||||||||||||||
| Deferred acquisition consideration | (3,220) | |||||||||||||||||||
Other items, net (2) | 13,016 | |||||||||||||||||||
| 65,343 | ||||||||||||||||||||
Adjustment to GAAP income tax expense (3) | (13,957) | |||||||||||||||||||
| 51,386 | ||||||||||||||||||||
(1) Adjusted Diluted EPS is defined within the Non-GAAP Financial Measures section of the Executive Summary.
(2) Other items, net, primarily includes restructuring, certain system implementation costs, working capital administrative fees, acquisition-related expense, and other non-recurring expenses.
(3) Represents the difference between the income tax expense of $2.7 million at an effective tax rate of (134.9)% on a GAAP basis and the income tax expense of $16.6 million at an effective tax rate of 26.5% on a non-GAAP basis. The difference reflects the tax impact of non-GAAP adjustments.
Page 16
SCHEDULE 11
STAGWELL INC. AND SUBSIDIARIES
UNAUDITED RECONCILIATION OF ADJUSTED DILUTED EARNINGS PER SHARE (NON-GAAP MEASURE)
(amounts in thousands, except per share amounts)
For the Six Months Ended June 30, 2025
| GAAP | Adjustments | Non-GAAP | ||||||||||||||||||
Net income (loss) attributable to Stagwell Inc. common shareholders | $ | (8,178) | $ | 95,596 | $ | 87,418 | ||||||||||||||
Net income (loss) attributable to Class C shareholders | (6,637) | — | (6,637) | |||||||||||||||||
Net income (loss) attributable to Stagwell Inc. and Class C shareholders and adjusted net income | $ | (14,815) | $ | 95,596 | $ | 80,781 | ||||||||||||||
Diluted - Weighted average number of common shares outstanding | 186,843 | — | 186,843 | |||||||||||||||||
| Weighted average number of shares of Class C Common Stock outstanding | 78,757 | — | 78,757 | |||||||||||||||||
Diluted - Weighted average number of shares outstanding | 265,600 | — | 265,600 | |||||||||||||||||
Diluted EPS and Adjusted Diluted EPS (1) | $ | (0.06) | $ | 0.30 | ||||||||||||||||
Adjustments to Net income (loss) | ||||||||||||||||||||
Amortization | $ | 68,574 | ||||||||||||||||||
| Stock-based compensation | 31,497 | |||||||||||||||||||
| Deferred acquisition consideration | 3,437 | |||||||||||||||||||
Other items, net (2) | 16,818 | |||||||||||||||||||
| 120,326 | ||||||||||||||||||||
Adjustment to GAAP income tax expense (3) | (24,730) | |||||||||||||||||||
| $ | 95,596 | |||||||||||||||||||
(1) See Non-GAAP Financial Measures section above for the definition of Adjusted Diluted EPS.
(2) Other items, net, primarily includes restructuring, certain system implementation costs, working capital administrative fees, acquisition-related expense, and other non-recurring expenses.
(3) Represents the difference between the income tax benefit of $4.4 million at an effective tax rate of (78.7)% on a GAAP basis and the income tax expense of $29.1 million at an effective tax rate of 26.5% on a non-GAAP basis. The difference reflects the tax impact of non-GAAP adjustments.
Page 17
SCHEDULE 12
STAGWELL INC. AND SUBSIDIARIES
UNAUDITED CONSOLIDATED BALANCE SHEETS
(amounts in thousands)
| June 30, 2026 | December 31, 2025 | ||||||||||
| ASSETS | |||||||||||
| Current Assets | |||||||||||
| Cash and cash equivalents | $ | 109,473 | $ | 104,537 | |||||||
| Accounts receivable, net | 713,100 | 735,752 | |||||||||
| Expenditures billable to clients | 159,320 | 164,694 | |||||||||
| Other current assets | 211,279 | 157,309 | |||||||||
| Total Current Assets | 1,193,172 | 1,162,292 | |||||||||
| Fixed assets, net | 71,552 | 73,081 | |||||||||
| Right-of-use assets - operating leases | 192,880 | 213,576 | |||||||||
| Goodwill | 1,594,881 | 1,595,238 | |||||||||
| Other intangible assets, net | 815,270 | 834,248 | |||||||||
| Deferred tax assets | 280,161 | 281,057 | |||||||||
| Other assets | 51,600 | 55,055 | |||||||||
| Total Assets | $ | 4,199,516 | $ | 4,214,547 | |||||||
| LIABILITIES, REDEEMABLE NONCONTROLLING INTERESTS ("RNCI"), AND SHAREHOLDERS’ EQUITY | |||||||||||
| Current Liabilities | |||||||||||
| Accounts payable | $ | 515,035 | $ | 548,320 | |||||||
| Accrued media | 203,073 | 239,490 | |||||||||
| Accruals and other liabilities | 299,293 | 291,554 | |||||||||
| Advance billings | 369,465 | 329,815 | |||||||||
| Current portion of lease liabilities - operating leases | 53,945 | 55,386 | |||||||||
| Current portion of deferred acquisition consideration | 37,784 | 15,446 | |||||||||
| Total Current Liabilities | 1,478,595 | 1,480,011 | |||||||||
| Long-term debt | 1,450,112 | 1,326,013 | |||||||||
| Long-term portion of deferred acquisition consideration | 19,083 | 24,598 | |||||||||
| Long-term lease liabilities - operating leases | 201,597 | 224,397 | |||||||||
| Deferred tax liabilities | 52,777 | 54,726 | |||||||||
| Long-term tax receivable agreement liability | 252,390 | 252,390 | |||||||||
| Other liabilities | 38,208 | 51,077 | |||||||||
| Total Liabilities | 3,492,762 | 3,413,212 | |||||||||
| Redeemable Noncontrolling Interests | 20,313 | 24,968 | |||||||||
| Commitments, contingencies and guarantees | |||||||||||
| Shareholders' Equity | |||||||||||
| Common shares - Class A | 244 | 252 | |||||||||
| Paid-in capital | 685,139 | 744,463 | |||||||||
| Retained earnings | 13,320 | 32,930 | |||||||||
| Accumulated other comprehensive loss | (29,319) | (19,252) | |||||||||
| Stagwell Inc. Shareholders' Equity | 669,384 | 758,393 | |||||||||
| Noncontrolling interests | 17,057 | 17,974 | |||||||||
| Total Shareholders' Equity | 686,441 | 776,367 | |||||||||
Total liabilities, RNCI, and shareholders’ equity | $ | 4,199,516 | $ | 4,214,547 | |||||||
Page 18
SCHEDULE 13
STAGWELL INC. AND SUBSIDIARIES
UNAUDITED SUMMARY CASH FLOW DATA
(amounts in thousands)
| Six Months Ended June 30, | |||||||||||
| 2026 | 2025 | ||||||||||
| Cash flows from operating activities: | |||||||||||
| Net loss | $ | (22,648) | $ | (9,959) | |||||||
Adjustments to reconcile net loss to cash provided by operating activities: | |||||||||||
| Stock-based compensation | 32,815 | 31,497 | |||||||||
| Depreciation and amortization | 88,286 | 83,375 | |||||||||
Amortization of right-of-use lease assets and lease liability interest | 32,232 | 34,075 | |||||||||
| Lease termination gain | — | (3,529) | |||||||||
| Deferred income taxes | (338) | (1,424) | |||||||||
| Adjustment to deferred acquisition consideration | 19,091 | 3,437 | |||||||||
| Other, net | 1,071 | (7,517) | |||||||||
| Changes in working capital: | |||||||||||
| Accounts receivable | 9,595 | 7,941 | |||||||||
| Expenditures billable to clients | 5,082 | 27,021 | |||||||||
| Other current assets | (58,849) | (41,375) | |||||||||
| Accounts payable | (15,944) | 25,333 | |||||||||
| Accrued expenses and other liabilities | (28,787) | (89,393) | |||||||||
| Advance billings | 39,278 | 35,765 | |||||||||
| Current portion of lease liabilities - operating leases | (35,717) | (40,509) | |||||||||
| Deferred acquisition related payments | (1,450) | — | |||||||||
Net cash provided by operating activities | 63,717 | 54,738 | |||||||||
| Cash flows from investing activities: | |||||||||||
| Capitalized software | (62,446) | (29,241) | |||||||||
| Capital expenditures | (21,623) | (18,088) | |||||||||
| Acquisitions, net of cash acquired | (4,453) | 14,172 | |||||||||
| Other | (1,150) | (1,779) | |||||||||
Net cash used in investing activities | (89,672) | (34,936) | |||||||||
| Cash flows from financing activities: | |||||||||||
| Repayment of borrowings under revolving credit facility | (972,100) | (925,000) | |||||||||
| Proceeds from borrowings under revolving credit facility | 1,096,100 | 1,038,000 | |||||||||
| Shares repurchased and cancelled | (87,956) | (67,504) | |||||||||
| Distributions to noncontrolling interests and RNCI | (3,071) | (4,761) | |||||||||
| Payment of deferred consideration | (337) | (16,103) | |||||||||
| Tax Receivables Agreement payment | (2,554) | — | |||||||||
| Debt financing and other costs | — | (3,570) | |||||||||
Net cash provided by financing activities | 30,082 | 21,062 | |||||||||
| Effect of exchange rate changes on cash and cash equivalents | 809 | 9,106 | |||||||||
| Net increase in cash and cash equivalents | 4,936 | 49,970 | |||||||||
| Cash and cash equivalents at beginning of period | 104,537 | 131,339 | |||||||||
| Cash and cash equivalents at end of period | $ | 109,473 | $ | 181,309 | |||||||
Page 19
EARNINGS PRESENTATION Second Quarter 2026 JULY 30 | 2026
This document contains forward-looking statements within the meaning of Section 27A of the Securities Act of 1933, as amended (the “Securities Act”), and Section 21E of the Securities Exchange Act of 1934, as amended (the “Exchange Act”). The Company’s representatives may also make forward-looking statements orally or in writing from time to time. Statements in this document that are not historical facts, including, statements about the Company’s beliefs and expectations, future financial performance, growth, and future prospects, the Company’s strategy, business and economic trends and growth, technological leadership and differentiation, potential and completed acquisitions, anticipated and actual operating efficiencies and synergies and estimates of amounts for redeemable noncontrolling interests and deferred acquisition consideration, constitute forward-looking statements. Forward-looking statements, which are generally denoted by words such as “ability,” “aim,” “anticipate,” “assume,” “believe,” “better,” “build,” “consider,” “continue,” “could,” “develop,” “drive,” “enhance,” “estimate,” “expect,” “focus,” “forecast,” “future,” “grow,” “guidance,” “improve,” “intend,” “likely,” “maintain,” “may,” “ongoing,” “outlook,” “plan,” “position,” “possible,” “potential,” “probable,” “project,” “seek,” “should,” “target,” “will,” “would” or the negative of such terms or other variations thereof and terms of similar substance used in connection with any discussion of current plans, estimates and projections are subject to change based on a number of factors, including those outlined in this section. Forward-looking statements in this document are based on certain key expectations and assumptions made by the Company. Although the management of the Company believes that the expectations and assumptions on which such forward-looking statements are based are reasonable, undue reliance should not be placed on the forward-looking statements because the Company can give no assurance that they will prove to be correct. The material assumptions upon which such forward-looking statements are based include, among others, assumptions with respect to general business, economic and market conditions, the competitive environment, anticipated and unanticipated tax consequences and anticipated and unanticipated costs. These forward-looking statements are based on current plans, estimates and projections, and are subject to change based on a number of factors, including those outlined in this section. These forward- looking statements are subject to various risks and uncertainties, many of which are outside the Company’s control. Therefore, you should not place undue reliance on such statements. Forward-looking statements speak only as of the date they are made, and the Company undertakes no obligation to update publicly any of them in light of new information or future events, if any. Forward-looking statements involve inherent risks and uncertainties. A number of important factors could cause actual results to differ materially from those contained in any forward-looking statements. Such risk factors include, but are not limited to, the following: • risks associated with international, national and regional unfavorable economic conditions, including the effect of changing tariffs and other trade policies, inflation and other macroeconomic factors that could affect the Company or its clients; • demand for the Company’s services, which may precipitate or exacerbate other risks and uncertainties; • inflation and actions taken by central banks to counter inflation; • the Company’s ability to attract new clients and retain existing clients; • the impact of a reduction in client spending and changes in client advertising, marketing and corporate communications requirements; • financial failure of the Company’s clients; • the Company’s ability to retain and attract key employees; • the Company’s ability to compete in the markets in which it operates; • the Company’s ability to achieve its cost saving initiatives; • the Company’s implementation of strategic initiatives; • the Company’s ability to remain in compliance with its debt agreements and the Company’s ability to finance its contingent payment obligations when due and payable, including but not limited to those relating to redeemable noncontrolling interests, deferred acquisition consideration and profit interests; • the Company’s ability to manage its growth effectively; • the Company’s ability to identify and complete acquisitions or other strategic transactions that complement and expand the Company’s business capabilities and successfully integrate newly acquired businesses into the Company’s operations, retain key employees, and realize cost savings, synergies and other related anticipated benefits within the expected time period; • the Company’s ability to identify and complete divestitures and to achieve the anticipated benefits therefrom; • the Company’s ability to develop products incorporating new technologies, including augmented reality, artificial intelligence, and virtual reality, and realize benefits from such products; • the Company’s use of artificial intelligence, including generative artificial intelligence; • adverse tax consequences for the Company, its operations and its stockholders, that may differ from the expectations of the Company, including that recent or future changes in tax laws, potential changes to corporate tax rates in the United States and disagreements with tax authorities on the Company’s determinations that may result in increased tax costs; • adverse tax consequences in connection with the business combination that formed the Company in August 2021, including the incurrence of material Canadian federal income tax (including material “emigration tax”); • the Company’s ability to maintain an effective system of internal control over financial reporting, including the risk that the Company’s internal controls will fail to detect misstatements in its financial statements; • the Company’s ability to accurately forecast its future financial performance and provide accurate guidance; • the Company’s ability to protect client data from security incidents or cyberattacks; • economic disruptions resulting from war and other economic and geopolitical tensions (such as the ongoing military conflicts in Iran and the Middle East, and between Russia and Ukraine), terrorist activities, natural disasters, public health events, and tariff and trade policies; • stock price volatility; and foreign currency fluctuations. Investors should carefully consider these risk factors, other risk factors described herein, and the additional risk factors outlined in more detail in our 2025 Form 10-K, filed with the Securities and Exchange Commission (the “SEC”) on March 13, 2026, and accessible on the SEC’s website at www.sec.gov, under the caption “Risk Factors,” and in the Company’s other SEC filings. FORWARD LOOKING STATEMENTS & OTHER INFORMATION 2
DEFINITIONS OF NON-GAAP FINANCIAL MEASURES 3 In addition to its reported results, Stagwell Inc. has included in this earnings presentation certain financial results that the Securities and Exchange Commission (SEC) defines as "non-GAAP Financial Measures." Management believes that such non-GAAP financial measures, when read in conjunction with the Company's reported results, can provide useful supplemental information for investors analyzing period to period comparisons of the Company's results. Such non-GAAP financial measures include the following: Pro Forma Results: The Pro Forma amounts presented for each period were prepared by combining the historical standalone statements of operations for each of legacy MDC and SMG. The unaudited pro forma results are provided for illustrative purposes only and do not purport to represent what the actual consolidated results of operations or consolidated financial condition would have been had the combination actually occurred on the date indicated, nor do they purport to project the future consolidated results of operations or consolidated financial condition for any future period or as of any future date. The Company has excluded a quantitative reconciliation of Adjusted Pro Forma EBITDA to net income under the “unreasonable efforts” exception in Item 10(e)(1)(i)(B) of Regulation S-K. 1. Organic Net Revenue: “Organic net revenue growth” and “Organic net revenue decline” reflects the year-over-year change in the Company's reported net revenue attributable to the Company's management of the entities it owns. We calculate organic net revenue growth (decline) by subtracting the net impact of acquisitions (divestitures) and the impact of foreign currency exchange fluctuations from the aggregate year-over-year increase or decrease in the Company's reported net revenue. The net impact of acquisitions (divestitures) reflects the year-over-year change in the Company’s reported net revenue attributable to the impact of all individual entities that were acquired or divested in the current and prior year. We calculate impact of an acquisition as follows: (a) for an entity acquired during the current year, we present the entity’s current period reported revenue as the impact of the acquisition in the current year; and (b) for an entity acquired in the prior year, we present an amount equal to the entity’s current year net revenue for the same period during which we didn’t own the entity in the prior year as the impact of the acquisition in the current year. We calculate impact of a divestiture as follows: (a) for a divestiture in the current year, we present the entity’s prior year net revenue for the same period during which we no longer owned it in the current year as impact of the divestiture in the current year; and (b) for a divestiture in the prior year, we present the entity’s prior year net revenue for the period during which we owned it in the prior year as impact of the divestiture in the current year. We calculate the impact of any acquisition or divestiture without adjusting for foreign currency exchange fluctuations. The impact of foreign currency exchange fluctuations reflects the year-over-year change in the Company’s reported net revenue attributable to changes in foreign currency exchange rates. We calculate the impact of foreign currency exchange fluctuations for the portion of the reporting period in which we recognized revenue from a foreign entity in both the current year and the prior year. The impact is calculated as the difference between (1) reported prior period net revenue (converted to U.S. dollars at historical foreign currency exchange rates) and (2) prior period net revenue converted to U.S. dollars at current period foreign exchange rates. 2. Net New Business: Estimate of annualized revenue for new wins less annualized revenue for losses incurred in the period. 3. Adjusted EBITDA: defined as Net income (loss) attributable to Stagwell Inc. common shareholders excluding non-operating income or expense, income tax expense or benefit, equity in income or loss of non-consolidated entities and net income or loss attributable to noncontrolling and redeemable noncontrolling interest holders to achieve Operating income (loss), plus depreciation and amortization, stock-based compensation, deferred acquisition consideration adjustments, impairment and other losses, and other items. Other items primarily includes restructuring, certain system implementation costs, working capital administrative fees and acquisition-related expenses. Adjusted EBITDA for our reportable segments is reconciled to Operating income (loss), as Net income (loss) is not relevant for reportable segment financial metric 4. Adjusted Diluted EPS: defined as Adjusted Net Income (loss) attributable to Stagwell Inc. common and Class C shareholders, divided by the diluted weighted average shares outstanding. Adjusted Net Income represents net income (loss) attributable to Stagwell Inc. common and Class C shareholders, excluding amortization, impairment and other losses, stock-based compensation, deferred acquisition consideration adjustments, discrete tax items, and other items (as defined above), allocated between the two share classes based on their respective income allocation percentages using a normalized effective tax rate. The diluted weighted average shares outstanding includes the diluted weighted average common shares outstanding plus Class C common stock, par value $0.00001 per share (the “Class C Common Stock”) as if converted to shares of Class A Common Stock if not included because they were anti-dilutive 5. Free Cash Flow: defined as consolidated net cash flow from operations less cash outflow from capital expenditures and capitalized software, excluding material nonrecurring capital purchases. Free Cash Flow Conversion is the percentage of adjusted EBITDA. 6. Financial Guidance: The Company provides guidance on a non-GAAP basis as it cannot predict certain elements which are included in reported GAAP results. Included in this earnings presentation are tables reconciling reported Stagwell Inc. results to arrive at certain of these non-GAAP financial measures.
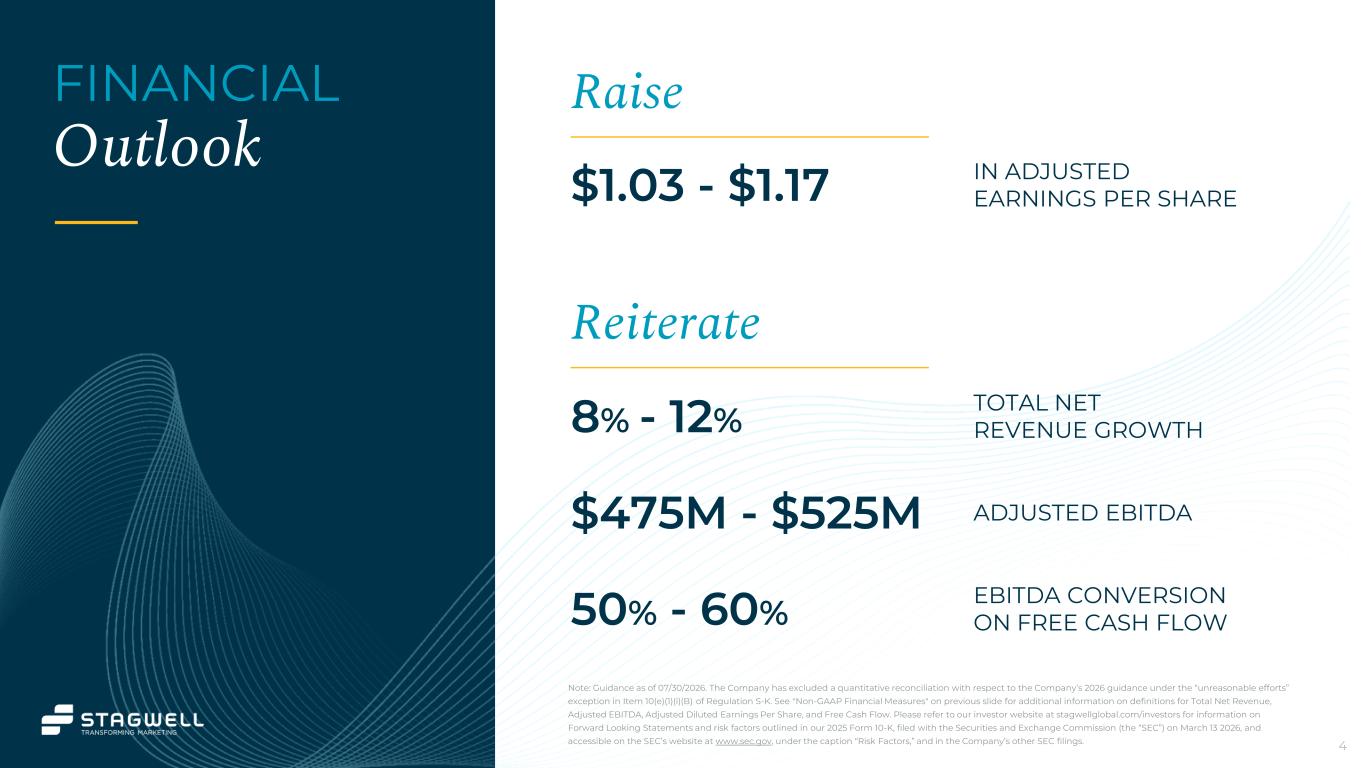
4 FINANCIAL Outlook Note: Guidance as of 07/30/2026. The Company has excluded a quantitative reconciliation with respect to the Company’s 2026 guidance under the “unreasonable efforts” exception in Item 10(e)(1)(i)(B) of Regulation S-K. See "Non-GAAP Financial Measures" on previous slide for additional information on definitions for Total Net Revenue, Adjusted EBITDA, Adjusted Diluted Earnings Per Share, and Free Cash Flow. Please refer to our investor website at stagwellglobal.com/investors for information on Forward Looking Statements and risk factors outlined in our 2025 Form 10-K, filed with the Securities and Exchange Commission (the “SEC”) on March 13 2026, and accessible on the SEC’s website at www.sec.gov, under the caption “Risk Factors,” and in the Company’s other SEC filings. Raise $1.03 - $1.17 IN ADJUSTED EARNINGS PER SHARE Reiterate 8% - 12% TOTAL NET REVENUE GROWTH $475M - $525M ADJUSTED EBITDA 50% - 60% EBITDA CONVERSION ON FREE CASH FLOW
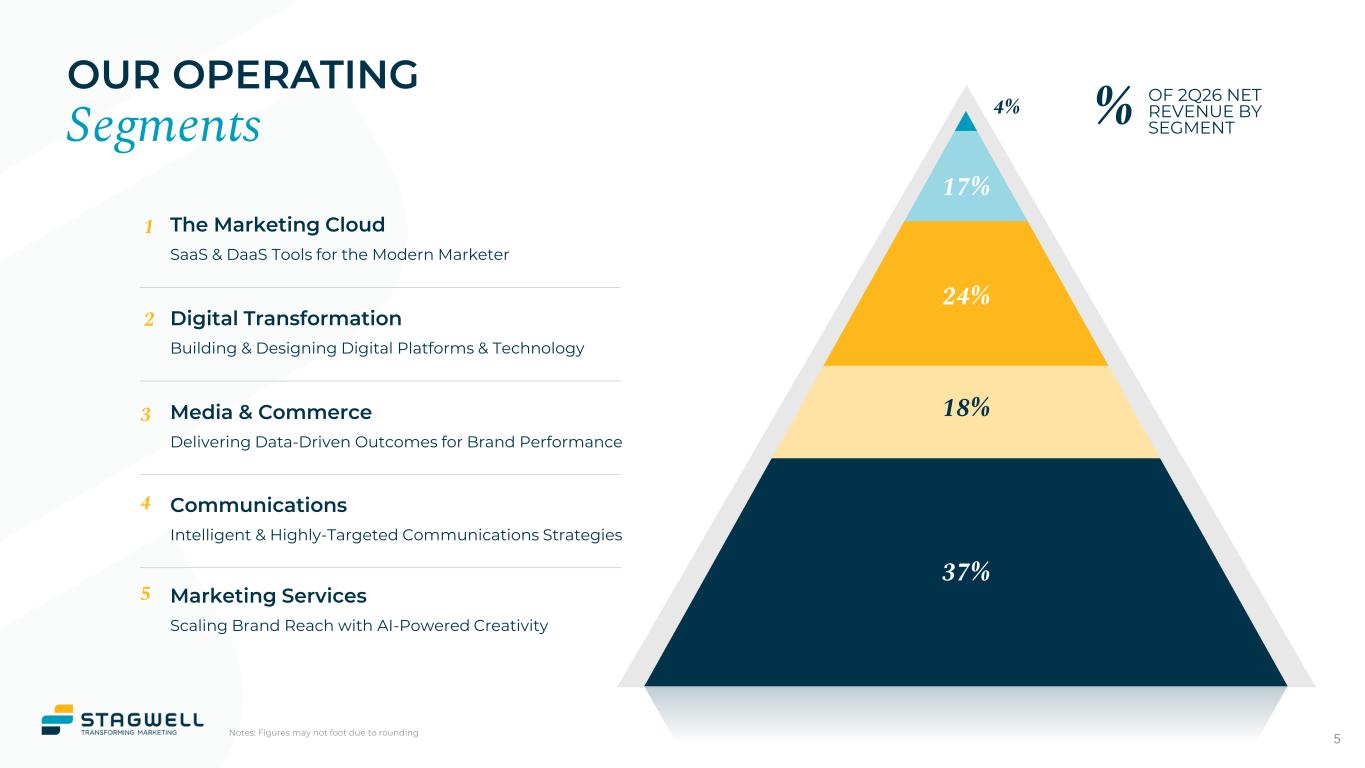
5 OUR OPERATING Segments Marketing Services Scaling Brand Reach with AI-Powered Creativity Media & Commerce Delivering Data-Driven Outcomes for Brand Performance Communications Intelligent & Highly-Targeted Communications Strategies Digital Transformation Building & Designing Digital Platforms & Technology 2 3 4 5 The Marketing Cloud SaaS & DaaS Tools for the Modern Marketer 1 37% 18% 24% 17% 4% % OF 2Q26 NET REVENUE BY SEGMENT Notes: Figures may not foot due to rounding
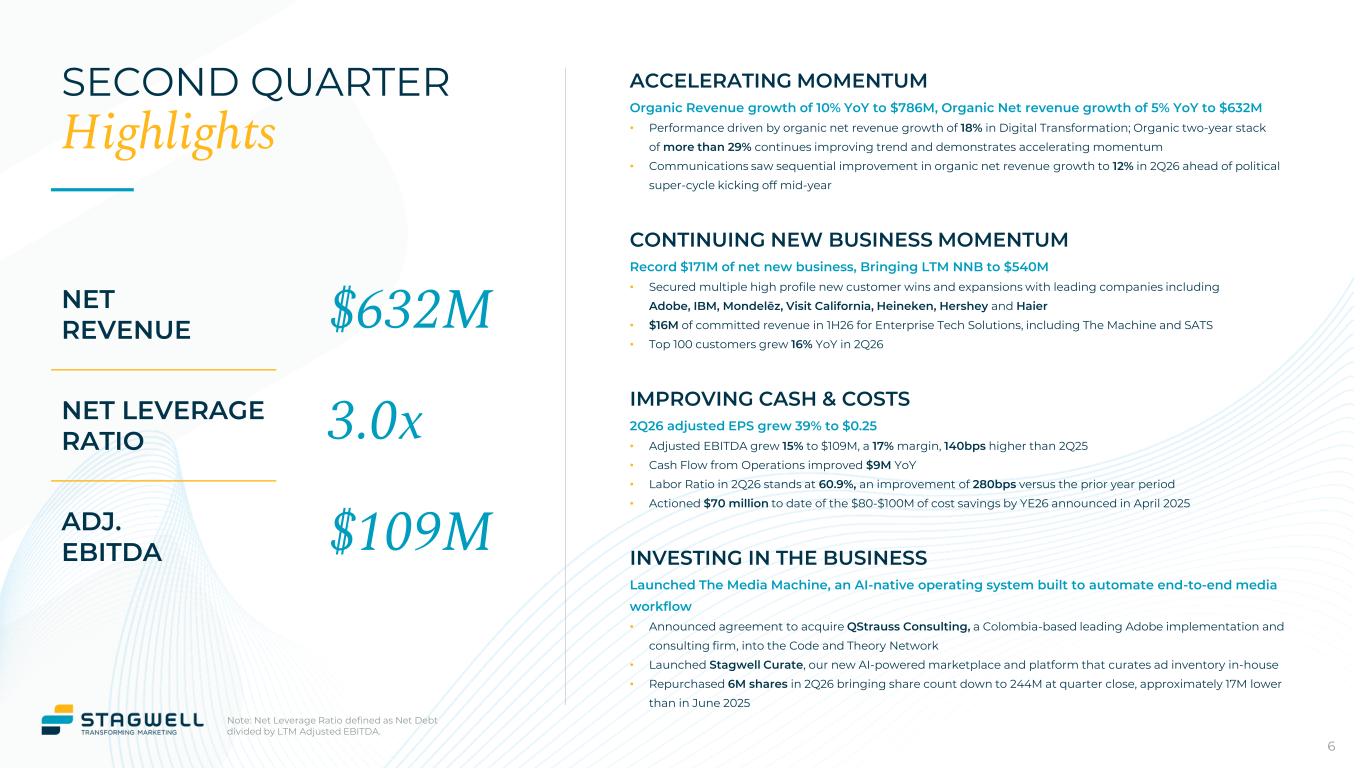
SECOND QUARTER Highlights 6 ACCELERATING MOMENTUM Organic Revenue growth of 10% YoY to $786M, Organic Net revenue growth of 5% YoY to $632M • Performance driven by organic net revenue growth of 18% in Digital Transformation; Organic two-year stack of more than 29% continues improving trend and demonstrates accelerating momentum • Communications saw sequential improvement in organic net revenue growth to 12% in 2Q26 ahead of political super-cycle kicking off mid-year CONTINUING NEW BUSINESS MOMENTUM Record $171M of net new business, Bringing LTM NNB to $540M • Secured multiple high profile new customer wins and expansions with leading companies including Adobe, IBM, Mondelēz, Visit California, Heineken, Hershey and Haier • $16M of committed revenue in 1H26 for Enterprise Tech Solutions, including The Machine and SATS • Top 100 customers grew 16% YoY in 2Q26 IMPROVING CASH & COSTS 2Q26 adjusted EPS grew 39% to $0.25 • Adjusted EBITDA grew 15% to $109M, a 17% margin, 140bps higher than 2Q25 • Cash Flow from Operations improved $9M YoY • Labor Ratio in 2Q26 stands at 60.9%, an improvement of 280bps versus the prior year period • Actioned $70 million to date of the $80-$100M of cost savings by YE26 announced in April 2025 NET REVENUE $632M NET LEVERAGE RATIO 3.0x ADJ. EBITDA $109M Note: Net Leverage Ratio defined as Net Debt divided by LTM Adjusted EBITDA. INVESTING IN THE BUSINESS Launched The Media Machine, an AI-native operating system built to automate end-to-end media workflow • Announced agreement to acquire QStrauss Consulting, a Colombia-based leading Adobe implementation and consulting firm, into the Code and Theory Network • Launched Stagwell Curate, our new AI-powered marketplace and platform that curates ad inventory in-house • Repurchased 6M shares in 2Q26 bringing share count down to 244M at quarter close, approximately 17M lower than in June 2025

7 Growth Drivers
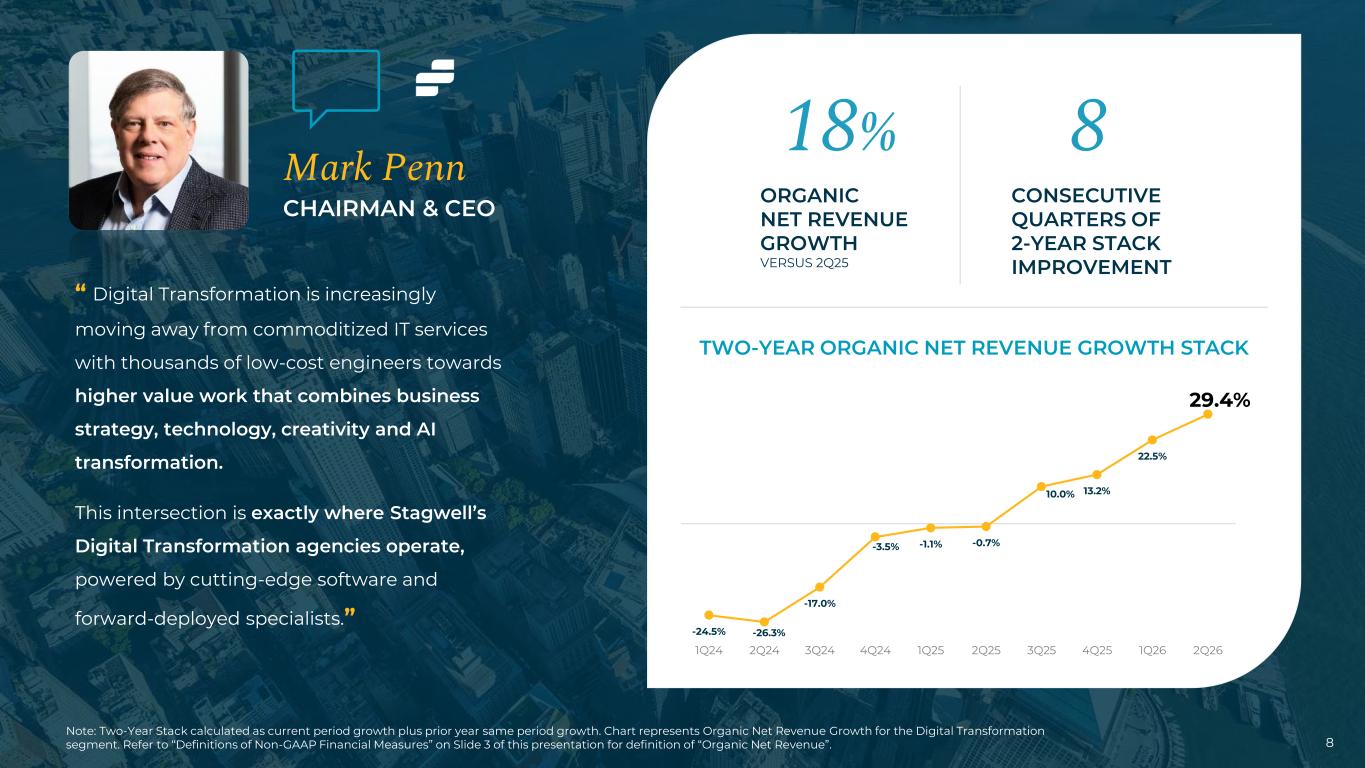
Mark Penn CHAIRMAN & CEO 8 Note: Two-Year Stack calculated as current period growth plus prior year same period growth. Chart represents Organic Net Revenue Growth for the Digital Transformation segment. Refer to “Definitions of Non-GAAP Financial Measures” on Slide 3 of this presentation for definition of “Organic Net Revenue”. “ Digital Transformation is increasingly moving away from commoditized IT services with thousands of low-cost engineers towards higher value work that combines business strategy, technology, creativity and AI transformation. This intersection is exactly where Stagwell’s Digital Transformation agencies operate, powered by cutting-edge software and forward-deployed specialists.” -24.5% -26.3% -17.0% -3.5% -1.1% -0.7% 10.0% 13.2% 22.5% 29.4% 1Q24 2Q24 3Q24 4Q24 1Q25 2Q25 3Q25 4Q25 1Q26 2Q26 TWO-YEAR ORGANIC NET REVENUE GROWTH STACK 18% 8 ORGANIC NET REVENUE GROWTH VERSUS 2Q25 CONSECUTIVE QUARTERS OF 2-YEAR STACK IMPROVEMENT
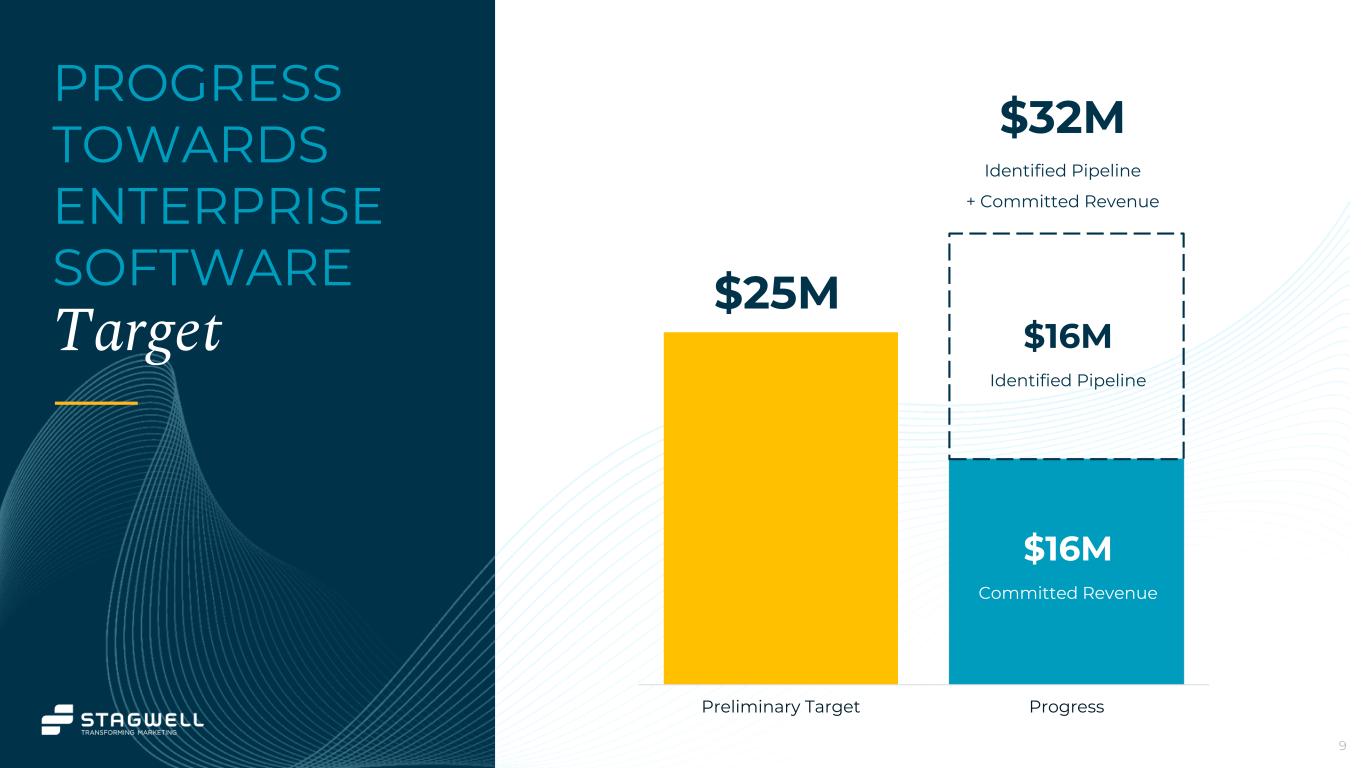
9 PROGRESS TOWARDS ENTERPRISE SOFTWARE Target Preliminary Target Progress $25M $16M Identified Pipeline $16M Committed Revenue $32M Identified Pipeline + Committed Revenue
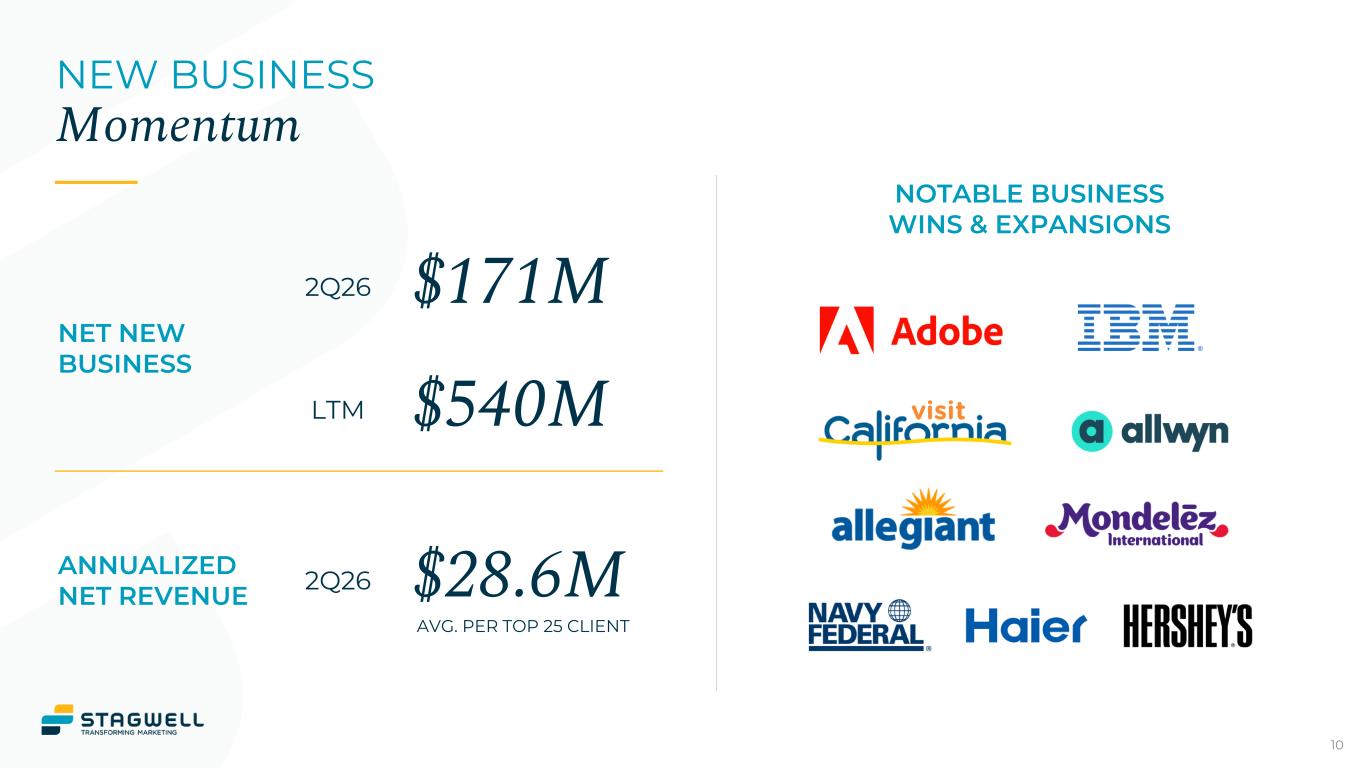
10 NEW BUSINESS Momentum NET NEW BUSINESS 2Q26 $171M LTM $540M ANNUALIZED NET REVENUE 2Q26 $28.6M NOTABLE BUSINESS WINS & EXPANSIONS AVG. PER TOP 25 CLIENT
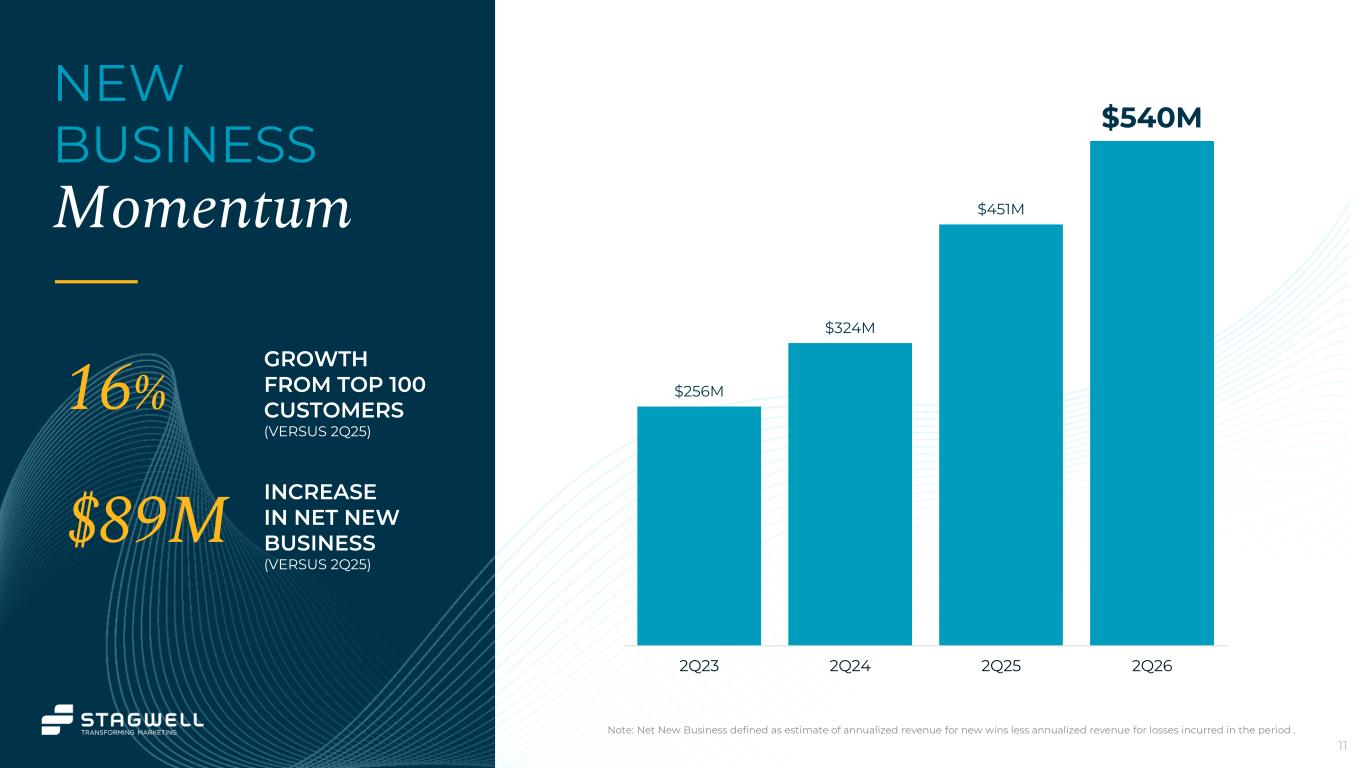
11 NEW BUSINESS Momentum $256M $324M $451M $540M 2Q23 2Q24 2Q25 2Q26 Note: Net New Business defined as estimate of annualized revenue for new wins less annualized revenue for losses incurred in the period . 16% GROWTH FROM TOP 100 CUSTOMERS (VERSUS 2Q25) $89M INCREASE IN NET NEW BUSINESS (VERSUS 2Q25)
12 2026 Financials
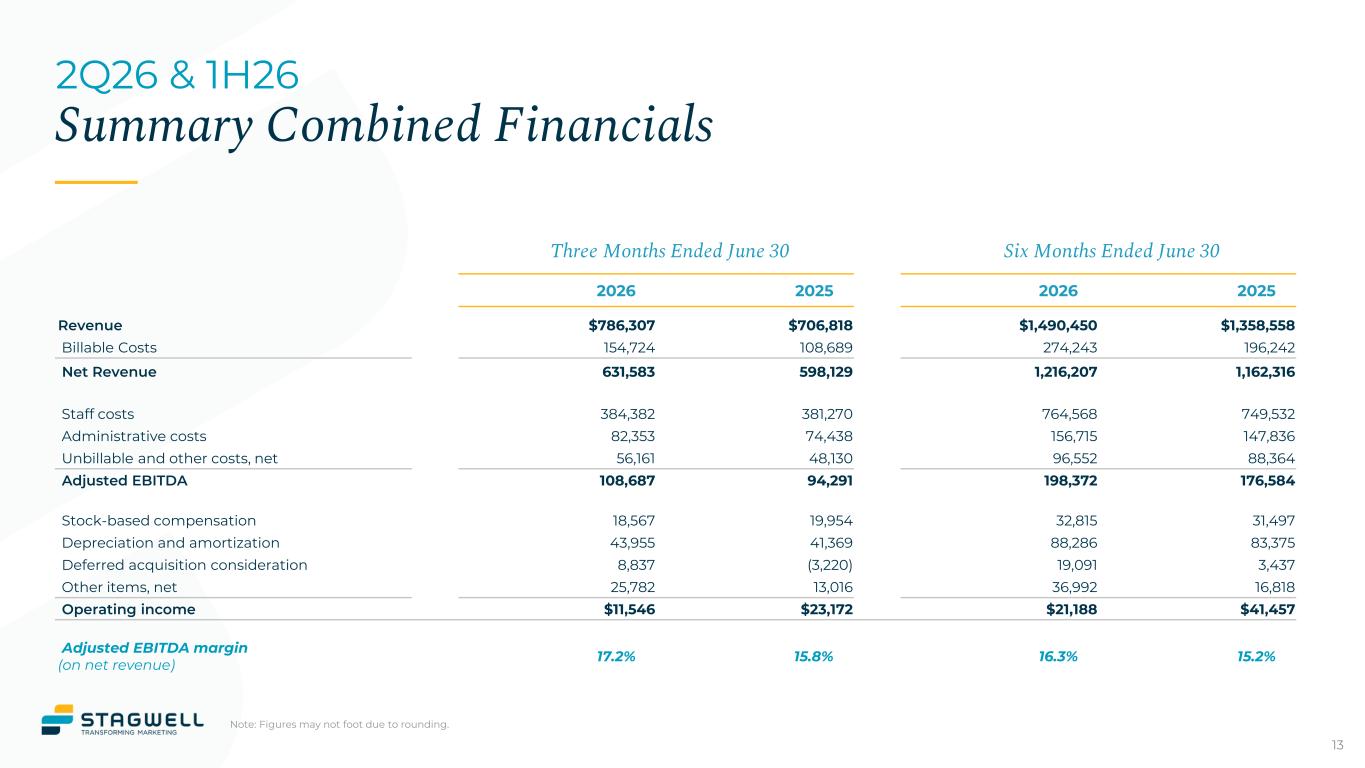
13 2Q26 & 1H26 Summary Combined Financials Note: Figures may not foot due to rounding. Three Months Ended June 30 Six Months Ended June 30 2026 2025 2026 2025 Revenue $786,307 $706,818 $1,490,450 $1,358,558 Billable Costs 154,724 108,689 274,243 196,242 Net Revenue 631,583 598,129 1,216,207 1,162,316 Staff costs 384,382 381,270 764,568 749,532 Administrative costs 82,353 74,438 156,715 147,836 Unbillable and other costs, net 56,161 48,130 96,552 88,364 Adjusted EBITDA 108,687 94,291 198,372 176,584 Stock-based compensation 18,567 19,954 32,815 31,497 Depreciation and amortization 43,955 41,369 88,286 83,375 Deferred acquisition consideration 8,837 (3,220) 19,091 3,437 Other items, net 25,782 13,016 36,992 16,818 Operating income $11,546 $23,172 $21,188 $41,457 Adjusted EBITDA margin (on net revenue) 17.2% 15.8% 16.3% 15.2%
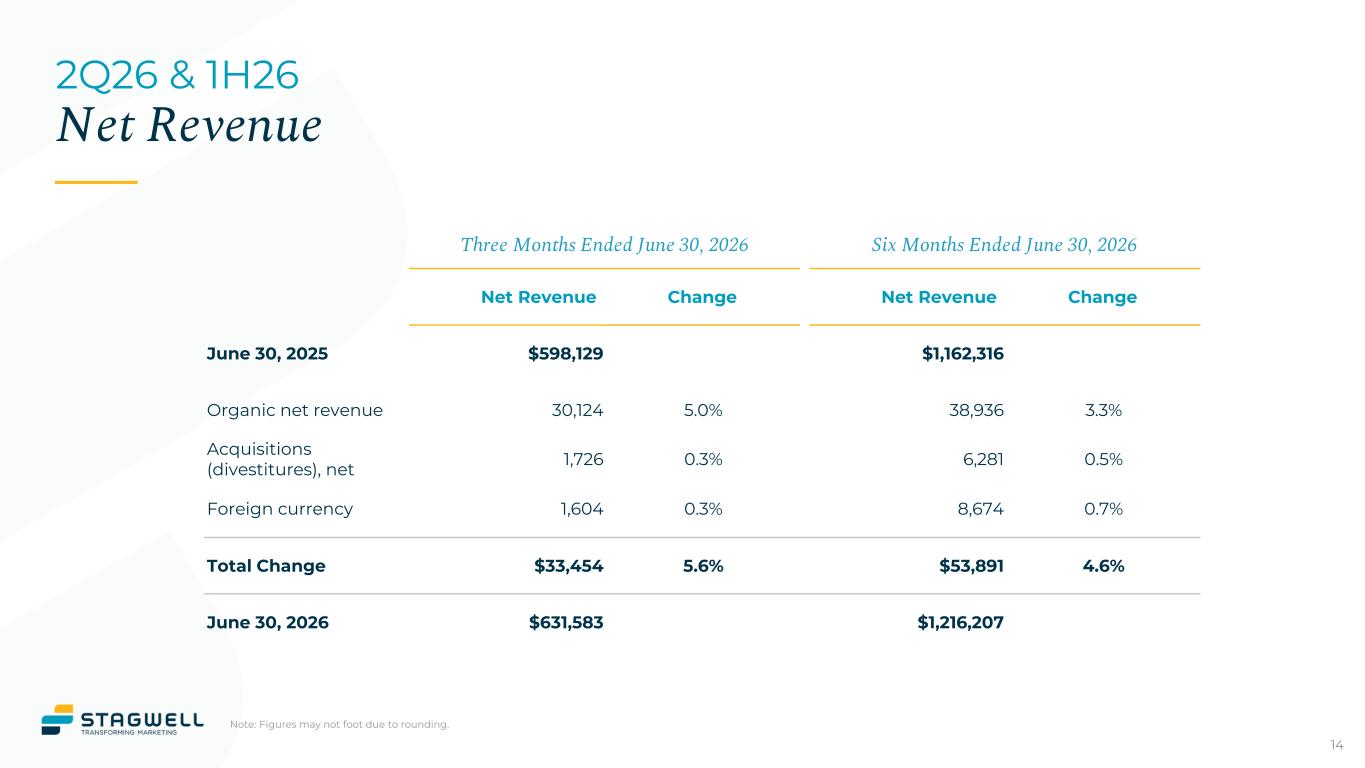
14 2Q26 & 1H26 Net Revenue Note: Figures may not foot due to rounding. Three Months Ended June 30, 2026 Six Months Ended June 30, 2026 Net Revenue Change Net Revenue Change June 30, 2025 $598,129 $1,162,316 Organic net revenue 30,124 5.0% 38,936 3.3% Acquisitions (divestitures), net 1,726 0.3% 6,281 0.5% Foreign currency 1,604 0.3% 8,674 0.7% Total Change $33,454 5.6% $53,891 4.6% June 30, 2026 $631,583 $1,216,207
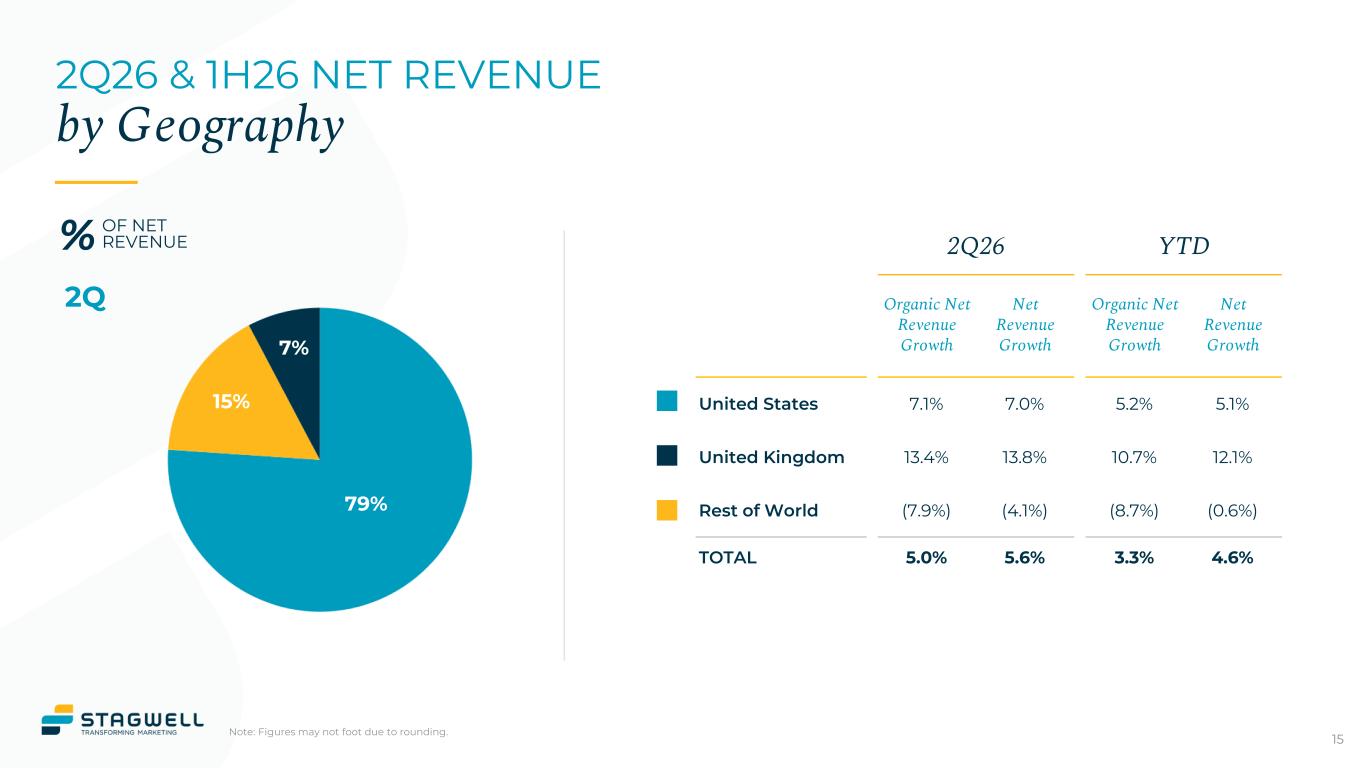
Note: Figures may not foot due to rounding. 2Q 15 2Q26 YTD Organic Net Revenue Growth Net Revenue Growth Organic Net Revenue Growth Net Revenue Growth United States 7.1% 7.0% 5.2% 5.1% United Kingdom 13.4% 13.8% 10.7% 12.1% Rest of World (7.9%) (4.1%) (8.7%) (0.6%) TOTAL 5.0% 5.6% 3.3% 4.6% 79% 7% 15% % OF NET REVENUE 2Q26 & 1H26 NET REVENUE by Geography
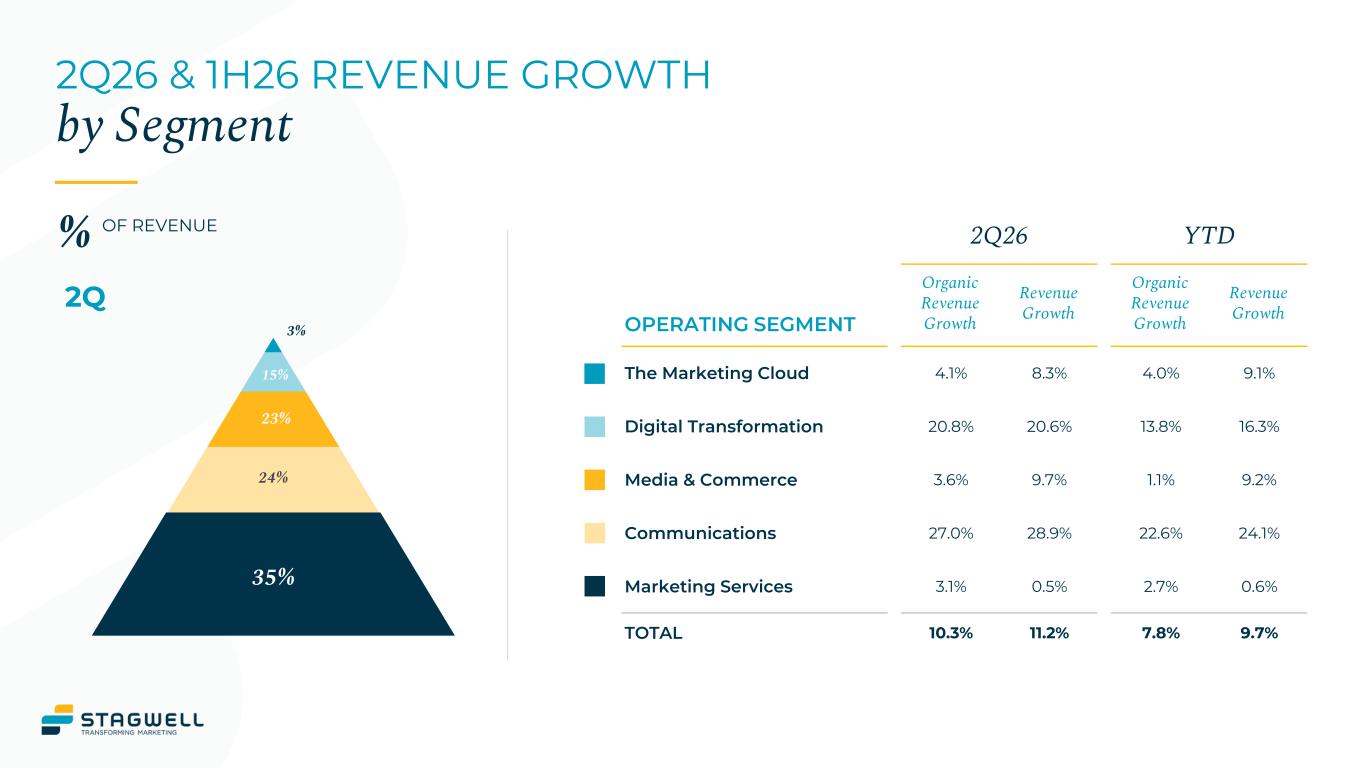
2Q26 YTD OPERATING SEGMENT Organic Revenue Growth Revenue Growth Organic Revenue Growth Revenue Growth The Marketing Cloud 4.1% 8.3% 4.0% 9.1% Digital Transformation 20.8% 20.6% 13.8% 16.3% Media & Commerce 3.6% 9.7% 1.1% 9.2% Communications 27.0% 28.9% 22.6% 24.1% Marketing Services 3.1% 0.5% 2.7% 0.6% TOTAL 10.3% 11.2% 7.8% 9.7% 3% 15% 23% 24% 35% 2Q26 & 1H26 REVENUE GROWTH by Segment 2Q % OF REVENUE
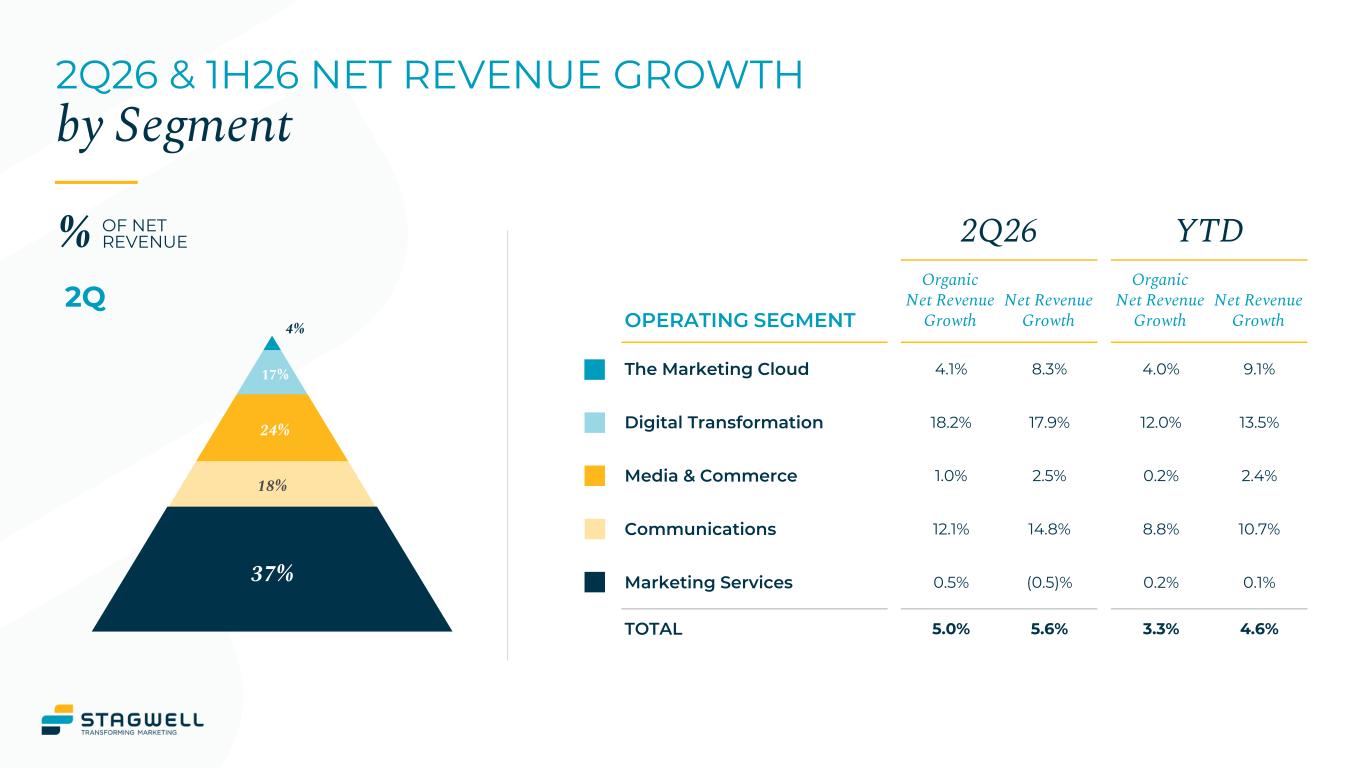
2Q26 YTD OPERATING SEGMENT Organic Net Revenue Growth Net Revenue Growth Organic Net Revenue Growth Net Revenue Growth The Marketing Cloud 4.1% 8.3% 4.0% 9.1% Digital Transformation 18.2% 17.9% 12.0% 13.5% Media & Commerce 1.0% 2.5% 0.2% 2.4% Communications 12.1% 14.8% 8.8% 10.7% Marketing Services 0.5% (0.5)% 0.2% 0.1% TOTAL 5.0% 5.6% 3.3% 4.6% 4% 17% 24% 18% 37% 2Q26 & 1H26 NET REVENUE GROWTH by Segment 2Q % OF NET REVENUE
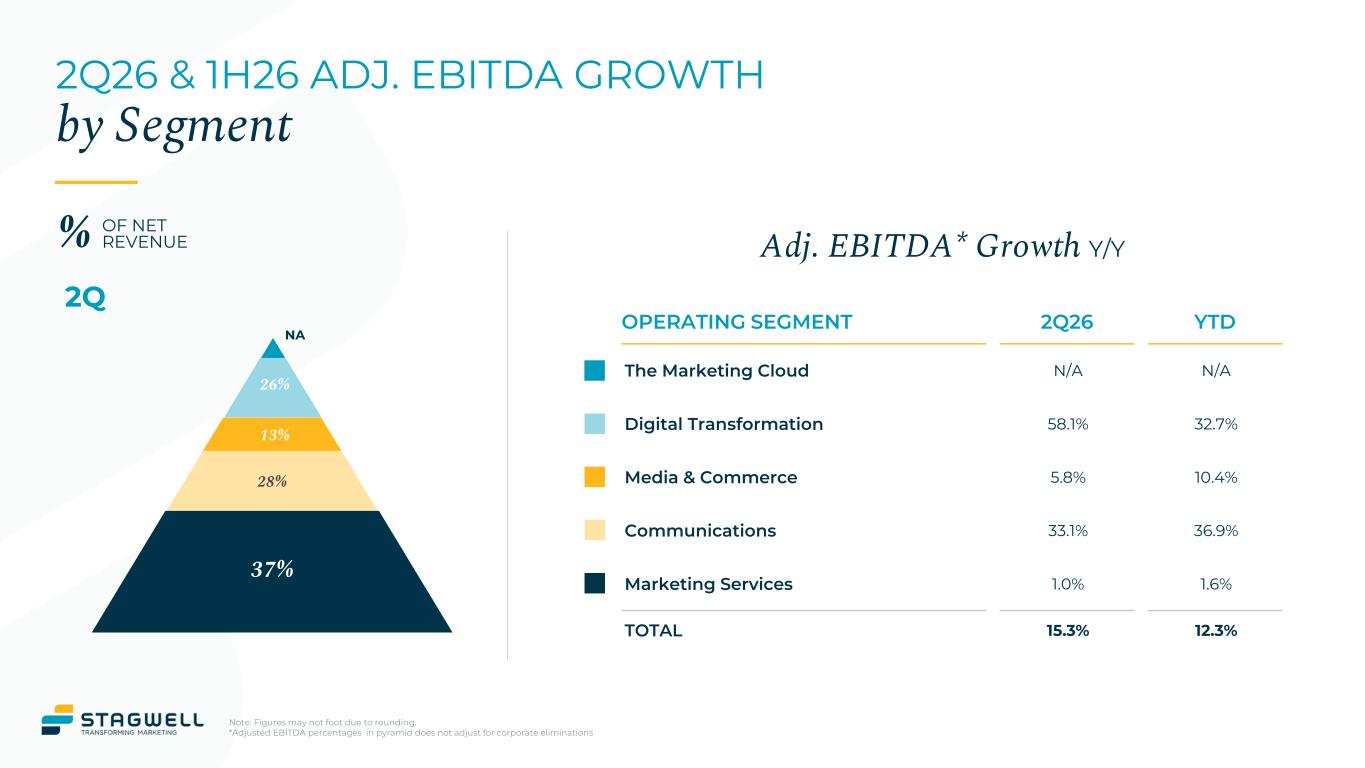
OPERATING SEGMENT 2Q26 YTD The Marketing Cloud N/A N/A Digital Transformation 58.1% 32.7% Media & Commerce 5.8% 10.4% Communications 33.1% 36.9% Marketing Services 1.0% 1.6% TOTAL 15.3% 12.3% NA 26% 13% 28% 37% Adj. EBITDA* Growth Y/Y Note: Figures may not foot due to rounding. *Adjusted EBITDA percentages in pyramid does not adjust for corporate eliminations 2Q26 & 1H26 ADJ. EBITDA GROWTH by Segment 2Q % OF NET REVENUE
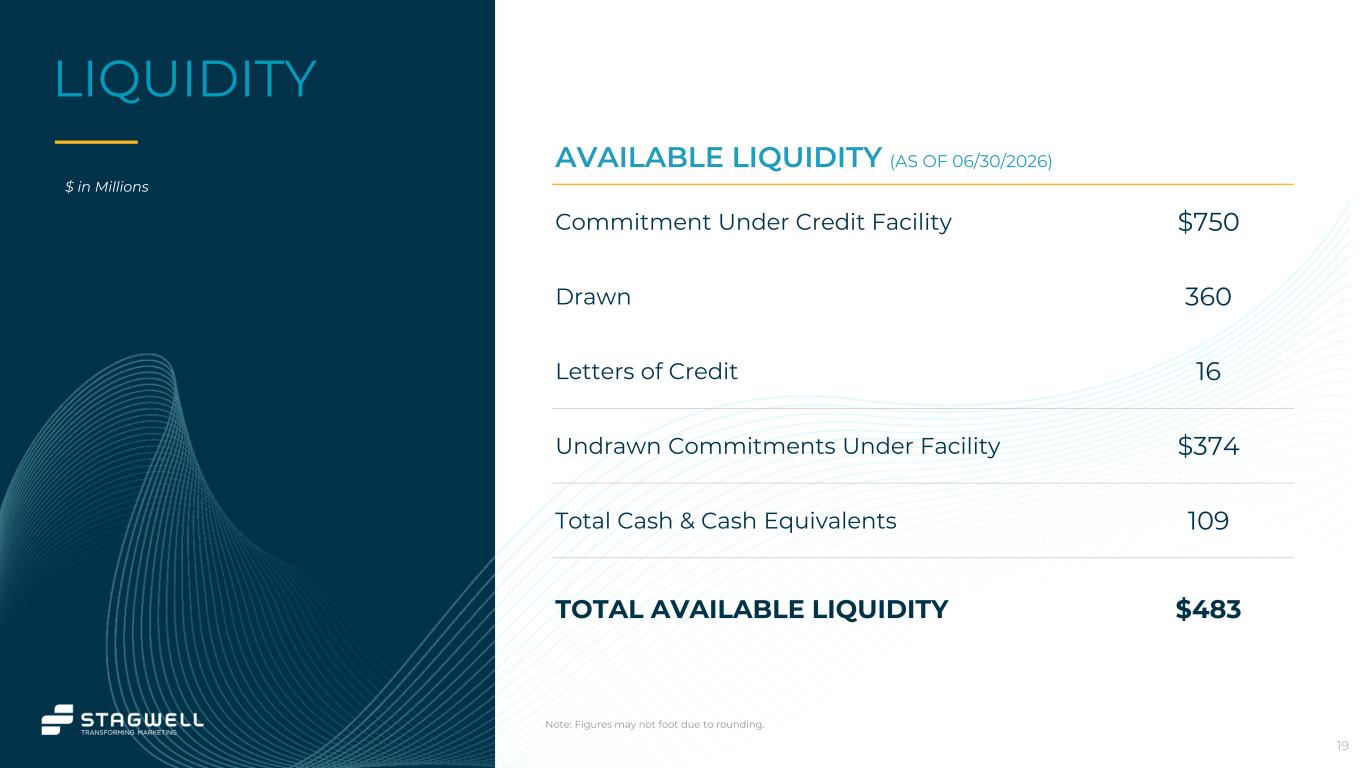
19 LIQUIDITY Note: Figures may not foot due to rounding. $ in Millions AVAILABLE LIQUIDITY (AS OF 06/30/2026) Commitment Under Credit Facility $750 Drawn 360 Letters of Credit 16 Undrawn Commitments Under Facility $374 Total Cash & Cash Equivalents 109 TOTAL AVAILABLE LIQUIDITY $483
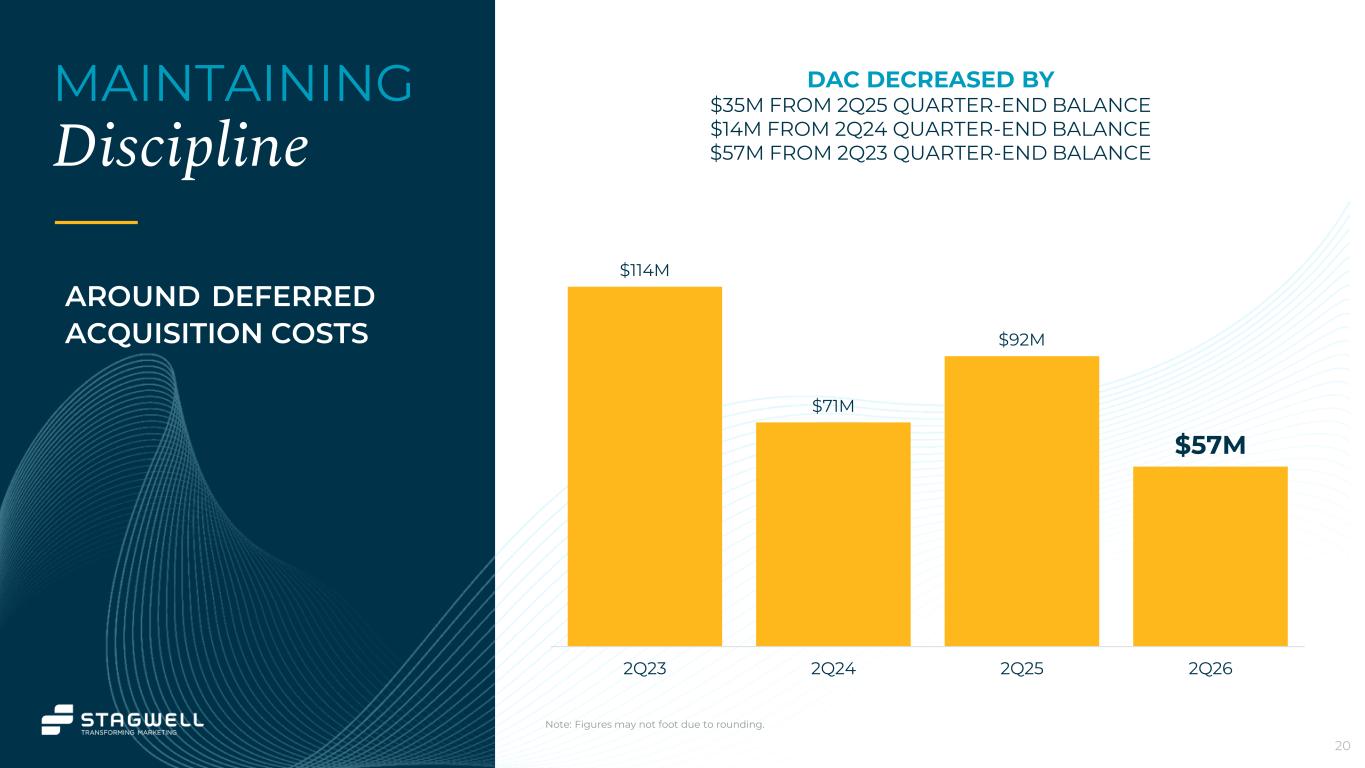
20 Note: Figures may not foot due to rounding. MAINTAINING Discipline AROUND DEFERRED ACQUISITION COSTS DAC DECREASED BY $35M FROM 2Q25 QUARTER-END BALANCE $14M FROM 2Q24 QUARTER-END BALANCE $57M FROM 2Q23 QUARTER-END BALANCE $114M $71M $92M $57M 2Q23 2Q24 2Q25 2Q26
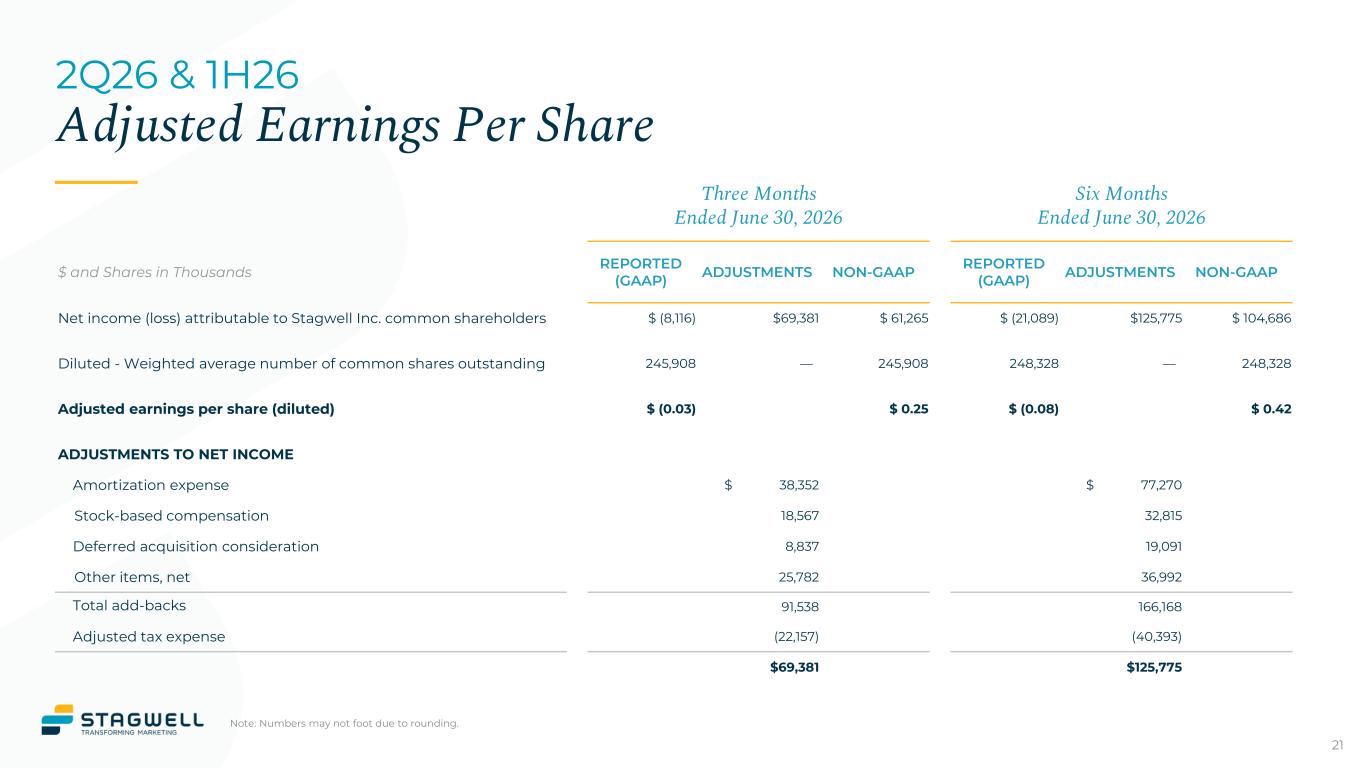
21 2Q26 & 1H26 Adjusted Earnings Per Share Note: Numbers may not foot due to rounding. Three Months Ended June 30, 2026 Six Months Ended June 30, 2026 $ and Shares in Thousands REPORTED (GAAP) ADJUSTMENTS NON-GAAP REPORTED (GAAP) ADJUSTMENTS NON-GAAP Net income (loss) attributable to Stagwell Inc. common shareholders $ (8,116) $69,381 $ 61,265 $ (21,089) $125,775 $ 104,686 Diluted - Weighted average number of common shares outstanding 245,908 — 245,908 248,328 — 248,328 Adjusted earnings per share (diluted) $ (0.03) $ 0.25 $ (0.08) $ 0.42 ADJUSTMENTS TO NET INCOME Amortization expense $ 38,352 $ 77,270 Stock-based compensation 18,567 32,815 Deferred acquisition consideration 8,837 19,091 Other items, net 25,782 36,992 Total add-backs 91,538 166,168 Adjusted tax expense (22,157) (40,393) $69,381 $125,775
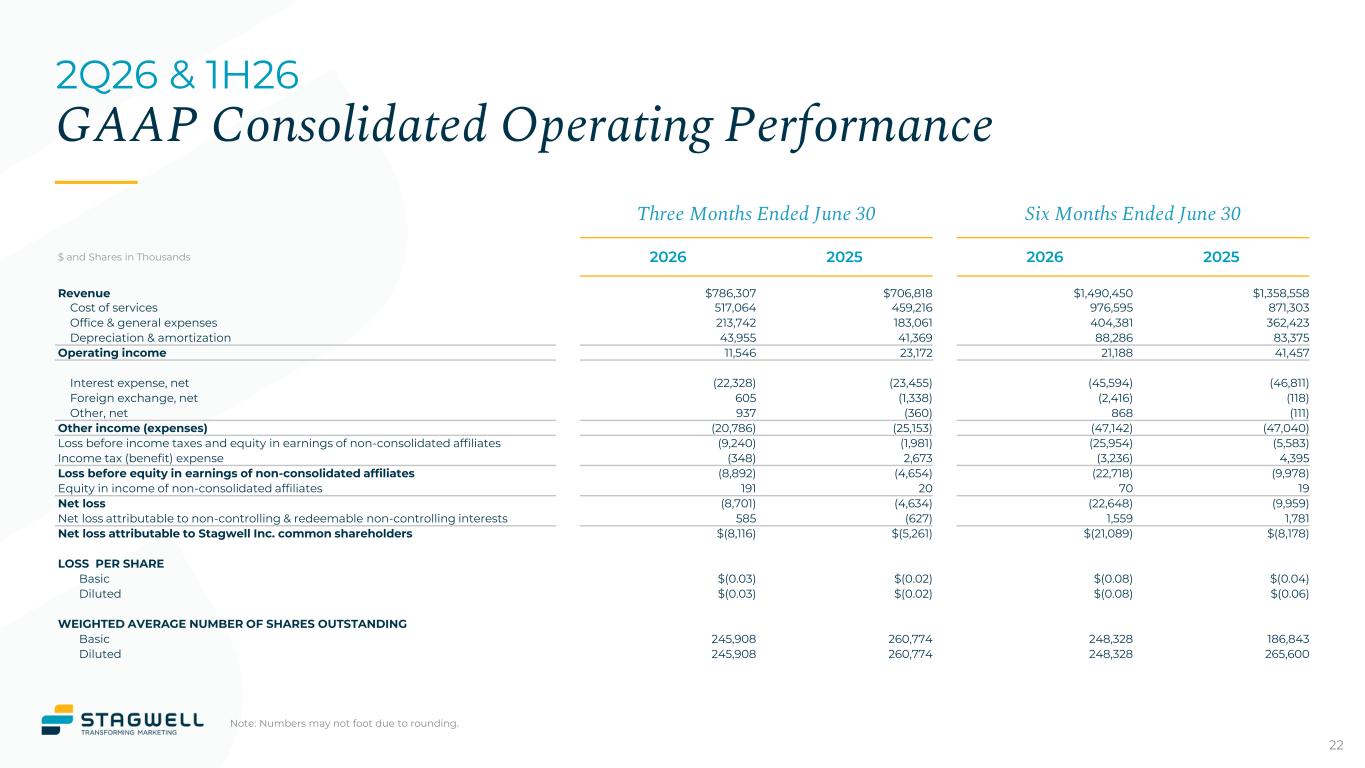
22 2Q26 & 1H26 GAAP Consolidated Operating Performance Note: Numbers may not foot due to rounding. Three Months Ended June 30 Six Months Ended June 30 $ and Shares in Thousands 2026 2025 2026 2025 Revenue $786,307 $706,818 $1,490,450 $1,358,558 Cost of services 517,064 459,216 976,595 871,303 Office & general expenses 213,742 183,061 404,381 362,423 Depreciation & amortization 43,955 41,369 88,286 83,375 Operating income 11,546 23,172 21,188 41,457 Interest expense, net (22,328) (23,455) (45,594) (46,811) Foreign exchange, net 605 (1,338) (2,416) (118) Other, net 937 (360) 868 (111) Other income (expenses) (20,786) (25,153) (47,142) (47,040) Loss before income taxes and equity in earnings of non-consolidated affiliates (9,240) (1,981) (25,954) (5,583) Income tax (benefit) expense (348) 2,673 (3,236) 4,395 Loss before equity in earnings of non-consolidated affiliates (8,892) (4,654) (22,718) (9,978) Equity in income of non-consolidated affiliates 191 20 70 19 Net loss (8,701) (4,634) (22,648) (9,959) Net loss attributable to non-controlling & redeemable non-controlling interests 585 (627) 1,559 1,781 Net loss attributable to Stagwell Inc. common shareholders $(8,116) $(5,261) $(21,089) $(8,178) LOSS PER SHARE Basic $(0.03) $(0.02) $(0.08) $(0.04) Diluted $(0.03) $(0.02) $(0.08) $(0.06) WEIGHTED AVERAGE NUMBER OF SHARES OUTSTANDING Basic 245,908 260,774 248,328 186,843 Diluted 245,908 260,774 248,328 265,600
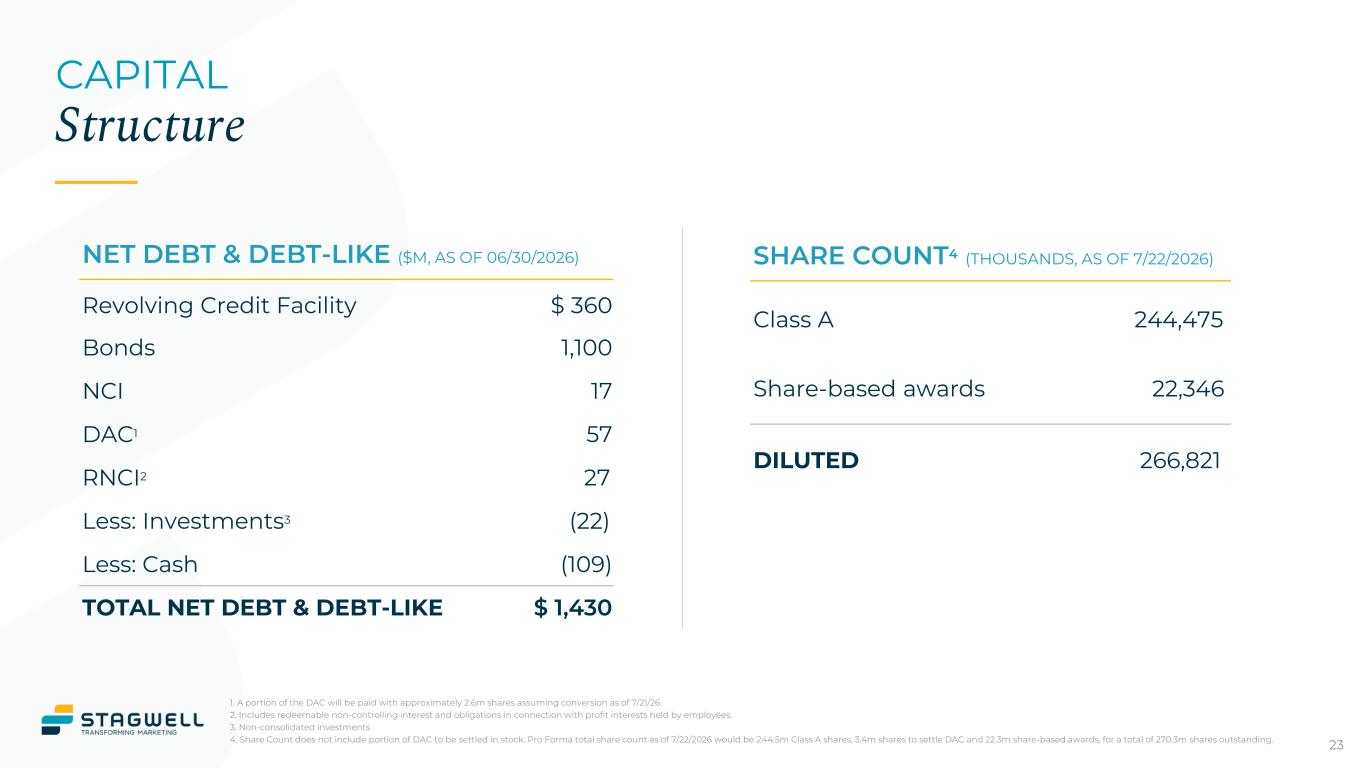
23 CAPITAL Structure 1. A portion of the DAC will be paid with approximately 2.6m shares assuming conversion as of 7/21/26. 2. Includes redeemable non-controlling interest and obligations in connection with profit interests held by employees. 3. Non-consolidated investments 4. Share Count does not include portion of DAC to be settled in stock. Pro Forma total share count as of 7/22/2026 would be 244.5m Class A shares, 3.4m shares to settle DAC and 22.3m share-based awards, for a total of 270.3m shares outstanding. NET DEBT & DEBT-LIKE ($M, AS OF 06/30/2026) Revolving Credit Facility $ 360 Bonds 1,100 NCI 17 DAC1 57 RNCI2 27 Less: Investments3 (22) Less: Cash (109) TOTAL NET DEBT & DEBT-LIKE $ 1,430 SHARE COUNT4 (THOUSANDS, AS OF 7/22/2026) Class A 244,475 Share-based awards 22,346 DILUTED 266,821
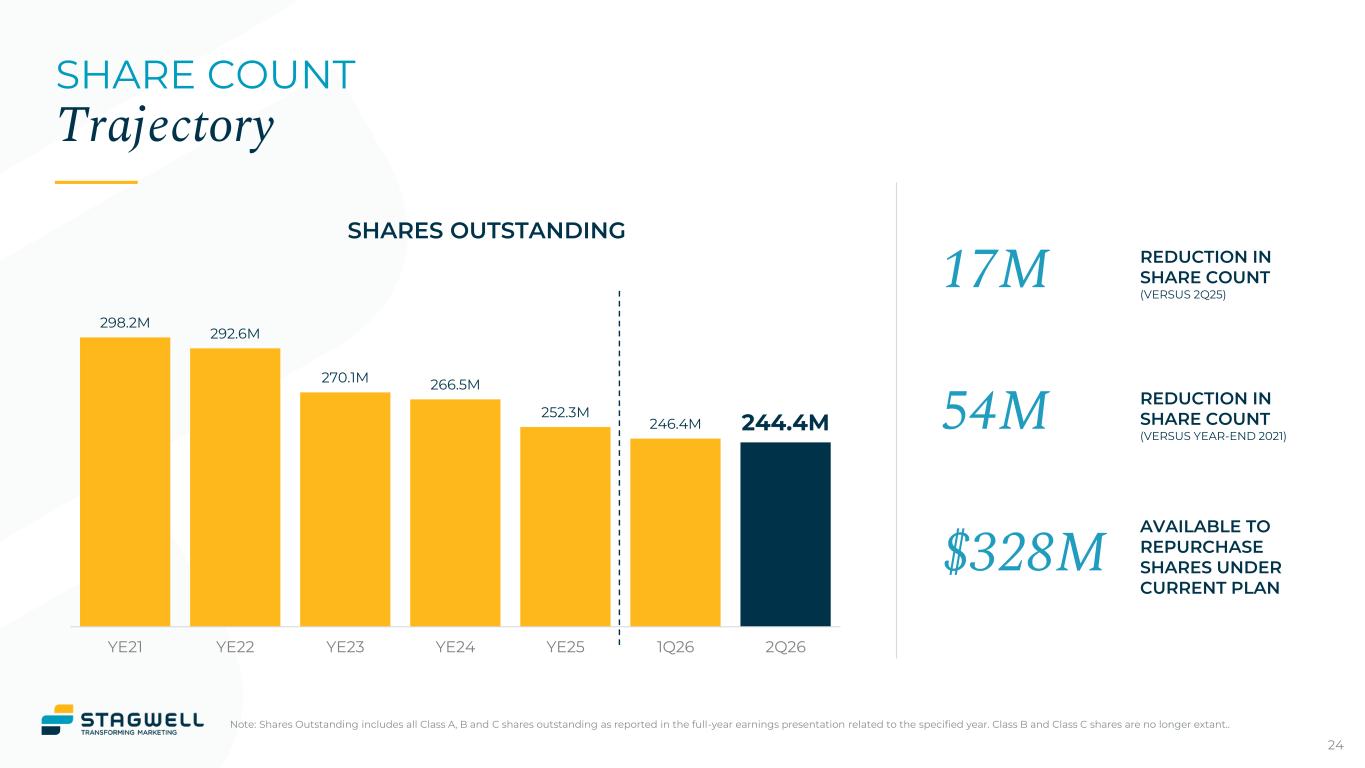
24 SHARE COUNT Trajectory Note: Shares Outstanding includes all Class A, B and C shares outstanding as reported in the full-year earnings presentation related to the specified year. Class B and Class C shares are no longer extant.. 298.2M 292.6M 270.1M 266.5M 252.3M 246.4M 244.4M YE21 YE22 YE23 YE24 YE25 1Q26 2Q26 SHARES OUTSTANDING 17M REDUCTION IN SHARE COUNT (VERSUS 2Q25) 54M REDUCTION IN SHARE COUNT (VERSUS YEAR-END 2021) $328M AVAILABLE TO REPURCHASE SHARES UNDER CURRENT PLAN