
THRY 8-K
Thryv Holdings, Inc. (THRY)
8-K
2021-05-13
For: 2021-05-13
View Original
Added on
April 07, 2026
SECURITIES AND EXCHANGE COMMISSION
WASHINGTON, DC 20549
FORM 8-K
CURRENT REPORT
Pursuant to Section 13 or 15(d) of the
Securities Exchange Act of 1934
Date of Report (Date of earliest event reported) (May 13, 2021)
THRYV HOLDINGS, INC.
(Exact name of registrant as specified in its charter)
|
Delaware
|
001-35895
|
13-2740040
|
|
(State or Other Jurisdiction of Incorporation)
|
(Commission File Number)
|
(IRS Employer Identification No.)
|
|
2200 West Airfield Drive
P.O. Box 619810
DFW Airport, Texas
|
75261
|
|
|
(Address of Principal Executive Offices)
|
(Zip Code)
|
(972) 453-7000
(Registrant’s telephone number, including area code)
Check the appropriate box below if the Form 8-K filing is intended to simultaneously satisfy the filing obligation of the registrant under any of the following provisions (see General
Instruction A.2. below):
| ☐ |
Written communications pursuant to Rule 425 under the Securities Act (17 CFR 230.425)
|
| ☐ |
Soliciting material pursuant to Rule 14a-12 under the Exchange Act (17 CFR 240.14a-12)
|
| ☐ |
Pre-commencement communications pursuant to Rule 14d-2(b) under the Exchange Act (17 CFR 240.14d-2(b))
|
| ☐ |
Pre-commencement communications pursuant to Rule 13e-4(c) under the Exchange Act (17 CFR 240.13e-4(c))
|
Securities registered pursuant to Section 12(b) of the Act:
|
Title of each class
|
Trading Symbol(s)
|
Name of each exchange on which
registered
|
|
Common Stock, $0.01 par value
|
THRY
|
Nasdaq Capital Market
|
Indicate by check mark whether the registrant is an emerging growth company as defined in Rule 405 of the Securities Act of 1933 (17 CFR §230.405) or Rule 12b-2 of the Securities Exchange Act of 1934 (17 CFR §240.12b-2).
Emerging growth company ☐
If an emerging growth company, indicate by check mark if the registrant has elected not to use the extended transition period for complying with any new or revised financial accounting standards provided pursuant to
Section 13(a) of the Exchange Act. ☐
| Item 2.02. |
Results of Operations and Financial Condition.
|
On May 13, 2021, Thryv Holdings, Inc. (the “Company”) issued a press release announcing its earnings for the quarter ended March 31, 2021. This press release is attached as Exhibit 99.1 and is incorporated herein by reference.
| Item 7.01. |
Regulation FD Disclosure.
|
The Company will hold a conference call on May 13, 2021. A copy of the slide materials to be discussed at the conference call is being furnished as Exhibit 99.2, and is incorporated herein by reference and available on the Company’s website.
The information in Item 2.02 and Item 7.01 of this Current Report is being furnished and shall not be deemed “filed” for the purposes of Section 18 of the Securities Exchange Act of 1934, as amended, or otherwise subject to the liabilities of
that Section. The information in Item 2.02 and Item 7.01 of this Current Report shall not be incorporated by reference into any registration statement or other document pursuant to the Securities Act of 1933, as amended.
| Item 9.01. |
Financial Statements and Exhibits.
|
(d) Exhibits. The following exhibits are filed with this document:
|
Exhibit Number
|
Description
|
|
Press release, dated May 13, 2021, issued by Thryv Holdings, Inc.
|
|
|
Investor Supplement.
|
SIGNATURE
Pursuant to the requirements of the Securities Exchange Act of 1934, the registrant has duly caused this report to be signed on its behalf by the undersigned hereunto duly authorized.
|
THRYV HOLDINGS, INC.
|
|||
|
Date: May 13, 2021
|
By:
|
/s/ Paul D. Rouse
|
|
|
Name: Paul D. Rouse
|
|||
|
Title: Chief Financial Officer, Executive Vice
President and Treasurer
|
|||
Exhibit 99.1
Thryv Raises SaaS Revenue Guidance, Releases ThryvPay Mobile
App and Reports First Quarter 2021 Financial Results
SaaS Revenue Grows 17% Year-Over-Year
Strong SaaS Metrics show upward trajectory of Thryv software business
DALLAS, May 13, 2021– Thryv Holdings, Inc. (NASDAQ:THRY) (“Thryv” or the “Company”), the provider of Thryv® software, the end-to-end client experience platform for growing small
businesses, announced financial results for the first quarter 2021. The Company has also raised its 2021 outlook for its SaaS segment.
“Our strong Q1 performance confirms we are offering the right solution for small businesses,” said Joe Walsh, CEO and president of Thryv. “As a result of our execution, we are raising our SaaS revenue guidance for 2021 and remain well-positioned
to capitalize on the market opportunity.”
Today, we announced the release of our ThryvPaySM mobile app. This easy to use mobile payment app is ideally suited to the needs of service-based businesses and is now available at no monthly charge. It also offers added
convenience for our Thryv platform subscribers. We are pleased to offer this app free of charge for small businesses and provide the option for frictionless upgrades to the full Thryv platform when the time is right.”
First Quarter 2021 Financial Highlights (1):
| ● |
U.S. SaaS revenue was $37.3 million, a 17% increase year-over-year
|
| ● |
U.S. Marketing Services revenue was $227.9 million
|
| ● |
Thryv International Marketing Services revenue was $15.4 million
|
| ● |
Consolidated total revenue was $280.6 million
|
| ● |
Consolidated net income was $36.5 million
|
| ● |
Consolidated adjusted EBITDA was $104.9 million, representing an adjusted EBITDA margin of 37.4%
|
| ● |
Consolidated gross profit was $182.4 million
|
| ● |
Consolidated adjusted gross profit was $193.8 million
|
| (1) |
Consolidated results include Sensis results subsequent to the March 1, 2021 acquisition date.
|
Additional US Business Highlights
| ● |
SaaS ARPU increased to $304 for the first quarter of 2021, compared to $240 in the first quarter of 2020
|
| ● |
Total SaaS clients increased sequentially to 44.5 thousand for the first quarter of 2021
|
| ● |
SaaS monthly churn was 2.5% for the first quarter of 2021, compared to 3.4% in the first quarter of 2020
|
| ● |
Net Dollar Retention improved 16 percentage points to 89% at end of the first quarter of 2021, when compared to the first quarter of 2020
|
| ● |
SaaS active users and usage frequency reached new all-time high as daily and weekly active users increased 44% year-over-year
|
| ● |
SaaS average time-in-app reaches new all-time high and increases 103% year-over-year
|
| ● |
On March 1st, the Company acquired Sensis Holdings, the leading Australian marketing services company
|
Outlook:
The Company is updating guidance for fiscal year 2021 as indicated below.
| • |
U.S SaaS revenue guidance range raised to $151 – $153 million, up from the previously announced $140 - $145 million
|
| • |
| • |
Thryv International, which reflects the acquisition of Sensis Holdings, expects revenue in the range of AUD $180 to $200 million for the 10 months of 2021 ownership (Sensis Holdings acquired March 1, 2021)
|
Please note: All GAAP financials now include Sensis for the month of March 2021 only.
These statements are forward-looking and actual results may materially differ. Refer to the “Forward-Looking Statements” section below for information on the factors that could cause our actual results to materially
differ from these forward-looking statements.
Earnings Conference Call Information
Thryv will host a conference call on Thursday, May 13, 2021 at 8:30 a.m. (Eastern Time) to discuss the Company's first quarter 2021 results. The conference call will be available via the Internet at www.thryv.com. There will be several slides
accompanying the webcast. Please go to the website at least 15 minutes prior to the call to register, download and install any necessary software. The recorded webcast will also be available on the Company's website.
If you are unable to participate in the conference call, a replay will be available. To access the replay, please dial (800) 585-8367 or (416) 621-4642 and enter "7068595."
Final Results
Thryv Holdings, Inc. and Subsidiaries
Condensed Consolidated Statements of Operations
(in thousands, except share and per share data)
(unaudited)
|
Three Months Ended March 31,
|
||||||||
|
2021
|
2020
|
|||||||
|
Revenue
|
$
|
280,606
|
$
|
318,570
|
||||
|
Cost of services
|
98,160
|
117,976
|
||||||
|
Gross profit
|
182,446
|
200,594
|
||||||
|
Operating expenses:
|
||||||||
|
Sales and marketing
|
76,540
|
89,292
|
||||||
|
General and administrative
|
41,279
|
49,562
|
||||||
|
Impairment charges
|
—
|
98
|
||||||
|
Total operating expenses
|
117,819
|
138,952
|
||||||
|
Operating income
|
64,627
|
61,642
|
||||||
|
Other income (expense):
|
||||||||
|
Interest expense
|
(11,607
|
)
|
(14,780
|
)
|
||||
|
Interest expense, related party
|
(4,065
|
)
|
(5,150
|
)
|
||||
|
Other components of net periodic pension cost
|
453
|
(201
|
)
|
|||||
|
Other expense
|
(1,093
|
)
|
—
|
|||||
|
Income before (provision) for income taxes
|
48,315
|
41,511
|
||||||
|
(Provision) for income taxes
|
(11,809
|
)
|
(13,409
|
)
|
||||
|
Net income
|
$
|
36,506
|
$
|
28,102
|
||||
|
Net income per common share:
|
||||||||
|
Basic
|
$
|
1.10
|
$
|
0.86
|
||||
|
Diluted
|
$
|
1.07
|
$
|
0.80
|
||||
|
Weighted-average shares used in computing basic and diluted net income per common share:
|
||||||||
|
Basic
|
33,108,422
|
32,578,286
|
||||||
|
Diluted
|
34,013,480
|
35,026,526
|
||||||
Thryv Holdings, Inc. and Subsidiaries
Condensed Consolidated Balance Sheets
(in thousands, except share data)
(unaudited)
|
March 31, 2021
|
December 31, 2020
|
|||||||
|
Assets
|
||||||||
|
Current assets
|
||||||||
|
Cash and cash equivalents
|
$
|
29,841
|
$
|
2,406
|
||||
|
Accounts receivable, net of allowance of $34,557 and $33,030
|
354,737
|
296,570
|
||||||
|
Contract assets, net of allowance of $244 and $338
|
9,285
|
10,975
|
||||||
|
Taxes receivable
|
9,154
|
9,229
|
||||||
|
Prepaid expenses and other current assets
|
36,277
|
26,172
|
||||||
|
Indemnification asset
|
24,346
|
24,346
|
||||||
|
Total current assets
|
463,640
|
369,698
|
||||||
|
Fixed assets and capitalized software, net
|
123,281
|
89,044
|
||||||
|
Goodwill
|
679,559
|
609,457
|
||||||
|
Intangible assets, net
|
145,647
|
31,777
|
||||||
|
Deferred tax assets
|
97,941
|
93,099
|
||||||
|
Other assets
|
34,410
|
21,902
|
||||||
|
Total assets
|
$
|
1,544,478
|
$
|
1,214,977
|
||||
|
Liabilities and Stockholders' Equity
|
||||||||
|
Current liabilities
|
||||||||
|
Accounts payable
|
$
|
19,981
|
$
|
8,927
|
||||
|
Accrued liabilities
|
157,537
|
139,613
|
||||||
|
Current portion of unrecognized tax benefits
|
30,417
|
30,022
|
||||||
|
Contract liabilities
|
47,909
|
18,942
|
||||||
|
New Term Loan, current
|
70,000
|
—
|
||||||
|
Other current liabilities
|
20,324
|
9,896
|
||||||
|
Total current liabilities
|
346,168
|
207,400
|
||||||
|
New Term Loan, net
|
372,454
|
—
|
||||||
|
New Term Loan, related party
|
234,098
|
—
|
||||||
|
Senior Term Loan, net
|
—
|
335,683
|
||||||
|
Senior Term Loan, related party
|
—
|
113,482
|
||||||
|
ABL Facility
|
43,682
|
79,238
|
||||||
|
Leaseback obligations
|
54,585
|
54,798
|
||||||
|
Pension obligations, net
|
184,642
|
190,827
|
||||||
|
Deferred tax liabilities
|
30,706
|
508
|
||||||
|
Other liabilities
|
48,947
|
36,266
|
||||||
|
Total long-term liabilities
|
969,114
|
810,802
|
||||||
|
Commitments and contingencies
|
||||||||
|
Stockholders' equity
|
||||||||
|
Common stock - $0.01 par value, 250,000,000 shares authorized; 59,806,077, shares issued and 33,127,667 shares outstanding at March 31, 2021; and 59,590,422 shares issued and 32,912,012
shares outstanding at December 31, 2020
|
598
|
596
|
||||||
|
Additional paid-in capital
|
1,058,504
|
1,059,624
|
||||||
|
Treasury stock - 26,678,410 shares at March 31, 2021 and December 31, 2020
|
(468,613
|
)
|
(468,613
|
)
|
||||
|
Accumulated other comprehensive income (loss)
|
(2,967
|
)
|
—
|
|||||
|
Accumulated deficit
|
(358,326
|
)
|
(394,832
|
)
|
||||
|
Total stockholders' equity
|
229,196
|
196,775
|
||||||
|
Total liabilities and stockholders' equity
|
$
|
1,544,478
|
$
|
1,214,977
|
||||
Thryv Holdings, Inc. and Subsidiaries
Condensed Consolidated Statements of Cash Flows
(in thousands)
(unaudited)
|
Three Months Ended March 31,
|
||||||||
|
2021
|
2020
|
|||||||
|
Cash Flows from Operating Activities
|
||||||||
|
Net income
|
$
|
36,506
|
$
|
28,102
|
||||
|
Adjustments to reconcile net income to net cash provided by operating activities:
|
||||||||
|
Depreciation and amortization
|
19,718
|
37,823
|
||||||
|
Amortization of debt issuance costs
|
433
|
267
|
||||||
|
Deferred income taxes
|
(13,249
|
)
|
(15,911
|
)
|
||||
|
Provision for credit losses
|
2,018
|
10,588
|
||||||
|
Provision for service credits
|
4,528
|
6,736
|
||||||
|
Stock-based compensation expense (benefit)
|
1,971
|
(6,064
|
)
|
|||||
|
Other components of net periodic pension cost
|
(453
|
)
|
201
|
|||||
|
Loss on early extinguishment of debt
|
299
|
—
|
||||||
|
Loss on disposal/write-off of fixed assets and capitalized software
|
15
|
2,962
|
||||||
|
Impairment charges
|
—
|
98
|
||||||
|
Non-cash loss from remeasurement of indemnification asset
|
—
|
3,801
|
||||||
|
Gain (loss) on foreign currency exchange rates
|
835
|
—
|
||||||
|
Other, net
|
6
|
—
|
||||||
|
Changes in working capital items, excluding acquisitions:
|
||||||||
|
Accounts receivable
|
26,846
|
(8,921
|
)
|
|||||
|
Contract assets
|
1,446
|
(522
|
)
|
|||||
|
Prepaid expenses and other assets
|
(10,998
|
)
|
(4,583
|
)
|
||||
|
Accounts payable and accrued liabilities
|
(67,458
|
)
|
(33,981
|
)
|
||||
|
Accrued income taxes, net
|
9,597
|
30,351
|
||||||
|
Operating lease liability
|
(403
|
)
|
(2,620
|
)
|
||||
|
Contract liabilities
|
2,547
|
(2,685
|
)
|
|||||
|
Net cash provided by operating activities
|
14,204
|
45,642
|
||||||
|
Cash Flows from Investing Activities
|
||||||||
|
Additions to fixed assets and capitalized software
|
(3,668
|
)
|
(9,122
|
)
|
||||
|
Proceeds from the sale of building and fixed assets
|
—
|
1,502
|
||||||
|
Acquisition of a business, net of cash acquired
|
(174,190
|
)
|
—
|
|||||
|
Net cash (used in) investing activities
|
(177,858
|
)
|
(7,620
|
)
|
||||
|
Cash Flows from Financing Activities
|
||||||||
|
Proceeds from New Term Loan
|
418,070
|
—
|
||||||
|
Proceeds from New Term Loan, related party
|
260,930
|
—
|
||||||
|
Payments of Senior Term Loan
|
(335,821
|
)
|
(23,445
|
)
|
||||
|
Payments of Senior Term Loan, related party
|
(113,789
|
)
|
(10,555
|
)
|
||||
|
Proceeds from ABL Facility
|
249,936
|
329,719
|
||||||
|
Payments of ABL Facility
|
(285,492
|
)
|
(312,624
|
)
|
||||
|
Purchase of treasury stock
|
—
|
(21,770
|
)
|
|||||
|
Other
|
(2,038
|
)
|
(56
|
)
|
||||
|
Net cash provided by (used in) financing activities
|
191,796
|
(38,731
|
)
|
|||||
|
Effect of exchange rate changes on cash and cash equivalents
|
(707
|
)
|
—
|
|||||
|
Increase (decrease) in cash and cash equivalents
|
27,435
|
(709
|
)
|
|||||
|
Cash and cash equivalents, beginning of period
|
2,406
|
1,912
|
||||||
|
Cash and cash equivalents, end of period
|
$
|
29,841
|
$
|
1,203
|
||||
|
Supplemental Information
|
||||||||
|
Cash paid for interest
|
$
|
17,286
|
$
|
20,802
|
||||
|
Cash paid (received) for income taxes, net
|
$
|
15,753
|
$
|
(1,031
|
)
|
|||
|
Three Months Ended March 31, 2021
|
||||||||||||||||
|
Marketing
Services
|
SaaS
|
Thryv
International
|
Total
|
|||||||||||||
|
Revenue
|
$
|
227,933
|
$
|
37,251
|
$
|
15,422
|
$
|
280,606
|
||||||||
|
Segment EBITDA
|
98,631
|
316
|
5,986
|
104,933
|
||||||||||||
Non-GAAP Measures
Our results included in this press release include Adjusted EBITDA and Adjusted Gross Profit, which are not presented in accordance with U.S. generally accepted accounting principles (“GAAP”). These non-GAAP
measures are presented for supplemental informational purposes only and are not intended to be considered in isolation or as a substitute for, or superior to, financial information prepared and presented in accordance with GAAP. Please refer to the
supplemental information presented in the tables below for a reconciliation of Adjusted EBITDA to Net income, and Adjusted Gross Profit to gross profit. Both Net income and Gross profit are the most comparable GAAP financial measure to Adjusted
EBITDA and Adjusted Gross Profit, respectively.
We believe that these non-GAAP financial measures provide useful information about our financial performance, enhance the overall understanding of our past performance and future prospects and allow for greater transparency with respect to
important metrics used by our management for financial and operational decision-making. We believe that these measures provide an additional tool for investors to use in comparing our core financial performance over multiple periods with other
companies in our industry. However, it is important to note that the particular items we exclude from, or include in, our non-GAAP financial measures may differ from the items excluded from, or included in, similar non-GAAP financial measures used
by other companies in the same industry.
The following is a reconciliation of Adjusted EBITDA to its most directly comparable GAAP measure, Net income (in thousands):
|
Three Months Ended March 31,
|
||||||||
|
2021
|
2020
|
|||||||
|
Reconciliation of Adjusted EBITDA
|
||||||||
|
Net income
|
$
|
36,506
|
$
|
28,102
|
||||
|
Interest expense
|
15,672
|
19,930
|
||||||
|
Provision for income taxes
|
11,809
|
13,409
|
||||||
|
Depreciation and amortization expense
|
19,718
|
37,823
|
||||||
|
Loss on early extinguishment of debt
|
299
|
—
|
||||||
|
Restructuring and integration expenses (1)
|
9,234
|
9,845
|
||||||
|
Transaction costs (2)
|
10,546
|
6,534
|
||||||
|
Stock-based compensation expense (benefit) (3)
|
1,971
|
(6,064
|
)
|
|||||
|
Other components of net periodic pension (benefit) cost (4)
|
(453
|
)
|
201
|
|||||
|
Non-cash loss from remeasurement of indemnification asset (5)
|
—
|
3,801
|
||||||
|
Impairment charges
|
—
|
98
|
||||||
|
Other (6)
|
(369
|
)
|
(900
|
)
|
||||
|
Adjusted EBITDA
|
$
|
104,933
|
$
|
112,779
|
||||
|
(1)
|
For the three months ended March 31, 2021 and 2020, expenses relate to periodic efforts to enhance efficiencies and reduce costs, and include severance benefits, loss on disposal of fixed assets and capitalized software, and costs
associated with abandoned facilities and system consolidation.
|
| (2) |
Expenses related to the Company's direct listing, Sensis acquisition and other transaction costs.
|
| (3) |
Company records stock-based compensation expense related to the amortization of grant date fair value of the Company’s stock-based compensation awards. Additionally, stock-based compensation expense includes the remeasurement of these
awards at each period end.
|
| (4) |
Other components of net periodic pension cost is from our non-contributory defined benefit pension plans that are currently frozen and incur no additional service costs. The most significant component of other components of net periodic
pension cost relates to the mark to market pension remeasurement.
|
| (5) |
In connection with the YP Acquisition, the seller provided the Company indemnity for future potential losses associated with certain federal and state tax positions taken in tax returns filed by the seller prior to the Acquisition Date.
|
| (6) |
Other primarily includes expenses related to potential non income-based tax liabilities. Additionally, during the three months ended March 31, 2021, other includes foreign exchange related expense of $0.8 million.
|
The following is a reconciliation of Adjusted Gross Profit, to its most directly comparable GAAP measure, Gross profit (in thousands):
|
Three Months Ended March 31,
|
||||||||
|
2021
|
2020
|
|||||||
|
Reconciliation of Adjusted Gross Profit
|
||||||||
|
Gross profit
|
$
|
182,446
|
$
|
200,594
|
||||
|
Plus:
|
||||||||
|
Depreciation and amortization expense
|
11,244
|
18,355
|
||||||
|
Stock-based compensation expense (benefit)
|
81
|
(316
|
)
|
|||||
|
Adjusted Gross Profit
|
$
|
193,771
|
$
|
218,633
|
||||
Forward-Looking Statements
Some statements included in this release constitute forward-looking statements. Statements that include the words “may”, “will”, “could”, “should”, “would”, “believe”, “anticipate”, “forecast”, “estimate”, “expect”, “preliminary”, “intend”,
“plan”, “project”, “outlook”, “future”, “forward”, “guidance” and similar statements of a future or forward-looking nature identify forward-looking statements. These statements are not guarantees of future performance. Forward-looking statements
provide current expectations with respect to our financial performance and future events with respect to our business and industry in general. Forward-looking statements are based on certain assumptions and include any statement that does not
directly relate to any historical or current fact. Accordingly, there are or will be important factors that could cause our actual results to differ materially from those indicated in these statements. We believe that these factors include, but are
not limited to, the risks related to the following: risks related to the ongoing COVID-19 pandemic, the Company’s ability to maintain adequate liquidity to fund operations; the Company’s future operating and financial performance; the Company’s
ability to consummate acquisitions, or, if consummated, to successfully integrate acquired businesses into the Company’s operations, the Company’s ability to recognize the benefits of acquisitions, or the failure of an acquired company to achieve
its plans and objectives; limitations on our operating and strategic flexibility and the ability to operate our business, finance our capital needs or expand business strategies under the terms of our credit facilities; our ability to retain
existing business and obtain and retain new business; general economic or business conditions affecting the markets we serve; declining use of print yellow page directories by consumers; our ability to collect trade receivables from clients to whom
we extend credit; credit risk associated with our reliance on small and medium sized businesses as clients; our ability to attract and retain key managers; increased competition in our markets; our ability to obtain future financing due to changes
in the lending markets or our financial position; our ability to maintain agreements with major Internet search and local media companies; reduced advertising spending and increased contract cancellations by our clients, which causes reduced
revenue; and our ability to anticipate or respond effectively to changes in technology and consumer preferences. All subsequent written and oral forward-looking statements attributable to us or persons acting on our behalf are expressly qualified
in their entirety by such cautionary statements.
If one or more events related to these or other risks or uncertainties materialize, or if our underlying assumptions prove to be incorrect, actual results may differ materially from what we anticipate. For these reasons, we caution you against
relying on forward-looking statements. All forward-looking statements included in this press release are expressly qualified in their entirety by the foregoing cautionary statements. These forward-looking statements speak only as of the date hereof
and, other than as required by law, we undertake no obligation to publicly update or revise any forward-looking statements, whether as a result of new information, future events or otherwise.
Thryv Holdings, Inc. owns the easy-to-use Thryv® end-to-end customer experience software built for growing small to medium sized businesses (SMBs) that helps over 40,000 SaaS clients with the daily demands of
running a business. With Thryv®, SMBs can get the job, manage the job and get credit. Thryv’s award-winning platform provides modernized business functions, allowing SMBs to reach more customers,
stay organized, get paid faster and generate reviews. These functions include building a digital customer database, automated marketing through email and text, updating business listings across the internet, scheduling online appointments,
sending notifications and reminders, managing ratings and reviews, generating estimates and invoices, and processing payments.
Thryv supports franchise operators and multi-location business owners with Hub by Thryv™, a software console that enables businesses managers to oversee their operations using the Thryv® software.
Thryv also connects local businesses to consumer services through our search, display and social media management products, our print directories featuring The Real Yellow Pages® tagline, and our local search
portals, which operate under the DexKnows.com®, Superpages.com® and Yellowpages.com URLs and reach some 35 million monthly visitors. For more information about the company, visit thryv.com.
Thryv delivers business services to more than 400,000 SMBs worldwide that enable these SMBs to compete and win in today’s economy.
On March 1, 2021, Thryv announced it closed the acquisition of Sensis, Australia’s leading digital, marketing and directory services provider, which helps Australians connect and engage through its leading platforms, digital
consumer businesses (Yellow, White Pages, True Local and Whereis), search engine marketing and optimization services, website products, social, data and mapping solutions, and through its digital agency Found. Sensis is also Australia’s largest
print directory publisher including the Yellow and White Pages.
Headquartered in Melbourne, Sensis has a sales presence in all states and territories across Australia.
Media Contact:
Paige Blankenship
Thryv, Inc.
972.453.3012
Will Clarke
Sensis
+61 (0) 488 345 464
Investor Contacts:
Cameron Lessard
Thryv, Inc.
214.773.7022
KJ Christopher
Thryv, Inc.
972.453.7068
###
Exhibit 99.2
Investor SupplementFirst Quarter 2021
Safe Harbor This Presentation may include certain forward-looking statements, including, without
limitation, statements concerning the conditions of our industry and our operations, performance, and financial condition, including, in particular, statements relating to our business, growth strategies, product development efforts, and
future expenses. Forward-looking statements can be identified by words such as ‘‘anticipates,’’ ‘‘intends,’’ ‘‘plans,’’ ‘‘seeks,’’ ‘‘believes,’’ ‘‘estimates,’’ ‘‘expects,’’ and similar references to future periods, or by the inclusion of
forecasts or projections. Forward-looking statements are based on our current expectations and assumptions regarding our business, the economy, and other future conditions. Because forward-looking statements relate to the future, by their
nature, they are subject to inherent uncertainties and risks (some of which are beyond our control) and changes in circumstances or other assumptions that may cause actual results or performance to be materially different from those expressed
or implied by these forward-looking statements. As a result, our actual results may differ materially from those contemplated by the forward-looking statements. Except as required by law, we are under no obligation to, and expressly disclaim
any obligation to, update or alter any forward-looking statements whether as a result of any such changes, new information, subsequent events or otherwise.Market data and industry information used throughout this Presentation are based on
management’s knowledge of the industry and the good faith estimates of management. We also relied, to the extent available, upon management’s review of independent industry surveys and publications and other publicly available information
prepared by a number of third party sources. All of the market data and industry information used in this Presentation involves a number of assumptions and limitations, and you are cautioned not to give undue weight to such estimates.
Although we believe that these sources are reliable, we cannot guarantee the accuracy or completeness of this information, and we have not independently verified this information. While we believe the estimated market position, market
opportunity and market size information included in this presentation are generally reliable, such information, which is derived in part from management’s estimates and beliefs, is inherently uncertain and imprecise. Projections, assumptions
and estimates of our future performance and the future performance of the industry in which we operate are necessarily subject to a high degree of uncertainty and risk due to a variety of factors. These factors could cause results to differ
materially from those expressed in our estimates and beliefs and in the estimates prepared by independent parties. You should not construe the contents of this Presentation as legal, tax, accounting or investment advice or a recommendation to
take (or refrain from taking) any particular action. You should consult your own counsel and tax and financial advisors as to legal and related matters concerning the matters described herein.In addition to financial measures prepared in
accordance with U.S. generally accepted accounting principles (“GAAP”), this press release and the accompanying tables contain, and the conference call will contain, non-GAAP financial measures. We present non-GAAP measures including:
adjusted EBITDA, and adjusted EBITDA margin. The non-GAAP financial information is presented for supplemental informational purposes only and is not intended to be considered in isolation or as a substitute for, or superior to, financial
information prepared and presented in accordance with GAAP. Please refer to the supplemental information presented in the tables for reconciliations of the non-GAAP financial measures used in this press release to the most comparable GAAP
financial measures.We believe that these non-GAAP financial measures provide useful information about our financial performance, enhance the overall understanding of our past performance and future prospects and allow for greater transparency
with respect to important metrics used by our management for financial and operational decision-making. We believe that these measures provide an additional tool for investors to use in comparing our core financial performance over multiple
periods with other companies in our industry. However, it is important to note that the particular items we exclude from, or include in, our non-GAAP financial measures may differ from the items excluded from, or included in, similar non-GAAP
financial measures used by other companies in the same industry. 2
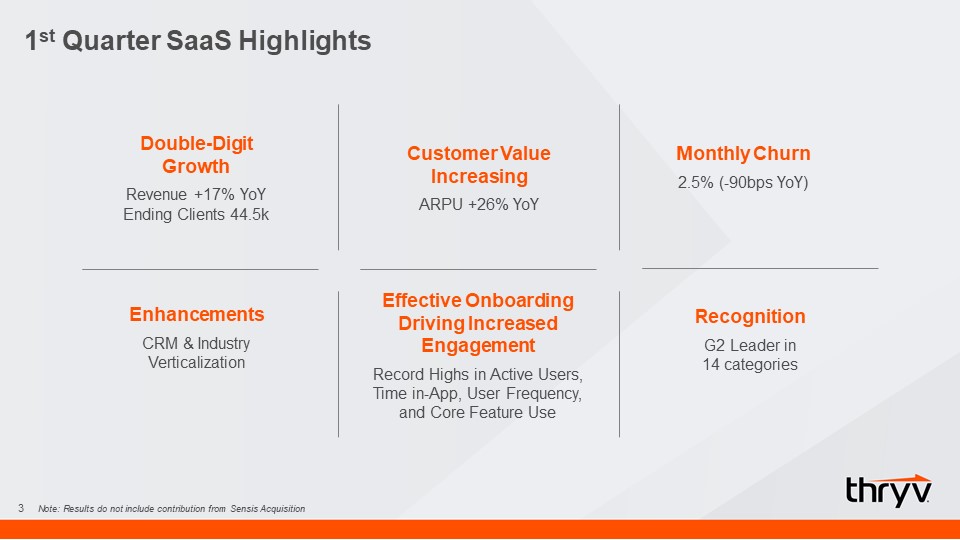
1st Quarter SaaS Highlights 3 Double-Digit GrowthRevenue +17% YoYEnding Clients 44.5k RecognitionG2
Leader in 14 categories Monthly Churn2.5% (-90bps YoY) Customer Value IncreasingARPU +26% YoY EnhancementsCRM & Industry Verticalization Effective Onboarding Driving Increased EngagementRecord Highs in Active Users, Time in-App, User
Frequency, and Core Feature Use Note: Results do not include contribution from Sensis Acquisition
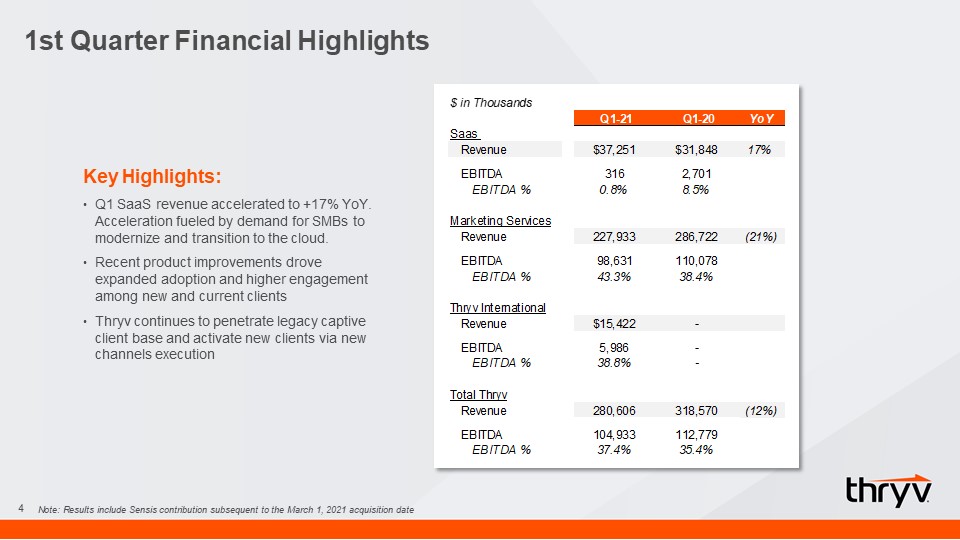
1st Quarter Financial Highlights 4 Key Highlights:Q1 SaaS revenue accelerated to +17% YoY.
Acceleration fueled by demand for SMBs to modernize and transition to the cloud. Recent product improvements drove expanded adoption and higher engagement among new and current clientsThryv continues to penetrate legacy captive client base
and activate new clients via new channels execution Note: Results include Sensis contribution subsequent to the March 1, 2021 acquisition date
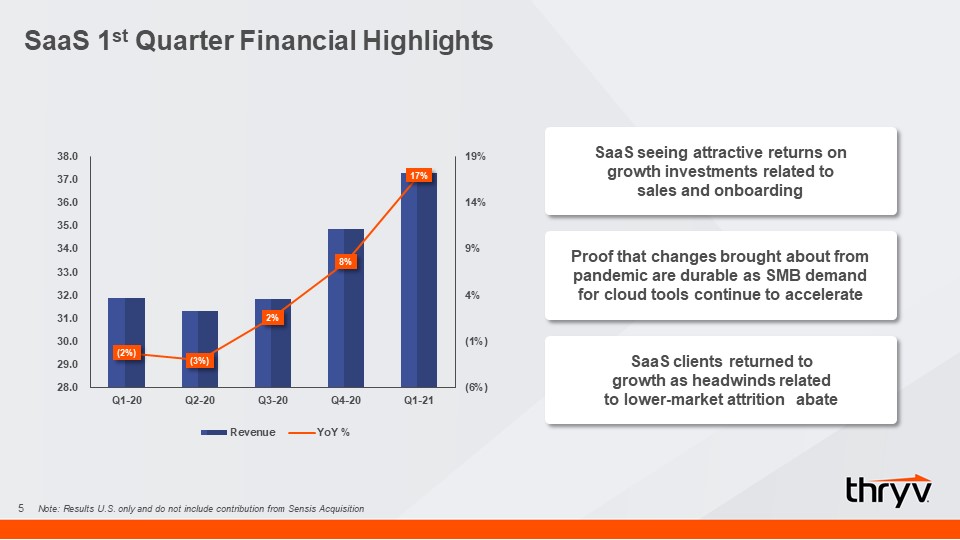
SaaS 1st Quarter Financial Highlights 5 SaaS seeing attractive returns on growth investments
related to sales and onboarding Proof that changes brought about from pandemic are durable as SMB demand for cloud tools continue to accelerate SaaS clients returned to growth as headwinds related to lower-market attrition abate Note:
Results U.S. only and do not include contribution from Sensis Acquisition
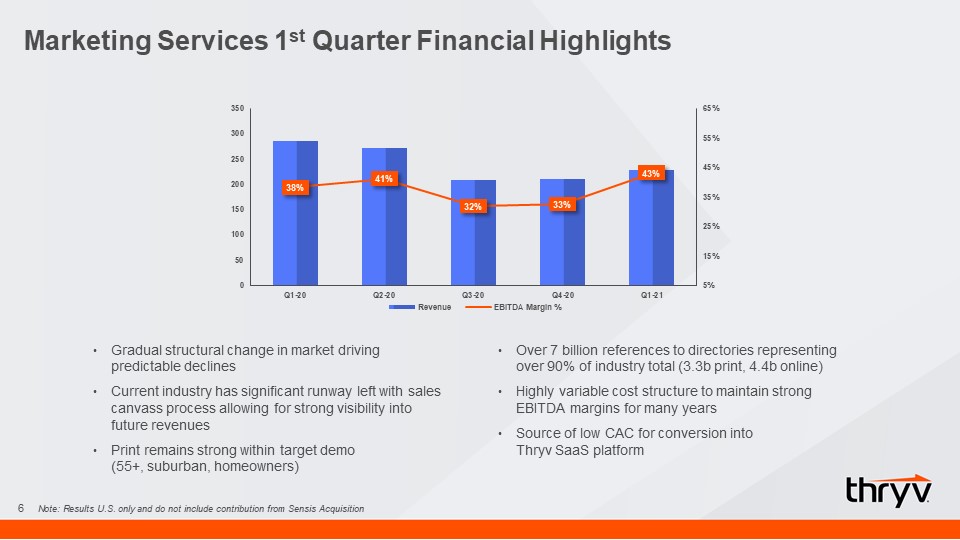
Marketing Services 1st Quarter Financial Highlights 6 Gradual structural change in market driving
predictable declines Current industry has significant runway left with sales canvass process allowing for strong visibility into future revenuesPrint remains strong within target demo (55+, suburban, homeowners)Over 7 billion references to
directories representing over 90% of industry total (3.3b print, 4.4b online)Highly variable cost structure to maintain strong EBITDA margins for many years Source of low CAC for conversion into Thryv SaaS platform Note: Results U.S. only
and do not include contribution from Sensis Acquisition
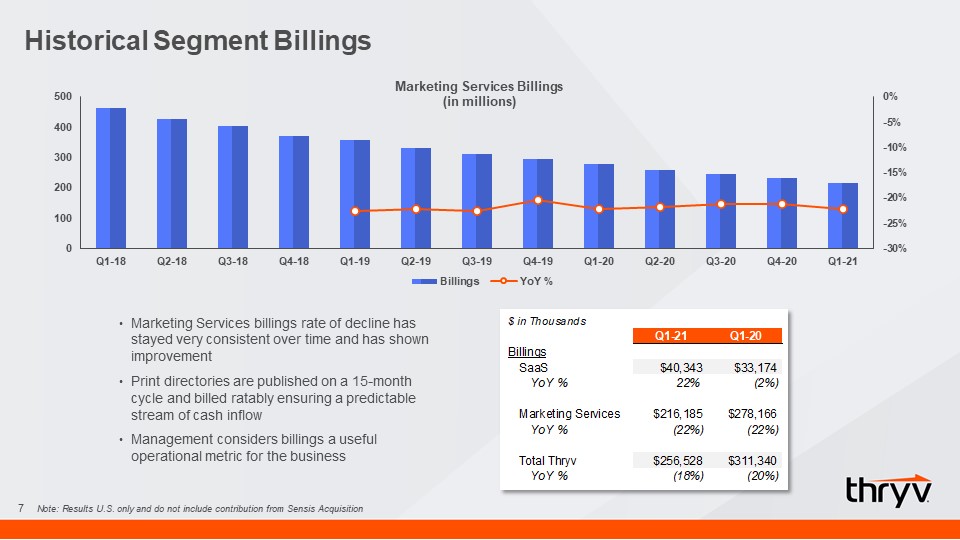
Historical Segment Billings 7 Marketing Services billings rate of decline has stayed very consistent
over time and has shown improvementPrint directories are published on a 15-month cycle and billed ratably ensuring a predictable stream of cash inflowManagement considers billings a useful operational metric for the business Note: Results
U.S. only and do not include contribution from Sensis Acquisition
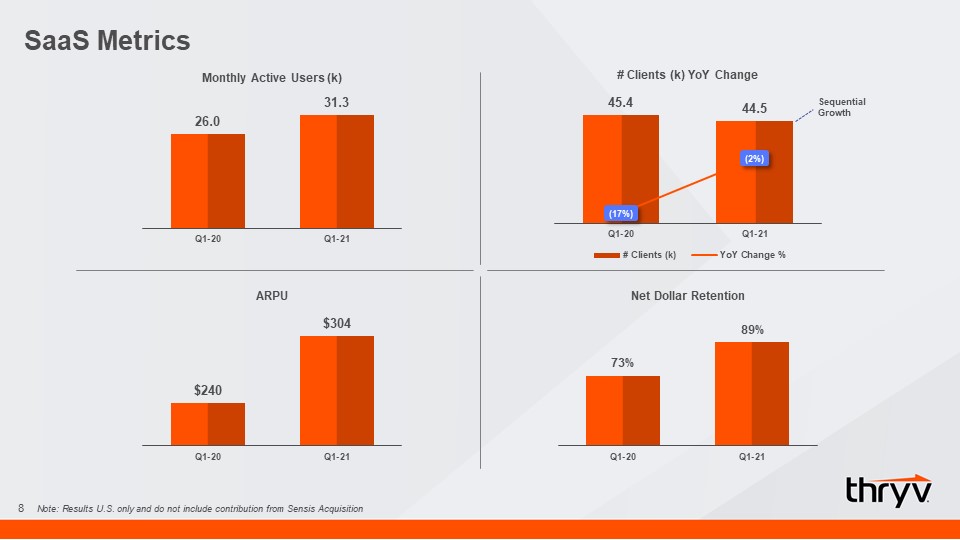
SaaS Metrics 8 Sequential Growth Note: Results U.S. only and do not include contribution from Sensis
Acquisition
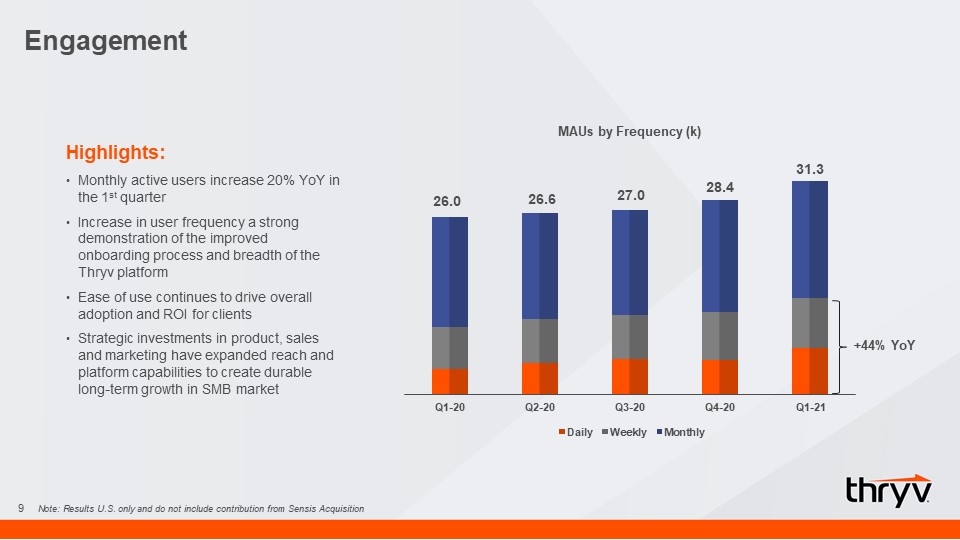
Engagement 9 26.0 31.3 +44% YoY Highlights:Monthly active users increase 20% YoY in the 1st
quarterIncrease in user frequency a strong demonstration of the improved onboarding process and breadth of the Thryv platformEase of use continues to drive overall adoption and ROI for clientsStrategic investments in product, sales and
marketing have expanded reach and platform capabilities to create durable long-term growth in SMB market 28.4 27.0 26.6 Note: Results U.S. only and do not include contribution from Sensis Acquisition
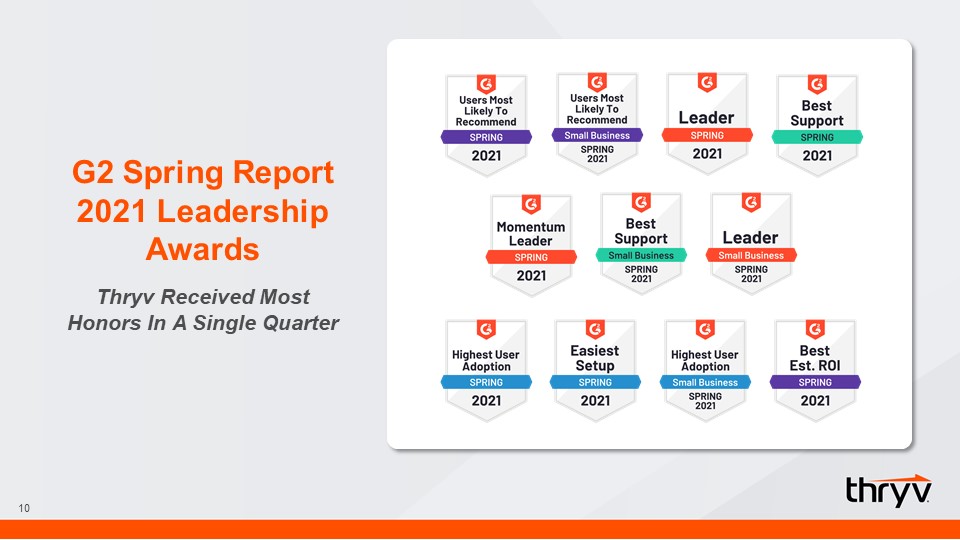
10 G2 Spring Report 2021 Leadership AwardsThryv Received Most Honors In A Single Quarter
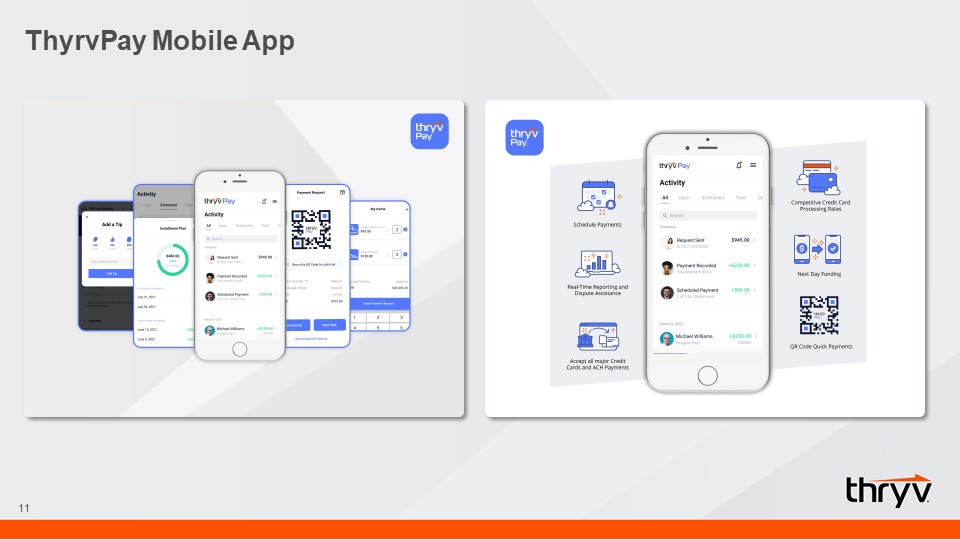
ThyrvPay Mobile App 11
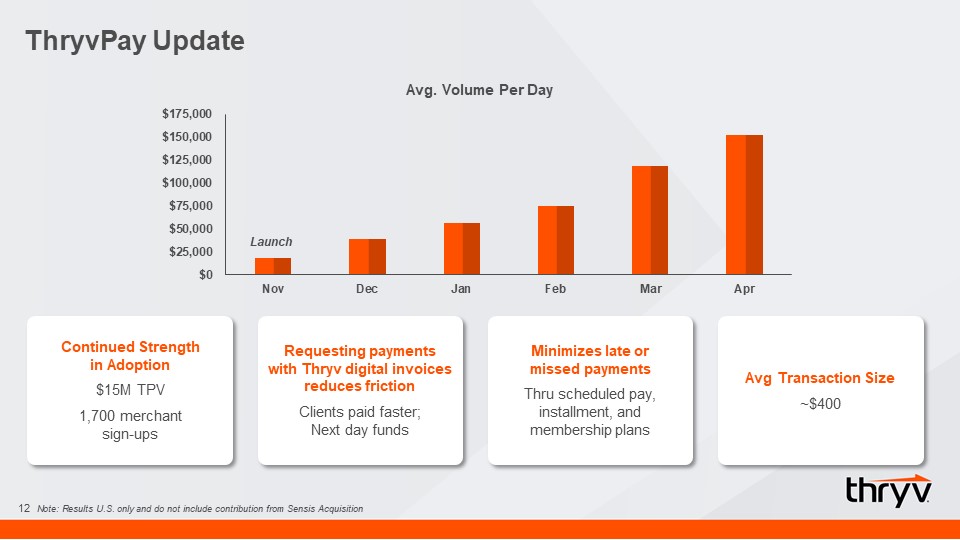
ThryvPay Update 12 Continued Strength in Adoption$15M TPV1,700 merchant sign-ups Requesting
payments with Thryv digital invoices reduces frictionClients paid faster;Next day funds Minimizes late or missed paymentsThru scheduled pay, installment, and membership plans Avg Transaction Size~$400 Note: Results U.S. only and do not
include contribution from Sensis Acquisition
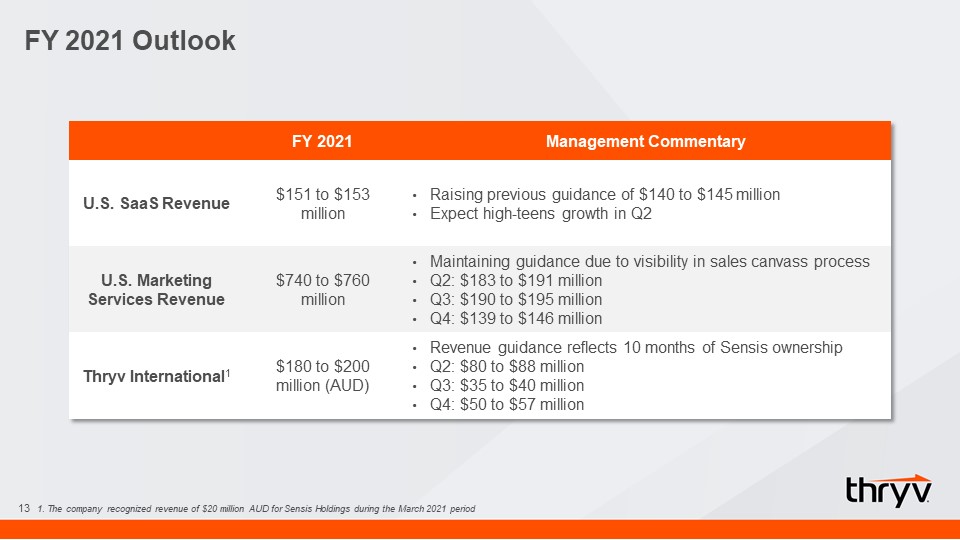
FY 2021 Outlook 13 FY 2021 Management Commentary U.S. SaaS Revenue $151 to $153 million
Raising previous guidance of $140 to $145 millionExpect high-teens growth in Q2 U.S. Marketing Services Revenue $740 to $760 million Maintaining guidance due to visibility in sales canvass process Q2: $183 to $191 millionQ3: $190 to $195
millionQ4: $139 to $146 million Thryv International1 $180 to $200 million (AUD) Revenue guidance reflects 10 months of Sensis ownershipQ2: $80 to $88 millionQ3: $35 to $40 millionQ4: $50 to $57 million 1. The company recognized revenue of
$20 million AUD for Sensis Holdings during the March 2021 period
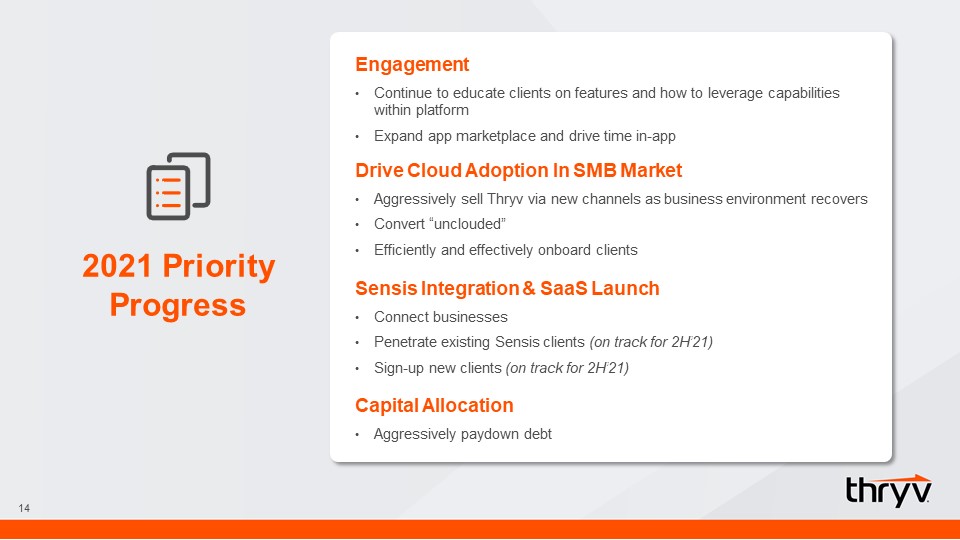
14 EngagementContinue to educate clients on features and how to leverage capabilities within
platformExpand app marketplace and drive time in-app Drive Cloud Adoption In SMB MarketAggressively sell Thryv via new channels as business environment recoversConvert “unclouded”Efficiently and effectively onboard clients Sensis
Integration & SaaS LaunchConnect businessesPenetrate existing Sensis clients (on track for 2H’21)Sign-up new clients (on track for 2H’21) Capital AllocationAggressively paydown debt 2021 Priority Progress

15 Appendix
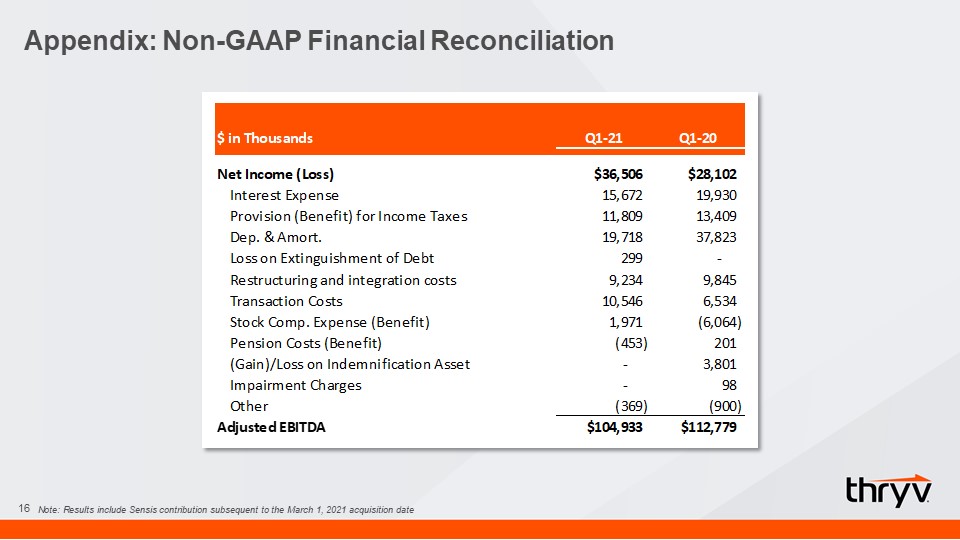
Appendix: Non-GAAP Financial Reconciliation 16 Note: Results include Sensis contribution subsequent
to the March 1, 2021 acquisition date