
Interface Inc 8-K, filed Feb 25, 2025
Interface Inc (TILE)
8-K
2025-02-25
For: 2025-02-25
View Original
Added on
April 08, 2026
About this 8-K
Interface Inc filed this 8-K on February 25, 2025.
Items reported
- Item 2.02: Financial results
- Item 7.01: Regulation FD disclosure
- Item 9.01: Financial statements and exhibits
UNITED STATES
SECURITIES AND EXCHANGE COMMISSION
Washington, D.C. 20549
FORM 8-K
CURRENT REPORT
Pursuant to Section 13 or 15(d) of the
Securities Exchange Act of 1934
Date of Report (Date of Earliest Event Reported): February 25, 2025
(Exact name of Registrant as Specified in its Charter)
| (State or other Jurisdiction of Incorporation or Organization) | (Commission File Number) | (IRS Employer Identification No.) | ||||||||||||
| (Address of principal executive offices) | (Zip code) | ||||||||||
Registrant’s telephone number, including area code: (770 ) 437-6800
Not Applicable
(Former name or former address, if changed since last report)
Securities Registered Pursuant to Section 12(b) of the Act:
| Title of Each Class | Trading Symbol(s) | Name of Each Exchange on Which Registered | ||||||
Check the appropriate box below if the Form 8-K filing is intended to simultaneously satisfy the filing obligation of the registrant under any of the following provisions (see General Instruction A.2. below):
| Written communications pursuant to Rule 425 under the Securities Act (17 CFR 230.425) | |||||
| Soliciting material pursuant to Rule 14a-12 under the Exchange Act (17 CFR 240.14a-12) | |||||
| Pre-commencement communications pursuant to Rule 14d-2(b) under the Exchange Act (17 CFR 240.14d-2(b)) | |||||
| Pre-commencement communications pursuant to Rule 13e-4(c) under the Exchange Act (17 CFR 240.13e-4(c)) | |||||
Indicate by check mark whether the registrant is an emerging growth company as defined in Rule 405 of the Securities Act of 1933 (§230.405 of this chapter) or Rule 12b-2 of the Securities Exchange Act of 1934 (§240.12b-2 of this chapter).
Emerging growth company ☐
If an emerging growth company, indicate by check mark if the registrant has elected not to use the extended transition period for complying with any new or revised financial accounting standards provided pursuant to Section 13(a) of the Exchange Act. ¨
Item 2.02 Results of Operations and Financial Condition
On February 25, 2025, Interface, Inc. (the “Company”) issued a press release reporting its financial results for the fourth quarter and full year of 2024 (the “Earnings Release”). A copy of the Earnings Release is included as Exhibit 99.1 hereto and hereby incorporated by reference. The information set forth in this Item 2.02, including the exhibit hereto, shall not be deemed “filed” for purposes of Section 18 of the Securities Exchange Act of 1934, nor shall it be deemed incorporated by reference in any filing under the Securities Act of 1933, except as shall be expressly set forth by specific reference in such filing.
Non-GAAP Financial Measures in the Earnings Release
The Earnings Release includes, as additional information for investors, the Company’s adjusted earnings per share, adjusted net income, adjusted operating income ("AOI"), adjusted gross profit, adjusted gross profit margin, adjusted selling, general and administrative (“SG&A”) expenses, currency neutral sales and currency neutral sales growth, net debt, and adjusted earnings before interest, taxes, depreciation and amortization (“EBITDA”). These measures are not in accordance with financial measures calculated in accordance with generally accepted accounting principles in the United States (“GAAP”) and may be different from similarly titled non-GAAP financial measures used by other companies. Non-GAAP financial measures should not be used as a substitute for, or considered superior to, GAAP financial measures.
Adjusted EPS, adjusted net income, and AOI exclude nora purchase accounting amortization, the cyber event impact, and restructuring, asset impairment, severance, and other, net. Adjusted EPS and adjusted net income also exclude the property casualty loss impact, the loss on foreign subsidiary liquidation, the loss on discontinuance of interest rate swaps, and the UK pension surplus tax rate change. Adjusted gross profit and adjusted gross profit margin exclude nora purchase accounting amortization and the cyber event impact. Adjusted SG&A expenses exclude the cyber event impact and restructuring, asset impairment, severance, and other, net.
Currency neutral sales and currency neutral sales growth exclude the impact of foreign currency fluctuations. Net debt is total debt less cash on hand. Adjusted EBITDA is GAAP net income excluding interest expense, income tax expense, depreciation and amortization, share-based compensation expense, cyber event impact, property casualty loss impact, restructuring, asset impairment, severance, and other, net, nora purchase accounting amortization, and the loss on foreign subsidiary liquidation.
Because the Company engages in acquisitions only episodically, and not as an everyday matter, the Company believes presenting certain measures excluding the effects of acquisitions facilitates focus on normal ongoing operations. The Company also believes presenting sales information absent the effect of foreign currency exchange rate fluctuations facilitates comparison of the Company’s operational performance between periods.
The Company generally believes reporting its adjusted results helps investors’ understanding of historical operating trends, because it facilitates comparison of current and prior periods during which one or more unique events may have occurred. The Company also believes that adjusted results provide supplemental information for comparisons to other companies which may not have experienced the same events underlying the adjustments. Furthermore, the Company uses adjusted results internally as supplemental information to evaluate its own performance, for planning purposes and in connection with its compensation programs.
Item 7.01 Regulation FD Disclosure
Management of Interface, Inc. (the “Company”) has updated the slide presentation which may be used in whole or in part in meetings with and presentations to investors and potential investors. A copy of the slide presentation is attached as Exhibit 99.2.
The information furnished pursuant to this Item 7.01, including Exhibit 99.2, shall not be deemed "filed" for purposes of Section 18 of the Securities Exchange Act of 1934, as amended (the "Exchange Act") or otherwise subject to the liabilities under that Section and shall not be deemed to be incorporated by reference into any filing of the Company under the Securities Act of 1933, as amended, or the Exchange Act.
Item 9.01 Financial Statements and Exhibits
(d) Exhibits.
| Exhibit No. | Description | ||||
| 99.1 | |||||
| 99.2 | |||||
| 104 | Cover Page Interactive Data File (embedded within the Inline XBRL document) | ||||
SIGNATURES
Pursuant to the requirements of the Securities Exchange Act of 1934, the registrant has duly caused this report to be signed on its behalf by the undersigned hereunto duly authorized.
| INTERFACE, INC. | |||||
| By: | /s/ Bruce A. Hausmann | ||||
| Bruce A. Hausmann | |||||
| Chief Financial Officer | |||||
| Date: February 25, 2025 | |||||
FOR IMMEDIATE RELEASE

Media Contact: Christine Needles Global Corporate Communications Christine.Needles@interface.com +1 404-491-4660 | Investor Contact: Bruce Hausmann Chief Financial Officer Bruce.Hausmann@interface.com +1 770-437-6802 | ||||
Interface Reports Fourth Quarter and Full Year 2024 Results
Delivered strong year, as One Interface strategy accelerates results
ATLANTA – February 25, 2025 – Interface, Inc. (Nasdaq: TILE), a worldwide commercial flooring company and global leader in sustainability, today announced results for the fourth quarter and full fiscal year ended December 29, 2024.
Fourth quarter highlights:
•Net sales totaled $335 million, up 3.0% year-over-year, in the range of our expectations.
•GAAP earnings per diluted share of $0.37; Adjusted earnings per diluted share of $0.34.
•Generated $38 million of cash from operations, repaid $34 million of debt in the quarter.
Fiscal Year:
•Net sales totaled $1,316 million, up 4.3% year-over-year.
•GAAP earnings per diluted share of $1.48; Adjusted earnings per diluted share of $1.46.
•Generated $148 million of cash from operations, repaid $115 million of debt in the year.
“We delivered impressive results in 2024, reflecting the early achievements of our One Interface strategy. We saw growth across all product categories, largely driven by continued momentum in the Americas, where our combined selling strategy has exceeded our expectations. Our team has made tremendous progress in advancing strategic initiatives that reduce complexity, improve pricing and mix management, and realize synergies from our global functions. As a result, we significantly expanded gross profit margin and nearly doubled GAAP earnings per diluted share,” commented Laurel Hurd, CEO of Interface.
“We delivered over 4% global net sales growth in 2024 in a challenging macro environment. Global Education billings were up double digits year-over-year, we gained share in Corporate Office, and we positioned our Healthcare segment for future success. Retail billings, although small in total, also contributed to our growth,” continued Hurd.
“I am proud of the tangible progress our team accomplished in the initial stages of our strategy implementation. We continue to differentiate ourselves in the market with premium, high-quality products while remaining true to our core values rooted in sustainable innovation. Our results reinforce that we are on the right path, and we remain focused on continuing to drive growth and shareholder value in the years ahead.”
“In fiscal year 2024, strong cash generation and disciplined capital management enabled us to repay $115 million of debt, reducing net leverage to 1.1 times fiscal year 2024 Adjusted EBITDA. We made tremendous progress expanding gross profit margins which grew 174 basis points year-over-year driven by higher volumes and favorable mix, as well as lower input costs,” added Bruce Hausmann, CFO of Interface.
1
| Consolidated Results Summary (Unaudited) | Three Months Ended | Twelve Months Ended | |||||||||||||||||||||
| (in millions, except percentages and per share data) | 12/29/2024 | 12/31/2023 | Change | 12/29/2024 | 12/31/2023 | Change | |||||||||||||||||
| GAAP | |||||||||||||||||||||||
| Net Sales | $ | 335.0 | $ | 325.1 | 3.0 | % | $ | 1,315.7 | $ | 1,261.5 | 4.3 | % | |||||||||||
| Gross Profit Margin % of Net Sales | 36.5 | % | 37.9 | % | (137) bps | 36.7 | % | 35.0 | % | 174 bps | |||||||||||||
| SG&A Expenses | $ | 92.7 | $ | 88.0 | 5.3 | % | $ | 348.5 | $ | 339.0 | 2.8 | % | |||||||||||
| SG&A Expenses % of Net Sales | 27.7 | % | 27.1 | % | 59 bps | 26.5 | % | 26.9 | % | (38) bps | |||||||||||||
| Operating Income | $ | 29.6 | $ | 35.2 | (15.7) | % | $ | 134.4 | $ | 104.5 | 28.6 | % | |||||||||||
| Net Income | $ | 21.8 | $ | 19.6 | 11.3 | % | $ | 86.9 | $ | 44.5 | 95.3 | % | |||||||||||
| Earnings per Diluted Share | $ | 0.37 | $ | 0.33 | 12.1 | % | $ | 1.48 | $ | 0.76 | 94.7 | % | |||||||||||
| Non-GAAP | |||||||||||||||||||||||
| Currency-Neutral Net Sales | $ | 336.0 | $ | 325.1 | 3.4 | % | $ | 1,317.5 | $ | 1,261.5 | 4.4 | % | |||||||||||
| Adjusted Gross Profit Margin % of Net Sales | 36.9 | % | 38.3 | % | (139) bps | 37.1 | % | 35.4 | % | 173 bps | |||||||||||||
| Adjusted SG&A Expenses | $ | 90.8 | $ | 83.5 | 8.8 | % | $ | 346.7 | $ | 329.8 | 5.1 | % | |||||||||||
| Adjusted SG&A Expenses % of Net Sales | 27.1 | % | 25.7 | % | 143 bps | 26.4 | % | 26.1 | % | 21 bps | |||||||||||||
| Adjusted Operating Income | $ | 32.8 | $ | 41.0 | (20.0) | % | $ | 141.4 | $ | 116.4 | 21.5 | % | |||||||||||
| Adjusted Net Income | $ | 20.1 | $ | 23.8 | (15.6) | % | $ | 86.2 | $ | 58.6 | 47.2 | % | |||||||||||
| Adjusted Earnings per Diluted Share | $ | 0.34 | $ | 0.41 | (17.1) | % | $ | 1.46 | $ | 1.00 | 46.0 | % | |||||||||||
| Adjusted EBITDA | $ | 46.0 | $ | 52.2 | (11.7) | % | $ | 189.0 | $ | 162.0 | 16.7 | % | |||||||||||
| Currency-Neutral Orders Increase Year-Over-Year | 4.7 | % | |||||||||||||||||||||
•Fourth quarter 2024 adjusted gross profit margin declined 139 basis points year-over-year due primarily to fourth quarter 2023 benefiting 160 basis points from non-recurring items. | |||||||||||||||||||||||
•Fourth quarter 2024 adjusted SG&A expenses increased year-over-year due in part to higher sales commissions and incentive compensation. | |||||||||||||||||||||||
| Additional Metrics | 12/29/2024 | 12/31/2023 | Change | ||||||||||||||||||||
| Cash | $ | 99.2 | $ | 110.5 | (10.2) | % | |||||||||||||||||
| Total Debt | $ | 302.8 | $ | 417.2 | (27.4) | % | |||||||||||||||||
| Total Debt Minus Cash ("Net Debt") | $ | 203.5 | $ | 306.7 | (33.6) | % | |||||||||||||||||
| Fiscal Year 2024 Adjusted EBITDA | $ | 189.0 | |||||||||||||||||||||
| Total Debt divided by Fiscal Year 2024 Net Income | 3.5 x | ||||||||||||||||||||||
| Net Debt divided by Fiscal Year 2024 Adj. EBITDA ("Net Leverage Ratio") | 1.1x | ||||||||||||||||||||||
2
| Segment Results Summary (Unaudited) | Three Months Ended | Twelve Months Ended | |||||||||||||||||||||
| (in millions, except percentages) | 12/29/2024 | 12/31/2023 | Change | 12/29/2024 | 12/31/2023 | Change | |||||||||||||||||
| AMS | |||||||||||||||||||||||
| Net Sales | $ | 205.7 | $ | 188.2 | 9.3 | % | $ | 800.8 | $ | 737.0 | 8.7 | % | |||||||||||
| Currency-Neutral Net Sales | $ | 206.3 | $ | 188.2 | 9.6 | % | $ | 801.8 | $ | 737.0 | 8.8 | % | |||||||||||
| Operating Income | $ | 28.5 | $ | 28.0 | 1.5 | % | $ | 105.3 | $ | 85.0 | 23.9 | % | |||||||||||
| Adjusted Operating Income | $ | 29.4 | $ | 29.2 | 0.7 | % | $ | 106.6 | $ | 87.8 | 21.4 | % | |||||||||||
| Currency-Neutral Orders Increase Year-Over-Year | 9.3 | % | |||||||||||||||||||||
| EAAA | |||||||||||||||||||||||
| Net Sales | $ | 129.3 | $ | 136.9 | (5.6) | % | $ | 514.8 | $ | 524.5 | (1.8) | % | |||||||||||
| Currency-Neutral Net Sales | $ | 129.8 | $ | 136.9 | (5.2) | % | $ | 515.7 | $ | 524.5 | (1.7) | % | |||||||||||
| Operating Income | $ | 1.2 | $ | 7.1 | (83.6) | % | $ | 29.1 | $ | 19.5 | 49.1 | % | |||||||||||
| Adjusted Operating Income | $ | 3.4 | $ | 11.8 | (71.2) | % | $ | 34.8 | $ | 28.6 | 21.7 | % | |||||||||||
| Currency-Neutral Orders (Decrease) Year-Over-Year | (1.1) | % | |||||||||||||||||||||
3
Outlook
Interface enters 2025 with a strong backlog, and expects customary seasonality in the year which typically means a lighter Q1 sequentially, followed by a stronger Q2 and Q3 sequentially. Separately, given current strength of the U.S. dollar compared to other foreign currencies, the Company is forecasting translation FX to negatively impact its year-over-year net sales growth rate by approximately 2% in Q1 2025 and approximately 1% to 2% for the full fiscal year 2025, which is included in the Company's Q1 and full fiscal year 2025 guidance. With that backdrop in mind, the Company anticipates the following:
| Q1 Fiscal Year 2025 Outlook | ||||||||
| Net sales | $290 million to $300 million | |||||||
| Adjusted gross profit margin | 37.5% of net sales | |||||||
| Adjusted SG&A expenses | $88 million | |||||||
| Adjusted interest & other expenses | $6 million | |||||||
| Adjusted effective income tax rate | 28.0% | |||||||
| Fully diluted weighted average share count | 59.2 million shares | |||||||
| Note: All figures are approximate | ||||||||
| Full Fiscal Year 2025 Outlook | ||||||||
| Net sales | $1.315 billion to $1.365 billion | |||||||
| Adjusted gross profit margin | 37.2% to 37.4% of net sales | |||||||
| Adjusted SG&A expenses | 26% of net sales | |||||||
| Adjusted interest & other expenses | $24 million | |||||||
| Adjusted effective income tax rate | 28.0% | |||||||
| Capital expenditures | $45 million | |||||||
| Note: All figures are approximate | ||||||||
4
Webcast and Conference Call Information
Interface will host a conference call on February 25, 2025, at 8:00 a.m. Eastern Time, to discuss its fourth quarter and full fiscal year 2024 results. The conference call will be simultaneously broadcast live over the Internet.
Listeners may access the conference call live over the Internet at:
https://events.q4inc.com/attendee/583846146, or through the Company's website at: https://investors.interface.com.
The archived version of the webcast will be available at these sites for one year beginning approximately one hour after the call ends.
Non-GAAP Financial Measures
Interface provides adjusted earnings per share, adjusted net income, adjusted operating income ("AOI"), adjusted gross profit, adjusted gross profit margin, adjusted SG&A expenses, currency- neutral sales and currency-neutral sales growth, net debt, and adjusted EBITDA as additional information regarding its operating results in this press release. These non-GAAP measures are not in accordance with – or alternatives to – GAAP measures, and may be different from non-GAAP measures used by other companies. Adjusted EPS, adjusted net income, and AOI exclude nora purchase accounting amortization, the cyber event impact, and restructuring, asset impairment, severance, and other, net. Adjusted EPS and adjusted net income also exclude the property casualty loss impact, the loss on foreign subsidiary liquidation, the loss on discontinuance of interest rate swaps, and the UK pension surplus tax rate change. Adjusted gross profit and adjusted gross profit margin exclude the nora purchase accounting amortization, and the cyber event impact. Adjusted SG&A expenses exclude the cyber event impact and restructuring, asset impairment, severance, and other, net. Currency-neutral sales and currency-neutral sales growth exclude the impact of foreign currency fluctuations.
Net debt is total debt less cash on hand. Adjusted EBITDA is GAAP net income excluding interest expense, income tax expense, depreciation and amortization, share-based compensation expense, cyber event impact, property casualty loss impact, restructuring, asset impairment, severance, and other, net, nora purchase accounting amortization, and the loss on foreign subsidiary liquidation. This news release should be read in conjunction with the Company's Current Report on Form 8-K furnished today to the U.S. Securities & Exchange Commission, which explains why Interface believes presentation of these non-GAAP measures provides useful information to investors, as well as any additional material purposes for which Interface uses these non-GAAP measures.
About Interface
Interface, Inc. (NASDAQ: TILE) is a global flooring solutions company and sustainability leader, offering an integrated portfolio of carpet tile and resilient flooring products that includes Interface® carpet tile and LVT, nora® rubber flooring, and FLOR® premium area rugs for commercial and residential spaces. Made with purpose and without compromise, Interface flooring brings more sophisticated design, more performance, more innovation, and more climate progress to interior spaces.
5
A decades-long pioneer in sustainability, Interface remains “all in” on becoming a restorative business. Today, the company is focusing on carbon reductions, not offsets, as it works toward achieving its verified science-based targets by 2030 and its goal to become a carbon negative enterprise by 2040.
Learn more about Interface at interface.com and blog.interface.com, nora by Interface at nora.com, FLOR at FLOR.com, and our sustainability journey at interface.com/sustainability.
Follow us on Facebook, Instagram, LinkedIn, X, and Pinterest.
Safe Harbor Statement under the Private Securities Litigation Reform Act of 1995:
Except for historical information contained herein, the other matters set forth in this news release are forward-looking statements. Forward-looking statements may be identified by words such as “may,” “expect,” “forecast,” “anticipate,” “intend,” “plan,” “believe,” “could,” “should,” “goal,” “aim," “objective,” “seek,” “project,” “estimate,” “target,” “will” and similar expressions. Forward-looking statements in this press release include, without limitation, any projections we make regarding the Company’s 2025 first quarter and full year 2025 under “Outlook” above. The forward-looking statements set forth above involve a number of risks and uncertainties that could cause actual results to differ materially from any such statement, including but not limited to the risks under the following subheadings in “Risk Factors” in the Company's Annual Report on Form 10-K for the fiscal year ended December 31, 2023: "We compete with a large number of manufacturers in the highly competitive floorcovering products market, and some of these competitors have greater financial resources than we do. We may face challenges competing on price, making investments in our business, or competing on product design or sustainability", "Our earnings could be adversely affected by non-cash adjustments to goodwill, when a test of goodwill assets indicates a material impairment of those assets", "Our success depends significantly upon the efforts, abilities and continued service of our senior management executives, our principal design consultant and other key personnel (including experienced sales and manufacturing personnel), and our loss of any of them could affect us adversely", "Large increases in the cost of our raw materials, shipping costs, duties or tariffs could adversely affect us if we are unable to pass these cost increases through to our customers", "Unanticipated termination or interruption of any of our arrangements with our primary third-party suppliers of synthetic fiber or our primary third-party supplier for luxury vinyl tile (“LVT”) or other key raw materials could have a material adverse effect on us", "The market price of our common stock has been volatile and the value of your investment may decline", "Changes to our facilities, manufacturing processes, product construction, and product composition could disrupt our operations, increase our manufacturing costs, increase customer complaints, increase warranty claims, negatively affect our reputation, and have a material adverse effect on our financial condition and results of operations", "Our business operations could suffer significant losses from natural disasters, acts of war, terrorism, catastrophes, fire, adverse weather conditions, pandemics, endemics, unstable geopolitical situations or other unexpected events", "Disruptions to or failures of information technology systems we use could adversely affect our business", "The impact of potential changes to environmental laws and regulations and industry standards regarding climate change and other sustainability matters could lead to unforeseen disruptions to our business operations", "Sales of our principal products have been and may continue to be affected by adverse economic cycles, and effects in the new construction market and renovation market", "Health crisis events, such as epidemics or pandemics, have adversely impacted, and may continue to impact, the economy and disrupt our operations and supply chains, which may have an adverse effect on our results of operations", "Our substantial international operations are subject to various political, economic and other uncertainties that could adversely affect our business results, including foreign currency fluctuations, restrictive taxation, custom duties, border closings or other adverse government regulations", "The conflict between Russia and Ukraine and the Israel-Hamas war could adversely affect our business, results of operations and financial position", "Fluctuations in foreign currency exchange rates have had, and could continue to have, an adverse impact on our financial condition and results of operations", "The uncertainty surrounding the ongoing implementation and effect of the U.K.’s exit from the European Union, and related negative developments in the European Union, could adversely affect our business, results of operations or financial condition", "We have a substantial amount of debt, which could adversely affect our business, financial condition and results of operations and our ability to meet our payment obligations under our debt", "Servicing our debt requires a significant amount of cash, and we may not have sufficient cash flow from our operations to pay our indebtedness", "We may incur substantial additional indebtedness, which could further exacerbate the risks associated with our substantial indebtedness", and "We face risks associated with litigation and claims".
You should consider any additional or updated information we include under the heading “Risk Factors” in our subsequent quarterly and annual reports.
6
Any forward-looking statements are made pursuant to the Private Securities Litigation Reform Act of 1995 and, as such, speak only as of the date made. The Company assumes no responsibility to update or revise forward-looking statements made in this press release and cautions readers not to place undue reliance on any such forward-looking statements.
- TABLES FOLLOW -
7
| Consolidated Statements of Operations (Unaudited) | Three Months Ended | Twelve Months Ended | ||||||||||||||||||||||||||||||
| (In thousands, except per share data) | 12/29/2024 | 12/31/2023 | 12/29/2024 | 12/31/2023 | ||||||||||||||||||||||||||||
| Net Sales | $ | 335,010 | $ | 325,118 | $ | 1,315,658 | $ | 1,261,498 | ||||||||||||||||||||||||
| Cost of Sales | 212,705 | 201,966 | 832,710 | 820,429 | ||||||||||||||||||||||||||||
| Gross Profit | 122,305 | 123,152 | 482,948 | 441,069 | ||||||||||||||||||||||||||||
| Selling, General & Administrative Expenses | 92,671 | 88,000 | 348,542 | 339,049 | ||||||||||||||||||||||||||||
| Restructuring, Asset Impairment, Other (Gains) and Charges | — | — | — | (2,502) | ||||||||||||||||||||||||||||
| Operating Income | 29,634 | 35,152 | 134,406 | 104,522 | ||||||||||||||||||||||||||||
| Interest Expense | 4,888 | 6,801 | 23,205 | 31,787 | ||||||||||||||||||||||||||||
| Other (Income) Expense, net | (2,590) | 1,407 | (2,353) | 9,081 | ||||||||||||||||||||||||||||
| Income Before Income Tax Expense | 27,336 | 26,944 | 113,554 | 63,654 | ||||||||||||||||||||||||||||
| Income Tax Expense | 5,570 | 7,389 | 26,608 | 19,137 | ||||||||||||||||||||||||||||
| Net Income | $ | 21,766 | $ | 19,555 | $ | 86,946 | $ | 44,517 | ||||||||||||||||||||||||
| Earnings Per Share – Basic | $ | 0.37 | $ | 0.34 | $ | 1.49 | $ | 0.77 | ||||||||||||||||||||||||
| Earnings Per Share – Diluted | $ | 0.37 | $ | 0.33 | $ | 1.48 | $ | 0.76 | ||||||||||||||||||||||||
Common Shares Outstanding – Basic | 58,304 | 58,108 | 58,282 | 58,092 | ||||||||||||||||||||||||||||
Common Shares Outstanding – Diluted | 59,209 | 58,636 | 58,871 | 58,335 | ||||||||||||||||||||||||||||
8
| Consolidated Balance Sheets (Unaudited) | |||||||||||
| (In thousands) | 12/29/2024 | 12/31/2023 | |||||||||
| Assets | |||||||||||
| Cash and Cash Equivalents | $ | 99,226 | $ | 110,498 | |||||||
| Accounts Receivable, net | 171,135 | 163,386 | |||||||||
| Inventories, net | 260,581 | 279,079 | |||||||||
Other Current Assets | 33,355 | 30,895 | |||||||||
Total Current Assets | 564,297 | 583,858 | |||||||||
| Property, Plant and Equipment, net | 282,374 | 291,140 | |||||||||
| Operating Lease Right-of-Use Assets | 76,815 | 87,519 | |||||||||
| Goodwill | 99,887 | 105,448 | |||||||||
| Other Intangibles, net | 48,273 | 56,255 | |||||||||
Other Assets | 99,170 | 105,875 | |||||||||
Total Assets | $ | 1,170,816 | $ | 1,230,095 | |||||||
| Liabilities | |||||||||||
Accounts Payable | $ | 68,943 | $ | 62,912 | |||||||
| Accrued Expenses | 134,996 | 130,890 | |||||||||
Current Portion of Operating Lease Liabilities | 12,296 | 12,347 | |||||||||
Current Portion of Long-Term Debt | 482 | 8,572 | |||||||||
Total Current Liabilities | 216,717 | 214,721 | |||||||||
Long-Term Debt | 302,275 | 408,641 | |||||||||
Operating Lease Liabilities | 68,092 | 78,269 | |||||||||
Other Long-Term Liabilities | 94,584 | 102,517 | |||||||||
Total Liabilities | 681,668 | 804,148 | |||||||||
Shareholders’ Equity | 489,148 | 425,947 | |||||||||
Total Liabilities and Shareholders’ Equity | $ | 1,170,816 | $ | 1,230,095 | |||||||
9
| Consolidated Statements of Cash Flows (Unaudited) | Twelve Months Ended | |||||||||||||
| (In thousands) | 12/29/2024 | 12/31/2023 | ||||||||||||
| OPERATING ACTIVITIES | ||||||||||||||
| Net Income | $ | 86,946 | $ | 44,517 | ||||||||||
| Adjustments to Reconcile Net Income to Cash Provided by Operating Activities: | ||||||||||||||
| Depreciation and Amortization | 39,333 | 40,774 | ||||||||||||
| Share-Based Compensation Expense | 12,907 | 10,265 | ||||||||||||
| Loss (Gain) on Disposal of Property, Plant and Equipment, net | 264 | (2,252) | ||||||||||||
| Loss on Foreign Subsidiary Liquidation | 2,152 | 6,221 | ||||||||||||
| Bad Debt Expense | 1,476 | 53 | ||||||||||||
| Amortization of Acquired Intangible Assets | 5,172 | 5,172 | ||||||||||||
| Deferred Taxes | (3,034) | (10,082) | ||||||||||||
| Other | (8,480) | 1,273 | ||||||||||||
| Change in Working Capital | ||||||||||||||
| Accounts Receivable | (13,872) | 21,798 | ||||||||||||
| Inventories | 10,467 | 31,040 | ||||||||||||
| Prepaid Expenses and Other Current Assets | (3,079) | (302) | ||||||||||||
| Accounts Payable and Accrued Expenses | 18,178 | (6,443) | ||||||||||||
| Cash Provided by Operating Activities | 148,430 | 142,034 | ||||||||||||
| INVESTING ACTIVITIES | ||||||||||||||
| Capital Expenditures | (33,788) | (26,107) | ||||||||||||
| Proceeds from Sale of Property, Plant and Equipment | 1,040 | 6,593 | ||||||||||||
| Insurance Proceeds from Property Casualty Loss | 2,374 | — | ||||||||||||
| Cash Used in Investing Activities | (30,374) | (19,514) | ||||||||||||
| FINANCING ACTIVITIES | ||||||||||||||
| Revolving Loan Borrowing | 34,243 | 90,000 | ||||||||||||
| Revolving Loan Repayments | (34,243) | (114,381) | ||||||||||||
| Term Loan Repayments | (115,213) | (80,927) | ||||||||||||
| Tax Withholding Payments for Share-Based Compensation | (4,770) | (1,514) | ||||||||||||
| Dividends Paid | (2,338) | (2,323) | ||||||||||||
| Finance Lease Payments | (2,913) | (2,419) | ||||||||||||
| Cash Used in Financing Activities | (125,234) | (111,564) | ||||||||||||
| Net Cash (Used in) Provided by Operating, Investing and Financing Activities | (7,178) | 10,956 | ||||||||||||
| Effect of Exchange Rate Changes on Cash | (4,094) | 1,978 | ||||||||||||
| CASH AND CASH EQUIVALENTS | ||||||||||||||
| Net Change During the Period | (11,272) | 12,934 | ||||||||||||
| Balance at Beginning of Period | 110,498 | 97,564 | ||||||||||||
| Balance at End of Period | $ | 99,226 | $ | 110,498 | ||||||||||
10
Net Sales by Region (Unaudited)
| Twelve Months Ended | |||||
| % of Total | 12/29/2024 | ||||
| Net Sales | |||||
| AMS | 61 | % | |||
| EMEA | 29 | % | |||
| APAC | 10 | % | |||
| Consolidated Net Sales | 100 | % | |||
Gross Billings by Customer Vertical (Unaudited)
| Twelve Months Ended | |||||
| % of Total | 12/29/2024 | ||||
| Gross Billings | |||||
| Corporate/Office | 47 | % | |||
| Education | 20 | % | |||
| Healthcare | 9 | % | |||
| Government | 6 | % | |||
| Retail | 5 | % | |||
| Residential/Living | 5 | % | |||
| Hospitality | 2 | % | |||
| Consumer Residential | 2 | % | |||
| Transportation | 2 | % | |||
| Other | 3 | % | |||
| Consolidated Gross Billings * | 100 | % | |||
| * Note: Sum of reconciling items may differ from total due to rounding of individual components | |||||
11
Reconciliation of GAAP Financial Measures to Non-GAAP Financial Measures (Unaudited)
(In millions, except per share amounts)
| Fourth Quarter 2024 | Fourth Quarter 2023 | ||||||||||||||||||||||||||||||||||||||||||||||
| Adjustments | Adjustments | ||||||||||||||||||||||||||||||||||||||||||||||
| Gross Profit | SG&A Expenses | Operating Income (Loss) | Pre-tax | Tax Effect | Net Income (Loss) | Diluted EPS | Gross Profit | SG&A Expenses | Operating Income (Loss) | Pre-tax | Tax Effect | Net Income (Loss) | Diluted EPS | ||||||||||||||||||||||||||||||||||
| GAAP As Reported | $ | 122.3 | $ | 92.7 | $ | 29.6 | $ | 21.8 | $ | 0.37 | $ | 123.2 | $ | 88.0 | $ | 35.2 | $ | 19.6 | $ | 0.33 | |||||||||||||||||||||||||||
| Non-GAAP Adjustments: | |||||||||||||||||||||||||||||||||||||||||||||||
| Purchase Accounting Amortization | 1.3 | — | 1.3 | 1.3 | (0.4) | 0.9 | 0.02 | 1.3 | — | 1.3 | 1.3 | (0.4) | 0.9 | 0.02 | |||||||||||||||||||||||||||||||||
| Restructuring, Asset Impairment, Severance, and Other, net | — | (2.2) | 2.2 | 2.2 | (0.5) | 1.7 | 0.03 | — | (4.4) | 4.4 | 4.4 | (1.2) | 3.2 | 0.06 | |||||||||||||||||||||||||||||||||
| Cyber Event Impact | — | 0.3 | (0.3) | (5.1) | 1.2 | (3.9) | (0.07) | — | (0.1) | 0.1 | 0.1 | — | 0.1 | — | |||||||||||||||||||||||||||||||||
Foreign Subsidiary Liquidation(1) | — | — | — | 2.2 | — | 2.2 | 0.04 | — | — | — | — | — | — | — | |||||||||||||||||||||||||||||||||
| UK Pension Surplus Tax Rate Change | — | — | — | — | (2.5) | (2.5) | (0.04) | — | — | — | — | — | — | — | |||||||||||||||||||||||||||||||||
| Adjustments Subtotal * | 1.3 | (1.9) | 3.1 | 0.5 | (2.2) | (1.7) | (0.03) | 1.3 | (4.5) | 5.8 | 5.8 | (1.6) | 4.2 | 0.08 | |||||||||||||||||||||||||||||||||
| Adjusted (non-GAAP) * | $ | 123.6 | $ | 90.8 | $ | 32.8 | $ | 20.1 | $ | 0.34 | $ | 124.4 | $ | 83.5 | $ | 41.0 | $ | 23.8 | $ | 0.41 | |||||||||||||||||||||||||||
| (1) Thailand foreign subsidiary substantially liquidated. The related cumulative translation adjustment recognized in other expense. | |||||||||||||||||||||||||||||||||||||||||||||||
| * Note: Sum of reconciling items may differ from total due to rounding of individual components | |||||||||||||||||||||||||||||||||||||||||||||||
12
| Fiscal Year 2024 | Fiscal Year 2023 | ||||||||||||||||||||||||||||||||||||||||||||||
| Adjustments | Adjustments | ||||||||||||||||||||||||||||||||||||||||||||||
| Gross Profit | SG&A Expenses | Operating Income | Pre-tax | Tax Effect | Net Income/(Loss) | Diluted EPS | Gross Profit | SG&A Expenses | Operating Income | Pre-tax | Tax Effect | Net Income/(Loss) | Diluted EPS | ||||||||||||||||||||||||||||||||||
| GAAP As Reported | $ | 482.9 | $ | 348.5 | $ | 134.4 | $ | 86.9 | $ | 1.48 | $ | 441.1 | $ | 339.0 | $ | 104.5 | $ | 44.5 | $ | 0.76 | |||||||||||||||||||||||||||
| Non-GAAP Adjustments: | |||||||||||||||||||||||||||||||||||||||||||||||
| Purchase Accounting Amortization | 5.2 | — | 5.2 | 5.2 | (1.5) | 3.7 | 0.06 | 5.2 | — | 5.2 | 5.2 | (1.5) | 3.7 | 0.06 | |||||||||||||||||||||||||||||||||
| Restructuring, Asset Impairment, Severance, and Other, net | — | (2.5) | 2.5 | 2.5 | (0.6) | 1.9 | 0.03 | — | (8.1) | 5.6 | 5.6 | (1.6) | 4.1 | 0.07 | |||||||||||||||||||||||||||||||||
| Cyber Event Impact | — | 0.7 | (0.7) | (5.5) | 1.3 | (4.2) | (0.07) | — | (1.1) | 1.1 | 1.1 | (0.3) | 0.8 | 0.01 | |||||||||||||||||||||||||||||||||
Property Casualty Loss(1) | — | — | — | (2.3) | 0.6 | (1.8) | (0.03) | — | — | — | (0.5) | 0.1 | (0.4) | (0.01) | |||||||||||||||||||||||||||||||||
Loss on Foreign Subsidiary Liquidation (2) | — | — | — | 2.2 | — | 2.2 | 0.04 | — | — | — | 6.2 | (1.1) | 5.1 | 0.09 | |||||||||||||||||||||||||||||||||
| Loss on Discontinuance of Interest Rate Swaps | — | — | — | — | — | — | — | — | — | — | 1.0 | (0.2) | 0.8 | 0.01 | |||||||||||||||||||||||||||||||||
| UK Pension Surplus Tax Rate Change | — | — | — | — | (2.5) | (2.5) | (0.04) | — | — | — | — | — | — | — | |||||||||||||||||||||||||||||||||
| Adjustments Subtotal * | 5.2 | (1.8) | 7.0 | 2.0 | (2.7) | (0.7) | (0.01) | 5.1 | (9.2) | 11.9 | 18.6 | (4.5) | 14.0 | 0.24 | |||||||||||||||||||||||||||||||||
| Adjusted (non-GAAP) * | $ | 488.1 | $ | 346.7 | $ | 141.4 | $ | 86.2 | $ | 1.46 | $ | 446.2 | $ | 329.8 | $ | 116.4 | $ | 58.6 | $ | 1.00 | |||||||||||||||||||||||||||
| (1) Represents insurance recovery. | |||||||||||||||||||||||||||||||||||||||||||||||
| (2) In 2024 our Thailand subsidiary was substantially liquidated. In 2023, our Russia and Brazil foreign subsidiaries were substantially liquidated. The related cumulative translation adjustment was recognized in other expense. | |||||||||||||||||||||||||||||||||||||||||||||||
| * Note: Sum of reconciling items may differ from total due to rounding of individual components | |||||||||||||||||||||||||||||||||||||||||||||||
13
Reconciliation of Segment GAAP Financial Measures to Non-GAAP Financial Measures ("Currency-Neutral Net Sales", "Adjusted Gross Profit" and "AOI")
(In millions)
| Fourth Quarter 2024 | Fourth Quarter 2023 | ||||||||||||||||||||||
| AMS Segment | EAAA Segment | Consolidated * | AMS Segment | EAAA Segment | Consolidated * | ||||||||||||||||||
| Net Sales as Reported (GAAP) | $ | 205.7 | $ | 129.3 | $ | 335.0 | $ | 188.2 | $ | 136.9 | $ | 325.1 | |||||||||||
| Impact of Changes in Currency | 0.5 | 0.5 | 1.0 | — | — | — | |||||||||||||||||
| Currency-Neutral Net Sales * | $ | 206.3 | $ | 129.8 | $ | 336.0 | $ | 188.2 | $ | 136.9 | $ | 325.1 | |||||||||||
| * Note: Sum of reconciling items may differ from total due to rounding of individual components | |||||||||||||||||||||||
| Fiscal Year 2024 | Fiscal Year 2023 | ||||||||||||||||||||||
| AMS Segment | EAAA Segment | Consolidated * | AMS Segment | EAAA Segment | Consolidated * | ||||||||||||||||||
| Net Sales as Reported (GAAP) | $ | 800.8 | $ | 514.8 | $ | 1,315.7 | $ | 737.0 | $ | 524.5 | $ | 1,261.5 | |||||||||||
| Impact of Changes in Currency | 1.0 | 0.8 | 1.8 | — | — | — | |||||||||||||||||
| Currency-Neutral Net Sales * | $ | 801.8 | $ | 515.7 | $ | 1,317.5 | $ | 737.0 | $ | 524.5 | $ | 1,261.5 | |||||||||||
| * Note: Sum of reconciling items may differ from total due to rounding of individual components | |||||||||||||||||||||||
14
| Fourth Quarter 2024 | Fourth Quarter 2023 | ||||||||||||||||||||||
| AMS Segment | EAAA Segment | Consolidated * | AMS Segment | EAAA Segment | Consolidated * | ||||||||||||||||||
| Gross Profit (GAAP) | $ | 81.2 | $ | 41.1 | $ | 122.3 | $ | 76.9 | $ | 46.3 | $ | 123.2 | |||||||||||
| Purchase Accounting Amortization | — | 1.3 | 1.3 | — | 1.3 | 1.3 | |||||||||||||||||
| Adjusted Gross Profit* | $ | 81.2 | $ | 42.3 | $ | 123.6 | $ | 76.9 | $ | 47.6 | $ | 124.4 | |||||||||||
| * Note: Sum of reconciling items may differ from total due to rounding of individual components | |||||||||||||||||||||||
| Fiscal Year 2024 | Fiscal Year 2023 | |||||||||||||||||||||||||
| AMS Segment | EAAA Segment | Consolidated * | AMS Segment | EAAA Segment | Consolidated * | |||||||||||||||||||||
| Gross Profit (GAAP) | $ | 306.6 | $ | 176.3 | $ | 482.9 | $ | 278.2 | $ | 162.8 | $ | 441.0 | ||||||||||||||
| Purchase Accounting Amortization | — | 5.2 | 5.2 | — | 5.2 | 5.2 | ||||||||||||||||||||
| Cyber Event Impact | — | — | — | — | — | — | ||||||||||||||||||||
| Adjusted Gross Profit* | $ | 306.6 | $ | 181.5 | $ | 488.1 | $ | 278.2 | $ | 168.0 | $ | 446.2 | ||||||||||||||
| * Note: Sum of reconciling items may differ from total due to rounding of individual components | ||||||||||||||||||||||||||
15
| Fourth Quarter 2024 | Fourth Quarter 2023 | ||||||||||||||||||||||||||||||||||
| AMS Segment | EAAA Segment | Consolidated * | AMS Segment | EAAA Segment | Consolidated * | ||||||||||||||||||||||||||||||
| GAAP Operating Income (Loss) | $ | 28.5 | $ | 1.2 | $ | 29.6 | $ | 28.0 | $ | 7.1 | $ | 35.2 | |||||||||||||||||||||||
| Non-GAAP Adjustments: | |||||||||||||||||||||||||||||||||||
| Purchase Accounting Amortization | — | 1.3 | 1.3 | — | 1.3 | 1.3 | |||||||||||||||||||||||||||||
| Cyber Event Impact | (0.1) | (0.2) | (0.3) | 0.1 | — | 0.1 | |||||||||||||||||||||||||||||
| Restructuring, Asset Impairment, Severance, and Other, net | 1.0 | 1.2 | 2.2 | 1.1 | 3.4 | 4.4 | |||||||||||||||||||||||||||||
| Adjustments Subtotal * | 0.9 | 2.2 | 3.1 | 1.1 | 4.7 | 5.8 | |||||||||||||||||||||||||||||
| AOI * | $ | 29.4 | $ | 3.4 | $ | 32.8 | $ | 29.2 | $ | 11.8 | $ | 41.0 | |||||||||||||||||||||||
| * Note: Sum of reconciling items may differ from total due to rounding of individual components | |||||||||||||||||||||||||||||||||||
| Fiscal Year 2024 | Fiscal Year 2023 | ||||||||||||||||||||||
| AMS Segment | EAAA Segment | Consolidated * | AMS Segment | EAAA Segment | Consolidated * | ||||||||||||||||||
| GAAP Operating Income (Loss) | $ | 105.3 | $ | 29.1 | $ | 134.4 | $ | 85.0 | $ | 19.5 | $ | 104.5 | |||||||||||
| Non-GAAP Adjustments: | |||||||||||||||||||||||
| Purchase Accounting Amortization | — | 5.2 | 5.2 | — | 5.2 | 5.2 | |||||||||||||||||
| Cyber Event Impact | (0.4) | (0.4) | (0.7) | 0.6 | 0.5 | 1.1 | |||||||||||||||||
| Restructuring, Asset Impairment, Severance, and Other, net | 1.6 | 0.9 | 2.5 | 2.1 | 3.5 | 5.6 | |||||||||||||||||
| Adjustments Subtotal * | 1.3 | 5.7 | 7.0 | 2.8 | 9.1 | 11.9 | |||||||||||||||||
| AOI * | $ | 106.6 | $ | 34.8 | $ | 141.4 | $ | 87.8 | $ | 28.6 | $ | 116.4 | |||||||||||
| * Note: Sum of reconciling items may differ from total due to rounding of individual components | |||||||||||||||||||||||
16
| (in millions) | Fourth Quarter 2024 | Fourth Quarter 2023 | Fiscal Year 2024 | Fiscal Year 2023 | |||||||||||||||||||||||||||||||
| Net Income as Reported (GAAP) | $ | 21.8 | $ | 19.6 | $ | 86.9 | $ | 44.5 | |||||||||||||||||||||||||||
| Income Tax Expense | 5.6 | 7.4 | 26.6 | 19.1 | |||||||||||||||||||||||||||||||
Interest Expense (including debt issuance cost amortization) | 4.9 | 6.8 | 23.2 | 31.8 | |||||||||||||||||||||||||||||||
Depreciation and Amortization (excluding debt issuance cost amortization) | 9.6 | 9.7 | 37.3 | 38.7 | |||||||||||||||||||||||||||||||
| Share-based Compensation Expense | 3.7 | 2.9 | 12.9 | 10.3 | |||||||||||||||||||||||||||||||
| Purchase Accounting Amortization | 1.3 | 1.3 | 5.2 | 5.2 | |||||||||||||||||||||||||||||||
| Restructuring, Asset Impairment, Severance, and Other, net | 2.2 | 4.4 | 2.5 | 5.6 | |||||||||||||||||||||||||||||||
| Cyber Event Impact | (5.1) | 0.1 | (5.5) | 1.1 | |||||||||||||||||||||||||||||||
Property Casualty Loss(1) | — | — | (2.3) | (0.5) | |||||||||||||||||||||||||||||||
Loss on Foreign Subsidiary Liquidation (2) | 2.2 | — | 2.2 | 6.2 | |||||||||||||||||||||||||||||||
| Adjusted Earnings before Interest, Taxes, Depreciation and Amortization (AEBITDA)* | $ | 46.0 | $ | 52.2 | $ | 189.0 | $ | 162.0 | |||||||||||||||||||||||||||
| (1) Represents insurance recovery. | |||||||||||||||||||||||||||||||||||
| (2) In 2024 our Thailand subsidiary was substantially liquidated. In 2023, our Russia and Brazil foreign subsidiaries were substantially liquidated. The related cumulative translation adjustment was recognized in other expense. | |||||||||||||||||||||||||||||||||||
| Note: Sum of reconciling items may differ from total due to rounding of individual components | |||||||||||||||||||||||||||||||||||
The impacts of changes in foreign currency presented in the tables are calculated based on applying the prior year period's average foreign currency exchange rates to the current year period.
The Company believes that the above non-GAAP performance measures, which management uses in managing and evaluating the Company’s business, may provide users of the Company’s financial information with additional meaningful basis for comparing the Company’s current results and results in a prior period, as these measures reflect factors that are unique to one period relative to the comparable period. However, these non‑GAAP performance measures should be viewed in addition to, and not as an alternative for, the Company’s reported results under accounting principles generally accepted in the United States. Tax effects identified above (when applicable) are calculated using the statutory tax rate for the jurisdictions in which the charge or income occurred.
# # #
17
Investor Presentation | February 2025
2 Forward Looking Statements and Non-GAAP Measures This presentation contains forward-looking statements, including, in particular, statements about Interface’s plans, strategies and prospects. These are based on the Company’s current assumptions, expectations and projections about future events. Although Interface believes that the expectations reflected in these forward-looking statements are reasonable, the Company can give no assurance that these expectations will prove to be correct or that savings or other benefits anticipated in the forward-looking statements will be achieved. The forward-looking statements set forth involve a number of risks and uncertainties that could cause actual results to differ materially from any such statement, including risks and uncertainties associated with economic conditions in the commercial interiors industry and the risks under the heading “Risk Factors” in the Company's Annual Report on Form 10-K for the fiscal year ended December 31, 2023, which discussions are hereby incorporated by reference. You should also consider any additional or updated information we include under the heading “Risk Factors” in our subsequent annual and quarterly reports. Forward-looking statements in this presentation include, without limitation, the information set forth on the slides titled “Interface: a compelling investment”, “‘One Interface’ Strategy”, “Brand Leader in the Specified Channel”, and “Financial Policy”. Other forward-looking statements can be identified by words such as “may,” “expect,” “forecast,” “anticipate,” “intend,” “plan,” “believe,” “could,” “should”, “goal”, “aim”, “objective”, “commitment”, “seek,” “project,” “estimate,” “target,” and similar expressions. Forward-looking statements speak only as of the date made. The Company assumes no responsibility to update or revise forward-looking statements and cautions listeners and meeting attendees not to place undue reliance on any such statements. This presentation includes certain financial measures not calculated in accordance with U.S. GAAP. They may be different from similarly titled non-GAAP measures used by other companies, and should not be used as a substitute for, or considered superior to, GAAP measures. Reconciliations to the most directly comparable GAAP measures appear in the Appendix Note: Sum of reconciling items may differ from total due to rounding of individual components
3 At Interface, we’re Made for More Who We Are Leading Established GlobalDedicated Engaged provider of commercial flooring: carpet tile, rubber, and LVT brand with a history of innovation and a commitment to the pursuit of sustainability to performance and improving the built environment, industry, and the world manufacturing capabilities with a focus on local market needs customer-centric and purpose- driven culture with deep design and innovation roots
Interface is a global leader in commercial flooring 4 $1.3 billion in net sales in FY2024 3,600 global employees 6 manufacturing locations on 4 continents ATL headquartered in Atlanta, GA Recognized leader in sustainability with over 50 years of innovation First cradle-to-gate carbon negative commercial carpet tile and rubber flooring prototype Premium brands with attractive margins and leadership in core categories
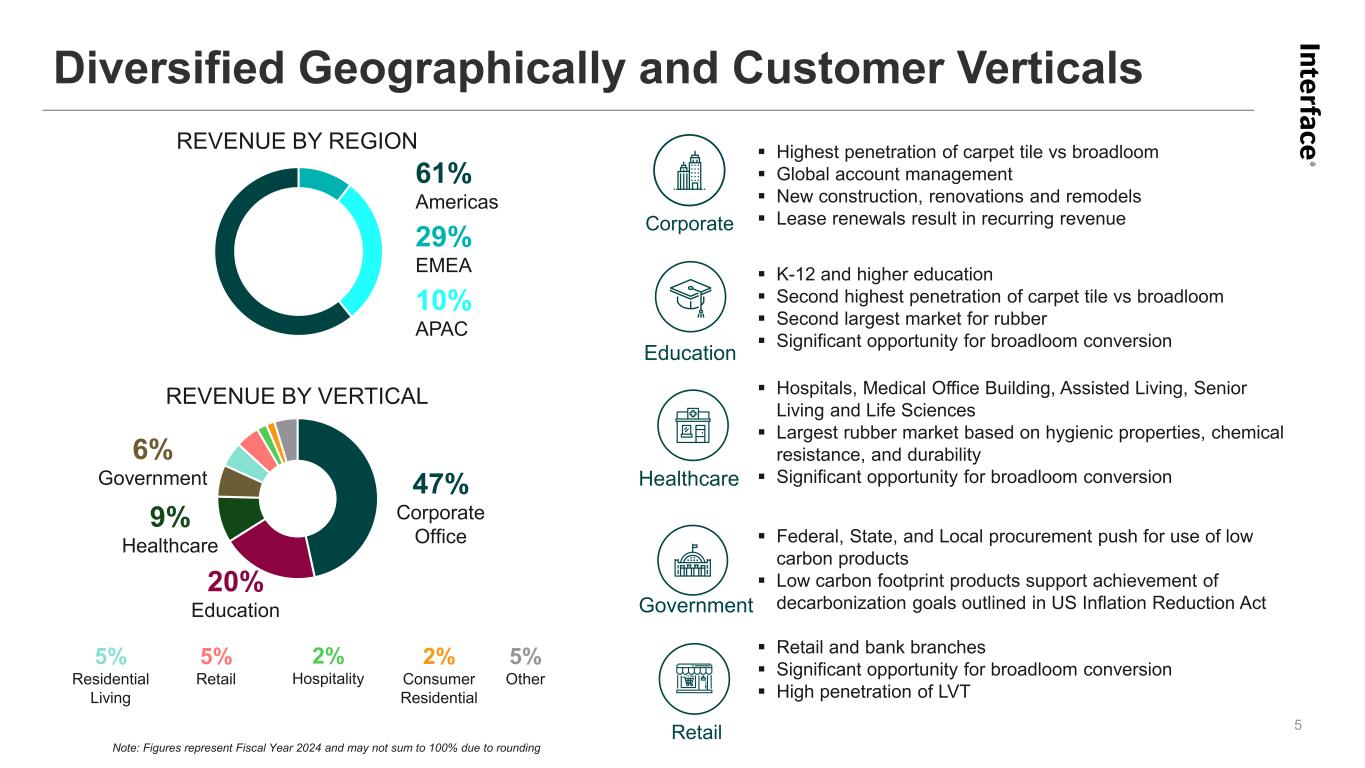
Healthcare 61% Americas 29% EMEA 10% APAC REVENUE BY REGION Diversified Geographically and Customer Verticals 5 Note: Figures represent Fiscal Year 2024 and may not sum to 100% due to rounding 47% Corporate Office 20% Education Highest penetration of carpet tile vs broadloom Global account management New construction, renovations and remodels Lease renewals result in recurring revenue K-12 and higher education Second highest penetration of carpet tile vs broadloom Second largest market for rubber Significant opportunity for broadloom conversion Hospitals, Medical Office Building, Assisted Living, Senior Living and Life Sciences Largest rubber market based on hygienic properties, chemical resistance, and durability Significant opportunity for broadloom conversion Federal, State, and Local procurement push for use of low carbon products Low carbon footprint products support achievement of decarbonization goals outlined in US Inflation Reduction Act Retail and bank branches Significant opportunity for broadloom conversion High penetration of LVT Corporate Education Government 9% Healthcare 6% Government 5% Residential Living 5% Retail 2% Hospitality 2% Consumer Residential 5% Other REVENUE BY VERTICAL Retail
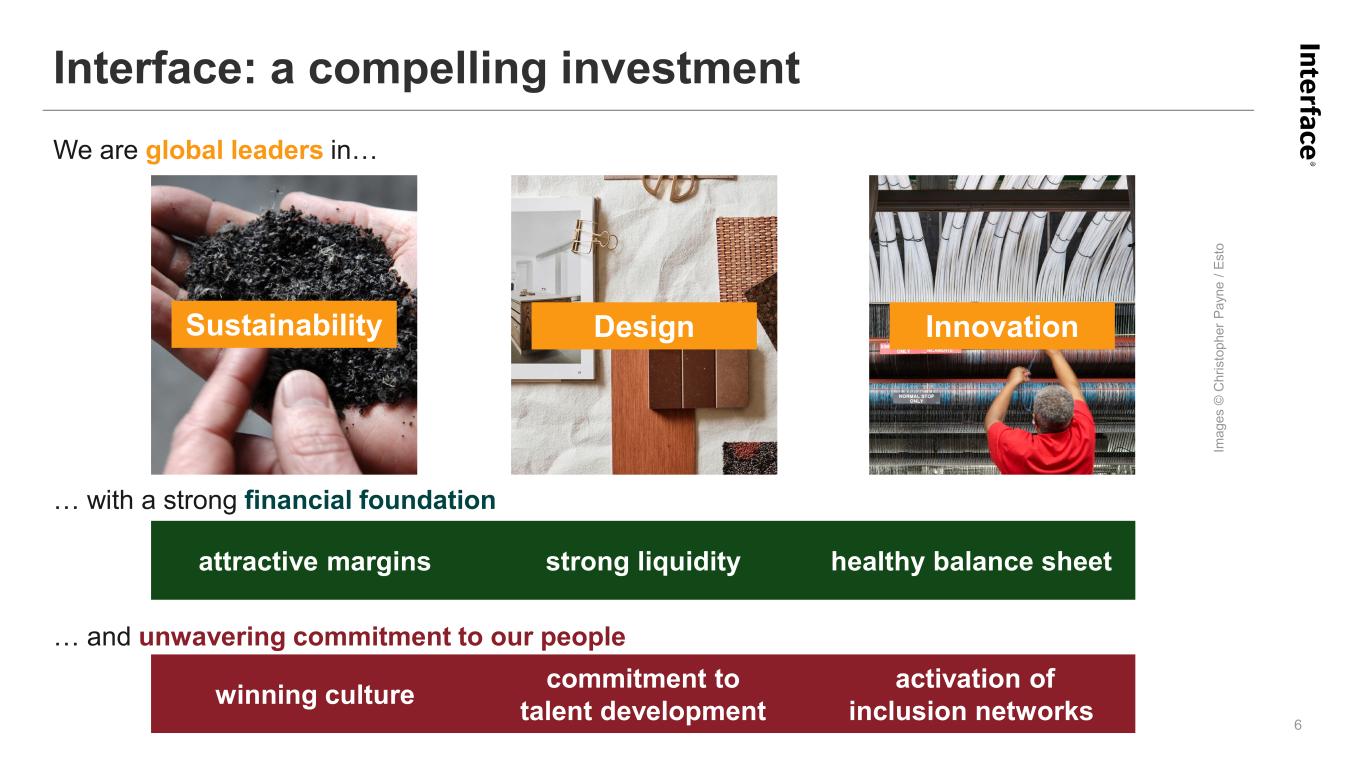
Interface: a compelling investment 6 We are global leaders in… … with a strong financial foundation Design InnovationSustainability attractive margins strong liquidity healthy balance sheet Im ag es © C hr is to ph er P ay ne / Es to … and unwavering commitment to our people winning culture commitment to talent development activation of inclusion networks
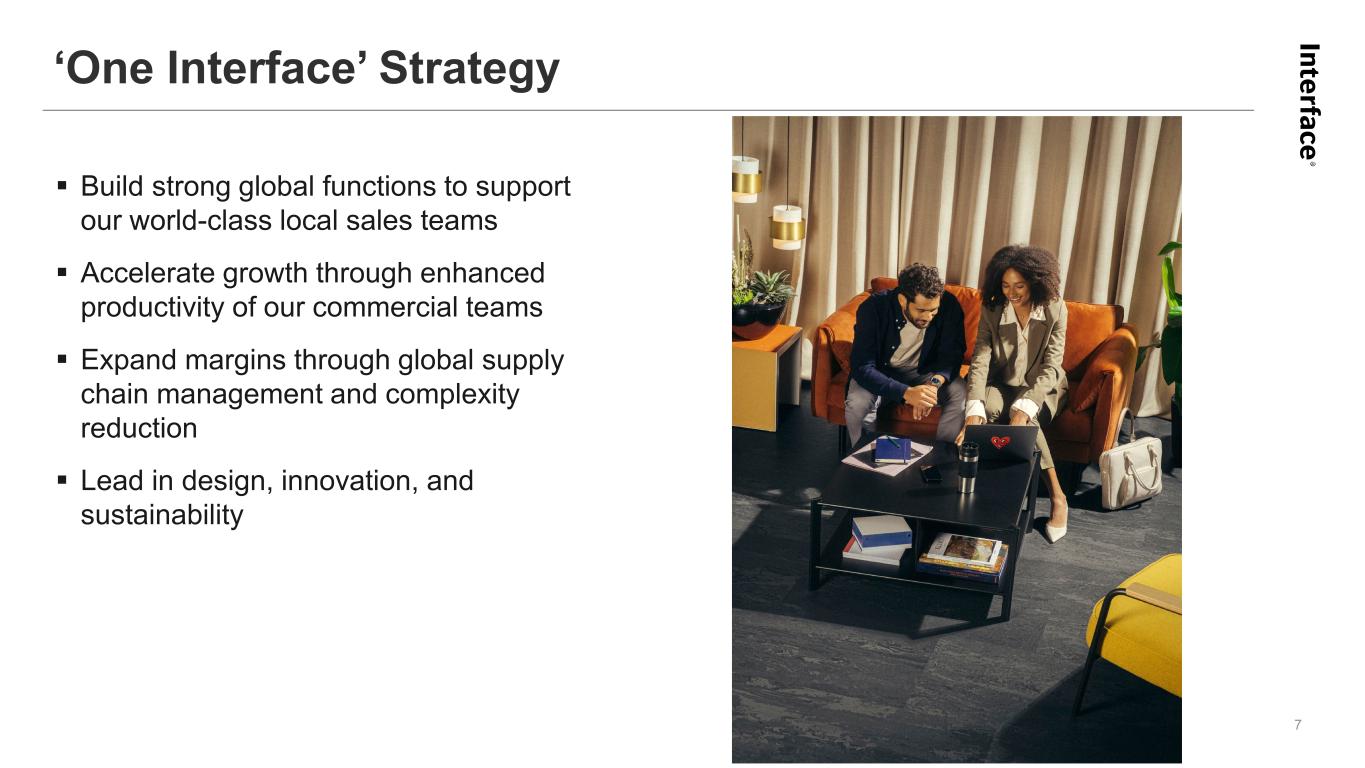
‘One Interface’ Strategy Build strong global functions to support our world-class local sales teams Accelerate growth through enhanced productivity of our commercial teams Expand margins through global supply chain management and complexity reduction Lead in design, innovation, and sustainability 7

Interface Positioning
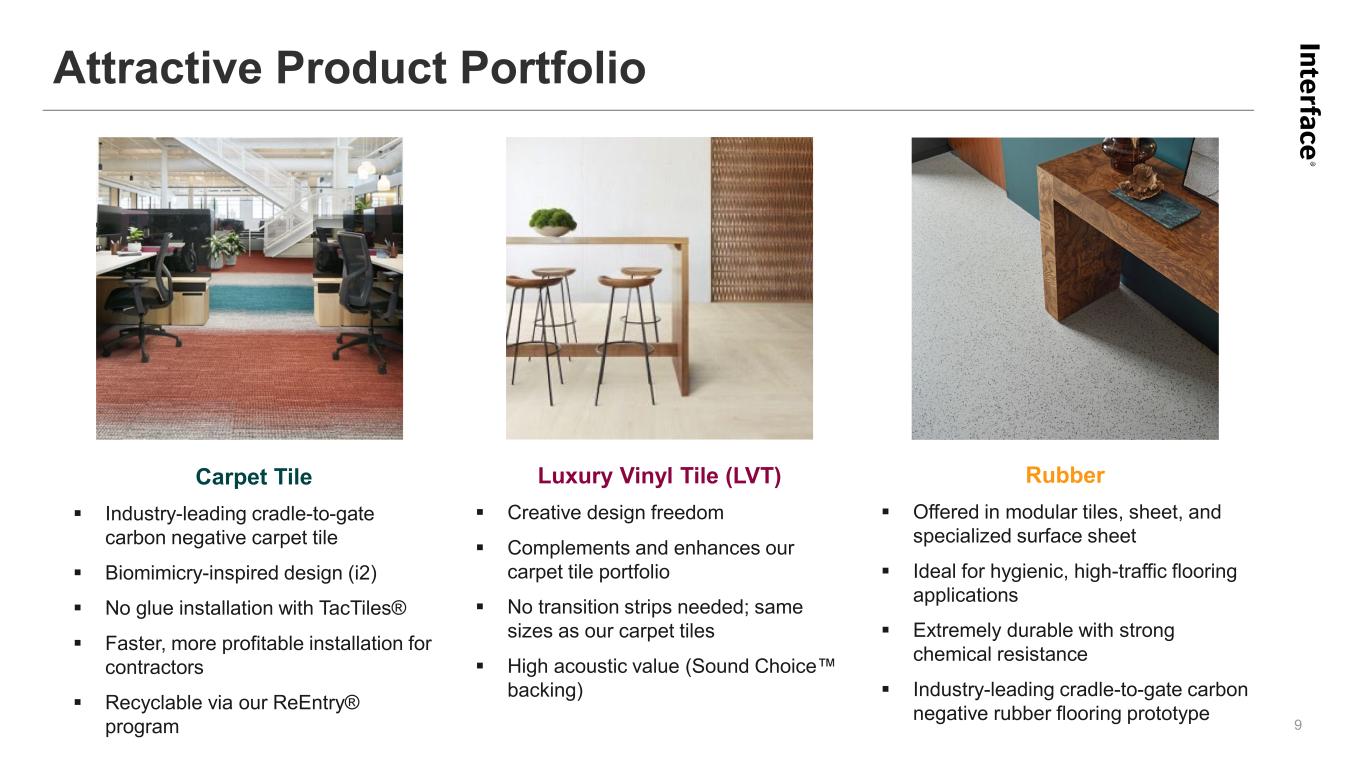
Attractive Product Portfolio 9 Carpet Tile Industry-leading cradle-to-gate carbon negative carpet tile Biomimicry-inspired design (i2) No glue installation with TacTiles® Faster, more profitable installation for contractors Recyclable via our ReEntry® program Luxury Vinyl Tile (LVT) Creative design freedom Complements and enhances our carpet tile portfolio No transition strips needed; same sizes as our carpet tiles High acoustic value (Sound Choice backing) Rubber Offered in modular tiles, sheet, and specialized surface sheet Ideal for hygienic, high-traffic flooring applications Extremely durable with strong chemical resistance Industry-leading cradle-to-gate carbon negative rubber flooring prototype
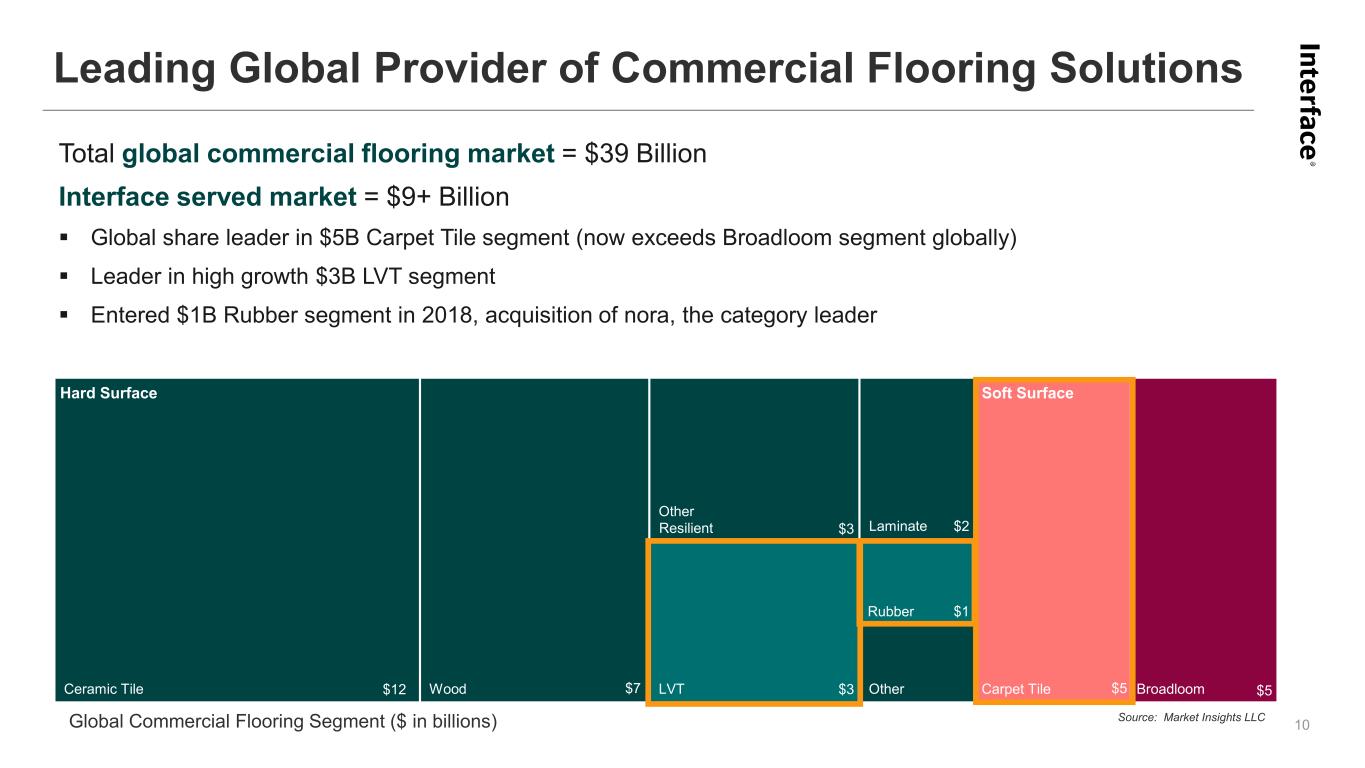
Total global commercial flooring market = $39 Billion Interface served market = $9+ Billion Global share leader in $5B Carpet Tile segment (now exceeds Broadloom segment globally) Leader in high growth $3B LVT segment Entered $1B Rubber segment in 2018, acquisition of nora, the category leader Source: Market Insights LLC Ceramic Tile Wood LVT Resilient Laminate Other BroadloomCarpet Tile Hard Surface Soft Surface $12 $7 $2 $1 $3 $3 $5 Other Global Commercial Flooring Segment ($ in billions) Leading Global Provider of Commercial Flooring Solutions 10 Rubber $5
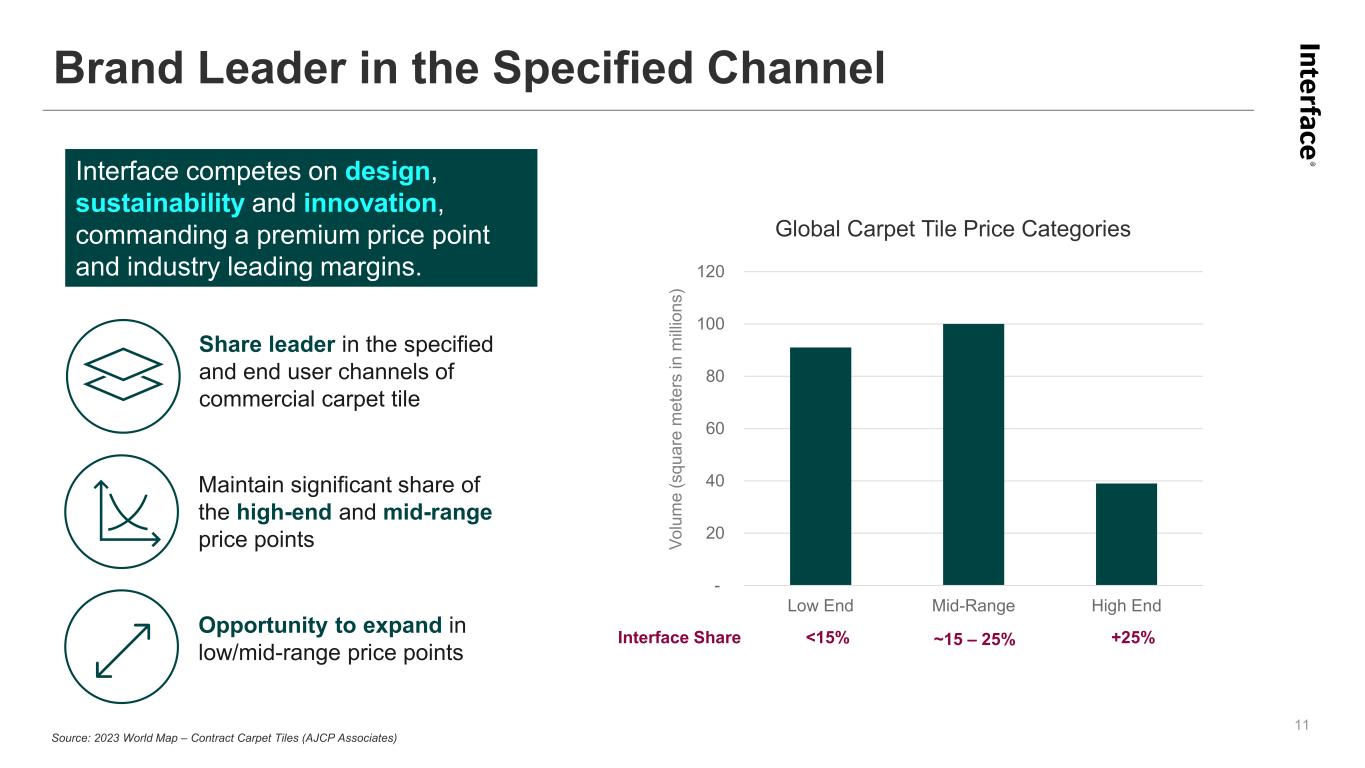
- 20 40 60 80 100 120 Low End Mid-Range High End Brand Leader in the Specified Channel 11 Interface competes on design, sustainability and innovation, commanding a premium price point and industry leading margins. Source: 2023 World Map – Contract Carpet Tiles (AJCP Associates) Opportunity to expand in low/mid-range price points Maintain significant share of the high-end and mid-range price points Share leader in the specified and end user channels of commercial carpet tile Global Carpet Tile Price Categories Interface Share <15% ~15 – 25% +25% Vo lu m e (s qu ar e m et er s in m illi on s)
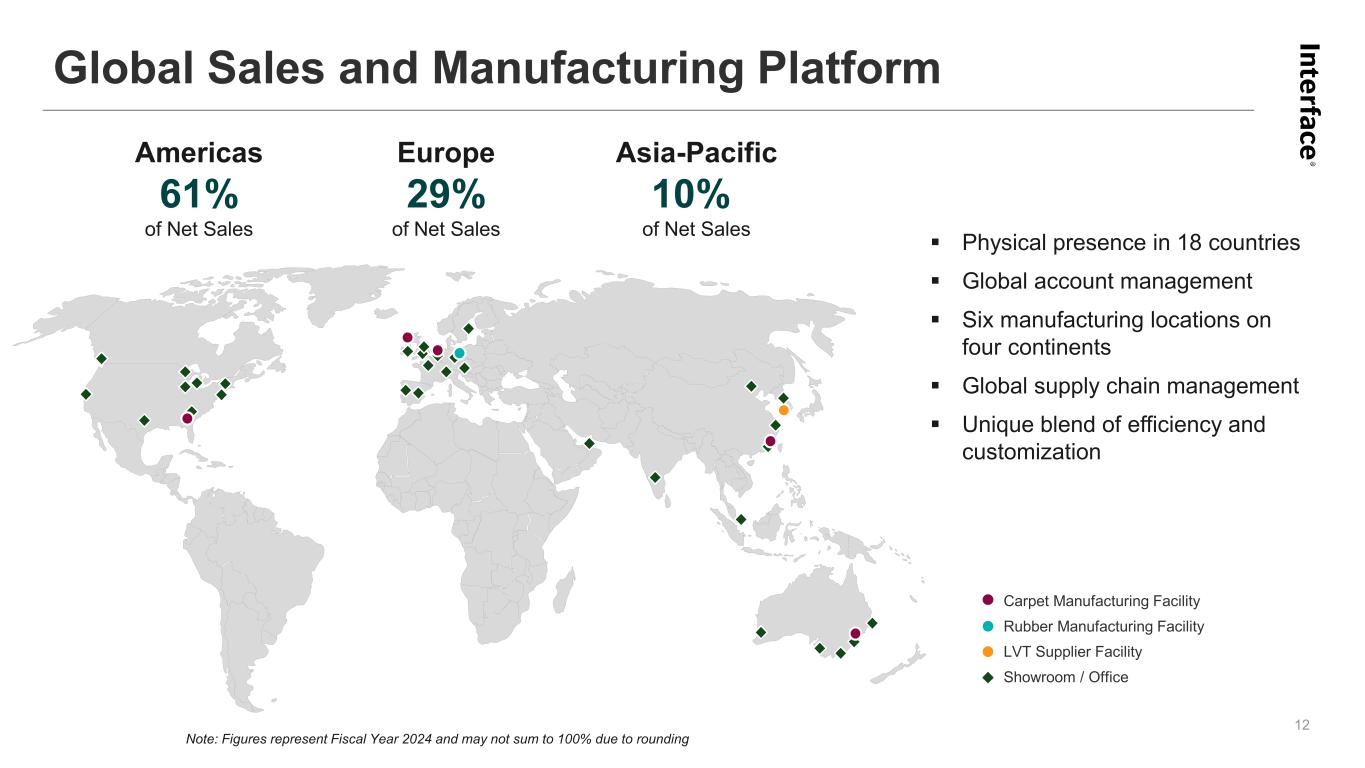
Physical presence in 18 countries Global account management Six manufacturing locations on four continents Global supply chain management Unique blend of efficiency and customization Note: Figures represent Fiscal Year 2024 and may not sum to 100% due to rounding Americas 61% of Net Sales Europe 29% of Net Sales Asia-Pacific 10% of Net Sales Carpet Manufacturing Facility Rubber Manufacturing Facility LVT Supplier Facility Showroom / Office Global Sales and Manufacturing Platform 12

ESG Overview
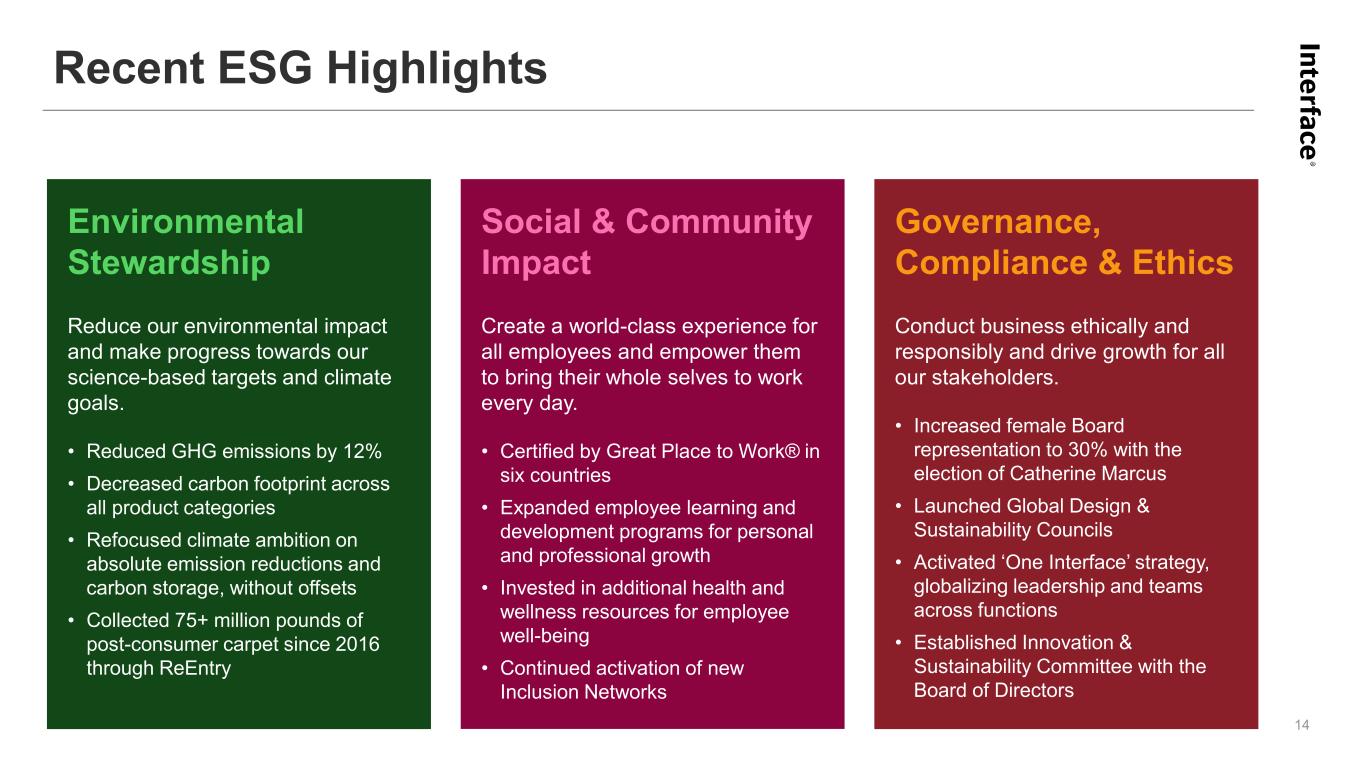
Recent ESG Highlights 14 Environmental Stewardship Reduce our environmental impact and make progress towards our science-based targets and climate goals. • Reduced GHG emissions by 12% • Decreased carbon footprint across all product categories • Refocused climate ambition on absolute emission reductions and carbon storage, without offsets • Collected 75+ million pounds of post-consumer carpet since 2016 through ReEntry Social & Community Impact Create a world-class experience for all employees and empower them to bring their whole selves to work every day. • Certified by Great Place to Work® in six countries • Expanded employee learning and development programs for personal and professional growth • Invested in additional health and wellness resources for employee well-being • Continued activation of new Inclusion Networks Governance, Compliance & Ethics Conduct business ethically and responsibly and drive growth for all our stakeholders. • Increased female Board representation to 30% with the election of Catherine Marcus • Launched Global Design & Sustainability Councils • Activated ‘One Interface’ strategy, globalizing leadership and teams across functions • Established Innovation & Sustainability Committee with the Board of Directors
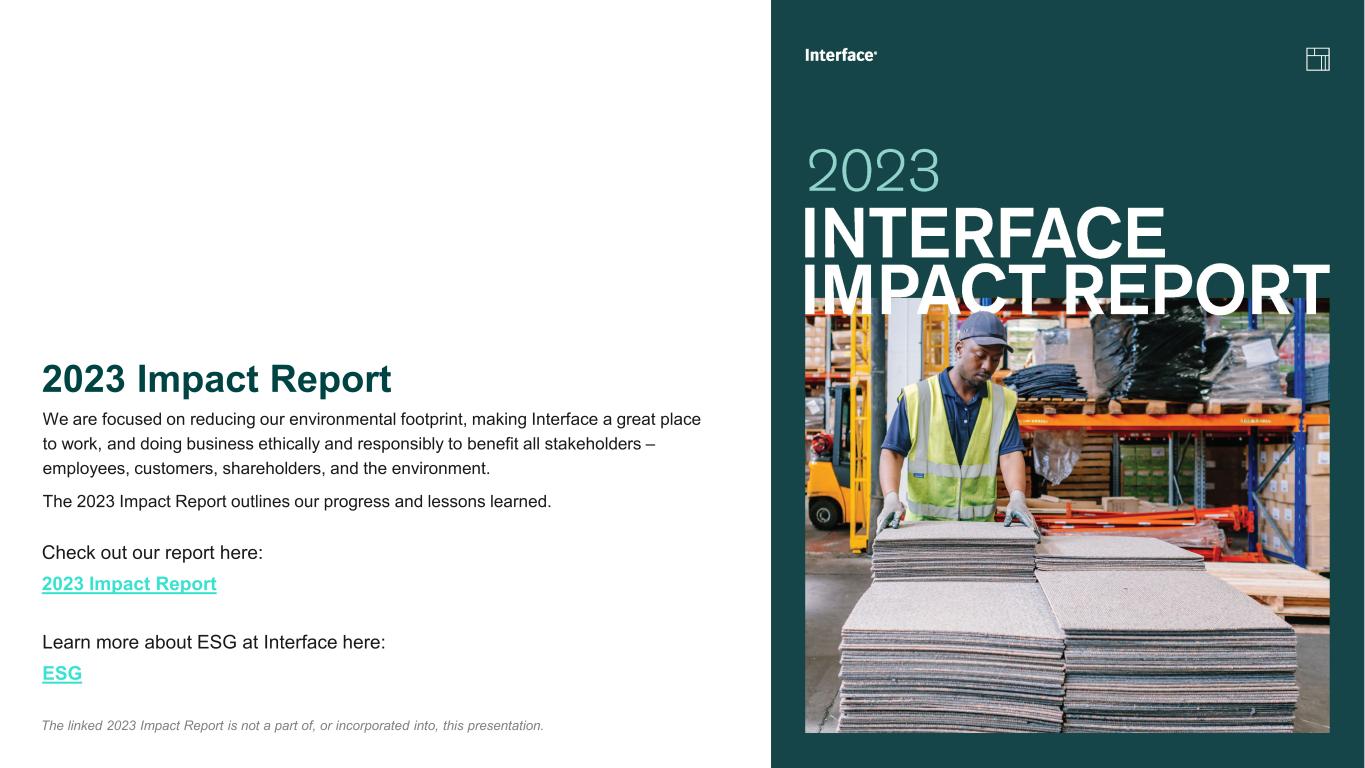
15 Check out our report here: 2023 Impact Report The linked 2023 Impact Report is not a part of, or incorporated into, this presentation. 2023 Impact Report We are focused on reducing our environmental footprint, making Interface a great place to work, and doing business ethically and responsibly to benefit all stakeholders – employees, customers, shareholders, and the environment. The 2023 Impact Report outlines our progress and lessons learned. Learn more about ESG at Interface here: ESG

Financial Performance
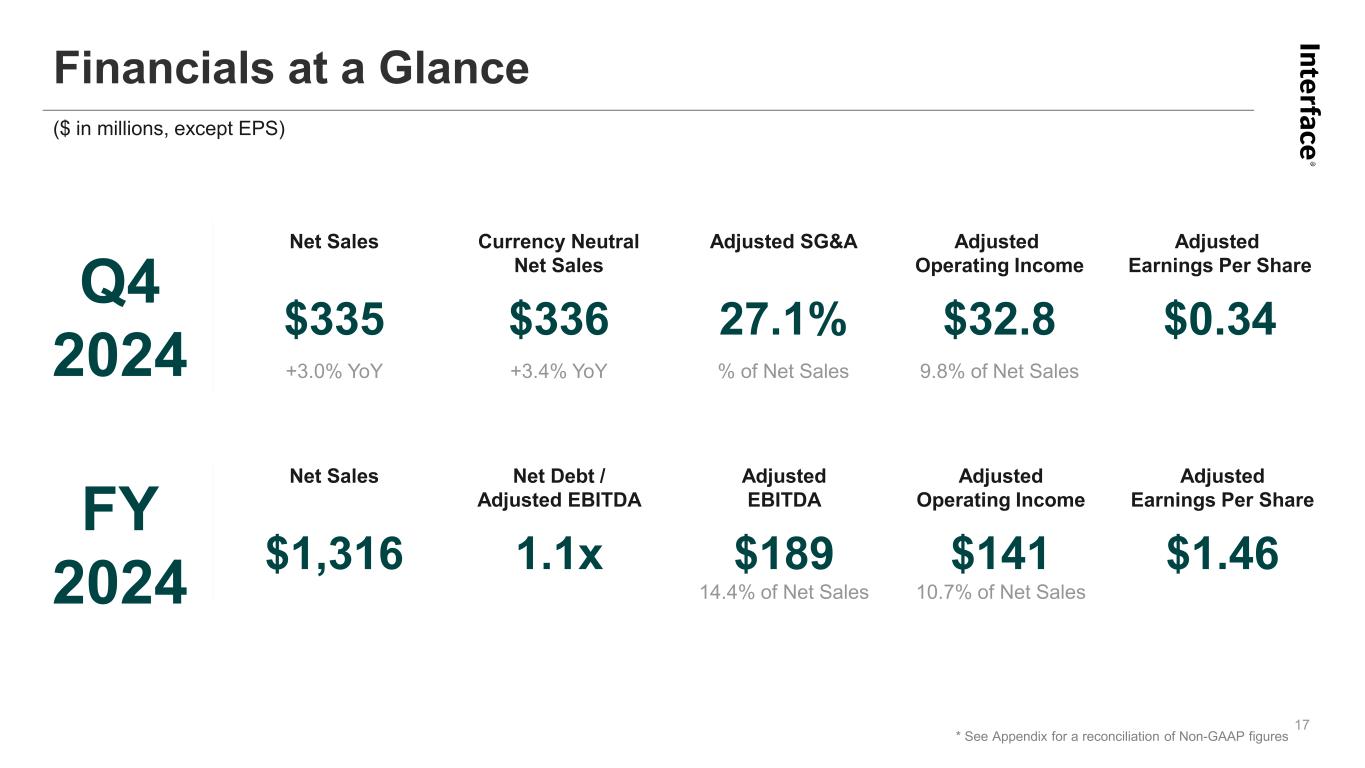
Financials at a Glance 17 Currency Neutral Net Sales $336 +3.4% YoY Net Sales $335 +3.0% YoY Adjusted SG&A 27.1% % of Net Sales Adjusted Operating Income $32.8 9.8% of Net Sales Net Debt / Adjusted EBITDA 1.1x Net Sales $1,316 Adjusted EBITDA $189 14.4% of Net Sales Adjusted Operating Income $141 10.7% of Net Sales Q4 2024 FY 2024 Adjusted Earnings Per Share $0.34 Adjusted Earnings Per Share $1.46 * See Appendix for a reconciliation of Non-GAAP figures ($ in millions, except EPS)
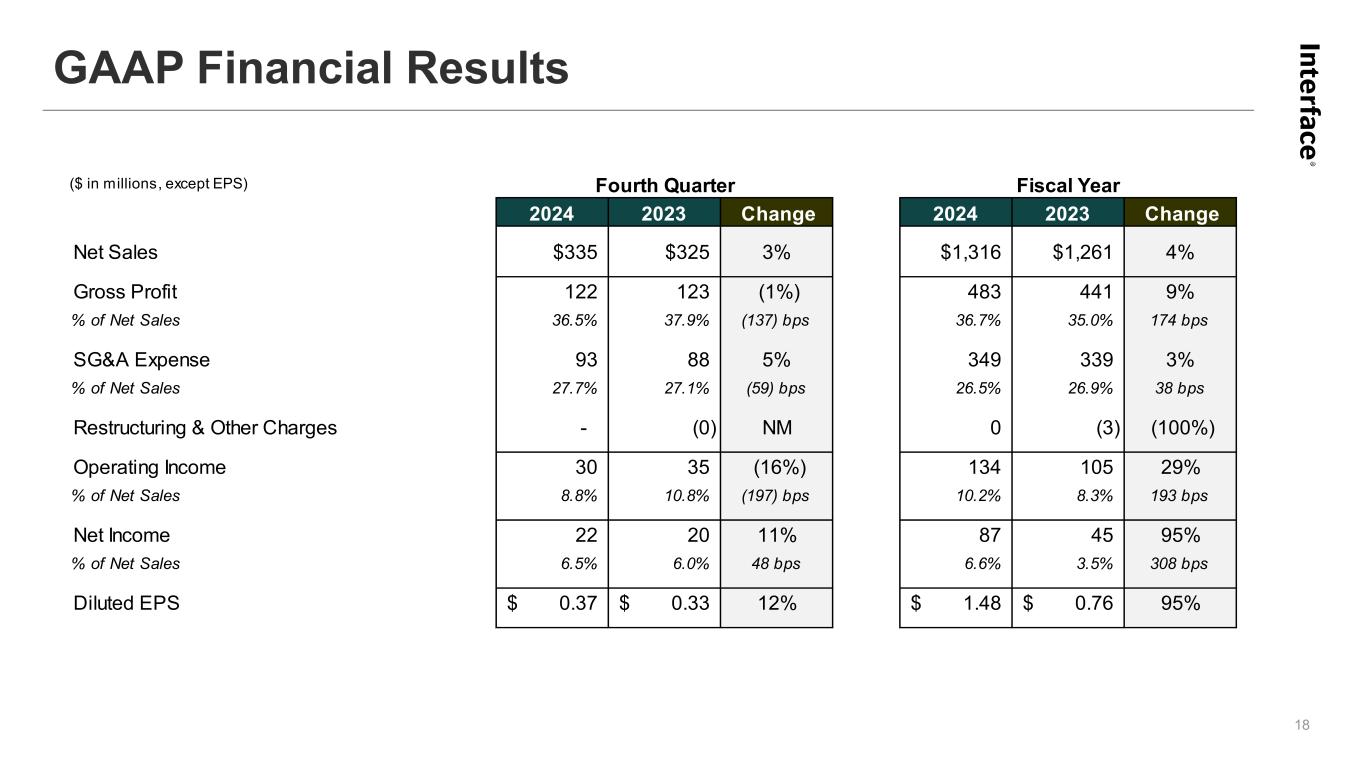
GAAP Financial Results 18 ($ in millions, except EPS) 2024 2023 Change 2024 2023 Change Net Sales $335 $325 3% $1,316 $1,261 4% Gross Profit 122 123 (1%) 483 441 9% % of Net Sales 36.5% 37.9% (137) bps 36.7% 35.0% 174 bps SG&A Expense 93 88 5% 349 339 3% % of Net Sales 27.7% 27.1% (59) bps 26.5% 26.9% 38 bps Restructuring & Other Charges - (0) NM 0 (3) (100%) Operating Income 30 35 (16%) 134 105 29% % of Net Sales 8.8% 10.8% (197) bps 10.2% 8.3% 193 bps Net Income 22 20 11% 87 45 95% % of Net Sales 6.5% 6.0% 48 bps 6.6% 3.5% 308 bps Diluted EPS 0.37$ 0.33$ 12% 1.48$ 0.76$ 95% Fourth Quarter Fiscal Year
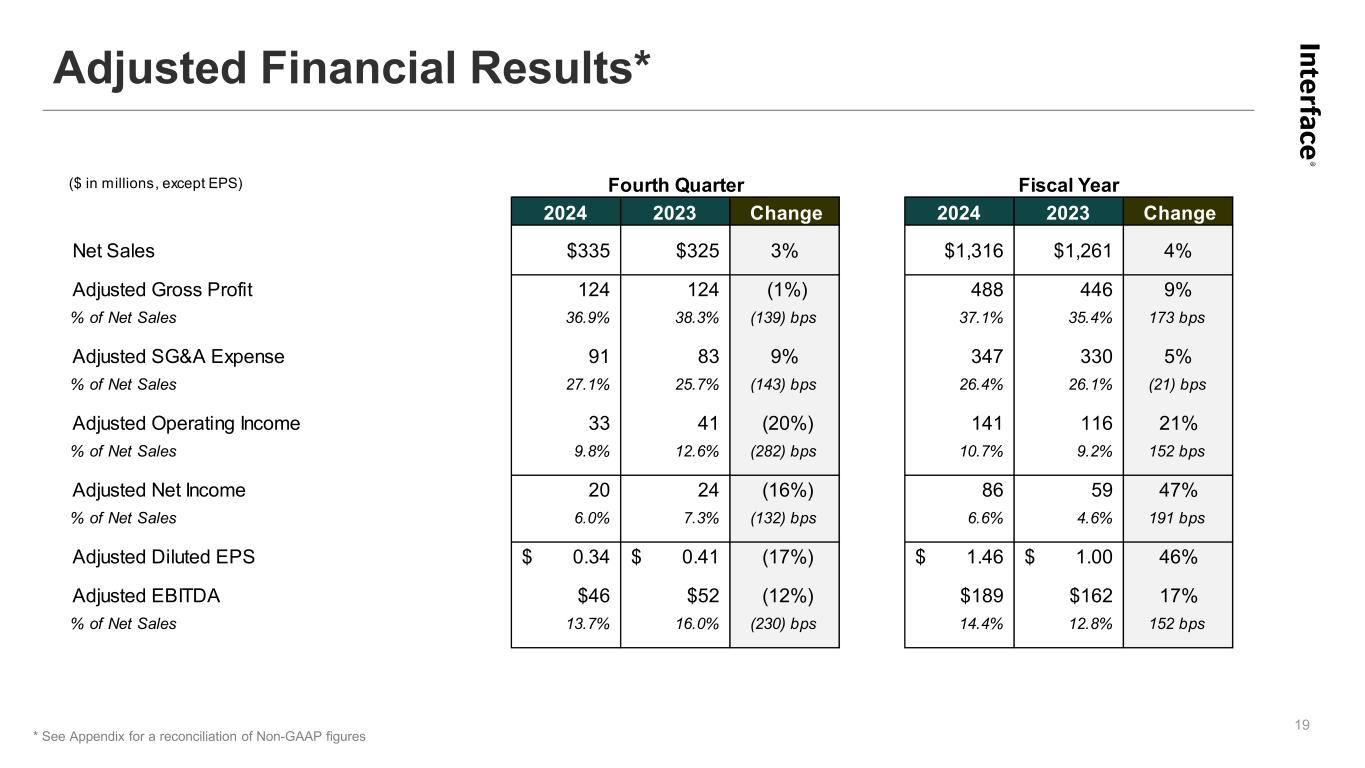
Adjusted Financial Results* 19 * See Appendix for a reconciliation of Non-GAAP figures ($ in millions, except EPS) 2024 2023 Change 2024 2023 Change Net Sales $335 $325 3% $1,316 $1,261 4% Adjusted Gross Profit 124 124 (1%) 488 446 9% % of Net Sales 36.9% 38.3% (139) bps 37.1% 35.4% 173 bps Adjusted SG&A Expense 91 83 9% 347 330 5% % of Net Sales 27.1% 25.7% (143) bps 26.4% 26.1% (21) bps Adjusted Operating Income 33 41 (20%) 141 116 21% % of Net Sales 9.8% 12.6% (282) bps 10.7% 9.2% 152 bps Adjusted Net Income 20 24 (16%) 86 59 47% % of Net Sales 6.0% 7.3% (132) bps 6.6% 4.6% 191 bps Adjusted Diluted EPS 0.34$ 0.41$ (17%) 1.46$ 1.00$ 46% Adjusted EBITDA $46 $52 (12%) $189 $162 17% % of Net Sales 13.7% 16.0% (230) bps 14.4% 12.8% 152 bps Fourth Quarter Fiscal Year
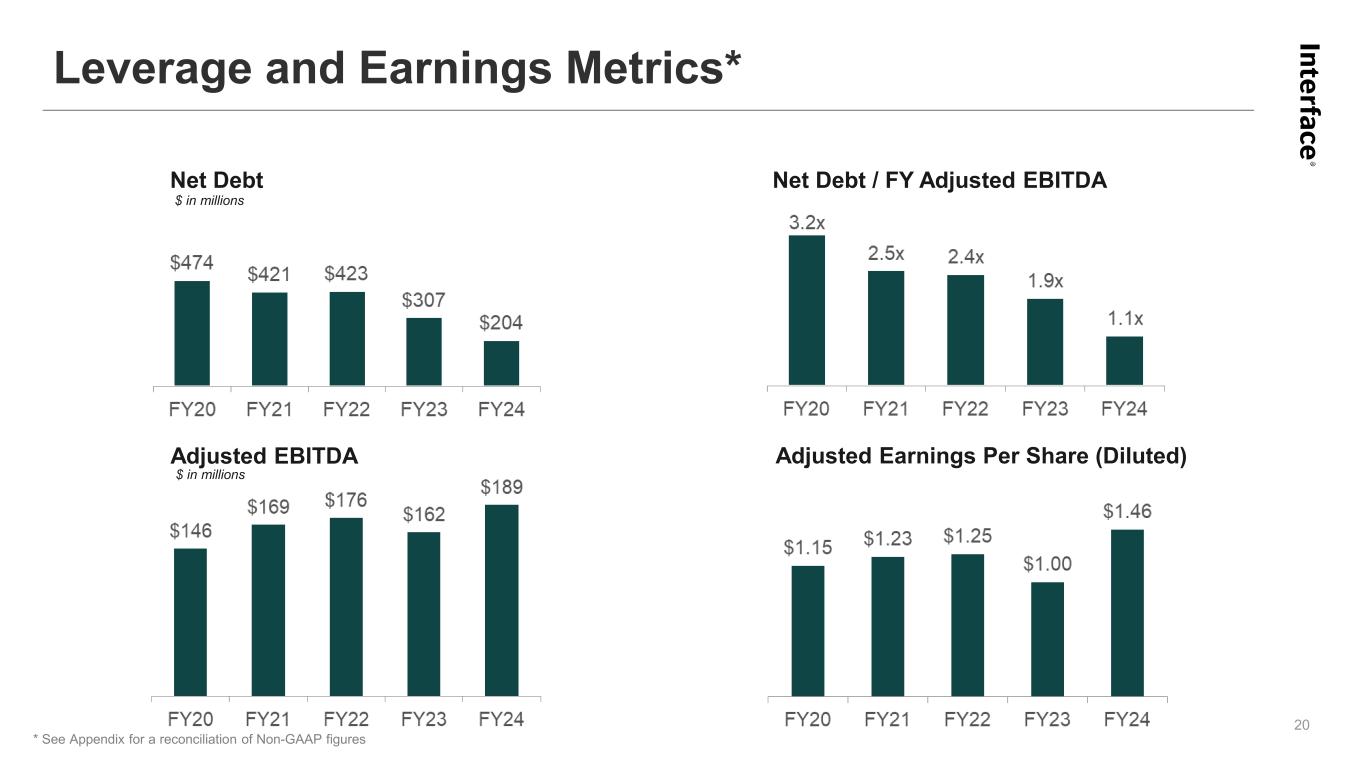
Adjusted EBITDA Adjusted Earnings Per Share (Diluted) Net Debt / FY Adjusted EBITDANet Debt Leverage and Earnings Metrics* 20 $ in millions * See Appendix for a reconciliation of Non-GAAP figures $ in millions
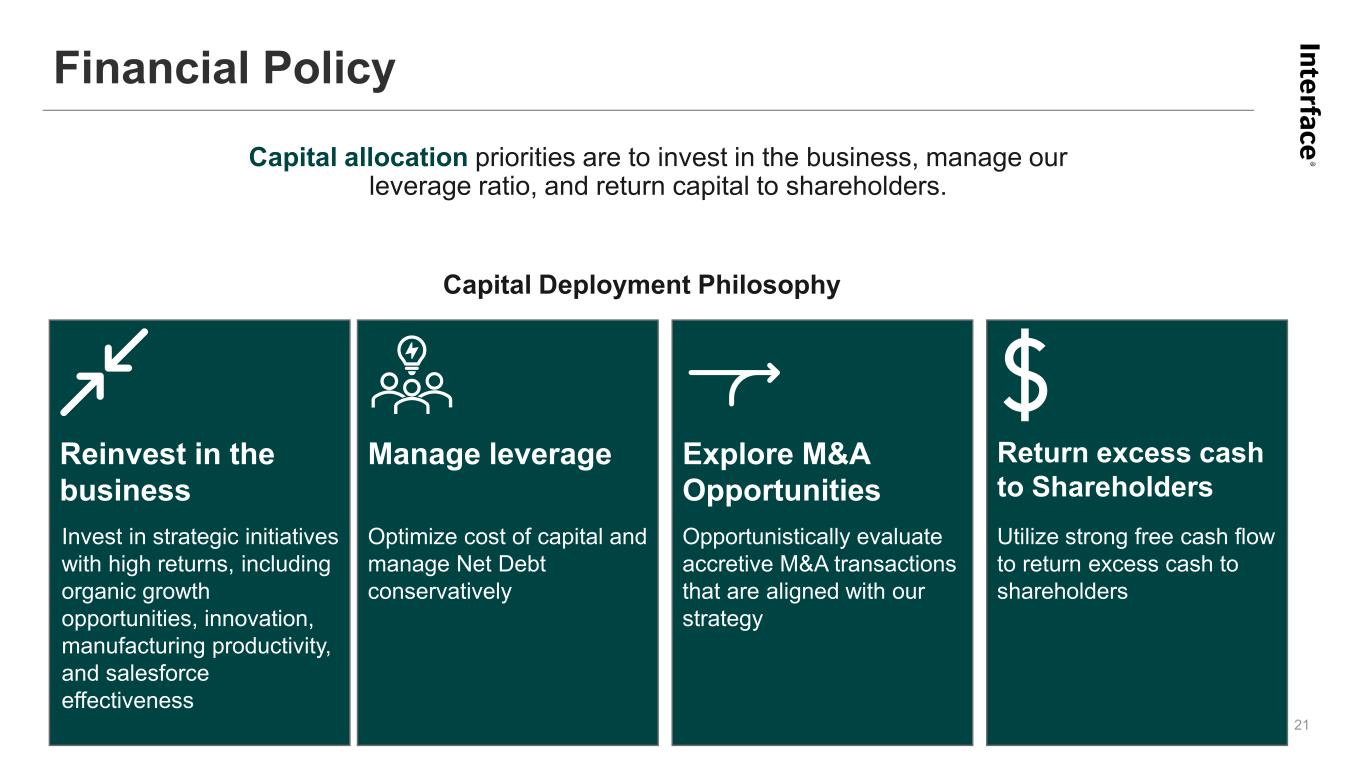
Financial Policy 21 Capital allocation priorities are to invest in the business, manage our leverage ratio, and return capital to shareholders. Reinvest in the business Invest in strategic initiatives with high returns, including organic growth opportunities, innovation, manufacturing productivity, and salesforce effectiveness Manage leverage Optimize cost of capital and manage Net Debt conservatively Explore M&A Opportunities Opportunistically evaluate accretive M&A transactions that are aligned with our strategy Return excess cash to Shareholders Utilize strong free cash flow to return excess cash to shareholders Capital Deployment Philosophy

Appendix
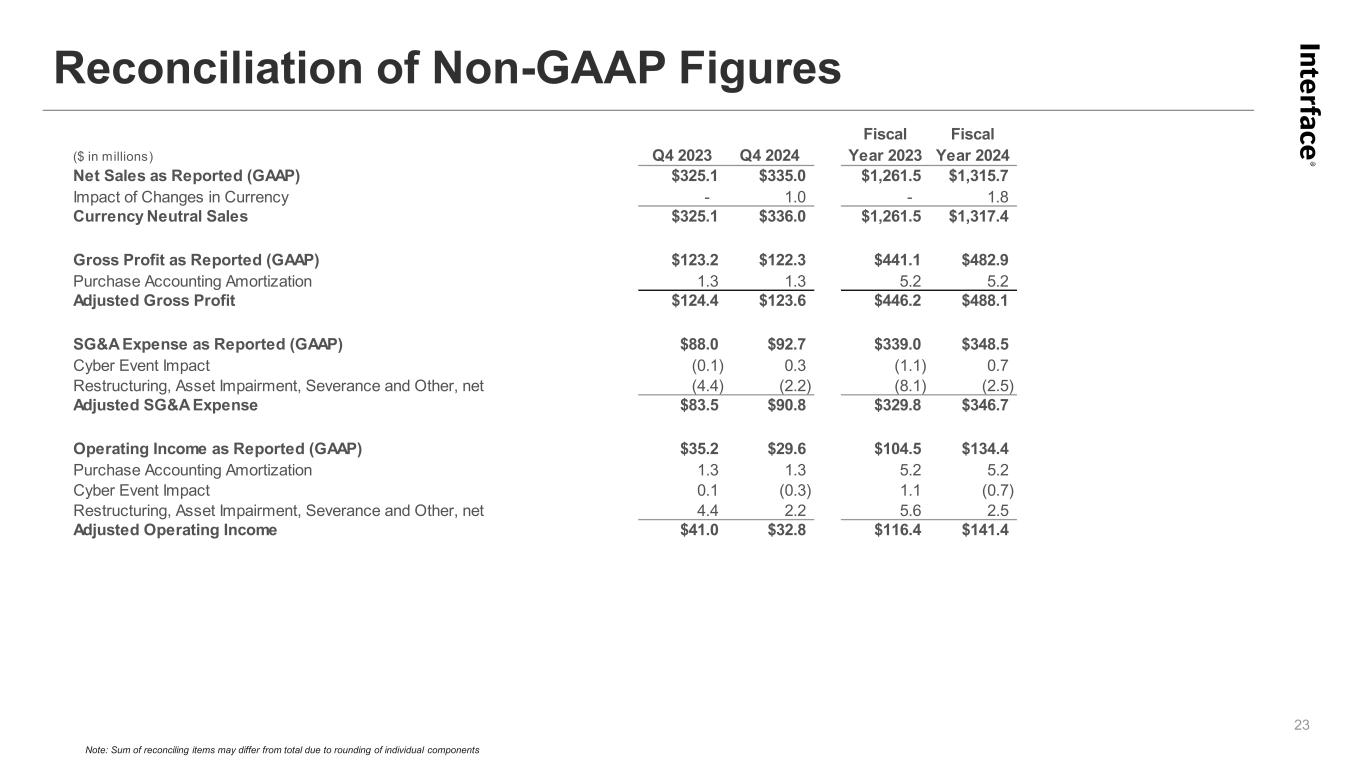
Reconciliation of Non-GAAP Figures 23 Note: Sum of reconciling items may differ from total due to rounding of individual components ($ in millions) Q4 2023 Q4 2024 Fiscal Year 2023 Fiscal Year 2024 Net Sales as Reported (GAAP) $325.1 $335.0 $1,261.5 $1,315.7 Impact of Changes in Currency - 1.0 - 1.8 Currency Neutral Sales $325.1 $336.0 $1,261.5 $1,317.4 Gross Profit as Reported (GAAP) $123.2 $122.3 $441.1 $482.9 Purchase Accounting Amortization 1.3 1.3 5.2 5.2 Adjusted Gross Profit $124.4 $123.6 $446.2 $488.1 SG&A Expense as Reported (GAAP) $88.0 $92.7 $339.0 $348.5 Cyber Event Impact (0.1) 0.3 (1.1) 0.7 Restructuring, Asset Impairment, Severance and Other, net (4.4) (2.2) (8.1) (2.5) Adjusted SG&A Expense $83.5 $90.8 $329.8 $346.7 Operating Income as Reported (GAAP) $35.2 $29.6 $104.5 $134.4 Purchase Accounting Amortization 1.3 1.3 5.2 5.2 Cyber Event Impact 0.1 (0.3) 1.1 (0.7) Restructuring, Asset Impairment, Severance and Other, net 4.4 2.2 5.6 2.5 Adjusted Operating Income $41.0 $32.8 $116.4 $141.4
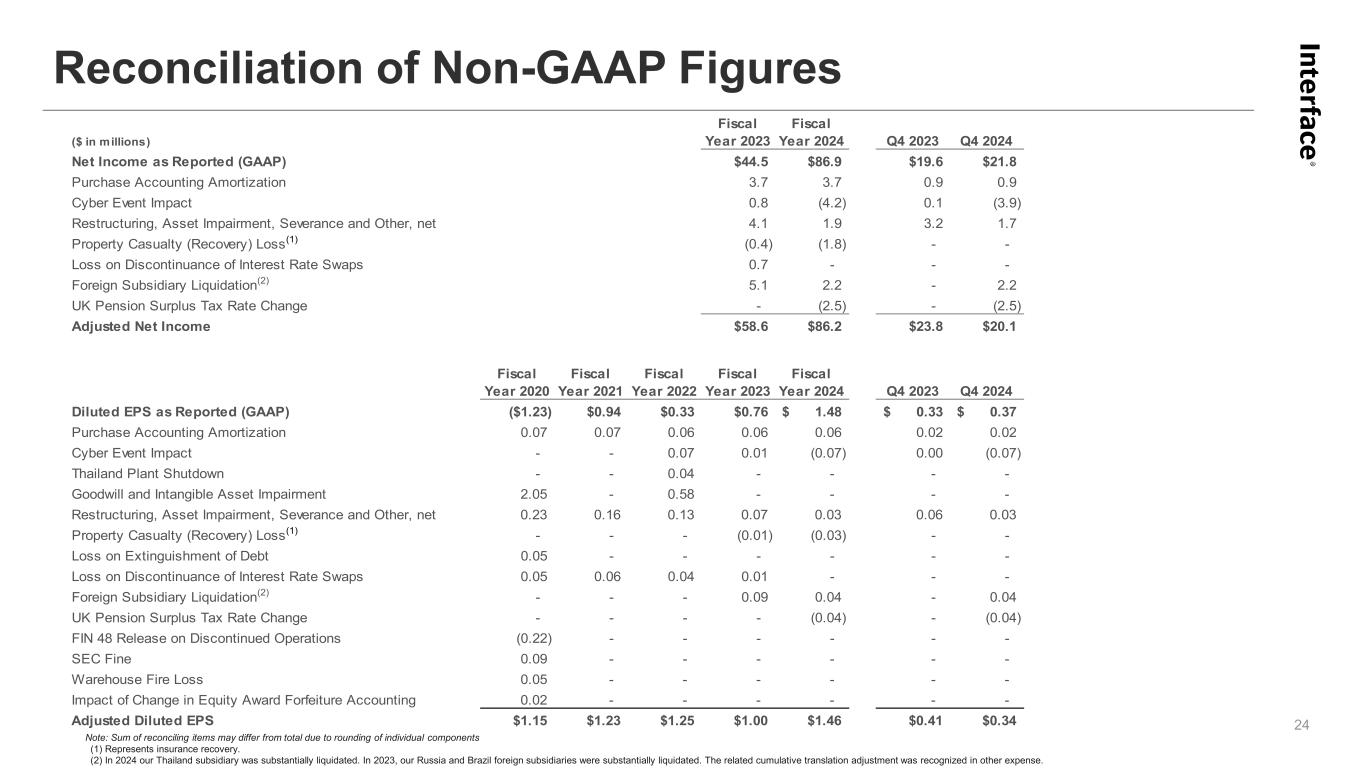
($ in millions) Fiscal Year 2023 Fiscal Year 2024 Q4 2023 Q4 2024 Net Income as Reported (GAAP) $44.5 $86.9 $19.6 $21.8 Purchase Accounting Amortization 3.7 3.7 0.9 0.9 Cyber Event Impact 0.8 (4.2) 0.1 (3.9) Restructuring, Asset Impairment, Severance and Other, net 4.1 1.9 3.2 1.7 Property Casualty (Recovery) Loss(1) (0.4) (1.8) - - Loss on Discontinuance of Interest Rate Swaps 0.7 - - - Foreign Subsidiary Liquidation(2) 5.1 2.2 - 2.2 UK Pension Surplus Tax Rate Change - (2.5) - (2.5) Adjusted Net Income $58.6 $86.2 $23.8 $20.1 Fiscal Year 2020 Fiscal Year 2021 Fiscal Year 2022 Fiscal Year 2023 Fiscal Year 2024 Q4 2023 Q4 2024 Diluted EPS as Reported (GAAP) ($1.23) $0.94 $0.33 $0.76 1.48$ 0.33$ 0.37$ Purchase Accounting Amortization 0.07 0.07 0.06 0.06 0.06 0.02 0.02 Cyber Event Impact - - 0.07 0.01 (0.07) 0.00 (0.07) Thailand Plant Shutdown - - 0.04 - - - - Goodwill and Intangible Asset Impairment 2.05 - 0.58 - - - - Restructuring, Asset Impairment, Severance and Other, net 0.23 0.16 0.13 0.07 0.03 0.06 0.03 Property Casualty (Recovery) Loss(1) - - - (0.01) (0.03) - - Loss on Extinguishment of Debt 0.05 - - - - - - Loss on Discontinuance of Interest Rate Swaps 0.05 0.06 0.04 0.01 - - - Foreign Subsidiary Liquidation(2) - - - 0.09 0.04 - 0.04 UK Pension Surplus Tax Rate Change - - - - (0.04) - (0.04) FIN 48 Release on Discontinued Operations (0.22) - - - - - - SEC Fine 0.09 - - - - - - Warehouse Fire Loss 0.05 - - - - - - Impact of Change in Equity Award Forfeiture Accounting 0.02 - - - - - - Adjusted Diluted EPS $1.15 $1.23 $1.25 $1.00 $1.46 $0.41 $0.34 Reconciliation of Non-GAAP Figures 24 Note: Sum of reconciling items may differ from total due to rounding of individual components (1) Represents insurance recovery. (2) In 2024 our Thailand subsidiary was substantially liquidated. In 2023, our Russia and Brazil foreign subsidiaries were substantially liquidated. The related cumulative translation adjustment was recognized in other expense.
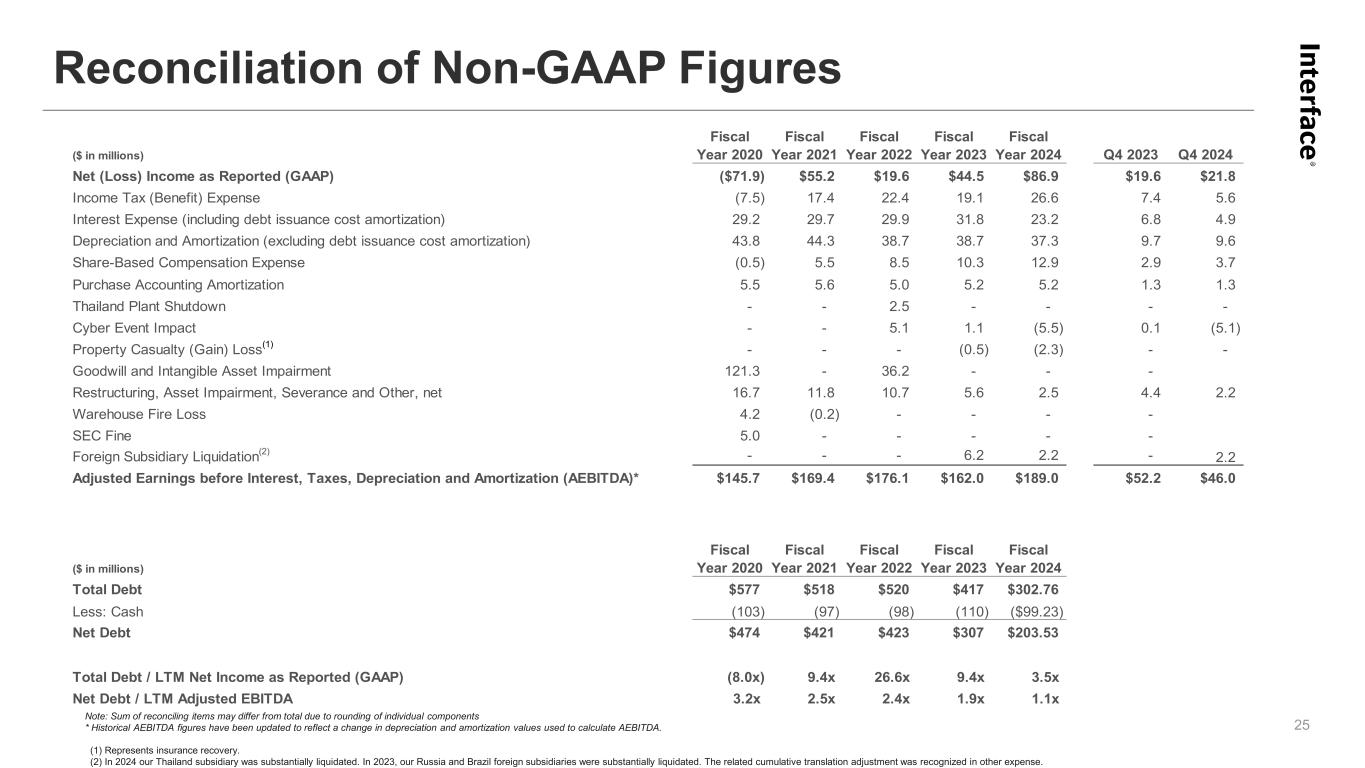
($ in millions) Fiscal Year 2020 Fiscal Year 2021 Fiscal Year 2022 Fiscal Year 2023 Fiscal Year 2024 Q4 2023 Q4 2024 Net (Loss) Income as Reported (GAAP) ($71.9) $55.2 $19.6 $44.5 $86.9 $19.6 $21.8 Income Tax (Benefit) Expense (7.5) 17.4 22.4 19.1 26.6 7.4 5.6 Interest Expense (including debt issuance cost amortization) 29.2 29.7 29.9 31.8 23.2 6.8 4.9 Depreciation and Amortization (excluding debt issuance cost amortization) 43.8 44.3 38.7 38.7 37.3 9.7 9.6 Share-Based Compensation Expense (0.5) 5.5 8.5 10.3 12.9 2.9 3.7 Purchase Accounting Amortization 5.5 5.6 5.0 5.2 5.2 1.3 1.3 Thailand Plant Shutdown - - 2.5 - - - - Cyber Event Impact - - 5.1 1.1 (5.5) 0.1 (5.1) Property Casualty (Gain) Loss(1) - - - (0.5) (2.3) - - Goodwill and Intangible Asset Impairment 121.3 - 36.2 - - - Restructuring, Asset Impairment, Severance and Other, net 16.7 11.8 10.7 5.6 2.5 4.4 2.2 Warehouse Fire Loss 4.2 (0.2) - - - - SEC Fine 5.0 - - - - - Foreign Subsidiary Liquidation(2) - - - 6.2 2.2 - 2.2 Adjusted Earnings before Interest, Taxes, Depreciation and Amortization (AEBITDA)* $145.7 $169.4 $176.1 $162.0 $189.0 $52.2 $46.0 ($ in millions) Fiscal Year 2020 Fiscal Year 2021 Fiscal Year 2022 Fiscal Year 2023 Fiscal Year 2024 Total Debt $577 $518 $520 $417 $302.76 Less: Cash (103) (97) (98) (110) ($99.23) Net Debt $474 $421 $423 $307 $203.53 Total Debt / LTM Net Income as Reported (GAAP) (8.0x) 9.4x 26.6x 9.4x 3.5x Net Debt / LTM Adjusted EBITDA 3.2x 2.5x 2.4x 1.9x 1.1x Note: Sum of reconciling items may differ from total due to rounding of individual components * Historical AEBITDA figures have been updated to reflect a change in depreciation and amortization values used to calculate AEBITDA. (1) Represents insurance recovery. (2) In 2024 our Thailand subsidiary was substantially liquidated. In 2023, our Russia and Brazil foreign subsidiaries were substantially liquidated. The related cumulative translation adjustment was recognized in other expense. Reconciliation of Non-GAAP Figures 25