TRLV 8-K
Trulieve Cannabis Corp. (TRLV)
8-K
2026-08-07
For: 2026-08-07
View Original
Added on
August 07, 2026
UNITED STATES
SECURITIES AND EXCHANGE COMMISSION
Washington, D.C. 20549
____________________
FORM 8-K
___________________
CURRENT REPORT
Pursuant to Section 13 or 15(d)
of the Securities Exchange Act of 1934
Date of Report (Date of Earliest Event Reported): August 7, 2026
___________________
(Exact Name of Registrant as specified in its charter)
___________________
(State or Other Jurisdiction of Incorporation) | (Commission File Number) | (IRS Employer Identification No.) | ||||||
(Address of principal executive offices and zip code)
(
(Registrant’s telephone number, including area code)
Not Applicable
(Registrant’s name or former address, if change since last report)
___________________
Check the appropriate box below if the Form 8-K filing is intended to simultaneously satisfy the filing obligation of the registrant under any of the following provisions:
| Written communications pursuant to Rule 425 under the Securities Act (17 CFR 230.425) | |||||
| Soliciting material pursuant to Rule 14a-12 under the Exchange Act (17 CFR 240.14a-12) | |||||
| Pre-commencement communications pursuant to Rule 14d-2(b) under the Exchange Act (17 CFR 240.14d-2(b)) | |||||
| Pre-commencement communications pursuant to Rule 13e-4(c) under the Exchange Act (17 CFR 240.13e-4(c)) | |||||
Securities registered pursuant to Section 12(b) of the Act:
| Title of each class | Trading Symbol(s) | Name of each exchange on which registered | ||||||||||||
Indicate by check mark whether the registrant is an emerging growth company as defined in Rule 405 of the Securities Act of 1933 (§230.405 of this chapter) or Rule 12b-2 of the Securities Exchange Act of 1934 (§240.12b-2 of this chapter).
Emerging Growth Company o
If an emerging growth company, indicate by check mark if the registrant has elected not to use the extended transition period for complying with any new or revised financial accounting standards pursuant to Section 13(a) of the Exchange Act. o
Item 2.02 Results of Operations and Financial Condition.
On August 7, 2026, Trulieve Cannabis Corp. (the “Company”) announced via press release its results for the three and six months ended June 30, 2026. A copy of the Company’s press release is hereby furnished to the Commission and incorporated herein by reference as Exhibit 99.1.
Item 7.01 Regulation FD Disclosure.
The Company from time to time presents at various industry and other conferences and provides summary business information. A copy of the slide presentation that will be used by representatives of the Company in connection with such presentations (the “Corporate Presentation”) is attached to this Current Report on Form 8-K as Exhibit 99.2. The Corporate Presentation is current as of August 7, 2026, and the Company disclaims any obligation to correct or update this material in the future.
Item 9.01. Financial Statements and Exhibits.
(d)Exhibits
Exhibit No. | Description | |||||||
| 99.1* | ||||||||
| 99.2* | ||||||||
| 104 | Cover Page Interactive Data File (embedded within the Inline XBRL document) | |||||||
*The information in the press release attached as Exhibit 99.1 and the corporate presentation attached as Exhibit 99.2 is intended to be furnished and shall not be deemed “filed” for purposes of Section 18 of the Securities Exchange Act of 1934 (the “Exchange Act”) or otherwise subject to the liabilities of that section, nor shall it be deemed incorporated by reference in any filing under the Securities Act of 1933 or the Exchange Act, except as expressly set forth by specific reference in such filing.
SIGNATURE
Pursuant to the requirements of the Securities Exchange Act of 1934, as amended, the registrant has duly caused this report to be signed on its behalf by the undersigned hereunto duly authorized.
| Trulieve Cannabis Corp. | ||||||||
| By: | /s/ Eric Powers | |||||||
| Name: | Eric Powers | |||||||
| Title: | Chief Legal Officer | |||||||
Date: August 7, 2026
Exhibit 99.1

Trulieve Reports Second Quarter 2026 Results
•Second quarter revenue of $271 million, with 60% gross margin | ||
•Cash flow from operations of $109 million and free cash flow of $74 million* in first half of 2026 | ||
•First U.S. Cannabis Company listed on New York Stock Exchange under ticker "TRLV" | ||
Tallahassee, FL – August 7, 2026 – Trulieve Cannabis Corp. (NYSE: TRLV) (“Trulieve” or “the Company”), a leading and top-performing medical cannabis company in the U.S., today announced its results for the quarter ended June 30, 2026. Results are reported in U.S. dollars and in accordance with U.S. Generally Accepted Accounting Principles (GAAP), unless otherwise indicated. Numbers may not sum perfectly due to rounding. Second quarter 2026 results include both Trulieve and Harvest operations until the deconsolidation of Harvest on June 3, 2026, and Trulieve medical only operations for the remainder of June.
Q2 2026 Financial and Operational Highlights*
•Revenue of $271 million, with 94% of revenue from retail sales.
•Achieved gross margin of 60%, with GAAP gross profit of $162 million.
•Reported net loss attributable to common shareholders of $406 million or $2.10 per share, includes $407 million impact from the Harvest deconsolidation and equity investment. Adjusted net income of $20 million* or $0.11 per share, excludes non-recurring charges, asset impairments, disposals, unconsolidated entity, deconsolidation transaction, and discontinued operations.
•Achieved adjusted EBITDA of $98 million*, or 36% of revenue.
•Generated cash flow from operations of $53 million and free cash flow of $32 million*.
•Cash at quarter end was $325 million.
•Filed applications to register state licensed medical marijuana operations with the Drug Enforcement Agency following federal rescheduling of medical marijuana to Schedule III.
•Completed deconsolidation of Harvest mixed medical and adult use state operations.
•Listed on the New York Stock Exchange under ticker TRLV.
•Announced share repurchase program up to the lesser of $50 million or 8,495,038 subordinate voting shares.
•Began shipment of medical cannabis products to licensed independent pharmacies in Georgia.
•Opened four dispensaries in Belleview, Boca Raton, Lutz, and Tallahassee, Florida.
*See “Non-GAAP Financial Measures” below for additional information and a reconciliation to GAAP for Non-GAAP metrics.
Recent Developments
•Obtained shareholder and Board approval for the concurrent domestication of the Company to Delaware and continuance out of British Columbia.
•Commemorated Georgia medical cannabis program expansion on July 1 with new product launches and onsite activations across our dispensary network.
•Named to TIME's America's Best Companies 2026 List.
•Opened one dispensary in Marco Island, Florida.
•Currently operate 207 retail dispensaries and 3.5 million square feet of cultivation and processing capacity in the United States.
Management Commentary
“We made history this quarter as the first U.S. cannabis company to list on the New York Stock Exchange following rescheduling of medical marijuana,” said Kim Rivers, Trulieve CEO. “With broader cannabis rescheduling and state program expansion in markets like Georgia and Texas on the horizon, Trulieve is well positioned to leverage its scale, financial strength, and branded products to drive future growth.”
Financial Highlights*
| Results of Operations | For the Three Months Ended | For the Six Months Ended | |||||||||||||||||||||||||||||||||||||||
| (Figures in millions except per share data) | June 30, 2026† | June 30, 2025 | % Better / (Worse) | March 31, 2026 | % Better / (Worse) | June 30, 2026† | June 30, 2025 | % Better / (Worse) | |||||||||||||||||||||||||||||||||
| Revenue | $ | 271 | $ | 302 | (10%) | $ | 287 | (6%) | $ | 558 | $ | 600 | (7%) | ||||||||||||||||||||||||||||
| Gross profit | $ | 162 | $ | 183 | (11%) | $ | 170 | (5%) | $ | 332 | $ | 366 | (9%) | ||||||||||||||||||||||||||||
| Gross margin % | 60% | 61% | 59% | 60% | 61% | ||||||||||||||||||||||||||||||||||||
| Operating expenses | $ | 533 | $ | 130 | NMF | $ | 134 | NMF | $ | 667 | $ | 280 | (138%) | ||||||||||||||||||||||||||||
| Operating expenses % | 197% | 43% | 47% | 120% | 47% | ||||||||||||||||||||||||||||||||||||
| Net (loss) income** | $ | (406) | $ | (14) | NMF | $ | 2 | NMF | $ | (404) | $ | (47) | NMF | ||||||||||||||||||||||||||||
| Net (loss) income continuing operations | $ | (405) | $ | (16) | NMF | $ | 3 | NMF | $ | (402) | $ | (48) | NMF | ||||||||||||||||||||||||||||
| Adjusted net income (loss) | $ | 20 | $ | (8) | NMF | $ | 20 | 1% | $ | 41 | $ | (11) | NMF | ||||||||||||||||||||||||||||
| Diluted shares outstanding | 193 | 191 | 198 | 193 | 191 | ||||||||||||||||||||||||||||||||||||
| Diluted EPS continuing operations | $ | (2.10) | $ | (0.07) | NMF | $ | 0.02 | NMF | $ | (2.09) | $ | (0.23) | NMF | ||||||||||||||||||||||||||||
| Adjusted Diluted EPS | $ | 0.11 | $ | (0.04) | NMF | $ | 0.10 | 4% | $ | 0.21 | $ | (0.06) | NMF | ||||||||||||||||||||||||||||
| Adjusted EBITDA | $ | 98 | $ | 111 | (11%) | $ | 100 | (2%) | $ | 198 | $ | 220 | (10%) | ||||||||||||||||||||||||||||
| Adjusted EBITDA Margin % | 36% | 37% | 35% | 36% | 37% | ||||||||||||||||||||||||||||||||||||
NMF - No Meaningful Figure
†Q2:26 reported results reflect the deconsolidation of Harvest on June 3, 2026.
*See “Non-GAAP Financial Measures” below for additional information and a reconciliation to GAAP for Non-GAAP metrics.
**Net (loss) income attributable to common shareholders which excludes non-controlling interest.
Conference Call
The Company will host a conference call and live audio webcast on August 7, 2026, at 8:30 A.M. Eastern time, to discuss its second quarter 2026 financial results. Interested parties can join the conference call by dialing in as directed below. Please dial in 15 minutes prior to the call.
| North American toll free: 1-844-824-3830 | Passcode: 9497090 | |||||||
| International: 1-412-542-4136 | Passcode: 9497090 | |||||||
A live audio webcast of the conference call will be available at:
Trulieve Second Quarter 2026 Results Call
A powerpoint presentation and archived replay of the webcast will be available at:
https://investors.trulieve.com/events
The Company’s Form 10-Q for the quarter ended June 30, 2026 will be available on the SEC’s website or at https://investors.trulieve.com/quarterly-results. The Company’s Management's Discussion and Analysis for the period and the accompanying financial statements and notes will be available under the Company’s profile on https://www.sedarplus.ca and on its website at https://investors.trulieve.com/quarterly-results. This news release is not in any way a substitute for reading those financial statements, including the notes to the financial statements.
Trulieve Cannabis Corp.
Condensed Consolidated Balance Sheets (Unaudited)
(in millions, except for share data)
| June 30, 2026 | December 31, 2025 | ||||||||||
| ASSETS | |||||||||||
| Current Assets: | |||||||||||
| Cash and cash equivalents | $ | 325.4 | $ | 255.5 | |||||||
| Accounts receivable, net | 3.9 | 10.5 | |||||||||
| Inventories | 186.9 | 242.3 | |||||||||
| Income tax receivable | 0.2 | 8.5 | |||||||||
| Notes receivable - current portion, net | 0.1 | 1.2 | |||||||||
| Prepaid expenses | 20.7 | 18.3 | |||||||||
| Other current assets | 4.7 | 25.5 | |||||||||
| Management services agreement receivable, related party | 22.9 | — | |||||||||
| Assets associated with discontinued operations | — | 0.9 | |||||||||
| Total current assets | 564.8 | 562.7 | |||||||||
| Property and equipment, net | 584.0 | 670.4 | |||||||||
| Right of use assets - operating, net | 86.1 | 108.3 | |||||||||
| Right of use assets - finance, net | 54.8 | 60.0 | |||||||||
| Intangible assets, net | 300.4 | 798.4 | |||||||||
| Goodwill | 325.6 | 483.9 | |||||||||
| Notes receivable, net | 0.5 | 0.5 | |||||||||
| Investment in Harvest | 152.5 | — | |||||||||
| Other assets | 8.7 | 10.0 | |||||||||
| Long-term assets associated with discontinued operations | — | 1.9 | |||||||||
| TOTAL ASSETS | $ | 2,077.4 | $ | 2,696.1 | |||||||
| LIABILITIES | |||||||||||
| Current Liabilities: | |||||||||||
| Accounts payable and accrued liabilities | $ | 61.5 | $ | 82.7 | |||||||
| Deferred revenue | 7.0 | 9.6 | |||||||||
| Notes payable - current portion | 4.2 | 4.1 | |||||||||
| Operating lease liabilities - current portion | 11.3 | 13.0 | |||||||||
| Finance lease liabilities - current portion | 10.1 | 10.7 | |||||||||
| Construction finance liabilities - current portion | 0.6 | 2.4 | |||||||||
| Contingencies | 0.3 | 0.8 | |||||||||
| Liabilities associated with discontinued operations | — | 3.7 | |||||||||
| Total current liabilities | 95.1 | 126.9 | |||||||||
| Long-Term Liabilities: | |||||||||||
| Notes payable, net | 89.4 | 90.8 | |||||||||
| Private placement notes, net | 195.8 | 136.7 | |||||||||
| Operating lease liabilities | 85.8 | 107.9 | |||||||||
| Finance lease liabilities | 59.8 | 64.1 | |||||||||
| Construction finance liabilities | 120.2 | 133.8 | |||||||||
| Deferred tax liabilities | 57.2 | 178.0 | |||||||||
| Uncertain tax position liabilities | 598.2 | 668.4 | |||||||||
| Other long-term liabilities | 10.0 | 11.4 | |||||||||
| Long-term liabilities associated with discontinued operations | — | 34.9 | |||||||||
| TOTAL LIABILITIES | $ | 1,311.5 | $ | 1,553.1 | |||||||
| EQUITY | |||||||||||
Common shares, no par value; unlimited shares authorized. 192,382,935, and 192,307,145 shares issued and outstanding as of June 30, 2026 and December 31, 2025, respectively. | $ | — | $ | — | |||||||
| Additional paid-in-capital | 2,083.2 | 2,073.4 | |||||||||
| Accumulated deficit | (1,315.7) | (912.1) | |||||||||
| Non-controlling interest | (1.6) | (18.2) | |||||||||
| TOTAL EQUITY | 765.9 | 1,143.0 | |||||||||
| TOTAL LIABILITIES AND EQUITY | $ | 2,077.4 | $ | 2,696.1 | |||||||
Trulieve Cannabis Corp.
Condensed Consolidated Statements of Operations (Unaudited)
(in millions, except for share data)
| Three Months Ended June 30, | Six Months Ended June 30, | ||||||||||||||||||||||
| 2026 | 2025 | 2026 | 2025 | ||||||||||||||||||||
| Revenue | $ | 271.0 | $ | 302.1 | $ | 557.7 | $ | 599.8 | |||||||||||||||
| Cost of goods sold | 108.7 | 119.2 | 225.3 | 233.7 | |||||||||||||||||||
| Gross profit | 162.3 | 182.9 | 332.4 | 366.1 | |||||||||||||||||||
| Expenses: | |||||||||||||||||||||||
| Selling, general, and administrative | 101.8 | 101.1 | 206.7 | 219.9 | |||||||||||||||||||
| Depreciation and amortization | 25.7 | 29.4 | 55.5 | 58.8 | |||||||||||||||||||
| Loss (gain) on disposal or impairment of assets | 2.0 | (0.3) | 1.7 | 1.5 | |||||||||||||||||||
| Loss on deconsolidation transaction | 403.3 | — | 403.3 | — | |||||||||||||||||||
| Total expenses | 532.8 | 130.3 | 667.2 | 280.2 | |||||||||||||||||||
| (Loss) income from operations | (370.5) | 52.6 | (334.8) | 86.0 | |||||||||||||||||||
| Other income (expense): | |||||||||||||||||||||||
| Interest expense, net | (12.8) | (16.4) | (26.1) | (32.7) | |||||||||||||||||||
| Interest income | 3.1 | 3.6 | 5.7 | 6.7 | |||||||||||||||||||
| Equity in net loss of Harvest | (3.3) | — | (3.3) | — | |||||||||||||||||||
| Other income (expense), net | 0.1 | (1.0) | 0.2 | (0.7) | |||||||||||||||||||
| Total other expense, net | (12.9) | (13.7) | (23.4) | (26.7) | |||||||||||||||||||
| (Loss) income before provision for income taxes | (383.4) | 38.9 | (358.2) | 59.2 | |||||||||||||||||||
| Provision for income taxes | 22.0 | 54.7 | 43.8 | 107.2 | |||||||||||||||||||
| Net loss from continuing operations | (405.4) | (15.8) | (402.0) | (48.0) | |||||||||||||||||||
| Net loss from discontinued operations, net of tax benefit (provision) of $237, $(441), $597, and $(441) respectively, attributable to common shareholders | (0.7) | (0.3) | (1.8) | (1.9) | |||||||||||||||||||
| Net loss | (406.1) | (16.1) | (403.8) | (49.9) | |||||||||||||||||||
| Less: net loss attributable to non-controlling interest from continuing operations | (0.1) | (2.3) | (0.2) | (3.2) | |||||||||||||||||||
| Net loss attributable to common shareholders | $ | (406.0) | $ | (13.8) | $ | (403.6) | $ | (46.7) | |||||||||||||||
| Earnings Per Share | |||||||||||||||||||||||
| Net loss per share - Continuing operations: | |||||||||||||||||||||||
| Basic and diluted | $ | (2.10) | $ | (0.07) | $ | (2.09) | $ | (0.23) | |||||||||||||||
| Net loss per share - Discontinued operations: | |||||||||||||||||||||||
| Basic and diluted | $ | (0.00) | $ | (0.00) | $ | (0.01) | $ | (0.01) | |||||||||||||||
| Weighted average number of common shares used in computing net loss per share: | |||||||||||||||||||||||
| Basic and diluted | 192.7 | 191.2 | 192.6 | 191.2 | |||||||||||||||||||
Trulieve Cannabis Corp.
Condensed Consolidated Statements of Cash Flows (Unaudited)
(in millions)
| Three Months Ended June 30, | Six Months Ended June 30, | ||||||||||||||||||||||
| 2026 | 2025 | 2026 | 2025 | ||||||||||||||||||||
| Cash flows from operating activities | |||||||||||||||||||||||
| Net loss | $ | (406.1) | $ | (16.1) | $ | (403.8) | $ | (49.9) | |||||||||||||||
| Adjustments to reconcile net loss to net cash provided by operating activities: | |||||||||||||||||||||||
| Depreciation and amortization | 25.7 | 29.4 | 55.5 | 58.8 | |||||||||||||||||||
| Depreciation included in cost of goods sold | 13.4 | 13.7 | 27.4 | 27.6 | |||||||||||||||||||
| Loss on deconsolidation transaction | 403.3 | — | 403.3 | — | |||||||||||||||||||
| Equity in net loss of Harvest | 3.3 | — | 3.3 | — | |||||||||||||||||||
| Impairment and disposal of long-lived assets, net of recoveries | 2.0 | (2.0) | 1.7 | (0.2) | |||||||||||||||||||
| Gain from disposal of discontinued operations | — | — | — | — | |||||||||||||||||||
| Share-based compensation | 6.9 | 6.8 | 11.1 | 10.7 | |||||||||||||||||||
| Deferred income taxes | (10.8) | (5.3) | (19.1) | (9.9) | |||||||||||||||||||
| Other non-cash changes | 3.5 | 7.3 | 6.7 | 12.3 | |||||||||||||||||||
| Changes in operating assets and liabilities: | |||||||||||||||||||||||
| Inventories | 6.0 | (2.2) | 6.0 | (10.1) | |||||||||||||||||||
| Accounts receivable | 1.1 | (0.8) | (2.7) | (3.4) | |||||||||||||||||||
| Other assets | (28.4) | 7.0 | (30.7) | (1.0) | |||||||||||||||||||
| Accounts payable and accrued liabilities | 5.4 | (11.6) | (3.4) | (11.8) | |||||||||||||||||||
| Income tax receivable / payable | (0.6) | 1.3 | 1.1 | 2.7 | |||||||||||||||||||
| Uncertain tax position liabilities | 32.9 | 58.7 | 61.0 | 114.4 | |||||||||||||||||||
| Other liabilities | (4.6) | (6.0) | (8.5) | (8.7) | |||||||||||||||||||
| Proceeds received from insurance for operating expenses | — | 5.7 | — | 5.7 | |||||||||||||||||||
| Net cash provided by operating activities | 53.1 | 86.1 | 108.8 | 137.2 | |||||||||||||||||||
| Cash flows from investing activities | |||||||||||||||||||||||
| Capital expenditures | (21.0) | (16.0) | (34.5) | (36.8) | |||||||||||||||||||
| Maturities of short-term investments | — | — | — | 60.0 | |||||||||||||||||||
| Cash disposed in deconsolidation transaction | (58.4) | — | (58.4) | — | |||||||||||||||||||
| Other proceeds | 4.5 | 7.4 | 4.8 | 11.4 | |||||||||||||||||||
| Other purchases and payments | — | — | — | (0.2) | |||||||||||||||||||
| Net cash (used in) provided by investing activities | (74.9) | (8.6) | (88.0) | 34.4 | |||||||||||||||||||
| Cash flows from financing activities | |||||||||||||||||||||||
| Proceeds from long-term borrowings | — | — | 60.7 | — | |||||||||||||||||||
| Payments on long-term borrowings | (1.7) | (3.6) | (3.7) | (5.5) | |||||||||||||||||||
| Payments for debt issuance costs | — | — | (1.3) | — | |||||||||||||||||||
| Other payments and distributions | (2.8) | (2.2) | (5.4) | (4.6) | |||||||||||||||||||
| Payments for taxes related to net share settlement of equity awards | (1.3) | (0.1) | (1.3) | (0.3) | |||||||||||||||||||
| Net cash provided by (used in) financing activities | (5.7) | (5.8) | 49.1 | (10.3) | |||||||||||||||||||
| Net increase in cash and cash equivalents, and restricted cash | (27.5) | 71.6 | 69.9 | 161.3 | |||||||||||||||||||
| Cash, cash equivalents, and restricted cash, beginning of period | 352.9 | 329.4 | 255.5 | 239.7 | |||||||||||||||||||
| Cash, cash equivalents, and restricted cash, end of period | $ | 325.4 | $ | 401.0 | $ | 325.4 | $ | 401.0 | |||||||||||||||
The condensed consolidated statements of cash flows include continuing operations and discontinued operations for the periods presented.
Non-GAAP Financial Measures (Unaudited)
In addition to our results determined in accordance with GAAP, we supplement our results with non-GAAP financial measures, including EBITDA, adjusted EBITDA, EBITDA margin, adjusted EBITDA margin, adjusted net income (loss), adjusted net income (loss) per diluted share, and free cash flow.
The Company calculates EBITDA as net income (loss) before net interest expense, interest income, income tax expense, depreciation and amortization; adjusted EBITDA as net income (loss) before net interest expense, interest income, income tax expense, depreciation and amortization and also excludes certain extraordinary items; EBITDA margin as EBITDA as % of revenue; adjusted EBITDA margin as adjusted EBITDA as % of revenue; adjusted net income (loss) as net income (loss) less certain extraordinary items; adjusted EPS as adjusted net income (loss) divided by diluted shares outstanding; and free cash flow as cash flow from operations less capital expenditures.
Our management uses these non-GAAP financial measures in conjunction with GAAP financial measures to evaluate our operating results and financial performance. We believe these measures are useful to investors as they are widely used measures of performance and can facilitate comparison to other companies. These non-GAAP financial measures are not, and should not be considered as, measures of liquidity. These non-GAAP financial measures have limitations as analytical tools in that they do not reflect all of the amounts associated with our results of operations as determined in accordance with GAAP. Because of these limitations, these non-GAAP financial measures should be considered along with GAAP financial performance measures. The presentation of these non-GAAP financial measures is not intended to be considered in isolation or as a substitute for, or superior to, financial information prepared and presented in accordance with GAAP. Investors are encouraged to review the reconciliation of these non-GAAP financial measures to their most directly comparable GAAP financial measures. A reconciliation of the non-GAAP financial measures to such GAAP measures can be found below. These non-GAAP financial measures should be considered supplemental to, and not a substitute for, our reported financial results prepared in accordance with GAAP.
Reconciliation of Non-GAAP EBITDA and Adjusted EBITDA (Unaudited)
The following table presents a reconciliation of GAAP net (loss) income attributable to common shareholders to non-GAAP EBITDA and Adjusted EBITDA for each of the periods presented:
(Amounts expressed in millions of United States dollars) | Three Months Ended | For the Six Months Ended | ||||||||||||||||||||||||||||||
| June 30, 2026 | June 30, 2025 | March 31, 2026 | June 30, 2026 | June 30, 2025 | ||||||||||||||||||||||||||||
| Net (loss) income attributable to common shareholders | $ | (406.0) | $ | (13.8) | $ | 2.4 | $ | (403.6) | $ | (46.7) | ||||||||||||||||||||||
| Add (deduct) impact of: | ||||||||||||||||||||||||||||||||
| Interest expense, net | $ | 12.8 | $ | 16.4 | $ | 13.3 | $ | 26.1 | $ | 32.7 | ||||||||||||||||||||||
| Interest income | $ | (3.1) | $ | (3.6) | $ | (2.7) | $ | (5.7) | $ | (6.7) | ||||||||||||||||||||||
| Provision for income taxes | $ | 22.0 | $ | 54.7 | $ | 21.9 | $ | 43.8 | $ | 107.2 | ||||||||||||||||||||||
| Depreciation and amortization | $ | 25.7 | $ | 29.4 | $ | 29.7 | $ | 55.5 | $ | 58.8 | ||||||||||||||||||||||
| Depreciation included in cost of goods sold | $ | 13.4 | $ | 13.7 | $ | 14.0 | $ | 27.4 | $ | 27.6 | ||||||||||||||||||||||
| EBITDA (Non-GAAP) | $ | (335.2) | $ | 96.8 | $ | 78.6 | $ | (256.5) | $ | 172.8 | ||||||||||||||||||||||
| EBITDA Margin (Non-GAAP) | NMF | 32% | 27% | NMF | 29% | |||||||||||||||||||||||||||
| Loss (gain) on disposal or impairment of assets | $ | 2.0 | $ | (0.3) | $ | (0.3) | $ | 1.7 | $ | 1.5 | ||||||||||||||||||||||
| Campaign and political contributions | $ | 4.7 | $ | 4.4 | $ | 9.5 | $ | 14.3 | $ | 27.4 | ||||||||||||||||||||||
| Acquisition, transaction, and other non-recurring costs | $ | 12.3 | $ | 1.6 | $ | 7.4 | $ | 19.8 | $ | 4.7 | ||||||||||||||||||||||
| Share-based compensation | $ | 6.9 | $ | 6.8 | $ | 4.1 | $ | 11.1 | $ | 10.7 | ||||||||||||||||||||||
| Other (income) expense, net | $ | (0.1) | $ | 1.0 | $ | (0.1) | $ | (0.2) | $ | 0.7 | ||||||||||||||||||||||
| Equity in net loss of Harvest | $ | 3.3 | $ | — | $ | — | $ | 3.3 | $ | — | ||||||||||||||||||||||
| Loss on deconsolidation transaction | $ | 403.3 | $ | — | $ | — | $ | 403.3 | $ | — | ||||||||||||||||||||||
| Discontinued operations, net of tax, attributable to common shareholders | $ | 0.7 | $ | 0.3 | $ | 1.1 | $ | 1.8 | $ | 1.9 | ||||||||||||||||||||||
| Adjusted EBITDA (Non-GAAP) | $ | 98.0 | $ | 110.6 | $ | 100.4 | $ | 198.4 | $ | 219.8 | ||||||||||||||||||||||
| Adjusted EBITDA Margin (Non-GAAP) | 36% | 37% | 35% | 36% | 37% | |||||||||||||||||||||||||||
Reconciliation of Non-GAAP Adjusted Net Income (Loss) (Unaudited)
The following table presents a reconciliation of GAAP net (loss) income attributable to common shareholders to non-GAAP adjusted net income (loss), for each of the periods presented:
| For the Three Months Ended | For the Six Months Ended | |||||||||||||||||||||||||||||||
| (Amounts expressed in millions of United States dollars) | June 30, 2026 | June 30, 2025 | March 31, 2026 | June 30, 2026 | June 30, 2025 | |||||||||||||||||||||||||||
| Net (loss) income attributable to common shareholders | $ | (406.0) | $ | (13.8) | $ | 2.4 | $ | (403.6) | $ | (46.7) | ||||||||||||||||||||||
| Net loss from discontinued operations, net of tax, attributable to common shareholders | $ | 0.7 | $ | 0.3 | $ | 1.1 | $ | 1.8 | $ | 1.9 | ||||||||||||||||||||||
| Net (loss) income from continuing operations available to common shareholders | $ | (405.3) | $ | (13.5) | $ | 3.5 | $ | (401.8) | $ | (44.7) | ||||||||||||||||||||||
| Add (deduct) impact of: | ||||||||||||||||||||||||||||||||
| Loss (gain) on disposal or impairment of assets | $ | 2.0 | $ | (0.3) | $ | (0.3) | $ | 1.7 | $ | 1.5 | ||||||||||||||||||||||
| Campaign and political contributions | $ | 4.7 | $ | 4.4 | $ | 9.5 | $ | 14.3 | $ | 27.4 | ||||||||||||||||||||||
| Acquisition, transaction, and other non-recurring costs | $ | 12.3 | $ | 1.6 | $ | 7.4 | $ | 19.8 | $ | 4.7 | ||||||||||||||||||||||
| Equity in net loss of Harvest | $ | 3.3 | $ | — | $ | — | $ | 3.3 | $ | — | ||||||||||||||||||||||
| Loss on deconsolidation transaction | $ | 403.3 | $ | — | $ | — | $ | 403.3 | $ | — | ||||||||||||||||||||||
| Adjusted net income (loss) (Non-GAAP) | $ | 20.4 | $ | (7.7) | $ | 20.2 | $ | 40.6 | $ | (11.1) | ||||||||||||||||||||||
Reconciliation of Non-GAAP Adjusted Net Income (Loss) Per Diluted Share (Unaudited)
The following table presents a reconciliation of GAAP net (loss) income attributable to common shareholders per share to non-GAAP adjusted net income (loss) per diluted share, for each of the periods presented:
| For the Three Months Ended | For the Six Months Ended | |||||||||||||||||||||||||||||||
| (Amounts expressed are per share except for shares which are in millions) | June 30, 2026 | June 30, 2025 | March 31, 2026 | June 30, 2026 | June 30, 2025 | |||||||||||||||||||||||||||
| Net (loss) income attributable to common shareholders | $ | (2.11) | $ | (0.07) | $ | 0.01 | $ | (2.10) | $ | (0.24) | ||||||||||||||||||||||
| Net loss from discontinued operations, net of tax, attributable to common shareholders | $ | 0.00 | $ | 0.00 | $ | 0.01 | $ | 0.01 | $ | 0.01 | ||||||||||||||||||||||
| Net (loss) income from continuing operations available to common shareholders | $ | (2.10) | $ | (0.07) | $ | 0.02 | $ | (2.09) | $ | (0.23) | ||||||||||||||||||||||
| Add (deduct) impact of: | ||||||||||||||||||||||||||||||||
| Loss (gain) on disposal or impairment of assets | $ | 0.01 | $ | (0.00) | $ | (0.00) | $ | 0.01 | $ | 0.01 | ||||||||||||||||||||||
| Campaign and political contributions | $ | 0.02 | $ | 0.02 | $ | 0.05 | $ | 0.07 | $ | 0.14 | ||||||||||||||||||||||
| Acquisition, transaction, and other non-recurring costs | $ | 0.06 | $ | 0.01 | $ | 0.04 | $ | 0.10 | $ | 0.02 | ||||||||||||||||||||||
| Equity in net loss of Harvest | $ | 0.02 | $ | — | $ | — | $ | 0.02 | $ | — | ||||||||||||||||||||||
| Loss on deconsolidation transaction | $ | 2.09 | $ | — | $ | — | $ | 2.09 | $ | — | ||||||||||||||||||||||
| Adjusted net income (loss) (Non-GAAP) | $ | 0.11 | $ | (0.04) | $ | 0.10 | $ | 0.21 | $ | (0.06) | ||||||||||||||||||||||
| Diluted shares outstanding | 192.7 | 191.2 | 197.8 | 192.6 | 191.2 | |||||||||||||||||||||||||||
Reconciliation of Non-GAAP Free Cash Flow (Unaudited)
The following table presents a reconciliation of GAAP cash flow from operating activities to non-GAAP free cash flow, for each of the periods presented:
| For the Three Months Ended | For the Six Months Ended | |||||||||||||||||||||||||||||||
| (Amounts expressed in millions of United States dollars) | June 30, 2026 | June 30, 2025 | March 31, 2026 | June 30, 2026 | June 30, 2025 | |||||||||||||||||||||||||||
| Cash flow from operating activities | $ | 53.1 | $ | 86.1 | $ | 55.7 | $ | 108.8 | $ | 137.2 | ||||||||||||||||||||||
| Capital expenditures | $ | (21.0) | $ | (16.0) | $ | (13.5) | $ | (34.5) | $ | (36.8) | ||||||||||||||||||||||
| Free cash flow (Non-GAAP) | $ | 32.1 | $ | 70.1 | $ | 42.2 | $ | 74.4 | $ | 100.4 | ||||||||||||||||||||||
Forward-Looking Statements
This news release includes forward-looking information and statements within the meaning of the U.S. Private Securities Litigation Reform Act of 1995 and applicable Canadian securities legislation (collectively herein referred to as “forward-looking statements”). These forward-looking statements relate to the Company’s expectations or forecasts of business, operations, financial performance, cash flows, prospects, and other plans, intentions, expectations, estimates, and beliefs and include statements regarding broader cannabis rescheduling and state program expansion. Words such as “expects”, “continue”, “will”, “anticipates” and “intends” or similar expressions are intended to identify forward-looking statements. These forward-looking statements are based on the Company’s current projections and expectations about future events and financial trends that management believes might affect its financial condition, results of operations, business strategy and financial needs, and on certain assumptions and analysis made by the Company in light of the experience and perception of historical trends, current conditions and expected future developments and other factors management believes are appropriate. Forward-looking statements involve and are subject to assumptions and known and unknown risks, uncertainties, and other factors which may cause actual events, results, performance, or achievements of the Company to be materially different from future events, results, performance, and achievements expressed or implied by forward-looking statements herein, including, without limitation, the risks discussed under the heading “Risk Factors” in our most recent Annual Report on Form 10-K and in our periodic reports subsequently filed with the United States Securities and Exchange Commission and in the Company’s filings on https://www.sedarplus.ca. Although the Company believes that any forward-looking statements herein are reasonable, in light of the use of assumptions and the significant risks and uncertainties inherent in such statements, there can be no assurance that any such forward-looking statements will prove to be accurate, and accordingly readers are advised to rely on their own evaluation of such risks and uncertainties and should not place undue reliance upon such forward-looking statements. Any forward-looking statements herein are made as of the date hereof and, except as required by applicable laws, the Company assumes no obligation and disclaims any intention to update or revise any forward-looking statements herein or to update the reasons that actual events or results could or do differ from those projected in any forward-looking statements herein, whether as a result of new information, future events or results, or otherwise.
About Trulieve
Trulieve is an industry leading, vertically integrated cannabis company and multi-state operator in the U.S., with established medical marijuana operations in Florida, Georgia, Pennsylvania, and West Virginia. Driven by a core mission to expand access to cannabis, Trulieve serves customers with innovative, high-quality branded products and exceptional experiences. With scaled operations in attractive markets and targeted expansion through its hub strategy, Trulieve is poised for accelerated growth. Trulieve is listed on the NYSE under the symbol TRLV. For more information, please visit Trulieve.com.
Facebook: @Trulieve
Instagram: @Trulieve
X: @Trulieve
Investor and Media Contact
Christine Hersey, Chief Corporate Affairs & Strategy Officer
+1 (424) 202-0210

Second Quarter 2026 Earnings Presentation August 2026 NYSE: TRLV
www.trulieve.com 2 Forward-Looking Statements Unless the context otherwise requires, the terms “Company,” “Trulieve,” “we,” “us” and “our” in this presentation refer to Trulieve Cannabis Corp. and its subsidiaries. This presentation includes forward-looking information and statements within the meaning of the U.S. Private Securities Litigation Reform Act of 1995 and applicable Canadian securities legislation (collectively herein referred to as “forward-looking statements”). These forward-looking statements relate to the Company’s expectations or forecasts of business, operations, financial performance, prospects, and other plans, intentions, expectations, estimates, and beliefs and include statements regarding, among other things, growth opportunities, and the positioning of the Company for the future, state expansion, potential rescheduling of non-medical marijuana to Schedule III, the tax implications to Trulieve of the rescheduling of marijuana, and the potential adoption of an “adult use” program in Pennsylvania. Words such as “expects”, “continue”, “will”, “anticipates” and “intends” or similar expressions are intended to identify forward-looking statements. These forward-looking statements are based on the Company’s current projections and expectations about future events and financial trends that management believes might affect its financial condition, results of operations, business strategy and financial needs, and on certain assumptions and analysis made by the Company in light of the experience and perception of historical trends, current conditions and expected future developments and other factors management believes are appropriate. Forward-looking statements involve and are subject to assumptions and known and unknown risks, uncertainties, and other factors which may cause actual events, results, performance, or achievements of the Company to be materially different from future events, results, performance, and achievements expressed or implied by forward-looking statements herein, including, without limitation, the risks discussed under the heading “Risk Factors” in our most recent Annual Report on Form 10-K and in our periodic reports subsequently filed with the United States Securities and Exchange Commission. Although the Company believes that any forward-looking statements herein are reasonable, in light of the use of assumptions and the significant risks and uncertainties inherent in such statements, there can be no assurance that any such forward-looking statements will prove to be accurate, and accordingly, readers are advised to rely on their own evaluation of such risks and uncertainties and should not place undue reliance upon such forward- looking statements. Any forward-looking statements herein are made as of the date hereof and, except as required by applicable laws, the Company assumes no obligation and disclaims any intention to update or revise any forward-looking statements herein or to update the reasons that actual events or results could or do differ from those projected in any forward-looking statements herein, whether as a result of new information, future events or results, or otherwise. Forward-looking statements made in this document are made only as of the date of their initial publication, and the Company undertakes no obligation to publicly update any of these forward-looking statements as actual events unfold except as required by law.
www.trulieve.com 3 Management’s Use of Non-GAAP Financial Measures In addition to our results determined in accordance with Generally Accepted Accounting Principles (GAAP), we supplement our results with non-GAAP financial measures, including adjusted Selling, General, and Administrative (SG&A) expense, adjusted SG&A as % revenue, adjusted net income (loss), adjusted net income (loss) per diluted share, EBITDA, EBITDA margin, adjusted EBITDA, adjusted EBITDA margin, and free cash flow. The Company calculates adjusted SG&A as SG&A less extraordinary expenses; adjusted SG&A margin as % of revenue; adjusted net income (loss) as net income (loss) less certain extraordinary items; adjusted net income (loss) per diluted share as adjusted net income (loss) divided by basic and diluted shares outstanding; EBITDA as net income (loss) before net interest expense, interest income, income tax expense, depreciation and amortization; EBITDA margin as EBITDA as % of revenue; adjusted EBITDA as net income (loss) before net interest expense, interest income, income tax expense, depreciation and amortization and also excludes certain extraordinary items; adjusted EBITDA margin as adjusted EBITDA as % of revenue; free cash flow as cash flow from operations less capital expenditures. Our management uses these non-GAAP financial measures in conjunction with GAAP financial measures to evaluate our operating results and financial performance. We believe these measures are useful to investors as they are widely used measures of performance and can facilitate comparison to other companies. These non-GAAP financial measures are not and should not be considered as measures of liquidity. These non-GAAP financial measures have limitations as analytical tools in that they do not reflect all of the amounts associated with our results of operations as determined in accordance with GAAP. Because of these limitations, these non-GAAP financial measures should be considered along with GAAP financial performance measures. The presentation of these non-GAAP financial measures is not intended to be considered in isolation or as a substitute for, or superior to, financial information prepared and presented in accordance with GAAP. Investors are encouraged to review the reconciliation of these non-GAAP financial measures to their most directly comparable GAAP financial measures. A reconciliation of the non-GAAP financial measures to such GAAP measures can be found at the end of this presentation on the slides captioned “Reconciliation of Non-GAAP Financial Measures”. These non-GAAP financial measures should be considered supplemental to, and not a substitute for, our reported financial results prepared in accordance with GAAP.

www.trulieve.com 4 Overview • Second Quarter Highlights • Harvest Deconsolidation • NYSE Listing • Financial and Operational Highlights • Recent Developments • 2026 Focus Areas • Catalysts • Financial Highlights • Medical Marijuana Markets • Appendix

I. Second Quarter Highlights
www.trulieve.com 6 Deconsolidation of Harvest Mixed Use Markets • On June 3, 2026, Trulieve completed a corporate restructuring and investment by a third party resulting in the deconsolidation of its mixed medical and adult use market operations “Harvest” • The deconsolidation of Harvest was completed to facilitate listing on the NYSE • Trulieve’s current consolidated operations consist of DEA registered, state licensed medical marijuana facilities serving only medical patients under Schedule III • 207 dispensaries and 3.5 million square feet of production capacity • Florida, Georgia, Pennsylvania and West Virginia • Conditional medical marijuana license awards in Alabama and Texas • Harvest mixed use markets are 100% controlled by an independent third-party investor* • Harvest markets include Arizona, Connecticut, Maryland, and Ohio • 34 dispensaries and 0.5 million square feet of production capacity • Trulieve retains 90% economic interest *other than businesses the transfer of which is subject to regulatory approval, which businesses will, automatically and without any action on the part of Trulieve or any other party, transfer to Harvest upon the receipt of regulatory approval
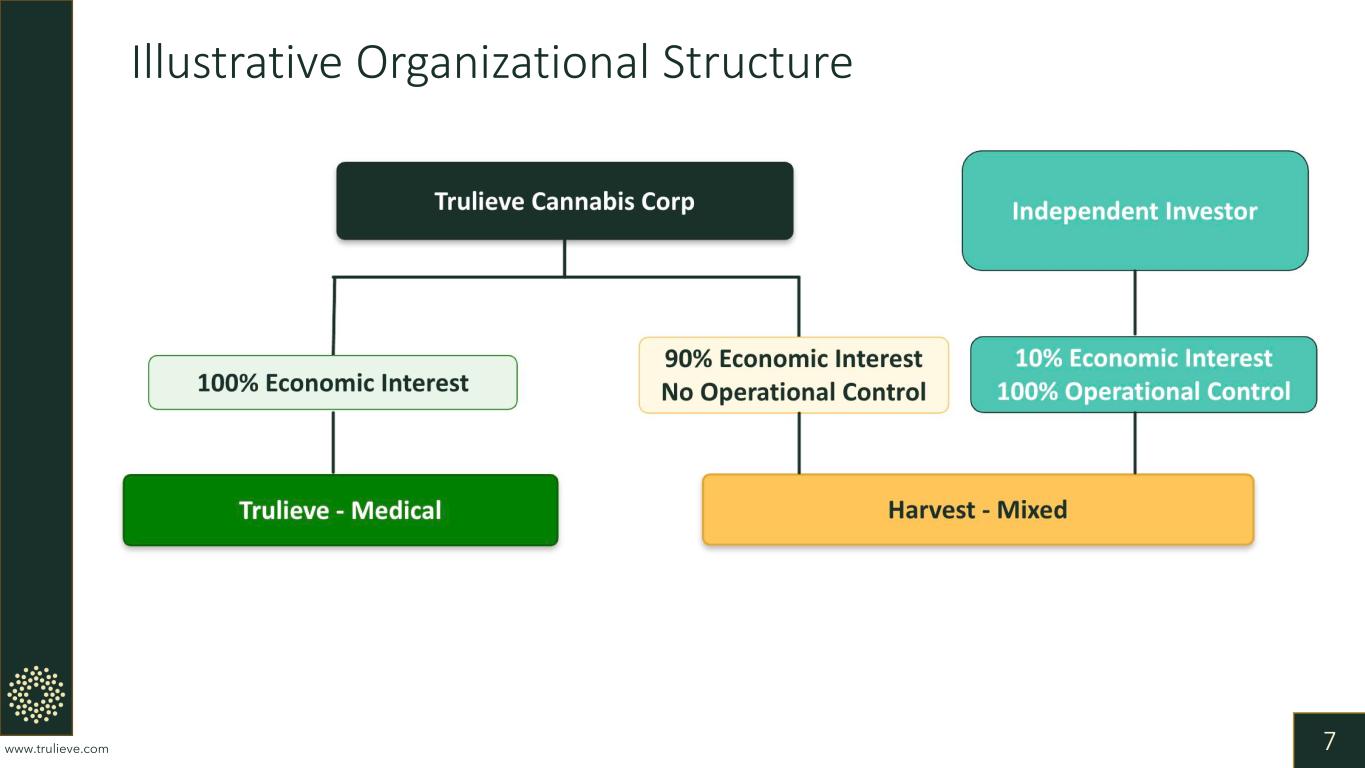
www.trulieve.com 7 Illustrative Organizational Structure
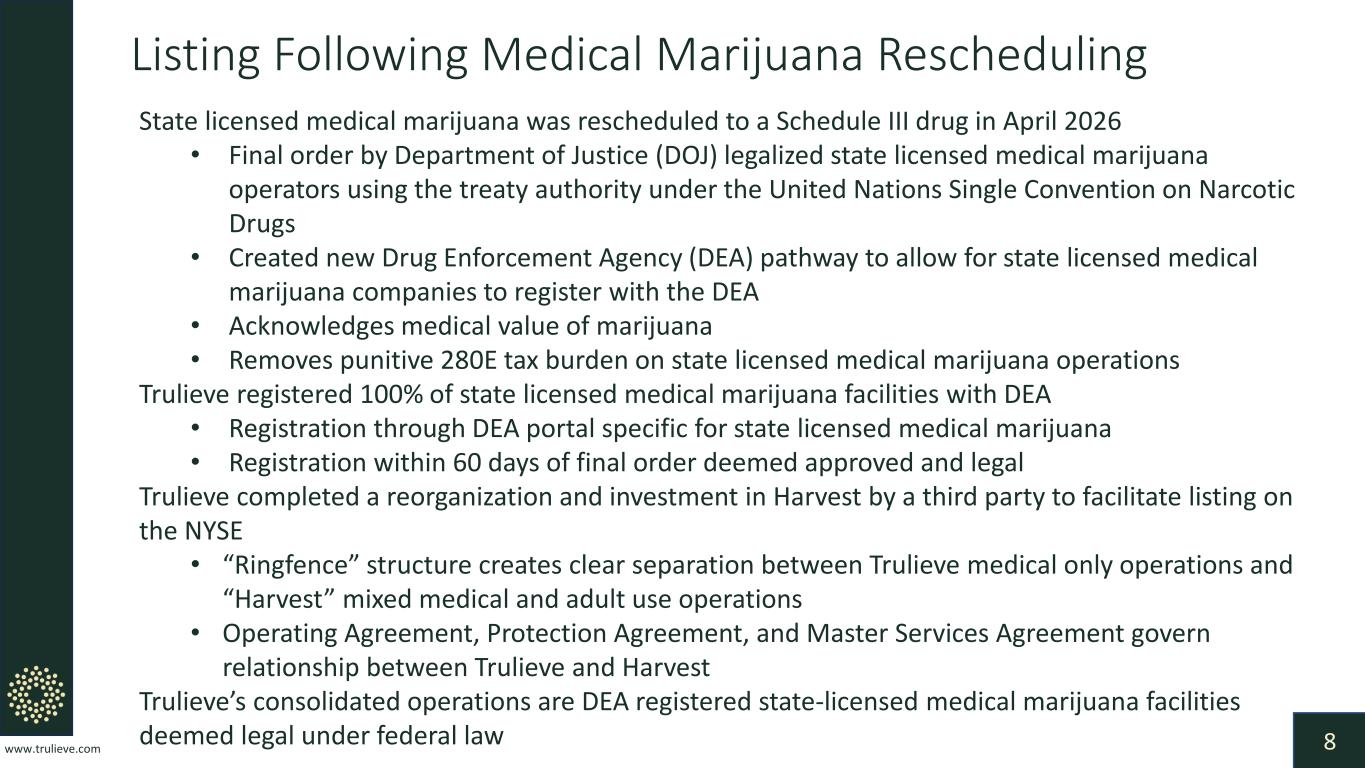
www.trulieve.com 8 Listing Following Medical Marijuana Rescheduling State licensed medical marijuana was rescheduled to a Schedule III drug in April 2026 • Final order by Department of Justice (DOJ) legalized state licensed medical marijuana operators using the treaty authority under the United Nations Single Convention on Narcotic Drugs • Created new Drug Enforcement Agency (DEA) pathway to allow for state licensed medical marijuana companies to register with the DEA • Acknowledges medical value of marijuana • Removes punitive 280E tax burden on state licensed medical marijuana operations Trulieve registered 100% of state licensed medical marijuana facilities with DEA • Registration through DEA portal specific for state licensed medical marijuana • Registration within 60 days of final order deemed approved and legal Trulieve completed a reorganization and investment in Harvest by a third party to facilitate listing on the NYSE • “Ringfence” structure creates clear separation between Trulieve medical only operations and “Harvest” mixed medical and adult use operations • Operating Agreement, Protection Agreement, and Master Services Agreement govern relationship between Trulieve and Harvest Trulieve’s consolidated operations are DEA registered state-licensed medical marijuana facilities deemed legal under federal law
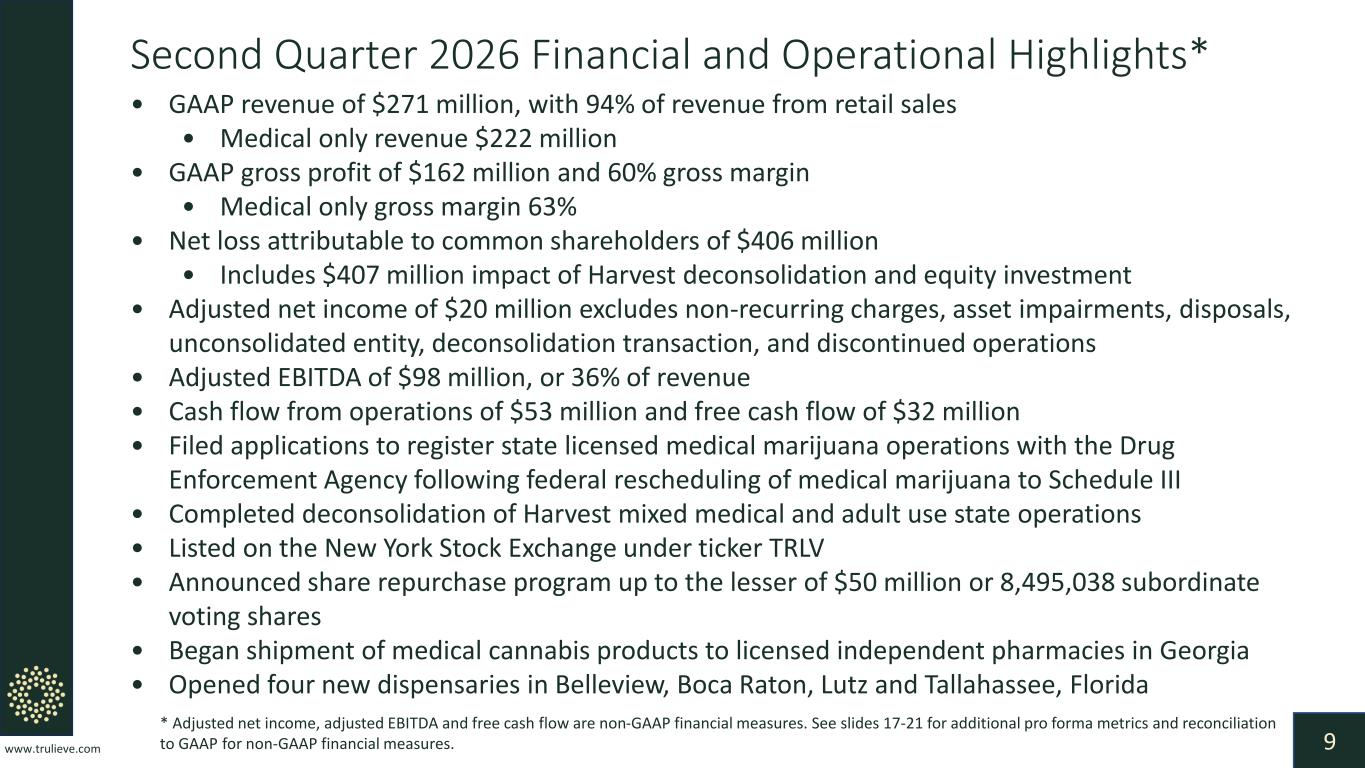
www.trulieve.com 9 Second Quarter 2026 Financial and Operational Highlights* • GAAP revenue of $271 million, with 94% of revenue from retail sales • Medical only revenue $222 million • GAAP gross profit of $162 million and 60% gross margin • Medical only gross margin 63% • Net loss attributable to common shareholders of $406 million • Includes $407 million impact of Harvest deconsolidation and equity investment • Adjusted net income of $20 million excludes non-recurring charges, asset impairments, disposals, unconsolidated entity, deconsolidation transaction, and discontinued operations • Adjusted EBITDA of $98 million, or 36% of revenue • Cash flow from operations of $53 million and free cash flow of $32 million • Filed applications to register state licensed medical marijuana operations with the Drug Enforcement Agency following federal rescheduling of medical marijuana to Schedule III • Completed deconsolidation of Harvest mixed medical and adult use state operations • Listed on the New York Stock Exchange under ticker TRLV • Announced share repurchase program up to the lesser of $50 million or 8,495,038 subordinate voting shares • Began shipment of medical cannabis products to licensed independent pharmacies in Georgia • Opened four new dispensaries in Belleview, Boca Raton, Lutz and Tallahassee, Florida * Adjusted net income, adjusted EBITDA and free cash flow are non-GAAP financial measures. See slides 17-21 for additional pro forma metrics and reconciliation to GAAP for non-GAAP financial measures.
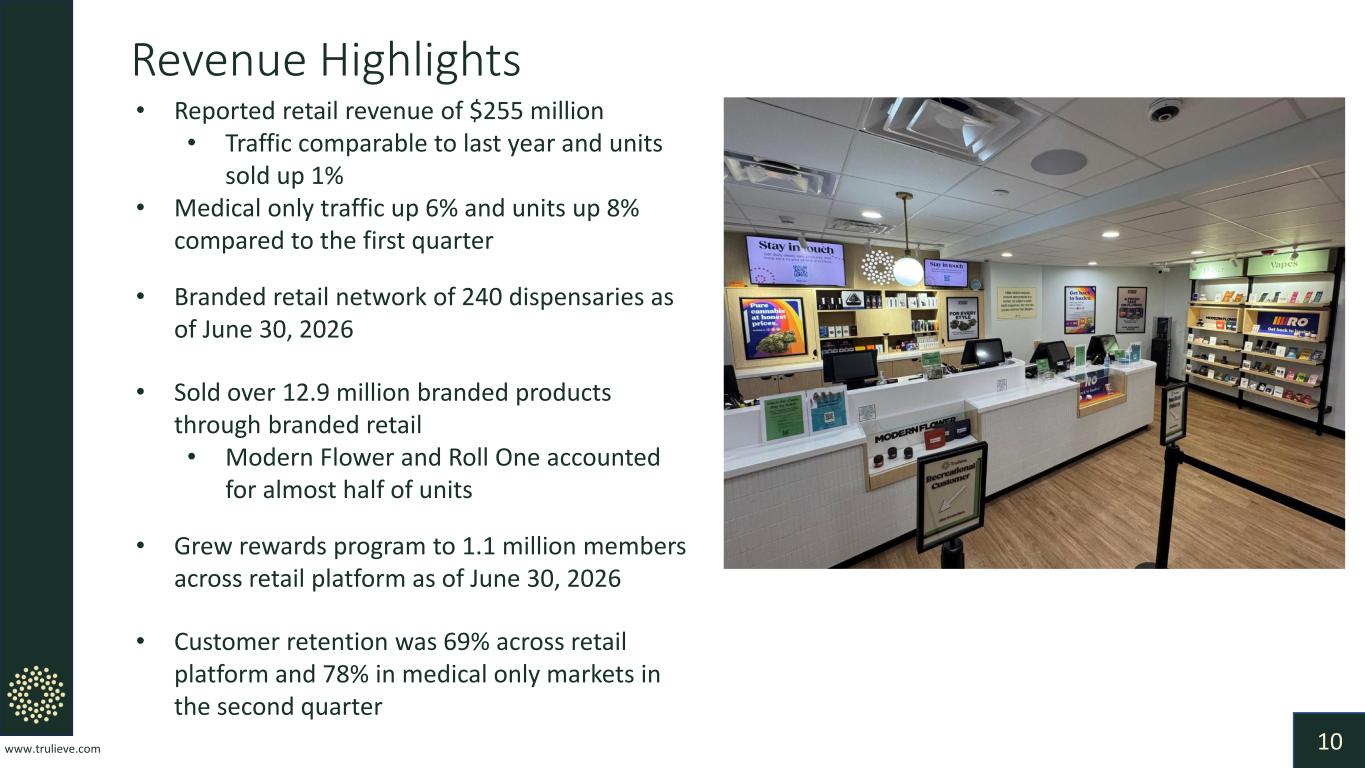
www.trulieve.com 10 Revenue Highlights • Reported retail revenue of $255 million • Traffic comparable to last year and units sold up 1% • Medical only traffic up 6% and units up 8% compared to the first quarter • Branded retail network of 240 dispensaries as of June 30, 2026 • Sold over 12.9 million branded products through branded retail • Modern Flower and Roll One accounted for almost half of units • Grew rewards program to 1.1 million members across retail platform as of June 30, 2026 • Customer retention was 69% across retail platform and 78% in medical only markets in the second quarter
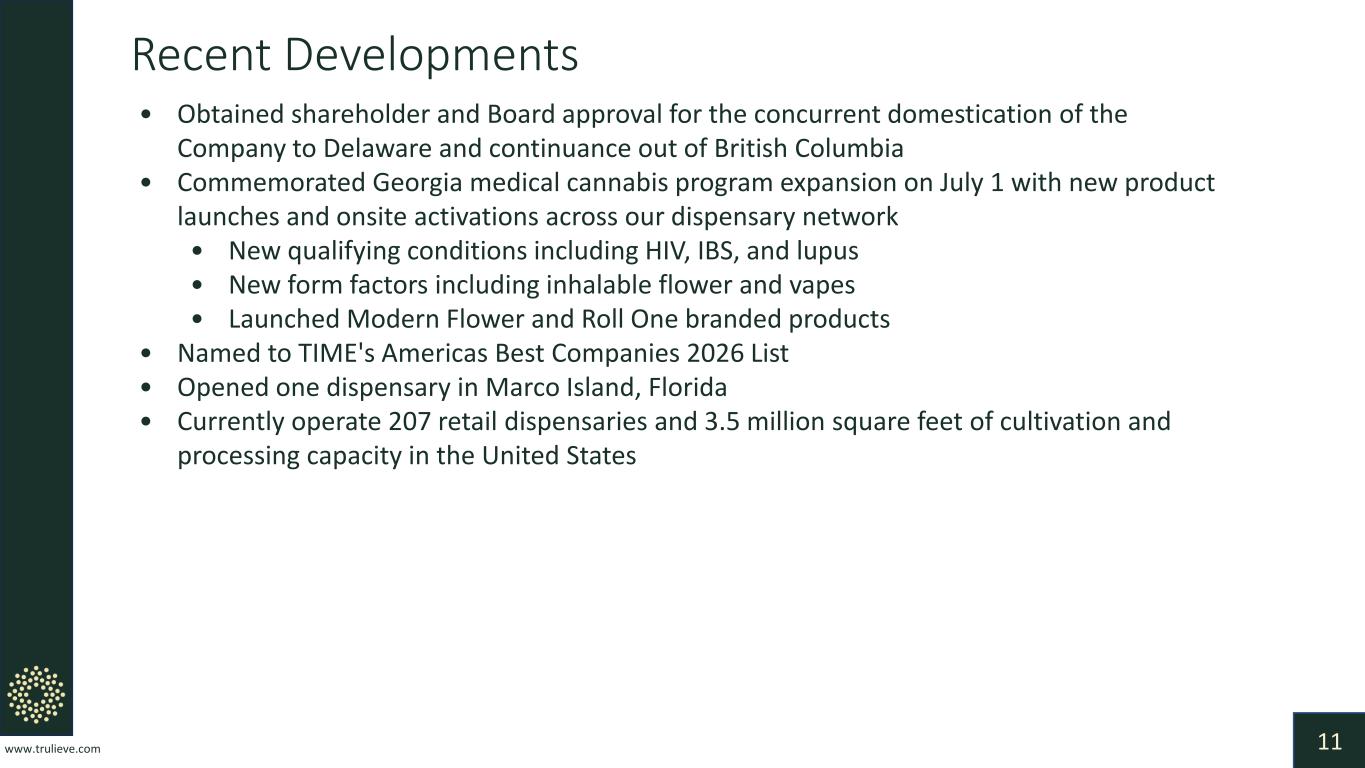
www.trulieve.com 11 Recent Developments • Obtained shareholder and Board approval for the concurrent domestication of the Company to Delaware and continuance out of British Columbia • Commemorated Georgia medical cannabis program expansion on July 1 with new product launches and onsite activations across our dispensary network • New qualifying conditions including HIV, IBS, and lupus • New form factors including inhalable flower and vapes • Launched Modern Flower and Roll One branded products • Named to TIME's Americas Best Companies 2026 List • Opened one dispensary in Marco Island, Florida • Currently operate 207 retail dispensaries and 3.5 million square feet of cultivation and processing capacity in the United States

www.trulieve.com 12 2026 Focus Areas Expand Access to Cannabis • Support federal reform including rescheduling, SAFE Banking • Support state expansion including Florida, Georgia, Pennsylvania, and Texas Invest in Growth Initiatives • Expand Production Capacity and Retail Network in Georgia • Ramp Production and Retail in Texas • Expand Retail, Production, and Distribution Network • Evaluate Strategic M&A • Invest in Technology and Infrastructure Grow Loyal Customer Base • Attract and Retain Customers • Deliver Exceptional Customer Experiences • Build and Reinforce Brand Loyalty Elevate Branded Product Portfolio • Manage Portfolio of Internal and Partner Brands • Launch New and Innovative Products
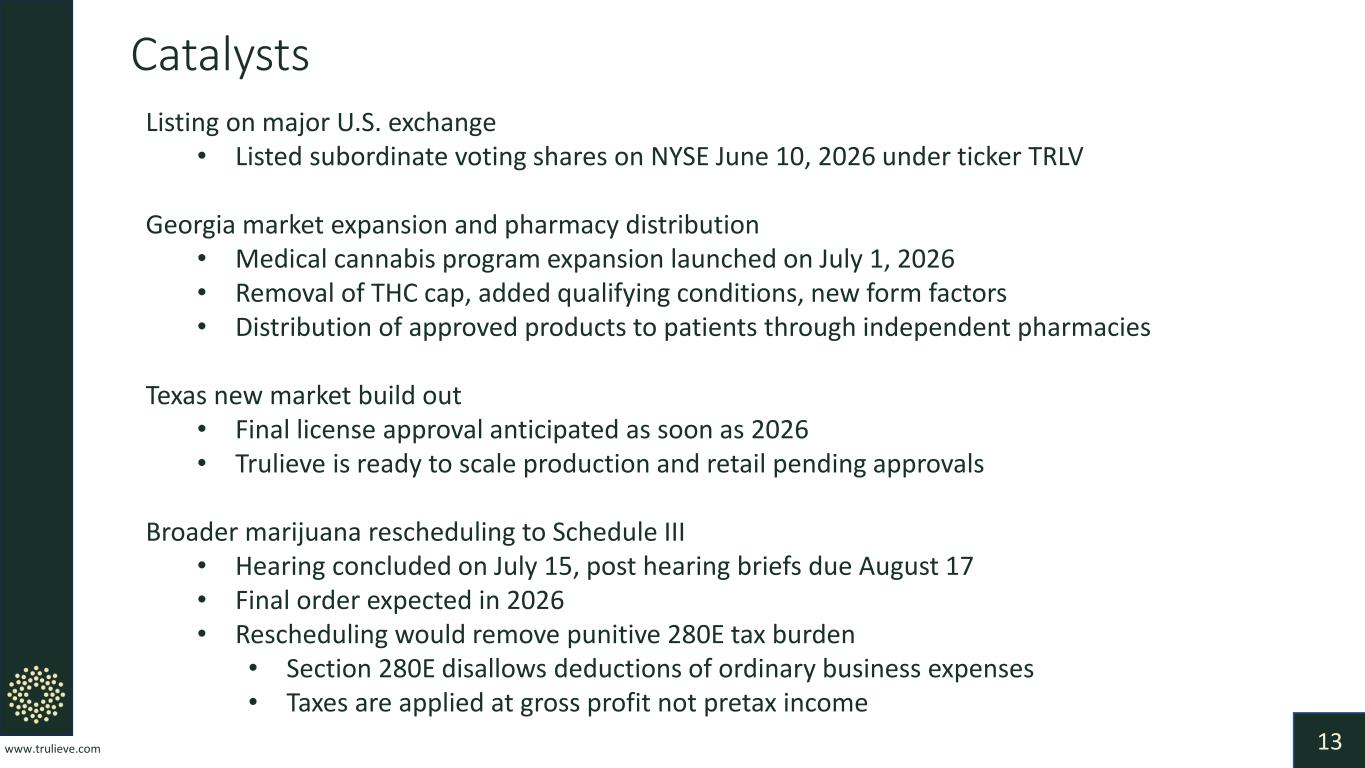
www.trulieve.com 13 Catalysts Listing on major U.S. exchange • Listed subordinate voting shares on NYSE June 10, 2026 under ticker TRLV Georgia market expansion and pharmacy distribution • Medical cannabis program expansion launched on July 1, 2026 • Removal of THC cap, added qualifying conditions, new form factors • Distribution of approved products to patients through independent pharmacies Texas new market build out • Final license approval anticipated as soon as 2026 • Trulieve is ready to scale production and retail pending approvals Broader marijuana rescheduling to Schedule III • Hearing concluded on July 15, post hearing briefs due August 17 • Final order expected in 2026 • Rescheduling would remove punitive 280E tax burden • Section 280E disallows deductions of ordinary business expenses • Taxes are applied at gross profit not pretax income

II. Financial Highlights

www.trulieve.com 15 Financial Targets Financial Targets: • Anticipate third quarter reported revenue will be comparable to Q2 medical revenue of $222 million • 2026 cash flow from operations of at least $225 million expected, reduced from $250 million due to the deconsolidation transaction • 2026 capital expenditures up to $95 million expected, up from $85 million for investments in growth markets Financial Position as of June 30, 2026: • $325 million in cash • $289 million of debt at 9.6% interest See slides 17-21 for additional pro forma metrics and reconciliation to GAAP for non-GAAP financial measures. Numbers may not sum perfectly due to rounding.
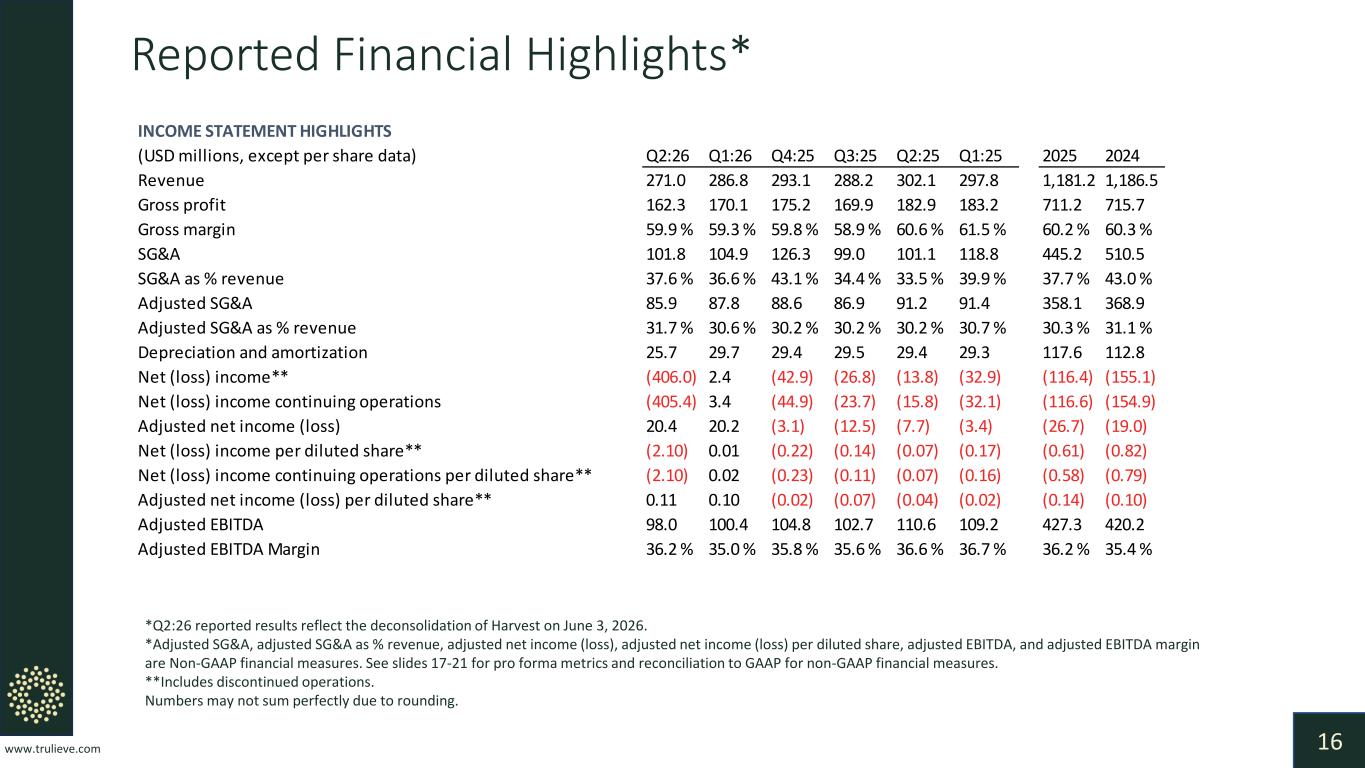
www.trulieve.com 16 Reported Financial Highlights* *Q2:26 reported results reflect the deconsolidation of Harvest on June 3, 2026. *Adjusted SG&A, adjusted SG&A as % revenue, adjusted net income (loss), adjusted net income (loss) per diluted share, adjusted EBITDA, and adjusted EBITDA margin are Non-GAAP financial measures. See slides 17-21 for pro forma metrics and reconciliation to GAAP for non-GAAP financial measures. **Includes discontinued operations. Numbers may not sum perfectly due to rounding. INCOME STATEMENT HIGHLIGHTS (USD millions, except per share data) Q2:26 Q1:26 Q4:25 Q3:25 Q2:25 Q1:25 2025 2024 Revenue 271.0 286.8 293.1 288.2 302.1 297.8 1,181.2 1,186.5 Gross profit 162.3 170.1 175.2 169.9 182.9 183.2 711.2 715.7 Gross margin 59.9 % 59.3 % 59.8 % 58.9 % 60.6 % 61.5 % 60.2 % 60.3 % SG&A 101.8 104.9 126.3 99.0 101.1 118.8 445.2 510.5 SG&A as % revenue 37.6 % 36.6 % 43.1 % 34.4 % 33.5 % 39.9 % 37.7 % 43.0 % Adjusted SG&A 85.9 87.8 88.6 86.9 91.2 91.4 358.1 368.9 Adjusted SG&A as % revenue 31.7 % 30.6 % 30.2 % 30.2 % 30.2 % 30.7 % 30.3 % 31.1 % Depreciation and amortization 25.7 29.7 29.4 29.5 29.4 29.3 117.6 112.8 Net (loss) income** (406.0) 2.4 (42.9) (26.8) (13.8) (32.9) (116.4) (155.1) Net (loss) income continuing operations (405.4) 3.4 (44.9) (23.7) (15.8) (32.1) (116.6) (154.9) Adjusted net income (loss) 20.4 20.2 (3.1) (12.5) (7.7) (3.4) (26.7) (19.0) Net (loss) income per diluted share** (2.10) 0.01 (0.22) (0.14) (0.07) (0.17) (0.61) (0.82) Net (loss) income continuing operations per diluted share** (2.10) 0.02 (0.23) (0.11) (0.07) (0.16) (0.58) (0.79) Adjusted net income (loss) per diluted share** 0.11 0.10 (0.02) (0.07) (0.04) (0.02) (0.14) (0.10) Adjusted EBITDA 98.0 100.4 104.8 102.7 110.6 109.2 427.3 420.2 Adjusted EBITDA Margin 36.2 % 35.0 % 35.8 % 35.6 % 36.6 % 36.7 % 36.2 % 35.4 %
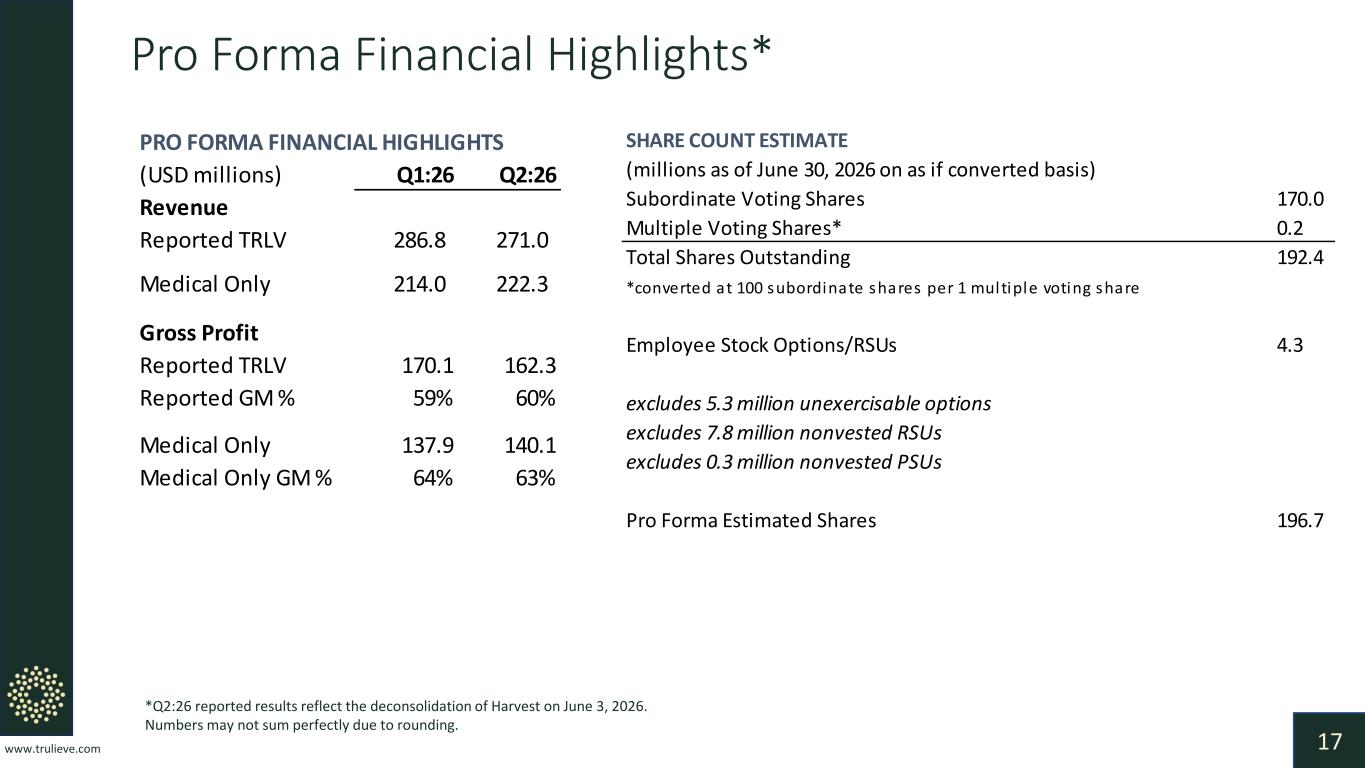
www.trulieve.com 17 Pro Forma Financial Highlights* *Q2:26 reported results reflect the deconsolidation of Harvest on June 3, 2026. Numbers may not sum perfectly due to rounding. SHARE COUNT ESTIMATE (millions as of June 30, 2026 on as if converted basis) Subordinate Voting Shares 170.0 Multiple Voting Shares* 0.2 Total Shares Outstanding 192.4 *converted at 100 subordinate shares per 1 multiple voting share Employee Stock Options/RSUs 4.3 excludes 5.3 million unexercisable options excludes 7.8 million nonvested RSUs excludes 0.3 million nonvested PSUs Pro Forma Estimated Shares 196.7 PRO FORMA FINANCIAL HIGHLIGHTS (USD millions) Q1:26 Q2:26 Revenue Reported TRLV 286.8 271.0 Medical Only 214.0 222.3 Gross Profit Reported TRLV 170.1 162.3 Reported GM % 59% 60% Medical Only 137.9 140.1 Medical Only GM % 64% 63%
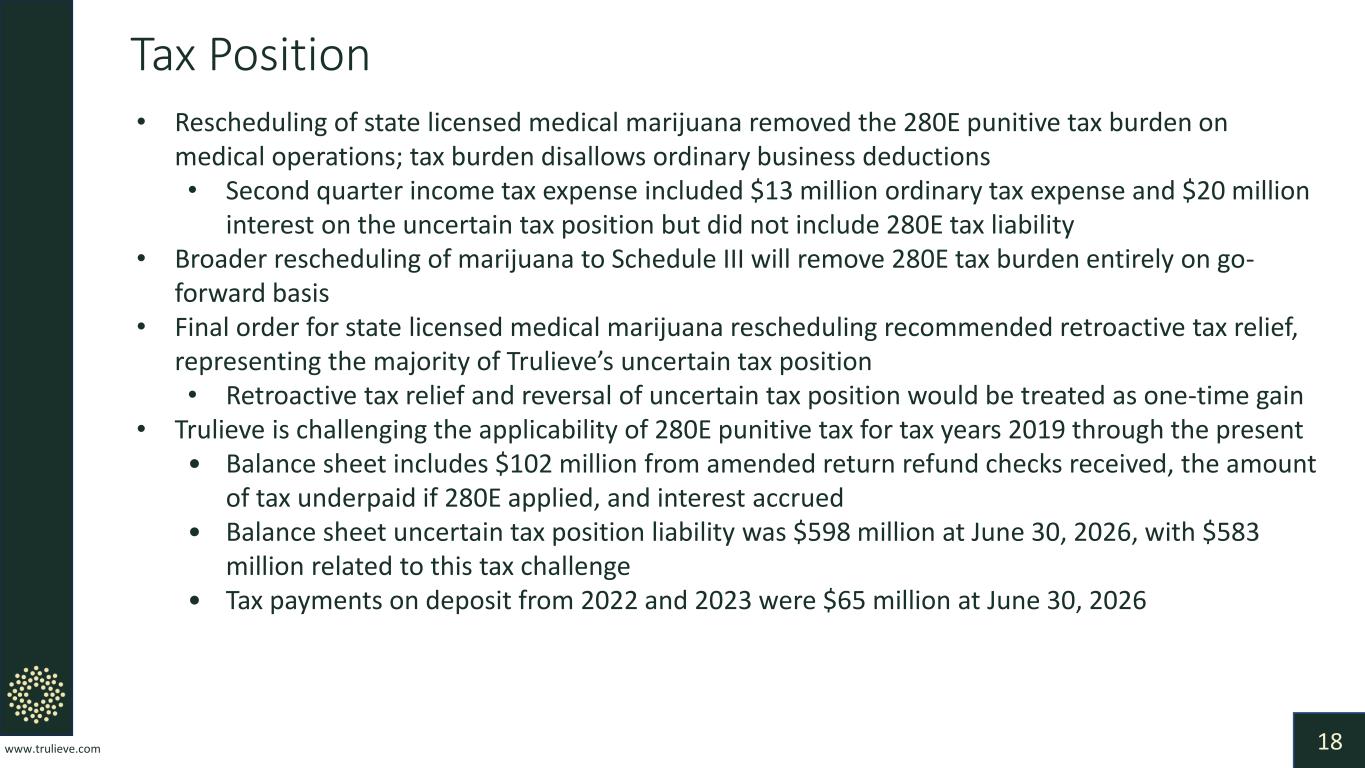
www.trulieve.com 18 Tax Position • Rescheduling of state licensed medical marijuana removed the 280E punitive tax burden on medical operations; tax burden disallows ordinary business deductions • Second quarter income tax expense included $13 million ordinary tax expense and $20 million interest on the uncertain tax position but did not include 280E tax liability • Broader rescheduling of marijuana to Schedule III will remove 280E tax burden entirely on go- forward basis • Final order for state licensed medical marijuana rescheduling recommended retroactive tax relief, representing the majority of Trulieve’s uncertain tax position • Retroactive tax relief and reversal of uncertain tax position would be treated as one-time gain • Trulieve is challenging the applicability of 280E punitive tax for tax years 2019 through the present • Balance sheet includes $102 million from amended return refund checks received, the amount of tax underpaid if 280E applied, and interest accrued • Balance sheet uncertain tax position liability was $598 million at June 30, 2026, with $583 million related to this tax challenge • Tax payments on deposit from 2022 and 2023 were $65 million at June 30, 2026
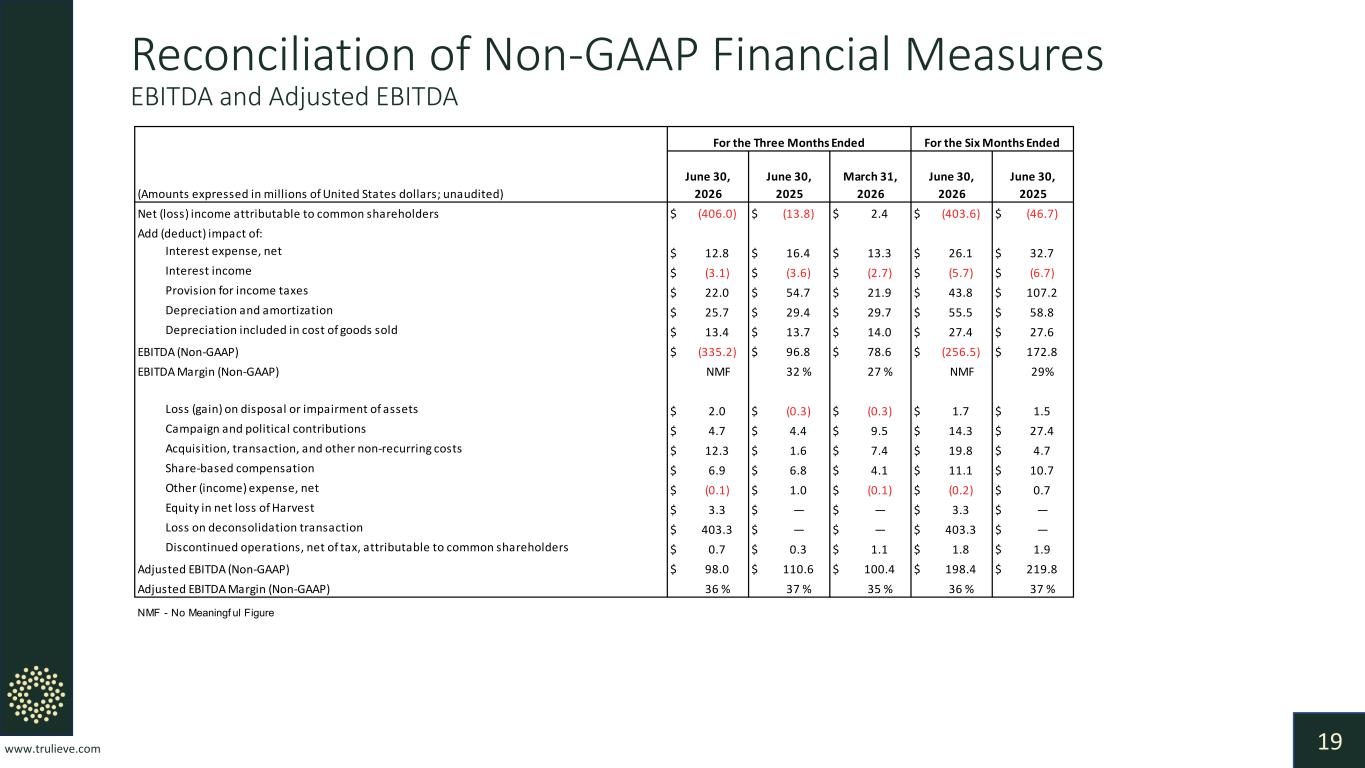
www.trulieve.com 19 Reconciliation of Non-GAAP Financial Measures EBITDA and Adjusted EBITDA Net (loss) income attributable to common shareholders $ (406.0) $ (13.8) $ 2.4 $ (403.6) $ (46.7) Add (deduct) impact of: Interest expense, net $ 12.8 $ 16.4 $ 13.3 $ 26.1 $ 32.7 Interest income $ (3.1) $ (3.6) $ (2.7) $ (5.7) $ (6.7) Provision for income taxes $ 22.0 $ 54.7 $ 21.9 $ 43.8 $ 107.2 Depreciation and amortization $ 25.7 $ 29.4 $ 29.7 $ 55.5 $ 58.8 Depreciation included in cost of goods sold $ 13.4 $ 13.7 $ 14.0 $ 27.4 $ 27.6 EBITDA (Non-GAAP) $ (335.2) $ 96.8 $ 78.6 $ (256.5) $ 172.8 EBITDA Margin (Non-GAAP) NMF 32 % 27 % NMF 29% Loss (gain) on disposal or impairment of assets $ 2.0 $ (0.3) $ (0.3) $ 1.7 $ 1.5 Campaign and political contributions $ 4.7 $ 4.4 $ 9.5 $ 14.3 $ 27.4 Acquisition, transaction, and other non-recurring costs $ 12.3 $ 1.6 $ 7.4 $ 19.8 $ 4.7 Share-based compensation $ 6.9 $ 6.8 $ 4.1 $ 11.1 $ 10.7 Other (income) expense, net $ (0.1) $ 1.0 $ (0.1) $ (0.2) $ 0.7 Equity in net loss of Harvest $ 3.3 $ — $ — $ 3.3 $ — Loss on deconsolidation transaction $ 403.3 $ — $ — $ 403.3 $ — Discontinued operations, net of tax, attributable to common shareholders $ 0.7 $ 0.3 $ 1.1 $ 1.8 $ 1.9 Adjusted EBITDA (Non-GAAP) $ 98.0 $ 110.6 $ 100.4 $ 198.4 $ 219.8 Adjusted EBITDA Margin (Non-GAAP) 36 % 37 % 35 % 36 % 37 % NMF - No Meaningf ul Figure (Amounts expressed in millions of United States dollars; unaudited) June 30, 2026 June 30, 2025 March 31, 2026 For the Three Months Ended For the Six Months Ended June 30, 2025 June 30, 2026
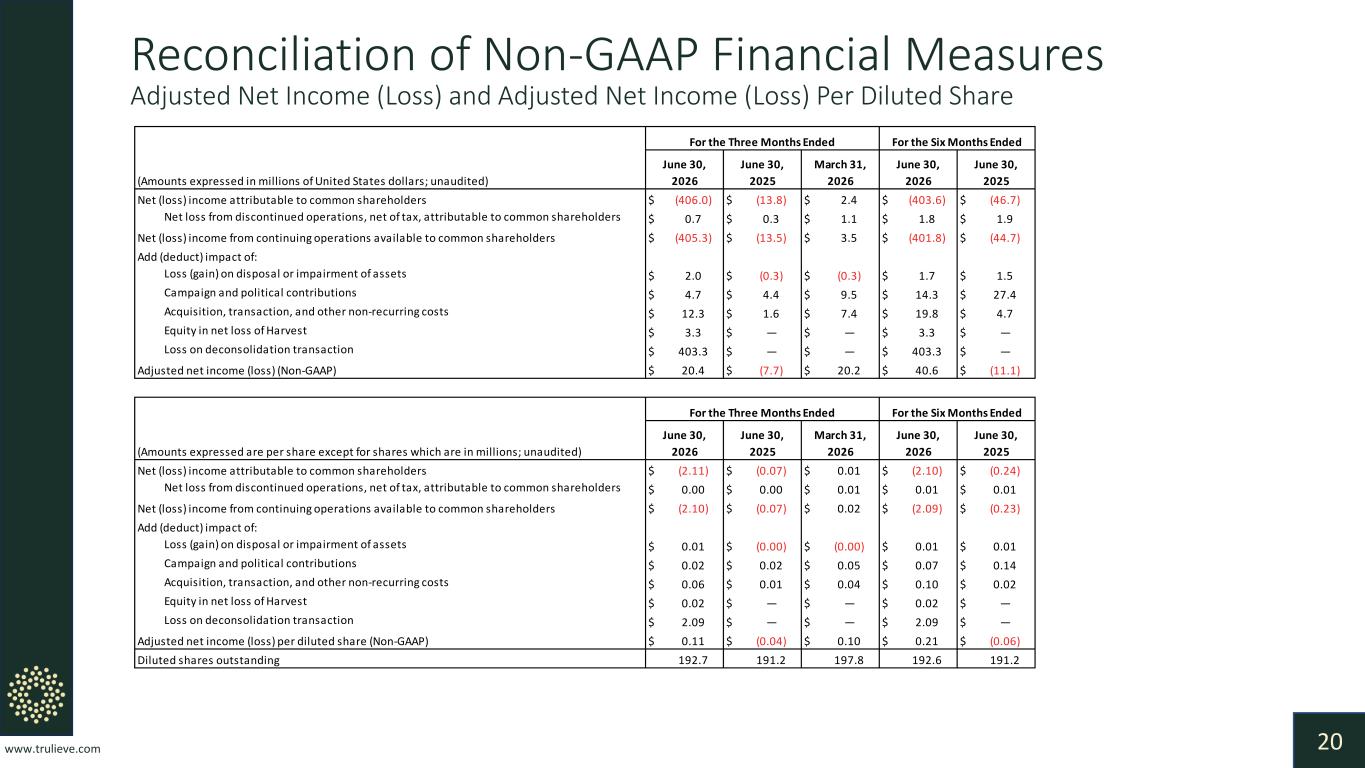
www.trulieve.com 20 Reconciliation of Non-GAAP Financial Measures Adjusted Net Income (Loss) and Adjusted Net Income (Loss) Per Diluted Share Net (loss) income attributable to common shareholders $ (406.0) $ (13.8) $ 2.4 $ (403.6) $ (46.7) Net loss from discontinued operations, net of tax, attributable to common shareholders $ 0.7 $ 0.3 $ 1.1 $ 1.8 $ 1.9 Net (loss) income from continuing operations available to common shareholders $ (405.3) $ (13.5) $ 3.5 $ (401.8) $ (44.7) Add (deduct) impact of: Loss (gain) on disposal or impairment of assets $ 2.0 $ (0.3) $ (0.3) $ 1.7 $ 1.5 Campaign and political contributions $ 4.7 $ 4.4 $ 9.5 $ 14.3 $ 27.4 Acquisition, transaction, and other non-recurring costs $ 12.3 $ 1.6 $ 7.4 $ 19.8 $ 4.7 Equity in net loss of Harvest $ 3.3 $ — $ — $ 3.3 $ — Loss on deconsolidation transaction $ 403.3 $ — $ — $ 403.3 $ — Adjusted net income (loss) (Non-GAAP) $ 20.4 $ (7.7) $ 20.2 $ 40.6 $ (11.1) Net (loss) income attributable to common shareholders $ (2.11) $ (0.07) $ 0.01 $ (2.10) $ (0.24) Net loss from discontinued operations, net of tax, attributable to common shareholders $ 0.00 $ 0.00 $ 0.01 $ 0.01 $ 0.01 Net (loss) income from continuing operations available to common shareholders $ (2.10) $ (0.07) $ 0.02 $ (2.09) $ (0.23) Add (deduct) impact of: Loss (gain) on disposal or impairment of assets $ 0.01 $ (0.00) $ (0.00) $ 0.01 $ 0.01 Campaign and political contributions $ 0.02 $ 0.02 $ 0.05 $ 0.07 $ 0.14 Acquisition, transaction, and other non-recurring costs $ 0.06 $ 0.01 $ 0.04 $ 0.10 $ 0.02 Equity in net loss of Harvest $ 0.02 $ — $ — $ 0.02 $ — Loss on deconsolidation transaction $ 2.09 $ — $ — $ 2.09 $ — Adjusted net income (loss) per diluted share (Non-GAAP) $ 0.11 $ (0.04) $ 0.10 $ 0.21 $ (0.06) Diluted shares outstanding 192.7 191.2 197.8 192.6 191.2 June 30, 2026 For the Six Months Ended June 30, 2025(Amounts expressed are per share except for shares which are in millions; unaudited) June 30, 2026 For the Three Months Ended June 30, 2025 March 31, 2026 (Amounts expressed in millions of United States dollars; unaudited) June 30, 2026 June 30, 2025 March 31, 2026 For the Three Months Ended For the Six Months Ended June 30, 2026 June 30, 2025

www.trulieve.com 21 Reconciliation of Non-GAAP Financial Measures Adjusted Net Income (Loss) and Adjusted Net Income (Loss) Per Diluted Share Net (loss) income attributable to common shareholders $ (406.0) $ (13.8) $ 2.4 $ (403.6) $ (46.7) Net loss from discontinued operations, net of tax, attributable to common shareholders $ 0.7 $ 0.3 $ 1.1 $ 1.8 $ 1.9 Net (loss) income from continuing operations available to common shareholders $ (405.3) $ (13.5) $ 3.5 $ (401.8) $ (44.7) Add (deduct) impact of: Loss (gain) on disposal or impairment of assets $ 2.0 $ (0.3) $ (0.3) $ 1.7 $ 1.5 Campaign and political contributions $ 4.7 $ 4.4 $ 9.5 $ 14.3 $ 27.4 Acquisition, transaction, and other non-recurring costs $ 12.3 $ 1.6 $ 7.4 $ 19.8 $ 4.7 Equity in net loss of Harvest $ 3.3 $ — $ — $ 3.3 $ — Loss on deconsolidation transaction $ 403.3 $ — $ — $ 403.3 $ — Adjusted net income (loss) (Non-GAAP) $ 20.4 $ (7.7) $ 20.2 $ 40.6 $ (11.1) Net (loss) income attributable to common shareholders $ (2.11) $ (0.07) $ 0.01 $ (2.10) $ (0.24) Net loss from discontinued operations, net of tax, attributable to common shareholders $ 0.00 $ 0.00 $ 0.01 $ 0.01 $ 0.01 Net (loss) income from continuing operations available to common shareholders $ (2.10) $ (0.07) $ 0.02 $ (2.09) $ (0.23) Add (deduct) impact of: Loss (gain) on disposal or impairment of assets $ 0.01 $ (0.00) $ (0.00) $ 0.01 $ 0.01 Campaign and political contributions $ 0.02 $ 0.02 $ 0.05 $ 0.07 $ 0.14 Acquisition, transaction, and other non-recurring costs $ 0.06 $ 0.01 $ 0.04 $ 0.10 $ 0.02 Equity in net loss of Harvest $ 0.02 $ — $ — $ 0.02 $ — Loss on deconsolidation transaction $ 2.09 $ — $ — $ 2.09 $ — Adjusted net income (loss) per diluted share (Non-GAAP) $ 0.11 $ (0.04) $ 0.10 $ 0.21 $ (0.06) Diluted shares outstanding 192.7 191.2 197.8 192.6 191.2 June 30, 2026 For the Six Months Ended June 30, 2025(Amounts expressed are per share except for shares which are in millions; unaudited) June 30, 2026 For the Three Months Ended June 30, 2025 March 31, 2026 (Amounts expressed in millions of United States dollars; unaudited) June 30, 2026 June 30, 2025 March 31, 2026 For the Three Months Ended For the Six Months Ended June 30, 2026 June 30, 2025

III. Medical Marijuana Markets

www.trulieve.com 23 Florida Medical Marijuana Market • Population 23 million • 938,980 patients as of July 31, 2026 • Florida is the largest U.S. medical marijuana market • Trulieve has 170 dispensaries, 22% of retail doors, leading retail position by all measures • Trulieve sold 56% more flower per store and 20% more oil per store than market average in Q2:26 • Flower market share 35% • Oil market share 26% • In Q2, Trulieve sold an average of 78 pounds of flower per store across 169 stores • 750K ft2 indoor cultivation facility in Jefferson County producing high quality product at scale • Launched mobile app in November, 50K downloads and over 2 million user sessions in Q2
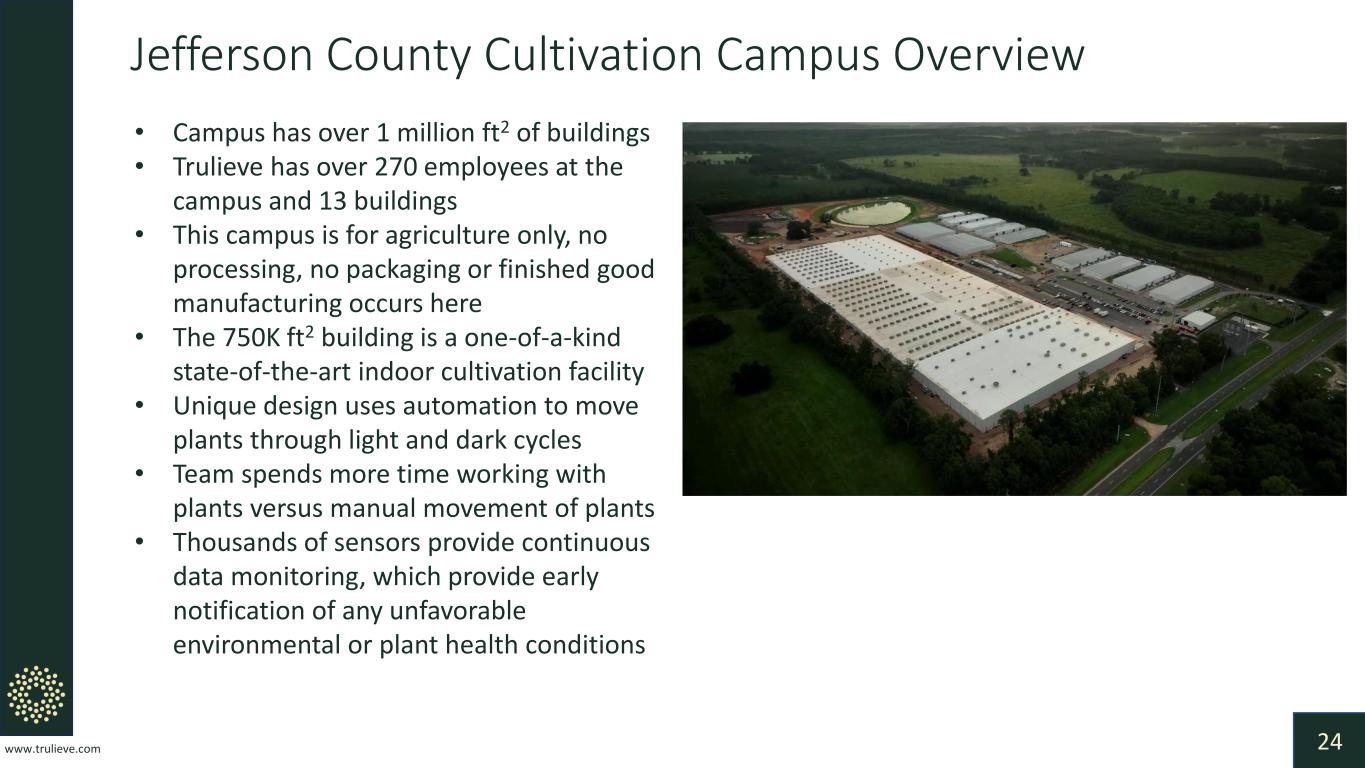
www.trulieve.com 24 Jefferson County Cultivation Campus Overview • Campus has over 1 million ft2 of buildings • Trulieve has over 270 employees at the campus and 13 buildings • This campus is for agriculture only, no processing, no packaging or finished good manufacturing occurs here • The 750K ft2 building is a one-of-a-kind state-of-the-art indoor cultivation facility • Unique design uses automation to move plants through light and dark cycles • Team spends more time working with plants versus manual movement of plants • Thousands of sensors provide continuous data monitoring, which provide early notification of any unfavorable environmental or plant health conditions

www.trulieve.com 25 Georgia Medical Marijuana Market • Population 11 million • 45,356 patients (+38% YTD) • Trulieve has one of two Tier 1 licenses • Allows up to 100K ft2 of production canopy versus Tier 2 limit of 50K ft2 • Cultivation campus in Adel • 6 dispensaries, plan to open 7th in Dunwoody • Only 6 licensed operators in state • Medical program expanded July 1, 2026 • New conditions HIV, IBS, lupus • New form factors including flower and vapes • Pharmacy distribution of approved medical marijuana products to patients resumes with DEA registration • 125 independent pharmacies • Only state program to allow these sales
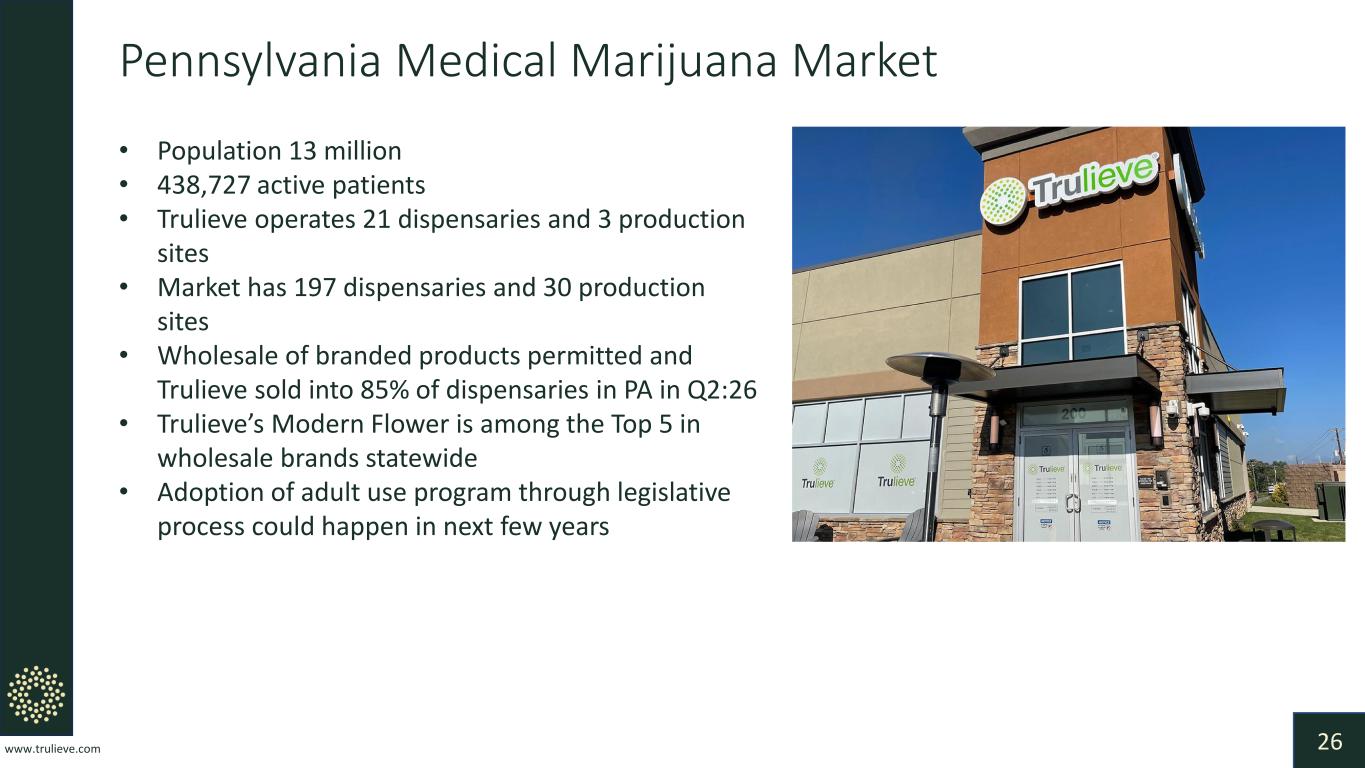
www.trulieve.com 26 Pennsylvania Medical Marijuana Market • Population 13 million • 438,727 active patients • Trulieve operates 21 dispensaries and 3 production sites • Market has 197 dispensaries and 30 production sites • Wholesale of branded products permitted and Trulieve sold into 85% of dispensaries in PA in Q2:26 • Trulieve’s Modern Flower is among the Top 5 in wholesale brands statewide • Adoption of adult use program through legislative process could happen in next few years
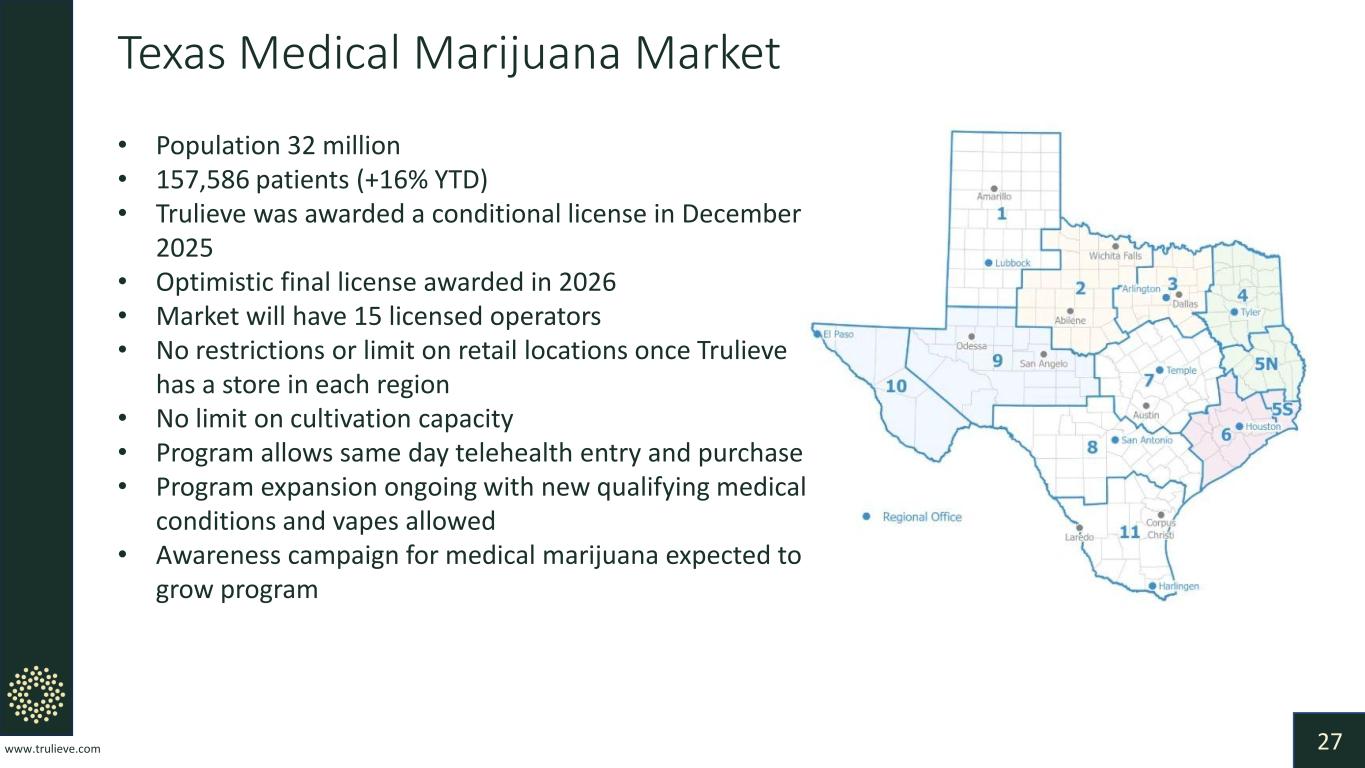
www.trulieve.com 27 Texas Medical Marijuana Market • Population 32 million • 157,586 patients (+16% YTD) • Trulieve was awarded a conditional license in December 2025 • Optimistic final license awarded in 2026 • Market will have 15 licensed operators • No restrictions or limit on retail locations once Trulieve has a store in each region • No limit on cultivation capacity • Program allows same day telehealth entry and purchase • Program expansion ongoing with new qualifying medical conditions and vapes allowed • Awareness campaign for medical marijuana expected to grow program

IV. Appendix

www.trulieve.com 29 U.S. Cannabis Industry Source: Company Estimates • The legal U.S. cannabis market is expected to reach $43 billion by 2030 • The U.S. is global launchpad for cannabis culture, product development, and trends • 46 states have some program with CBD, medical marijuana, and/or adult use • 41 states have adopted medical marijuana programs overseen by state agencies • 24 states have enacted adult use marijuana programs $19 $25 $25 $29 $30 $30 $32 $34 $36 $39 $43 $0 $5 $10 $15 $20 $25 $30 $35 $40 $45 $50 2020 2021 2022 2023 2024 2025 2026 2027 2028 2029 2030 B il li o n s U.S. Legal Cannabis Sales Forecast (USD Billions)
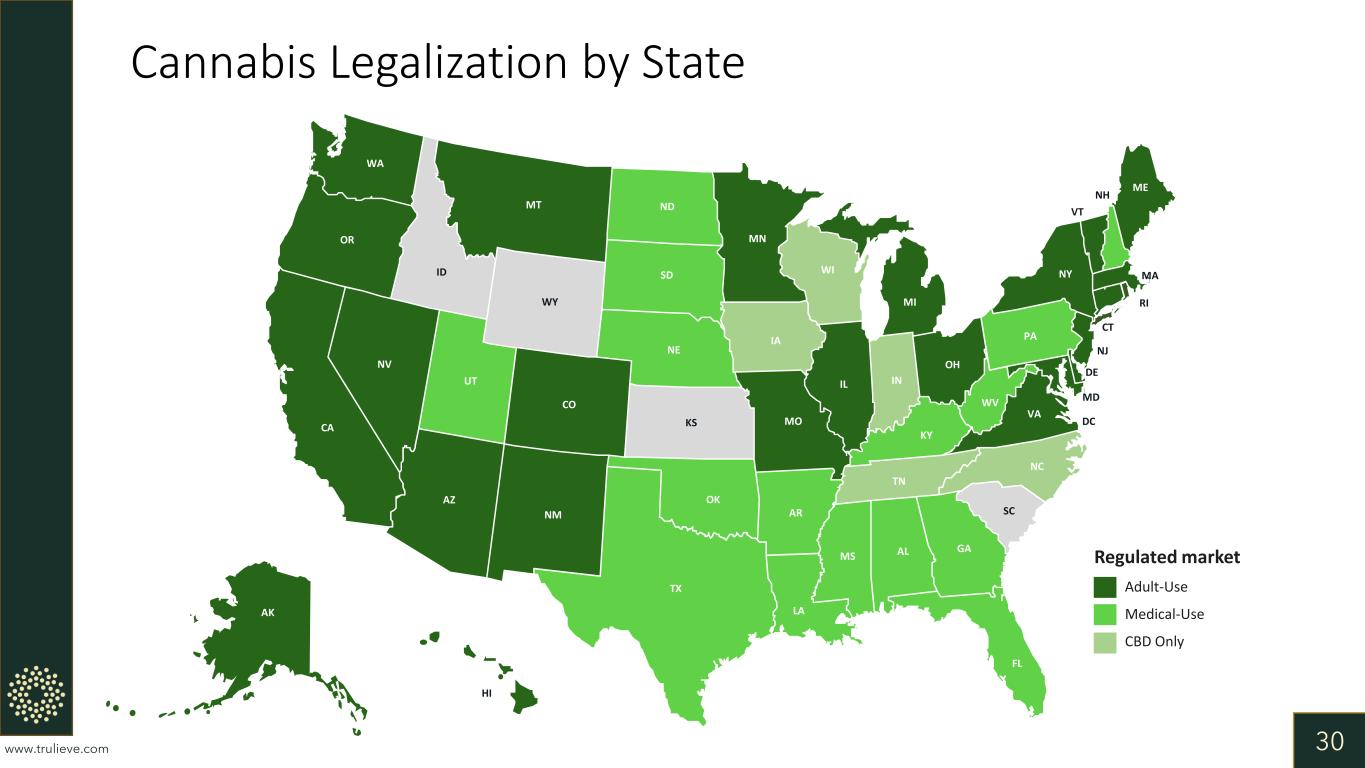
www.trulieve.com 30 Cannabis Legalization by State MT WY ID WA OR NV UT CA AZ ND SD NE CO NM TX OK KS AR LA MO IA MN WI IL IN KY TN MS AL GA FL SC NC VA OH MI NY PA MD DE NJ CT RI MA ME VT NH DC WV AK HI AK Regulated market Adult-Use Medical-Use CBD Only
www.trulieve.com 31 Trulieve At A Glance Trulieve is the largest U.S. medical marijuana operator • First Florida licensed operator with initial sales in 2016 • Listed on Canadian Securities Exchange in September 2018 • Listed on New York Stock Exchange June 10, 2026 under ticker “TRLV” Established scaled operations in attractive markets • 3.5 million square feet of cultivation and processing capacity • 207 retail dispensaries with DEA registration in medical only states • >5,000 employees Excellent track record of profitable growth and prudent capital allocation • 2025 consolidated results: $1.2 billion revenue, 60% gross margin and $273 million cash flow from operations • Disciplined capital allocation with adherence to strategy and criteria • Targeted approach with balance between organic growth and M&A
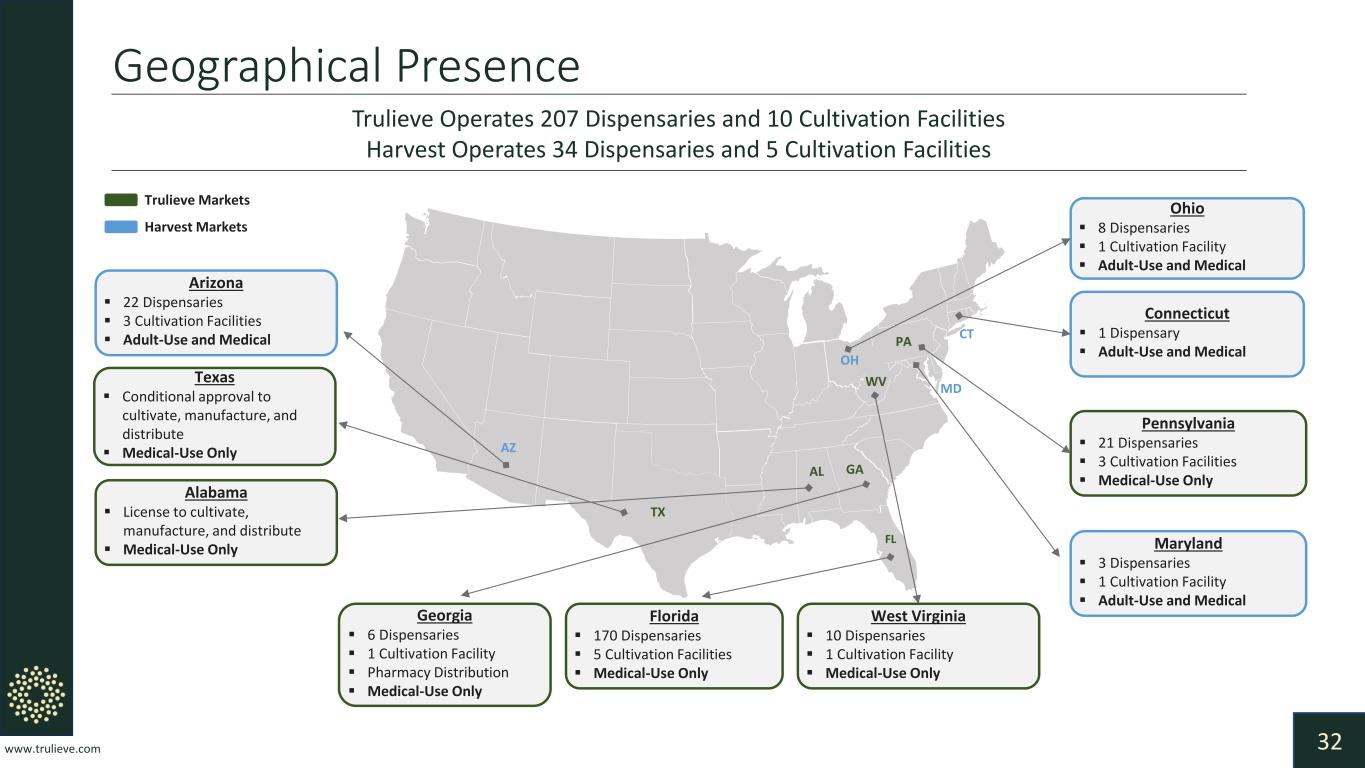
www.trulieve.com 32 Connecticut ▪ 1 Dispensary ▪ Adult-Use and Medical Florida ▪ 170 Dispensaries ▪ 5 Cultivation Facilities ▪ Medical-Use Only Alabama ▪ License to cultivate, manufacture, and distribute ▪ Medical-Use Only Trulieve Markets Harvest Markets Geographical Presence Trulieve Operates 207 Dispensaries and 10 Cultivation Facilities Harvest Operates 34 Dispensaries and 5 Cultivation Facilities MD OH PA FL CT AZ WV GA Arizona ▪ 22 Dispensaries ▪ 3 Cultivation Facilities ▪ Adult-Use and Medical Pennsylvania ▪ 21 Dispensaries ▪ 3 Cultivation Facilities ▪ Medical-Use Only Maryland ▪ 3 Dispensaries ▪ 1 Cultivation Facility ▪ Adult-Use and Medical Ohio ▪ 8 Dispensaries ▪ 1 Cultivation Facility ▪ Adult-Use and Medical Texas ▪ Conditional approval to cultivate, manufacture, and distribute ▪ Medical-Use Only TX AL Georgia ▪ 6 Dispensaries ▪ 1 Cultivation Facility ▪ Pharmacy Distribution ▪ Medical-Use Only West Virginia ▪ 10 Dispensaries ▪ 1 Cultivation Facility ▪ Medical-Use Only

www.trulieve.com 33 • Leadership

www.trulieve.com 34 Board of Directors KIM RIVERS, Founder, Chairman, Chief Executive Officer Experienced entrepreneur with successful track record in multiple sectors including cannabis and real estate. Rivers joined Trulieve at its inception and has been the key driver for the Company’s customer-centric vision, strong growth, strategic expansion, and industry-leading profitability. Prior to Trulieve, Ms. Rivers spent several years as an attorney in private practice specializing in mergers, acquisitions, and securities for multi-million-dollar corporations. RICHARD MAY, Director President and Co-Owner of May Nursery, Inc. with almost two decades of growing and management experience. May has served on several agricultural and civic boards including the Southern Nursery Association and the Gadsden County Chamber of Commerce. May is a founding member of Trulieve. JANE MORREAU, Director Seasoned global finance executive with a broad skillset and expertise. Experience includes supply chain management, manufacturing operations, information technology, retail operations, mergers and acquisitions and corporate strategy. Morreau formerly served as Executive Vice President and Chief Financial Officer of Brown-Forman Corporation. PETER T. HEALY, Lead Director Attorney with a focus on capital markets, M&A, and private equity transactions. Clients have included corporate issuers, Wall Street underwriters, and private equity firms. Substantial experience representing issuers and underwriters in public offerings and private placements, private equity firms and sovereign wealth funds in their investment activities, and corporate boards in governance matters and strategic transactions. THOMAS MILLNER, Director Executive with strong combination of leadership, merchandising and multichannel experience. Served as CEO of Cabela's, a direct marketer and specialty retailer of outdoor recreation merchandise, for nearly a decade. Prior to Cabela's, Milner spent 14 years as president and CEO of North Carolina's Remington Arms Company. SUSAN THRONSON, Director Independent director with global digital, ecommerce and loyalty marketing experience. Thronson was Senior Vice President of Global Marketing for Marriott International, leading Marriott's worldwide integrated marketing strategy and execution for its 15 hotel brands. MATTHEW FOULSTON, Director Seasoned financial executive with extensive international experience, serving as CFO for three publicly listed companies. Foulston was Executive Vice President and CFO of Covetrus, Inc., a global animal health distribution, software, and e-commerce business, and previously served as Executive Vice President and CFO for TreeHouse Foods, Inc., and CFO of Compass Minerals International Inc.

www.trulieve.com 35 Executive Leadership KIM RIVERS Founder, Chairman, Chief Executive Officer JAN REESE Chief Financial Officer KYLE LANDRUM Chief Production Officer TIM MOREY Chief Sales Officer ERIC POWERS Chief Legal Officer MICHIEL DE ZWAAN Chief Human Resources Officer CHRISTINE HERSEY Chief Corporate Affairs & Strategy Officer NILYUM JHALA Chief Technology Officer ELIAS AGUILERA Chief Marketing Officer

www.trulieve.com 36 House of Brands Trulieve Brands V A LU E M ID P R EM IU M Partner Brands