TWO-PC 8-K
Two Harbors Investment Corp. (TWO-PC)
8-K
2020-02-05
For: 2020-02-05
View Original
Added on
April 08, 2026
UNITED STATES
SECURITIES AND EXCHANGE COMMISSION
Washington, D.C. 20549
FORM 8-K
Current Report
Pursuant to Section 13 or 15(d) of the Securities Exchange Act of 1934
Date of Report: February 5, 2020
(Exact name of registrant as specified in its charter)
(State or other jurisdiction of incorporation or organization) | (Commission File Number) | (I.R.S. Employer Identification No.) | |
(Address of Principal Executive Offices) | (Zip Code) | ||
(612 ) 629-2500
Registrant's telephone number, including area code
(Former name or former address, if changed since last report)
Check the appropriate box below if the Form 8-K filing is intended to simultaneously satisfy the filing obligation of the registrant under any of the following provisions (see General Instruction A.2. below):
Securities Registered Pursuant to Section 12(b) of the Act:
Title of Each Class: | Trading Symbol(s) | Name of Exchange on Which Registered: | ||
Indicate by check mark whether the registrant is an emerging growth company as defined in Rule 405 of the Securities Act of 1933 (17 CFR §230.405) or Rule 12b-2 of the Securities Exchange Act of 1934 (17 CFR §240.12b-2).
Emerging Growth Company ☐
If an emerging growth company, indicate by check mark if the registrant has elected not to use the extended transition period for complying with any new or revised financial accounting standards provided pursuant to Section 13(a) of the Exchange Act.
☐
Item 2.02 Results of Operations and Financial Condition.
On February 5, 2020, Two Harbors Investment Corp. (the "Company") issued a press release announcing its financial results for the fiscal quarter ended December 31, 2019. A copy of the press release and the 2019 Fourth Quarter Earnings Call Presentation are attached hereto as Exhibits 99.1 and 99.2, respectively, and are incorporated herein by reference.
The information in this Current Report, including Exhibits 99.1 and 99.2 attached hereto, is furnished pursuant to Item 2.02 of Form 8-K and shall not be deemed to be “filed” for any other purpose, including for purposes of Section 18 of the Securities Exchange Act of 1934, as amended, or otherwise subject to the liabilities of that Section. The information in Item 2.02 of this Current Report, including Exhibits 99.1 and 99.2, shall not be deemed incorporated by reference into any filing of the registrant under the Securities Act of 1933 or the Exchange Act, whether made before or after the date hereof, regardless of any general incorporation language in such filings (unless the registrant specifically states that the information or exhibit in this Item 2.02 is incorporated by reference).
Item 9.01 | Financial Statements and Exhibits. |
(d) Exhibits.
Exhibit No. | Description | ||
99.1 | |||
99.2 | |||
104 | Cover Page Interactive Data File, formatted in Inline XBRL. | ||
SIGNATURES
Pursuant to the requirements of the Securities Exchange Act of 1934, the registrant has duly caused this report to be signed on its behalf by the undersigned hereunto duly authorized.
TWO HARBORS INVESTMENT CORP. | ||
By: | /s/ REBECCA B. SANDBERG | |
Rebecca B. Sandberg | ||
General Counsel and Secretary | ||
Date: February 5, 2020 | ||

Two Harbors Investment Corp. Reports Fourth Quarter 2019 Financial Results
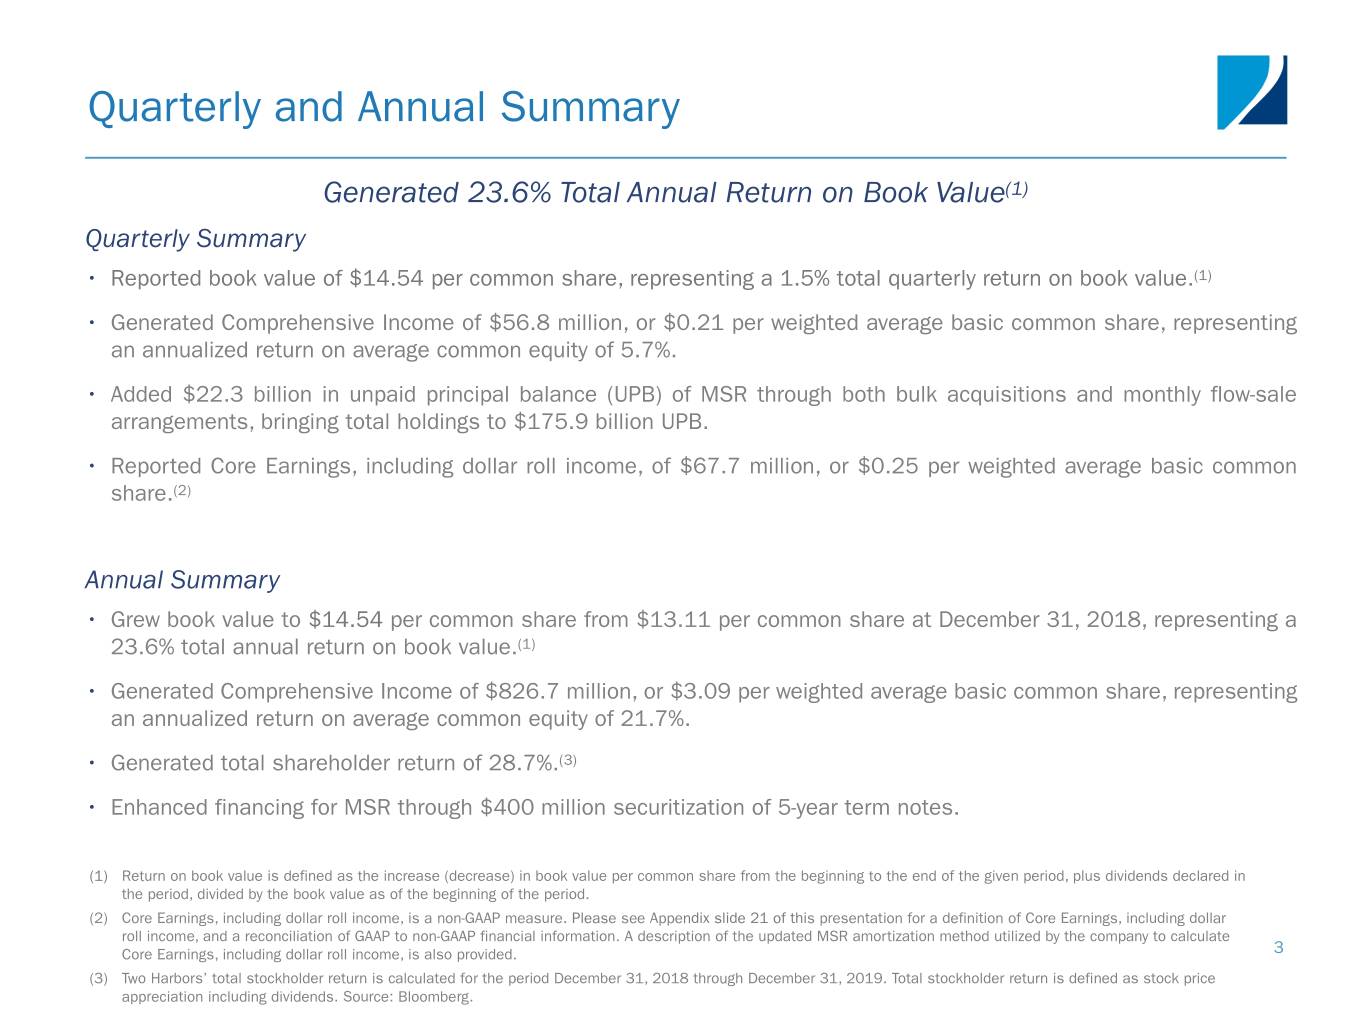
Generated 23.6% Total Annual Return on Book Value(1)
NEW YORK, February 5, 2020 - Two Harbors Investment Corp. (NYSE: TWO), a leading hybrid mortgage real estate investment trust (REIT) that invests in residential mortgage-backed securities (RMBS), mortgage servicing rights (MSR) and other financial assets, today announced its financial results for the quarter ended December 31, 2019.
Quarterly Summary
• | Reported book value of $14.54 per common share, representing a 1.5% total quarterly return on book value.(1) |
• | Generated Comprehensive Income of $56.8 million, or $0.21 per weighted average basic common share, representing an annualized return on average common equity of 5.7%. |
• | Added $22.3 billion in unpaid principal balance (UPB) of MSR, through both bulk acquisitions and monthly flow-sale arrangements, bringing total holdings to $175.9 billion UPB. |
• | Reported Core Earnings, including dollar roll income, of $67.7 million, or $0.25 per weighted average basic common share.(2) |
2019 Summary
• | Grew book value to $14.54 per common share from $13.11 per common share at December 31, 2018, representing a 23.6% total annual return on book value.(1) |
• | Generated Comprehensive Income of $826.7 million, or $3.09 per weighted average basic common share, representing an annualized return on average common equity of 21.7%. |
• | Generated total stockholder return of 28.7% .(3) |
• | Enhanced financing for MSR through $400 million securitization of 5-year term notes. |
“We are quite proud of the returns that we generated in 2019. Notably, we drove a total stockholder return of 28.7%(3) and a return on book value of 23.6%(1) for the year,” stated Thomas Siering, Two Harbors’ President and Chief Executive Officer. “Book value preservation is our primary goal and the foundation for long-term stockholder returns.”
(1) | Return on book value is defined as the increase (decrease) in book value per common share from the beginning to the end of the given period, plus dividends declared in the period, divided by the book value as of the beginning of the period. |
(2) | Core Earnings, including dollar roll income, is a non-GAAP measure. Please see page 11 for a definition of Core Earnings, including dollar roll income, and a reconciliation of GAAP to non-GAAP financial information. |
(3) | Two Harbors’ total stockholder return is calculated for the period December 31, 2018 through December 31, 2019. Total stockholder return is defined as stock price appreciation including dividends. Source: Bloomberg. |
- 1 -
Operating Performance
The following table summarizes the company’s GAAP and non-GAAP earnings measurements and key metrics for the third and fourth quarters of 2019:
Two Harbors Investment Corp. Operating Performance (unaudited) | |||||||||||||||||||||
(dollars in thousands, except per common share data) | |||||||||||||||||||||
Three Months Ended December 31, 2019 | Three Months Ended September 30, 2019 | ||||||||||||||||||||
Earnings attributable to common stockholders | Earnings | Per weighted average basic common share | Annualized return on average common equity | Earnings | Per weighted average basic common share | Annualized return on average common equity | |||||||||||||||
Comprehensive Income | $ | 56,850 | $ | 0.21 | 5.7 | % | $ | 257,585 | $ | 0.94 | 25.7 | % | |||||||||
GAAP Net Income | $ | 115,804 | $ | 0.42 | 11.6 | % | $ | 286,749 | $ | 1.05 | 28.6 | % | |||||||||
Core Earnings, including dollar roll income(1) | $ | 67,671 | $ | 0.25 | 6.8 | % | $ | 64,979 | $ | 0.24 | 6.5 | % | |||||||||
Operating Metrics | |||||||||||||||||||||
Dividend per common share | $ | 0.40 | $ | 0.40 | |||||||||||||||||
Annualized dividend yield(2) | 10.9 | % | 12.2 | % | |||||||||||||||||
Book value per common share at period end | $ | 14.54 | $ | 14.72 | |||||||||||||||||
Return on book value(3) | 1.5 | % | 6.7 | % | |||||||||||||||||
Other operating expenses, excluding non-cash LTIP amortization(4) | $ | 11,719 | $ | 11,364 | |||||||||||||||||
Other operating expenses, excluding non-cash LTIP amortization, as a percentage of average equity(4) | 0.9 | % | 0.9 | % | |||||||||||||||||
________________
(1) | Please see page 11 for a definition of Core Earnings, including dollar roll income, and a reconciliation of GAAP to non-GAAP financial information. |
(2) | Dividend yield is calculated based on annualizing the dividends declared in the given period, divided by the closing share price as of the end of the period. |
(3) | Return on book value is defined as the increase (decrease) in book value per common share from the beginning to the end of the given period, plus dividends declared in the period, divided by the book value as of the beginning of the period. |
(4) | Excludes non-cash equity compensation expense of $2.4 million for the fourth quarter 2019 and $2.0 million for the third quarter 2019. |
“Our results in 2019 highlighted the effectiveness of our MSR portfolio construction, as we dynamically and successfully managed the portfolio through a volatile environment in rates and mortgage spreads,” stated Matt Koeppen, Two Harbors’ Co-Chief Investment Officer. “The actions we took this year were intended to preserve or increase book value, preserve or increase return expectancy, and to reduce risk. We believe that we were very successful in this regard.”
“We are very satisfied with our performance this quarter, as our active portfolio management resulted in positive total return despite market trends that were the opposite of those that prevailed through the first three quarters,” stated Bill Greenberg, Two Harbors’ Co-Chief Investment Officer. “Our Rates and Credit strategies complement each other and each have contributed to our success.”
Portfolio Summary
The company’s portfolio is comprised of a Rates strategy and a Credit strategy. The Rates strategy consisted of $29.8 billion of Agency RMBS, Agency Derivatives and MSR as well as their associated notional hedges as of December 31, 2019. Additionally, the company held $7.7 billion bond equivalent value of net long to-be-announced securities (TBAs) as part of the Rates strategy. The Credit strategy consisted of $3.6 billion of non-Agency securities, as well as their associated notional hedges as of December 31, 2019.
- 2 -
The following tables summarize the company’s investment portfolio as of December 31, 2019 and September 30, 2019:
Two Harbors Investment Corp. Portfolio | ||||||||||||||
(dollars in thousands) | ||||||||||||||
Portfolio Composition | As of December 31, 2019 | As of September 30, 2019 | ||||||||||||
(unaudited) | (unaudited) | |||||||||||||
Rates Strategy | ||||||||||||||
Agency | ||||||||||||||
Fixed Rate | $ | 27,763,471 | 83.2 | % | $ | 24,750,521 | 82.4 | % | ||||||
Other Agency(1) | 83,509 | 0.2 | % | 91,554 | 0.3 | % | ||||||||
Total Agency | 27,846,980 | 83.4 | % | 24,842,075 | 82.7 | % | ||||||||
Mortgage servicing rights | 1,909,444 | 5.7 | % | 1,651,556 | 5.5 | % | ||||||||
Credit Strategy | ||||||||||||||
Non-Agency | ||||||||||||||
Senior | 3,073,098 | 9.2 | % | 2,990,274 | 10.0 | % | ||||||||
Mezzanine | 480,765 | 1.5 | % | 483,009 | 1.6 | % | ||||||||
Other | 74,410 | 0.2 | % | 79,092 | 0.3 | % | ||||||||
Total Non-Agency | 3,628,273 | 10.9 | % | 3,552,375 | 11.9 | % | ||||||||
Aggregate Portfolio | 33,384,697 | 30,046,006 | ||||||||||||
Net TBA position(2) | 7,656,187 | 10,264,428 | ||||||||||||
Total Portfolio | $ | 41,040,884 | $ | 40,310,434 | ||||||||||
Portfolio Metrics | Three Months Ended December 31, 2019 | Three Months Ended September 30, 2019 | ||||
(unaudited) | (unaudited) | |||||
Annualized portfolio yield during the quarter(3) | 3.54 | % | 3.67 | % | ||
Rates Strategy | ||||||
Agency RMBS, Agency Derivatives and mortgage servicing rights | 3.20 | % | 3.47 | % | ||
Credit Strategy | ||||||
Non-Agency securities | 6.29 | % | 5.26 | % | ||
Annualized cost of funds on average borrowing balance during the quarter(4) | 2.35 | % | 2.51 | % | ||
Annualized net yield for aggregate portfolio during the quarter | 1.19 | % | 1.16 | % | ||
________________
(1) | Other Agency includes hybrid ARMs and Agency derivatives. |
(2) | Represents bond equivalent value of TBA position. Bond equivalent value is defined as notional amount multiplied by market price. Accounted for as derivative instruments in accordance with GAAP. |
(3) | Includes interest income on RMBS and servicing income net of servicing expenses and amortization on MSR. |
(4) | Cost of funds includes interest spread income/expense associated with the portfolio's interest rate swaps and caps. |
Portfolio Metrics Specific to RMBS and Agency Derivatives | As of December 31, 2019 | As of September 30, 2019 | ||||||
(unaudited) | (unaudited) | |||||||
Weighted average cost basis of principal and interest securities | ||||||||
Agency(5) | $ | 103.96 | $ | 104.23 | ||||
Non-Agency(6) | $ | 63.86 | $ | 63.63 | ||||
Weighted average three month CPR | ||||||||
Agency | 14.3 | % | 13.4 | % | ||||
Non-Agency | 6.4 | % | 5.9 | % | ||||
Fixed-rate investments as a percentage of aggregate RMBS and Agency Derivatives portfolio | 89.1 | % | 88.2 | % | ||||
Adjustable-rate investments as a percentage of aggregate RMBS and Agency Derivatives portfolio | 10.9 | % | 11.8 | % | ||||
______________
(5) Weighted average cost basis includes RMBS principal and interest securities only. Average purchase price utilized carrying value for weighting purposes.
(6) Average purchase price utilized carrying value for weighting purposes. If current face were utilized for weighting purposes, the average purchase price for total non-Agency securities excluding the company's non-Agency interest-only portfolio, would be $59.60 at December 31, 2019 and $59.41 at September 30, 2019.
- 3 -
Portfolio Metrics Specific to MSR(1) | As of December 31, 2019 | As of September 30, 2019 | ||||||
(dollars in thousands) | (unaudited) | (unaudited) | ||||||
Unpaid principal balance | $ | 175,882,142 | $ | 165,332,533 | ||||
Fair market value | $ | 1,909,444 | $ | 1,651,556 | ||||
Gross weighted average coupon | 4.1% | 4.1 | % | |||||
Weighted average original FICO score(2) | 754 | 752 | ||||||
Weighted average original LTV | 75% | 75 | % | |||||
60+ day delinquencies | 0.3% | 0.3 | % | |||||
Net servicing spread | 27.0 basis points | 26.5 basis points | ||||||
Three Months Ended December 31, 2019 | Three Months Ended September 30, 2019 | |||||||
(unaudited) | (unaudited) | |||||||
Fair value losses | $ | (21,739 | ) | $ | (234,514 | ) | ||
Servicing income | $ | 127,690 | $ | 126,025 | ||||
Servicing expenses | $ | 20,149 | $ | 17,962 | ||||
Change in servicing reserves | $ | 72 | $ | (300 | ) | |||
________________
Note: The company does not directly service mortgage loans, but instead contracts with appropriately licensed subservicers to handle substantially all servicing functions in the name of the subservicer for the loans underlying the company’s MSR.
(1) Metrics exclude residential mortgage loans in securitization trusts for which the company is the named servicing administrator.
(2) FICO represents a mortgage industry accepted credit score of a borrower.
Other Investments and Risk Management Metrics | As of December 31, 2019 | As of September 30, 2019 | ||||||
(dollars in thousands) | (unaudited) | (unaudited) | ||||||
Net long TBA notional amount(3) | $ | 7,427,000 | $ | 9,863,000 | ||||
Interest rate swaps and caps notional, utilized to economically hedge interest rate exposure (or duration) | $ | 39,702,470 | $ | 41,833,495 | ||||
Swaptions net notional, utilized as macroeconomic hedges | 1,257,000 | 1,750,000 | ||||||
Total interest rate swaps, caps and swaptions notional | $ | 40,959,470 | $ | 43,583,495 | ||||
________________
(3) Accounted for as derivative instruments in accordance with GAAP.
Financing Summary
The following tables summarize the company’s financing metrics and outstanding repurchase agreements, FHLB advances, revolving credit facilities, term notes and convertible senior notes as of December 31, 2019 and September 30, 2019:
December 31, 2019 | Balance | Weighted Average Borrowing Rate | Weighted Average Months to Maturity | Number of Distinct Counterparties | |||||||||
(dollars in thousands, unaudited) | |||||||||||||
Repurchase agreements collateralized by RMBS | $ | 28,884,848 | 2.12 | % | 2.44 | ||||||||
Repurchase agreements collateralized by MSR | 262,615 | 3.51 | % | 11.05 | |||||||||
Total repurchase agreements | 29,147,463 | 2.14 | % | 2.52 | 24 | ||||||||
FHLB advances collateralized by RMBS(4) | 210,000 | 2.00 | % | 42.56 | 1 | ||||||||
Revolving credit facilities collateralized by MSR | 300,000 | 4.26 | % | 14.37 | 1 | ||||||||
Term notes payable collateralized by MSR | 394,502 | 4.59 | % | 53.85 | n/a | ||||||||
Unsecured convertible senior notes | 284,954 | 6.25 | % | 24.53 | n/a | ||||||||
Total borrowings | $ | 30,336,919 | |||||||||||
________________
(4) The company’s wholly owned subsidiary, TH Insurance Holdings Company LLC (TH Insurance), is a member of the FHLB. As a member of the FHLB, TH Insurance has access to a variety of products and services offered by the FHLB, including secured advances.
- 4 -
September 30, 2019 | Balance | Weighted Average Borrowing Rate | Weighted Average Months to Maturity | Number of Distinct Counterparties | |||||||||
(dollars in thousands, unaudited) | |||||||||||||
Repurchase agreements collateralized by RMBS | $ | 25,304,275 | 2.46 | % | 2.54 | ||||||||
Repurchase agreements collateralized by MSR | 262,861 | 3.77 | % | 14.07 | |||||||||
Total repurchase agreements | 25,567,136 | 2.47 | % | 2.65 | 25 | ||||||||
FHLB advances collateralized by RMBS(1) | 50,000 | 2.99 | % | 180.66 | 1 | ||||||||
Revolving credit facilities collateralized by MSR | 300,000 | 4.52 | % | 17.39 | 1 | ||||||||
Term notes payable collateralized by MSR | 394,235 | 4.82 | % | 56.88 | n/a | ||||||||
Unsecured convertible senior notes | 284,635 | 6.25 | % | 27.53 | n/a | ||||||||
Total borrowings | $ | 26,596,006 | |||||||||||
________________
(1) The company’s wholly owned subsidiary, TH Insurance Holdings Company LLC (TH Insurance), is a member of the FHLB. As a member of the FHLB, TH Insurance has access to a variety of products and services offered by the FHLB, including secured advances.
Borrowings by Collateral Type | As of December 31, 2019 | As of September 30, 2019 | ||||||
(dollars in thousands) | (unaudited) | (unaudited) | ||||||
Collateral type: | ||||||||
Agency RMBS and Agency Derivatives | $ | 27,563,240 | $ | 24,133,606 | ||||
Mortgage servicing rights | 957,117 | 957,096 | ||||||
Non-Agency securities | 1,531,608 | 1,220,669 | ||||||
Other(2) | 284,954 | 284,635 | ||||||
Total/Annualized cost of funds on average borrowings during the quarter | $ | 30,336,919 | $ | 26,596,006 | ||||
Debt-to-equity ratio at period-end(3) | 6.1 | :1.0 | 5.3 | :1.0 | ||||
Economic debt-to-equity ratio at period-end(4) | 7.5 | :1.0 | 7.2 | :1.0 | ||||
Cost of Funds Metrics | Three Months Ended December 31, 2019 | Three Months Ended September 30, 2019 | ||||||
(unaudited) | (unaudited) | |||||||
Annualized cost of funds on average borrowings during the quarter: | 2.4 | % | 2.8 | % | ||||
Agency RMBS and Agency Derivatives | 2.2 | % | 2.6 | % | ||||
Mortgage servicing rights(5) | 5.0 | % | 5.2 | % | ||||
Non-Agency securities | 3.0 | % | 3.5 | % | ||||
Other(2)(5) | 6.8 | % | 6.7 | % | ||||
____________________
(2) | Includes unsecured convertible senior notes. |
(3) | Defined as total borrowings to fund RMBS, MSR and Agency Derivatives, divided by total equity. |
(4) | Defined as total borrowings to fund RMBS, MSR and Agency Derivatives, plus the implied debt on net TBA positions, divided by total equity. |
(5) | Includes amortization of debt issuance costs. |
Dividends and Taxable Income
The company declared dividends totaling $483.6 million for the 2019 taxable year. The company is required to distribute at least 90% of its taxable income to maintain its REIT status, and must distribute 100% of its taxable income to avoid federal income tax. The company distributed 94.7% of its 2019 taxable income to stockholders during 2019, and intends to distribute the remaining 5.3% during the 2020 calendar year. In addition, the tax characterization of each cash distribution made during 2019 will be treated as ordinary income to stockholders.
- 5 -
Conference Call
Two Harbors Investment Corp. will host a conference call on February 6, 2020 at 9:00 a.m. EST to discuss fourth quarter 2019 financial results and related information. To participate in the teleconference, please call toll-free (866) 548-4713, conference code 5688261, approximately 10 minutes prior to the above start time. You may also listen to the teleconference live via the Internet on the company’s website at www.twoharborsinvestment.com in the Investor Relations section under the Events and Presentations link. For those unable to attend, a telephone playback will be available beginning at 12:00 p.m. EST on February 6, 2020, through 12:00 a.m. EST on March 7, 2020. The playback can be accessed by calling (888) 203-1112 , conference code 5688261. The call will also be archived on the company’s website in the Investor Relations section under the Events and Presentations link.
Two Harbors Investment Corp.
Two Harbors Investment Corp., a Maryland corporation, is a real estate investment trust that invests in residential mortgage-backed securities, mortgage servicing rights and other financial assets. Two Harbors is headquartered in New York, New York, and is externally managed and advised by PRCM Advisers LLC, a wholly owned subsidiary of Pine River Capital Management L.P. Additional information is available at www.twoharborsinvestment.com.
Forward-Looking Statements
This presentation includes “forward-looking statements” within the meaning of the safe harbor provisions of the United States Private Securities Litigation Reform Act of 1995. Actual results may differ from expectations, estimates and projections and, consequently, readers should not rely on these forward-looking statements as predictions of future events. Words such as “expect,” “target,” “assume,” “estimate,” “project,” “budget,” “forecast,” “anticipate,” “intend,” “plan,” “may,” “will,” “could,” “should,” “believe,” “predicts,” “potential,” “continue,” and similar expressions are intended to identify such forward-looking statements. These forward-looking statements involve significant risks and uncertainties that could cause actual results to differ materially from expected results, including, among other things, those described in our Annual Report on Form 10-K for the year ended December 31, 2018, and any subsequent Quarterly Reports on Form 10-Q, under the caption “Risk Factors.” Factors that could cause actual results to differ include, but are not limited to: the state of credit markets and general economic conditions; changes in interest rates and the market value of our assets; changes in prepayment rates of mortgages underlying our target assets; the rates of default or decreased recovery on the mortgages underlying our target assets; the occurrence, extent and timing of credit losses within our portfolio; the concentration of credit risks we are exposed to; declines in home prices; our ability to establish, adjust and maintain appropriate hedges for the risks in our portfolio; the availability and cost of our target assets; the availability and cost of financing; changes in the competitive landscape within our industry; our ability to effectively execute and to realize the benefits of strategic transactions and initiatives we have pursued or may in the future pursue; our ability to manage various operational risks and costs associated with our business; interruptions in or impairments to our communications and information technology systems; our ability to acquire MSR and successfully operate our seller-servicer subsidiary and oversee our subservicers; the impact of any deficiencies in the servicing or foreclosure practices of third parties and related delays in the foreclosure process; our exposure to legal and regulatory claims; legislative and regulatory actions affecting our business; the impact of new or modified government mortgage refinance or principal reduction programs; our ability to maintain our REIT qualification; and limitations imposed on our business due to our REIT status and our exempt status under the Investment Company Act of 1940.
Readers are cautioned not to place undue reliance upon any forward-looking statements, which speak only as of the date made. Two Harbors does not undertake or accept any obligation to release publicly any updates or revisions to any forward-looking statement to reflect any change in its expectations or any change in events, conditions or circumstances on which any such statement is based. Additional information concerning these and other risk factors is contained in Two Harbors’ most recent filings with the Securities and Exchange Commission (SEC). All subsequent written and oral forward-looking statements concerning Two Harbors or matters attributable to Two Harbors or any person acting on its behalf are expressly qualified in their entirety by the cautionary statements above.
- 6 -
Non-GAAP Financial Measures
In addition to disclosing financial results calculated in accordance with United States generally accepted accounting principles (GAAP), this press release and the accompanying investor presentation present non-GAAP financial measures, such as Core Earnings, including dollar roll income and Core Earnings per basic common share, including dollar roll income, that exclude certain items. The non-GAAP financial measures presented by the company provide supplemental information to assist investors in analyzing the company’s results of operations and help facilitate comparisons to industry peers. However, because these measures are not calculated in accordance with GAAP, they should not be considered a substitute for, or superior to, the financial measures calculated in accordance with GAAP. The company’s GAAP financial results and the reconciliations from these results should be carefully evaluated. See the GAAP to non-GAAP reconciliation table on page 12 of this release.
Additional Information
Stockholders of Two Harbors and other interested persons may find additional information regarding the company at the SEC’s Internet site at www.sec.gov or by directing requests to: Two Harbors Investment Corp., Attn: Investor Relations, 575 Lexington Avenue, Suite 2930, New York, NY 10022, telephone (612) 629-2500.
Contact
Margaret Karr, Investor Relations, Two Harbors Investment Corp., (212) 364-3663 or
# # #
- 7 -
TWO HARBORS INVESTMENT CORP. | |||||||
CONDENSED CONSOLIDATED BALANCE SHEETS | |||||||
(dollars in thousands, except share data) | |||||||
December 31, 2019 | December 31, 2018 | ||||||
(unaudited) | |||||||
ASSETS | |||||||
Available-for-sale securities, at fair value | $ | 31,406,328 | $ | 25,552,604 | |||
Mortgage servicing rights, at fair value | 1,909,444 | 1,993,440 | |||||
Cash and cash equivalents | 558,136 | 409,758 | |||||
Restricted cash | 1,058,690 | 688,006 | |||||
Accrued interest receivable | 92,634 | 86,589 | |||||
Due from counterparties | 318,963 | 154,626 | |||||
Derivative assets, at fair value | 188,051 | 319,981 | |||||
Reverse repurchase agreements | 220,000 | 761,815 | |||||
Other assets | 169,376 | 165,660 | |||||
Total Assets | $ | 35,921,622 | $ | 30,132,479 | |||
LIABILITIES AND STOCKHOLDERS’ EQUITY | |||||||
Liabilities | |||||||
Repurchase agreements | $ | 29,147,463 | $ | 23,133,476 | |||
Federal Home Loan Bank advances | 210,000 | 865,024 | |||||
Revolving credit facilities | 300,000 | 310,000 | |||||
Term notes payable | 394,502 | — | |||||
Convertible senior notes | 284,954 | 283,856 | |||||
Derivative liabilities, at fair value | 6,740 | 820,590 | |||||
Due to counterparties | 259,447 | 130,210 | |||||
Dividends payable | 128,125 | 135,551 | |||||
Accrued interest payable | 149,626 | 160,005 | |||||
Other liabilities | 70,299 | 39,278 | |||||
Total Liabilities | 30,951,156 | 25,877,990 | |||||
Stockholders’ Equity | |||||||
Preferred stock, par value $0.01 per share; 50,000,000 shares authorized and 40,050,000 and 40,050,000 shares issued and outstanding, respectively ($1,001,250 and $1,001,250 liquidation preference, respectively) | 977,501 | 977,501 | |||||
Common stock, par value $0.01 per share; 450,000,000 shares authorized and 272,935,731 and 248,085,721 shares issued and outstanding, respectively | 2,729 | 2,481 | |||||
Additional paid-in capital | 5,154,764 | 4,809,616 | |||||
Accumulated other comprehensive income | 689,400 | 110,817 | |||||
Cumulative earnings | 2,655,891 | 2,332,371 | |||||
Cumulative distributions to stockholders | (4,509,819 | ) | (3,978,297 | ) | |||
Total Stockholders’ Equity | 4,970,466 | 4,254,489 | |||||
Total Liabilities and Stockholders’ Equity | $ | 35,921,622 | $ | 30,132,479 | |||
- 8 -
TWO HARBORS INVESTMENT CORP. | |||||||||||||||
CONDENSED CONSOLIDATED STATEMENTS OF COMPREHENSIVE INCOME (LOSS) | |||||||||||||||
(dollars in thousands) | |||||||||||||||
Certain prior period amounts have been reclassified to conform to the current period presentation | |||||||||||||||
Three Months Ended December 31, | Year Ended December 31, | ||||||||||||||
2019 | 2018 | 2019 | 2018 | ||||||||||||
(unaudited) | (unaudited) | ||||||||||||||
Interest income: | |||||||||||||||
Available-for-sale securities | $ | 230,567 | $ | 242,535 | $ | 962,283 | $ | 847,325 | |||||||
Other | 7,871 | 9,420 | 32,407 | 22,707 | |||||||||||
Total interest income | 238,438 | 251,955 | 994,690 | 870,032 | |||||||||||
Interest expense: | |||||||||||||||
Repurchase agreements | 152,919 | 146,702 | 654,280 | 469,437 | |||||||||||
Federal Home Loan Bank advances | 514 | 5,762 | 10,920 | 20,417 | |||||||||||
Revolving credit facilities | 4,038 | 5,044 | 19,354 | 10,820 | |||||||||||
Term notes payable | 5,002 | — | 10,708 | — | |||||||||||
Convertible senior notes | 4,811 | 4,793 | 19,067 | 18,997 | |||||||||||
Total interest expense | 167,284 | 162,301 | 714,329 | 519,671 | |||||||||||
Net interest income | 71,154 | 89,654 | 280,361 | 350,361 | |||||||||||
Other-than-temporary impairment losses | (3,308 | ) | (107 | ) | (14,312 | ) | (470 | ) | |||||||
Other income (loss): | |||||||||||||||
Gain (loss) on investment securities | 28,141 | (245,763 | ) | 280,118 | (341,312 | ) | |||||||||
Servicing income | 127,690 | 104,623 | 501,612 | 343,096 | |||||||||||
Loss on servicing asset | (21,739 | ) | (171,284 | ) | (697,659 | ) | (69,033 | ) | |||||||
(Loss) gain on interest rate swap, cap and swaption agreements | (6,875 | ) | (239,492 | ) | (108,289 | ) | 16,043 | ||||||||
(Loss) gain on other derivative instruments | (10,800 | ) | (39,122 | ) | 259,998 | (54,857 | ) | ||||||||
Other income | 60 | 342 | 337 | 3,037 | |||||||||||
Total other income (loss) | 116,477 | (590,696 | ) | 236,117 | (103,026 | ) | |||||||||
Expenses: | |||||||||||||||
Management fees | 17,546 | 12,152 | 60,102 | 30,272 | |||||||||||
Servicing expenses | 20,253 | 18,610 | 74,607 | 61,136 | |||||||||||
Other operating expenses | 14,142 | 15,943 | 57,055 | 62,983 | |||||||||||
Acquisition transaction costs | — | — | — | 86,703 | |||||||||||
Restructuring charges | — | — | — | 8,238 | |||||||||||
Total expenses | 51,941 | 46,705 | 191,764 | 249,332 | |||||||||||
Income (loss) before income taxes | 132,382 | (547,854 | ) | 310,402 | (2,467 | ) | |||||||||
(Benefit from) provision for income taxes | (2,372 | ) | 6,681 | (13,560 | ) | 41,823 | |||||||||
Net income (loss) | 134,754 | (554,535 | ) | 323,962 | (44,290 | ) | |||||||||
Dividends on preferred stock | 18,950 | 18,950 | 75,801 | 65,395 | |||||||||||
Net income (loss) attributable to common stockholders | $ | 115,804 | $ | (573,485 | ) | $ | 248,161 | $ | (109,685 | ) | |||||
Basic earnings (loss) per weighted average common share | $ | 0.42 | $ | (2.31 | ) | $ | 0.93 | $ | (0.53 | ) | |||||
Diluted earnings (loss) per weighted average common share | $ | 0.41 | $ | (2.31 | ) | $ | 0.93 | $ | (0.53 | ) | |||||
Dividends declared per common share | $ | 0.40 | $ | 0.47 | $ | 1.67 | $ | 1.88 | |||||||
Weighted average number of shares of common stock: | |||||||||||||||
Basic | 272,906,815 | 248,081,168 | 267,826,739 | 206,020,502 | |||||||||||
Diluted | 291,070,864 | 248,081,168 | 267,826,739 | 206,020,502 | |||||||||||
- 9 -
TWO HARBORS INVESTMENT CORP. | |||||||||||||||
CONDENSED CONSOLIDATED STATEMENTS OF COMPREHENSIVE INCOME (LOSS), CONTINUED | |||||||||||||||
(dollars in thousands) | |||||||||||||||
Certain prior period amounts have been reclassified to conform to the current period presentation | |||||||||||||||
Three Months Ended December 31, | Year Ended December 31, | ||||||||||||||
2019 | 2018 | 2019 | 2018 | ||||||||||||
(unaudited) | (unaudited) | ||||||||||||||
Comprehensive income (loss): | |||||||||||||||
Net income (loss) | $ | 134,754 | $ | (554,535 | ) | $ | 323,962 | $ | (44,290 | ) | |||||
Other comprehensive (loss) income, net of tax: | |||||||||||||||
Unrealized (loss) gain on available-for-sale securities | (58,954 | ) | 265,546 | 578,583 | (233,914 | ) | |||||||||
Other comprehensive (loss) income | (58,954 | ) | 265,546 | 578,583 | (233,914 | ) | |||||||||
Comprehensive income (loss) | 75,800 | (288,989 | ) | 902,545 | (278,204 | ) | |||||||||
Dividends on preferred stock | 18,950 | 18,950 | 75,801 | 65,395 | |||||||||||
Comprehensive income (loss) attributable to common stockholders | $ | 56,850 | $ | (307,939 | ) | $ | 826,744 | $ | (343,599 | ) | |||||
- 10 -
TWO HARBORS INVESTMENT CORP. | |||||||
RECONCILIATION OF GAAP TO NON-GAAP FINANCIAL INFORMATION | |||||||
(dollars in thousands, except share data) | |||||||
Certain prior period amounts have been reclassified to conform to the current period presentation | |||||||
Three Months Ended December 31, | Three Months Ended September 30, | ||||||
2019 | 2019 | ||||||
(unaudited) | (unaudited) | ||||||
Reconciliation of Comprehensive income to Core Earnings: | |||||||
Comprehensive income attributable to common stockholders | $ | 56,850 | $ | 257,585 | |||
Adjustment for other comprehensive loss attributable to common stockholders: | |||||||
Unrealized loss on available-for-sale securities attributable to common stockholders | 58,954 | 29,164 | |||||
Net income attributable to common stockholders | $ | 115,804 | $ | 286,749 | |||
Adjustments for non-Core Earnings: | |||||||
Other-than-temporary impairments and loss recovery adjustments | 2,198 | 7,275 | |||||
Realized gains on securities | (27,615 | ) | (250,267 | ) | |||
Unrealized (gain) loss on securities | (526 | ) | 1,439 | ||||
Realized and unrealized (gain) loss on mortgage servicing rights | (51,387 | ) | 161,214 | ||||
Realized loss (gain) on termination or expiration of swaps, caps and swaptions | 1,495 | (75,409 | ) | ||||
Unrealized losses on interest rate swaps, caps and swaptions | 10,148 | 23,940 | |||||
Loss (gain) on other derivative instruments | 19,833 | (85,916 | ) | ||||
Other loss (income) | 73 | (114 | ) | ||||
Change in servicing reserves | 72 | (300 | ) | ||||
Non-cash equity compensation expense | 2,423 | 1,980 | |||||
Net benefit from income taxes on non-Core Earnings | (4,847 | ) | (5,612 | ) | |||
Core Earnings attributable to common stockholders, including dollar roll income(1) | $ | 67,671 | $ | 64,979 | |||
Weighted average basic common shares | 272,906,815 | 272,897,575 | |||||
Core Earnings, including dollar roll income, attributable to common stockholders per weighted average basic common share | $ | 0.25 | $ | 0.24 | |||
(1) | Core Earnings, including dollar roll income, is a non-U.S. GAAP measure that we define as comprehensive income (loss) attributable to common stockholders, excluding “realized and unrealized gains and losses” (impairment losses, realized and unrealized gains and losses on the aggregate portfolio, reserve expense for representation and warranty obligations on MSR, non-cash compensation expense related to restricted common stock and restructuring charges) and transaction costs associated with the acquisition of CYS. As defined, Core Earnings includes interest income or expense and premium income or loss on derivative instruments and servicing income, net of estimated amortization on MSR. “Dollar roll income” is the economic equivalent to holding and financing Agency RMBS using short-term repurchase agreements. Core Earnings, including dollar roll income, provides supplemental information to assist investors in analyzing the company’s results of operations and helps facilitate comparisons to industry peers. |
- 11 -
TWO HARBORS INVESTMENT CORP. | |||||||||||||||||||
SUMMARY OF QUARTERLY CORE EARNINGS | |||||||||||||||||||
(dollars in millions, except per share data) | |||||||||||||||||||
Certain prior period amounts have been reclassified to conform to the current period presentation | |||||||||||||||||||
Three Months Ended | |||||||||||||||||||
December 31, 2019 | September 30, 2019 | June 30, 2019 | March 31, 2019 | December 31, 2018 | |||||||||||||||
(unaudited) | |||||||||||||||||||
Net Interest Income: | |||||||||||||||||||
Interest income | $ | 237.3 | $ | 251.1 | $ | 269.1 | $ | 245.5 | $ | 252.0 | |||||||||
Interest expense | 167.3 | 191.1 | 192.4 | 163.5 | 162.3 | ||||||||||||||
Net interest income | 70.0 | 60.0 | 76.7 | 82.0 | 89.7 | ||||||||||||||
Other income: | |||||||||||||||||||
Servicing income, net of amortization(1) | 54.6 | 52.7 | 52.7 | 52.5 | 46.9 | ||||||||||||||
Interest spread on interest rate swaps and caps | 4.8 | 19.1 | 22.9 | 23.7 | 15.3 | ||||||||||||||
Gain on other derivative instruments | 9.0 | — | 16.7 | 28.7 | 29.8 | ||||||||||||||
Other income | 0.1 | 0.4 | 0.5 | 0.5 | 0.6 | ||||||||||||||
Total other income | 68.5 | 72.2 | 92.8 | 105.4 | 92.6 | ||||||||||||||
Expenses | 49.4 | 46.2 | 42.9 | 45.2 | 42.3 | ||||||||||||||
Core Earnings, including dollar roll income before income taxes | 89.1 | 86.0 | 126.6 | 142.2 | 140.0 | ||||||||||||||
Income tax expense | 2.5 | 2.0 | 1.6 | 0.6 | 0.3 | ||||||||||||||
Core Earnings, including dollar roll income | 86.6 | 84.0 | 125.0 | 141.6 | 139.7 | ||||||||||||||
Dividends on preferred stock | 18.9 | 19.0 | 19.0 | 18.9 | 19.0 | ||||||||||||||
Core Earnings attributable to common stockholders, including dollar roll income(2) | $ | 67.7 | $ | 65.0 | $ | 106.0 | $ | 122.7 | $ | 120.7 | |||||||||
Weighted average basic Core EPS, including dollar roll income | $ | 0.25 | $ | 0.24 | $ | 0.39 | $ | 0.49 | $ | 0.49 | |||||||||
Core earnings return on average common equity, including dollar roll income | 6.8 | % | 6.5 | % | 11.1 | % | 14.3 | % | 13.8 | % | |||||||||
________________
(1) | Amortization refers to the portion of change in fair value of MSR primarily attributed to the realization of expected cash flows (runoff) of the portfolio. This amortization has been deducted from Core Earnings, including dollar roll income. Amortization of MSR is deemed a non-GAAP measure due to the company’s decision to account for MSR at fair value. As discussed on page 11, the company has refined the MSR amortization method utilized in the calculation of Core Earnings beginning with the period ended June 30, 2019. MSR amortization amounts for periods ending prior to June 30, 2019 have not be adjusted. |
(2) | Please see page 11 for a definition of Core Earnings, including dollar roll income, and a reconciliation of GAAP to non-GAAP financial information. |
- 12 -

Fourth Quarter 2019 Earnings Call FEBRUARY 6, 2020
Safe Harbor Statement FORWARD-LOOKING STATEMENTS This presentation includes “forward-looking statements” within the meaning of the safe harbor provisions of the United States Private Securities Litigation Reform Act of 1995. Actual results may differ from expectations, estimates and projections and, consequently, readers should not rely on these forward-looking statements as predictions of future events. Words such as “expect,” “target,” “assume,” “estimate,” “project,” “budget,” “forecast,” “anticipate,” “intend,” “plan,” “may,” “will,” “could,” “should,” “believe,” “predicts,” “potential,” “continue,” and similar expressions are intended to identify such forward-looking statements. These forward-looking statements involve significant risks and uncertainties that could cause actual results to differ materially from expected results, including, among other things, those described in our Annual Report on Form 10-K for the year ended December 31, 2018, and any subsequent Quarterly Reports on Form 10-Q, under the caption “Risk Factors.” Factors that could cause actual results to differ include, but are not limited to: the state of credit markets and general economic conditions; changes in interest rates and the market value of our assets; changes in prepayment rates of mortgages underlying our target assets; the rates of default or decreased recovery on the mortgages underlying our target assets; the occurrence, extent and timing of credit losses within our portfolio; the concentration of credit risks we are exposed to; declines in home prices; our ability to establish, adjust and maintain appropriate hedges for the risks in our portfolio; the availability and cost of our target assets; the availability and cost of financing; changes in the competitive landscape within our industry; our ability to effectively execute and to realize the benefits of strategic transactions and initiatives we have pursued or may in the future pursue; our ability to manage various operational risks and costs associated with our business; interruptions in or impairments to our communications and information technology systems; our ability to acquire mortgage servicing rights (MSR) and successfully operate our seller-servicer subsidiary and oversee our subservicers; the impact of any deficiencies in the servicing or foreclosure practices of third parties and related delays in the foreclosure process; our exposure to legal and regulatory claims; legislative and regulatory actions affecting our business; the impact of new or modified government mortgage refinance or principal reduction programs; our ability to maintain our REIT qualification; and limitations imposed on our business due to our REIT status and our exempt status under the Investment Company Act of 1940. Readers are cautioned not to place undue reliance upon any forward-looking statements, which speak only as of the date made. Two Harbors does not undertake or accept any obligation to release publicly any updates or revisions to any forward-looking statement to reflect any change in its expectations or any change in events, conditions or circumstances on which any such statement is based. Additional information concerning these and other risk factors is contained in Two Harbors’ most recent filings with the Securities and Exchange Commission (SEC). All subsequent written and oral forward-looking statements concerning Two Harbors or matters attributable to Two Harbors or any person acting on its behalf are expressly qualified in their entirety by the cautionary statements above. This presentation may include industry and market data obtained through research, surveys, and studies conducted by third parties and industry publications. We have not independently verified any such market and industry data from third-party sources. This presentation is provided for discussion purposes only and may not be relied upon as legal or investment advice, nor is it intended to be inclusive of all the risks and uncertainties that should be considered. This presentation does not constitute an offer to purchase or sell any securities, nor shall it be construed to be indicative of the terms of an offer that the parties or their respective affiliates would accept. Readers are advised that the financial information in this presentation is based on company data available at the time of this presentation and, in certain circumstances, may not have been audited by the company’s independent auditors. 2
Quarterly and Annual Summary Generated 23.6% Total Annual Return on Book Value(1) Quarterly Summary • Reported book value of $14.54 per common share, representing a 1.5% total quarterly return on book value.(1) • Generated Comprehensive Income of $56.8 million, or $0.21 per weighted average basic common share, representing an annualized return on average common equity of 5.7%. • Added $22.3 billion in unpaid principal balance (UPB) of MSR through both bulk acquisitions and monthly flow-sale arrangements, bringing total holdings to $175.9 billion UPB. • Reported Core Earnings, including dollar roll income, of $67.7 million, or $0.25 per weighted average basic common share.(2) Annual Summary • Grew book value to $14.54 per common share from $13.11 per common share at December 31, 2018, representing a 23.6% total annual return on book value.(1) • Generated Comprehensive Income of $826.7 million, or $3.09 per weighted average basic common share, representing an annualized return on average common equity of 21.7%. • Generated total shareholder return of 28.7%.(3) • Enhanced financing for MSR through $400 million securitization of 5-year term notes. (1) Return on book value is defined as the increase (decrease) in book value per common share from the beginning to the end of the given period, plus dividends declared in the period, divided by the book value as of the beginning of the period. (2) Core Earnings, including dollar roll income, is a non-GAAP measure. Please see Appendix slide 21 of this presentation for a definition of Core Earnings, including dollar roll income, and a reconciliation of GAAP to non-GAAP financial information. A description of the updated MSR amortization method utilized by the company to calculate Core Earnings, including dollar roll income, is also provided. 3 (3) Two Harbors’ total stockholder return is calculated for the period December 31, 2018 through December 31, 2019. Total stockholder return is defined as stock price appreciation including dividends. Source: Bloomberg.
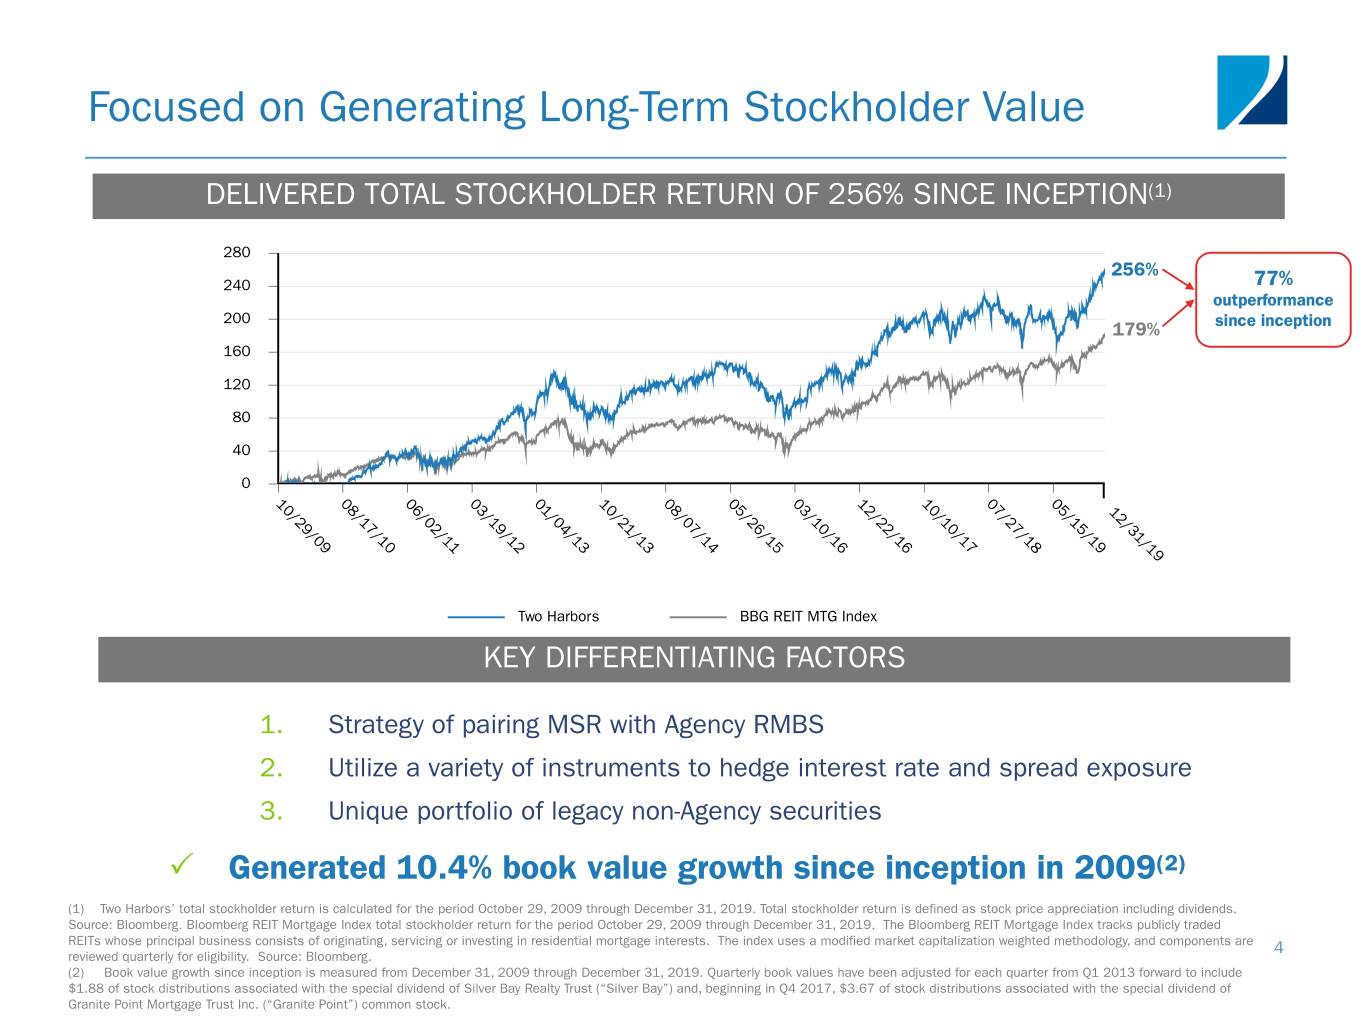
Focused on Generating Long-Term Stockholder Value DELIVERED TOTAL STOCKHOLDER RETURN OF 256% SINCE INCEPTION(1) 280 256% 240 77% outperformance 200 179% since inception 160 120 80 40 0 1 0 0 0 0 1 0 0 0 1 1 0 0 0 8 6 3 1 0 8 5 3 2 0 7 5 / / / / / / / / / / / / / 12/31/19 2 1 0 1 0 2 0 2 1 2 1 2 1 9 7 2 9 4 1 7 6 0 2 0 7 5 / / / / / / / / / / / / / 0 1 1 1 1 1 1 1 1 1 1 1 1 9 0 1 2 3 3 4 5 6 6 7 8 9 Two Harbors BBG REIT MTG Index KEY DIFFERENTIATING FACTORS 1. Strategy of pairing MSR with Agency RMBS 2. Utilize a variety of instruments to hedge interest rate and spread exposure 3. Unique portfolio of legacy non-Agency securities P Generated 10.4% book value growth since inception in 2009(2) (1) Two Harbors’ total stockholder return is calculated for the period October 29, 2009 through December 31, 2019. Total stockholder return is defined as stock price appreciation including dividends. Source: Bloomberg. Bloomberg REIT Mortgage Index total stockholder return for the period October 29, 2009 through December 31, 2019. The Bloomberg REIT Mortgage Index tracks publicly traded REITs whose principal business consists of originating, servicing or investing in residential mortgage interests. The index uses a modified market capitalization weighted methodology, and components are 4 reviewed quarterly for eligibility. Source: Bloomberg. (2) Book value growth since inception is measured from December 31, 2009 through December 31, 2019. Quarterly book values have been adjusted for each quarter from Q1 2013 forward to include $1.88 of stock distributions associated with the special dividend of Silver Bay Realty Trust (“Silver Bay”) and, beginning in Q4 2017, $3.67 of stock distributions associated with the special dividend of Granite Point Mortgage Trust Inc. (“Granite Point”) common stock.

Book Value Q4-2019 FY-2019 Q4-2019 Book Value FY-2019 Book Value (Dollars in millions, except per share data) Book Value per share Book Value per share Beginning common stockholders’ equity $ 4,018.3 $ 14.72 $ 3,253.2 $ 13.11 GAAP Net Income: Core Earnings, including dollar roll income, net of tax(1) 86.6 437.2 Comprehensive Income (GAAP) Dividend declaration - preferred (18.9) (75.8) Generated Core Earnings attributable to common stockholders, including dollar roll income, Q4-2019 net of tax(1) 67.7 361.4 Comprehensive Income of $56.8 Realized and unrealized gains and losses, net of tax 48.1 (113.3) million, or $0.21 per basic common Other comprehensive (loss) income, net of tax (59.0) 578.6 share. Dividend declaration - common (109.1) (455.7) Generated 2019 Comprehensive Other 2.6 8.7 Income of $826.7 million, or $3.09 Issuance of common stock, net of offering costs 0.6 336.3 per basic common share. Ending common stockholders’ equity $ 3,969.2 $ 14.54 $ 3,969.2 $ 14.54 Total preferred stock liquidation preference 1,001.3 1,001.3 Ending total equity $ 4,970.5 $ 4,970.5 (1) Core Earnings, including dollar roll income, is a non-GAAP measure. Please see Appendix slide 21 for a definition of Core Earnings, including dollar roll income, and a 5 reconciliation of GAAP to non-GAAP financial information.
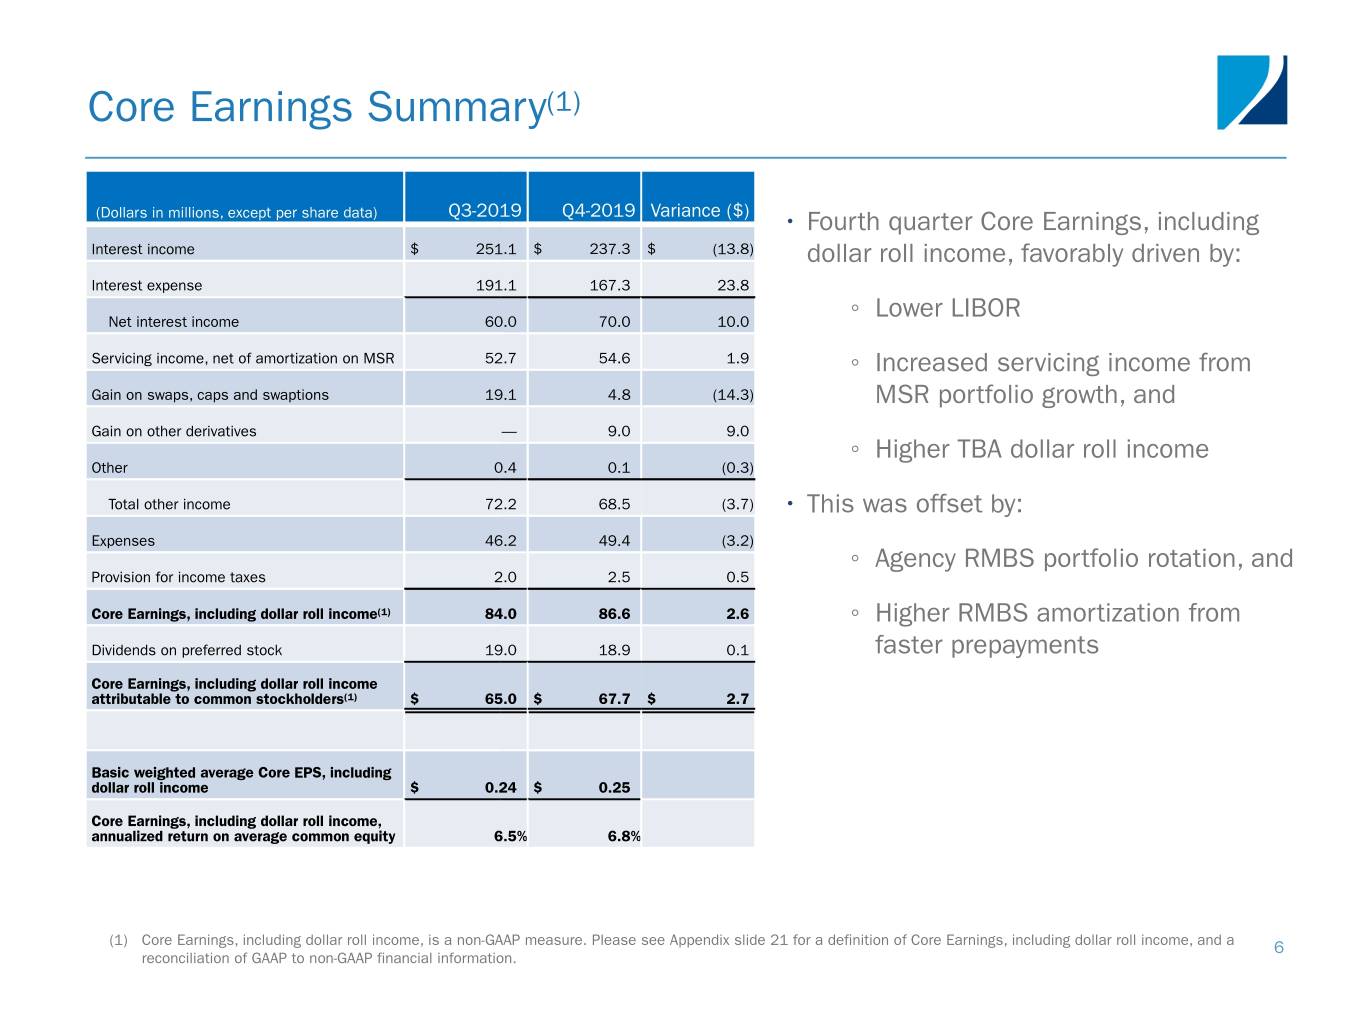
Core Earnings Summary(1) (Dollars in millions, except per share data) Q3-2019 Q4-2019 Variance ($) • Fourth quarter Core Earnings, including Interest income $ 251.1 $ 237.3 $ (13.8) dollar roll income, favorably driven by: Interest expense 191.1 167.3 23.8 Lower LIBOR Net interest income 60.0 70.0 10.0 ◦ Servicing income, net of amortization on MSR 52.7 54.6 1.9 ◦ Increased servicing income from Gain on swaps, caps and swaptions 19.1 4.8 (14.3) MSR portfolio growth, and Gain on other derivatives — 9.0 9.0 ◦ Higher TBA dollar roll income Other 0.4 0.1 (0.3) Total other income 72.2 68.5 (3.7) • This was offset by: Expenses 46.2 49.4 (3.2) ◦ Agency RMBS portfolio rotation, and Provision for income taxes 2.0 2.5 0.5 Core Earnings, including dollar roll income(1) 84.0 86.6 2.6 ◦ Higher RMBS amortization from Dividends on preferred stock 19.0 18.9 0.1 faster prepayments Core Earnings, including dollar roll income attributable to common stockholders(1) $ 65.0 $ 67.7 $ 2.7 Basic weighted average Core EPS, including dollar roll income $ 0.24 $ 0.25 Core Earnings, including dollar roll income, annualized return on average common equity 6.5% 6.8% (1) Core Earnings, including dollar roll income, is a non-GAAP measure. Please see Appendix slide 21 for a definition of Core Earnings, including dollar roll income, and a 6 reconciliation of GAAP to non-GAAP financial information.
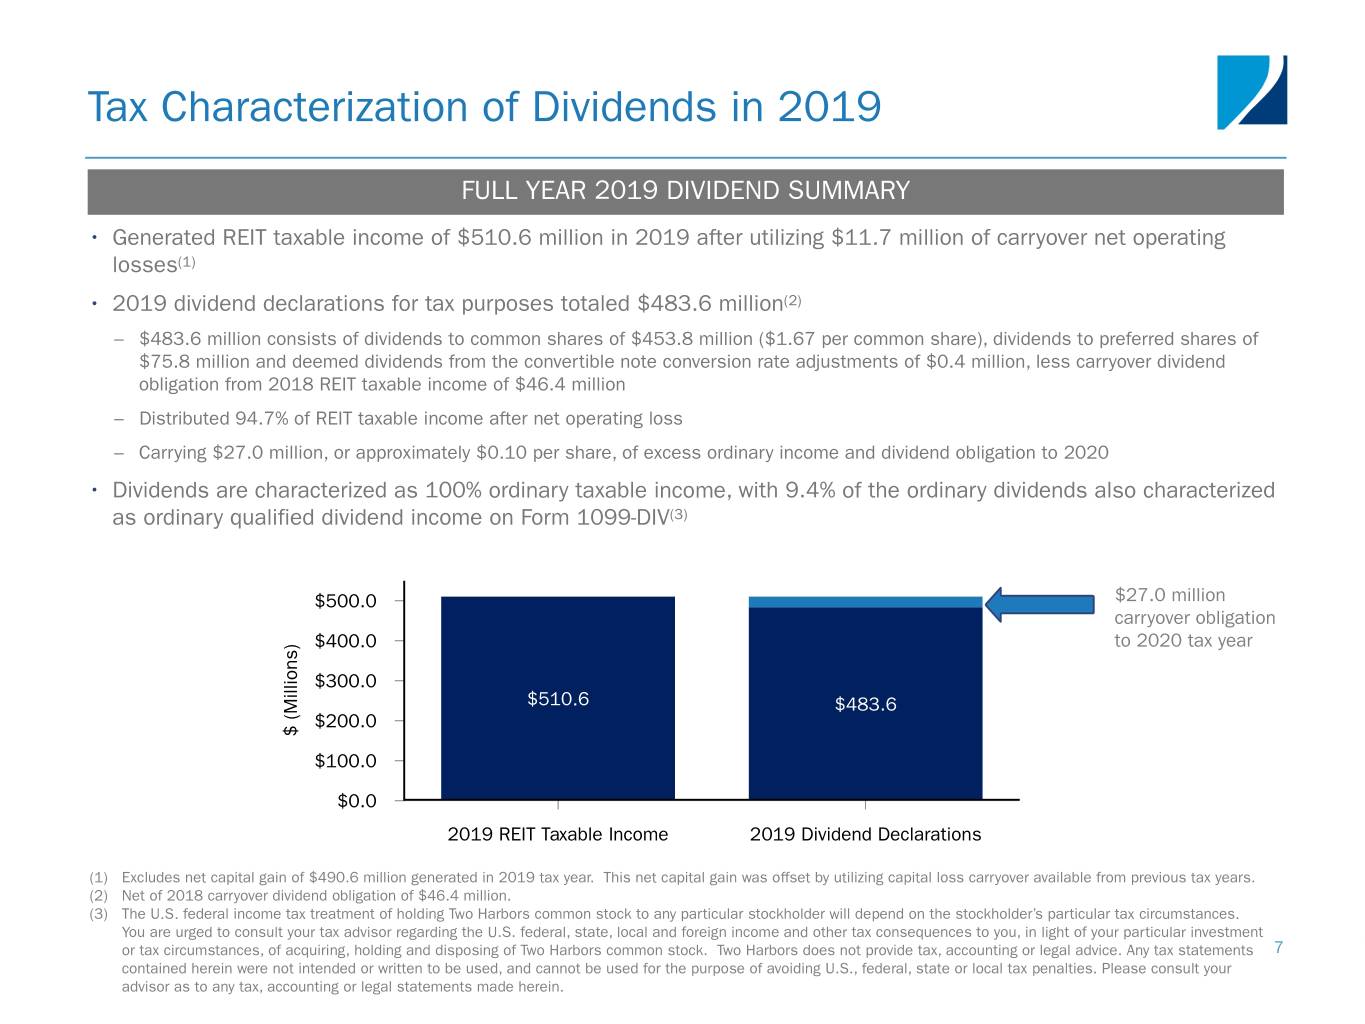
Tax Characterization of Dividends in 2019 FULL YEAR 2019 DIVIDEND SUMMARY • Generated REIT taxable income of $510.6 million in 2019 after utilizing $11.7 million of carryover net operating losses(1) • 2019 dividend declarations for tax purposes totaled $483.6 million(2) – $483.6 million consists of dividends to common shares of $453.8 million ($1.67 per common share), dividends to preferred shares of $75.8 million and deemed dividends from the convertible note conversion rate adjustments of $0.4 million, less carryover dividend obligation from 2018 REIT taxable income of $46.4 million – Distributed 94.7% of REIT taxable income after net operating loss – Carrying $27.0 million, or approximately $0.10 per share, of excess ordinary income and dividend obligation to 2020 • Dividends are characterized as 100% ordinary taxable income, with 9.4% of the ordinary dividends also characterized as ordinary qualified dividend income on Form 1099-DIV(3) $500.0 $27.0 million carryover obligation ) $400.0 to 2020 tax year s n o i l $300.0 l i $510.6 M $483.6 ( $200.0 $ $100.0 $0.0 2019 REIT Taxable Income 2019 Dividend Declarations (1) Excludes net capital gain of $490.6 million generated in 2019 tax year. This net capital gain was offset by utilizing capital loss carryover available from previous tax years. (2) Net of 2018 carryover dividend obligation of $46.4 million. (3) The U.S. federal income tax treatment of holding Two Harbors common stock to any particular stockholder will depend on the stockholder’s particular tax circumstances. You are urged to consult your tax advisor regarding the U.S. federal, state, local and foreign income and other tax consequences to you, in light of your particular investment or tax circumstances, of acquiring, holding and disposing of Two Harbors common stock. Two Harbors does not provide tax, accounting or legal advice. Any tax statements 7 contained herein were not intended or written to be used, and cannot be used for the purpose of avoiding U.S., federal, state or local tax penalties. Please consult your advisor as to any tax, accounting or legal statements made herein.
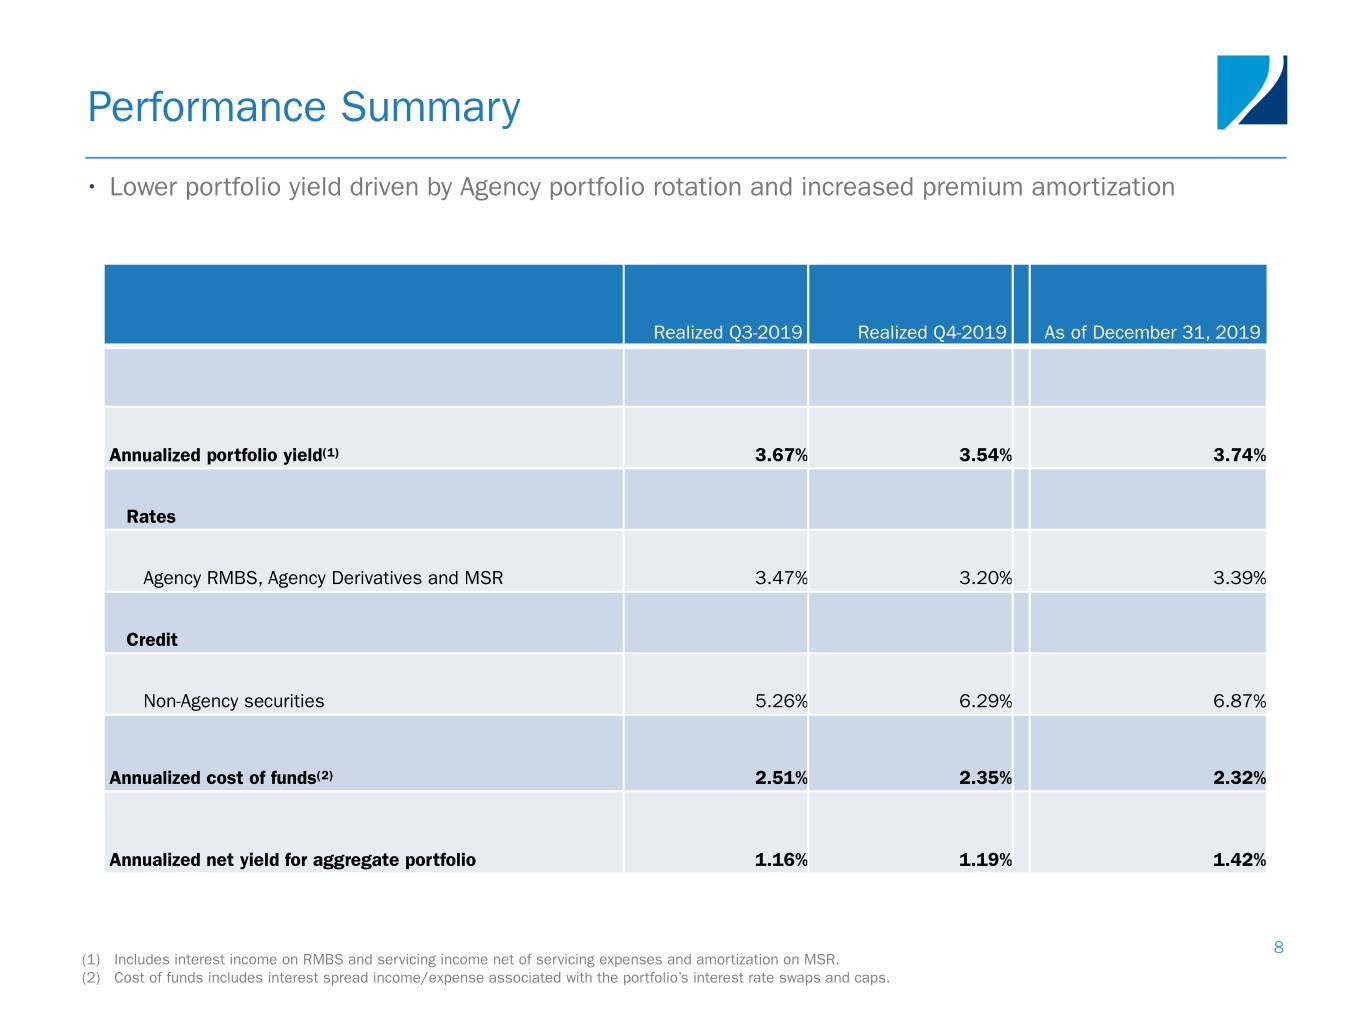
Performance Summary • Lower portfolio yield driven by Agency portfolio rotation and increased premium amortization Realized Q3-2019 Realized Q4-2019 As of December 31, 2019 Annualized portfolio yield(1) 3.67% 3.54% 3.74% Rates Agency RMBS, Agency Derivatives and MSR 3.47% 3.20% 3.39% Credit Non-Agency securities 5.26% 6.29% 6.87% Annualized cost of funds(2) 2.51% 2.35% 2.32% Annualized net yield for aggregate portfolio 1.16% 1.19% 1.42% 8 (1) Includes interest income on RMBS and servicing income net of servicing expenses and amortization on MSR. (2) Cost of funds includes interest spread income/expense associated with the portfolio’s interest rate swaps and caps.
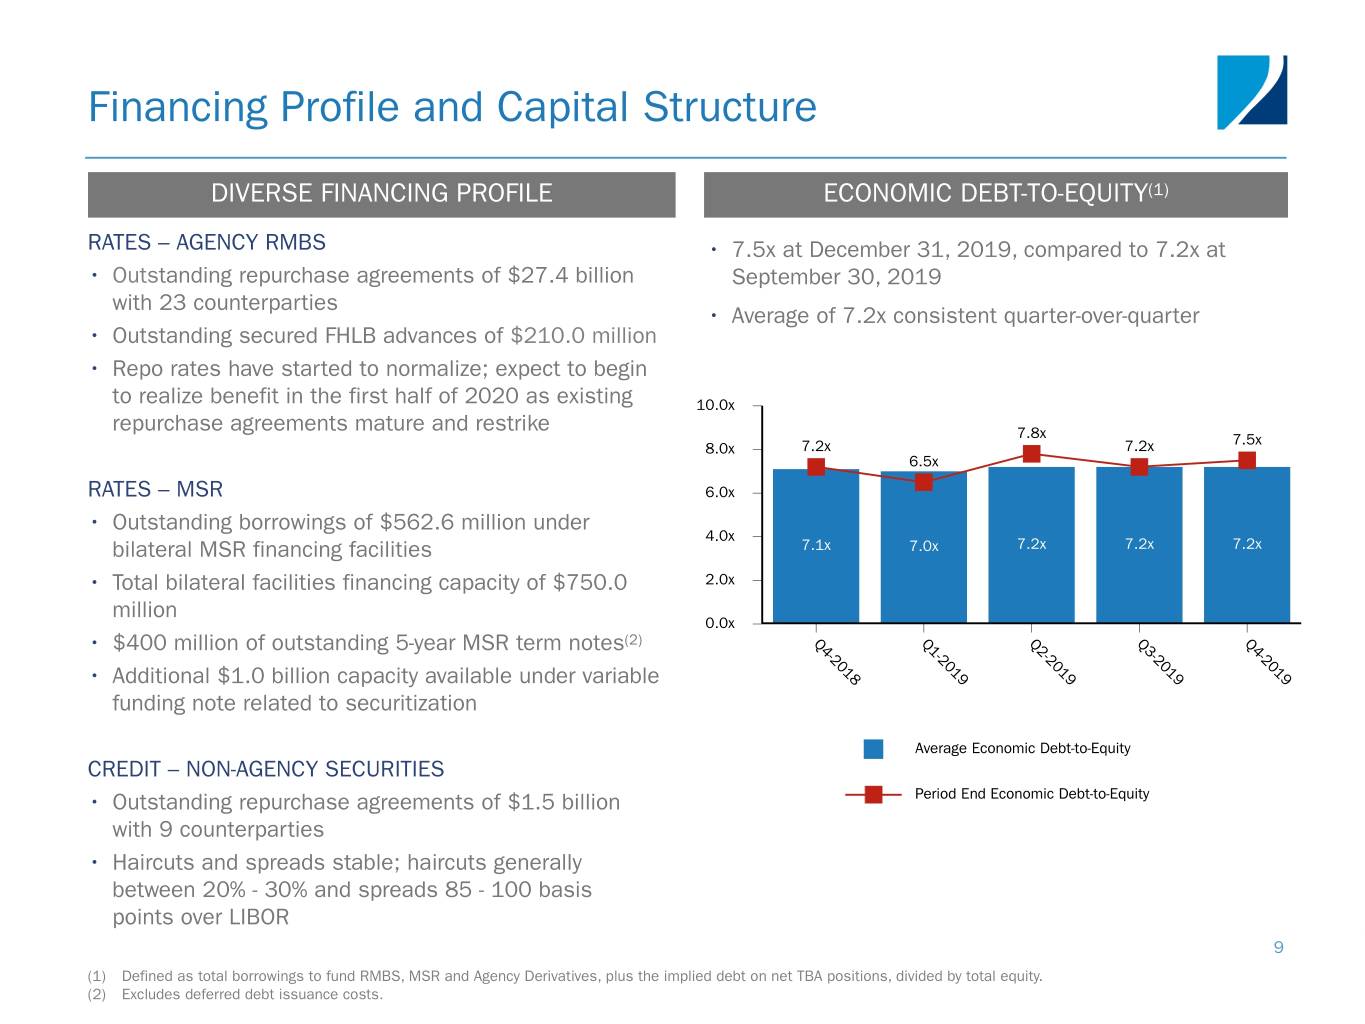
Financing Profile and Capital Structure DIVERSE FINANCING PROFILE ECONOMIC DEBT-TO-EQUITY(1) RATES – AGENCY RMBS • 7.5x at December 31, 2019, compared to 7.2x at • Outstanding repurchase agreements of $27.4 billion September 30, 2019 with 23 counterparties • Average of 7.2x consistent quarter-over-quarter • Outstanding secured FHLB advances of $210.0 million • Repo rates have started to normalize; expect to begin to realize benefit in the first half of 2020 as existing 10.0x repurchase agreements mature and restrike 7.8x 7.5x 8.0x 7.2x 7.2x 6.5x RATES – MSR 6.0x • Outstanding borrowings of $562.6 million under 4.0x bilateral MSR financing facilities 7.1x 7.0x 7.2x 7.2x 7.2x • Total bilateral facilities financing capacity of $750.0 2.0x million 0.0x (2) Q Q Q Q Q • $400 million of outstanding 5-year MSR term notes 4 1 2 3 4 -2 -2 -2 -2 -2 0 0 0 0 0 1 1 1 1 1 • Additional $1.0 billion capacity available under variable 8 9 9 9 9 funding note related to securitization Average Economic Debt-to-Equity CREDIT – NON-AGENCY SECURITIES • Outstanding repurchase agreements of $1.5 billion Period End Economic Debt-to-Equity with 9 counterparties • Haircuts and spreads stable; haircuts generally between 20% - 30% and spreads 85 - 100 basis points over LIBOR 9 (1) Defined as total borrowings to fund RMBS, MSR and Agency Derivatives, plus the implied debt on net TBA positions, divided by total equity. (2) Excludes deferred debt issuance costs.
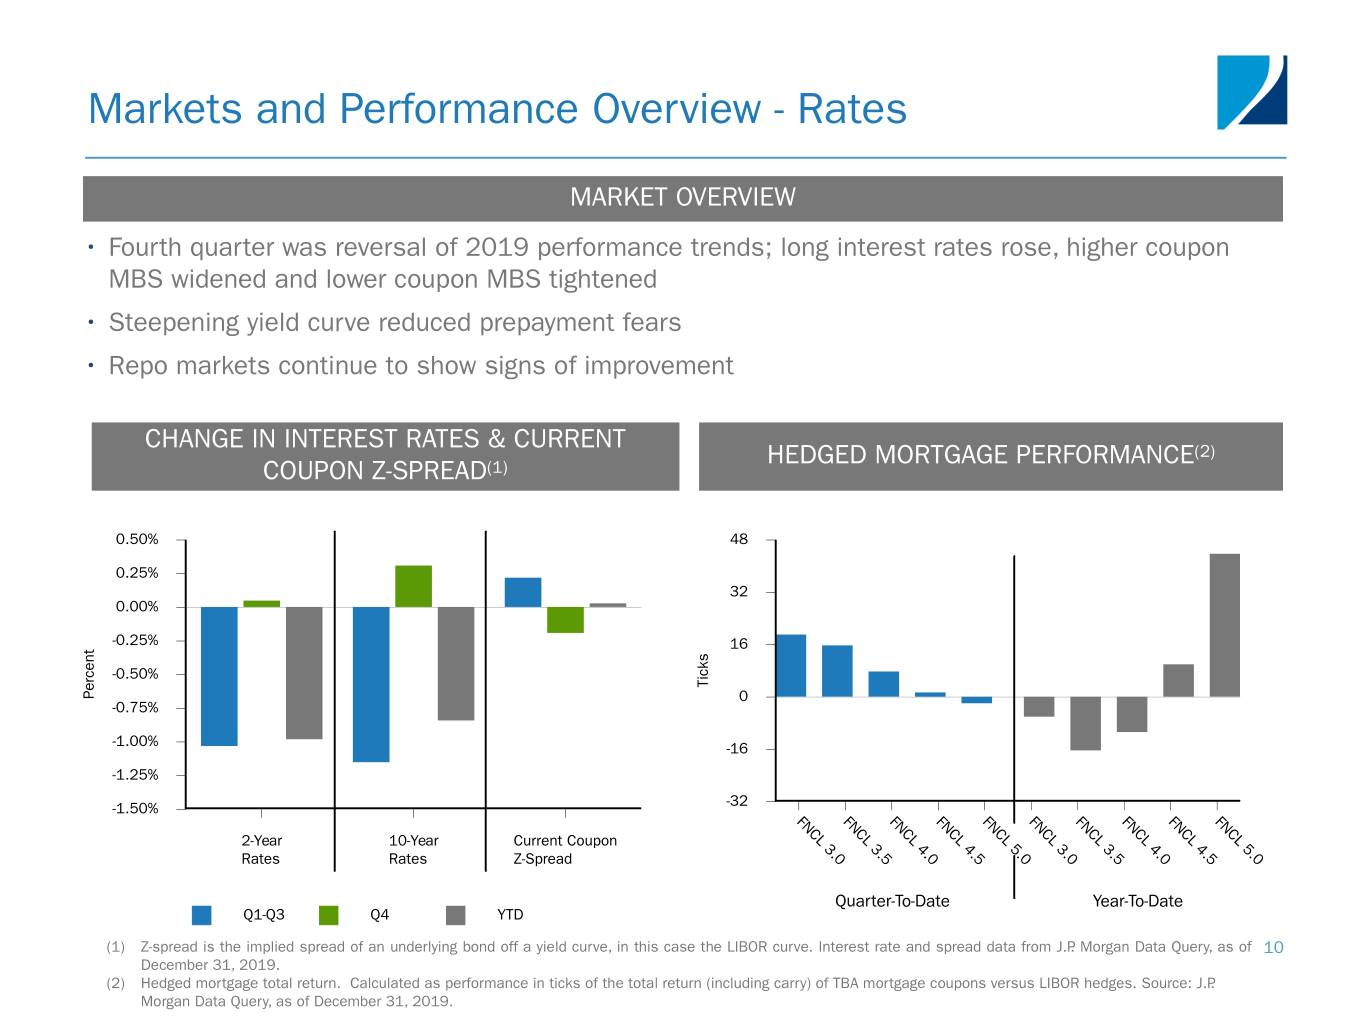
Markets and Performance Overview - Rates MARKET OVERVIEW • Fourth quarter was reversal of 2019 performance trends; long interest rates rose, higher coupon MBS widened and lower coupon MBS tightened • Steepening yield curve reduced prepayment fears • Repo markets continue to show signs of improvement CHANGE IN INTEREST RATES & CURRENT HEDGED MORTGAGE PERFORMANCE(2) COUPON Z-SPREAD(1) 0.50% 48 0.25% 32 0.00% -0.25% 16 t s n k e c c -0.50% i r T e P 0 -0.75% -1.00% -16 -1.25% -1.50% -32 FN FN FN FN FN FN FN FN FN FN C C C C C C C C C C L L L L L L L L L L 2-Year 10-Year Current Coupon 3 3 4 4 5 3 3 4 4 5 Rates Rates Z-Spread .0 .5 .0 .5 .0 .0 .5 .0 .5 .0 Quarter-To-Date Year-To-Date Q1-Q3 Q4 YTD (1) Z-spread is the implied spread of an underlying bond off a yield curve, in this case the LIBOR curve. Interest rate and spread data from J.P. Morgan Data Query, as of 10 December 31, 2019. (2) Hedged mortgage total return. Calculated as performance in ticks of the total return (including carry) of TBA mortgage coupons versus LIBOR hedges. Source: J.P. Morgan Data Query, as of December 31, 2019.
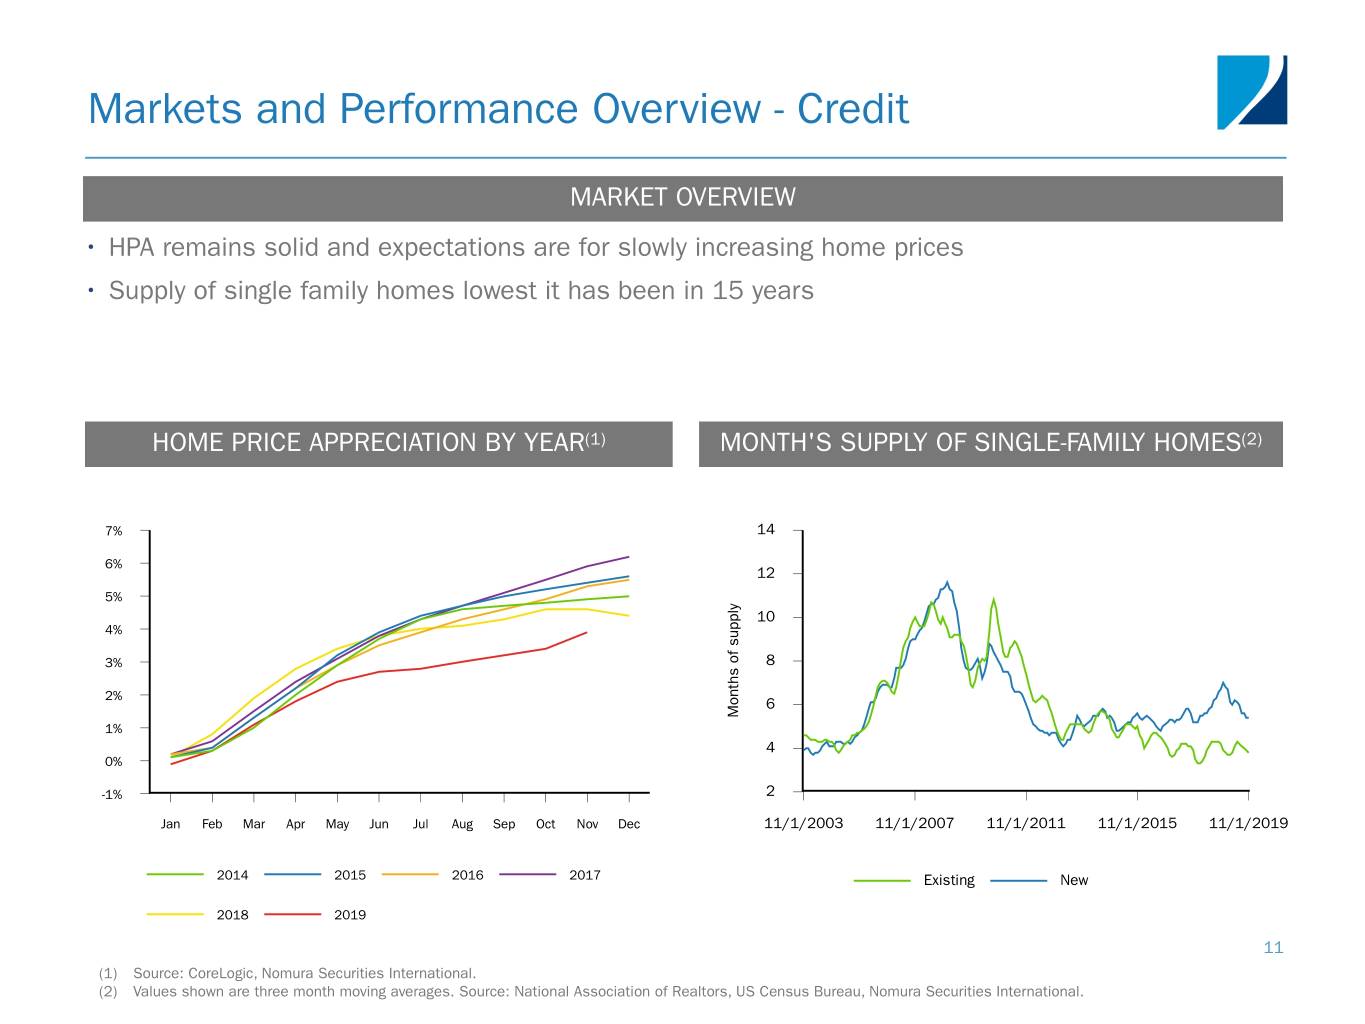
Markets and Performance Overview - Credit MARKET OVERVIEW • HPA remains solid and expectations are for slowly increasing home prices • Supply of single family homes lowest it has been in 15 years HOME PRICE APPRECIATION BY YEAR(1) MONTH'S SUPPLY OF SINGLE-FAMILY HOMES(2) 7% 14 6% 12 5% y l p 10 4% p u s f 3% o 8 s h t 2% n o 6 M 1% 4 0% -1% 2 Jan Feb Mar Apr May Jun Jul Aug Sep Oct Nov Dec 11/1/2003 11/1/2007 11/1/2011 11/1/2015 11/1/2019 2014 2015 2016 2017 Existing New 2018 2019 11 (1) Source: CoreLogic, Nomura Securities International. (2) Values shown are three month moving averages. Source: National Association of Realtors, US Census Bureau, Nomura Securities International.
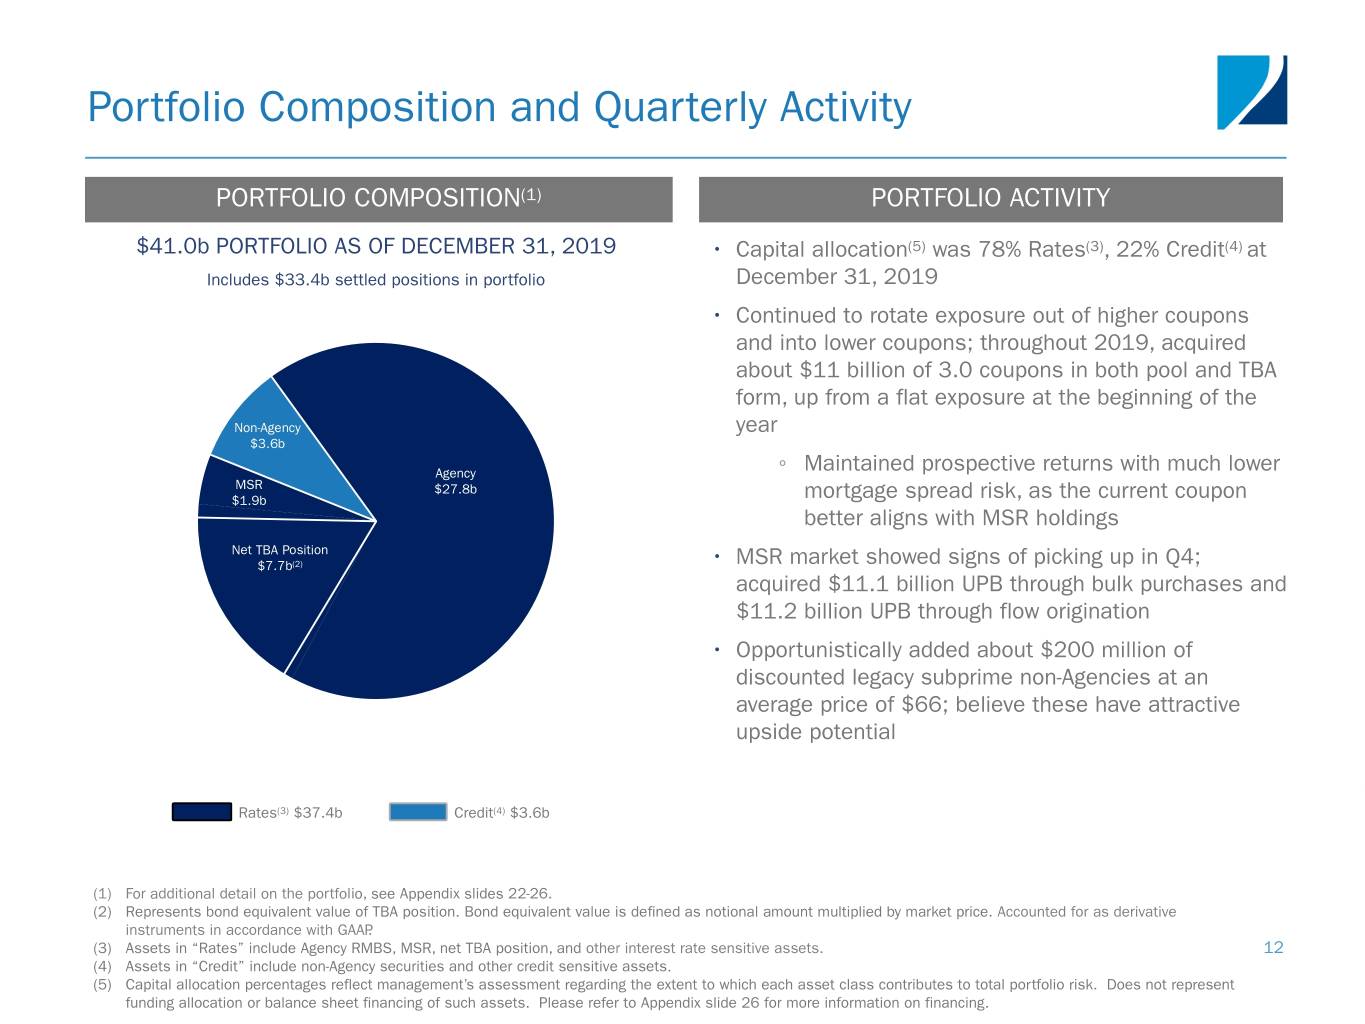
Portfolio Composition and Quarterly Activity PORTFOLIO COMPOSITION(1) PORTFOLIO ACTIVITY $41.0b PORTFOLIO AS OF DECEMBER 31, 2019 • Capital allocation(5) was 78% Rates(3), 22% Credit(4) at Includes $33.4b settled positions in portfolio December 31, 2019 • Continued to rotate exposure out of higher coupons and into lower coupons; throughout 2019, acquired about $11 billion of 3.0 coupons in both pool and TBA form, up from a flat exposure at the beginning of the Non-Agency year $3.6b Agency ◦ Maintained prospective returns with much lower MSR $27.8b $1.9b mortgage spread risk, as the current coupon better aligns with MSR holdings Net TBA Position $7.7b(2) • MSR market showed signs of picking up in Q4; acquired $11.1 billion UPB through bulk purchases and $11.2 billion UPB through flow origination • Opportunistically added about $200 million of discounted legacy subprime non-Agencies at an average price of $66; believe these have attractive upside potential Rates(3) $37.4b Credit(4) $3.6b (1) For additional detail on the portfolio, see Appendix slides 22-26. (2) Represents bond equivalent value of TBA position. Bond equivalent value is defined as notional amount multiplied by market price. Accounted for as derivative instruments in accordance with GAAP. (3) Assets in “Rates” include Agency RMBS, MSR, net TBA position, and other interest rate sensitive assets. 12 (4) Assets in “Credit” include non-Agency securities and other credit sensitive assets. (5) Capital allocation percentages reflect management’s assessment regarding the extent to which each asset class contributes to total portfolio risk. Does not represent funding allocation or balance sheet financing of such assets. Please refer to Appendix slide 26 for more information on financing.
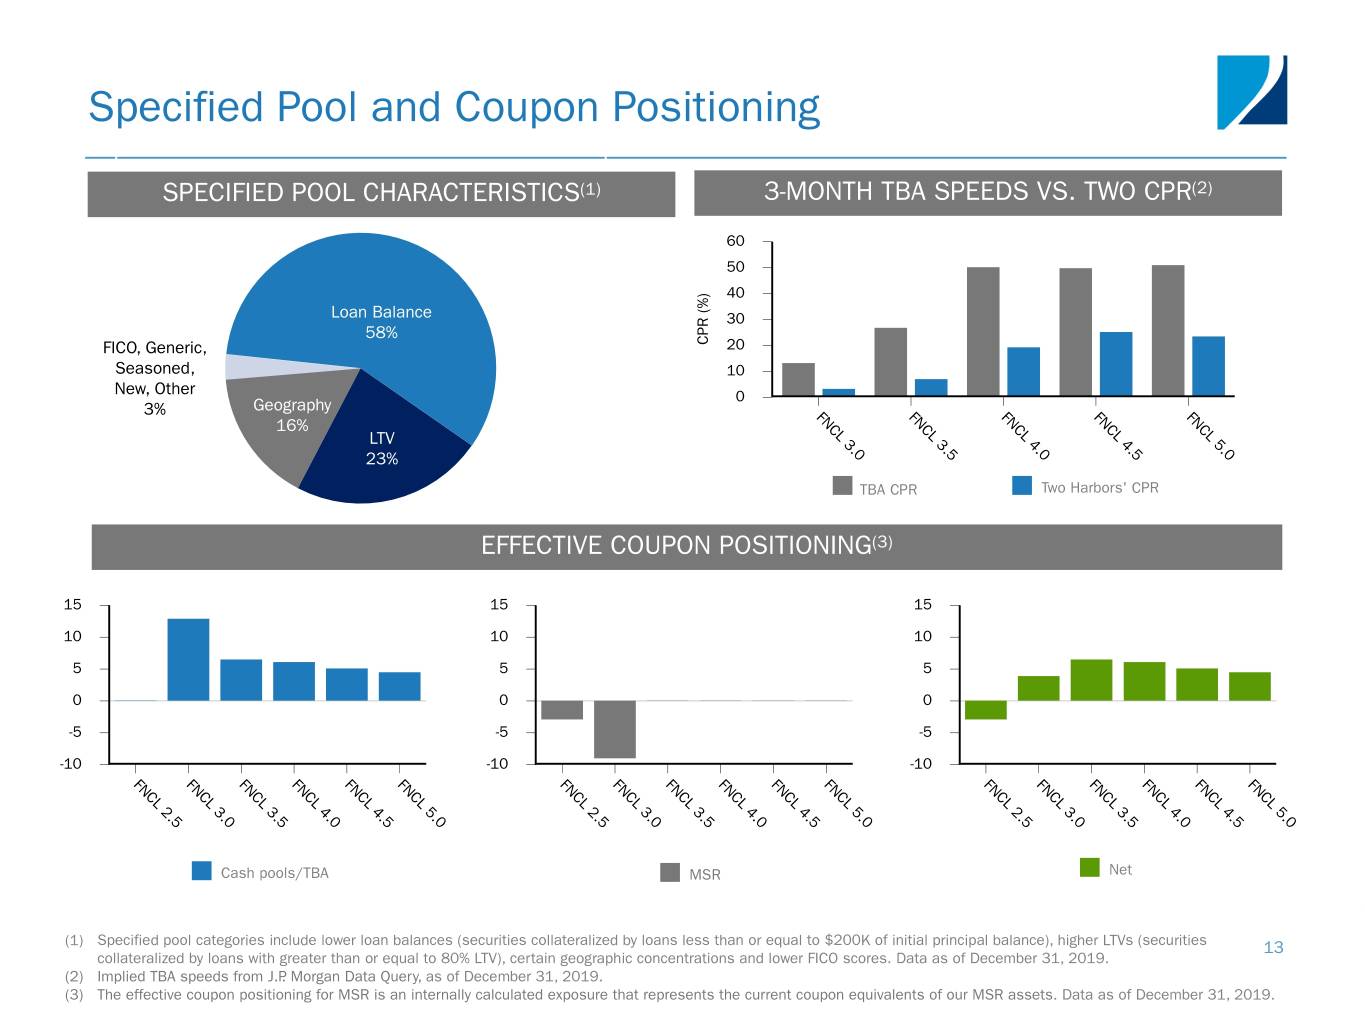
Specified Pool and Coupon Positioning SPECIFIED POOL CHARACTERISTICS(1) 3-MONTH TBA SPEEDS VS. TWO CPR(2) 60 50 ) 40 % Loan Balance ( 30 R 58% P FICO, Generic, C 20 Seasoned, 10 New, Other 0 3% Geography FN FN FN FN FN C C C C C 16% L L L L L LTV 3 3 4 4 5 . . . . . 23% 0 5 0 5 0 TBA CPR Two Harbors' CPR EFFECTIVE COUPON POSITIONING(3) 15 15 15 10 10 10 5 5 5 0 0 0 -5 -5 -5 -10 -10 -10 FN FN FN FN FN FN FN FN FN FN FN FN FN FN FN FN FN FN C C C C C C C C C C C C C C C C C C L L L L L L L L L L L L L L L L L L 2 3 3 4 4 5 2 3 3 4 4 5 2 3 3 4 4 5 .5 .0 .5 .0 .5 .0 .5 .0 .5 .0 .5 .0 .5 .0 .5 .0 .5 .0 Cash pools/TBA MSR Net (1) Specified pool categories include lower loan balances (securities collateralized by loans less than or equal to $200K of initial principal balance), higher LTVs (securities 13 collateralized by loans with greater than or equal to 80% LTV), certain geographic concentrations and lower FICO scores. Data as of December 31, 2019. (2) Implied TBA speeds from J.P. Morgan Data Query, as of December 31, 2019. (3) The effective coupon positioning for MSR is an internally calculated exposure that represents the current coupon equivalents of our MSR assets. Data as of December 31, 2019.
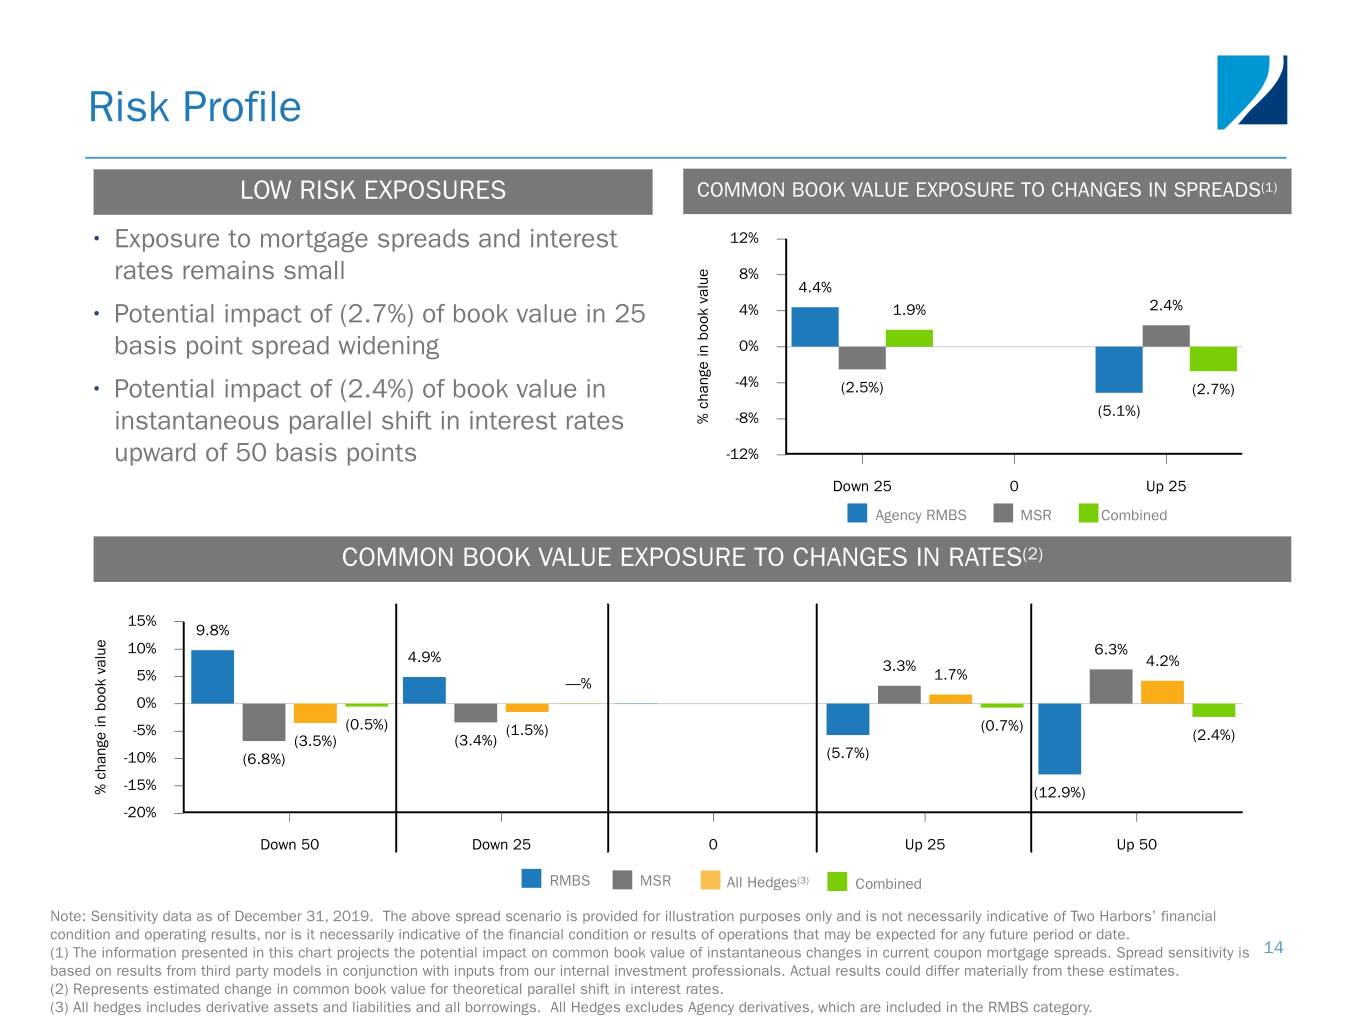
Risk Profile LOW RISK EXPOSURES COMMON BOOK VALUE EXPOSURE TO CHANGES IN SPREADS(1) • Exposure to mortgage spreads and interest 12% rates remains small e 8% u l 4.4% a v 2.4% k 4% 1.9% • Potential impact of (2.7%) of book value in 25 o o b n 0% basis point spread widening i e g n -4% a (2.5%) (2.7%) • Potential impact of (2.4%) of book value in h c (5.1%) instantaneous parallel shift in interest rates % -8% upward of 50 basis points -12% Down 25 0 Up 25 Agency RMBS MSR Combined COMMON BOOK VALUE EXPOSURE TO CHANGES IN RATES(2) 15% 9.8% e u 10% 6.3% l 4.9% a 3.3% 4.2% v 5% 1.7% k —% o o 0% b n i -5% (0.5%) (1.5%) (0.7%) e (2.4%) g (3.5%) (3.4%) n (5.7%) a -10% (6.8%) h c -15% % (12.9%) -20% Down 50 Down 25 0 Up 25 Up 50 RMBS MSR All Hedges(3) Combined Note: Sensitivity data as of December 31, 2019. The above spread scenario is provided for illustration purposes only and is not necessarily indicative of Two Harbors’ financial condition and operating results, nor is it necessarily indicative of the financial condition or results of operations that may be expected for any future period or date. (1) The information presented in this chart projects the potential impact on common book value of instantaneous changes in current coupon mortgage spreads. Spread sensitivity is 14 based on results from third party models in conjunction with inputs from our internal investment professionals. Actual results could differ materially from these estimates. (2) Represents estimated change in common book value for theoretical parallel shift in interest rates. (3) All hedges includes derivative assets and liabilities and all borrowings. All Hedges excludes Agency derivatives, which are included in the RMBS category.
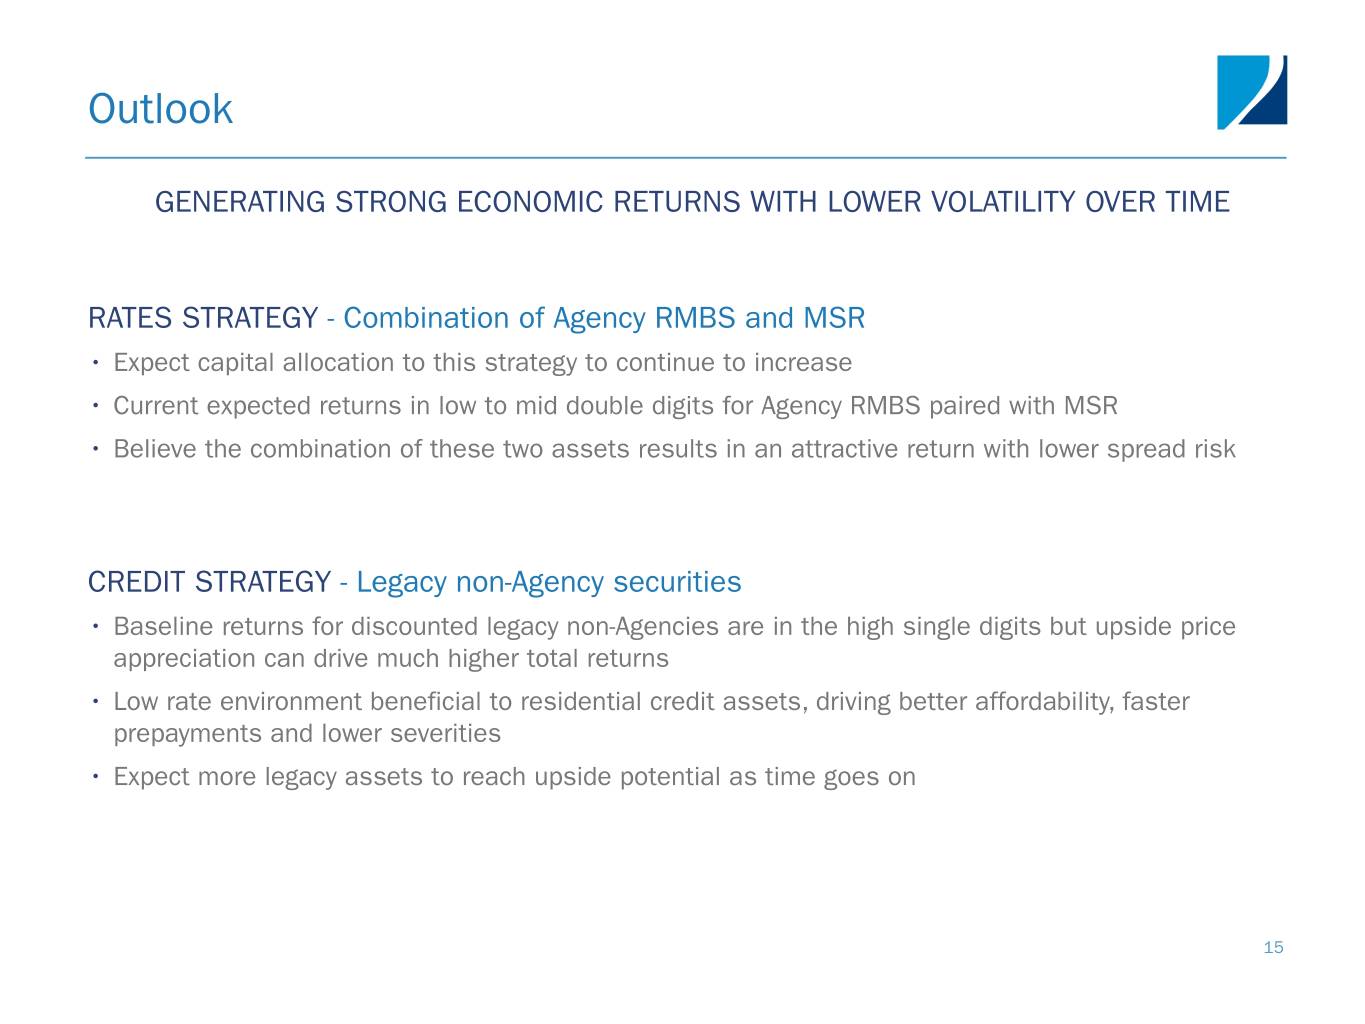
Outlook GENERATING STRONG ECONOMIC RETURNS WITH LOWER VOLATILITY OVER TIME RATES STRATEGY - Combination of Agency RMBS and MSR • Expect capital allocation to this strategy to continue to increase • Current expected returns in low to mid double digits for Agency RMBS paired with MSR • Believe the combination of these two assets results in an attractive return with lower spread risk CREDIT STRATEGY - Legacy non-Agency securities • Baseline returns for discounted legacy non-Agencies are in the high single digits but upside price appreciation can drive much higher total returns • Low rate environment beneficial to residential credit assets, driving better affordability, faster prepayments and lower severities • Expect more legacy assets to reach upside potential as time goes on 15

Appendix
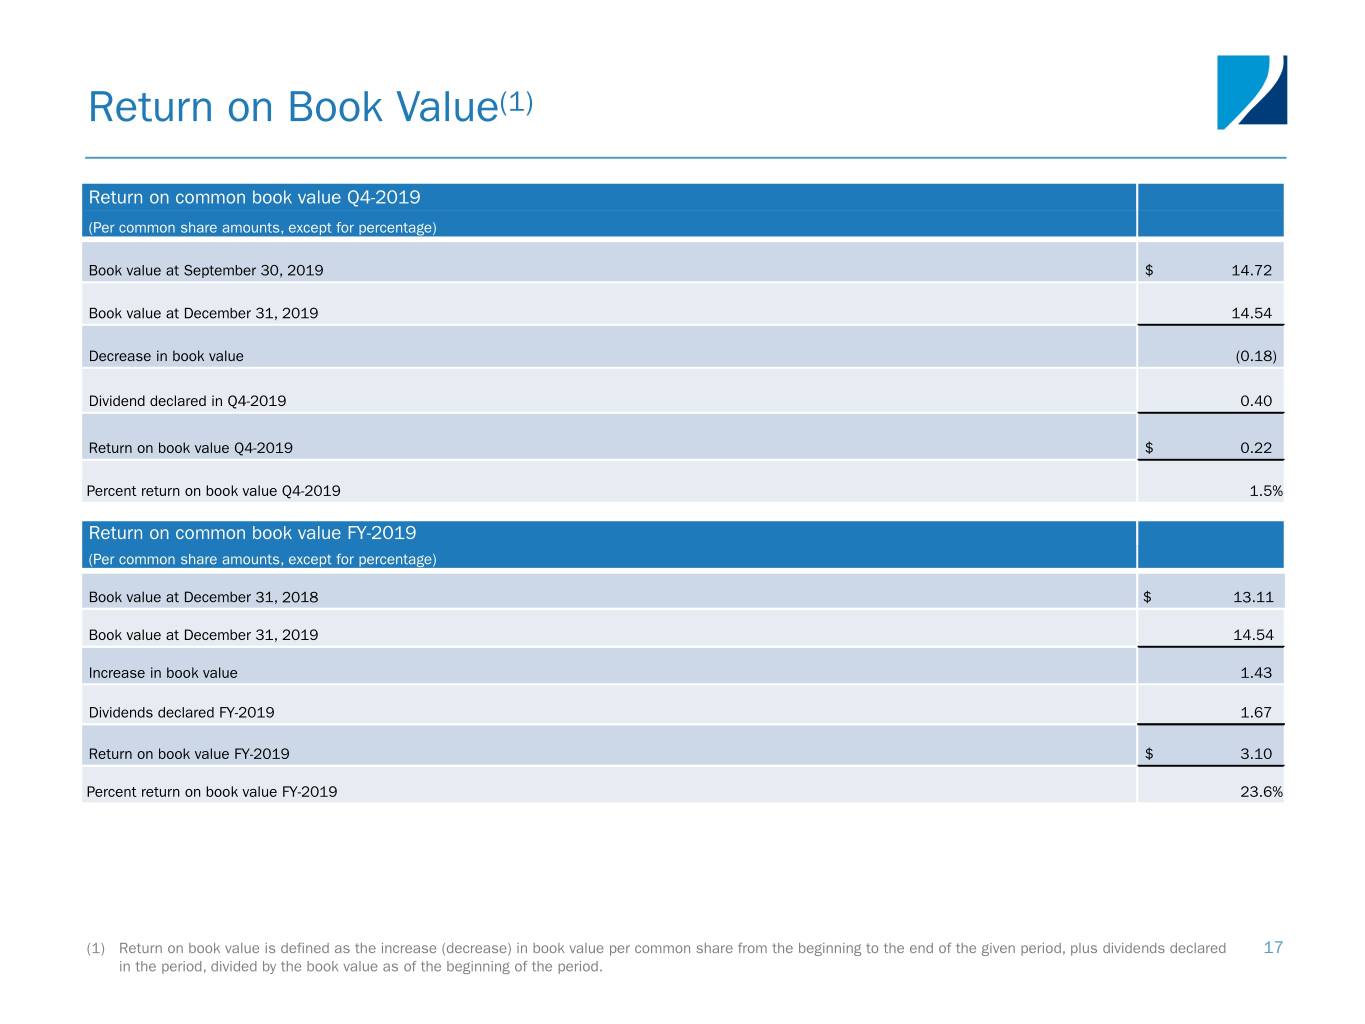
Return on Book Value(1) Return on common book value Q4-2019 (Per common share amounts, except for percentage) Book value at September 30, 2019 $ 14.72 Book value at December 31, 2019 14.54 Decrease in book value (0.18) Dividend declared in Q4-2019 0.40 Return on book value Q4-2019 $ 0.22 Percent return on book value Q4-2019 1.5% Return on common book value FY-2019 (Per common share amounts, except for percentage) Book value at December 31, 2018 $ 13.11 Book value at December 31, 2019 14.54 Increase in book value 1.43 Dividends declared FY-2019 1.67 Return on book value FY-2019 $ 3.10 Percent return on book value FY-2019 23.6% (1) Return on book value is defined as the increase (decrease) in book value per common share from the beginning to the end of the given period, plus dividends declared 17 in the period, divided by the book value as of the beginning of the period.
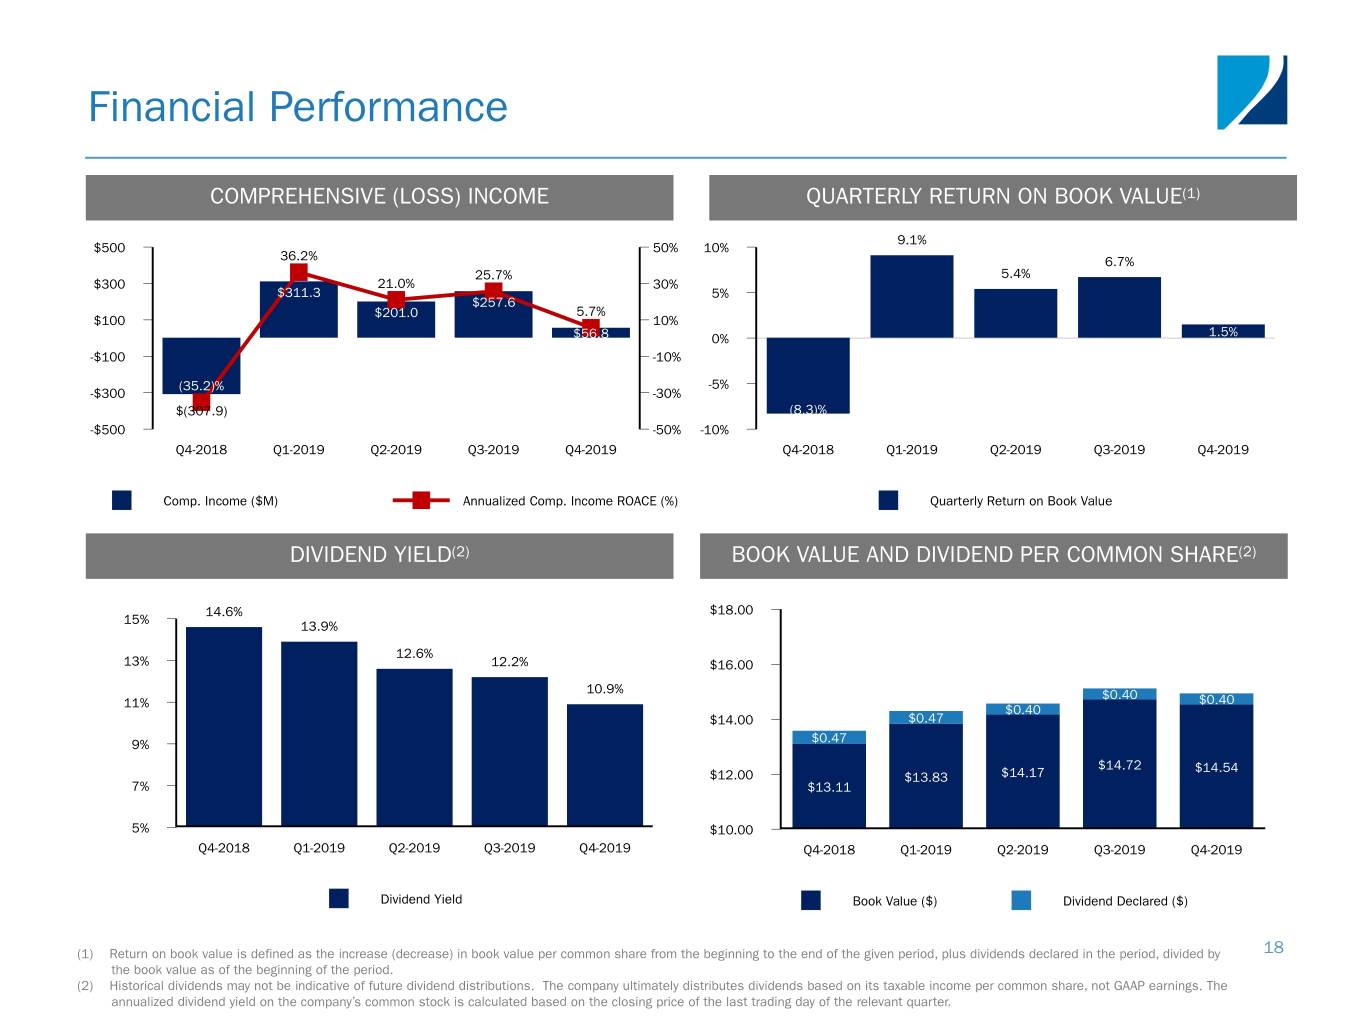
Financial Performance COMPREHENSIVE (LOSS) INCOME QUARTERLY RETURN ON BOOK VALUE(1) 9.1% $500 50% 10% 36.2% 6.7% 25.7% 5.4% $300 21.0% 30% $311.3 5% $257.6 $201.0 5.7% $100 10% 1.5% $56.8 0% -$100 -10% (35.2)% -5% -$300 -30% $(307.9) (8.3)% -$500 -50% -10% Q4-2018 Q1-2019 Q2-2019 Q3-2019 Q4-2019 Q4-2018 Q1-2019 Q2-2019 Q3-2019 Q4-2019 Comp. Income ($M) Annualized Comp. Income ROACE (%) Quarterly Return on Book Value DIVIDEND YIELD(2) BOOK VALUE AND DIVIDEND PER COMMON SHARE(2) 14.6% $18.00 15% 13.9% 12.6% 13% 12.2% $16.00 10.9% $0.40 11% $0.40 $0.40 $14.00 $0.47 $0.47 9% $14.72 $14.54 $12.00 $13.83 $14.17 7% $13.11 5% $10.00 Q4-2018 Q1-2019 Q2-2019 Q3-2019 Q4-2019 Q4-2018 Q1-2019 Q2-2019 Q3-2019 Q4-2019 Dividend Yield Book Value ($) Dividend Declared ($) (1) Return on book value is defined as the increase (decrease) in book value per common share from the beginning to the end of the given period, plus dividends declared in the period, divided by 18 the book value as of the beginning of the period. (2) Historical dividends may not be indicative of future dividend distributions. The company ultimately distributes dividends based on its taxable income per common share, not GAAP earnings. The annualized dividend yield on the company’s common stock is calculated based on the closing price of the last trading day of the relevant quarter.
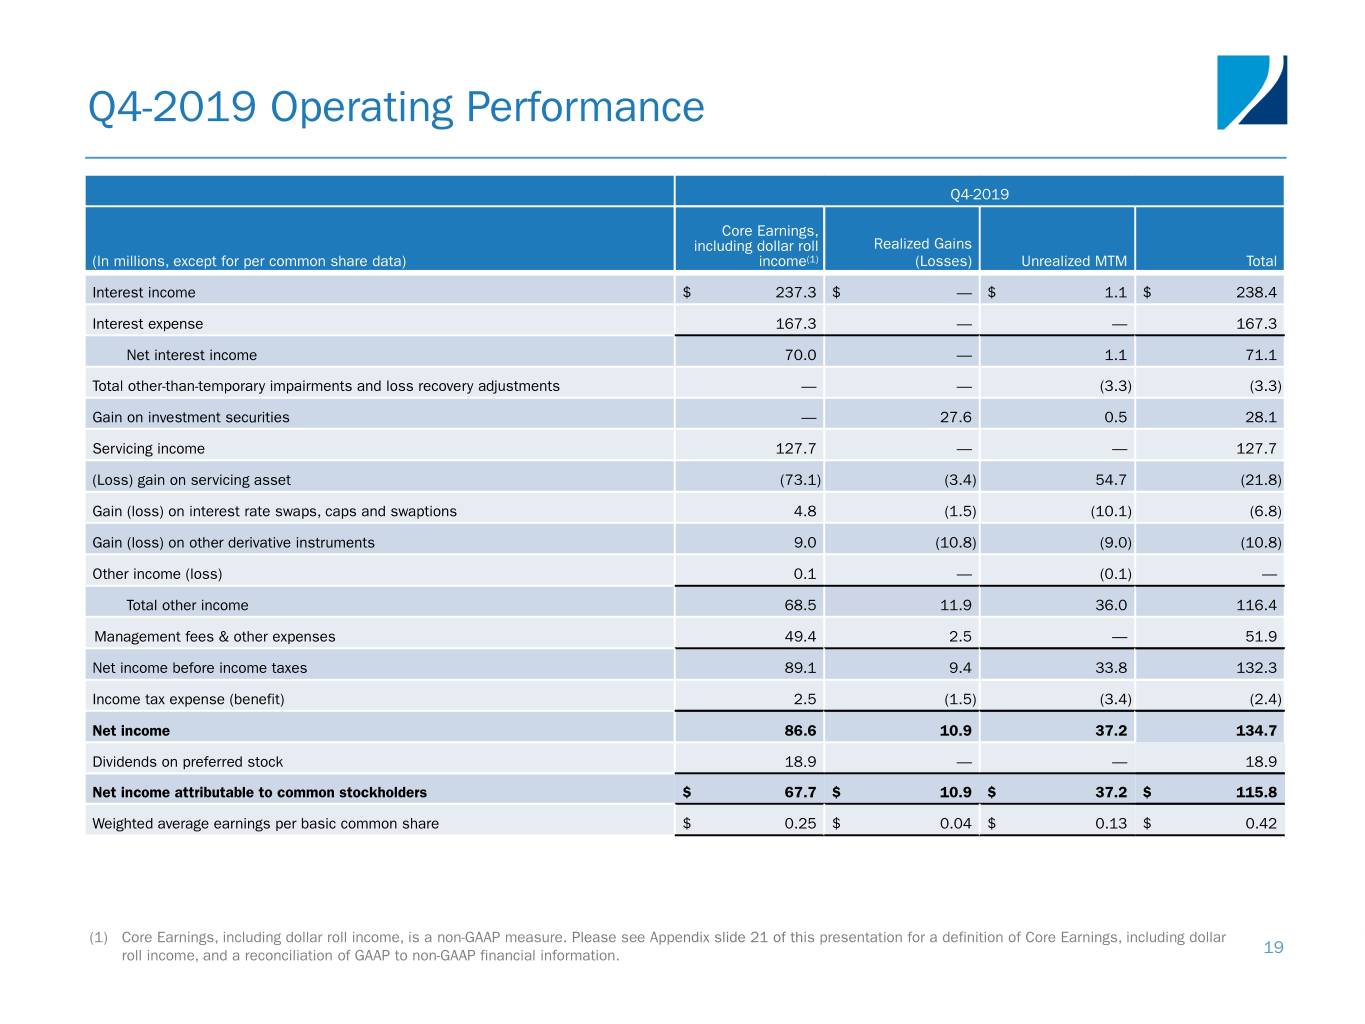
Q4-2019 Operating Performance Q4-2019 Core Earnings, including dollar roll Realized Gains (In millions, except for per common share data) income(1) (Losses) Unrealized MTM Total Interest income $ 237.3 $ — $ 1.1 $ 238.4 Interest expense 167.3 — — 167.3 Net interest income 70.0 — 1.1 71.1 Total other-than-temporary impairments and loss recovery adjustments — — (3.3) (3.3) Gain on investment securities — 27.6 0.5 28.1 Servicing income 127.7 — — 127.7 (Loss) gain on servicing asset (73.1) (3.4) 54.7 (21.8) Gain (loss) on interest rate swaps, caps and swaptions 4.8 (1.5) (10.1) (6.8) Gain (loss) on other derivative instruments 9.0 (10.8) (9.0) (10.8) Other income (loss) 0.1 — (0.1) — Total other income 68.5 11.9 36.0 116.4 Management fees & other expenses 49.4 2.5 — 51.9 Net income before income taxes 89.1 9.4 33.8 132.3 Income tax expense (benefit) 2.5 (1.5) (3.4) (2.4) Net income 86.6 10.9 37.2 134.7 Dividends on preferred stock 18.9 — — 18.9 Net income attributable to common stockholders $ 67.7 $ 10.9 $ 37.2 $ 115.8 Weighted average earnings per basic common share $ 0.25 $ 0.04 $ 0.13 $ 0.42 (1) Core Earnings, including dollar roll income, is a non-GAAP measure. Please see Appendix slide 21 of this presentation for a definition of Core Earnings, including dollar roll income, and a reconciliation of GAAP to non-GAAP financial information. 19
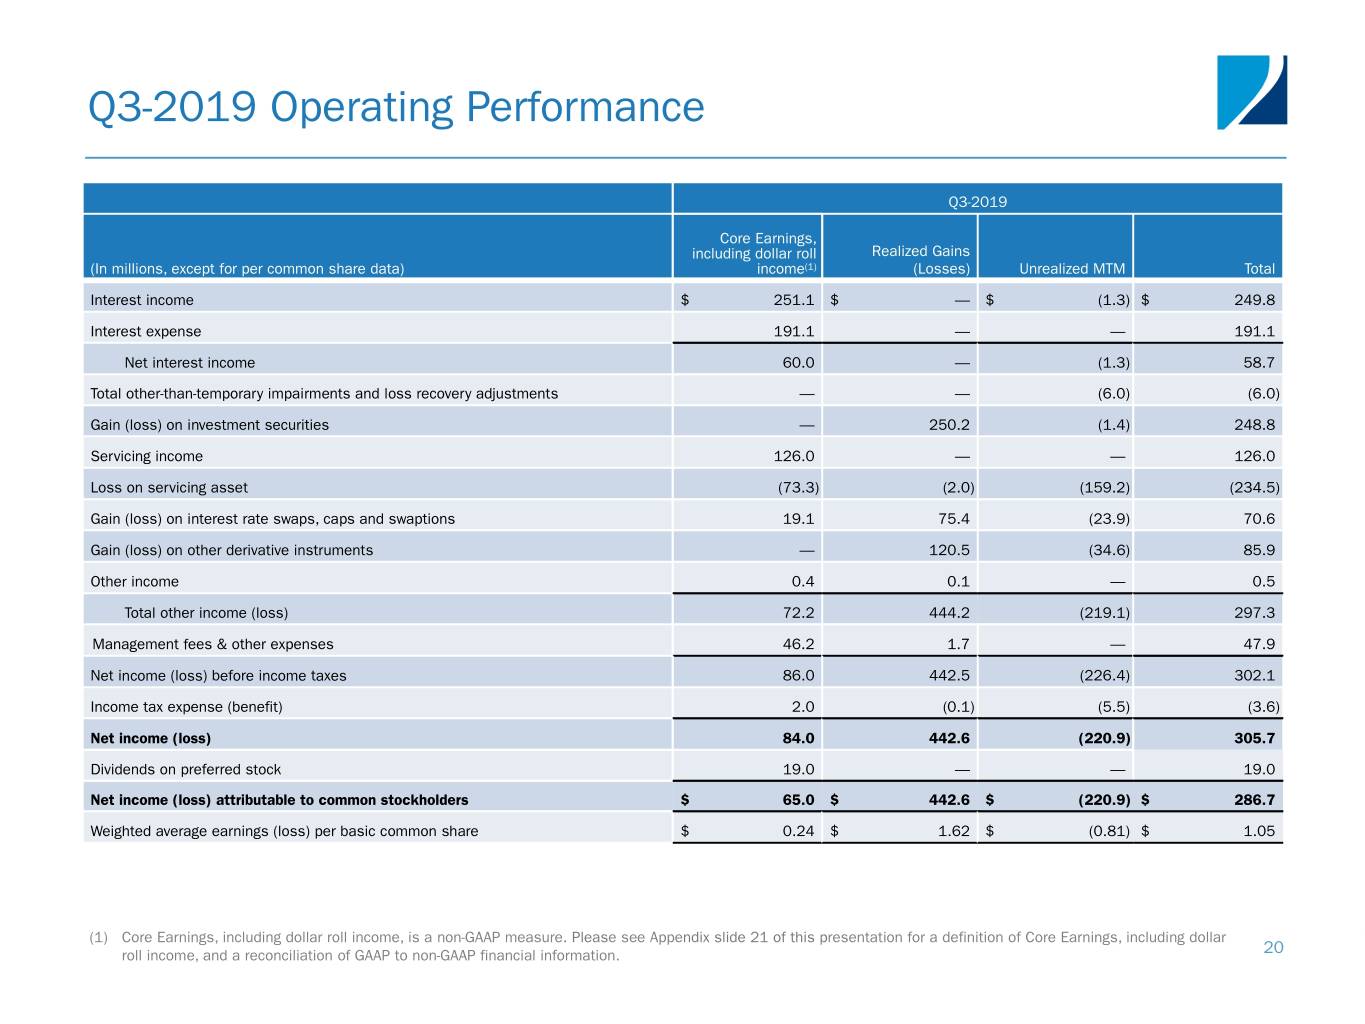
Q3-2019 Operating Performance Q3-2019 Core Earnings, including dollar roll Realized Gains (In millions, except for per common share data) income(1) (Losses) Unrealized MTM Total Interest income $ 251.1 $ — $ (1.3) $ 249.8 Interest expense 191.1 — — 191.1 Net interest income 60.0 — (1.3) 58.7 Total other-than-temporary impairments and loss recovery adjustments — — (6.0) (6.0) Gain (loss) on investment securities — 250.2 (1.4) 248.8 Servicing income 126.0 — — 126.0 Loss on servicing asset (73.3) (2.0) (159.2) (234.5) Gain (loss) on interest rate swaps, caps and swaptions 19.1 75.4 (23.9) 70.6 Gain (loss) on other derivative instruments — 120.5 (34.6) 85.9 Other income 0.4 0.1 — 0.5 Total other income (loss) 72.2 444.2 (219.1) 297.3 Management fees & other expenses 46.2 1.7 — 47.9 Net income (loss) before income taxes 86.0 442.5 (226.4) 302.1 Income tax expense (benefit) 2.0 (0.1) (5.5) (3.6) Net income (loss) 84.0 442.6 (220.9) 305.7 Dividends on preferred stock 19.0 — — 19.0 Net income (loss) attributable to common stockholders $ 65.0 $ 442.6 $ (220.9) $ 286.7 Weighted average earnings (loss) per basic common share $ 0.24 $ 1.62 $ (0.81) $ 1.05 (1) Core Earnings, including dollar roll income, is a non-GAAP measure. Please see Appendix slide 21 of this presentation for a definition of Core Earnings, including dollar roll income, and a reconciliation of GAAP to non-GAAP financial information. 20
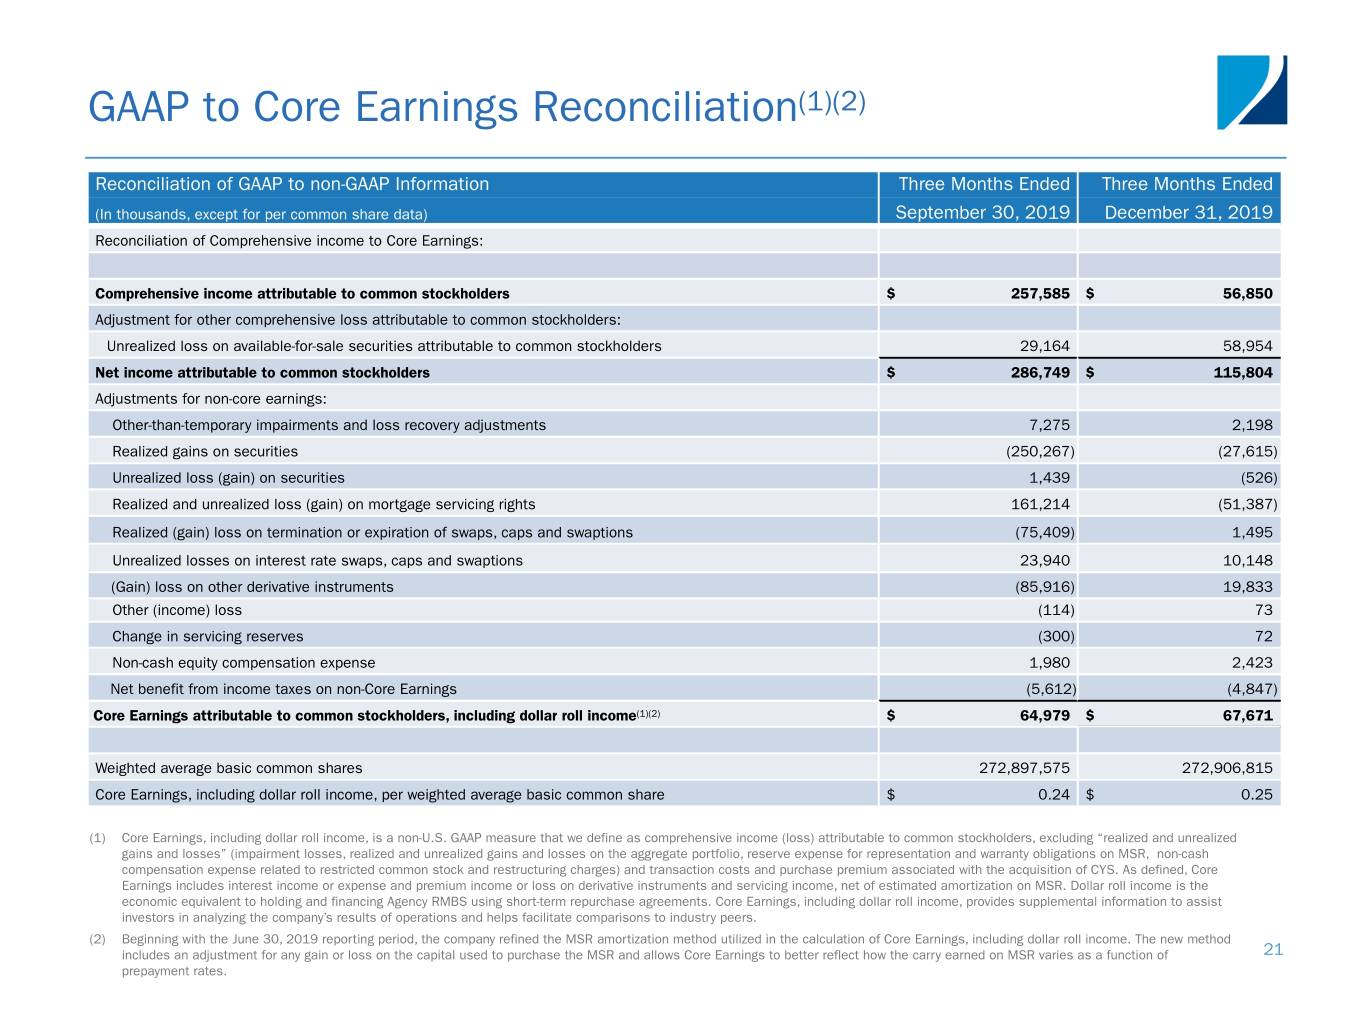
GAAP to Core Earnings Reconciliation(1)(2) Reconciliation of GAAP to non-GAAP Information Three Months Ended Three Months Ended (In thousands, except for per common share data) September 30, 2019 December 31, 2019 Reconciliation of Comprehensive income to Core Earnings: Comprehensive income attributable to common stockholders $ 257,585 $ 56,850 Adjustment for other comprehensive loss attributable to common stockholders: Unrealized loss on available-for-sale securities attributable to common stockholders 29,164 58,954 Net income attributable to common stockholders $ 286,749 $ 115,804 Adjustments for non-core earnings: Other-than-temporary impairments and loss recovery adjustments 7,275 2,198 Realized gains on securities (250,267) (27,615) Unrealized loss (gain) on securities 1,439 (526) Realized and unrealized loss (gain) on mortgage servicing rights 161,214 (51,387) Realized (gain) loss on termination or expiration of swaps, caps and swaptions (75,409) 1,495 Unrealized losses on interest rate swaps, caps and swaptions 23,940 10,148 (Gain) loss on other derivative instruments (85,916) 19,833 Other (income) loss (114) 73 Change in servicing reserves (300) 72 Non-cash equity compensation expense 1,980 2,423 Net benefit from income taxes on non-Core Earnings (5,612) (4,847) Core Earnings attributable to common stockholders, including dollar roll income(1)(2) $ 64,979 $ 67,671 Weighted average basic common shares 272,897,575 272,906,815 Core Earnings, including dollar roll income, per weighted average basic common share $ 0.24 $ 0.25 (1) Core Earnings, including dollar roll income, is a non-U.S. GAAP measure that we define as comprehensive income (loss) attributable to common stockholders, excluding “realized and unrealized gains and losses” (impairment losses, realized and unrealized gains and losses on the aggregate portfolio, reserve expense for representation and warranty obligations on MSR, non-cash compensation expense related to restricted common stock and restructuring charges) and transaction costs and purchase premium associated with the acquisition of CYS. As defined, Core Earnings includes interest income or expense and premium income or loss on derivative instruments and servicing income, net of estimated amortization on MSR. Dollar roll income is the economic equivalent to holding and financing Agency RMBS using short-term repurchase agreements. Core Earnings, including dollar roll income, provides supplemental information to assist investors in analyzing the company’s results of operations and helps facilitate comparisons to industry peers. (2) Beginning with the June 30, 2019 reporting period, the company refined the MSR amortization method utilized in the calculation of Core Earnings, including dollar roll income. The new method includes an adjustment for any gain or loss on the capital used to purchase the MSR and allows Core Earnings to better reflect how the carry earned on MSR varies as a function of 21 prepayment rates.
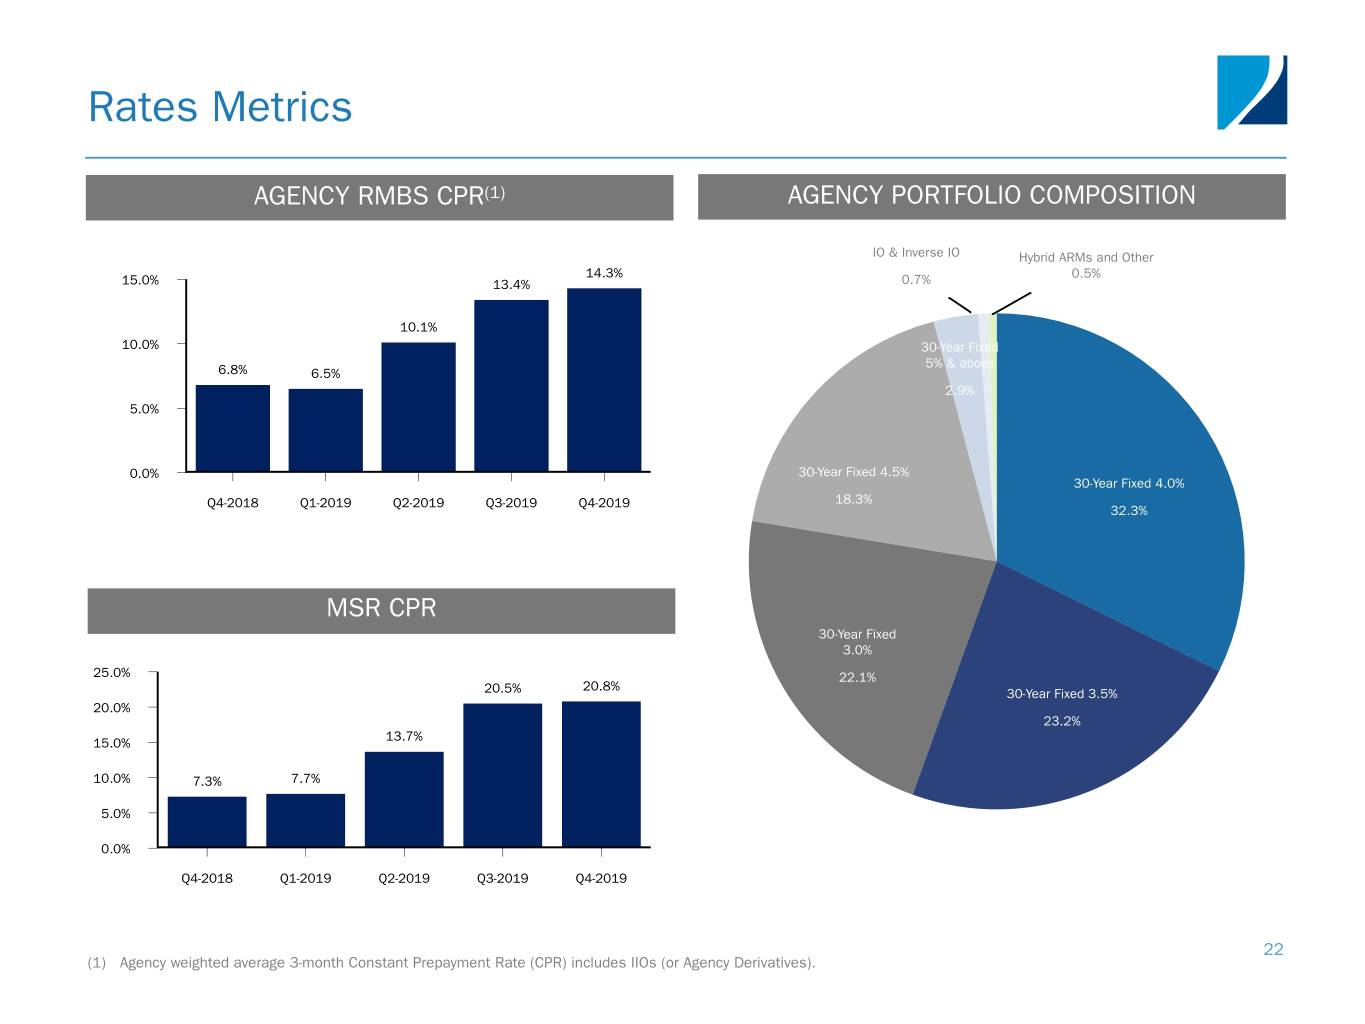
Rates Metrics AGENCY RMBS CPR(1) AGENCY PORTFOLIO COMPOSITION IO & Inverse IO Hybrid ARMs and Other 14.3% 0.5% 15.0% 13.4% 0.7% 10.1% 10.0% 30-Year Fixed 5% & above 6.8% 6.5% 2.9% 5.0% 0.0% 30-Year Fixed 4.5% 30-Year Fixed 4.0% Q4-2018 Q1-2019 Q2-2019 Q3-2019 Q4-2019 18.3% 32.3% MSR CPR 30-Year Fixed 3.0% 25.0% 22.1% 20.8% 20.5% 30-Year Fixed 3.5% 20.0% 23.2% 13.7% 15.0% 10.0% 7.3% 7.7% 5.0% 0.0% Q4-2018 Q1-2019 Q2-2019 Q3-2019 Q4-2019 22 (1) Agency weighted average 3-month Constant Prepayment Rate (CPR) includes IIOs (or Agency Derivatives).
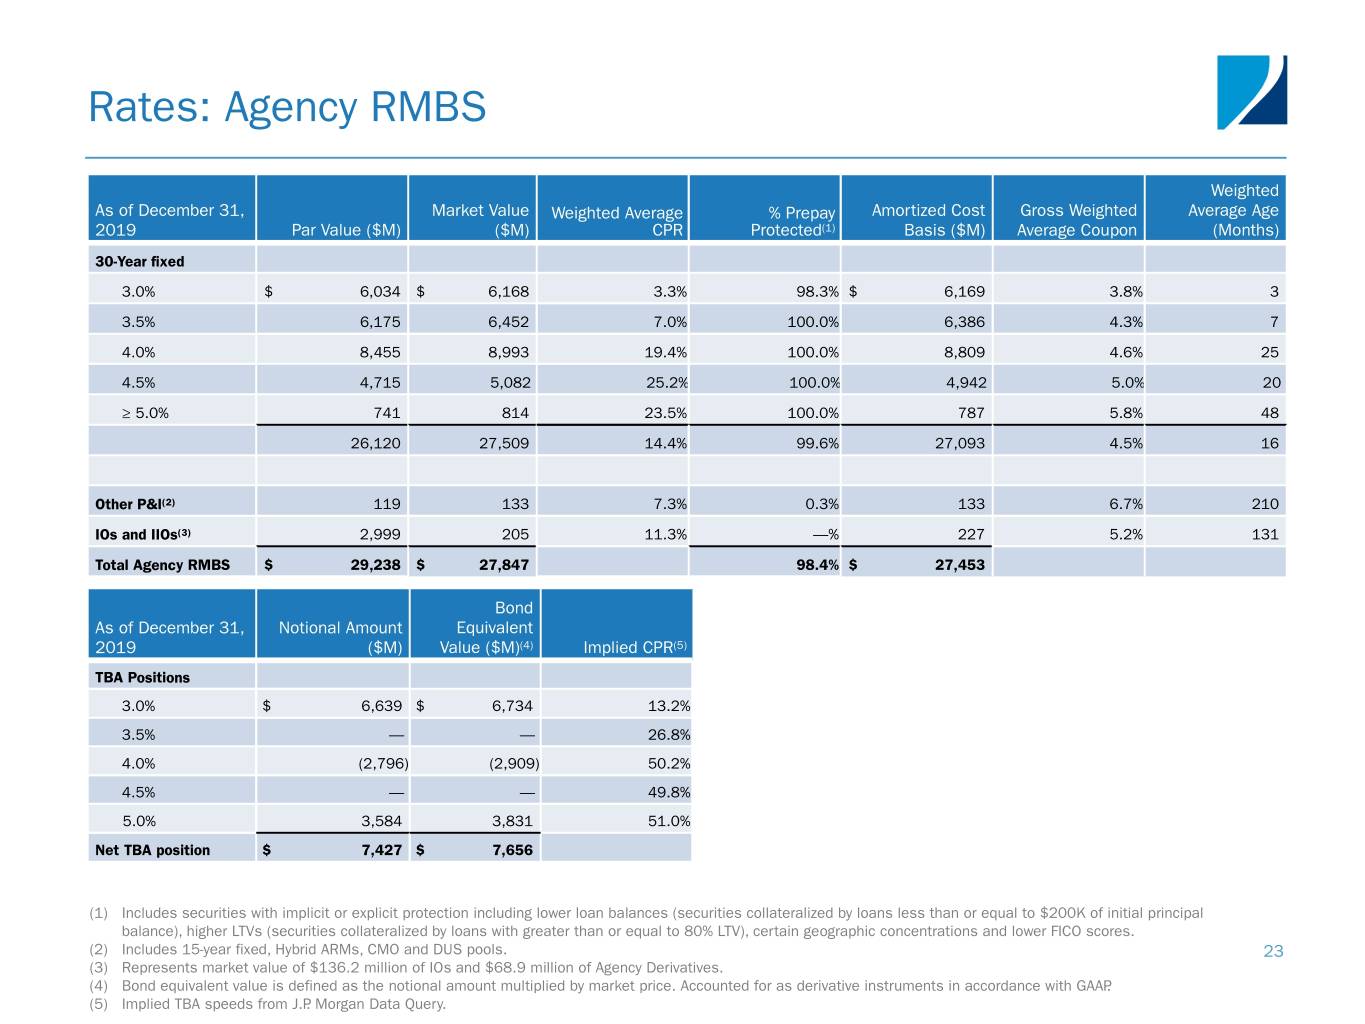
Rates: Agency RMBS Weighted As of December 31, Market Value Weighted Average % Prepay Amortized Cost Gross Weighted Average Age 2019 Par Value ($M) ($M) CPR Protected(1) Basis ($M) Average Coupon (Months) 30-Year fixed 3.0% $ 6,034 $ 6,168 3.3% 98.3% $ 6,169 3.8% 3 3.5% 6,175 6,452 7.0% 100.0% 6,386 4.3% 7 4.0% 8,455 8,993 19.4% 100.0% 8,809 4.6% 25 4.5% 4,715 5,082 25.2% 100.0% 4,942 5.0% 20 ≥ 5.0% 741 814 23.5% 100.0% 787 5.8% 48 26,120 27,509 14.4% 99.6% 27,093 4.5% 16 Other P&I(2) 119 133 7.3% 0.3% 133 6.7% 210 IOs and IIOs(3) 2,999 205 11.3% —% 227 5.2% 131 Total Agency RMBS $ 29,238 $ 27,847 98.4% $ 27,453 Bond As of December 31, Notional Amount Equivalent 2019 ($M) Value ($M)(4) Implied CPR(5) TBA Positions 3.0% $ 6,639 $ 6,734 13.2% 3.5% — — 26.8% 4.0% (2,796) (2,909) 50.2% 4.5% — — 49.8% 5.0% 3,584 3,831 51.0% Net TBA position $ 7,427 $ 7,656 (1) Includes securities with implicit or explicit protection including lower loan balances (securities collateralized by loans less than or equal to $200K of initial principal balance), higher LTVs (securities collateralized by loans with greater than or equal to 80% LTV), certain geographic concentrations and lower FICO scores. (2) Includes 15-year fixed, Hybrid ARMs, CMO and DUS pools. 23 (3) Represents market value of $136.2 million of IOs and $68.9 million of Agency Derivatives. (4) Bond equivalent value is defined as the notional amount multiplied by market price. Accounted for as derivative instruments in accordance with GAAP. (5) Implied TBA speeds from J.P. Morgan Data Query.

Rates: Mortgage Servicing Rights(1) Gross Weighted Weighted Weighted Weighted Unpaid Average Average Average Average (dollars in Number of Principal % Fannie Coupon Loan Age Original Original 60+ Day 3-Month Net Servicing millions) Loans Balance Fair Value Mae Rate (months) FICO(2) LTV Delinquencies CPR Fee (bps) 30-Year Fixed < 3.75% 106,097 $ 27,628 $ 330 71% 3.5% 47 771 71% 0.1% 10.5% 26.4 3.75% - 4.25% 241,274 59,173 672 65% 3.9% 39 761 76% 0.2% 16.1% 26.9 4.25% - 4.75% 194,543 43,612 455 65% 4.4% 33 745 79% 0.4% 26.4% 26.3 4.75% - 5.25% 95,468 19,780 207 66% 4.9% 26 732 80% 0.5% 32.9% 28.0 > 5.25% 34,524 5,987 61 71% 5.5% 24 709 80% 1.0% 30.8% 30.8 671,906 156,180 1,725 66% 4.2% 37 753 77% 0.3% 21.4% 26.9 15-Year Fixed < 2.75% 2,325 465 4 81% 2.6% 46 778 60% —% 8.6% 26.1 2.75% - 3.25% 39,977 6,894 63 80% 2.9% 48 772 62% 0.1% 11.2% 25.8 3.25% - 3.75% 40,052 6,311 61 74% 3.4% 40 760 65% 0.1% 15.0% 27.6 3.75% - 4.25% 21,243 2,990 30 64% 3.9% 32 747 66% 0.2% 19.2% 29.4 > 4.25% 11,644 1,423 14 62% 4.5% 23 734 67% 0.2% 24.8% 31.4 115,241 18,083 172 74% 3.4% 40 761 64% 0.1% 15.0% 27.5 Total ARMs 6,323 1,619 12 70% 3.6% 44 762 66% 0.3% 27.3% 25.2 Total Portfolio 793,470 $ 175,882 $ 1,909 67% 4.1% 37 754 75% 0.3% 20.8% 27.0 24 (1) Excludes residential mortgage loans for which the company is the named servicing administrator. (2) FICO represents a mortgage industry accepted credit score of a borrower.
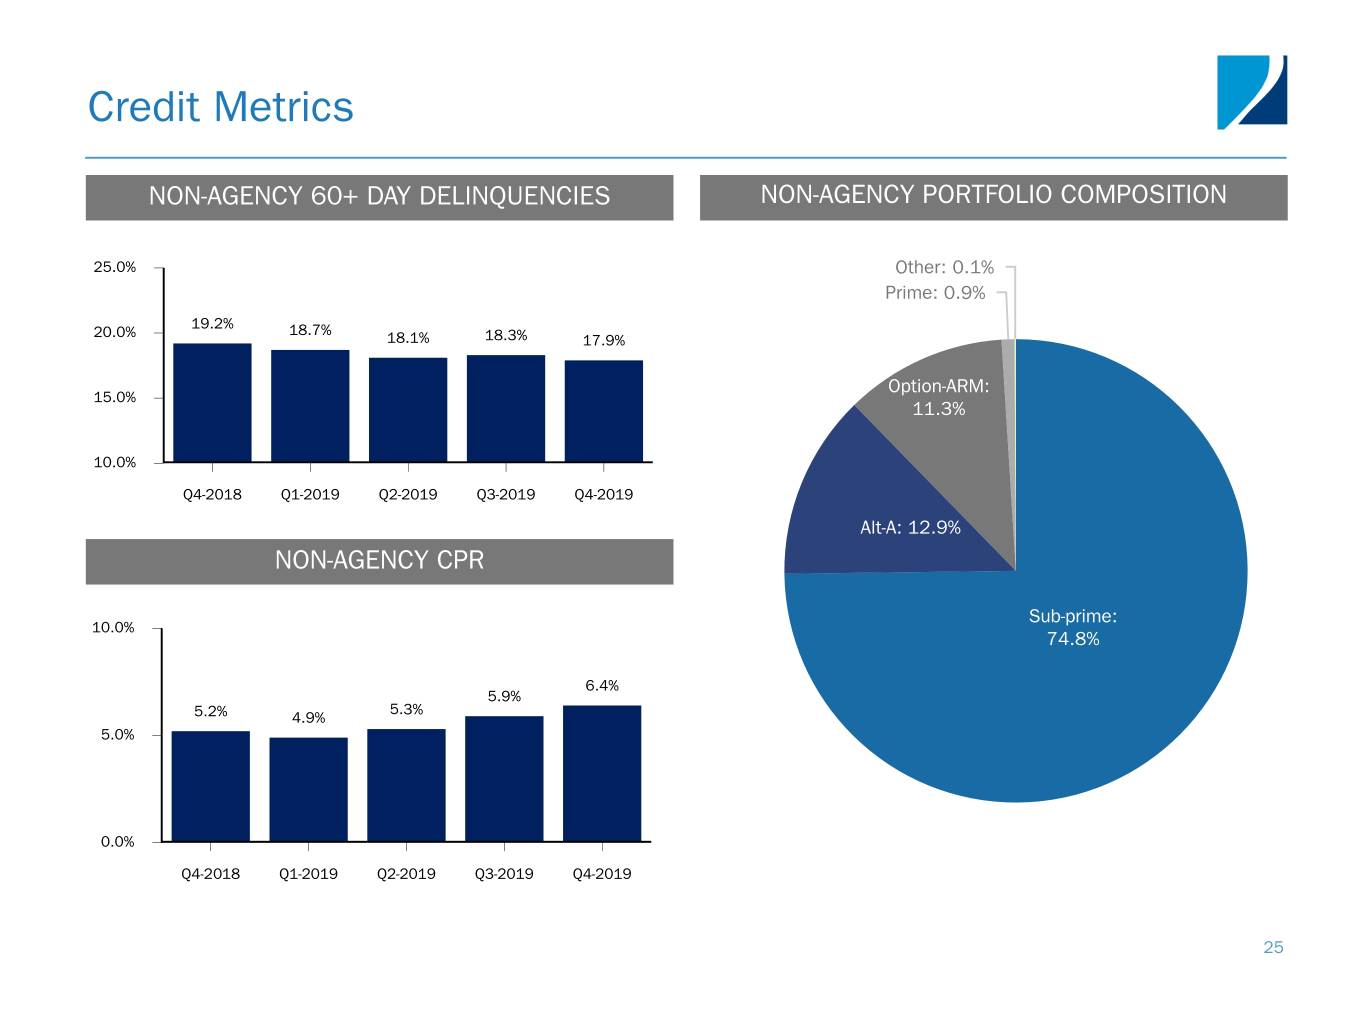
Credit Metrics NON-AGENCY 60+ DAY DELINQUENCIES NON-AGENCY PORTFOLIO COMPOSITION 25.0% Other: 0.1% Prime: 0.9% 19.2% 20.0% 18.7% 18.1% 18.3% 17.9% Option-ARM: 15.0% 11.3% 10.0% Q4-2018 Q1-2019 Q2-2019 Q3-2019 Q4-2019 Alt-A: 12.9% NON-AGENCY CPR Sub-prime: 10.0% 74.8% 6.4% 5.9% 5.3% 5.2% 4.9% 5.0% 0.0% Q4-2018 Q1-2019 Q2-2019 Q3-2019 Q4-2019 25
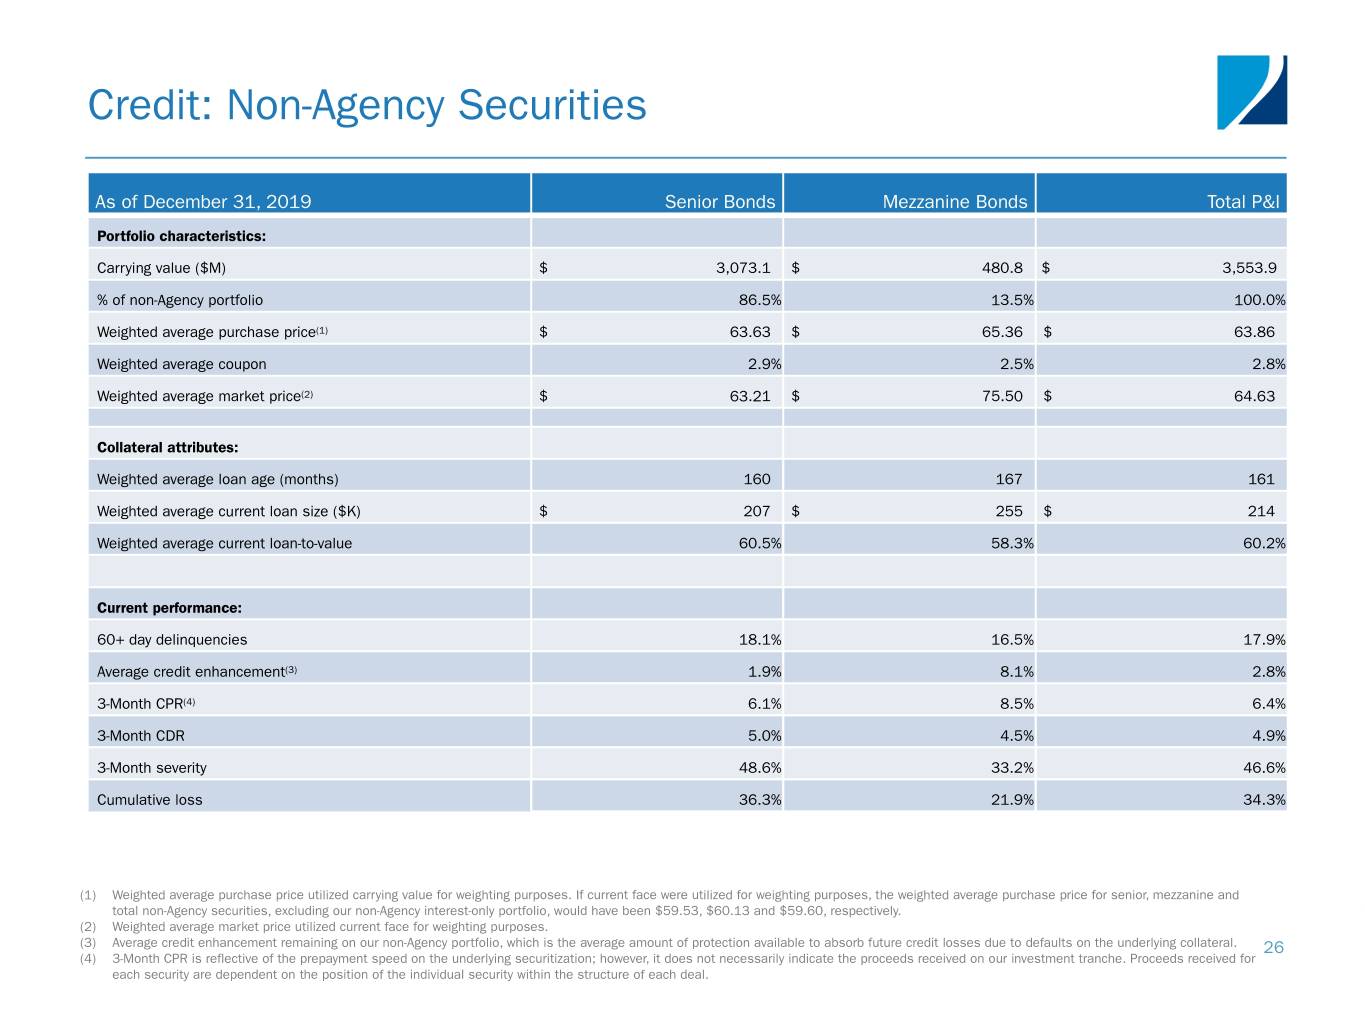
Credit: Non-Agency Securities As of December 31, 2019 Senior Bonds Mezzanine Bonds Total P&I Portfolio characteristics: Carrying value ($M) $ 3,073.1 $ 480.8 $ 3,553.9 % of non-Agency portfolio 86.5% 13.5% 100.0% Weighted average purchase price(1) $ 63.63 $ 65.36 $ 63.86 Weighted average coupon 2.9% 2.5% 2.8% Weighted average market price(2) $ 63.21 $ 75.50 $ 64.63 Collateral attributes: Weighted average loan age (months) 160 167 161 Weighted average current loan size ($K) $ 207 $ 255 $ 214 Weighted average current loan-to-value 60.5% 58.3% 60.2% Current performance: 60+ day delinquencies 18.1% 16.5% 17.9% Average credit enhancement(3) 1.9% 8.1% 2.8% 3-Month CPR(4) 6.1% 8.5% 6.4% 3-Month CDR 5.0% 4.5% 4.9% 3-Month severity 48.6% 33.2% 46.6% Cumulative loss 36.3% 21.9% 34.3% (1) Weighted average purchase price utilized carrying value for weighting purposes. If current face were utilized for weighting purposes, the weighted average purchase price for senior, mezzanine and total non-Agency securities, excluding our non-Agency interest-only portfolio, would have been $59.53, $60.13 and $59.60, respectively. (2) Weighted average market price utilized current face for weighting purposes. (3) Average credit enhancement remaining on our non-Agency portfolio, which is the average amount of protection available to absorb future credit losses due to defaults on the underlying collateral. 26 (4) 3-Month CPR is reflective of the prepayment speed on the underlying securitization; however, it does not necessarily indicate the proceeds received on our investment tranche. Proceeds received for each security are dependent on the position of the individual security within the structure of each deal.
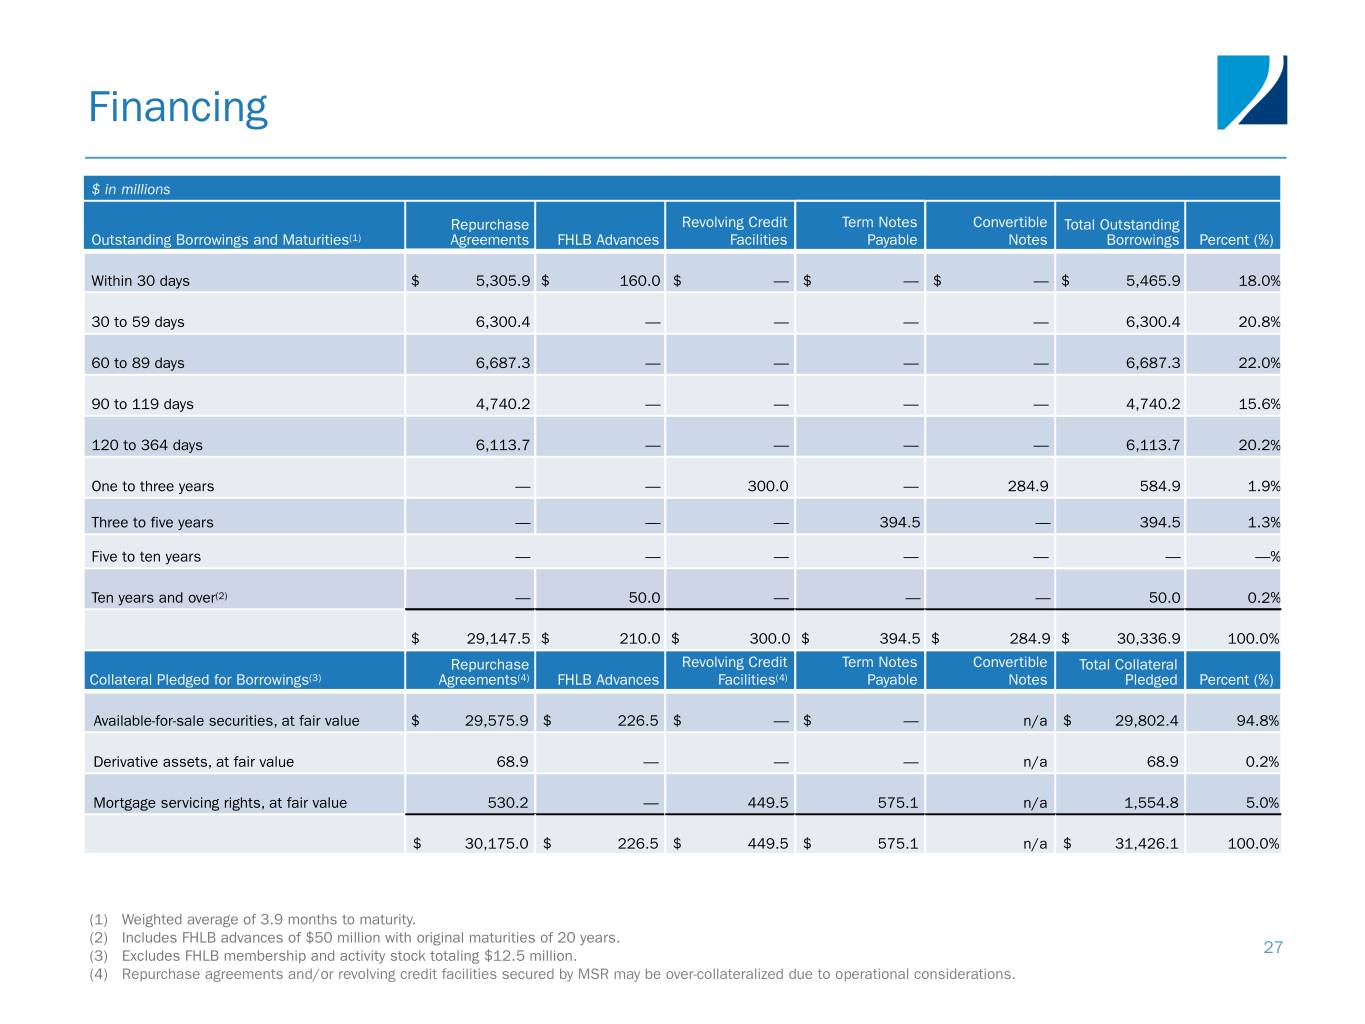
Financing $ in millions Repurchase Revolving Credit Term Notes Convertible Total Outstanding Outstanding Borrowings and Maturities(1) Agreements FHLB Advances Facilities Payable Notes Borrowings Percent (%) Within 30 days $ 5,305.9 $ 160.0 $ — $ — $ — $ 5,465.9 18.0% 30 to 59 days 6,300.4 — — — — 6,300.4 20.8% 60 to 89 days 6,687.3 — — — — 6,687.3 22.0% 90 to 119 days 4,740.2 — — — — 4,740.2 15.6% 120 to 364 days 6,113.7 — — — — 6,113.7 20.2% One to three years — — 300.0 — 284.9 584.9 1.9% Three to five years — — — 394.5 — 394.5 1.3% Five to ten years — — — — — — —% Ten years and over(2) — 50.0 — — — 50.0 0.2% $ 29,147.5 $ 210.0 $ 300.0 $ 394.5 $ 284.9 $ 30,336.9 100.0% Repurchase Revolving Credit Term Notes Convertible Total Collateral Collateral Pledged for Borrowings(3) Agreements(4) FHLB Advances Facilities(4) Payable Notes Pledged Percent (%) Available-for-sale securities, at fair value $ 29,575.9 $ 226.5 $ — $ — n/a $ 29,802.4 94.8% Derivative assets, at fair value 68.9 — — — n/a 68.9 0.2% Mortgage servicing rights, at fair value 530.2 — 449.5 575.1 n/a 1,554.8 5.0% $ 30,175.0 $ 226.5 $ 449.5 $ 575.1 n/a $ 31,426.1 100.0% (1) Weighted average of 3.9 months to maturity. (2) Includes FHLB advances of $50 million with original maturities of 20 years. (3) Excludes FHLB membership and activity stock totaling $12.5 million. 27 (4) Repurchase agreements and/or revolving credit facilities secured by MSR may be over-collateralized due to operational considerations.
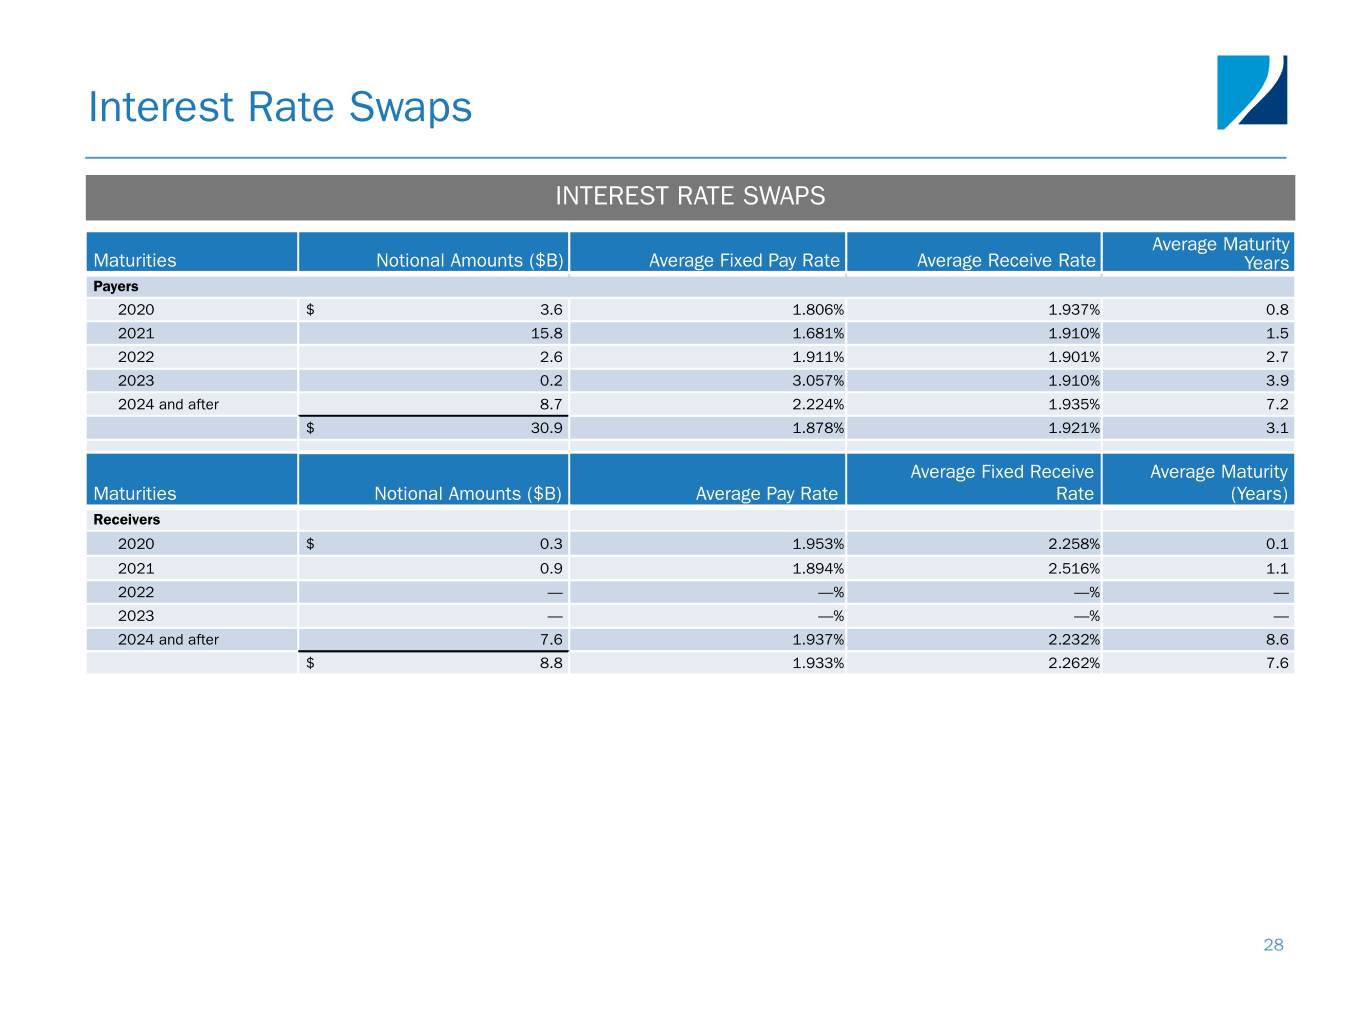
Interest Rate Swaps INTEREST RATE SWAPS Average Maturity Maturities Notional Amounts ($B) Average Fixed Pay Rate Average Receive Rate Years Payers 2020 $ 3.6 1.806% 1.937% 0.8 2021 15.8 1.681% 1.910% 1.5 2022 2.6 1.911% 1.901% 2.7 2023 0.2 3.057% 1.910% 3.9 2024 and after 8.7 2.224% 1.935% 7.2 $ 30.9 1.878% 1.921% 3.1 Average Fixed Receive Average Maturity Maturities Notional Amounts ($B) Average Pay Rate Rate (Years) Receivers 2020 $ 0.3 1.953% 2.258% 0.1 2021 0.9 1.894% 2.516% 1.1 2022 — —% —% — 2023 — —% —% — 2024 and after 7.6 1.937% 2.232% 8.6 $ 8.8 1.933% 2.262% 7.6 28
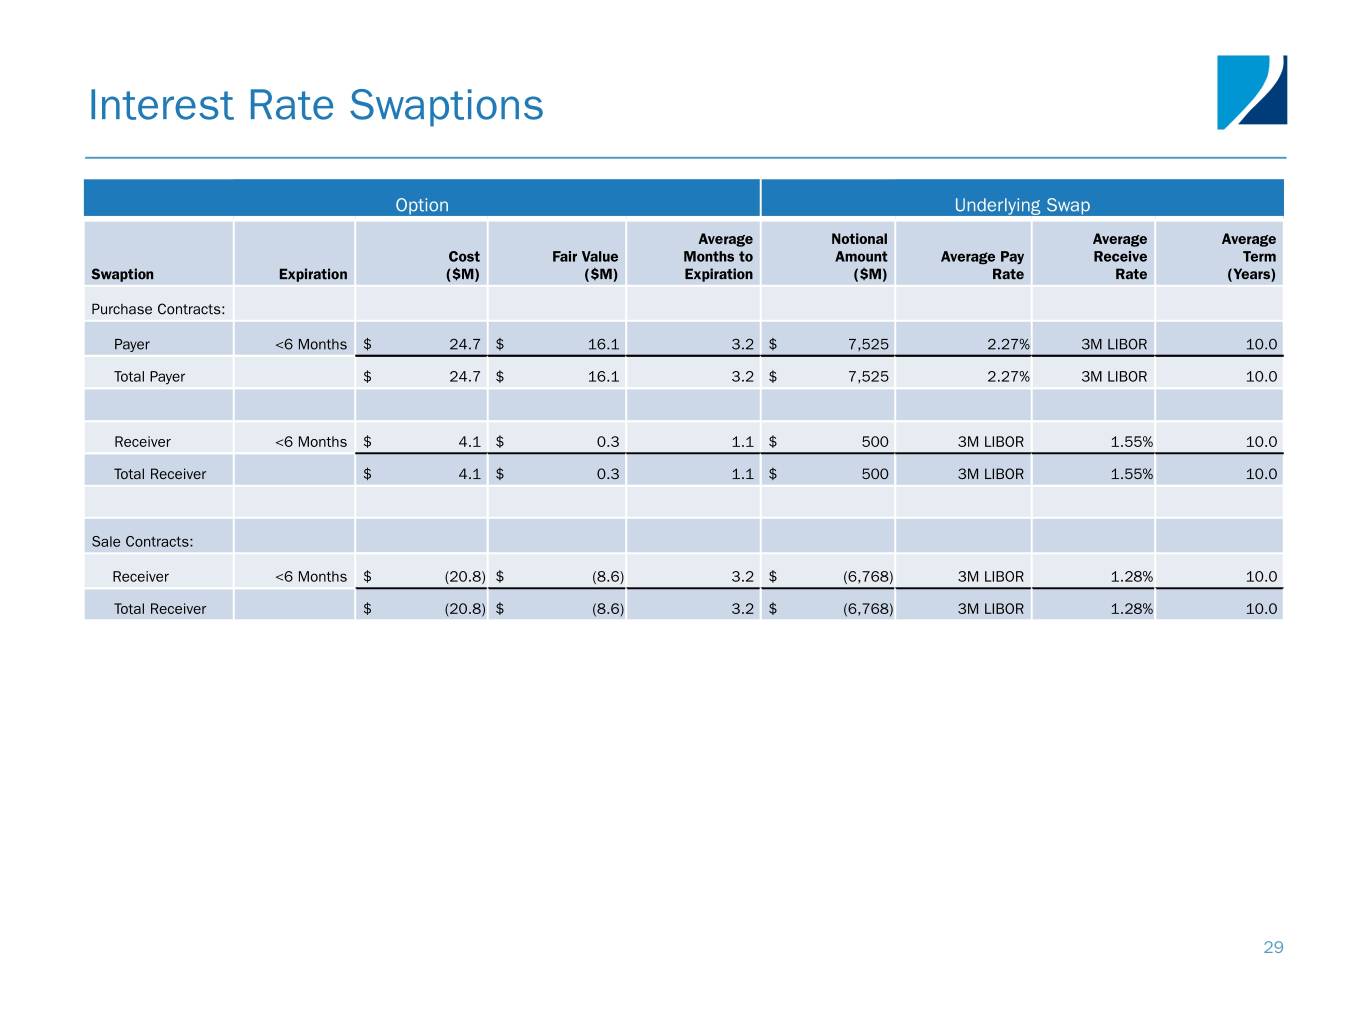
Interest Rate Swaptions Option Underlying Swap Average Notional Average Average Cost Fair Value Months to Amount Average Pay Receive Term Swaption Expiration ($M) ($M) Expiration ($M) Rate Rate (Years) Purchase Contracts: Payer <6 Months $ 24.7 $ 16.1 3.2 $ 7,525 2.27% 3M LIBOR 10.0 Total Payer $ 24.7 $ 16.1 3.2 $ 7,525 2.27% 3M LIBOR 10.0 Receiver <6 Months $ 4.1 $ 0.3 1.1 $ 500 3M LIBOR 1.55% 10.0 Total Receiver $ 4.1 $ 0.3 1.1 $ 500 3M LIBOR 1.55% 10.0 Sale Contracts: Receiver <6 Months $ (20.8) $ (8.6) 3.2 $ (6,768) 3M LIBOR 1.28% 10.0 Total Receiver $ (20.8) $ (8.6) 3.2 $ (6,768) 3M LIBOR 1.28% 10.0 29