
UTZ 8-K
Utz Brands, Inc. (UTZ)
8-K
2025-10-30
For: 2025-10-30
View Original
Added on
April 12, 2026
UNITED STATES
SECURITIES AND EXCHANGE COMMISSION
Washington, D.C. 20549
FORM 8-K
CURRENT REPORT
PURSUANT TO SECTION 13 OR 15(d) OF THE
SECURITIES EXCHANGE ACT OF 1934
Date of Report (Date of earliest event reported): October 30, 2025
(Exact name of registrant as specified in its charter)
| (State or other jurisdiction of incorporation) | (Commission File Number) | (IRS Employer Identification No.) | ||||||||||||
(Address of principal executive offices, including zip code)
Registrant’s telephone number, including area code: (717 ) 637-6644
(Former name or former address, if changed since last report)
Check the appropriate box below if the Form 8-K filing is intended to simultaneously satisfy the filing obligation of the registrant under any of the following provisions:
Securities registered pursuant to Section 12(b) of the Act:
| Title of each class | Trading Symbol(s) | Name of each exchange on which registered | ||||||||||||
| Class A Common Stock, par value $0.0001 per share | UTZ | New York Stock Exchange | ||||||||||||
Indicate by check mark whether the registrant is an emerging growth company as defined in Rule 405 of the Securities Act of 1933 (§230.405 of this chapter) or Rule 12b-2 of the Securities Exchange Act of 1934 (§240.12b-2 of this chapter).
Emerging growth company ☐
If an emerging growth company, indicate by check mark if the registrant has elected not to use the extended transition period for complying with any new or revised financial accounting standards provided pursuant to Section 13(a) of the Exchange Act. ☐
Item 2.02 Results of Operations and Financial Condition.
On October 30, 2025, Utz Brands, Inc. (NYSE: UTZ) (the “Company”) announced via press release the Company’s financial results for the fiscal quarter ended September 28, 2025. A copy of the Company’s press release is being furnished as Exhibit 99.1 to this Current Report on Form 8-K and is hereby incorporated by reference into this Item 2.02. The information and exhibit contained in this Item 2.02 is being furnished and shall not be deemed “filed” for purposes of Section 18 of the Securities Exchange Act of 1934, as amended (the “Exchange Act”), nor shall it be incorporated by reference into any filing under the Securities Act of 1933, as amended (the “Securities Act”), except as shall be expressly set forth by specific reference in such filing.
Item 7.01 Regulation FD Disclosure.
The Company will hold a conference call and webcast on October 30, 2025 (see information in the press release and under “Events & Presentations” of the Company’s website https://investors.utzsnacks.com). A copy of the slide materials to be discussed during the conference call and webcast is being furnished pursuant to Regulation FD as Exhibit 99.2 to this Current Report on Form 8-K and is hereby incorporated by reference into this Item 7.01. A copy of the slide materials has also been posted to the Company’s website at https://investors.utzsnacks.com. The information and exhibit contained in this Item 7.01 is being furnished and shall not be deemed “filed” for purposes of Section 18 of the Exchange Act, nor shall it be incorporated by reference into any filing under the Securities Act, except as shall be expressly set forth by specific reference in such filing.
Item 9.01 Financial Statements and Exhibits.
(d) Exhibits
| Exhibit No. | Description | ||||
| 104 | Cover Page Interactive Data File (embedded within the Inline XBRL document). | ||||
SIGNATURE
Pursuant to the requirements of the Securities Exchange Act of 1934, the registrant has duly caused this report to be signed on its behalf by the undersigned hereunto duly authorized.
Utz Brands, Inc.
Date: October 30, 2025
By: /s/ William J. Kelley Jr.
Name: William J. Kelley Jr.
Title: Executive Vice President,
Chief Financial Officer
Utz Brands Reports Third Quarter 2025 Results
Raises Organic Net Sales Growth Guidance and Announces California Expansion
Hanover, PA – October 30, 2025 – Utz Brands, Inc. (NYSE: UTZ) (“Utz” or the “Company”), a leading U.S. manufacturer of branded Salty Snacks and a small-cap growth and value Staples equity, today reported financial results for the Company’s third fiscal quarter ended September 28, 2025.
3Q’25 Summary(1)
•Net Sales increased 3.4% to $377.8 million
•Total Organic Net Sales increased 3.4%; Branded Salty Snacks Organic Net Sales increased 5.8%
•Gross Profit Margin decline of 220bps
•Adjusted Gross Profit Margin expansion of 210bps
•Net Income decreased to $(20.2) million
•Adjusted Net Income increased 13.2% to $33.5 million
•EBITDA decreased 22.0% to $23.8 million
•Adjusted EBITDA increased 11.7% to $60.3 million
•Diluted Earnings Per Share decreased to $(0.17)
•Adjusted Earnings Per Share increased 9.5% to $0.23
(1) All comparisons for the third quarter of 2025 are to the third quarter of 2024 (ended September 29, 2024).
“Utz delivered another quarter of strong performance, demonstrating both top-line and adjusted earnings growth,” said Howard Friedman, Chief Executive Officer of Utz. “We achieved Net Sales growth of 3.4%(1), Branded Salty Snacks Organic Net Sales growth of 5.8%(1), and gained both dollar and volume share in the Salty Snacks category, marking our ninth consecutive quarter of volume share growth. The various productivity initiatives across the organization are significantly contributing to our margin.”
“Today, we are also announcing plans to expand our presence in California. With California representing the nation’s largest salty snack market at $4.1 billion, we see substantial white space for our brands. As part of an expanded California strategy, we have acquired select distribution assets in the state to provide us with the infrastructure and capabilities to accelerate our market penetration. We’re confident that these assets will complement our Westward expansion strategy, bringing our portfolio of beloved brands to even more California customers.”
“We are raising our 2025 Organic Net Sales outlook again to reflect stronger revenue trends through the third quarter and our confidence in the remainder of the year,” said BK Kelley, EVP and Chief Financial Officer of Utz. “We now expect Organic Net Sales growth of approximately 3%, driven by our advantaged portfolio of brands and expansion geographies. We believe our various working capital initiatives, in combination with Adjusted EBITDA growth, will contribute significantly to our deleveraging efforts as we finish the year. Looking forward, as we move past our multi-year capex investments, free cash flow will be a key priority at Utz. We remain focused on executing our proven playbook: strengthening our Power Four Brands, expanding our geographic footprint, and leveraging our operational efficiencies to deliver sustained top and bottom-line results and long-term shareholder value.”
Third Quarter 2025 Results
Third quarter Net Sales increased 3.4% to $377.8 million compared to $365.5 million in the prior year period. Organic Net Sales also increased 3.4% year-over-year, driven by a favorable volume/mix contribution of 4.5%. This was partially
offset by lower net price realization of (1.1)%. Branded Salty Snacks Organic Net Sales(3) (representing 89% of total Net Sales) increased 5.8% led by our Power Four Brands, offset by a 13.1% decline in Non-Branded & Non-Salty Snacks Organic Net Sales(3), primarily due to a decline in Partner Brands and Dips & Salsas.
For the 13-week period ended September 28, 2025, the Company’s Branded Salty Snacks Retail Sales increased 4.8% versus the prior year period, outperforming the 0.2% decline for the Salty Snack category overall(3). The Company’s Retail Volumes increased by 3% compared to a 1.2% decline for the Salty Snack category, and the Company drove Retail Sales and Retail Volume share gains in both its Core and Expansion Geographies(2)(3). The Company’s Power Four Brands of Utz®, On The Border®, Zapp’s® and Boulder Canyon® Retail Sales increased by 7.1%.
Gross Profit Margin of 33.6% declined 220bps compared to 35.8% in the prior year period. Adjusted Gross Profit Margin of 41.1% expanded 210bps compared to 39.0% in the prior year period. The increase in Adjusted Gross Profit Margin was driven by productivity savings, which more than offset increased investments to support capacity expansion and supply chain cost inflation.
Selling, Distribution, and Administrative Expenses (“SD&A Expenses”) were $123.1 million, or 32.6% of Net Sales, compared to $110.0 million, or 30.1% of Net Sales, in the prior year period. Adjusted SD&A Expenses were $93.8 million, or 24.8% of Net Sales, compared to $88.7 million, or 24.3% of Net Sales, in the prior year period. The increase in both SD&A Expenses and Adjusted SD&A Expenses as a percentage of Net Sales were primarily due to adding capabilities, selling, and delivery costs to support the Company’s geographic expansion and growth initiatives.
The Company reported Net (Loss) Income of $(20.2) million compared to Net Income of $0.8 million in the prior year period. Adjusted Net Income in the quarter increased 13.2% to $33.5 million compared to $29.6 million in the prior year period. Adjusted Earnings Per Share increased 9.5% to $0.23 compared to $0.21 in the prior year period. The Adjusted Earnings Per Share increase in the third quarter was the result of higher Adjusted Net Income, driven by an increase in Adjusted EBITDA and lower interest expense, partially offset by an increase in depreciation and amortization.
The Company reported EBITDA of $23.8 million compared to EBITDA of $30.5 million in the prior year period. Adjusted EBITDA increased 11.7% to $60.3 million, or 16.0% as a percentage of Net Sales, compared to $54.0 million, or 14.8% as a percentage of Net Sales, in the prior year period. The increase in Adjusted EBITDA was driven by Adjusted Gross Profit Margin expansion, which more than offset the increase in Adjusted SD&A expenses.
(1) Versus prior year period.
(2) As measured by Circana MULO+ w/convenience.
(3) See “Other Defined Terms” for definitions.
Balance Sheet and Cash Flow Highlights
•As of September 28, 2025
◦Total liquidity of $197.7 million, consisting of cash on hand of $57.7 million and $140.0 million available under the Company’s revolving credit facility.
◦Net debt of $807.9 million resulting in a Net Leverage Ratio of 3.9x based on trailing twelve months Normalized Adjusted EBITDA of $207.2 million.
•For the thirty-nine weeks ended September 28, 2025
◦Cash flow provided by operations was $47.3 million.
◦Capital expenditures were $89.2 million, and dividends and distributions paid were $28.8 million.
Acquisition of California DSD Network
As part of our California expansion strategy, Utz is announcing the acquisition of Insignia International’s (“Insignia”) direct store delivery (“DSD”) distribution assets. The transaction includes DSD routes across California and the Midwest, along with select related assets. This acquisition accelerates Utz’s expansion in California, a key growth geography that represents the largest U.S. market for salty snacks with $4.1 billion in retail sales. The Company currently generates approximately $79 million in retail sales across California, representing 1.9% market share. Expanding distribution in
California creates a significant opportunity for growth when compared to our current Expansion Geography average of 3.0% and our Core Geography average of 6.6%.The financial impact of this acquisition is included in the Company’s fiscal 2025 outlook.
Fiscal Year 2025 Outlook
The Company is updating its 2025 fiscal year outlook to reflect stronger top-line trends, while reaffirming other guidance. The Company now expects:
•Organic Net Sales growth of approximately 3%, compared to the prior expectation of 2.5% or better. Utz expects Organic Net Sales growth will be led by Branded Salty Snacks Organic Net Sales growth, particularly the Power Four Brands
The Company is re-affirming:
•Adjusted EBITDA growth of 7% to 10%. The Company expects Adjusted EBITDA Margin expansion of approximately 100bps, which is consistent with the Company’s previously provided guidance. Utz expects Adjusted EBITDA Margin expansion will be led by Adjusted Gross Profit Margin expansion fueled by strong productivity cost savings and improved product mix; and
•Adjusted Earnings Per Share growth of 7% to 10%
Key assumptions for the Company’s fiscal 2025 outlook include the following, all consistent with the most recently provided outlook:
•An effective tax rate (normalized GAAP basis tax expense, which excludes one-time items) in the range of 17% to 19%;
•Interest Expense of approximately $46 million;
•Capital Expenditures of approximately $100 million, with the majority focused on building increased supply chain network capabilities and delivering accelerated productivity savings; and
•Net Leverage Ratio approaching 3x at fiscal year-end 2025.
Quantitative reconciliations are not available for the forward-looking non-GAAP financial measures used herein without unreasonable efforts due to the high variability, complexity, and low visibility with respect to certain items which are excluded from Organic Net Sales, Adjusted EBITDA, Net Leverage Ratio, normalized GAAP basis tax expense, excluding one-time items, and Adjusted Earnings Per Share, respectively. We expect the variability of these items to have a potentially unpredictable, and potentially significant, impact on our future financial results.
Conference Call and Webcast Presentation
The Company has also posted a pre-recorded management discussion of its third quarter results to its website at https://investors.utzsnacks.com. In addition, the Company will host a live question and answer session with analysts at 9:30 a.m. Eastern Time today. Please visit the “Events & Presentations” section of Utz’s Investor Relations website at https://investors.utzsnacks.com to access the live listen-only webcast. Participants can also dial in over the phone by calling 1-888-596-4144. The Event Plus passcode is 3860587. The Company has also posted presentation slides and additional supplemental financial information, which are available now on Utz’s Investor Relations website.
About Utz Brands, Inc.
Utz Brands, Inc. (NYSE: UTZ) manufactures a diverse portfolio of savory snacks through popular brands, including Utz®, On The Border® Chips & Dips, Zapp’s®, and Boulder Canyon®, among others.
After over a century with a strong family heritage, Utz continues to have a passion for exciting and delighting consumers with delicious snack foods made from top-quality ingredients. Utz's products are distributed nationally through grocery, mass merchandisers, club, convenience, drug, and other channels. Based in Hanover, Pennsylvania, Utz has multiple manufacturing facilities located across the U.S. to serve our growing customer base. For more information, please visit the Company’s website or call 1‐800‐FOR‐SNAX.
Investors and others should note that Utz announces material financial information to its investors using its Investor Relations website, U.S. Securities and Exchange Commission (the “Commission”) filings, press releases, public conference calls, and webcasts. Utz uses these channels, as well as social media, to communicate with our stockholders and the public about the Company, the Company’s products, and other Company information. It is possible that the information that Utz posts on social media could be deemed to be material information. Therefore, Utz encourages investors, the media, and others interested in the Company to review the information posted on the social media channels listed on Utz’s Investor Relations website.
Investor Contact
Trevor Martin
Utz Brands, Inc.
Media Contact
Colleen Farley
Utz Brands, Inc.
Forward-Looking Statements
This press release includes certain statements made herein that are not historical facts but are “forward-looking statements” within the meaning of the “safe harbor” provisions of the Private Securities Litigation Reform Act of 1995, as amended. The forward-looking statements generally are accompanied by or include, without limitation, statements such as “may,” “can,” “should,” “will,” “estimate,” “plan,” “project,” "forecast,” "intend,” "expect,” “anticipate,” “believe,” “seek,” “target” “goal”, “on track” or other similar words, phrases or expressions. These forward-looking statements include future plans for the Company, including outlook for fiscal 2025, plans related to the transformation of the Company’s supply chain, the Company’s product mix, the Company’s expectations regarding its level of indebtedness and associated interest expense impacts; the estimated or anticipated future results and benefits of the Company’s future plans and operations; the Company’s cost savings plans and the Company’s logistics optimization efforts; the estimated or anticipated future results and benefits of the Company’s plans and operations; the effects of tariffs, inflation or supply chain disruptions on the Company or its business; the benefits of the Company’s productivity initiatives; the effects of the Company’s marketing and innovation initiatives; the Company’s future capital structure; future opportunities for the Company’s growth; statements regarding the Company’s projected balance sheet and liabilities, including net leverage; and other statements that are not historical facts.
These statements are based on the current expectations of the Company’s management and are not predictions of actual performance. These statements are subject to a number of risks and uncertainties and the Company’s business and actual results may differ materially. Some factors that could cause actual results to differ include, without limitation: our operation in an industry with high levels of competition and consolidation; our reliance on key customers and ability to obtain favorable contractual terms and protections with customers; changes in demand for our products driven by changes in consumer preferences and tastes or our ability to innovate or market our products effectively; changes in consumers’ loyalty to our brands due to factors beyond our control; impacts on our reputation caused by concerns relating to the quality and safety of our products, ingredients, packaging, or processing techniques; the potential that our products might need to be recalled if they become adulterated or are mislabeled; the loss of retail shelf space and disruption to sales of food products due to changes in retail distribution arrangements; our reliance on third parties to effectively operate both our direct-to-warehouse delivery system and our direct-store-delivery network system; the evolution of e-commerce retailers and sales channels; disruption to our manufacturing operations, supply chain, or
distribution channels; the effects of inflation, including rising labor costs; shortages of raw materials, energy, water, and other supplies; changes in the legal and regulatory environments in which we operate, including with respect to tax legislation such as the One Big Beautiful Bill Act; potential liabilities and costs from litigation, claims, legal or regulatory proceedings, inquiries, or investigations into our business; potential adverse effects or unintended consequences related to the implementation of our growth strategy; our ability to successfully identify and execute acquisitions or dispositions and to manage integration or carve out issues following such transactions; the geographic concentration of our markets; our ability to attract and retain highly skilled personnel (including risks associated with our recently announced executive leadership transition); impairment in the carrying value of goodwill or other intangible assets; our ability to protect our intellectual property rights; disruptions, failures, or security breaches of our information technology infrastructure; climate change or legal, regulatory or market measures to address climate change; our exposure to liabilities, claims or new laws or regulations with respect to environmental matters; the increasing focus and opposing views, legislation and expectations with respect to ESG initiatives; restrictions on our operations imposed by covenants in our debt instruments; our exposure to changes in interest rates; adverse impacts from disruptions in the worldwide financial markets, including on our ability to obtain new credit; our exposure to any new or increased income or product taxes; pandemics, epidemics or other disease outbreaks; our exposure to changes to trade policies and tariff and import/export regulations by the United States and other jurisdictions; potential volatility in our Class A Common Stock caused by resales thereof; our dependence on distributions made by our subsidiaries; our payment obligations pursuant to a tax receivable agreement, which in certain cases may exceed the tax benefits we realize or be accelerated; provisions of Delaware law and our governing documents and other agreements that could limit the ability of stockholders to take certain actions or delay or discourage takeover attempts that stockholders may consider favorable; our exclusive forum provisions in our governing documents; the influence of certain significant stockholders and members of Utz Brands Holdings, LLC, whose interests may differ from those of our other stockholders; and other risks and uncertainties set forth in Part I, Item 1A “Risk Factors” in our Annual Report on Form 10-K for the year ended December 29, 2024 and in the other reports we file with the U.S. Securities and Exchange Commission from time to time.
Forward-looking statements provide the Company’s expectations, plans or forecasts of future events and views as of the date of this communication. These forward-looking statements should not be relied upon as representing the Company’s assessments as of any date subsequent to the date of this communication. The Company cautions investors not to place undue reliance upon any forward-looking statements, which speak only as of the date made. The Company does not undertake or accept any obligation or undertaking to release publicly any updates or revisions to any forward-looking statements to reflect any change in its expectations or any change in events, conditions, or circumstances on which any such statement is based, except as otherwise required by law.
Non-GAAP Financial Measures:
Utz uses non-GAAP financial information and believes it is useful to investors as it provides additional information to facilitate comparisons of historical operating results and identify trends in our underlying operating results, and it provides additional insight and transparency on how we evaluate the business. We use non-GAAP financial measures to budget, make operating and strategic decisions, and evaluate our performance. These non-GAAP financial measures do not represent financial performance in accordance with generally accepted accounted principles in the United States (“GAAP”) and may exclude items that are significant to understanding and assessing financial results. Therefore, these measures should not be considered in isolation or as an alternative to net income, cash flows from operations, earnings per share or other measures of profitability, liquidity, or performance under GAAP. You should be aware that the presentation of these measures may not be comparable to similarly titled measures used by other companies.
Management believes that non-GAAP financial measures should be considered as supplements to the GAAP measures reported, should not be considered replacements for, or superior to, the GAAP measures, and may not be comparable to similarly named measures used by other companies. The Company’s calculation of the non-GAAP financial measures may differ from methods used by other companies. We believe that these non-GAAP financial measures provide useful information to investors regarding certain financial and business trends relating to the financial condition and results of operations of the Company to date when considered with both the GAAP results and the reconciliations to the most comparable GAAP measures, and that the presentation of non-GAAP financial measures is useful to investors in the
evaluation of our operating performance compared to other companies in the Salty Snack industry, as similar measures are commonly used by the companies in this industry. These non-GAAP financial measures are subject to inherent limitations as they reflect the exercise of management judgment about which items of expense and income are excluded or included in determining these non-GAAP financial measures. The non-GAAP financial measures are not recognized in accordance with GAAP and should not be viewed as an alternative to GAAP measures. As new events or circumstances arise, these definitions could change. When the definitions change, we will provide the updated definitions and present the related non-GAAP historical results on a comparable basis.
Utz uses the following non-GAAP financial measures in its financial communications, and in the future could use others:
•Organic Net Sales
•Adjusted Gross Profit
•Adjusted Gross Profit as % of Net Sales (Adjusted Gross Profit Margin)
•Adjusted Selling, Distribution, and Administrative Expense
•Adjusted Selling, Distribution, and Administrative Expense as % of Net Sales (Adjusted Selling, Distribution, and Administrative Expense Margin)
•Adjusted Net Income
•Adjusted Earnings Per Share
•Adjusted Earnings Before Taxes
•EBITDA
•Adjusted EBITDA
•Adjusted EBITDA as % of Net Sales (Adjusted EBITDA Margin)
•Normalized Adjusted EBITDA
•Effective Normalized Tax Rate
•Net Leverage Ratio
•Adjusted COGS
•Branded Salty Snacks Organic Net Sales
•Non-Branded & Non-Salty Snacks Organic Net Sales
Organic Net Sales is defined as Net Sales excluding the impacts of acquisitions, divestitures and independent operator (“IO”) route conversions that took place after 1Q’2024.
Adjusted Gross Profit represents Gross Profit excluding Depreciation and Amortization expense, a non-cash item. In addition, Adjusted Gross Profit excludes the impact of costs that fall within the categories of non-cash adjustments and/or other cash adjustment items such as those related to stock-based compensation, hedging and purchase commitments adjustments, asset impairments, acquisition and integration costs, business transformation initiatives, and financing-related costs. Adjusted Gross Profit is one of the key performance indicators that our management uses to evaluate operating performance. We also report Adjusted Gross Profit as a percentage of Net Sales as an additional measure for investors to evaluate our Adjusted Gross Profit Margin.
Adjusted Selling, Distribution, and Administrative Expense is defined as all Selling, Distribution, and Administrative expense excluding Depreciation and Amortization expense, a non-cash item. In addition, Adjusted Selling, Distribution, and Administrative Expense excludes the impact of costs that fall within the categories of non-cash adjustments and/or other cash adjustment items such as those related to stock-based compensation, hedging and purchase commitments adjustments, asset impairments, acquisition and integration costs, business transformation initiatives, and financing-related costs. We also report Adjusted Selling, Distribution, and Administrative Expense as a percentage of Net Sales as an additional measure for investors to evaluate our Adjusted Selling, Distribution, and Administrative Margin.
Adjusted Net Income is defined as Net Income excluding Depreciation and Amortization expense, a non-cash item, related to fair value adjustments on property, plant, and equipment, and definite-lived intangibles relating to business combinations recorded in prior periods. In addition, Adjusted Net Income excludes deferred financing fees, interest income, and expense relating to IO loans and certain non-cash adjustments and/or other cash adjustment items such as
those related to stock-based compensation, hedging, and purchase commitments adjustments, asset impairments, acquisition and integration costs, business transformation initiatives, remeasurement of warrant liabilities and financing-related costs. Lastly, Adjusted Net Income normalizes the income tax provision to account for the above-mentioned adjustments.
Adjusted Earnings Before Taxes is defined as Adjusted Net Income before normalized GAAP basis tax expense.
Adjusted Earnings Per Share is defined as Adjusted Net Income divided by the weighted average shares outstanding for each period on a fully diluted basis, assuming the private placement warrants are net settled and the shares of Class V Common Stock of the Company are converted to Class A Common Stock of the Company.
EBITDA is defined as Net Income Before Interest, Income Taxes, and Depreciation and Amortization.
Adjusted EBITDA is defined as EBITDA further adjusted to exclude certain non-cash adjustments and/or other cash adjustment items, such as stock-based compensation, hedging and purchase commitments adjustments, asset impairments, acquisition and integration costs, business transformation initiatives, and financing-related costs. Adjusted EBITDA is one of the key performance indicators we use in evaluating our operating performance and in making financial, operating, and planning decisions. We believe Adjusted EBITDA is useful to the users of this release because the financial information contained in the release can be used in the evaluation of Utz’s operating performance compared to other companies in the Salty Snack industry, as similar measures are commonly used by companies in this industry. In this release, we also provide Adjusted EBITDA as a percentage of Net Sales as an additional measure for readers to evaluate our Adjusted EBITDA Margin.
Normalized Adjusted EBITDA is defined as Adjusted EBITDA after giving effect to pre-acquisition Adjusted EBITDA for certain acquisitions and dispositions from time to time.
Effective Normalized Tax Rate is defined as normalized GAAP basis tax expense, which excludes one-time items, divided by Adjusted Earnings before Taxes.
Net Leverage Ratio is defined as trailing twelve month Normalized Adjusted EBITDA divided by Net Debt. Net Debt is defined as Gross Debt less Cash and Cash Equivalents.
Other Defined Terms:
Branded Salty Snacks is defined as Power Four Brands and Other Brands. Power Four Brands consist of the Utz® brand, On The Border®, Zapp’s®, and Boulder Canyon®. Other Brands include Golden Flake®, TORTIYAHS!®, Hawaiian®, Bachman®, Tim’s Cascade®, Dirty Potato Chips®, TGI Fridays® and Vitner's®.
Non-Branded & Non-Salty Snacks is defined as partner brands, private label, co-manufacturing for which we are the manufacturer, Utz branded non-salty snacks such as On The Border® Dips and Salsa, and sales not attributable to specific brands.
Utz Brands, Inc.
CONSOLIDATED STATEMENTS OF OPERATIONS AND COMPREHENSIVE INCOME
For the thirteen weeks ended September 28, 2025 and September 29, 2024
(In millions, except share information)
(Unaudited)
| Thirteen weeks ended September 28, 2025 | Thirteen weeks ended September 29, 2024 | ||||||||||
| Net sales | $ | 377.8 | $ | 365.5 | |||||||
| Cost of goods sold | 250.9 | 234.5 | |||||||||
| Gross profit | 126.9 | 131.0 | |||||||||
| Selling, distribution, and administrative expenses | |||||||||||
| Selling and distribution | 88.4 | 80.1 | |||||||||
| Administrative | 34.7 | 29.9 | |||||||||
| Total selling, distribution, and administrative expenses | 123.1 | 110.0 | |||||||||
| Loss on sale of assets, net | (0.5) | (1.5) | |||||||||
| Income from operations | 3.3 | 19.5 | |||||||||
| Other loss, net | |||||||||||
| Interest expense | (10.6) | (12.6) | |||||||||
| Other income | 1.2 | 0.5 | |||||||||
| Loss on remeasurement of warrant liability | (0.7) | (6.4) | |||||||||
| Other loss, net | (10.1) | (18.5) | |||||||||
| (Loss) Income before taxes | (6.8) | 1.0 | |||||||||
| Income tax expense | 13.4 | 0.2 | |||||||||
| Net (loss) income | (20.2) | 0.8 | |||||||||
| Net loss (income) attributable to noncontrolling interest | 5.5 | (3.0) | |||||||||
| Net loss attributable to controlling interest | $ | (14.7) | $ | (2.2) | |||||||
Income per Class A Common stock: (in dollars) | |||||||||||
| Basic | $ | (0.17) | $ | (0.03) | |||||||
| Diluted | $ | (0.17) | $ | (0.03) | |||||||
| Weighted-average shares of Class A Common stock outstanding | |||||||||||
| Basic | 86,958,867 | 82,445,064 | |||||||||
| Diluted | 86,958,867 | 82,445,064 | |||||||||
| Net (loss) income | $ | (20.2) | $ | 0.8 | |||||||
| Other comprehensive loss: | |||||||||||
| Change in fair value of interest rate swap | (2.5) | (15.5) | |||||||||
| Comprehensive loss | (22.7) | (14.7) | |||||||||
| Net comprehensive loss attributable to noncontrolling interest | 6.5 | 3.4 | |||||||||
| Net comprehensive loss attributable to controlling interest | $ | (16.2) | $ | (11.3) | |||||||
Utz Brands, Inc.
CONSOLIDATED STATEMENTS OF OPERATIONS AND COMPREHENSIVE INCOME
For the thirty-nine weeks ended September 28, 2025 and September 29, 2024
(In millions, except share information)
(Unaudited)
| Thirty-nine weeks ended September 28, 2025 | Thirty-nine weeks ended September 29, 2024 | ||||||||||
| Net sales | $ | 1,096.6 | $ | 1,068.2 | |||||||
| Cost of goods sold | 724.7 | 692.9 | |||||||||
| Gross profit | 371.9 | 375.3 | |||||||||
| Selling, distribution, and administrative expenses | |||||||||||
| Selling and distribution | 251.5 | 227.5 | |||||||||
| Administrative | 104.3 | 96.5 | |||||||||
| Total selling, distribution, and administrative expenses | 355.8 | 324.0 | |||||||||
| (Loss) gain on sale of assets, net | (0.7) | 0.4 | |||||||||
| Income from operations | 15.4 | 51.7 | |||||||||
| Other (loss) income, net | |||||||||||
| Gain on sale of business | — | 44.0 | |||||||||
| Interest expense | (33.5) | (36.6) | |||||||||
| Loss on debt extinguishment | (0.5) | (1.3) | |||||||||
| Other income | 1.0 | 1.5 | |||||||||
| Gain (loss) on remeasurement of warrant liability | 22.8 | (5.3) | |||||||||
| Other (loss) income, net | (10.2) | 2.3 | |||||||||
| Income before taxes | 5.2 | 54.0 | |||||||||
| Income tax expense | 9.6 | 25.4 | |||||||||
| Net (loss) income | (4.4) | 28.6 | |||||||||
| Net loss (income) attributable to noncontrolling interest | 7.7 | (15.0) | |||||||||
| Net income attributable to controlling interest | $ | 3.3 | $ | 13.6 | |||||||
Income per Class A Common stock: (in dollars) | |||||||||||
| Basic | $ | 0.04 | $ | 0.17 | |||||||
| Diluted | $ | 0.04 | $ | 0.16 | |||||||
| Weighted-average shares of Class A Common stock outstanding | |||||||||||
| Basic | 86,266,184 | 81,763,848 | |||||||||
| Diluted | 87,795,006 | 84,948,754 | |||||||||
| Net (loss) income | $ | (4.4) | $ | 28.6 | |||||||
| Other comprehensive (loss) income: | |||||||||||
| Change in fair value of interest rate swap | (12.7) | (13.0) | |||||||||
| Comprehensive (loss) income | (17.1) | 15.6 | |||||||||
| Net comprehensive loss (income) attributable to noncontrolling interest | 12.7 | (9.6) | |||||||||
| Net comprehensive (loss) income attributable to controlling interest | $ | (4.4) | $ | 6.0 | |||||||
Utz Brands, Inc.
CONSOLIDATED BALANCE SHEETS
September 28, 2025 and December 29, 2024
(In millions, except per share information)
| As of September 28, 2025 | As of December 29, 2024 | ||||||||||
| (Unaudited) | |||||||||||
| ASSETS | |||||||||||
| Current Assets | |||||||||||
| Cash and cash equivalents | $ | 57.7 | $ | 56.1 | |||||||
| Accounts receivable, less allowance of $3.6 and $3.3, respectively | 133.3 | 119.9 | |||||||||
| Inventories | 112.9 | 101.4 | |||||||||
| Prepaid expenses and other assets | 24.4 | 35.3 | |||||||||
| Current portion of notes receivable | 5.1 | 4.6 | |||||||||
| Total current assets | 333.4 | 317.3 | |||||||||
| Non-current Assets | |||||||||||
| Assets held for sale | 6.7 | — | |||||||||
| Property, plant and equipment, net | 396.5 | 345.2 | |||||||||
| Goodwill | 870.7 | 870.7 | |||||||||
| Intangible assets, net | 973.0 | 996.5 | |||||||||
| Non-current portion of notes receivable | 10.5 | 9.2 | |||||||||
| Other assets | 185.8 | 189.5 | |||||||||
| Total non-current assets | 2,443.2 | 2,411.1 | |||||||||
| Total assets | $ | 2,776.6 | $ | 2,728.4 | |||||||
| LIABILITIES AND EQUITY | |||||||||||
| Current Liabilities | |||||||||||
| Current portion of term debt | $ | 25.9 | $ | 16.1 | |||||||
| Current portion of other notes payable | 7.2 | 6.9 | |||||||||
| Accounts payable | 172.2 | 151.0 | |||||||||
| Accrued expenses and other | 68.8 | 78.3 | |||||||||
| Current portion of warrant liability | — | 33.0 | |||||||||
| Total current liabilities | 274.1 | 285.3 | |||||||||
| Non-current portion of term debt and revolving credit facility | 824.8 | 752.5 | |||||||||
| Non-current portion of other notes payable | 15.8 | 15.0 | |||||||||
| Non-current accrued expenses and other | 170.0 | 164.2 | |||||||||
| Deferred tax liability | 129.8 | 123.7 | |||||||||
| Total non-current liabilities | 1,140.4 | 1,055.4 | |||||||||
| Total liabilities | 1,414.5 | 1,340.7 | |||||||||
| Commitments and Contingencies | |||||||||||
| Equity | |||||||||||
| Shares of Class A Common Stock, $0.0001 par value; 1,000,000,000 shares authorized; 87,509,774 and 83,537,542 shares issued and outstanding as of September 28, 2025 and December 29, 2024, respectively | — | — | |||||||||
| Shares of Class V Common Stock, $0.0001 par value; 61,249,000 shares authorized; 55,349,000 and 57,349,000 shares issued and outstanding as of September 28, 2025 and December 29, 2024, respectively | — | — | |||||||||
| Additional paid-in capital | 1,032.8 | 988.5 | |||||||||
| Accumulated deficit | (318.4) | (304.7) | |||||||||
| Accumulated other comprehensive income | 10.9 | 18.6 | |||||||||
| Total stockholders' equity | 725.3 | 702.4 | |||||||||
| Noncontrolling interest | 636.8 | 685.3 | |||||||||
| Total equity | 1,362.1 | 1,387.7 | |||||||||
| Total liabilities and equity | $ | 2,776.6 | $ | 2,728.4 | |||||||
Utz Brands, Inc.
CONSOLIDATED STATEMENTS OF CASH FLOWS
For the thirty-nine weeks ended September 28, 2025 and September 29, 2024
(In millions)
(Unaudited)
| Thirty-nine weeks ended September 28, 2025 | Thirty-nine weeks ended September 29, 2024 | ||||||||||
| Cash flows from operating activities | |||||||||||
| Net (loss) income | $ | (4.4) | $ | 28.6 | |||||||
| Adjustments to reconcile net (loss) income to net cash provided by operating activities: | |||||||||||
| Impairment and other charges | 0.6 | — | |||||||||
| Depreciation and amortization | 60.4 | 53.4 | |||||||||
| Gain on sale of business | — | (44.0) | |||||||||
| (Gain) loss on remeasurement of warrant liability | (22.8) | 5.3 | |||||||||
| Loss (gain) on sale of assets | 0.7 | (0.4) | |||||||||
| Loss on debt extinguishment | 0.5 | 1.3 | |||||||||
| Share-based compensation | 12.4 | 13.8 | |||||||||
| Deferred taxes | 6.1 | 4.1 | |||||||||
| Deferred financing costs | 1.0 | 2.8 | |||||||||
| Changes in assets and liabilities: | |||||||||||
| Accounts receivable, net | (13.4) | (6.3) | |||||||||
| Inventories | (11.5) | (4.8) | |||||||||
| Prepaid expenses and other assets | 2.5 | (23.7) | |||||||||
| Accounts payable and accrued expenses and other | 15.2 | 21.9 | |||||||||
| Net cash provided by operating activities | 47.3 | 52.0 | |||||||||
| Cash flows from investing activities | |||||||||||
| Purchases of property and equipment | (89.2) | (60.9) | |||||||||
| Purchases of intangibles | — | (9.2) | |||||||||
| Proceeds from sale of property and equipment | 0.9 | 26.1 | |||||||||
| Proceeds from sale of business | — | 167.5 | |||||||||
| Proceeds from sale of routes | 17.7 | 19.6 | |||||||||
| Proceeds from the sale of IO notes | 5.4 | 3.6 | |||||||||
| Purchases of IO routes and other changes in note receivables | (30.0) | (30.6) | |||||||||
| Net cash (used in) provided by investing activities | (95.2) | 116.1 | |||||||||
| Cash flows from financing activities | |||||||||||
| Borrowings on line of credit | 177.0 | 92.0 | |||||||||
| Repayments on line of credit | (156.5) | (69.6) | |||||||||
| Borrowings on term debt and notes payable | 81.4 | 25.3 | |||||||||
| Repayments on term debt and notes payable | (19.7) | (170.0) | |||||||||
| Payment of debt issuance cost | (1.7) | (0.7) | |||||||||
| Payments of tax withholding requirements for employee stock awards | (2.2) | (1.4) | |||||||||
| Dividends paid | (16.9) | (15.9) | |||||||||
| Distribution to noncontrolling interest | (11.9) | (14.9) | |||||||||
| Net cash provided by (used in) financing activities | 49.5 | (155.2) | |||||||||
| Net increase in cash and cash equivalents | 1.6 | 12.9 | |||||||||
| Cash and cash equivalents at beginning of period | 56.1 | 52.0 | |||||||||
| Cash and cash equivalents at end of period | $ | 57.7 | $ | 64.9 | |||||||
Reconciliation of Non-GAAP Financial Measures to Reported Financial Measures
(Amounts may not sum due to rounding)
Net Sales and Organic Net Sales
| 13-Weeks Ended | 39-Weeks Ended | |||||||||||||||||||||||||||||||||||||
| (dollars in millions) | September 28, 2025 | September 29, 2024 | Change | September 28, 2025 | September 29, 2024 | Change | ||||||||||||||||||||||||||||||||
| Net Sales as Reported | $ | 377.8 | $ | 365.5 | 3.4 | % | $ | 1,096.6 | $ | 1,068.2 | 2.7 | % | ||||||||||||||||||||||||||
| Impact of Dispositions | — | — | — | (4.3) | ||||||||||||||||||||||||||||||||||
Organic Net Sales (1) | $ | 377.8 | $ | 365.5 | 3.4 | % | $ | 1,096.6 | $ | 1,063.9 | 3.1 | % | ||||||||||||||||||||||||||
(1) Organic Net Sales excludes the Impact of Dispositions.
Net Sales Growth Drivers
| 13-Weeks Ended September 28, 2025 | 39-Weeks Ended September 28, 2025 | |||||||||||||||||||||||||||||||||||||
| (% change in prior year net sales) | Branded Salty Snacks (1) | Non-Branded & Non-Salty Snacks (2) | Total | Branded Salty Snacks (1) | Non-Branded & Non-Salty Snacks (2) | Total | ||||||||||||||||||||||||||||||||
| Net Sales as Reported | $ | 337.4 | $ | 40.4 | $ | 377.8 | $ | 965.4 | $ | 131.2 | $ | 1,096.6 | ||||||||||||||||||||||||||
| Net Sales as Reported Growth Versus Prior Year | 5.8 | % | (13.1) | % | 3.4 | % | 5.4 | % | (13.8) | % | 2.7 | % | ||||||||||||||||||||||||||
| Volume/mix | 7.0 | % | (12.7) | % | 4.5 | % | 7.4 | % | (10.5) | % | 4.8 | % | ||||||||||||||||||||||||||
| Pricing | (1.2) | (0.4) | (1.1) | (2.0) | (0.5) | (1.7) | ||||||||||||||||||||||||||||||||
| Organic Net Sales Growth Versus Prior Year | 5.8 | % | (13.1) | % | 3.4 | % | 5.4 | % | (11.0) | % | 3.1 | % | ||||||||||||||||||||||||||
| Divestiture | — | — | — | — | (2.8) | (0.4) | ||||||||||||||||||||||||||||||||
| Net Sales as Reported Growth Versus Prior Year | 5.8 | % | (13.1) | % | 3.4 | % | 5.4 | % | (13.8) | % | 2.7 | % | ||||||||||||||||||||||||||
(1) Branded Salty Snacks sales excluding IO unreported sales.
(2) Non-Branded & Non-Salty Snacks including IO unreported sales.
Gross Profit and Adjusted Gross Profit
| 13-Weeks Ended | 39-Weeks Ended | |||||||||||||||||||||||||
| (dollars in millions) | September 28, 2025 | September 29, 2024 | September 28, 2025 | September 29, 2024 | ||||||||||||||||||||||
| Gross Profit | $ | 126.9 | $ | 131.0 | $ | 371.9 | $ | 375.3 | ||||||||||||||||||
| Gross Profit as a % of Net Sales | 33.6 | % | 35.8 | % | 33.9 | % | 35.1 | % | ||||||||||||||||||
| Depreciation and Amortization | 8.5 | 6.6 | 25.5 | 20.5 | ||||||||||||||||||||||
Non-Cash and Other Cash Adjustments (1) | 19.8 | 5.1 | 38.4 | 9.7 | ||||||||||||||||||||||
| Adjusted Gross Profit | $ | 155.2 | $ | 142.7 | $ | 435.8 | $ | 405.5 | ||||||||||||||||||
| Adjusted Gross Profit as a % of Net Sales | 41.1 | % | 39.0 | % | 39.7 | % | 38.0 | % | ||||||||||||||||||
(1) Non-cash and other cash adjustments includes non-cash costs related to incentive programs, asset impairments and write-offs, purchase commitments, other non-cash items, acquisition, divestiture, and integration, business transformation initiatives, and financing-related costs.
Adjusted Selling, Distribution, and Administrative Expense
| 13-Weeks Ended | 39-Weeks Ended | |||||||||||||||||||||||||
| (dollars in millions) | September 28, 2025 | September 29, 2024 | September 28, 2025 | September 29, 2024 | ||||||||||||||||||||||
| Selling, Distribution, and Administrative Expense | $ | 123.1 | $ | 110.0 | $ | 355.8 | $ | 324.0 | ||||||||||||||||||
| Less: | ||||||||||||||||||||||||||
| Depreciation and Amortization in SD&A Expense | 11.9 | 10.9 | 34.9 | 32.9 | ||||||||||||||||||||||
| Non-Cash and Other Cash Adjustments (1) | 17.4 | 10.4 | 40.4 | 32.5 | ||||||||||||||||||||||
| Adjusted Selling, Distribution, and Administrative Expense | $ | 93.8 | $ | 88.7 | $ | 280.5 | $ | 258.6 | ||||||||||||||||||
| Adjusted SD&A Expense as a % of Net Sales | 24.8 | % | 24.3 | % | 25.6 | % | 24.2 | % | ||||||||||||||||||
(1) Non-cash and other cash adjustments includes non-cash costs related to incentive programs, asset impairments and write-offs, purchase commitments, other non-cash items, acquisition, divestiture, and integration, business transformation initiatives, and financing-related costs.
Adjusted Net Income
| 13-Weeks Ended | 39-Weeks Ended | |||||||||||||||||||||||||||||||||||||
| (dollars in millions, except per share data) | September 28, 2025 | September 29, 2024 | % Change | September 28, 2025 | September 29, 2024 | % Change | ||||||||||||||||||||||||||||||||
| Net (loss) Income | $ | (20.2) | $ | 0.8 | (2625.0) | % | $ | (4.4) | $ | 28.6 | (115.4) | % | ||||||||||||||||||||||||||
| Income Tax Expense | 13.4 | 0.2 | 9.6 | 25.4 | ||||||||||||||||||||||||||||||||||
| (Loss) lncome Before Taxes | (6.8) | 1.0 | 5.2 | 54.0 | ||||||||||||||||||||||||||||||||||
| Deferred Financing Fees | 0.3 | 0.3 | 1.0 | 2.8 | ||||||||||||||||||||||||||||||||||
| Acquisition Step-Up Depreciation and Amortization | 10.8 | 10.7 | 32.9 | 33.0 | ||||||||||||||||||||||||||||||||||
| Certain Non-Cash Adjustments | 7.3 | 6.2 | 19.4 | 15.1 | ||||||||||||||||||||||||||||||||||
| Acquisitions, Divestitures and Investments | 8.1 | 2.8 | 25.1 | (34.5) | ||||||||||||||||||||||||||||||||||
| Business Transformation Initiatives | 20.1 | 8.1 | 34.6 | 18.4 | ||||||||||||||||||||||||||||||||||
| Financing-Related Costs | 0.3 | — | 1.1 | 0.3 | ||||||||||||||||||||||||||||||||||
| Loss (gain) on Remeasurement of Warrant Liability | 0.7 | 6.4 | (22.8) | 5.3 | ||||||||||||||||||||||||||||||||||
Other Non-Cash and/or Cash Adjustments (1) | 47.6 | 34.5 | 91.3 | 40.4 | ||||||||||||||||||||||||||||||||||
| Adjusted Earnings before Taxes | 40.8 | 35.5 | 96.5 | 94.4 | ||||||||||||||||||||||||||||||||||
| Taxes on Earnings as Reported | (13.4) | (0.2) | (9.6) | (25.4) | ||||||||||||||||||||||||||||||||||
Income Tax Adjustments(2) | 6.1 | (5.7) | (7.4) | 8.9 | ||||||||||||||||||||||||||||||||||
| Adjusted Taxes on Earnings | (7.3) | (5.9) | (17.0) | (16.5) | ||||||||||||||||||||||||||||||||||
| Adjusted Net Income | $ | 33.5 | $ | 29.6 | 13.2 | % | $ | 79.5 | $ | 77.9 | 2.1 | % | ||||||||||||||||||||||||||
| Average Weighted Basic Shares Outstanding on an As-Converted Basis | 142.3 | 140.9 | 141.7 | 140.8 | ||||||||||||||||||||||||||||||||||
| Fully Diluted Shares on an As-Converted Basis | 143.6 | 144.1 | 143.2 | 144.0 | ||||||||||||||||||||||||||||||||||
| Adjusted Earnings Per Share | $ | 0.23 | $ | 0.21 | 9.5 | % | $ | 0.56 | $ | 0.54 | 3.7 | % | ||||||||||||||||||||||||||
(1) Non-cash and other cash adjustments includes non-cash costs related to incentive programs, asset impairments and write-offs, purchase commitments, other non-cash items, acquisitions, divestitures, and investments, business transformation initiatives, and financing-related costs.
(2) Income Tax Adjustment calculated as Income before taxes plus (i) Acquisition, Step-Up Depreciation and Amortization and (ii) Other non-cash and/or cash adjustments, multiplied by a normalized GAAP effective tax rate, minus the actual tax provision recorded in the Consolidated Statement of Operations and Comprehensive Income (Loss). The normalized GAAP effective tax rate excludes one-time items such as the impact of tax rate changes on deferred taxes and changes in valuation allowances.
Depreciation & Amortization
| 13-Weeks Ended | 39-Weeks Ended | |||||||||||||||||||||||||
| (dollars in millions) | September 28, 2025 | September 29, 2024 | September 28, 2025 | September 29, 2024 | ||||||||||||||||||||||
| Core D&A - Non-Acquisition-related included in Gross Profit | $ | 6.3 | $ | 4.5 | $ | 18.6 | $ | 13.7 | ||||||||||||||||||
| Step-Up D&A - Transaction-related included in Gross Profit | 2.2 | 2.1 | 6.9 | 6.8 | ||||||||||||||||||||||
| Depreciation & Amortization - included in Gross Profit | 8.5 | 6.6 | 25.5 | 20.5 | ||||||||||||||||||||||
| Core D&A - Non-Acquisition-related included in SD&A Expense | $ | 3.3 | 2.3 | $ | 8.9 | 6.7 | ||||||||||||||||||||
| Step-Up D&A - Transaction-related included in SD&A Expense | 8.6 | 8.6 | 26.0 | 26.2 | ||||||||||||||||||||||
| Depreciation & Amortization - included in SD&A Expense | 11.9 | 10.9 | 34.9 | 32.9 | ||||||||||||||||||||||
| Depreciation & Amortization - Total | $ | 20.4 | $ | 17.5 | $ | 60.4 | $ | 53.4 | ||||||||||||||||||
| Core Depreciation and Amortization | $ | 9.6 | $ | 6.8 | $ | 27.5 | $ | 20.4 | ||||||||||||||||||
| Step-Up Depreciation and Amortization | $ | 10.8 | 10.7 | $ | 32.9 | 33.0 | ||||||||||||||||||||
| Total Depreciation and Amortization | $ | 20.4 | $ | 17.5 | $ | 60.4 | $ | 53.4 | ||||||||||||||||||
EBITDA and Adjusted EBITDA
| 13-Weeks Ended | 39-Weeks Ended | |||||||||||||||||||||||||||||||||||||
| (dollars in millions) | September 28, 2025 | September 29, 2024 | % Change | September 28, 2025 | September 29, 2024 | % Change | ||||||||||||||||||||||||||||||||
| Net (Loss) Income | $ | (20.2) | $ | 0.8 | (2625.0) | % | $ | (4.4) | $ | 28.6 | (115.4) | % | ||||||||||||||||||||||||||
| Plus non-GAAP adjustments: | ||||||||||||||||||||||||||||||||||||||
| Income Tax Expense | 13.4 | 0.2 | 9.6 | 25.4 | ||||||||||||||||||||||||||||||||||
| Depreciation and Amortization | 20.4 | 17.5 | 60.4 | 53.4 | ||||||||||||||||||||||||||||||||||
| Interest Expense, Net | 10.6 | 12.6 | 33.5 | 36.6 | ||||||||||||||||||||||||||||||||||
Interest Income (IO loans)(1) | (0.4) | (0.6) | (1.4) | (1.5) | ||||||||||||||||||||||||||||||||||
| EBITDA | 23.8 | 30.5 | (22.0) | % | 97.7 | 142.5 | (31.4) | % | ||||||||||||||||||||||||||||||
Certain Non-Cash Adjustments(2) | 7.3 | 6.2 | 18.4 | 15.1 | ||||||||||||||||||||||||||||||||||
Acquisitions, Divestitures and Investments(3) | 8.1 | 2.8 | 25.1 | (34.5) | ||||||||||||||||||||||||||||||||||
Business Transformation Initiatives(4) | 20.1 | 8.1 | 34.6 | 18.4 | ||||||||||||||||||||||||||||||||||
Financing-Related Costs(5) | 0.3 | — | 1.1 | 0.3 | ||||||||||||||||||||||||||||||||||
Loss (gain) on Remeasurement of Warrant Liability(6) | 0.7 | 6.4 | (22.8) | 5.3 | ||||||||||||||||||||||||||||||||||
| Adjusted EBITDA | $ | 60.3 | $ | 54.0 | 11.7 | % | $ | 154.1 | $ | 147.1 | 4.8 | % | ||||||||||||||||||||||||||
| Net (loss) income as a % of Net Sales | (5.3) | % | 0.2 | % | (550) | bps | (0.4) | % | 2.7 | % | (310) | bps | ||||||||||||||||||||||||||
| Adjusted EBITDA as a % of Net Sales | 16.0 | % | 14.8 | % | 120 | bps | 14.1 | % | 13.8 | % | 30 | bps | ||||||||||||||||||||||||||
(1)Interest Income (IO loans) refers to interest income that we earn from IO notes receivable that has resulted from our initiatives to transition from RSP distribution to IO distribution ("Business Transformation Initiatives"). There is a notes payable recorded that mirrors most of the IO notes receivable, and the interest expense associated with the notes payable is part of the Interest Expense, Net adjustment.
(2)Certain Non-Cash Adjustments are comprised primarily of the following:
Incentive programs – The Company incurred $4.6 million and $4.7 million of share-based compensation expense for awards to employees and directors, and compensation expense associated with the Omnibus Equity Incentive Plan (the "OEIP") for the thirteen weeks ended September 28, 2025 and September 29, 2024, respectively. The Company incurred $10.8 million and $13.1 million of share-based compensation expense for awards to employees and directors, and compensation expense associated with the OEIP for the thirty-nine weeks ended September 28, 2025 and September 29, 2024, respectively.
Loss on impairment - The Company recorded an impairment charge of $0.6 million during the thirty-nine weeks ended September 28, 2025.
Purchase commitments and other adjustments – We have purchase commitments for specific quantities at fixed prices for certain of our products’ key ingredients. To facilitate comparisons of our underlying operating results, this adjustment was made to remove the volatility of purchase commitment related unrealized gains and losses. The adjustment related to purchase commitments and other adjustments, including cloud computing amortization, was expense of $2.7 million and $1.5 million for the thirteen weeks ended September 28, 2025 and September 29, 2024, respectively. The adjustment related to purchase commitments and other adjustments, including cloud computing amortization, was expense of $7.0 million and $2.0 million for the thirty-nine weeks ended September 28, 2025 and September 29, 2024, respectively.
(3)Acquisitions, Divestitures and Investments – This is comprised of start-up costs, consulting, transaction services, and legal fees incurred for acquisitions and certain potential acquisitions, in addition to expenses associated with integrating recent acquisitions and costs related to divestitures. These acquisitions and divestitures include assets related to our supply chain consolidation and transformation. Such expenses were $10.0 million and $2.8 million for the thirteen weeks ended September 28, 2025 and September 29, 2024, respectively; and $26.0 million and $9.5 million for the thirty-nine weeks ended September 28, 2025 and September 29, 2024, respectively. Also included in the thirteen weeks ended and thirty-nine weeks ended September 28, 2025 was income of $1.9 million and $0.9 million, respectively, related to the change in the liability associated with the Tax Receivable Agreement. Also, included in the thirty-nine weeks ended September 29, 2024 was a gain of $44.0 million related to the Good Health and R.W. Garcia Sale.
(4)Business Transformation Initiatives – This adjustment is related to start-up costs, consulting, professional and legal fees incurred for specific initiatives and structural changes to the business that do not reflect the cost of normal business operations. This adjustment also includes initiatives and structural changes related to our supply chain transformation. In addition, gains and losses realized from the sale of distribution rights to IOs and the subsequent disposal of trucks, severance costs associated with the elimination of RSP positions, and enterprise resource planning system transition costs fall into this category. The Company incurred such costs of $20.1 million and $8.1 million for the thirteen weeks ended September 28, 2025 and September 29, 2024, respectively; and $34.6 million and $18.4 million for the thirty-nine weeks ended September 28, 2025 and September 29, 2024, respectively.
(5)Financing-Related Costs – These costs include adjustments for various items related to raising debt and equity capital or debt extinguishment costs.
(6)Gains on Remeasurement of Warrant Liability - These liabilities are not expected to be settled in cash, and when exercised would result in a cash inflow to the Company with the warrants converting to Class A Common Stock with the liability being extinguished and the fair value of the warrants at the time of exercise being recorded as an increase to equity.
Normalized Adjusted EBITDA
| FY 2024 | FY 2025 | |||||||||||||||||||||||||||||||||||||||||||||||||||||||
| (dollars in millions) | Q1 | Q2 | Q3 | Q4 | FY 2024 | Q1 | Q2 | Q3 | TTM | |||||||||||||||||||||||||||||||||||||||||||||||
| Adjusted EBITDA | $ | 43.4 | $ | 49.7 | $ | 54.0 | $ | 53.1 | $ | 200.2 | $ | 45.1 | $ | 48.7 | $ | 60.3 | $ | 207.2 | ||||||||||||||||||||||||||||||||||||||
| Pre-Acquisition Adjusted EBITDA | — | — | — | — | — | — | — | — | — | |||||||||||||||||||||||||||||||||||||||||||||||
| Normalized Adjusted EBITDA | $ | 43.4 | $ | 49.7 | $ | 54.0 | $ | 53.1 | $ | 200.2 | $ | 45.1 | $ | 48.7 | $ | 60.3 | $ | 207.2 | ||||||||||||||||||||||||||||||||||||||
Net Debt and Leverage Ratio
| (dollars in millions) | As of September 28, 2025 | |||||||
| Term Loan | $ | 630.3 | ||||||
| Real Estate Loan | 57.7 | |||||||
| ABL Facility | 20.7 | |||||||
Equipment Loans and Finance Leases(1) | 156.9 | |||||||
Gross Debt(2) | 865.6 | |||||||
| Cash and Cash Equivalents | 57.7 | |||||||
| Total Net Debt | $ | 807.9 | ||||||
| Last 52-Weeks Normalized Adjusted EBITDA | $ | 207.2 | ||||||
Net Leverage Ratio(3) | 3.9x | |||||||
(1) Equipment loans and finance leases include leases accounted for as finance leases under US GAAP and loans for equipment.
(2) Includes Term Loan B, ABL Facility, Equipment Loans, and Finance Leases. Excludes amounts related to guarantees on IO loans which are collateralized by routes. The Company has the ability to recover substantially all of the outstanding IO loan value in the event of a default scenario, which historically has been uncommon.
(3) Based on trailing twelve month Normalized Adjusted EBITDA of $207.2 million.

Utz Brands, Inc. Third Quarter 2025 Earnings Presentation October 30, 2025
Disclaimer 2 Forward-Looking Statements Certain statements made herein are not historical facts but are “forward-looking statements” within the meaning of the “safe harbor” provisions of the Private Securities Litigation Reform Act of 1995, as amended. The forward-looking statements generally are accompanied by or include, without limitation, statements such as "may," "can," "should," "will," "estimate," "plan," "project," "forecast," "intend," "expect," "anticipate," "believe," "seek," "target," "goal," "on track," or other similar words, phrases or expressions. These forward-looking statements include future plans for Utz Brands, Inc. (“the Company”), including updated outlook for fiscal 2025, plans related to the transformation of the Company’s supply chain, the Company’s product mix, the Company's expectations regarding its level of indebtedness and associated interest expense impacts; the Company’s cost savings plans and the Company’s logistics optimization efforts; the estimated or anticipated future results and benefits of the Company’s plans and operations; the Company’s future capital structure; future opportunities for the Company; the effects of tariffs, inflation or supply chain disruptions on the Company or its business; statements regarding the Company’s project balance sheet and liabilities, including net leverage; and other statements that are not historical facts. These statements are based on the current expectations of the Company’s management and are not predictions of actual performance. These statements are subject to a number of risks and uncertainties, and the Company’s business and actual results may differ materially. Some factors that could cause actual results to differ include, without limitation: our operation in an industry with high levels of competition and consolidation; our reliance on key customers and ability to obtain favorable contractual terms and protections with customers; changes in demand for our products driven by changes in consumer preferences and tastes or our ability to innovate or market our products effectively; changes in consumers’ loyalty to our brands due to factors beyond our control; impacts on our reputation caused by concerns relating to the quality and safety of our products, ingredients, packaging, or processing techniques; the potential that our products might need to be recalled if they become adulterated or are mislabeled; the loss of retail shelf space and disruption to sales of food products due to changes in retail distribution arrangements; our reliance on third parties to effectively operate both our direct-to-warehouse delivery system and our direct- store-delivery network system; the evolution of e-commerce retailers and sales channels; disruption to our manufacturing operations, supply chain, or distribution channels; the effects of inflation, including rising labor costs; shortages of raw materials, energy, water, and other supplies; changes in the legal and regulatory environments in which we operate, including with respect to tax legislation such as the One Big Beautiful Bill Act; potential liabilities and costs from litigation, claims, legal or regulatory proceedings, inquiries, or investigations into our business; potential adverse effects or unintended consequences related to the implementation of our growth strategy; our ability to successfully identify and execute acquisitions or dispositions and to manage integration or carve out issues following such transactions; the geographic concentration of our markets; our ability to attract and retain highly skilled personnel (including risks associated with our recently announced executive leadership transition); impairment in the carrying value of goodwill or other intangible assets; our ability to protect our intellectual property rights; disruptions, failures, or security breaches of our information technology infrastructure; climate change or legal, regulatory or market measures to address climate change; our exposure to liabilities, claims or new laws or regulations with respect to environmental matters; the increasing focus and opposing views, legislation and expectations with respect to ESG initiatives; restrictions on our operations imposed by covenants in our debt instruments; our exposure to changes in interest rates; adverse impacts from disruptions in the worldwide financial markets, including on our ability to obtain new credit; our exposure to any new or increased income or product taxes; pandemics, epidemics or other disease outbreaks; our exposure to changes to trade policies and tariff and import/export regulations by the United States and other jurisdictions; potential volatility in our Class A Common Stock caused by resales thereof; our dependence on distributions made by our subsidiaries; our payment obligations pursuant to a tax receivable agreement, which in certain cases may exceed the tax benefits we realize or be accelerated; provisions of Delaware law and our governing documents and other agreements that could limit the ability of stockholders to take certain actions or delay or discourage takeover attempts that stockholders may consider favorable; our exclusive forum provisions in our governing documents; the influence of certain significant stockholders and members of Utz Brands Holdings, LLC, whose interests may differ from those of our other stockholders; and other risks and uncertainties set forth in Part I, Item 1A “Risk Factors” in our Annual Report on Form 10-K for the year ended December 29, 2024 and in the other reports we file with the U.S. Securities and Exchange Commission from time to time. These forward-looking statements should not be relied upon as representing the Company’s assessments as of any date subsequent to the date of this communication. The Company cautions investors not to place undue reliance upon any forward-looking statements, which speak only as of the date made. The Company does not undertake or accept any obligation or undertaking to release publicly any updates or revisions to any forward-looking statements to reflect any change in its expectations or any change in events, conditions or circumstances on which any such statement is based, except as otherwise required by law. Industry Information Unless otherwise indicated, information contained in this presentation or made orally during this presentation concerning the Company’s industry, competitive position and the markets in which it operates is based on information from independent research organizations, other third-party sources and management estimates. Management estimates are derived from publicly available information released by independent industry analysts and other third-party sources, as well as data from the Company’s internal research, and are based on assumptions made by the Company upon reviewing such data, and the Company’s experience in, and knowledge of, such industry and markets, which the Company believes to be reasonable. In addition, projections, assumptions and estimates of the future performance of the industry in which the Company operates, and the Company’s future performance are necessarily subject to uncertainty and risk due to a variety of factors, which could cause results to differ materially from those expressed in the estimates made by the independent parties and by the Company.
Disclaimer (cont.) 3 Trademarks This presentation may contain trademarks, service marks, trade names and copyrights of other companies, which are the property of their respective owners. Solely for convenience, some of the trademarks, service marks, trade names and copyrights referred to in this presentation may be listed without the TM, SM, © or ® symbols, but we will assert, to the fullest extent under applicable law, the rights of the applicable owners, if any, to these trademarks, service marks, trade names and copyrights. Projected Financial Information This presentation contains financial forecasts, which were prepared in good faith by the Company on a basis believed to be reasonable. Such financial forecasts have not been prepared in conformity with U.S. generally accepted accounting principles (“GAAP”). The Company’s independent auditors have not audited, reviewed, compiled or performed any procedures with respect to the projections for the purposes of their inclusion in this presentation, and accordingly, they have not expressed an opinion nor provided any other form of assurance with respect thereto for the purpose of this presentation. These projections are for illustrative purposes only and should not be relied upon as being necessarily indicative of future results. Certain of the above-mentioned projected information has been provided for purposes of providing comparisons with historical data. The assumptions and estimates underlying the prospective financial information are inherently uncertain and are subject to a wide variety of significant business, economic and competitive risks and uncertainties that could cause actual results to differ materially from those contained in the prospective financial information. Projections are inherently uncertain due to a number of factors outside of the Company’s control, as discussed under Forward-Looking Statements above. Accordingly, there can be no assurance that the prospective results are indicative of the future performance of the Company or that actual results will not differ materially from those presented in the prospective financial information. Inclusion of the prospective financial information in this presentation should not be regarded as a representation by any person that the results contained in the prospective financial information will be achieved. Non-GAAP Financial Measures This presentation includes certain financial measures not presented in accordance with GAAP including, but not limited to, Organic Net Sales, Adjusted Gross Profit, Adjusted Gross Profit Margin, Adjusted SD&A, EBITDA, Adjusted EBITDA, Adjusted EBITDA Margin, Normalized Adjusted EBITDA, Adjusted Net Income, Adjusted Earnings Per Share, Adjusted COGS, and Net Leverage Ratio, and certain ratios and other metrics derived therefrom. These non-GAAP financial measures do not represent financial performance in accordance with GAAP and may exclude items that are significant in understanding and assessing financial results. Therefore, these measures should not be considered in isolation or as an alternative to net income, cash flows from operations, earnings per share or other measures of profitability, liquidity or performance under GAAP. You should be aware that the presentation of these measures may not be comparable to similarly-titled measures used by other companies. Reconciliations of these historical non-GAAP measures to the most directly comparable GAAP measures are set forth in the appendix to this presentation. We believe (i) these non-GAAP measures of financial results provide useful information to management and investors regarding certain financial and business trends relating to the financial condition and results of operations of the Company to date; and (ii) the use of these non-GAAP financial measures provides an additional tool for investors to use in evaluating ongoing operating results and trends in comparing financial measures with other similar companies, many of which present similar non-GAAP financial measures to investors. These non-GAAP financial measures are subject to inherent limitations as they reflect the exercise of judgments by management about which expense and income are excluded or included in determining these non-GAAP financial measures. The non-GAAP financial measures are not recognized in accordance with GAAP and should not be viewed as an alternative to GAAP measures of performance. In addition, quantitative reconciliations are not available for the forward-looking GAAP financial measures used in this presentation without unreasonable efforts due to the high variability, complexity, and low visibility with respect to certain items which are excluded from Net Organic Sales, Adjusted EBITDA, Adjusted Earnings Per Share, and Net Leverage Ratio, respectively. We expect the variability of these items to have a potentially unpredictable, and potentially significant, impact on our future financial results.

Business Overview Howard Friedman Chief Executive Officer 4
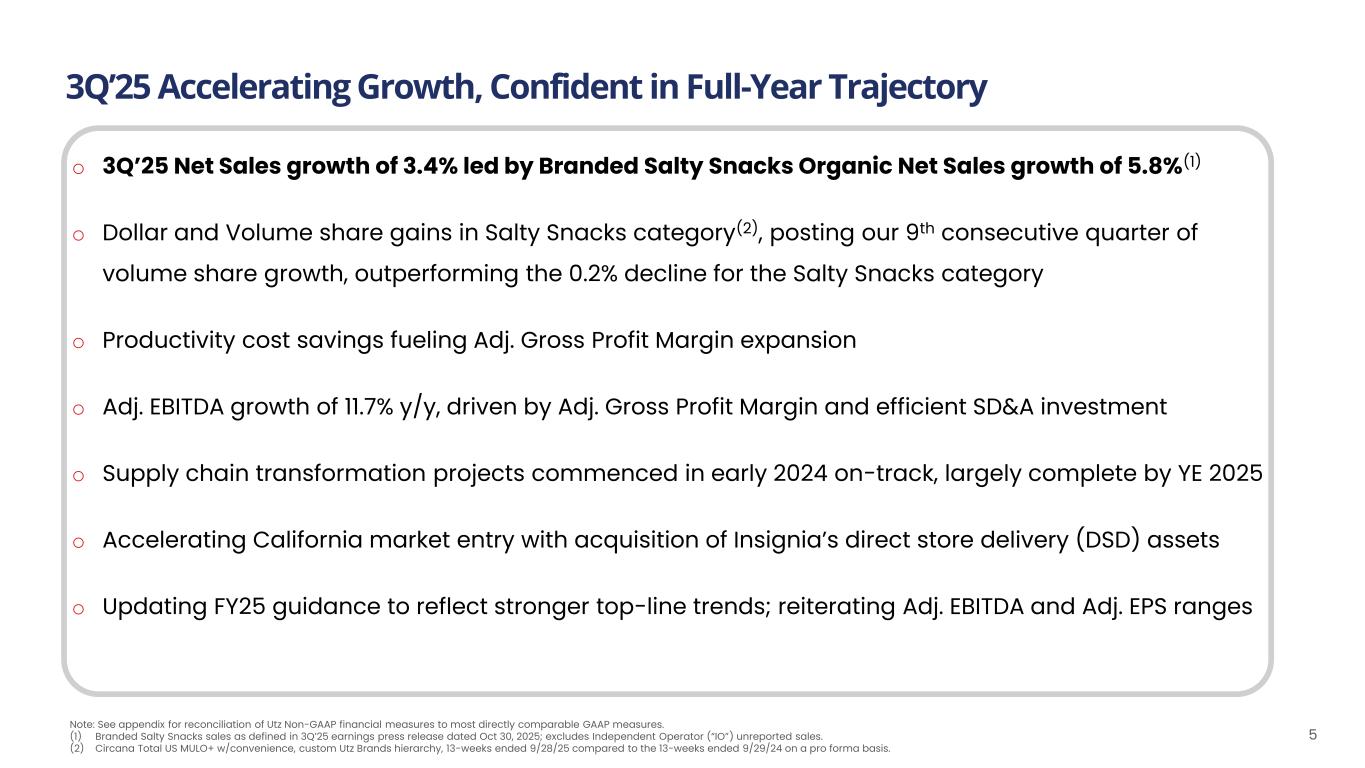
3Q’25 Accelerating Growth, Confident in Full-Year Trajectory 5 o 3Q’25 Net Sales growth of 3.4% led by Branded Salty Snacks Organic Net Sales growth of 5.8%(1) o Dollar and Volume share gains in Salty Snacks category(2), posting our 9th consecutive quarter of volume share growth, outperforming the 0.2% decline for the Salty Snacks category o Productivity cost savings fueling Adj. Gross Profit Margin expansion o Adj. EBITDA growth of 11.7% y/y, driven by Adj. Gross Profit Margin and efficient SD&A investment o Supply chain transformation projects commenced in early 2024 on-track, largely complete by YE 2025 o Accelerating California market entry with acquisition of Insignia’s direct store delivery (DSD) assets o Updating FY25 guidance to reflect stronger top-line trends; reiterating Adj. EBITDA and Adj. EPS ranges Note: See appendix for reconciliation of Utz Non-GAAP financial measures to most directly comparable GAAP measures. (1) Branded Salty Snacks sales as defined in 3Q’25 earnings press release dated Oct 30, 2025; excludes Independent Operator (“IO”) unreported sales. (2) Circana Total US MULO+ w/convenience, custom Utz Brands hierarchy, 13-weeks ended 9/28/25 compared to the 13-weeks ended 9/29/24 on a pro forma basis.
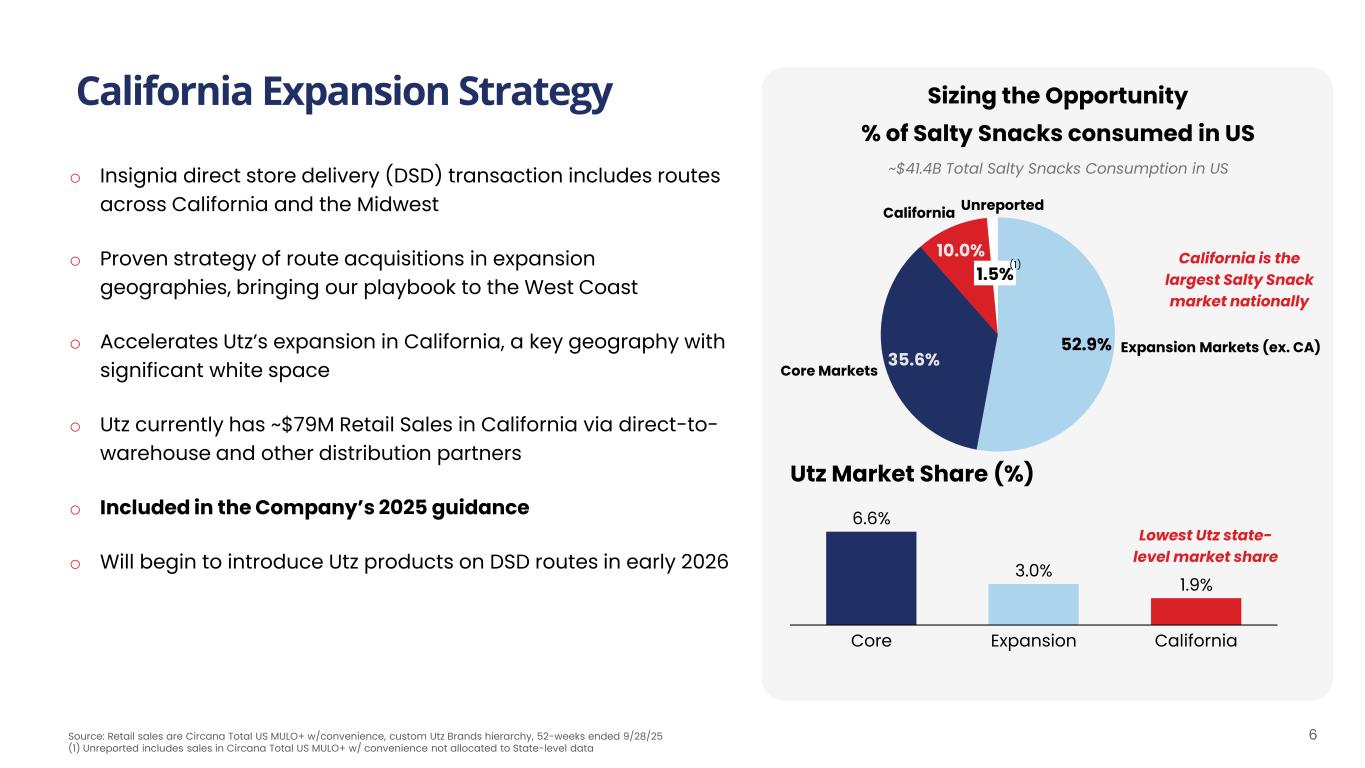
6 California Expansion Strategy o Insignia direct store delivery (DSD) transaction includes routes across California and the Midwest o Proven strategy of route acquisitions in expansion geographies, bringing our playbook to the West Coast o Accelerates Utz’s expansion in California, a key geography with significant white space o Utz currently has ~$79M Retail Sales in California via direct-to- warehouse and other distribution partners o Included in the Company’s 2025 guidance o Will begin to introduce Utz products on DSD routes in early 2026 Sizing the Opportunity % of Salty Snacks consumed in US Utz Market Share (%) Core Expansion California 6.6% 3.0% 1.9% Lowest Utz state- level market share ~$41.4B Total Salty Snacks Consumption in US Source: Retail sales are Circana Total US MULO+ w/convenience, custom Utz Brands hierarchy, 52-weeks ended 9/28/25 (1) Unreported includes sales in Circana Total US MULO+ w/ convenience not allocated to State-level data 52.9% 35.6% 10.0% Expansion Markets (ex. CA) Core Markets California 1.5% Unreported California is the largest Salty Snack market nationally (1)
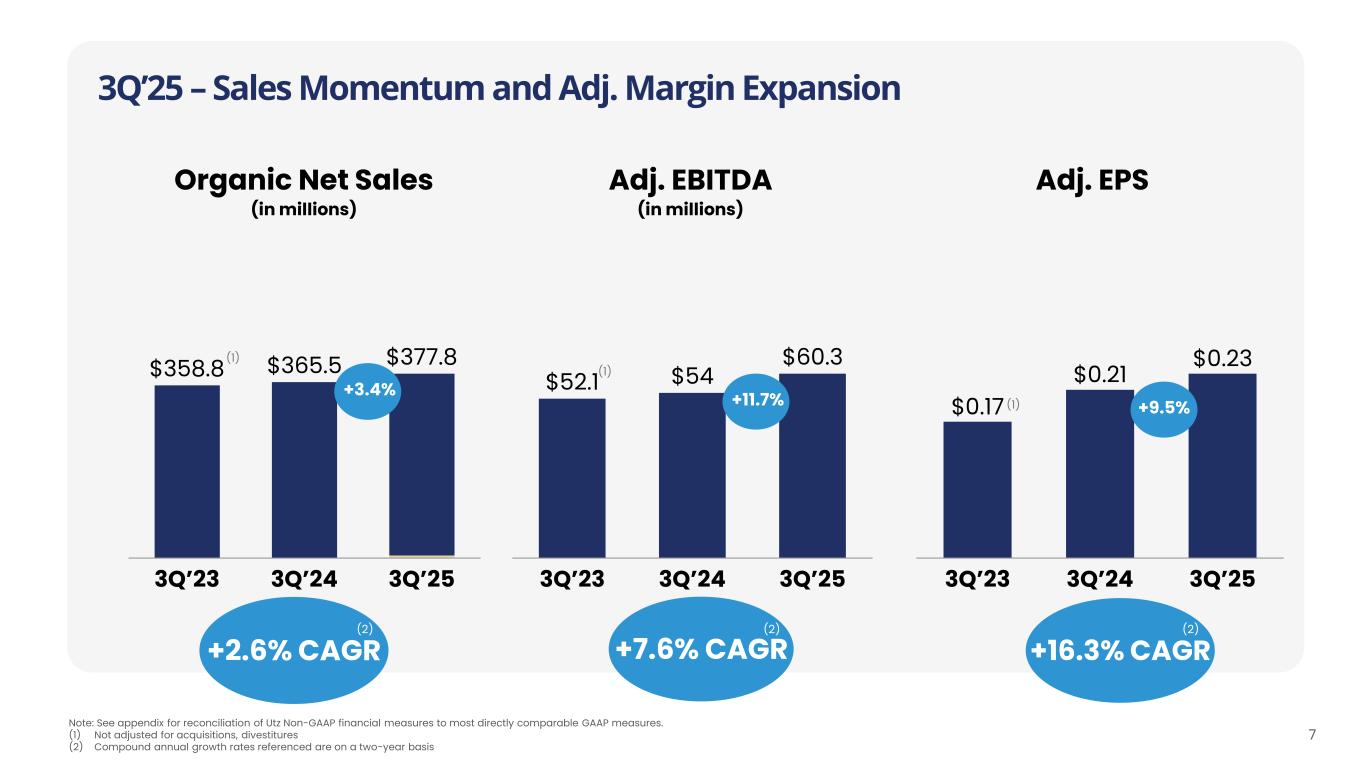
3Q’25 – Sales Momentum and Adj. Margin Expansion 7 Adj. EBITDA (in millions) 3Q’23 3Q’24 3Q’25 $52.1 $54 $60.3 Note: See appendix for reconciliation of Utz Non-GAAP financial measures to most directly comparable GAAP measures. (1) Not adjusted for acquisitions, divestitures (2) Compound annual growth rates referenced are on a two-year basis Adj. EPS $0.17 $0.21 $0.23 3Q’23 3Q’24 3Q’25 Organic Net Sales (in millions) 3Q’23 3Q’24 3Q’25 $358.8 $365.5 $377.8 +16.3% CAGR+7.6% CAGR+2.6% CAGR (1) (1)+11.7%+3.4% +9.5% (1) (2) (2) (2)
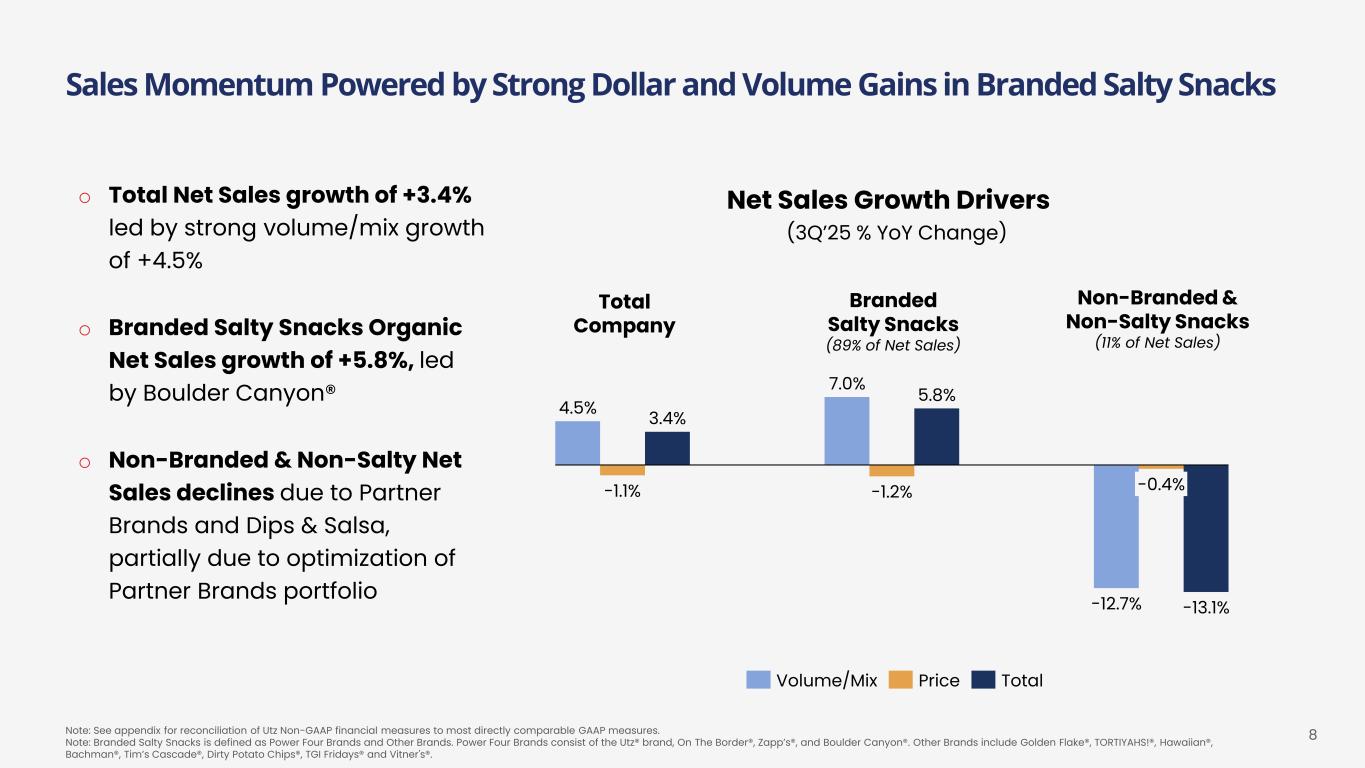
8Note: See appendix for reconciliation of Utz Non-GAAP financial measures to most directly comparable GAAP measures. Note: Branded Salty Snacks is defined as Power Four Brands and Other Brands. Power Four Brands consist of the Utz® brand, On The Border®, Zapp’s®, and Boulder Canyon®. Other Brands include Golden Flake®, TORTIYAHS!®, Hawaiian®, Bachman®, Tim’s Cascade®, Dirty Potato Chips®, TGI Fridays® and Vitner's®. Sales Momentum Powered by Strong Dollar and Volume Gains in Branded Salty Snacks Non-Branded & Non-Salty Snacks (11% of Net Sales) Total Company 4.5% -1.1% 3.4% 7.0% -1.2% 5.8% -12.7% -0.4% -13.1% (3Q’25 % YoY Change) Volume/Mix Price Total Net Sales Growth Driverso Total Net Sales growth of +3.4% led by strong volume/mix growth of +4.5% o Branded Salty Snacks Organic Net Sales growth of +5.8%, led by Boulder Canyon® o Non-Branded & Non-Salty Net Sales declines due to Partner Brands and Dips & Salsa, partially due to optimization of Partner Brands portfolio Branded Salty Snacks (89% of Net Sales)
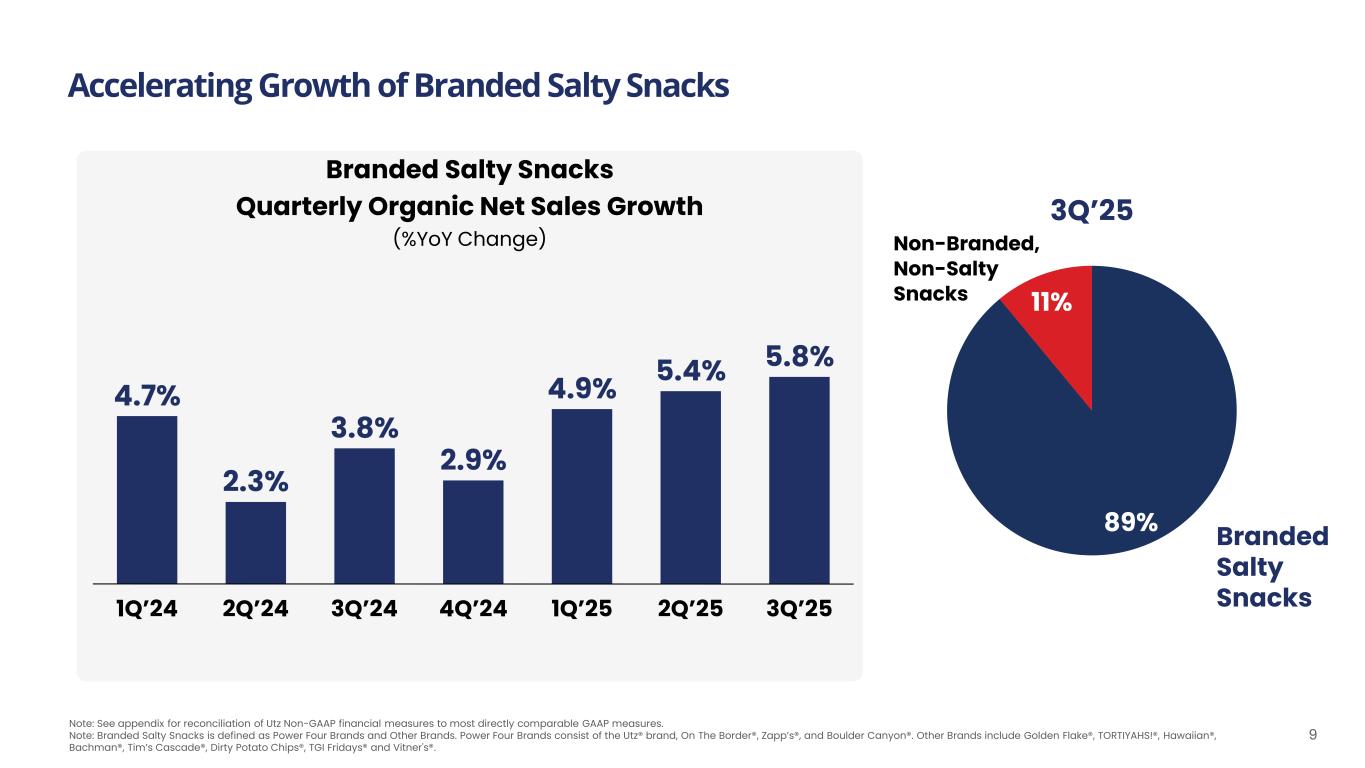
1Q’24 2Q’24 3Q’24 4Q’24 1Q’25 2Q’25 3Q’25 4.7% 2.3% 3.8% 2.9% 4.9% 5.4% 5.8% Accelerating Growth of Branded Salty Snacks 9 Branded Salty Snacks Quarterly Organic Net Sales Growth (%YoY Change) Note: See appendix for reconciliation of Utz Non-GAAP financial measures to most directly comparable GAAP measures. Note: Branded Salty Snacks is defined as Power Four Brands and Other Brands. Power Four Brands consist of the Utz® brand, On The Border®, Zapp’s®, and Boulder Canyon®. Other Brands include Golden Flake®, TORTIYAHS!®, Hawaiian®, Bachman®, Tim’s Cascade®, Dirty Potato Chips®, TGI Fridays® and Vitner's®. 89% 11% 3Q’25 Branded Salty Snacks Non-Branded, Non-Salty Snacks
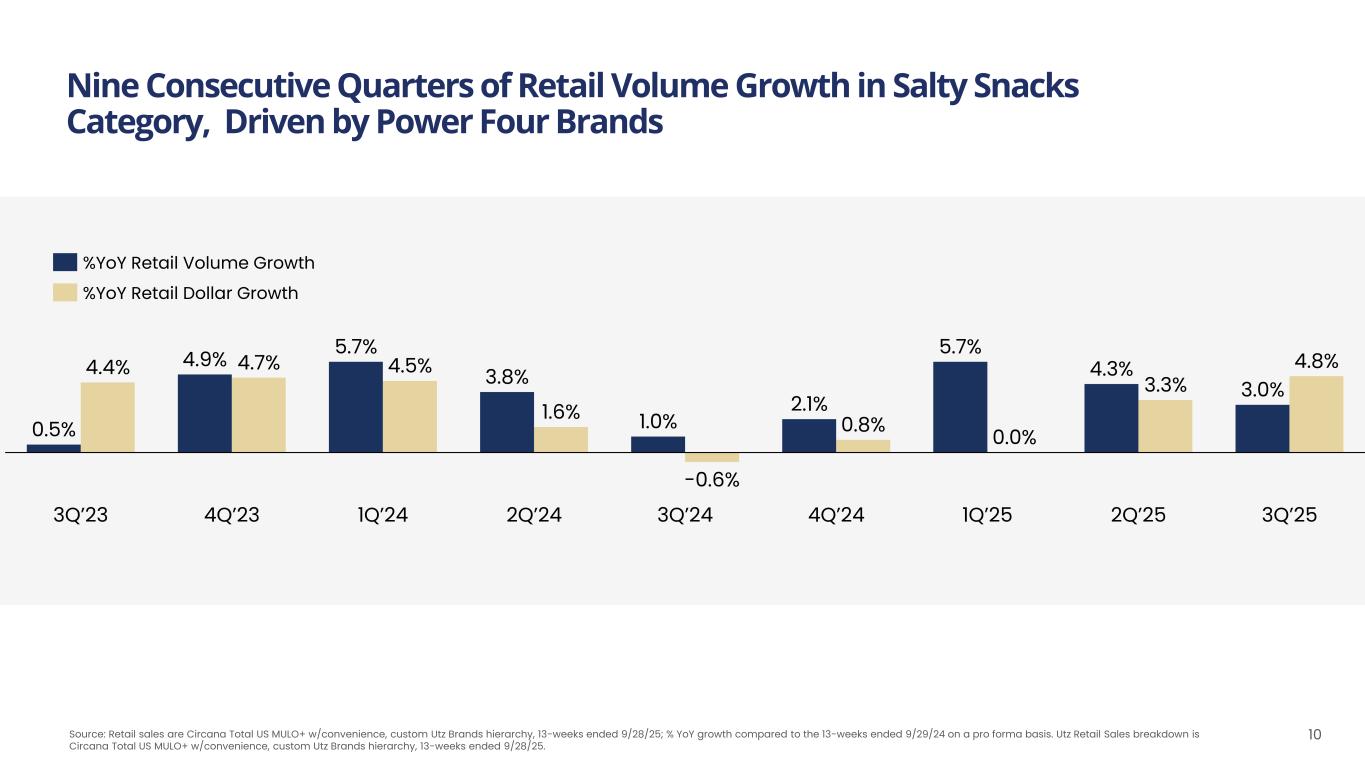
Nine Consecutive Quarters of Retail Volume Growth in Salty Snacks Category, Driven by Power Four Brands 10 3Q’23 4Q’23 1Q’24 2Q’24 3Q’24 4Q’24 1Q’25 2Q’25 0.5% 4.4% 4.9% 4.7% 5.7% 4.5% 3.8% 1.6% 1.0% -0.6% 2.1% 0.8% 5.7% 0.0% 4.3% 3.3% 3Q’25 3.0% 4.8% %YoY Retail Volume Growth %YoY Retail Dollar Growth Source: Retail sales are Circana Total US MULO+ w/convenience, custom Utz Brands hierarchy, 13-weeks ended 9/28/25; % YoY growth compared to the 13-weeks ended 9/29/24 on a pro forma basis. Utz Retail Sales breakdown is Circana Total US MULO+ w/convenience, custom Utz Brands hierarchy, 13-weeks ended 9/28/25.
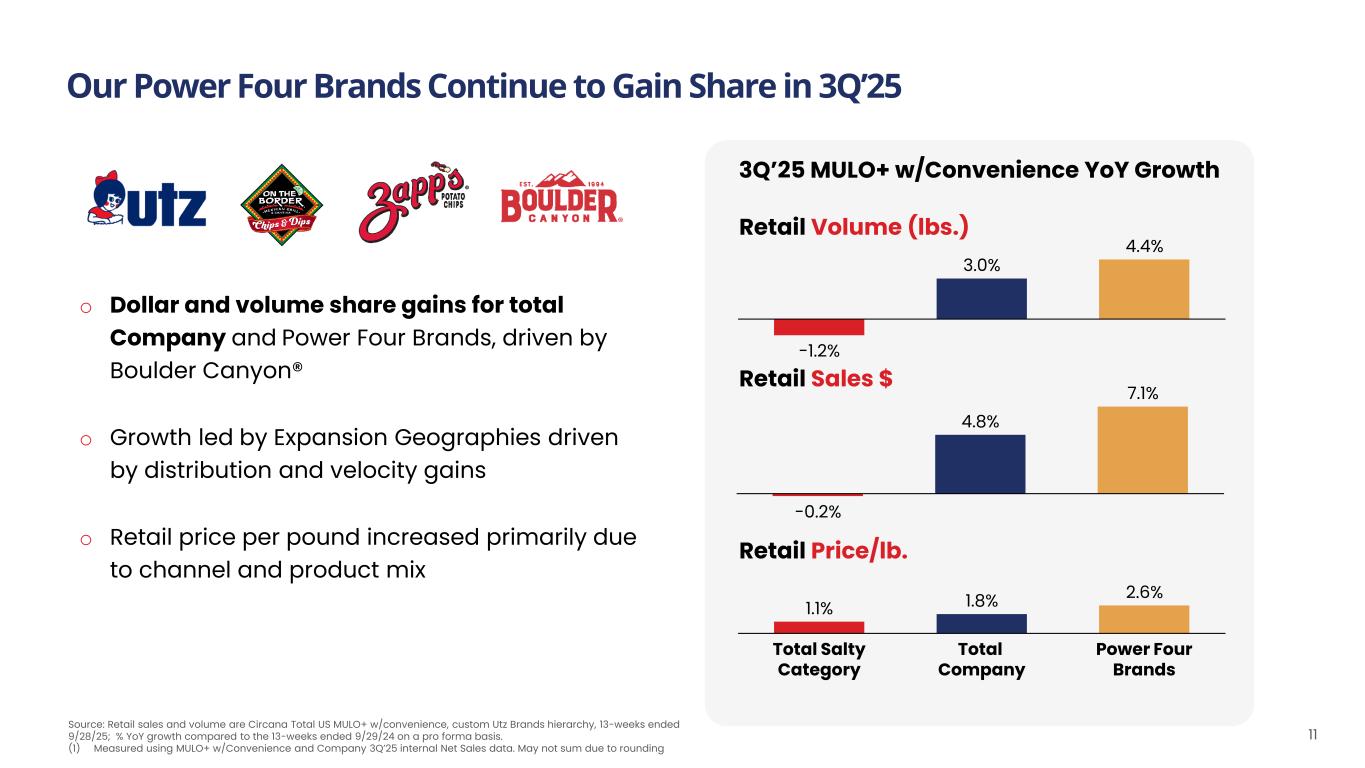
Our Power Four Brands Continue to Gain Share in 3Q’25 11 3Q’25 MULO+ w/Convenience YoY Growth -1.2% 3.0% 4.4% Retail Volume (lbs.) Total Salty Category Total Company Power Four Brands 1.1% 1.8% 2.6% Retail Price/lb. -0.2% 4.8% 7.1% Retail Sales $ Source: Retail sales and volume are Circana Total US MULO+ w/convenience, custom Utz Brands hierarchy, 13-weeks ended 9/28/25; % YoY growth compared to the 13-weeks ended 9/29/24 on a pro forma basis. (1) Measured using MULO+ w/Convenience and Company 3Q’25 internal Net Sales data. May not sum due to rounding o Dollar and volume share gains for total Company and Power Four Brands, driven by Boulder Canyon® o Growth led by Expansion Geographies driven by distribution and velocity gains o Retail price per pound increased primarily due to channel and product mix
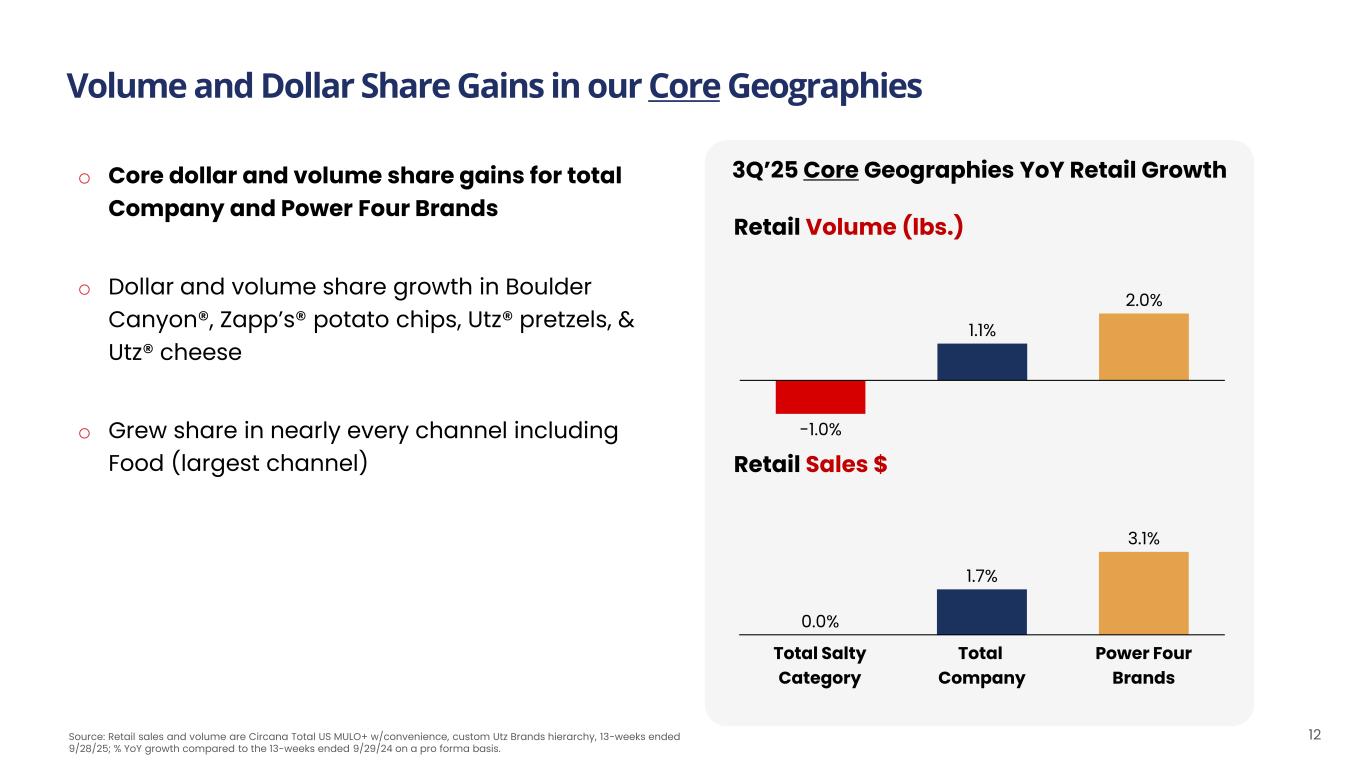
3Q’25 Core Geographies YoY Retail Growth Retail Volume (lbs.) Source: Retail sales and volume are Circana Total US MULO+ w/convenience, custom Utz Brands hierarchy, 13-weeks ended 9/28/25; % YoY growth compared to the 13-weeks ended 9/29/24 on a pro forma basis. Volume and Dollar Share Gains in our Core Geographies 12 Total Salty Category Total Company Power Four Brands 0.0% 1.7% 3.1% -1.0% 1.1% 2.0% Retail Sales $ o Core dollar and volume share gains for total Company and Power Four Brands o Dollar and volume share growth in Boulder Canyon®, Zapp’s® potato chips, Utz® pretzels, & Utz® cheese o Grew share in nearly every channel including Food (largest channel)
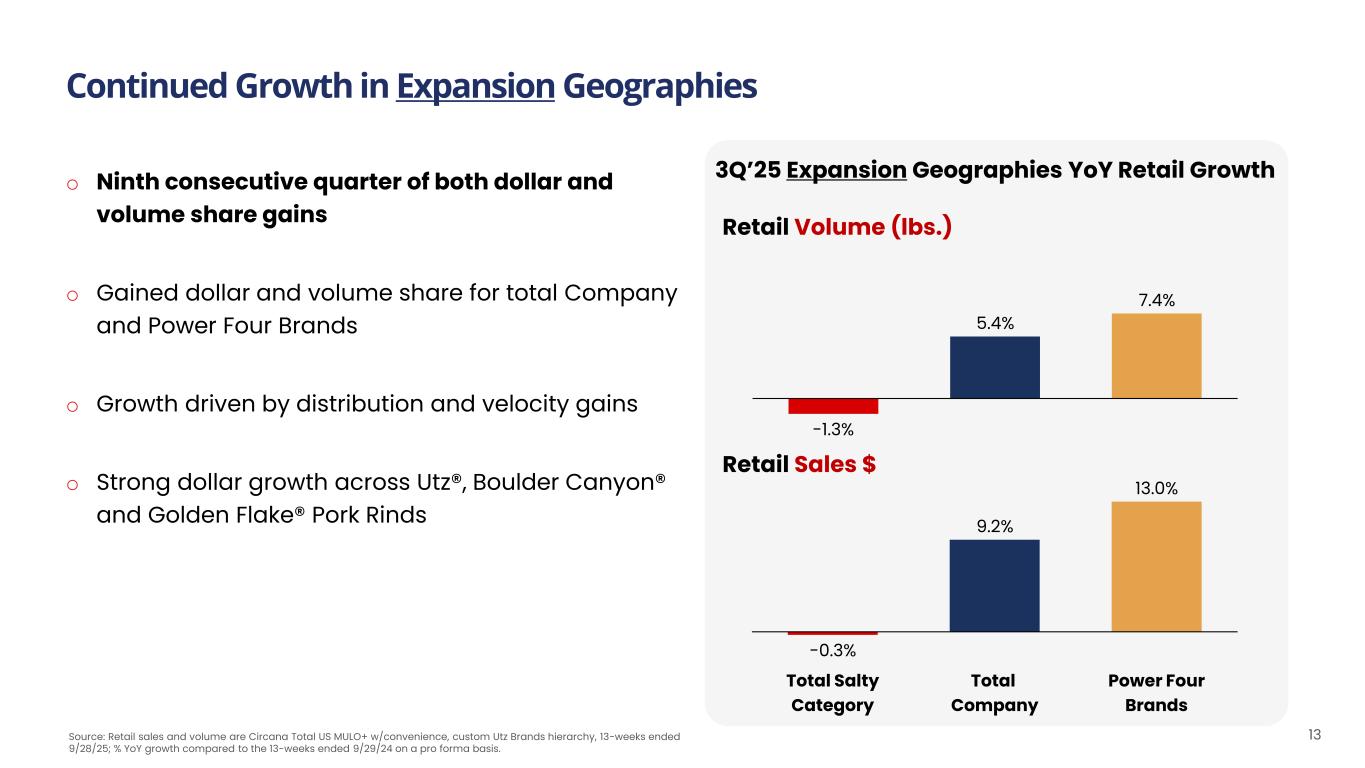
Continued Growth in Expansion Geographies 13 o Ninth consecutive quarter of both dollar and volume share gains o Gained dollar and volume share for total Company and Power Four Brands o Growth driven by distribution and velocity gains o Strong dollar growth across Utz®, Boulder Canyon® and Golden Flake® Pork Rinds 3Q’25 Expansion Geographies YoY Retail Growth Retail Volume (lbs.) Total Salty Category Total Company Power Four Brands -0.3% 9.2% 13.0% -1.3% 5.4% 7.4% Retail Sales $ Source: Retail sales and volume are Circana Total US MULO+ w/convenience, custom Utz Brands hierarchy, 13-weeks ended 9/28/25; % YoY growth compared to the 13-weeks ended 9/29/24 on a pro forma basis.
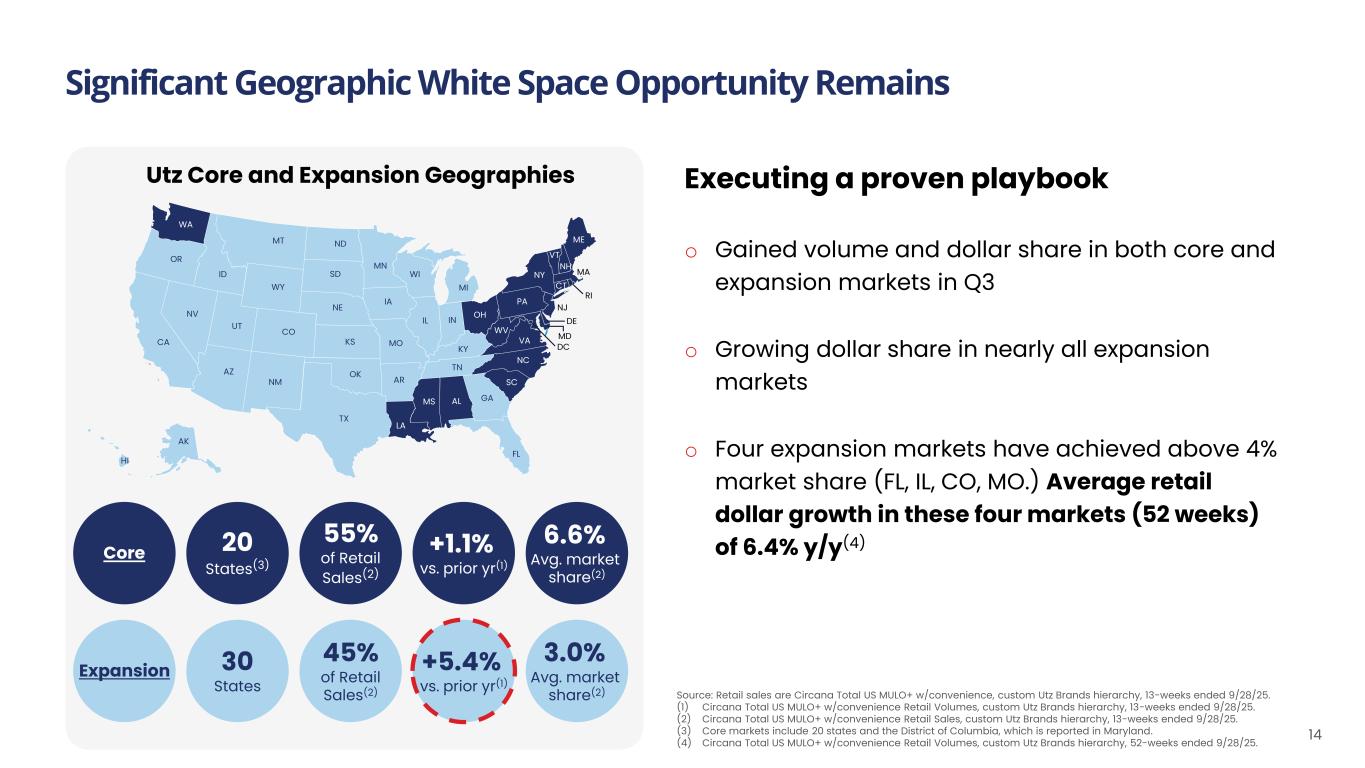
Significant Geographic White Space Opportunity Remains 14 Utz Core and Expansion Geographies FL NM DE MD TX OK KS NE SD NDMT WY COUT ID AZ NV WA CA OR KY ME NY PA VT NH MA RI CT WV INIL NC TN SC ALMS AR LA MO IA MN WI NJ GA DC VA OH MI HI AK Executing a proven playbook o Gained volume and dollar share in both core and expansion markets in Q3 o Growing dollar share in nearly all expansion markets o Four expansion markets have achieved above 4% market share (FL, IL, CO, MO.) Average retail dollar growth in these four markets (52 weeks) of 6.4% y/y(4)55% of Retail Sales(2) +1.1% vs. prior yr(1) 6.6% Avg. market share(2) Core 45% of Retail Sales(2) +5.4% vs. prior yr(1) 3.0% Avg. market share(2) Expansion 20 States(3) 30 States Source: Retail sales are Circana Total US MULO+ w/convenience, custom Utz Brands hierarchy, 13-weeks ended 9/28/25. (1) Circana Total US MULO+ w/convenience Retail Volumes, custom Utz Brands hierarchy, 13-weeks ended 9/28/25. (2) Circana Total US MULO+ w/convenience Retail Sales, custom Utz Brands hierarchy, 13-weeks ended 9/28/25. (3) Core markets include 20 states and the District of Columbia, which is reported in Maryland. (4) Circana Total US MULO+ w/convenience Retail Volumes, custom Utz Brands hierarchy, 52-weeks ended 9/28/25.
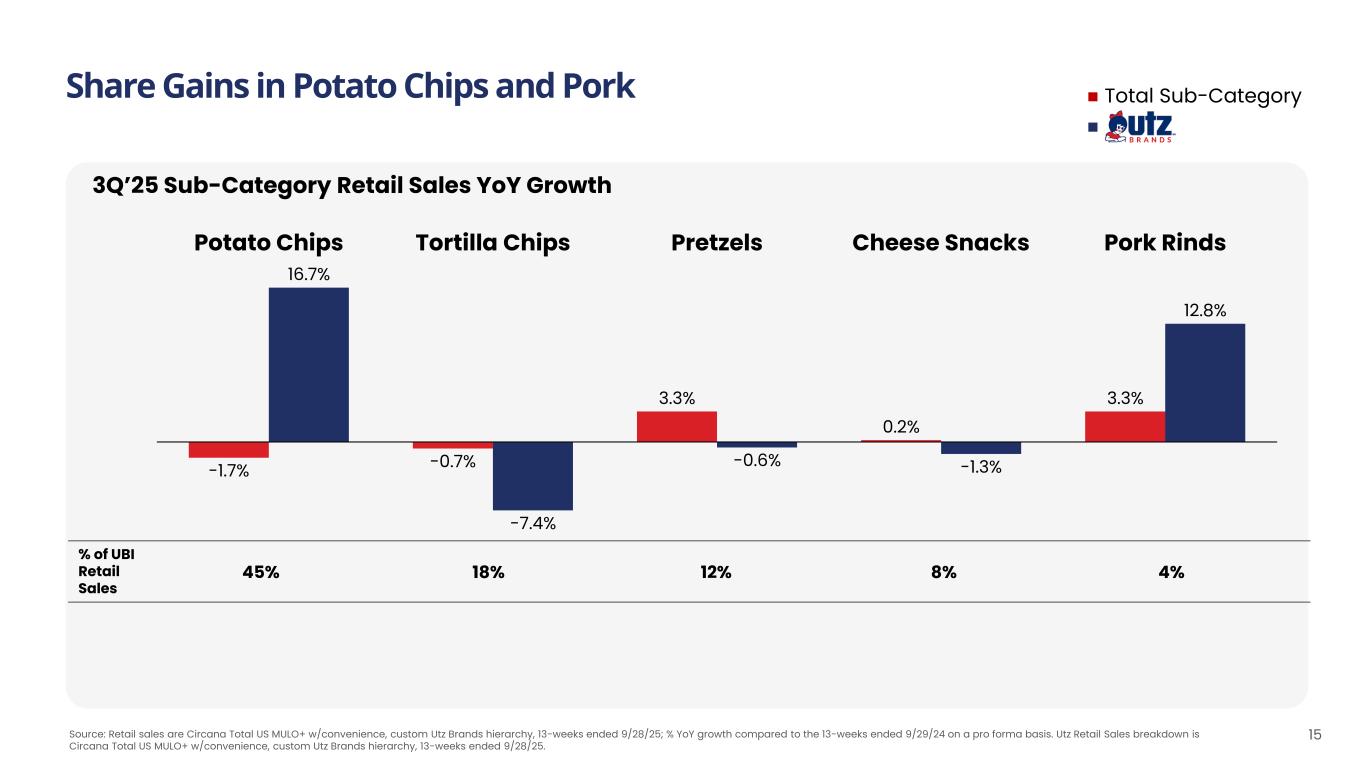
% of UBI Retail Sales 45% 18% 12% 8% 4% Source: Retail sales are Circana Total US MULO+ w/convenience, custom Utz Brands hierarchy, 13-weeks ended 9/28/25; % YoY growth compared to the 13-weeks ended 9/29/24 on a pro forma basis. Utz Retail Sales breakdown is Circana Total US MULO+ w/convenience, custom Utz Brands hierarchy, 13-weeks ended 9/28/25. 3Q’25 Sub-Category Retail Sales YoY Growth Potato Chips Tortilla Chips Pretzels Cheese Snacks Pork Rinds -1.7% 16.7% -0.7% -7.4% 3.3% -0.6% 0.2% -1.3% 3.3% 12.8% 15 Share Gains in Potato Chips and Pork Total Sub-Category
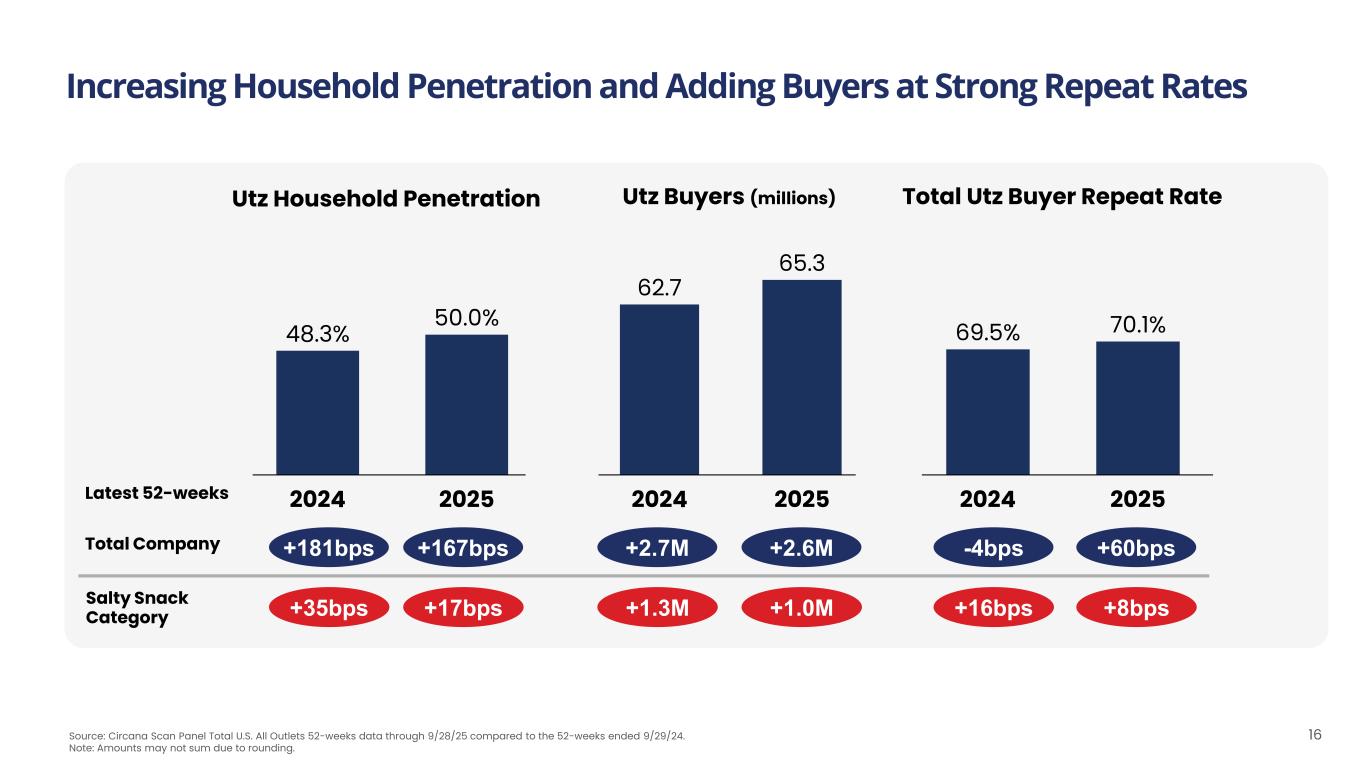
Increasing Household Penetration and Adding Buyers at Strong Repeat Rates 16 Utz Household Penetration Utz Buyers (millions) Total Utz Buyer Repeat Rate Source: Circana Scan Panel Total U.S. All Outlets 52-weeks data through 9/28/25 compared to the 52-weeks ended 9/29/24. Note: Amounts may not sum due to rounding. 35 40 45 50 55 2024 2025 48.3% 50.0% 60 65 70 75 2024 2025 69.5% 70.1% 62.7 65.3 45 50 55 60 65 70 2024 2025 Total Company Salty Snack Category +167bps +17bps +2.6M +1.0M +60bps +8bps +181bps +35bps +2.7M +1.3M -4bps +16bps Latest 52-weeks
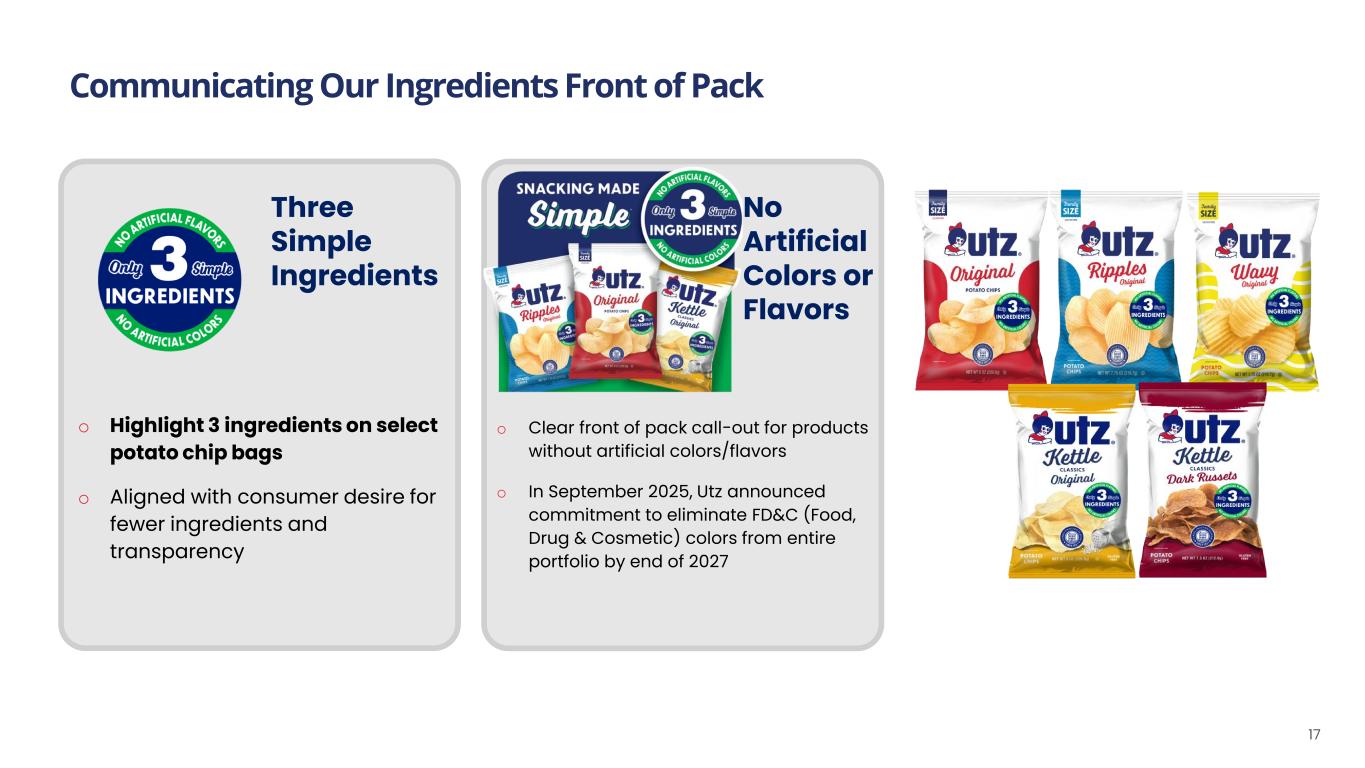
Communicating Our Ingredients Front of Pack o Clear front of pack call-out for products without artificial colors/flavors o In September 2025, Utz announced commitment to eliminate FD&C (Food, Drug & Cosmetic) colors from entire portfolio by end of 2027 No Artificial Colors or Flavors o Highlight 3 ingredients on select potato chip bags o Aligned with consumer desire for fewer ingredients and transparency Three Simple Ingredients 17
Financial Review BK Kelley Chief Financial Officer 18
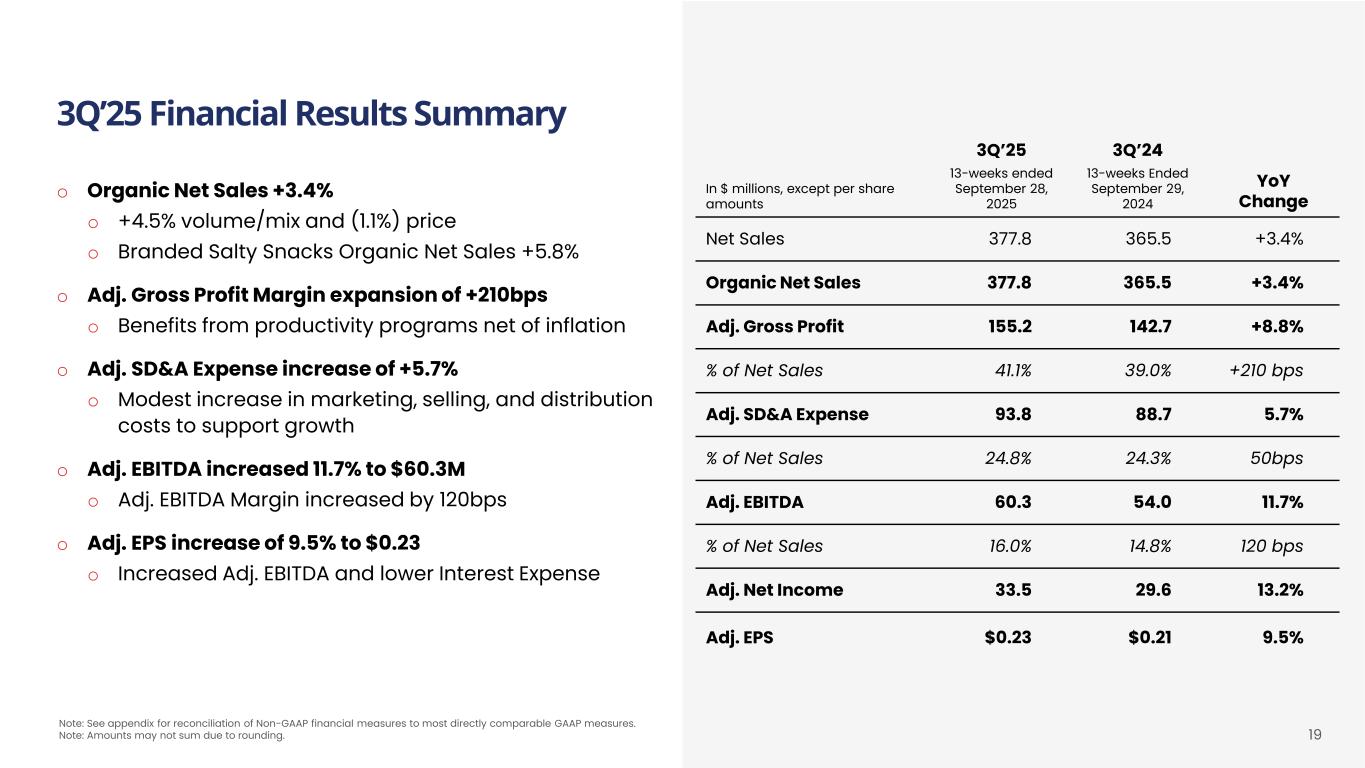
3Q’25 Financial Results Summary o Organic Net Sales +3.4% o +4.5% volume/mix and (1.1%) price o Branded Salty Snacks Organic Net Sales +5.8% o Adj. Gross Profit Margin expansion of +210bps o Benefits from productivity programs net of inflation o Adj. SD&A Expense increase of +5.7% o Modest increase in marketing, selling, and distribution costs to support growth o Adj. EBITDA increased 11.7% to $60.3M o Adj. EBITDA Margin increased by 120bps o Adj. EPS increase of 9.5% to $0.23 o Increased Adj. EBITDA and lower Interest Expense 3Q’25 3Q’24 YoY Change In $ millions, except per share amounts 13-weeks ended September 28, 2025 13-weeks Ended September 29, 2024 Net Sales 377.8 365.5 +3.4% Organic Net Sales 377.8 365.5 +3.4% Adj. Gross Profit 155.2 142.7 +8.8% % of Net Sales 41.1% 39.0% +210 bps Adj. SD&A Expense 93.8 88.7 5.7% % of Net Sales 24.8% 24.3% 50bps Adj. EBITDA 60.3 54.0 11.7% % of Net Sales 16.0% 14.8% 120 bps Adj. Net Income 33.5 29.6 13.2% Adj. EPS $0.23 $0.21 9.5% 19 Note: See appendix for reconciliation of Non-GAAP financial measures to most directly comparable GAAP measures. Note: Amounts may not sum due to rounding.
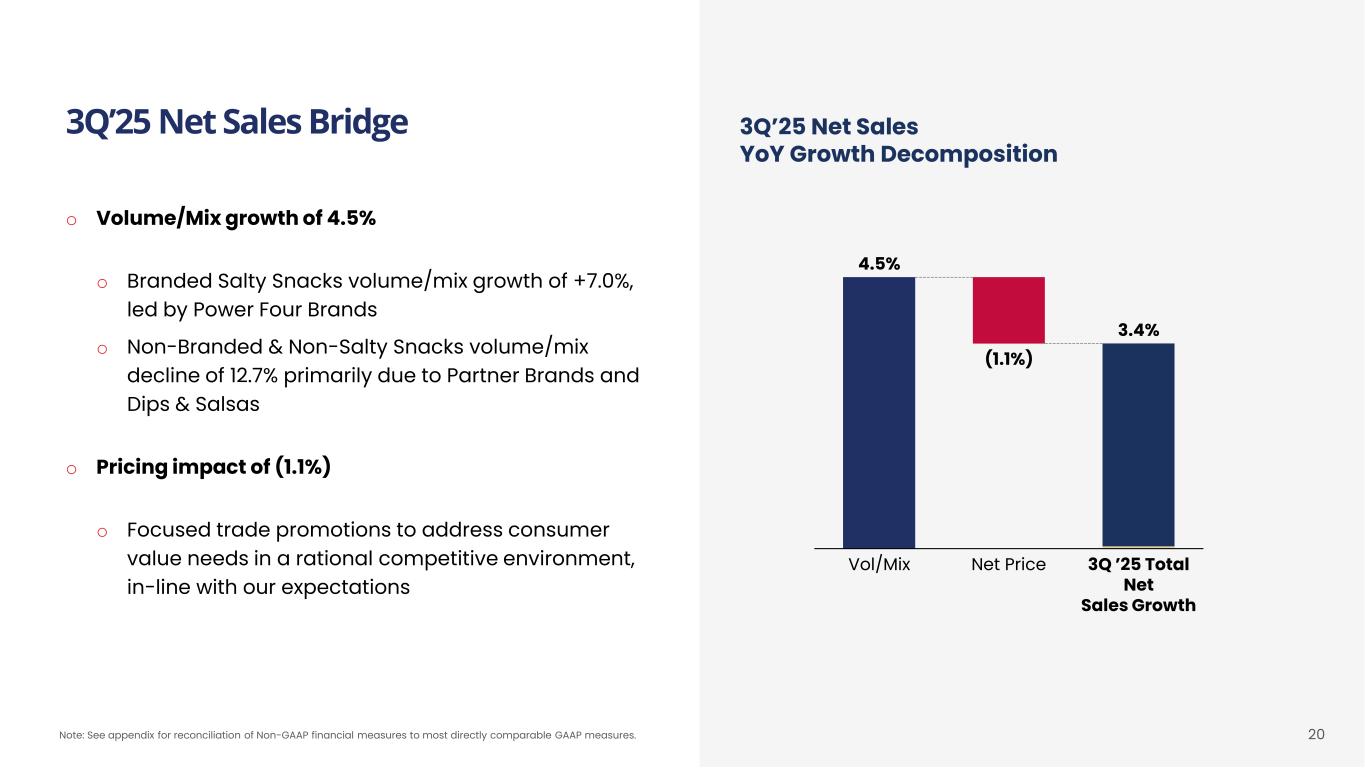
20 3Q’25 Net Sales YoY Growth Decomposition Note: See appendix for reconciliation of Non-GAAP financial measures to most directly comparable GAAP measures. Vol/Mix Net Price 3Q ’25 Total Net Sales Growth 4.5% (1.1%) 3.4% o Volume/Mix growth of 4.5% o Branded Salty Snacks volume/mix growth of +7.0%, led by Power Four Brands o Non-Branded & Non-Salty Snacks volume/mix decline of 12.7% primarily due to Partner Brands and Dips & Salsas o Pricing impact of (1.1%) o Focused trade promotions to address consumer value needs in a rational competitive environment, in-line with our expectations 3Q’25 Net Sales Bridge
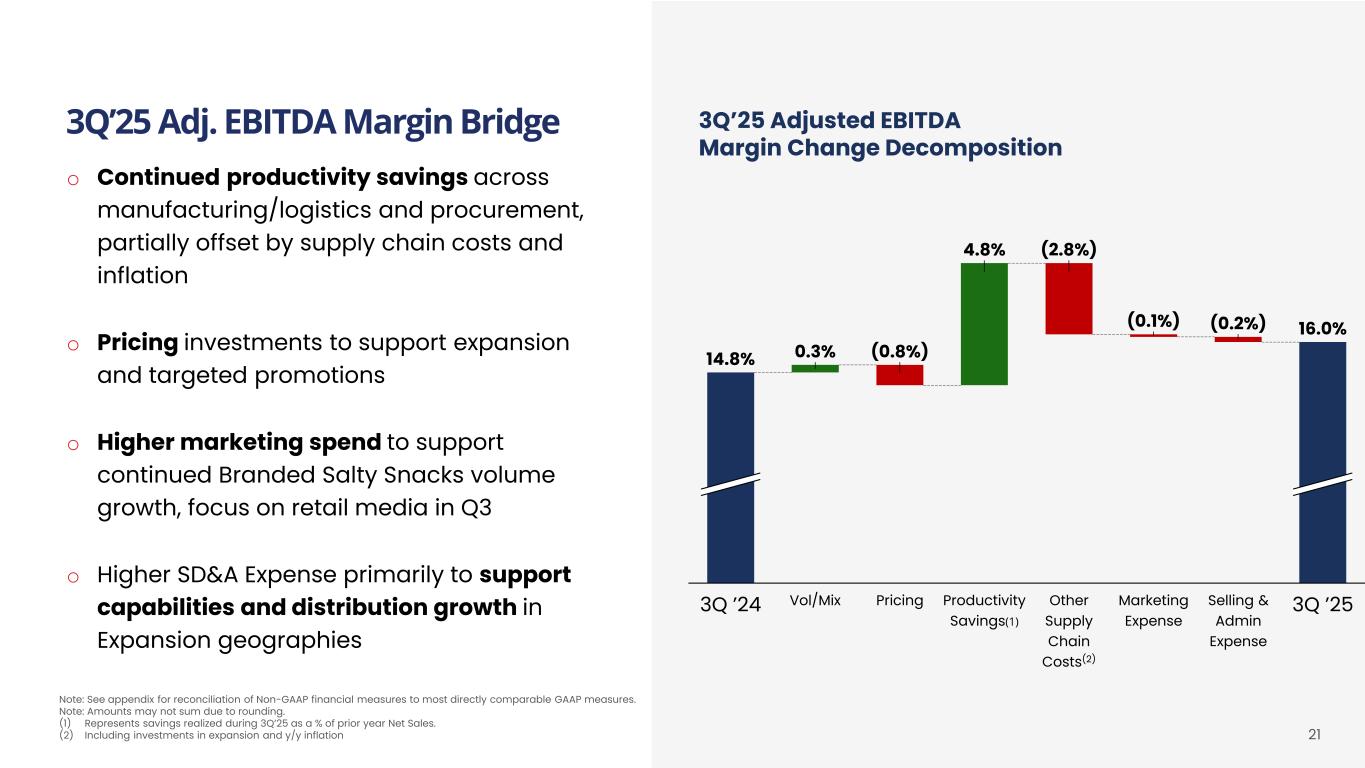
3Q’25 Adjusted EBITDA Margin Change Decomposition 3Q’25 Adj. EBITDA Margin Bridge 21 o Continued productivity savings across manufacturing/logistics and procurement, partially offset by supply chain costs and inflation o Pricing investments to support expansion and targeted promotions o Higher marketing spend to support continued Branded Salty Snacks volume growth, focus on retail media in Q3 o Higher SD&A Expense primarily to support capabilities and distribution growth in Expansion geographies Note: See appendix for reconciliation of Non-GAAP financial measures to most directly comparable GAAP measures. Note: Amounts may not sum due to rounding. (1) Represents savings realized during 3Q’25 as a % of prior year Net Sales. (2) Including investments in expansion and y/y inflation 0.3% Vol/Mix (0.8%) Pricing 4.8% Productivity Savings(1) 14.8% 16.0% (2.8%) Other Supply Chain Costs(2) (0.1%) Marketing Expense (0.2%) 3Q ’24 3Q ’25Selling & Admin Expense
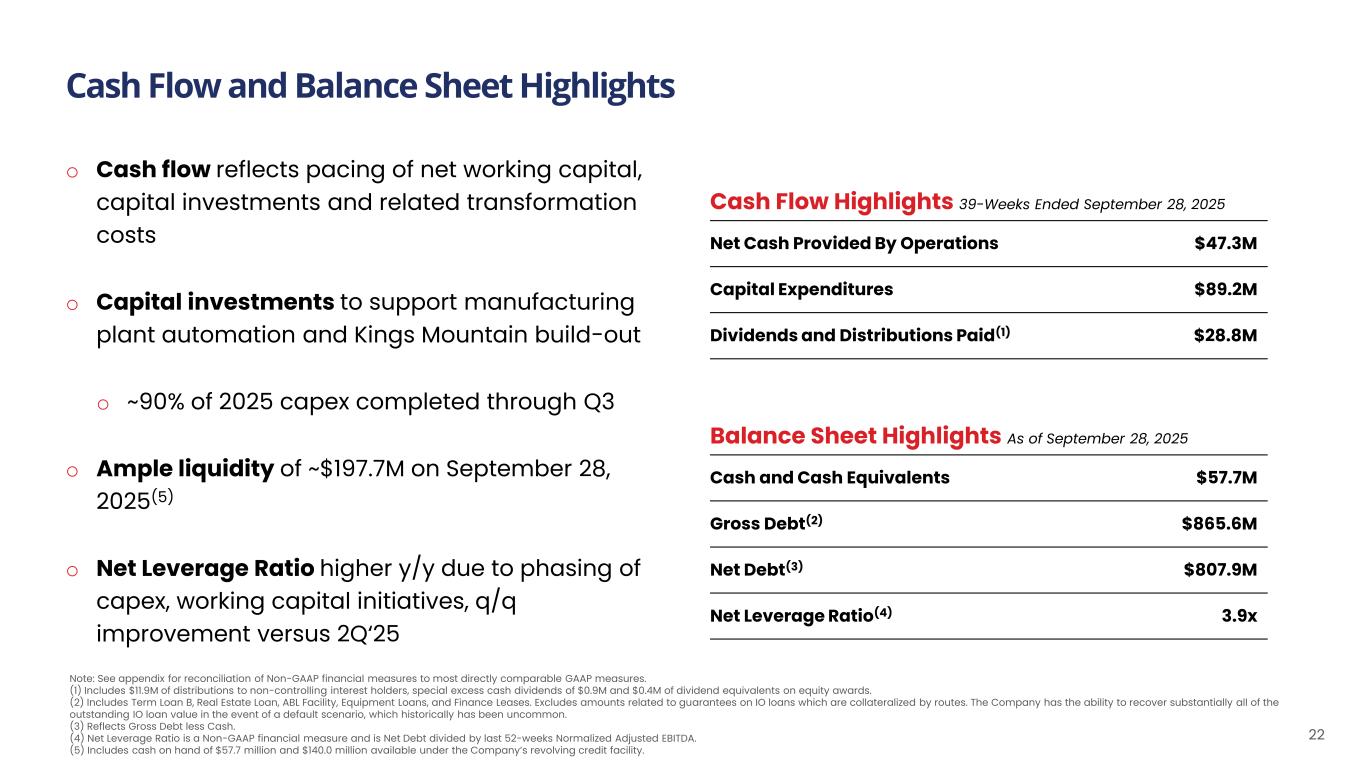
Cash Flow and Balance Sheet Highlights As of January 1, 2023 Cash Flow Highlights 39-Weeks Ended September 28, 2025 Net Cash Provided By Operations $47.3M Capital Expenditures $89.2M Dividends and Distributions Paid(1) $28.8M Balance Sheet Highlights As of September 28, 2025 Cash and Cash Equivalents $57.7M Gross Debt(2) $865.6M Net Debt(3) $807.9M Net Leverage Ratio(4) 3.9x 22 Note: See appendix for reconciliation of Non-GAAP financial measures to most directly comparable GAAP measures. (1) Includes $11.9M of distributions to non-controlling interest holders, special excess cash dividends of $0.9M and $0.4M of dividend equivalents on equity awards. (2) Includes Term Loan B, Real Estate Loan, ABL Facility, Equipment Loans, and Finance Leases. Excludes amounts related to guarantees on IO loans which are collateralized by routes. The Company has the ability to recover substantially all of the outstanding IO loan value in the event of a default scenario, which historically has been uncommon. (3) Reflects Gross Debt less Cash. (4) Net Leverage Ratio is a Non-GAAP financial measure and is Net Debt divided by last 52-weeks Normalized Adjusted EBITDA. (5) Includes cash on hand of $57.7 million and $140.0 million available under the Company’s revolving credit facility. o Cash flow reflects pacing of net working capital, capital investments and related transformation costs o Capital investments to support manufacturing plant automation and Kings Mountain build-out o ~90% of 2025 capex completed through Q3 o Ample liquidity of ~$197.7M on September 28, 2025(5) o Net Leverage Ratio higher y/y due to phasing of capex, working capital initiatives, q/q improvement versus 2Q‘25
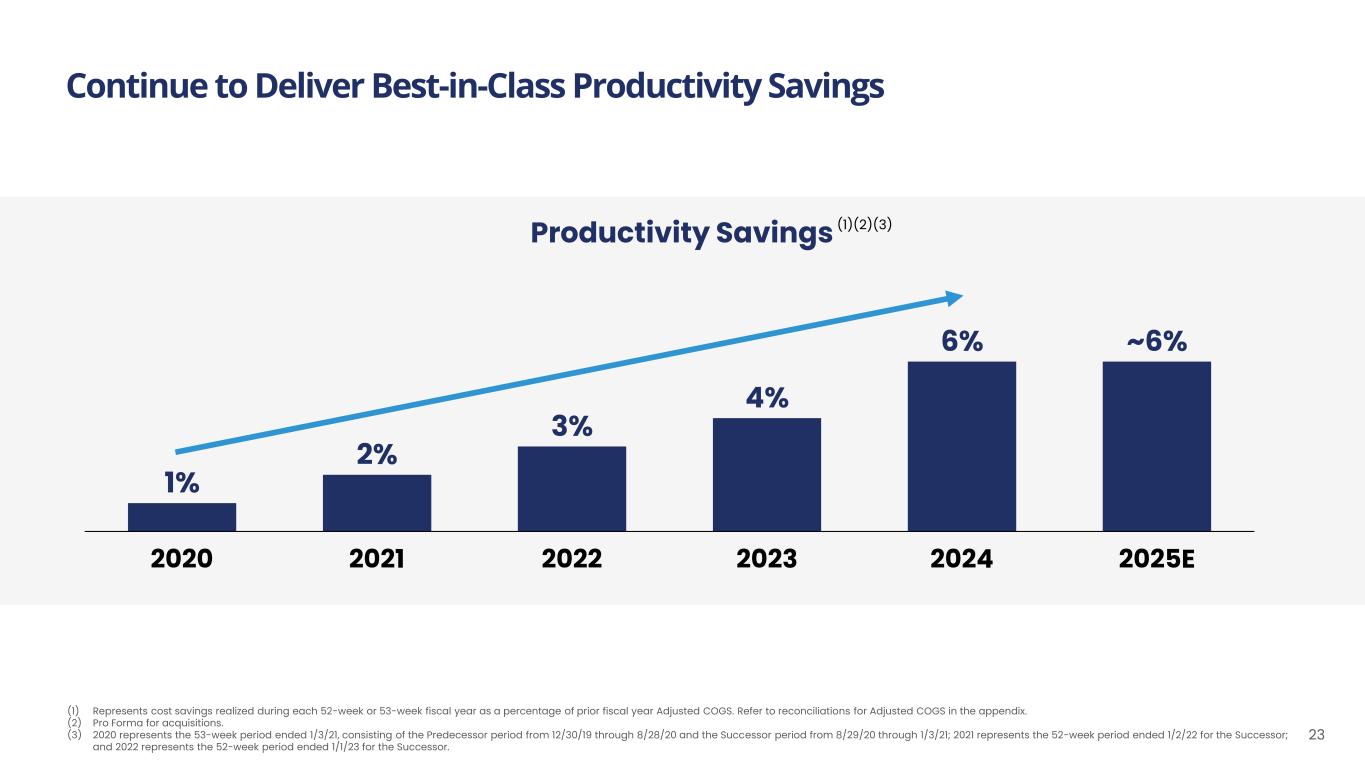
Continue to Deliver Best-in-Class Productivity Savings 23 Productivity Savings (1) Represents cost savings realized during each 52-week or 53-week fiscal year as a percentage of prior fiscal year Adjusted COGS. Refer to reconciliations for Adjusted COGS in the appendix. (2) Pro Forma for acquisitions. (3) 2020 represents the 53-week period ended 1/3/21, consisting of the Predecessor period from 12/30/19 through 8/28/20 and the Successor period from 8/29/20 through 1/3/21; 2021 represents the 52-week period ended 1/2/22 for the Successor; and 2022 represents the 52-week period ended 1/1/23 for the Successor. 2020 2021 2022 2023 2024 2025E 1% 2% 3% 4% 6% ~6% (1)(2)(3)
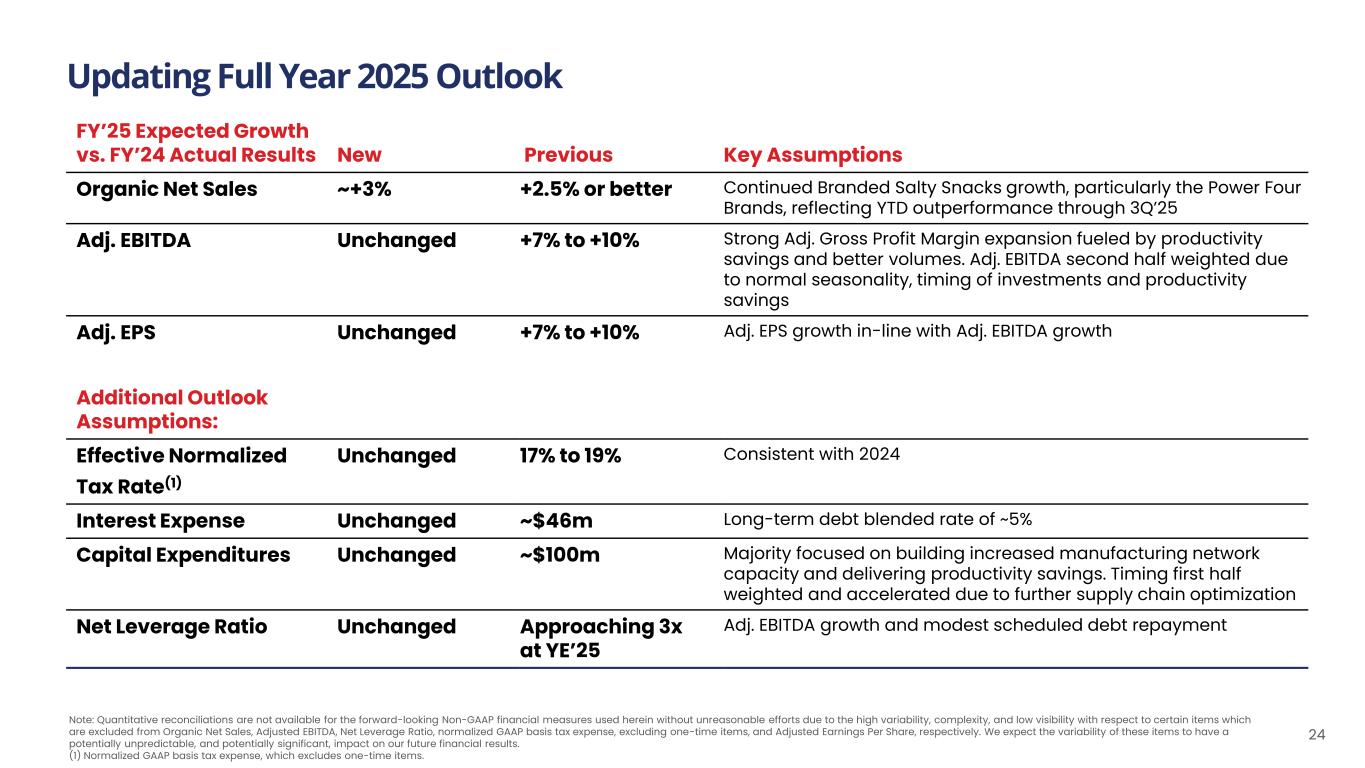
Note: Quantitative reconciliations are not available for the forward-looking Non-GAAP financial measures used herein without unreasonable efforts due to the high variability, complexity, and low visibility with respect to certain items which are excluded from Organic Net Sales, Adjusted EBITDA, Net Leverage Ratio, normalized GAAP basis tax expense, excluding one-time items, and Adjusted Earnings Per Share, respectively. We expect the variability of these items to have a potentially unpredictable, and potentially significant, impact on our future financial results. (1) Normalized GAAP basis tax expense, which excludes one-time items. FY’25 Expected Growth vs. FY’24 Actual Results New Previous Key Assumptions Organic Net Sales ~+3% +2.5% or better Continued Branded Salty Snacks growth, particularly the Power Four Brands, reflecting YTD outperformance through 3Q’25 Adj. EBITDA Unchanged +7% to +10% Strong Adj. Gross Profit Margin expansion fueled by productivity savings and better volumes. Adj. EBITDA second half weighted due to normal seasonality, timing of investments and productivity savings Adj. EPS Unchanged +7% to +10% Adj. EPS growth in-line with Adj. EBITDA growth Additional Outlook Assumptions: Effective Normalized Tax Rate(1) Unchanged 17% to 19% Consistent with 2024 Interest Expense Unchanged ~$46m Long-term debt blended rate of ~5% Capital Expenditures Unchanged ~$100m Majority focused on building increased manufacturing network capacity and delivering productivity savings. Timing first half weighted and accelerated due to further supply chain optimization Net Leverage Ratio Unchanged Approaching 3x at YE’25 Adj. EBITDA growth and modest scheduled debt repayment Updating Full Year 2025 Outlook 24
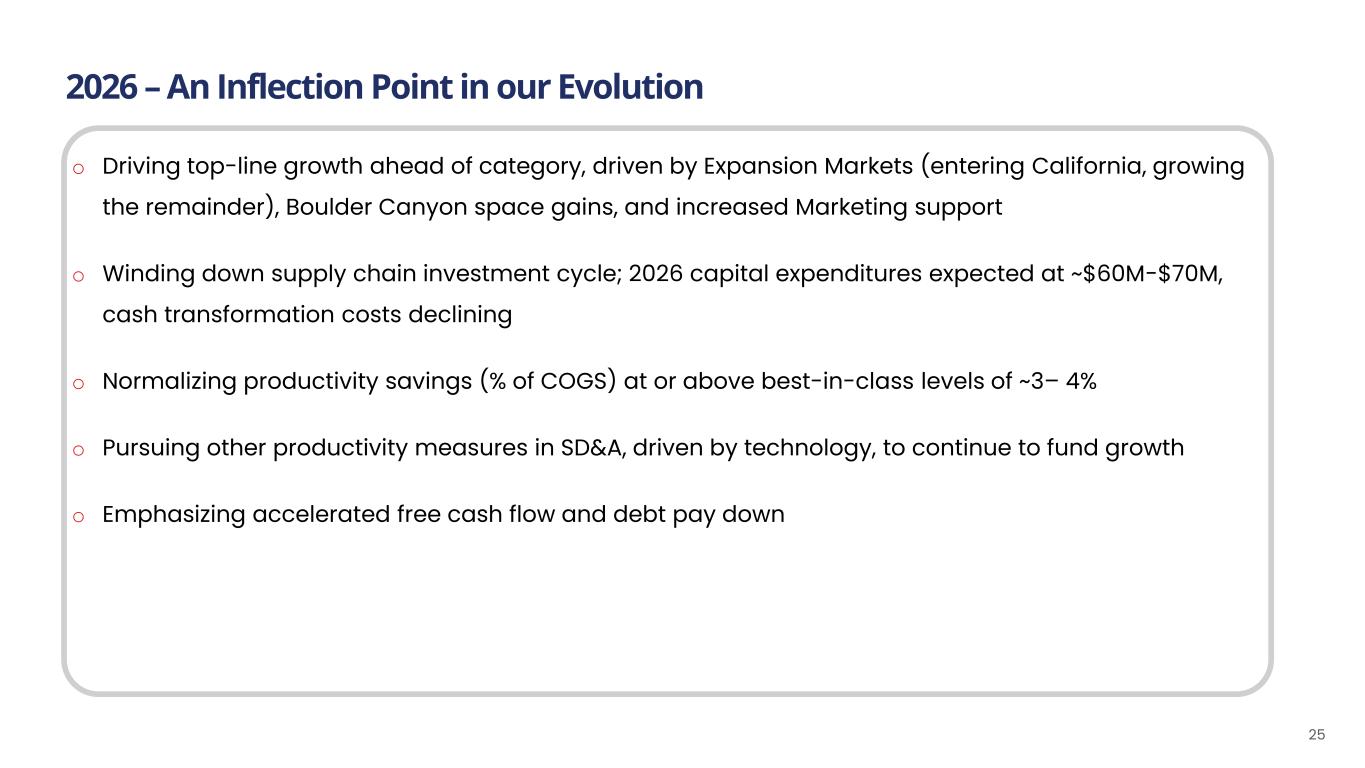
2026 – An Inflection Point in our Evolution 25 o Driving top-line growth ahead of category, driven by Expansion Markets (entering California, growing the remainder), Boulder Canyon space gains, and increased Marketing support o Winding down supply chain investment cycle; 2026 capital expenditures expected at ~$60M-$70M, cash transformation costs declining o Normalizing productivity savings (% of COGS) at or above best-in-class levels of ~3– 4% o Pursuing other productivity measures in SD&A, driven by technology, to continue to fund growth o Emphasizing accelerated free cash flow and debt pay down

Appendix 26
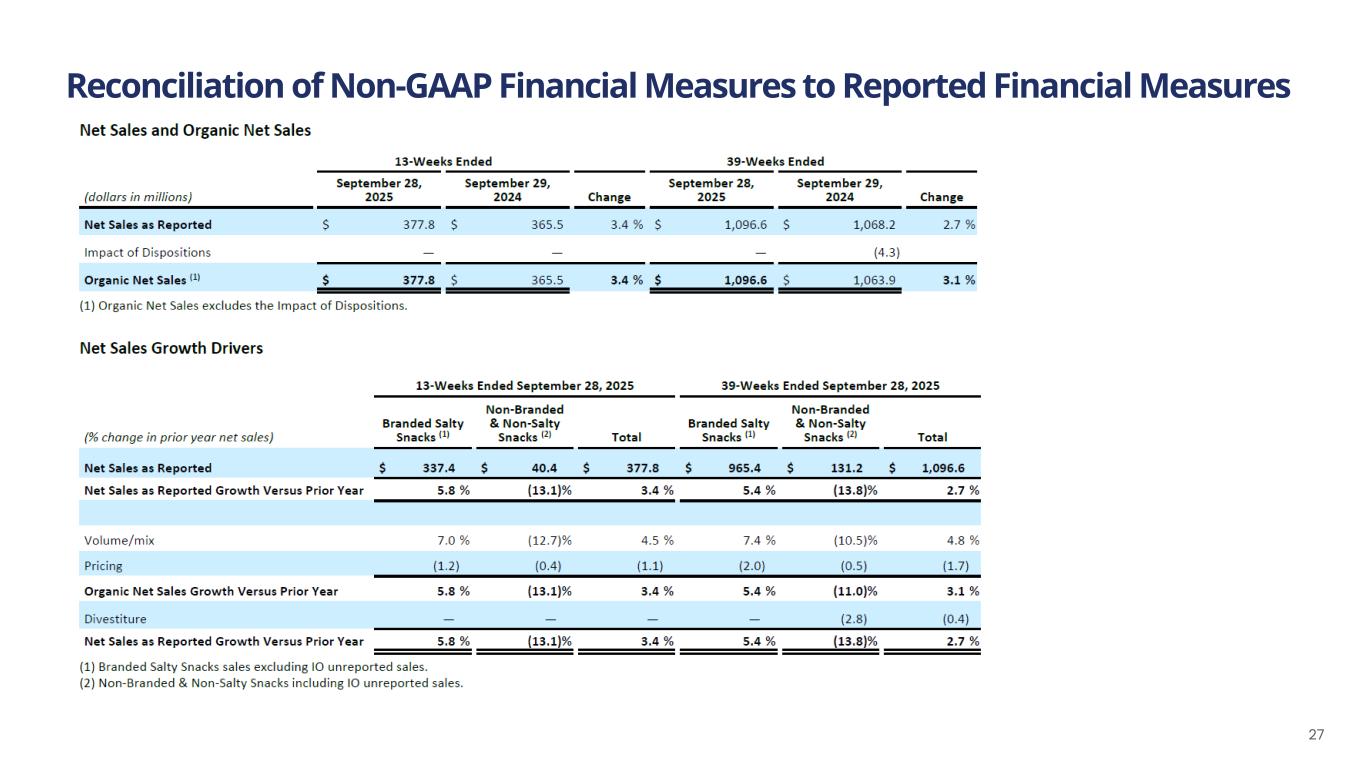
Reconciliation of Non-GAAP Financial Measures to Reported Financial Measures 27
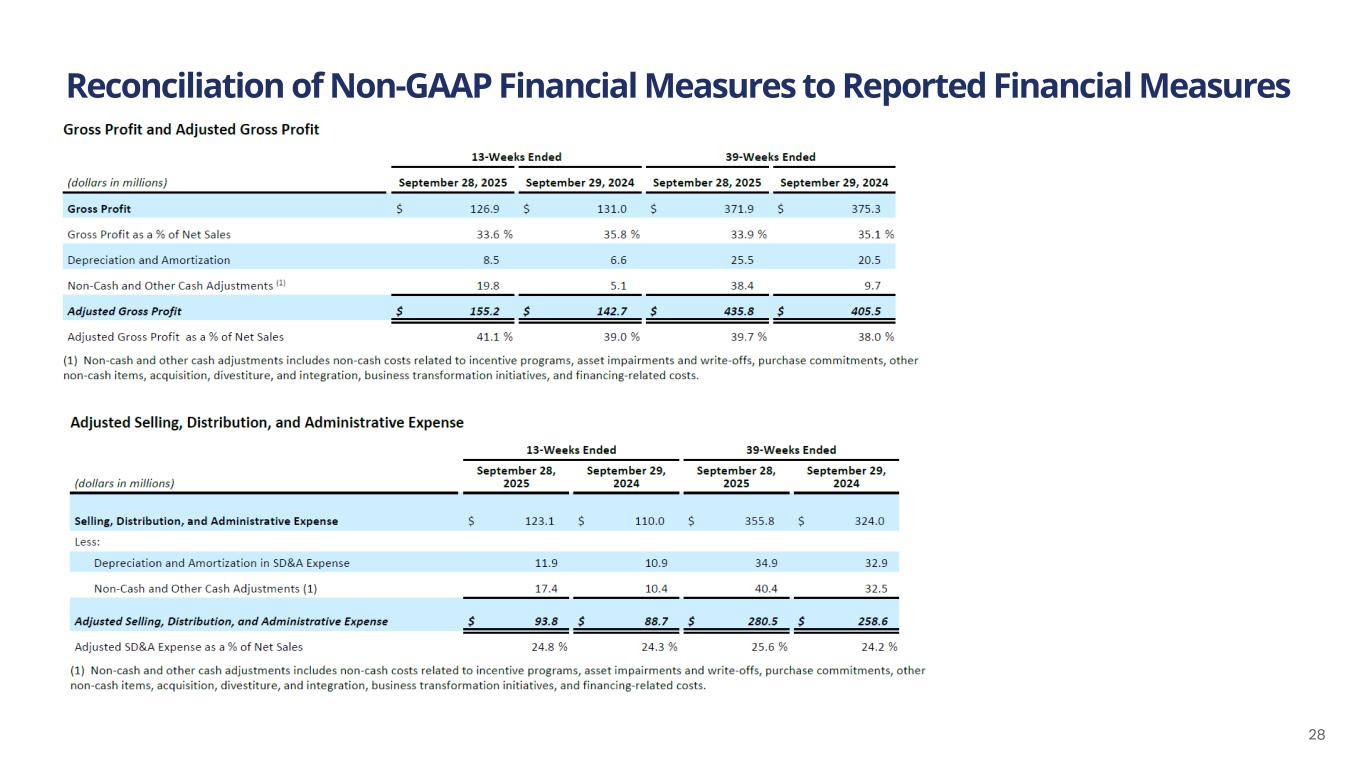
Reconciliation of Non-GAAP Financial Measures to Reported Financial Measures 28
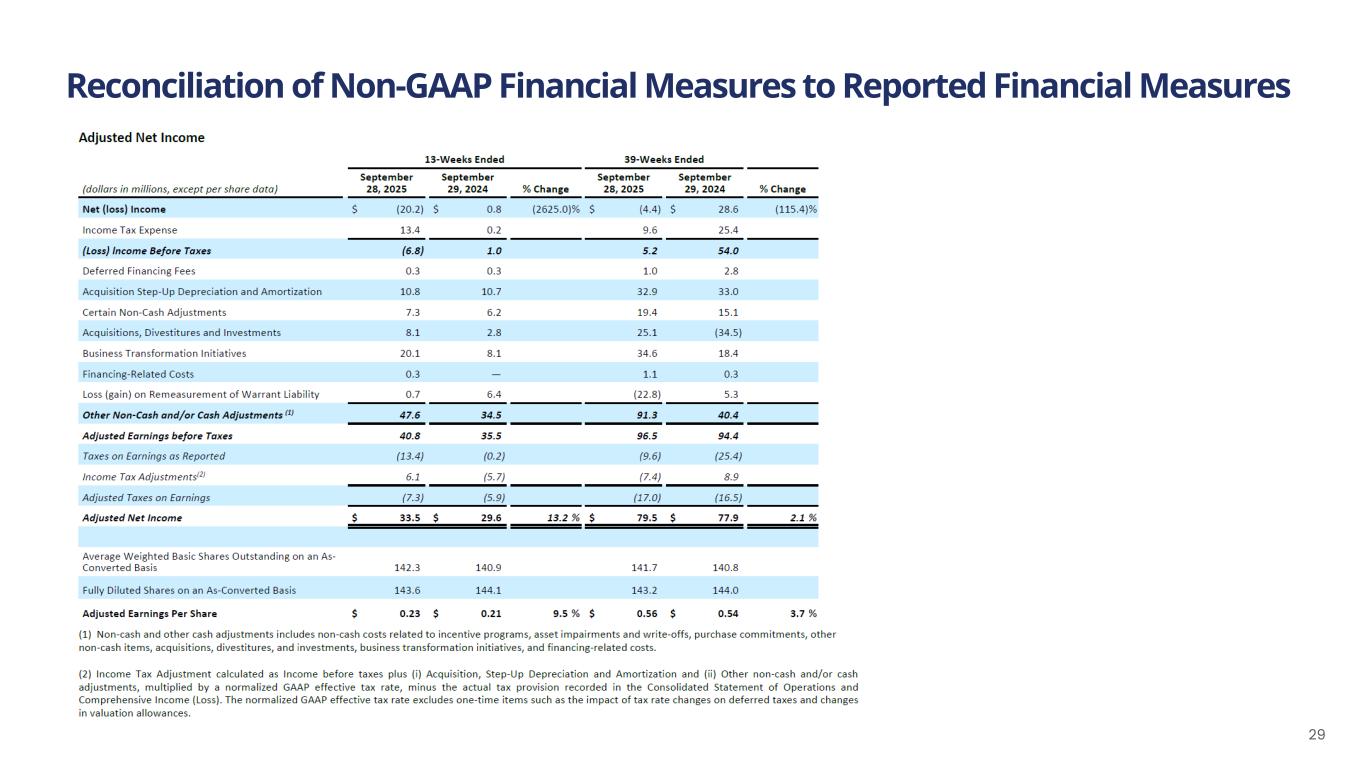
Reconciliation of Non-GAAP Financial Measures to Reported Financial Measures 29
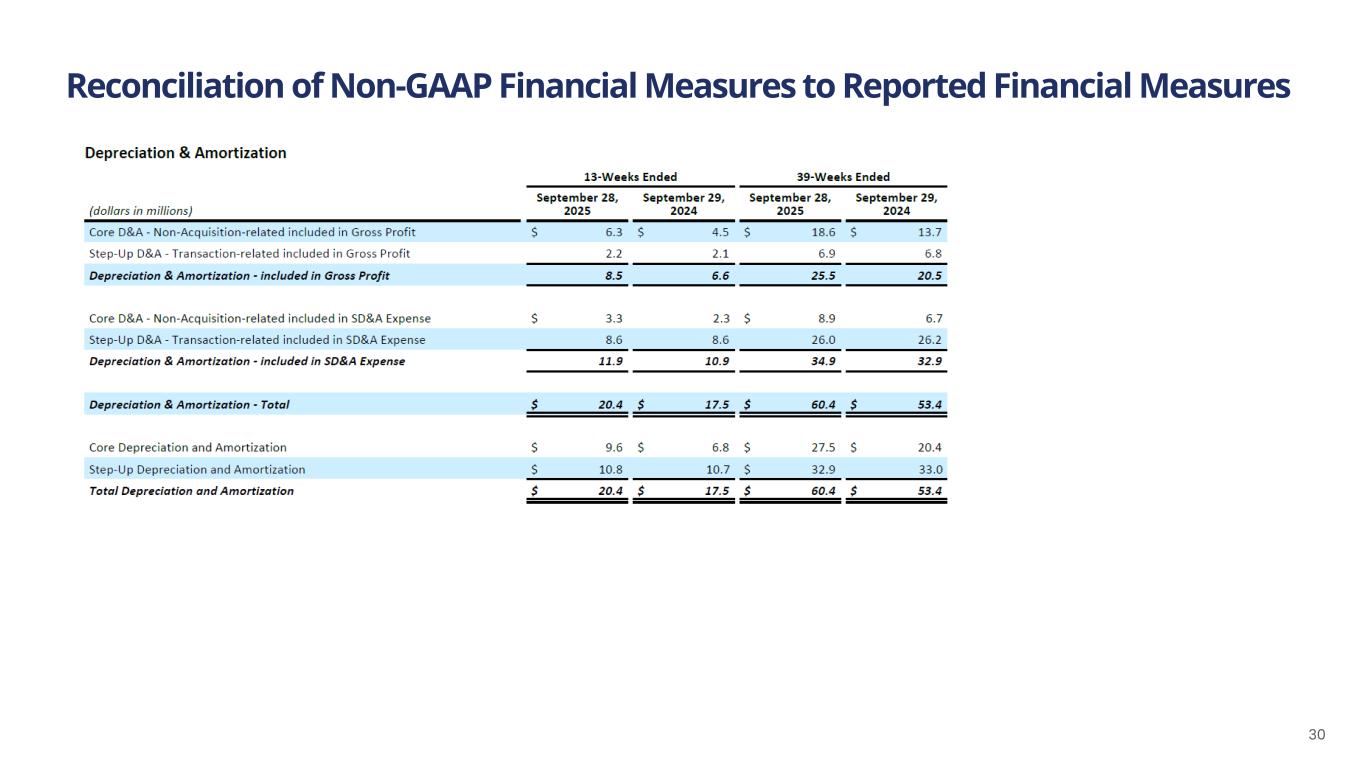
Reconciliation of Non-GAAP Financial Measures to Reported Financial Measures 30
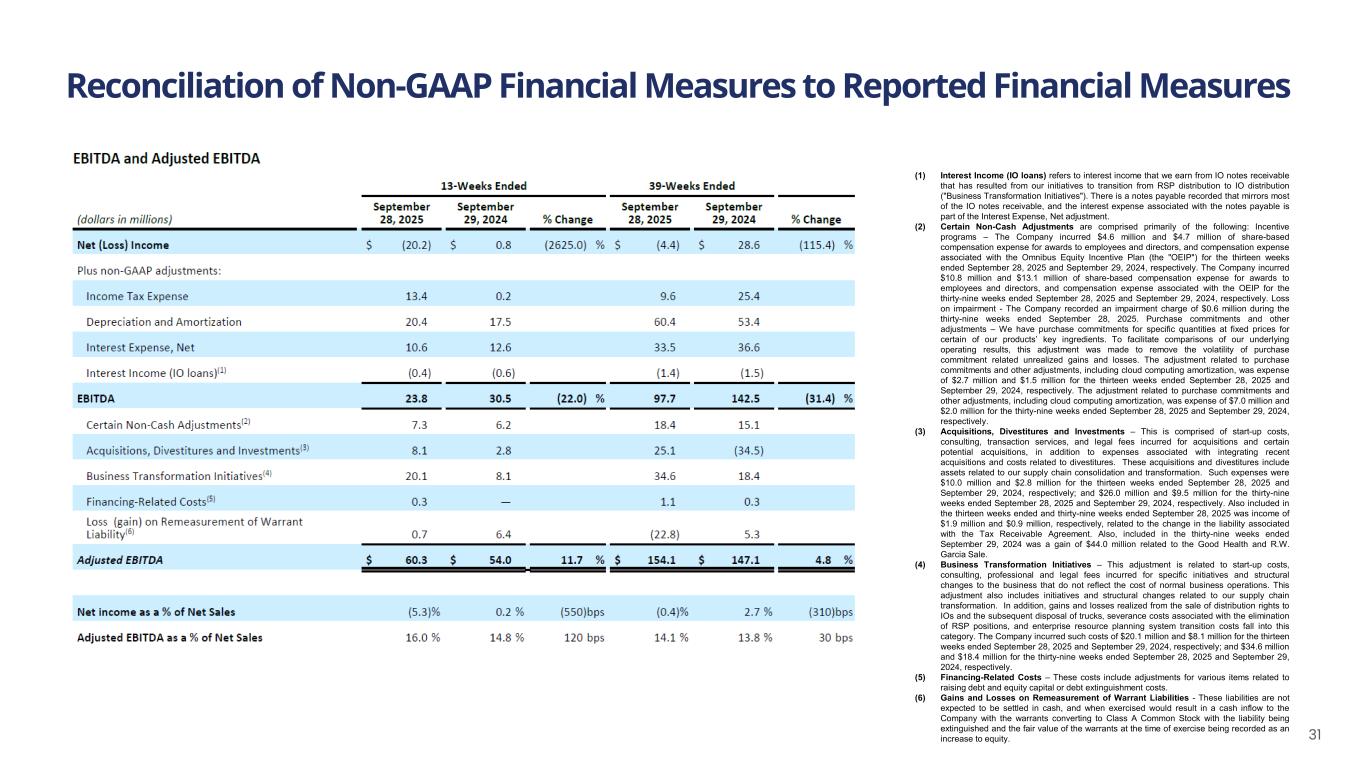
Reconciliation of Non-GAAP Financial Measures to Reported Financial Measures 31 (1) Interest Income (IO loans) refers to interest income that we earn from IO notes receivable that has resulted from our initiatives to transition from RSP distribution to IO distribution ("Business Transformation Initiatives"). There is a notes payable recorded that mirrors most of the IO notes receivable, and the interest expense associated with the notes payable is part of the Interest Expense, Net adjustment. (2) Certain Non-Cash Adjustments are comprised primarily of the following: Incentive programs – The Company incurred $4.6 million and $4.7 million of share-based compensation expense for awards to employees and directors, and compensation expense associated with the Omnibus Equity Incentive Plan (the "OEIP") for the thirteen weeks ended September 28, 2025 and September 29, 2024, respectively. The Company incurred $10.8 million and $13.1 million of share-based compensation expense for awards to employees and directors, and compensation expense associated with the OEIP for the thirty-nine weeks ended September 28, 2025 and September 29, 2024, respectively. Loss on impairment - The Company recorded an impairment charge of $0.6 million during the thirty-nine weeks ended September 28, 2025. Purchase commitments and other adjustments – We have purchase commitments for specific quantities at fixed prices for certain of our products’ key ingredients. To facilitate comparisons of our underlying operating results, this adjustment was made to remove the volatility of purchase commitment related unrealized gains and losses. The adjustment related to purchase commitments and other adjustments, including cloud computing amortization, was expense of $2.7 million and $1.5 million for the thirteen weeks ended September 28, 2025 and September 29, 2024, respectively. The adjustment related to purchase commitments and other adjustments, including cloud computing amortization, was expense of $7.0 million and $2.0 million for the thirty-nine weeks ended September 28, 2025 and September 29, 2024, respectively. (3) Acquisitions, Divestitures and Investments – This is comprised of start-up costs, consulting, transaction services, and legal fees incurred for acquisitions and certain potential acquisitions, in addition to expenses associated with integrating recent acquisitions and costs related to divestitures. These acquisitions and divestitures include assets related to our supply chain consolidation and transformation. Such expenses were $10.0 million and $2.8 million for the thirteen weeks ended September 28, 2025 and September 29, 2024, respectively; and $26.0 million and $9.5 million for the thirty-nine weeks ended September 28, 2025 and September 29, 2024, respectively. Also included in the thirteen weeks ended and thirty-nine weeks ended September 28, 2025 was income of $1.9 million and $0.9 million, respectively, related to the change in the liability associated with the Tax Receivable Agreement. Also, included in the thirty-nine weeks ended September 29, 2024 was a gain of $44.0 million related to the Good Health and R.W. Garcia Sale. (4) Business Transformation Initiatives – This adjustment is related to start-up costs, consulting, professional and legal fees incurred for specific initiatives and structural changes to the business that do not reflect the cost of normal business operations. This adjustment also includes initiatives and structural changes related to our supply chain transformation. In addition, gains and losses realized from the sale of distribution rights to IOs and the subsequent disposal of trucks, severance costs associated with the elimination of RSP positions, and enterprise resource planning system transition costs fall into this category. The Company incurred such costs of $20.1 million and $8.1 million for the thirteen weeks ended September 28, 2025 and September 29, 2024, respectively; and $34.6 million and $18.4 million for the thirty-nine weeks ended September 28, 2025 and September 29, 2024, respectively. (5) Financing-Related Costs – These costs include adjustments for various items related to raising debt and equity capital or debt extinguishment costs. (6) Gains and Losses on Remeasurement of Warrant Liabilities - These liabilities are not expected to be settled in cash, and when exercised would result in a cash inflow to the Company with the warrants converting to Class A Common Stock with the liability being extinguished and the fair value of the warrants at the time of exercise being recorded as an increase to equity.
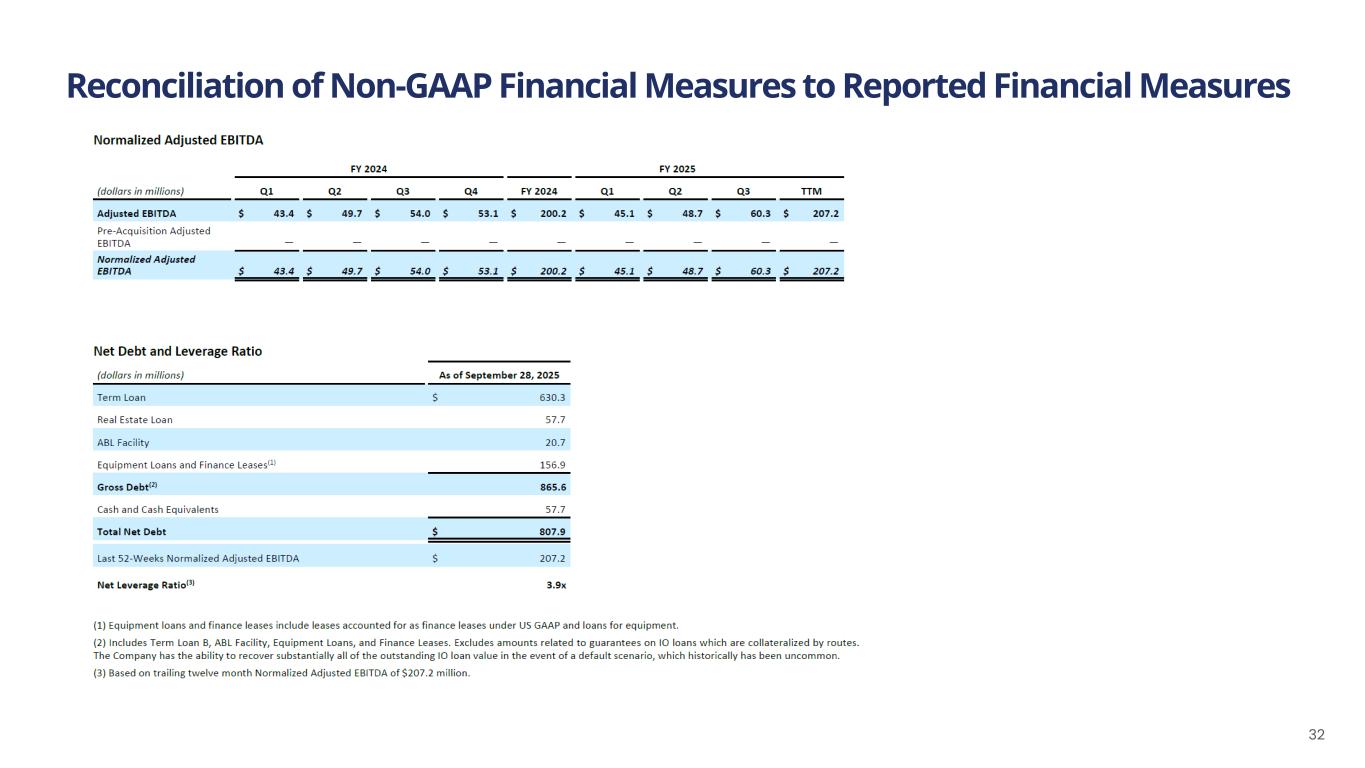
Reconciliation of Non-GAAP Financial Measures to Reported Financial Measures 32
Appendix Additional Reconciliations as Previously Disclosed 33
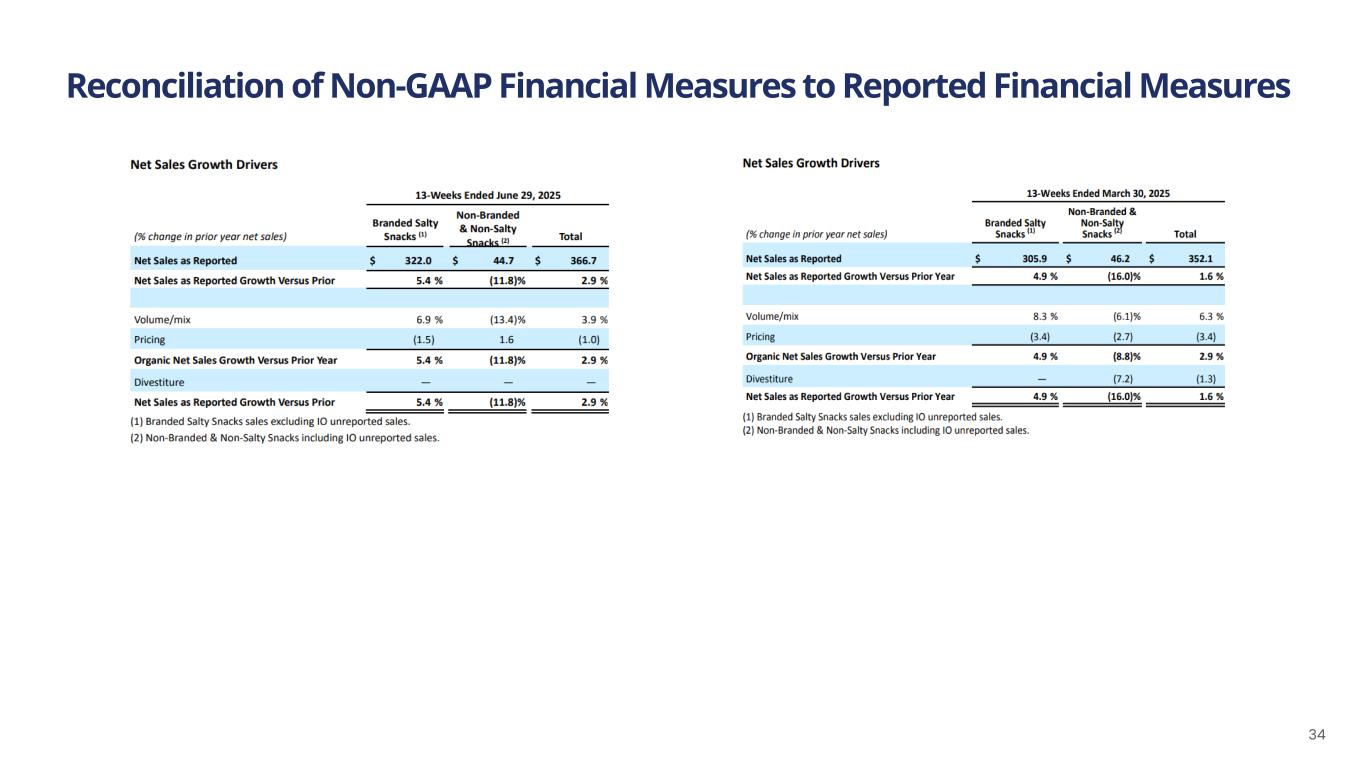
Reconciliation of Non-GAAP Financial Measures to Reported Financial Measures 34
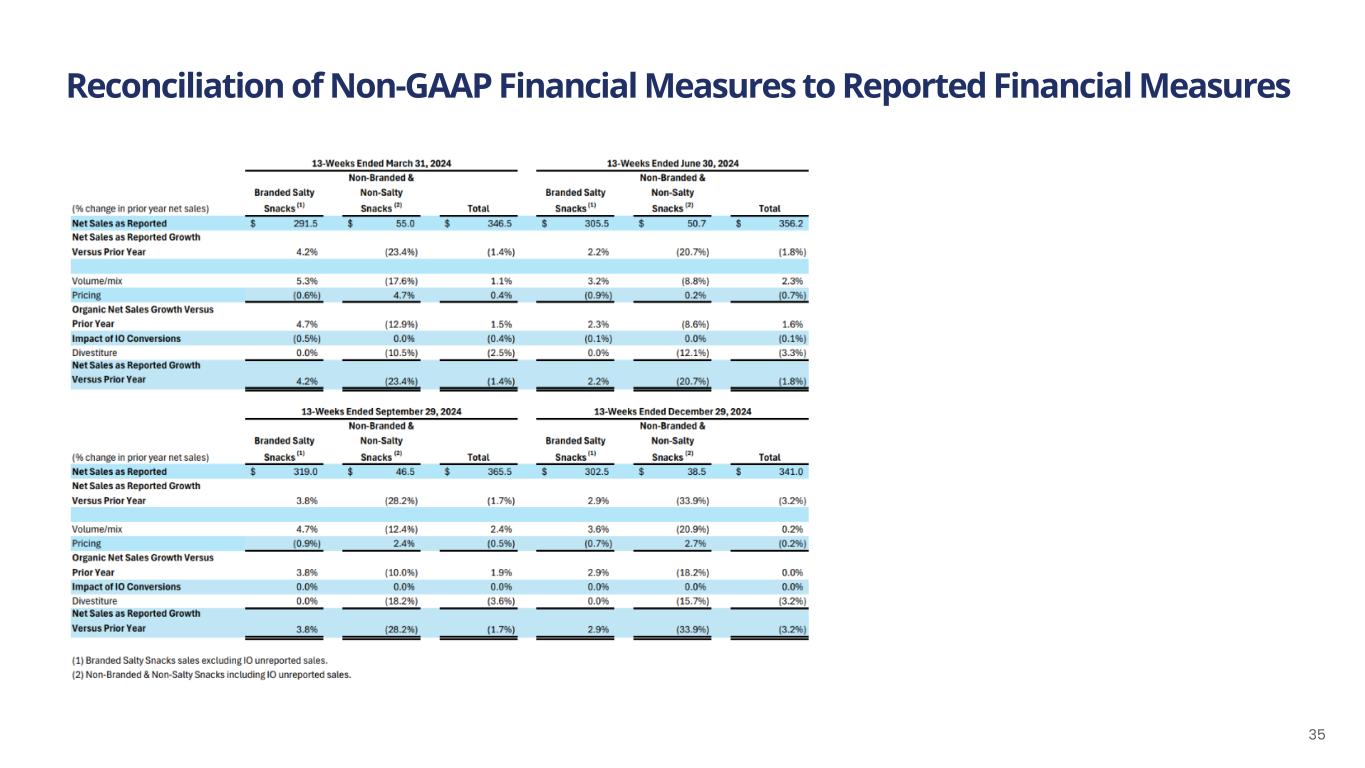
Reconciliation of Non-GAAP Financial Measures to Reported Financial Measures 35
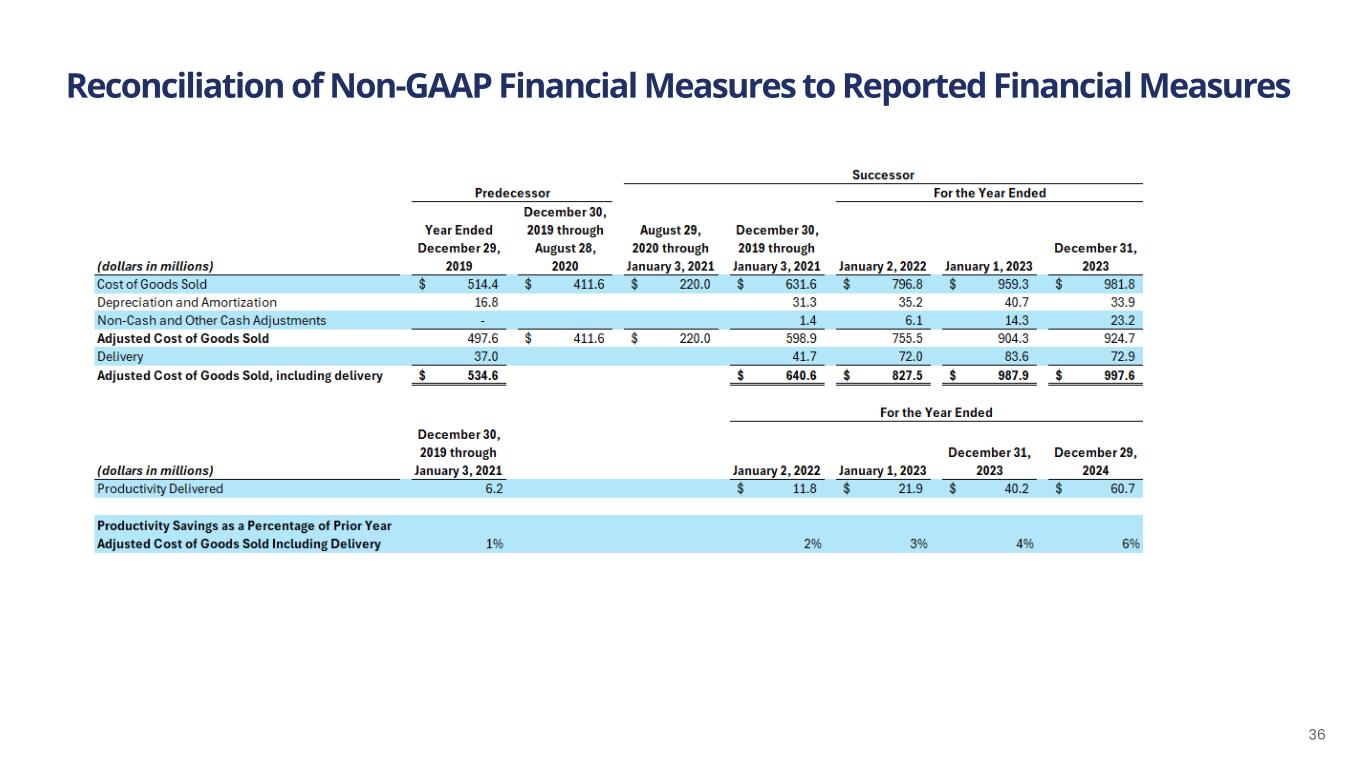
Reconciliation of Non-GAAP Financial Measures to Reported Financial Measures 36
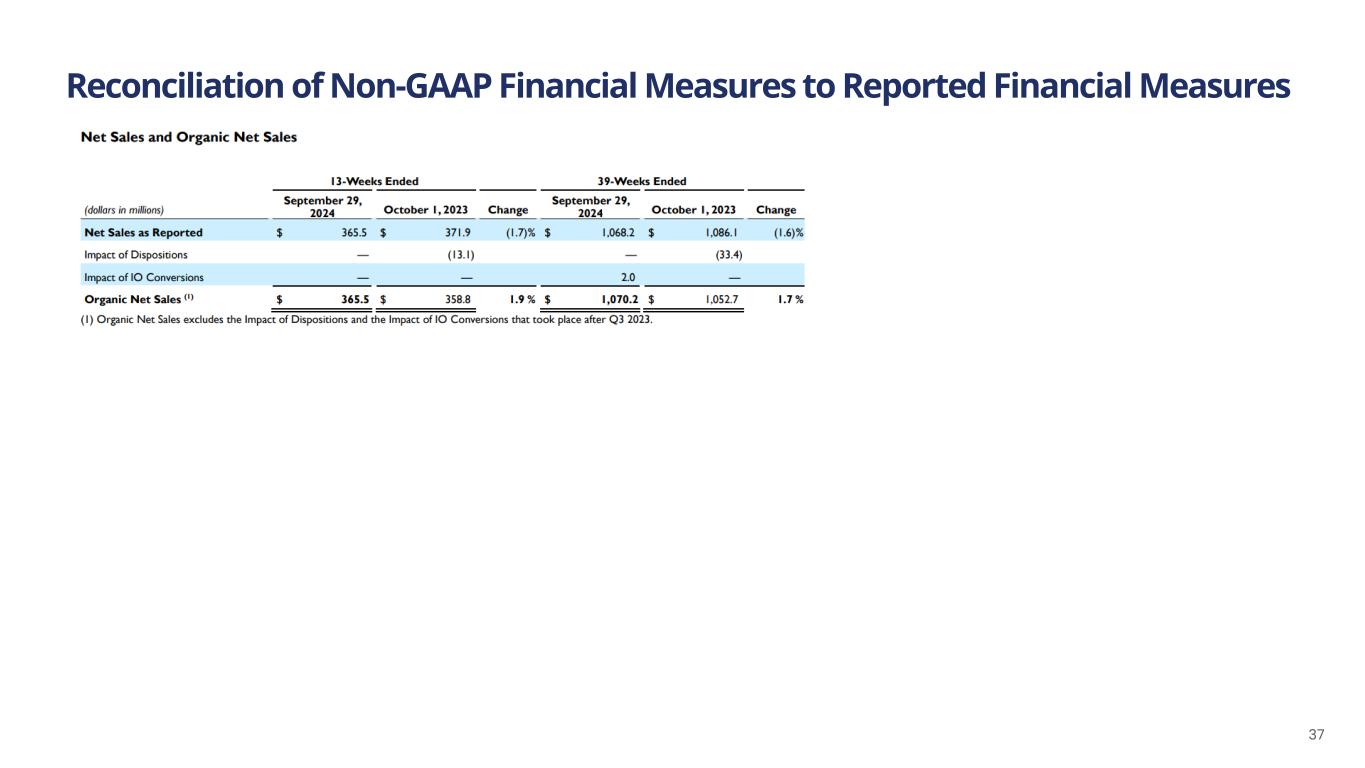
Reconciliation of Non-GAAP Financial Measures to Reported Financial Measures 37
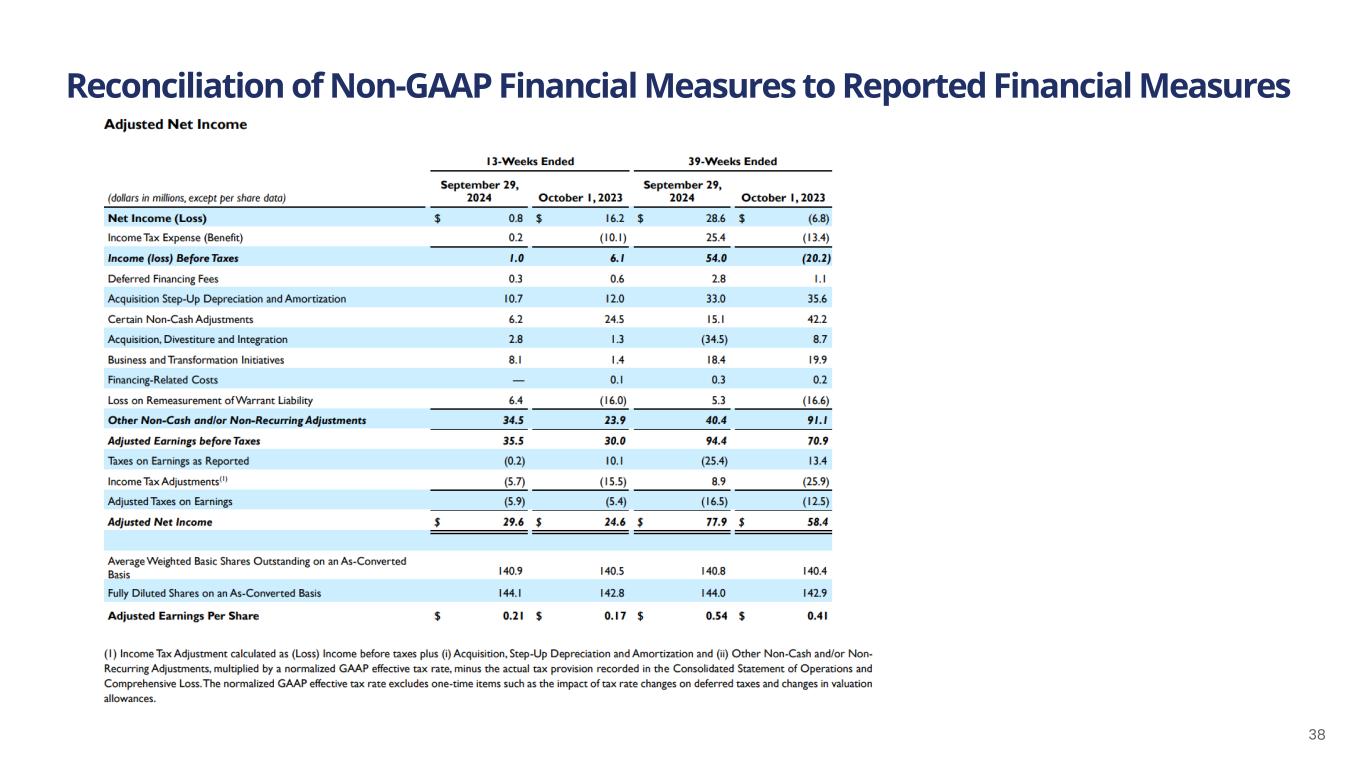
Reconciliation of Non-GAAP Financial Measures to Reported Financial Measures 38
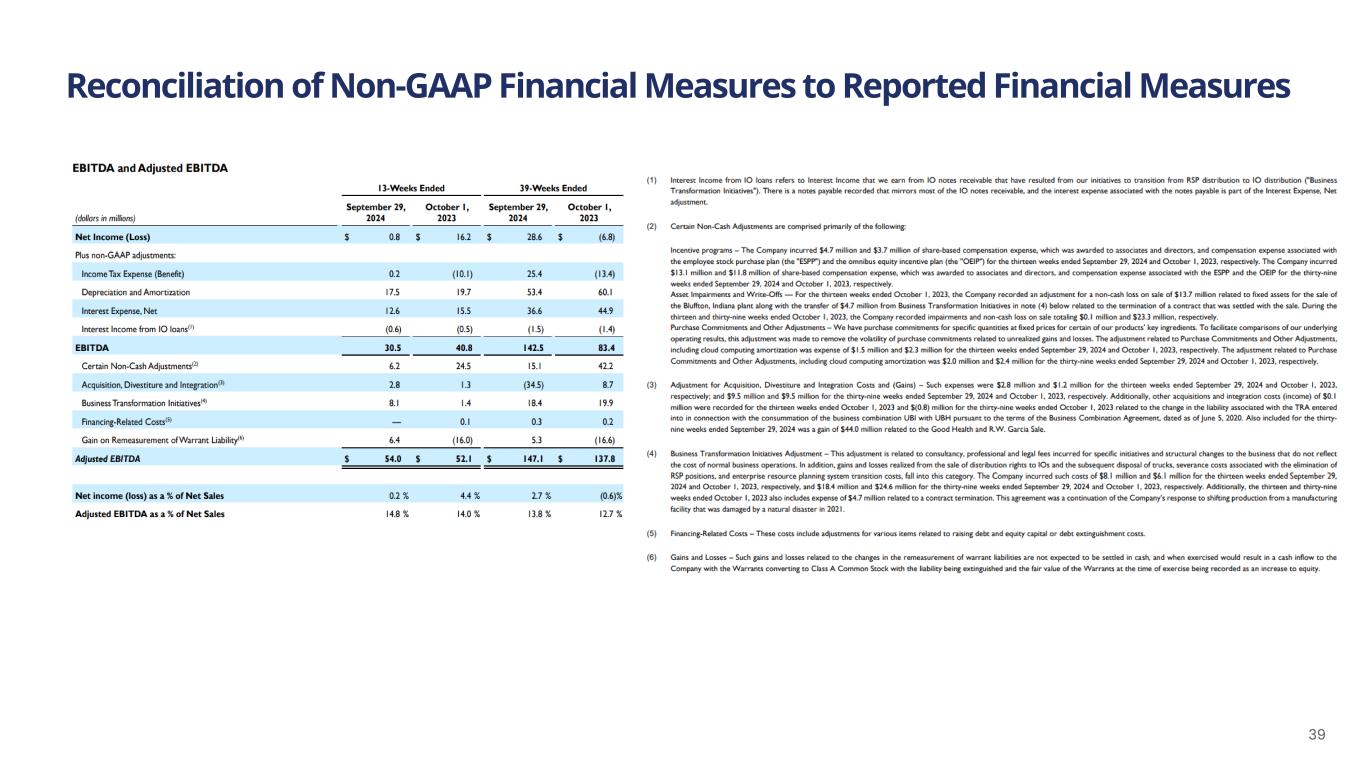
Reconciliation of Non-GAAP Financial Measures to Reported Financial Measures 39