
VSEC 8-K
Vse Corp (VSEC)
8-K
2022-07-28
For: 2022-07-27
View Original
Added on
July 04, 2026
UNITED STATES
SECURITIES AND EXCHANGE COMMISSION
Washington, D.C. 20549
FORM 8-K
CURRENT REPORT
Pursuant to Section 13 or 15(d) of the
Securities Exchange Act of 1934
Date of Report (Date of earliest event reported): July 27, 2022
(Exact name of registrant as specified in its charter)
(State or Other Jurisdiction of Incorporation) | (Commission File Number) | (IRS Employer Identification Number) | ||||||||||||
(Address of Principal Executive Offices) | (Zip Code) | ||||||||||||||||
(703 ) 960-4600
(Registrant's Telephone Number, Including Area Code)
Not Applicable
(Former Name or Former Address, if Changed Since Last Report)
Check the appropriate box below if the Form 8-K filing is intended to simultaneously satisfy the filing obligation of the registrant under any of the following provisions:
| Written communications pursuant to Rule 425 under the Securities Act (17 CFR 230.425) | |||||
| Soliciting material pursuant to Rule 14a-12 under the Exchange Act (17 CFR 240.14a-12) | |||||
| Pre-commencement communications pursuant to Rule 14d-2(b) under the Exchange Act (17 CFR 240.14d-2(b)) | |||||
| Pre-commencement communications pursuant to Rule 13e-4(c) under the Exchange Act (17 CFR 240.13e-4(c)) | |||||
Securities registered pursuant to Section 12(b) of the Act:
Title of each class | Trading Symbol(s) | Name of each exchange on which registered | ||||||||||||
Indicate by check mark whether the registrant is an emerging growth company as defined in Rule 405 of the Securities Act of 1933 (§ 230.405 of this chapter) or Rule 12b-2 of the Securities Exchange Act of 1934 (§ 240.12b-2 of this chapter).
Emerging growth company ☐
If an emerging growth company, indicate by check mark if the registrant has elected not to use the extended transition period for complying with any new or revised financial accounting standards provided pursuant to Section 13(a) of the Exchange Act. ☐
VSE CORPORATION
Item 2.02 Results of Operations and Financial Condition.
On July 27, 2022, the Company issued a press release reporting its financial results for the second quarter ended June 30, 2022. Additionally, the Company made available related materials to be discussed during the Company’s webcast and conference call referred to in such press release. A copy of the press release and related conference call materials are being furnished as Exhibits 99.1 and 99.2, respectively, to this Current Report on Form 8-K and are hereby incorporated by reference.
The information in the preceding paragraph, as well as Exhibits 99.1 and 99.2, shall not be deemed “filed” for purposes of Section 18 of the Securities Exchange Act of 1934, as amended (the “Exchange Act”), or otherwise subject to the liabilities of that section. It may only be incorporated by reference into another filing under the Exchange Act or the Securities Act of 1933, as amended if such subsequent filing specifically references this Current Report on Form 8-K.
Item 9.01 Financial Statements and Exhibits.
(d) Exhibits
| Exhibit | |||||
| Number | |||||
| 99.1 | |||||
| 99.2 | |||||
| 104 | Cover Page Interactive Data File | ||||
VSE CORPORATION AND SUBSIDIARIES
SIGNATURES
Pursuant to the requirements of the Securities Exchange Act of 1934, as amended, the Registrant has duly caused this report to be signed on its behalf by the undersigned hereunto duly authorized.
VSE CORPORATION | |||||||||||
(Registrant) | |||||||||||
Date: | July 27, 2022 | By: | /s/ Stephen D. Griffin | ||||||||
| Stephen D. Griffin | |||||||||||
| Senior Vice President and Chief Financial Officer | |||||||||||
| (Principal Financial Officer and Principal Accounting Officer) | |||||||||||

VSE Corporation Announces Second Quarter 2022 Results
Revenue Increased 38% Year-over-Year; Record Setting $105 Million Revenue Quarter for Aviation
ALEXANDRIA, Va., July 27, 2022 - VSE Corporation (NASDAQ: VSEC, "VSE", or the "Company"), a leading provider of aftermarket distribution and maintenance, repair and overhaul ("MRO") services for land, sea and air transportation assets for government and commercial markets, today announced results for the second quarter 2022.
SECOND QUARTER 2022 RESULTS
(As compared to the Second Quarter 2021)
▪Total Revenues of $241.7 million increased 38%
▪GAAP Net Income of $7.5 million increased $19.9 million
▪GAAP EPS (Diluted) of $0.59 increased $1.56
▪Adjusted EBITDA of $22.9 million increased 21%
▪Adjusted Net Income of $9.6 million increased 25%
▪Adjusted EPS (Diluted) of $0.75 increased 25%
Aviation segment revenue increased 121% year-over-year to a record $105.0 million in the second quarter 2022. The year-over-year revenue improvement was attributable to share gains within the Business and General Aviation (B&GA) market and continued commercial end-market recovery. Aviation distribution and repair revenue increased 177% and 37%, respectively, in the second quarter 2022 versus the prior-year period. The Aviation segment reported operating income of $6.5 million in the second quarter, compared to an operating loss of $22.3 million in the same period of 2021. Segment adjusted EBITDA increased by 198% in the second quarter to $11.9 million, versus $4.0 million in the prior-year period. Adjusted EBITDA margin was 11.4%, an increase of 293 basis points versus the prior-year period, driven by execution of new program awards and end-market recovery.
Fleet segment revenue increased 12% year-over-year to $64.7 million in the second quarter 2022. Revenues from commercial customers increased 48% on a year-over-year basis, driven by growth in commercial fleet demand and e-commerce fulfillment sales. Commercial revenue represented 40% of total Fleet segment revenue in the period. Segment adjusted EBITDA increased 10% year-over-year to $7.7 million, while adjusted EBITDA margin was 12.0%, flat with the prior-year period.
Federal and Defense segment revenue increased 3% year-over-year to $72.0 million in the second quarter 2022, driven by growth in the Foreign Military Sales (FMS) program with the U.S. Navy along with a steady increase in Defense Logistics Agency (DLA) distribution services, offset by the expiration of a certain U.S. Army contract. Segment adjusted EBITDA declined 58% year-over-year to $3.4 million in the period, given a higher mix of cost-plus contracts. Funded backlog decreased 1% year-to-date to $183 million while bookings decreased 9% year-to-date, primarily driven by the expiration of a certain U.S. Army contract.
STRATEGIC UPDATE
During the second quarter, VSE continued to effectively execute its business transformation roadmap, with a focus on developing a market-leading aftermarket parts distribution and MRO services platform supporting higher-growth end-markets. Building long-term sustainable revenue channels, growing adjusted EBITDA, and optimizing legacy programs remain key focus areas for value creation. The Company’s second quarter results demonstrate strong execution on recently awarded new business, organic investments to drive growth, and the continued optimization of legacy programs.
Building Long-Term, Sustainable Revenue Channels:
•During the second quarter, Aviation achieved its first-ever quarter exceeding $100M of revenue, growing more than 121% year-over-year, supported by growth in distribution and MRO revenue channels, and growth within both commercial and business and general aviation (B&GA) customer markets.
•More than 50% of Aviation second quarter revenue is a result of the successful implementation of more than $1.5B of new awards signed in the last 18 months, and contributions from the 2021 Global Parts Group Inc. acquisition. VSE Aviation successfully launched new programs with a specific focus on the B&GA market. These programs expanded VSE's B&GA customer base from 100 in 2020 to over 3,000 unique B&GA customers in 2022. Further, all programs and integrations are performing ahead of initial expectations.
•Aviation MRO revenue increased 37% versus the prior-year period, driven by higher B&GA flight activity and maintenance, as well as recovery within commercial MRO customers. New, organic repair capability additions and share of wallet expansion in the B&GA space contributed to this outperformance.
•During the second quarter, Fleet continued to generate strong revenue growth across its commercial fleet and e-commerce fulfillment businesses, resulting in a 48% year-over-year increase in commercial revenue. The continued diversification strategy is reflected in commercial revenue now comprising 40% of Fleet segment total revenue, up from 10% in 2019. These results are driven by sustained program execution and strong end-market demand. The Fleet segment continues to expand operations and supply chain capabilities to meet growing demand.
•The Federal and Defense segment won $4 million of new Distribution and Logistics Agency (DLA) awards in the second quarter, representing a 2.5x book-to-bill ratio year-to-date. This revenue channel builds on new capabilities, allowing the Federal and Defense segment to serve its customers by providing more comprehensive solutions for their global supply chain.
Growing Adjusted EBITDA:
•Aviation segment adjusted EBITDA grew to $11.9 million in the second quarter, an increase of 198% versus the prior-year period. Increased MRO activity continued to drive margin expansion. Commercial MRO revenue remains at approximately 75% of 2019 levels, in line with commercial airline end-market activity, and is anticipated to recover by 2024.
•Fleet segment adjusted EBITDA grew to $7.7 million, up 10% year-over-year. The segment's strong focus on commercial growth continues, underpinned by robust class 4-8 and heavy-duty vehicle aftermarket activity.
Optimizing Legacy Programs:
•Fleet segment's USPS revenue grew to $36.9 million, up 4% in the second quarter versus the prior-year period. Servicing all vehicle types in the 230,000+ USPS vehicle fleet, the Fleet segment continues its long history of serving as an essential part of USPS maintenance operations in support of their complex supply chain.
•Federal and Defense revenue on the Naval Sea Systems Command (NAVSEA) contract increased 43% year-over-year in the second quarter of 2022, primarily resulting from efforts related to Foreign Military Sales (FMS) support in Bahrain.
MANAGEMENT COMMENTARY
“During the second quarter, we continued to advance our growth and diversification strategy, while demonstrating focused execution on new program wins, both of which contributed to strong year-over-year growth in revenue and profitability,” stated John Cuomo, President and CEO of VSE Corporation. “We delivered another record-revenue quarter within both Aviation and commercial Fleet, leveraging our customer-centric aftermarket distribution and MRO value proposition. Our results for the first half of 2022 demonstrate the strength and resiliency of the VSE team, and the demand for our products and services in the growing, fragmented markets we serve.”
“Our Aviation segment reported a record quarter, as revenue increased 121% on a year-over-year basis to more than $105 million, while adjusted EBITDA margin increased 293 basis points to 11.4% in the second quarter,” continued Cuomo. “This performance was supported by a combination of recent market share gains, together with improved demand within both commercial aviation and B&GA end-markets. The Aviation segment continues to execute with excellence on both legacy and new programs wins.”
“Within our Fleet segment, commercial revenue increased 48% on a year-year basis in the second quarter, supported by demand across both our commercial fleet and e-commerce channels,” continued Cuomo. “We will continue to make investments in this growing market, as our customers value our team's ability to solve their complex supply chain distribution challenges.”
“We generated strong momentum across all of our business segments in the first half of 2022,” stated Stephen Griffin, CFO of VSE Corporation. “Our second quarter adjusted EBITDA of $22.9 million, up $4.0 million year-over-year, supports the growth and profitability outlook we communicated in first quarter 2022,” continued Griffin. “As previously communicated, we expect to generate positive cash flow for the full year, as well as a corresponding improvement in net leverage. We look forward to updating shareholders on the progress of our strategy during our Investor Day later this year.”
FINANCIAL RESOURCES AND LIQUIDITY
As of June 30, 2022, the Company had $91 million in cash and unused commitment availability under its $350 million revolving credit facility maturing in 2024. As of June 30, 2022, VSE had total net debt outstanding of $308 million and $84.3 million of trailing-twelve months adjusted EBITDA.
SECOND QUARTER RESULTS
| Three months ended June 30, | Six months ended June 30, | |||||||||||||||||||||||||||||||||||||
| (in thousands, except per share data) | 2022 | 2021 | % Change | 2022 | 2021 | % Change | ||||||||||||||||||||||||||||||||
| Revenues | $ | 241,713 | $ | 175,112 | 38.0 | % | $ | 472,952 | $ | 340,093 | 39.1 | % | ||||||||||||||||||||||||||
| Operating income (loss) | $ | 14,151 | $ | (12,714) | NM(1) | $ | 26,065 | $ | (3,111) | NM(1) | ||||||||||||||||||||||||||||
| Net income (loss) | $ | 7,548 | $ | (12,366) | NM(1) | $ | 13,792 | $ | (7,255) | NM(1) | ||||||||||||||||||||||||||||
| EPS (Diluted) | $ | 0.59 | $ | (0.97) | NM(1) | $ | 1.08 | $ | (0.59) | NM(1) | ||||||||||||||||||||||||||||
(1) Not meaningful as prior period was a net loss | ||||||||||||||||||||||||||||||||||||||
SECOND QUARTER SEGMENT RESULTS
The following is a summary of revenues and operating income (loss) for the three and six months ended June 30, 2022 and June 30, 2021:
| Three months ended June 30, | Six months ended June 30, | |||||||||||||||||||||||||||||||||||||
| (in thousands) | 2022 | 2021 | % Change | 2022 | 2021 | % Change | ||||||||||||||||||||||||||||||||
| Revenues: | ||||||||||||||||||||||||||||||||||||||
| Aviation | $ | 105,019 | $ | 47,515 | 121.0 | % | $ | 198,309 | $ | 91,886 | 115.8 | % | ||||||||||||||||||||||||||
| Fleet | 64,742 | 58,057 | 11.5 | % | 131,772 | 112,804 | 16.8 | % | ||||||||||||||||||||||||||||||
| Federal & Defense | 71,952 | 69,540 | 3.5 | % | 142,871 | 135,403 | 5.5 | % | ||||||||||||||||||||||||||||||
| Total revenues | $ | 241,713 | $ | 175,112 | 38.0 | % | $ | 472,952 | $ | 340,093 | 39.1 | % | ||||||||||||||||||||||||||
| Operating income (loss): | ||||||||||||||||||||||||||||||||||||||
| Aviation | $ | 6,450 | $ | (22,272) | NM(1) | $ | 14,072 | $ | (22,604) | NM(1) | ||||||||||||||||||||||||||||
| Fleet | 5,366 | 4,000 | 34.2 | % | 11,747 | 9,741 | 20.6 | % | ||||||||||||||||||||||||||||||
| Federal & Defense | 2,552 | 6,999 | (63.5) | % | 1,864 | 12,024 | (84.5) | % | ||||||||||||||||||||||||||||||
| Corporate/unallocated expenses | (217) | (1,441) | (84.9) | % | (1,618) | (2,272) | (28.8) | % | ||||||||||||||||||||||||||||||
| Operating income (loss) | $ | 14,151 | $ | (12,714) | (211.3) | % | $ | 26,065 | $ | (3,111) | (937.8) | % | ||||||||||||||||||||||||||
(1) Not meaningful as prior period was a net loss | ||||||||||||||||||||||||||||||||||||||
The Company reported $1.5 million and $2.7 million of total capital expenditures for three and six months ended June 30, 2022.
NON-GAAP MEASURES
In addition to the financial measures prepared in accordance with generally accepted accounting principles ("GAAP"), this earnings release also contains Non-GAAP financial measures. These measures provide useful information to investors, and a reconciliation of these measures to the most directly comparable GAAP measures and other information relating to these Non-GAAP measures is included in the supplemental schedules attached.
NON-GAAP FINANCIAL INFORMATION
Reconciliation of Adjusted Net Income and Adjusted EPS to Net Income
| Three months ended June 30, | Six months ended June 30, | ||||||||||||||||||||||||||||
| (in thousands) | 2022 | 2021 | 2022 | 2021 | |||||||||||||||||||||||||
| Net income (loss) | $ | 7,548 | $ | (12,366) | $ | 13,792 | $ | (7,255) | |||||||||||||||||||||
| Adjustments to net income: | |||||||||||||||||||||||||||||
| Acquisition, integration and restructuring costs | 344 | 236 | 632 | 546 | |||||||||||||||||||||||||
| Executive transition costs | — | 905 | — | 905 | |||||||||||||||||||||||||
| Inventory reserve | — | 24,420 | — | 24,420 | |||||||||||||||||||||||||
| Non-recurring professional fees | — | — | 218 | — | |||||||||||||||||||||||||
| Forward contract loss provision | — | — | 3,482 | — | |||||||||||||||||||||||||
Russia/Ukraine conflict (1) | 2,335 | — | 2,335 | — | |||||||||||||||||||||||||
| 10,227 | 13,195 | 20,459 | 18,616 | ||||||||||||||||||||||||||
| Tax impact of adjusted items | (669) | (5,541) | (1,665) | (5,619) | |||||||||||||||||||||||||
| Adjusted net income | $ | 9,558 | $ | 7,654 | $ | 18,794 | $ | 12,997 | |||||||||||||||||||||
| Weighted average dilutive shares | 12,811 | 12,702 | 12,807 | 12,391 | |||||||||||||||||||||||||
| Adjusted EPS (Diluted) | $ | 0.75 | $ | 0.60 | $ | 1.47 | $ | 1.05 | |||||||||||||||||||||
(1) Adjustment represents a non-cash charge recorded to reduce the carrying amount of accounts receivable and inventory related to the Russia/Ukraine military conflict. | |||||||||||||||||||||||||||||
Reconciliation of Consolidated EBITDA and Adjusted EBITDA to Net Income
| Three months ended June 30, | Six months ended June 30, | ||||||||||||||||||||||||||||
| (in thousands) | 2022 | 2021 | 2022 | 2021 | |||||||||||||||||||||||||
| Net income (loss) | $ | 7,548 | $ | (12,366) | $ | 13,792 | $ | (7,255) | |||||||||||||||||||||
| Interest expense | 3,872 | 2,666 | 7,481 | 5,696 | |||||||||||||||||||||||||
| Income taxes | 2,731 | (3,014) | 4,792 | (1,552) | |||||||||||||||||||||||||
| Amortization of intangible assets | 4,437 | 4,603 | 9,173 | 8,891 | |||||||||||||||||||||||||
| Depreciation and other amortization | 1,659 | 1,424 | 3,258 | 2,784 | |||||||||||||||||||||||||
| EBITDA | 20,247 | (6,687) | 38,496 | 8,564 | |||||||||||||||||||||||||
| Acquisition, integration and restructuring costs | 344 | 236 | 632 | 546 | |||||||||||||||||||||||||
| Executive transition costs | — | 905 | — | 905 | |||||||||||||||||||||||||
| Inventory reserve | — | 24,420 | — | 24,420 | |||||||||||||||||||||||||
| Non-recurring professional fees | — | — | 218 | — | |||||||||||||||||||||||||
| Forward contract loss provision | — | — | 3,482 | — | |||||||||||||||||||||||||
Russia/Ukraine conflict (1) | 2,335 | — | 2,335 | — | |||||||||||||||||||||||||
| Adjusted EBITDA | $ | 22,926 | $ | 18,874 | $ | 45,163 | $ | 34,435 | |||||||||||||||||||||
(1) Adjustment represents a non-cash charge recorded to reduce the carrying amount of accounts receivable and inventory related to the Russia/Ukraine military conflict. | |||||||||||||||||||||||||||||
| Adjusted EBITDA Summary | ||||||||||||||||||||||||||||||||||||||
| Three months ended June 30, | Six months ended June 30, | |||||||||||||||||||||||||||||||||||||
| (in thousands) | 2022 | 2021 | % Change | 2022 | 2021 | % Change | ||||||||||||||||||||||||||||||||
| Aviation | $ | 11,935 | $ | 4,009 | 197.7 | % | $ | 22,798 | $ | 6,231 | 265.9 | % | ||||||||||||||||||||||||||
| Fleet | 7,741 | 7,041 | 9.9 | % | 16,532 | 15,122 | 9.3 | % | ||||||||||||||||||||||||||||||
| Federal & Defense | 3,443 | 8,123 | (57.6) | % | 7,209 | 13,902 | (48.1) | % | ||||||||||||||||||||||||||||||
Adjusted Corporate expenses (2) | (193) | (299) | (35.5) | % | (1,376) | (820) | 67.8 | % | ||||||||||||||||||||||||||||||
| Adjusted EBITDA | $ | 22,926 | $ | 18,874 | 21.5 | % | $ | 45,163 | $ | 34,435 | 31.2 | % | ||||||||||||||||||||||||||
(2) Includes certain adjustments not directly attributable to any of our segments. | ||||||||||||||||||||||||||||||||||||||
Reconciliation of Segment EBITDA and Adjusted EBITDA to Operating Income (Loss)
| Three months ended June 30, | Six months ended June 30, | ||||||||||||||||||||||||||||
| (in thousands) | 2022 | 2021 | 2022 | 2021 | |||||||||||||||||||||||||
| Aviation | |||||||||||||||||||||||||||||
| Operating income (loss) | $ | 6,450 | $ | (22,272) | $ | 14,072 | $ | (22,604) | |||||||||||||||||||||
| Depreciation and amortization | 3,110 | 2,554 | 6,145 | 5,108 | |||||||||||||||||||||||||
| EBITDA | 9,560 | (19,718) | 20,217 | (17,496) | |||||||||||||||||||||||||
| Acquisition, integration and restructuring costs | 40 | — | 246 | — | |||||||||||||||||||||||||
| Inventory reserve | — | 23,727 | — | 23,727 | |||||||||||||||||||||||||
Russia/Ukraine conflict (1) | 2,335 | — | 2,335 | — | |||||||||||||||||||||||||
| Adjusted EBITDA | $ | 11,935 | $ | 4,009 | $ | 22,798 | $ | 6,231 | |||||||||||||||||||||
| Fleet | |||||||||||||||||||||||||||||
| Operating income | $ | 5,366 | $ | 4,000 | $ | 11,747 | $ | 9,741 | |||||||||||||||||||||
| Depreciation and amortization | 2,246 | 2,348 | 4,575 | 4,688 | |||||||||||||||||||||||||
| EBITDA | 7,612 | 6,348 | 16,322 | 14,429 | |||||||||||||||||||||||||
| Acquisition, integration and restructuring costs | 129 | — | 210 | — | |||||||||||||||||||||||||
| Inventory reserve | — | 693 | — | 693 | |||||||||||||||||||||||||
| Adjusted EBITDA | $ | 7,741 | $ | 7,041 | $ | 16,532 | $ | 15,122 | |||||||||||||||||||||
| Federal & Defense | |||||||||||||||||||||||||||||
| Operating income | $ | 2,552 | $ | 6,999 | $ | 1,864 | $ | 12,024 | |||||||||||||||||||||
| Depreciation and amortization | 739 | 1,124 | 1,711 | 1,878 | |||||||||||||||||||||||||
| EBITDA | $ | 3,291 | $ | 8,123 | $ | 3,575 | $ | 13,902 | |||||||||||||||||||||
| Forward contract loss provision | — | — | 3,482 | — | |||||||||||||||||||||||||
| Acquisition, integration and restructuring costs | 152 | — | 152 | — | |||||||||||||||||||||||||
| Adjusted EBITDA | $ | 3,443 | $ | 8,123 | $ | 7,209 | $ | 13,902 | |||||||||||||||||||||
(1) Adjustment represents a non-cash charge recorded to reduce the carrying amount of accounts receivable and inventory related to the Russia/Ukraine military conflict. | |||||||||||||||||||||||||||||
Reconciliation of Operating Cash to Free Cash Flow
| Three months ended June 30, | Six months ended June 30, | |||||||||||||||||||||||||
| (in thousands) | 2022 | 2021 | 2022 | 2021 | ||||||||||||||||||||||
| Net cash (used in) provided by operating activities | $ | (1,964) | $ | (17,601) | $ | (20,138) | $ | (53,968) | ||||||||||||||||||
| Capital expenditures | (1,477) | (3,049) | (2,746) | (5,158) | ||||||||||||||||||||||
| Free cash flow | $ | (3,441) | $ | (20,650) | $ | (22,884) | $ | (59,126) | ||||||||||||||||||
Reconciliation of Debt to Net Debt
| June 30, | December 31, | |||||||||||||
| (in thousands) | 2022 | 2021 | ||||||||||||
| Principal amount of debt | $ | 310,356 | $ | 286,734 | ||||||||||
| Debt issuance costs | (1,746) | (2,165) | ||||||||||||
| Cash and cash equivalents | (371) | (518) | ||||||||||||
| Net debt | $ | 308,239 | $ | 284,051 | ||||||||||
The non-GAAP Financial Information set forth in this document is not calculated in accordance with GAAP under SEC Regulation G. We consider Adjusted Net Income, Adjusted EPS (Diluted), EBITDA, Adjusted EBITDA, net debt and free cash flow as non-GAAP financial measures and important indicators of performance and useful metrics for management and investors to evaluate our business' ongoing operating performance on a consistent basis across reporting periods. These non-GAAP financial measures, however, should not be considered in isolation or as a substitute for performance measures prepared in accordance with GAAP. Adjusted Net Income represents Net Income adjusted for acquisition-related costs, forward contract loss provision and other discrete items, and related tax impact. Adjusted EPS (Diluted) is computed by dividing net income, adjusted for the discrete items as identified above and the related tax impacts, by the diluted weighted average number of common shares outstanding. EBITDA represents net income before interest expense, income taxes, amortization of intangible assets and depreciation and other amortization. Adjusted EBITDA represents EBITDA (as defined above) adjusted for the discrete items as identified above. Net debt is defined as total debt less cash and cash equivalents. Free cash flow represents operating cash flow less capital expenditures.
CONFERENCE CALL
A conference call will be held Thursday, July 28, 2022 at 8:30 A.M. EST to review the Company’s financial results, discuss recent events and conduct a question-and-answer session.
A webcast of the conference call and accompanying presentation materials will be available in the Investor Relations section of VSE’s website at https://ir.vsecorp.com. To listen to the live broadcast, go to the site at least 15 minutes prior to the scheduled start time in order to register, download and install any necessary audio software.
To participate in the live teleconference:
Domestic Live: | (877) 407-0789 | ||||
International Live: | (201) 689-8562 | ||||
| Audio Webcast: | https://viavid.webcasts.com/starthere.jsp?ei=1558232&tp_key=b7dc062da4 | ||||
To listen to a replay of the teleconference through August 11, 2022:
Domestic Replay: | (844) 512-2921 | ||||
International Replay: | (412) 317-6671 | ||||
Replay PIN Number: | 13731169 | ||||
ABOUT VSE CORPORATION
VSE is a leading provider of aftermarket distribution and repair services for land, sea and air transportation assets for government and commercial markets. Core services include MRO services, parts distribution, supply chain management and logistics, engineering support, and consulting and training services for global commercial, federal, military and defense customers. VSE also provides information technology and energy consulting services. For additional information regarding VSE’s services and products, visit www.vsecorp.com.
AVIATION
Distribution & MRO Services
VSE’s Aviation segment provides aftermarket MRO and distribution services to commercial, business and general aviation, cargo, military/defense and rotorcraft customers globally. Core services include parts distribution, component and engine accessory MRO services, rotable exchange and supply chain services.
FLEET
Distribution & Fleet Services
VSE's Fleet segment provides parts, inventory management, e-commerce fulfillment, logistics, supply chain support and other services to the commercial aftermarket medium- and heavy-duty truck market, the United States Postal Service (USPS), and the United States Department of Defense. Core services include parts distribution, sourcing, IT solutions, customized fleet logistics, warehousing, kitting, just-in-time supply chain management, alternative product sourcing, engineering and technical support.
FEDERAL & DEFENSE
Logistics & Sustainment Services
VSE's Federal & Defense segment provides aftermarket MRO and logistics services to improve operational readiness and extend the lifecycle of military vehicles, ships and aircraft for the U.S. Armed Forces, federal agencies and international defense customers. Core services include base operations support, procurement, supply chain management, vehicle, maritime and aircraft sustainment services, IT and data management services and energy consulting.
Please refer to the Form 10-Q that will be filed with the Securities and Exchange Commission (SEC) on or about July 28, 2022 for more details on our second quarter 2022 results. Also, refer to VSE’s Annual Report on Form 10-K for the year ended December 31, 2021 for further information and analysis of VSE’s financial condition and results of operations. VSE encourages investors and others to review the detailed reporting and disclosures contained in VSE’s public filings for additional discussion about the status of customer programs and contract awards, risks, revenue sources and funding, dependence on material customers, and management’s discussion of short- and long-term business challenges and opportunities.
FORWARD LOOKING STATEMENTS
This document contains certain forward-looking statements. These forward-looking statements, which are included in accordance with the safe harbor provisions of the Private Securities Litigation Reform Act of 1995, may involve known and unknown risks, uncertainties and other factors that may cause VSE’s actual results and performance in future periods to be materially different from any future results or performance suggested by the forward-looking statements in this document. Although we believe the expectations reflected in such forward-looking statements are based upon reasonable assumptions, we can give no assurance that actual results will not differ materially from these expectations. “Forward-looking” statements, as such term is defined by the SEC in its rules, regulations and releases, represent our expectations or beliefs, including, but not limited to, statements concerning our operations, economic performance, financial condition, the impact of widespread health developments, the health and economic impact thereof, and the governmental, commercial, consumer and other responses thereto, growth and acquisition strategies, investments and future operational plans. Without limiting the generality of the foregoing, words such as “may,” “will,” “expect,” “believe,” “anticipate,” “intend,” “forecast,” “seek,” “plan,” “predict,” “project,” “could,” “estimate,” “might,” “continue,” “seeking” or the negative or other variations thereof or comparable terminology are intended to identify forward-looking statements. These statements, by their nature, involve substantial risks and uncertainties, certain of which are beyond our control, and actual results may differ materially depending on a variety of important factors, including, but not limited to, factors identified in our reports filed or expected to be filed with the SEC including our Annual Report on Form 10-K for the year ended December 31, 2021. All forward-looking statements made herein are qualified by these cautionary statements and risk factors and there can be no assurance that the actual results, events or developments referenced herein will occur or be realized. Readers are cautioned not to place undue reliance on these forward looking-statements, which reflect management's analysis only as of the date hereof. We undertake no obligation to update or revise forward-looking statements to reflect changed assumptions, the occurrence of unanticipated events or changes to future operating results.
INVESTOR CONTACT
Noel Ryan
(720) 778-2415
VSE Corporation and Subsidiaries
Unaudited Consolidated Balance Sheets
(in thousands except share and per share amounts)
| June 30, | December 31, | |||||||||||||
| 2022 | 2021 | |||||||||||||
| Assets | ||||||||||||||
| Current assets: | ||||||||||||||
| Cash and cash equivalents | $ | 371 | $ | 518 | ||||||||||
| Receivables (net of allowance of $3.5 million and $1.7 million, respectively) | 102,194 | 76,587 | ||||||||||||
| Unbilled receivables | 41,310 | 31,882 | ||||||||||||
| Inventories | 337,753 | 322,702 | ||||||||||||
| Other current assets | 24,958 | 32,304 | ||||||||||||
| Total current assets | 506,586 | 463,993 | ||||||||||||
| Property and equipment (net of accumulated depreciation of $70 million and $66 million, respectively) | 42,237 | 42,486 | ||||||||||||
| Intangible assets (net of accumulated amortization of $116 million and $135 million, respectively) | 99,090 | 108,263 | ||||||||||||
| Goodwill | 248,837 | 248,753 | ||||||||||||
| Operating lease right-of-use asset | 25,241 | 27,327 | ||||||||||||
| Other assets | 25,232 | 27,736 | ||||||||||||
| Total assets | $ | 947,223 | $ | 918,558 | ||||||||||
| Liabilities and Stockholders' equity | ||||||||||||||
| Current liabilities: | ||||||||||||||
| Current portion of long-term debt | $ | 14,162 | $ | 14,162 | ||||||||||
| Accounts payable | 112,935 | 115,064 | ||||||||||||
| Accrued expenses and other current liabilities | 48,226 | 49,465 | ||||||||||||
| Dividends payable | 1,279 | 1,273 | ||||||||||||
| Total current liabilities | 176,602 | 179,964 | ||||||||||||
| Long-term debt, less current portion | 294,448 | 270,407 | ||||||||||||
| Deferred compensation | 11,977 | 14,328 | ||||||||||||
| Long-term lease obligations under operating leases | 24,537 | 27,168 | ||||||||||||
| Deferred tax liabilities | 8,376 | 9,108 | ||||||||||||
| Other long-term liabilities | — | 250 | ||||||||||||
| Total liabilities | 515,940 | 501,225 | ||||||||||||
| Commitments and contingencies | ||||||||||||||
| Stockholders' equity: | ||||||||||||||
| Common stock, par value $0.05 per share, authorized 23,000,000 shares; issued and outstanding 12,794,421 and 12,726,659, respectively | 640 | 636 | ||||||||||||
| Additional paid-in capital | 91,051 | 88,515 | ||||||||||||
| Retained earnings | 339,592 | 328,358 | ||||||||||||
| Accumulated other comprehensive loss | — | (176) | ||||||||||||
| Total stockholders' equity | 431,283 | 417,333 | ||||||||||||
| Total liabilities and stockholders' equity | $ | 947,223 | $ | 918,558 | ||||||||||
VSE Corporation and Subsidiaries
Unaudited Consolidated Statements of Income
(in thousands except share and per share amounts)
| For the three months ended June 30, | For the six months ended June 30, | |||||||||||||||||||||||||
| 2022 | 2021 | 2022 | 2021 | |||||||||||||||||||||||
| Revenues: | ||||||||||||||||||||||||||
| Products | $ | 143,576 | $ | 84,463 | $ | 280,807 | $ | 163,043 | ||||||||||||||||||
| Services | 98,137 | 90,649 | 192,145 | 177,050 | ||||||||||||||||||||||
| Total revenues | 241,713 | 175,112 | 472,952 | 340,093 | ||||||||||||||||||||||
| Costs and operating expenses: | ||||||||||||||||||||||||||
| Products | 130,978 | 101,325 | 253,433 | 172,037 | ||||||||||||||||||||||
| Services | 91,282 | 80,848 | 182,510 | 161,188 | ||||||||||||||||||||||
| Selling, general and administrative expenses | 865 | 1,050 | 1,771 | 1,088 | ||||||||||||||||||||||
| Amortization of intangible assets | 4,437 | 4,603 | 9,173 | 8,891 | ||||||||||||||||||||||
| Total costs and operating expenses | 227,562 | 187,826 | 446,887 | 343,204 | ||||||||||||||||||||||
| Operating income (loss) | 14,151 | (12,714) | 26,065 | (3,111) | ||||||||||||||||||||||
| Interest expense, net | 3,872 | 2,666 | 7,481 | 5,696 | ||||||||||||||||||||||
| Income (loss) before income taxes | 10,279 | (15,380) | 18,584 | (8,807) | ||||||||||||||||||||||
| Provision for income taxes | 2,731 | (3,014) | 4,792 | (1,552) | ||||||||||||||||||||||
| Net income (loss) | $ | 7,548 | $ | (12,366) | $ | 13,792 | $ | (7,255) | ||||||||||||||||||
| Basic earnings (loss) per share | $ | 0.59 | $ | (0.97) | $ | 1.08 | $ | (0.59) | ||||||||||||||||||
| Basic weighted average shares outstanding | 12,778,355 | 12,702,366 | 12,760,026 | 12,391,166 | ||||||||||||||||||||||
| Diluted earnings (loss) per share | $ | 0.59 | $ | (0.97) | $ | 1.08 | $ | (0.59) | ||||||||||||||||||
| Diluted weighted average shares outstanding | 12,811,078 | 12,702,366 | 12,807,249 | 12,391,166 | ||||||||||||||||||||||
| Dividends declared per share | $ | 0.10 | $ | 0.09 | $ | 0.20 | $ | 0.18 | ||||||||||||||||||
VSE Corporation and Subsidiaries
Unaudited Consolidated Statements of Cash Flows
(in thousands)
| For the six months ended June 30, | ||||||||||||||
| 2022 | 2021 | |||||||||||||
| Cash flows from operating activities: | ||||||||||||||
| Net income (loss) | $ | 13,792 | $ | (7,255) | ||||||||||
| Adjustments to reconcile net income to net cash provided by operating activities: | ||||||||||||||
| Depreciation and amortization | 12,850 | 12,267 | ||||||||||||
| Deferred taxes | (790) | (3,872) | ||||||||||||
| Stock-based compensation | 2,675 | 2,256 | ||||||||||||
| Inventory valuation adjustment | 1,094 | 24,420 | ||||||||||||
| Changes in operating assets and liabilities, net of impact of acquisitions: | ||||||||||||||
| Receivables | (25,607) | (17,558) | ||||||||||||
| Unbilled receivables | (9,428) | (4,378) | ||||||||||||
| Inventories | (16,145) | (45,157) | ||||||||||||
| Other current assets and noncurrent assets | 8,884 | (16,693) | ||||||||||||
| Accounts payable and deferred compensation | (4,848) | (8,017) | ||||||||||||
| Accrued expenses and other current and noncurrent liabilities | (2,615) | 10,019 | ||||||||||||
| Net cash used in operating activities | (20,138) | (53,968) | ||||||||||||
| Cash flows from investing activities: | ||||||||||||||
| Purchases of property and equipment | (2,746) | (5,158) | ||||||||||||
| Proceeds from the sale of property and equipment | — | 14 | ||||||||||||
| Proceeds from the payment on notes receivable | 3,073 | 1,138 | ||||||||||||
| Cash paid for acquisitions, net of cash acquired | — | (14,785) | ||||||||||||
| Net cash provided by (used in) investing activities | 327 | (18,791) | ||||||||||||
| Cash flows from financing activities: | ||||||||||||||
| Borrowings on loan agreement | 236,194 | 258,497 | ||||||||||||
| Repayments on loan agreement | (212,572) | (234,976) | ||||||||||||
| Proceeds from issuance of common stock | 486 | 52,017 | ||||||||||||
| Earn-out obligation payments | (1,000) | — | ||||||||||||
| Payments of taxes for equity transactions | (892) | (681) | ||||||||||||
| Dividends paid | (2,552) | (2,139) | ||||||||||||
| Net cash provided by financing activities | 19,664 | 72,718 | ||||||||||||
| Net decreases in cash and cash equivalents | (147) | (41) | ||||||||||||
| Cash and cash equivalents at beginning of period | 518 | 378 | ||||||||||||
| Cash and cash equivalents at end of period | $ | 371 | $ | 337 | ||||||||||
Second Quarter 2022 Results Conference Call July 2022
R A I S E T H E B A R 2 This presentation contains statements that, to the extent they are not recitations of historical fact, constitute "forward looking statements" within the meaning of Section 27A of the Securities Act of 1933, as amended (the “Securities Act”), and Section 21E of the Exchange Act. All such statements are intended to be covered by the safe harbor provisions for forward-looking statements contained in the Private Securities Litigation Reform Act of 1995 and includes this statement for purposes of such safe harbor provisions. “Forward-looking” statements, as such term is defined by the SEC in its rules, regulations and releases, represent VSE Corporation’s (the “Company”) expectations or beliefs, including, but not limited to, statements concerning its operations, economic performance, financial condition, growth and acquisition strategies, investments and future operational plans. Without limiting the generality of the foregoing, words such as “may,” “will,” “expect,” “believe,” “anticipate,” “intend,” “forecast,” “seek,” “plan,” “predict,” “project,” “could,” “estimate,” “might,” “continue,” “seeking” or the negative or other variations thereof or comparable terminology are intended to identify forward-looking statements. These statements speak only as of the date of this presentation and the Company undertakes no ongoing obligation, other than that imposed by law, to update these statements. These statements appear in a number of places in this presentation, and relate to, among other things, the Company’s intent, belief or current expectations with respect to: its future financial condition, results of operations or prospects; our business and growth strategies; and our financing plans and forecasts. You are cautioned that any such forward-looking statements are not guarantees of future performance and involve significant risks and uncertainties, and that actual results may differ materially from those contained in or implied by the forward-looking statements as a result of various factors, some of which are unknown, including, without limitation the factors identified in the Company’s reports filed with the SEC including its Annual Report on Form 10-K for the year ended December 31, 2021. Forward-Looking Statements Non-GAAP Financial Measures In addition to the financial measures prepared in accordance with generally accepted accounting principles (GAAP), this document also contains Non-GAAP financial measures. We consider Adjusted Net Income, Adjusted EPS (Diluted), EBITDA, Adjusted EBITDA, trailing-twelve month Adjusted EBITDA, net debt and free cash flow (FCF) as non-GAAP financial measures and important indicators of performance and useful metrics for management and investors to evaluate our business’s ongoing operating performance on a consistent basis across reporting periods. Adjusted Net Income represents Net Income adjusted for discrete items. Adjusted EPS (Diluted) is computed by dividing net income, adjusted for the discrete items and the related tax impacts, by the diluted weighted average number of common shares outstanding. EBITDA represents net income before interest expense, income taxes, amortization of intangible assets and depreciation and other amortization. Adjusted EBITDA represents EBITDA adjusted for discrete items. Net debt is defined as total debt less cash and cash equivalents. Free cash flow represents operating cash flow less capital expenditures. Net leverage ratio is calculated as net debt divided by trailing twelve month Adjusted EBITDA. The reasons why we believe these measures provide useful information to investors and a reconciliation of these measures to the most directly comparable GAAP measures and other information relating to these Non-GAAP measures are included in the supplemental schedules attached.
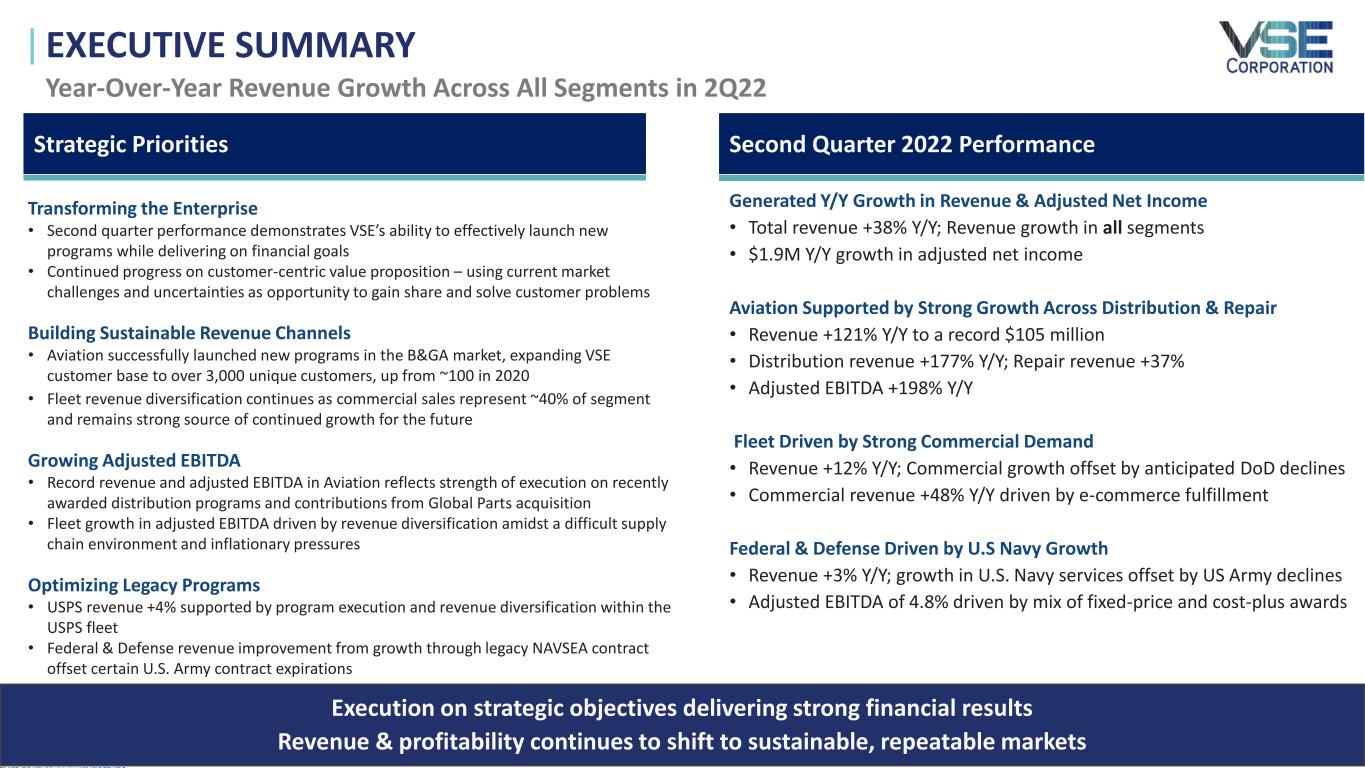
R A I S E T H E B A R 3 EXECUTIVE SUMMARY Generated Y/Y Growth in Revenue & Adjusted Net Income • Total revenue +38% Y/Y; Revenue growth in all segments • $1.9M Y/Y growth in adjusted net income Aviation Supported by Strong Growth Across Distribution & Repair • Revenue +121% Y/Y to a record $105 million • Distribution revenue +177% Y/Y; Repair revenue +37% • Adjusted EBITDA +198% Y/Y Fleet Driven by Strong Commercial Demand • Revenue +12% Y/Y; Commercial growth offset by anticipated DoD declines • Commercial revenue +48% Y/Y driven by e-commerce fulfillment Federal & Defense Driven by U.S Navy Growth • Revenue +3% Y/Y; growth in U.S. Navy services offset by US Army declines • Adjusted EBITDA of 4.8% driven by mix of fixed-price and cost-plus awards Second Quarter 2022 Performance Execution on strategic objectives delivering strong financial results Revenue & profitability continues to shift to sustainable, repeatable markets Year-Over-Year Revenue Growth Across All Segments in 2Q22 Strategic Priorities Transforming the Enterprise • Second quarter performance demonstrates VSE’s ability to effectively launch new programs while delivering on financial goals • Continued progress on customer-centric value proposition – using current market challenges and uncertainties as opportunity to gain share and solve customer problems Building Sustainable Revenue Channels • Aviation successfully launched new programs in the B&GA market, expanding VSE customer base to over 3,000 unique customers, up from ~100 in 2020 • Fleet revenue diversification continues as commercial sales represent ~40% of segment and remains strong source of continued growth for the future Growing Adjusted EBITDA • Record revenue and adjusted EBITDA in Aviation reflects strength of execution on recently awarded distribution programs and contributions from Global Parts acquisition • Fleet growth in adjusted EBITDA driven by revenue diversification amidst a difficult supply chain environment and inflationary pressures Optimizing Legacy Programs • USPS revenue +4% supported by program execution and revenue diversification within the USPS fleet • Federal & Defense revenue improvement from growth through legacy NAVSEA contract offset certain U.S. Army contract expirations
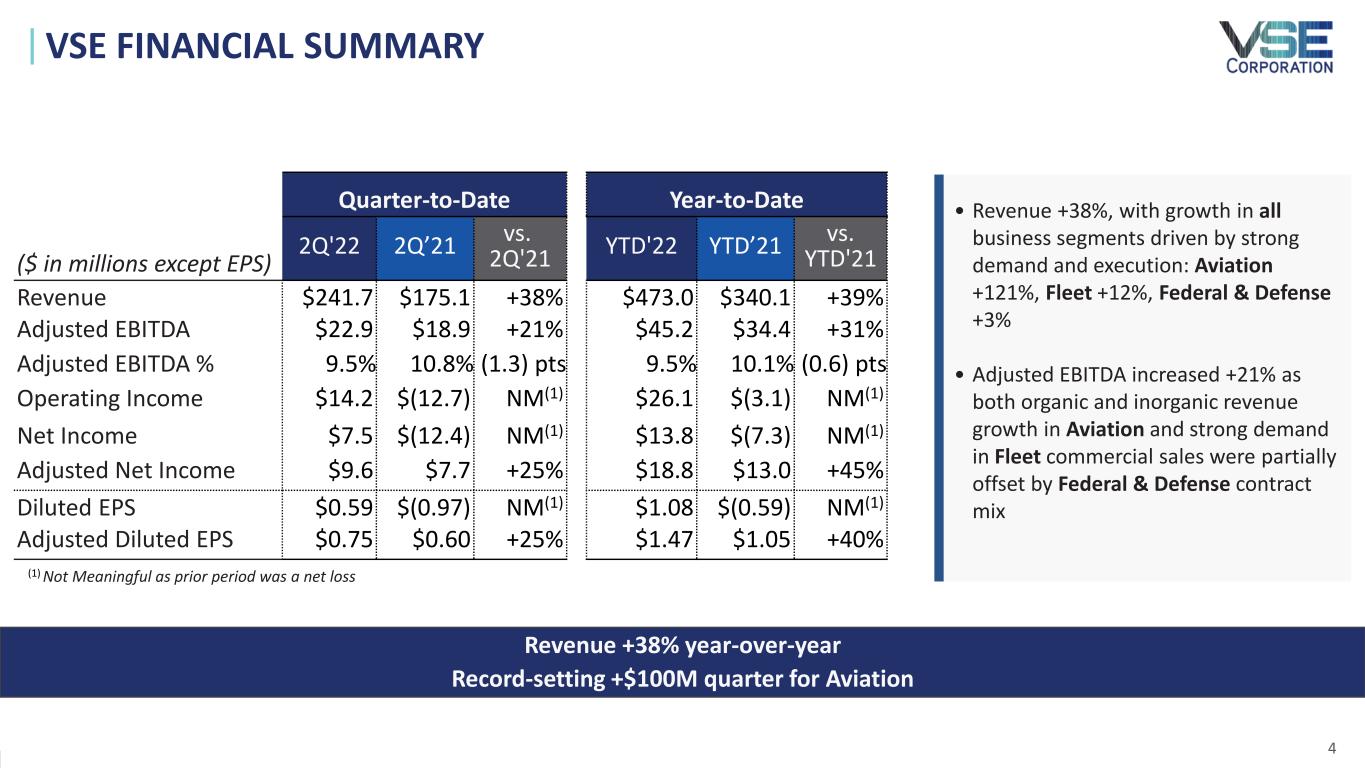
R A I S E T H E B A R • Revenue +38%, with growth in all business segments driven by strong demand and execution: Aviation +121%, Fleet +12%, Federal & Defense +3% • Adjusted EBITDA increased +21% as both organic and inorganic revenue growth in Aviation and strong demand in Fleet commercial sales were partially offset by Federal & Defense contract mix 4 VSE FINANCIAL SUMMARY ($ in millions except EPS) Quarter-to-Date 2Q'22 2Q’21 vs. 2Q'21 Revenue $241.7 $175.1 +38% Adjusted EBITDA $22.9 $18.9 +21% Adjusted EBITDA % 9.5% 10.8% (1.3) pts Operating Income $14.2 $(12.7) NM(1) Net Income $7.5 $(12.4) NM(1) Adjusted Net Income $9.6 $7.7 +25% Diluted EPS $0.59 $(0.97) NM(1) Adjusted Diluted EPS $0.75 $0.60 +25% Revenue +38% year-over-year Record-setting +$100M quarter for Aviation (1) Not Meaningful as prior period was a net loss Year-to-Date YTD'22 YTD’21 vs. YTD'21 $473.0 $340.1 +39% $45.2 $34.4 +31% 9.5% 10.1% (0.6) pts $26.1 $(3.1) NM(1) $13.8 $(7.3) NM(1) $18.8 $13.0 +45% $1.08 $(0.59) NM(1) $1.47 $1.05 +40%
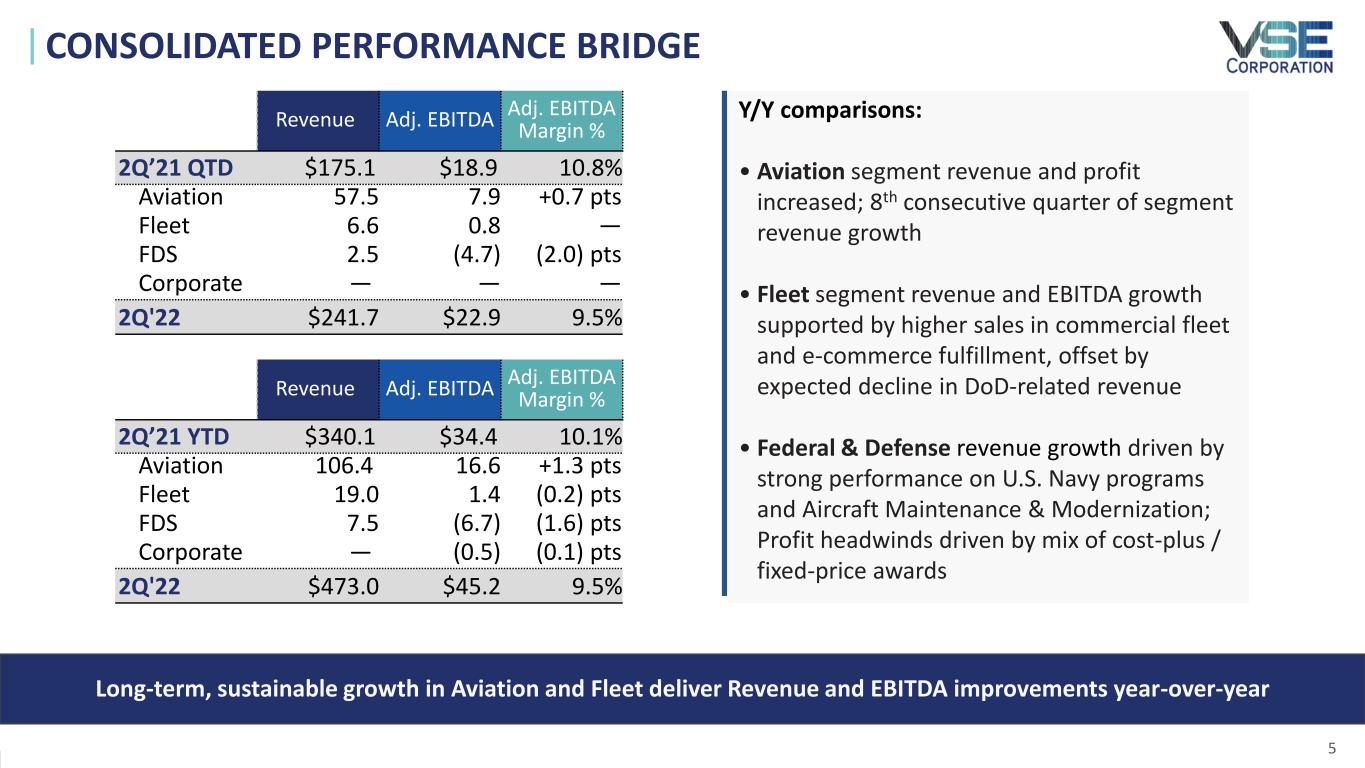
R A I S E T H E B A R 5 CONSOLIDATED PERFORMANCE BRIDGE Y/Y comparisons: • Aviation segment revenue and profit increased; 8th consecutive quarter of segment revenue growth • Fleet segment revenue and EBITDA growth supported by higher sales in commercial fleet and e-commerce fulfillment, offset by expected decline in DoD-related revenue • Federal & Defense revenue growth driven by strong performance on U.S. Navy programs and Aircraft Maintenance & Modernization; Profit headwinds driven by mix of cost-plus / fixed-price awards Revenue Adj. EBITDA Adj. EBITDA Margin % 2Q’21 QTD $175.1 $18.9 10.8% Aviation 57.5 7.9 +0.7 pts Fleet 6.6 0.8 — FDS 2.5 (4.7) (2.0) pts Corporate — — — 2Q'22 $241.7 $22.9 9.5% Long-term, sustainable growth in Aviation and Fleet deliver Revenue and EBITDA improvements year-over-year Revenue Adj. EBITDA Adj. EBITDA Margin % 2Q’21 YTD $340.1 $34.4 10.1% Aviation 106.4 16.6 +1.3 pts Fleet 19.0 1.4 (0.2) pts FDS 7.5 (6.7) (1.6) pts Corporate — (0.5) (0.1) pts 2Q'22 $473.0 $45.2 9.5%
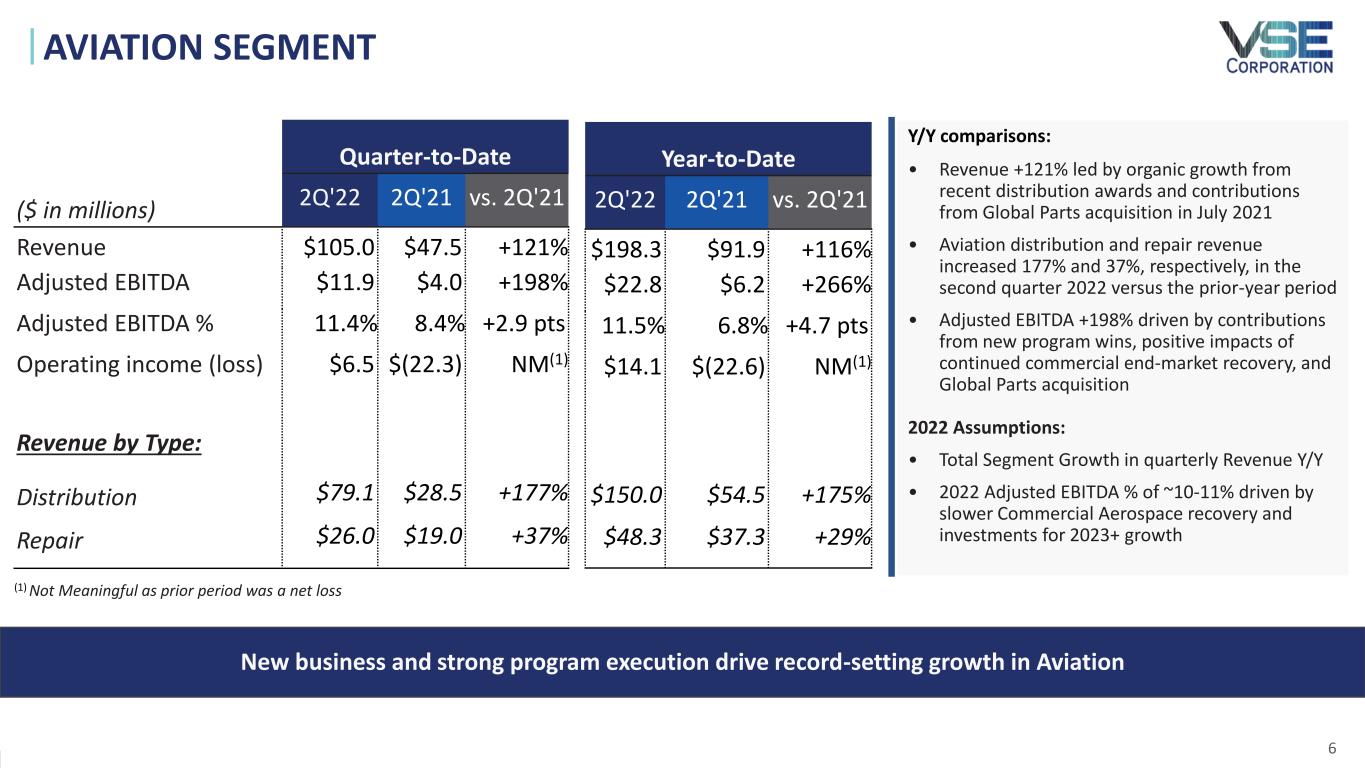
R A I S E T H E B A R 6 AVIATION SEGMENT ($ in millions) Quarter-to-Date 2Q'22 2Q'21 vs. 2Q'21 Revenue $105.0 $47.5 +121% Adjusted EBITDA $11.9 $4.0 +198% Adjusted EBITDA % 11.4% 8.4% +2.9 pts Operating income (loss) $6.5 $(22.3) NM(1) Revenue by Type: Distribution $79.1 $28.5 +177% Repair $26.0 $19.0 +37% (1) Not Meaningful as prior period was a net loss Y/Y comparisons: • Revenue +121% led by organic growth from recent distribution awards and contributions from Global Parts acquisition in July 2021 • Aviation distribution and repair revenue increased 177% and 37%, respectively, in the second quarter 2022 versus the prior-year period • Adjusted EBITDA +198% driven by contributions from new program wins, positive impacts of continued commercial end-market recovery, and Global Parts acquisition 2022 Assumptions: • Total Segment Growth in quarterly Revenue Y/Y • 2022 Adjusted EBITDA % of ~10-11% driven by slower Commercial Aerospace recovery and investments for 2023+ growth New business and strong program execution drive record-setting growth in Aviation Year-to-Date 2Q'22 2Q'21 vs. 2Q'21 $198.3 $91.9 +116% $22.8 $6.2 +266% 11.5% 6.8% +4.7 pts $14.1 $(22.6) NM(1) $150.0 $54.5 +175% $48.3 $37.3 +29%
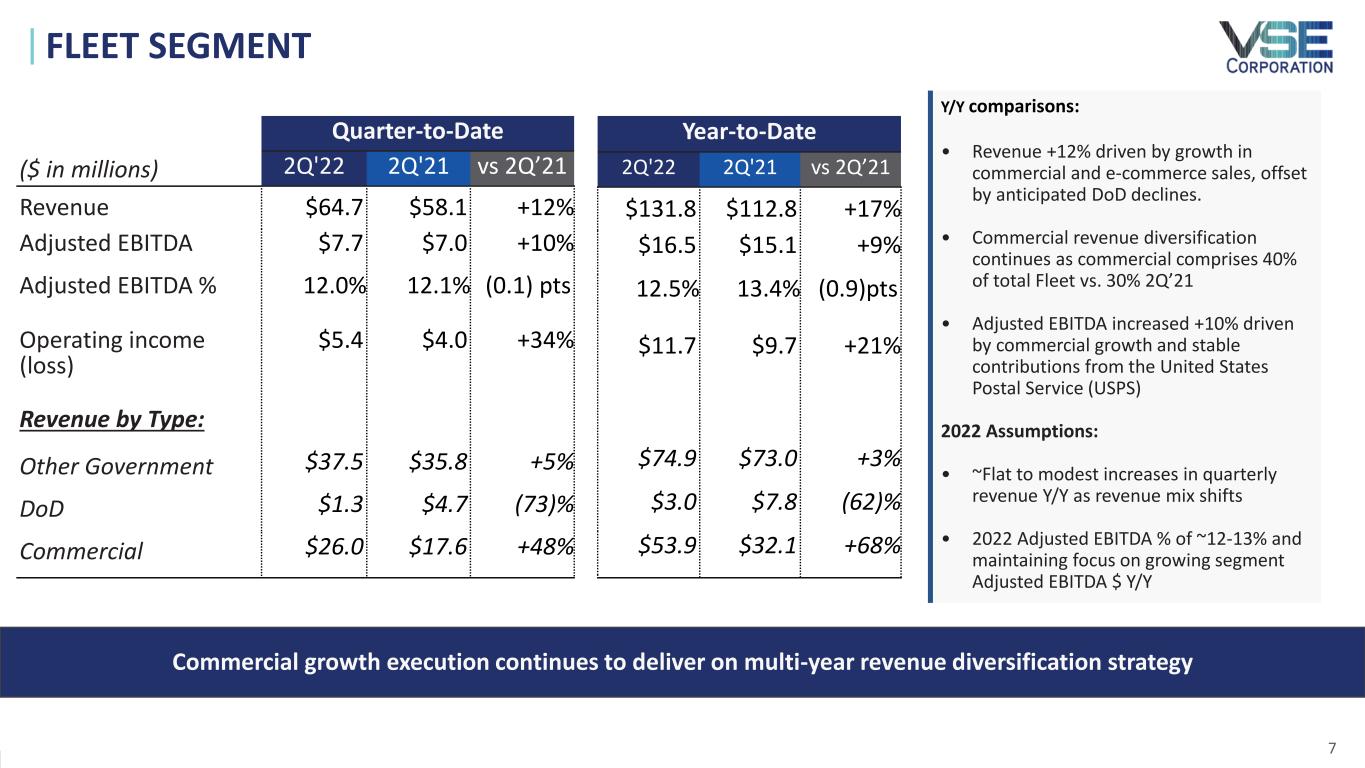
R A I S E T H E B A R 7 FLEET SEGMENT ($ in millions) Quarter-to-Date 2Q'22 2Q'21 vs 2Q’21 Revenue $64.7 $58.1 +12% Adjusted EBITDA $7.7 $7.0 +10% Adjusted EBITDA % 12.0% 12.1% (0.1) pts Operating income (loss) $5.4 $4.0 +34% Revenue by Type: Other Government $37.5 $35.8 +5% DoD $1.3 $4.7 (73)% Commercial $26.0 $17.6 +48% Y/Y comparisons: • Revenue +12% driven by growth in commercial and e-commerce sales, offset by anticipated DoD declines. • Commercial revenue diversification continues as commercial comprises 40% of total Fleet vs. 30% 2Q’21 • Adjusted EBITDA increased +10% driven by commercial growth and stable contributions from the United States Postal Service (USPS) 2022 Assumptions: • ~Flat to modest increases in quarterly revenue Y/Y as revenue mix shifts • 2022 Adjusted EBITDA % of ~12-13% and maintaining focus on growing segment Adjusted EBITDA $ Y/Y Commercial growth execution continues to deliver on multi-year revenue diversification strategy Year-to-Date 2Q'22 2Q'21 vs 2Q’21 $131.8 $112.8 +17% $16.5 $15.1 +9% 12.5% 13.4% (0.9)pts $11.7 $9.7 +21% $74.9 $73.0 +3% $3.0 $7.8 (62)% $53.9 $32.1 +68%
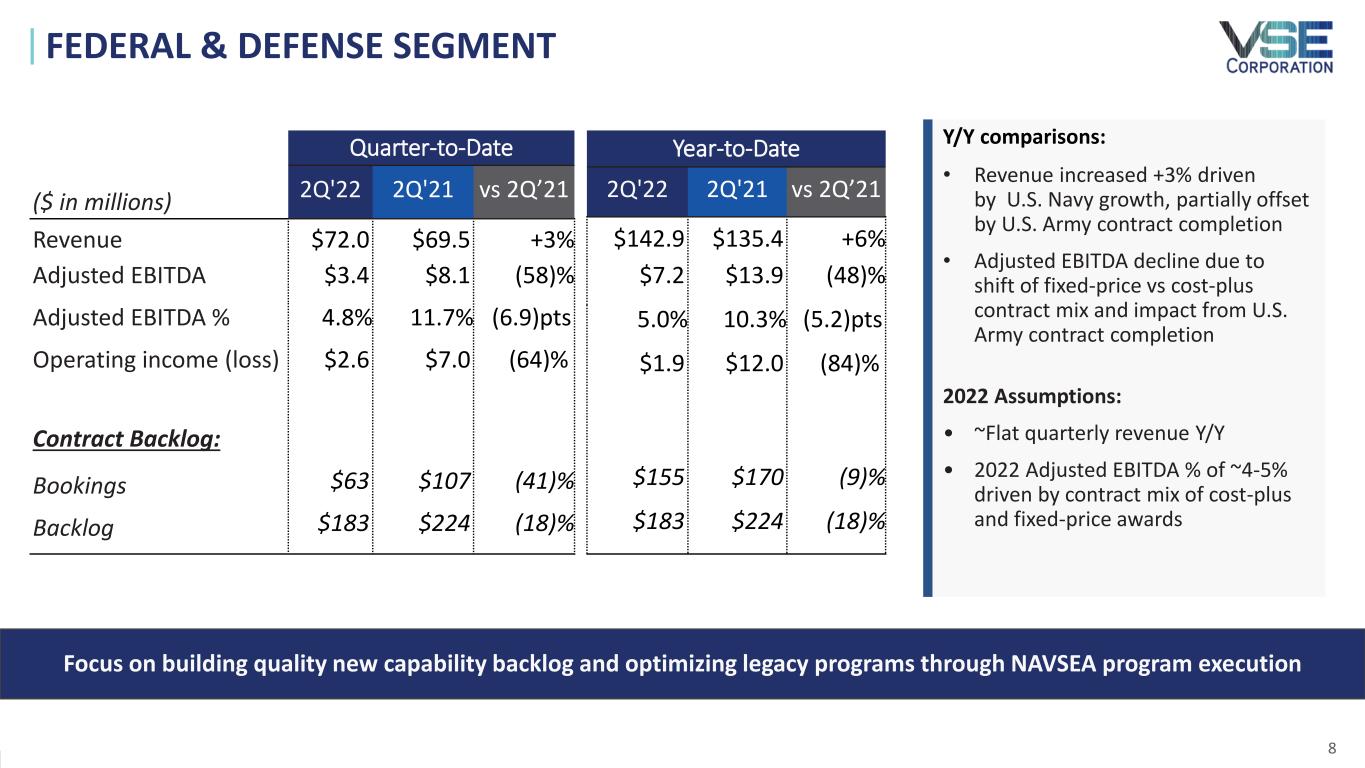
R A I S E T H E B A R 8 FEDERAL & DEFENSE SEGMENT ($ in millions) Quarter-to-Date 2Q'22 2Q'21 vs 2Q’21 Revenue $72.0 $69.5 +3% Adjusted EBITDA $3.4 $8.1 (58)% Adjusted EBITDA % 4.8% 11.7% (6.9)pts Operating income (loss) $2.6 $7.0 (64)% Contract Backlog: Bookings $63 $107 (41)% Backlog $183 $224 (18)% Y/Y comparisons: • Revenue increased +3% driven by U.S. Navy growth, partially offset by U.S. Army contract completion • Adjusted EBITDA decline due to shift of fixed-price vs cost-plus contract mix and impact from U.S. Army contract completion 2022 Assumptions: • ~Flat quarterly revenue Y/Y • 2022 Adjusted EBITDA % of ~4-5% driven by contract mix of cost-plus and fixed-price awards Focus on building quality new capability backlog and optimizing legacy programs through NAVSEA program execution Year-to-Date 2Q'22 2Q'21 vs 2Q’21 $142.9 $135.4 +6% $7.2 $13.9 (48)% 5.0% 10.3% (5.2)pts $1.9 $12.0 (84)% $155 $170 (9)% $183 $224 (18)%
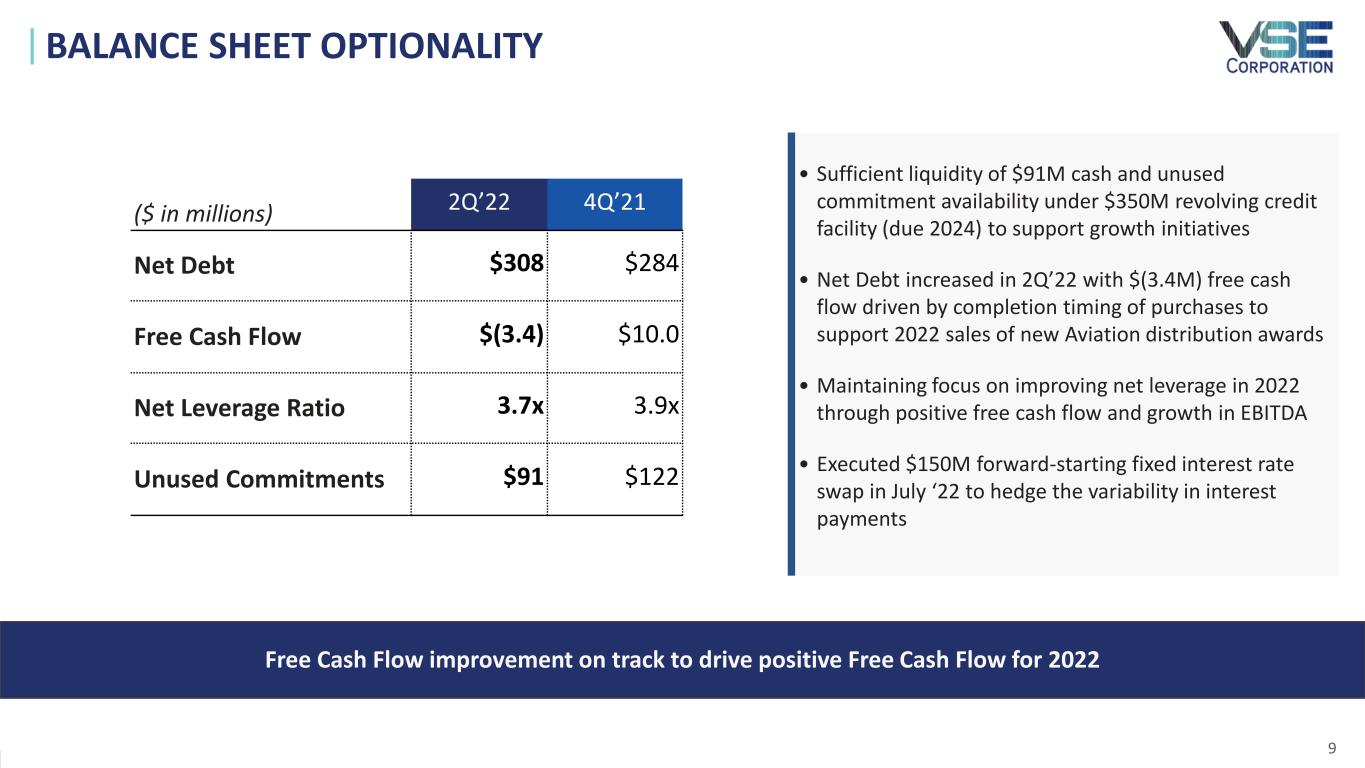
R A I S E T H E B A R • Sufficient liquidity of $91M cash and unused commitment availability under $350M revolving credit facility (due 2024) to support growth initiatives • Net Debt increased in 2Q’22 with $(3.4M) free cash flow driven by completion timing of purchases to support 2022 sales of new Aviation distribution awards • Maintaining focus on improving net leverage in 2022 through positive free cash flow and growth in EBITDA • Executed $150M forward-starting fixed interest rate swap in July ‘22 to hedge the variability in interest payments 9 BALANCE SHEET OPTIONALITY ($ in millions) 2Q’22 4Q’21 Net Debt $308 $284 Free Cash Flow $(3.4) $10.0 Net Leverage Ratio 3.7x 3.9x Unused Commitments $91 $122 Free Cash Flow improvement on track to drive positive Free Cash Flow for 2022
APPENDIX 10
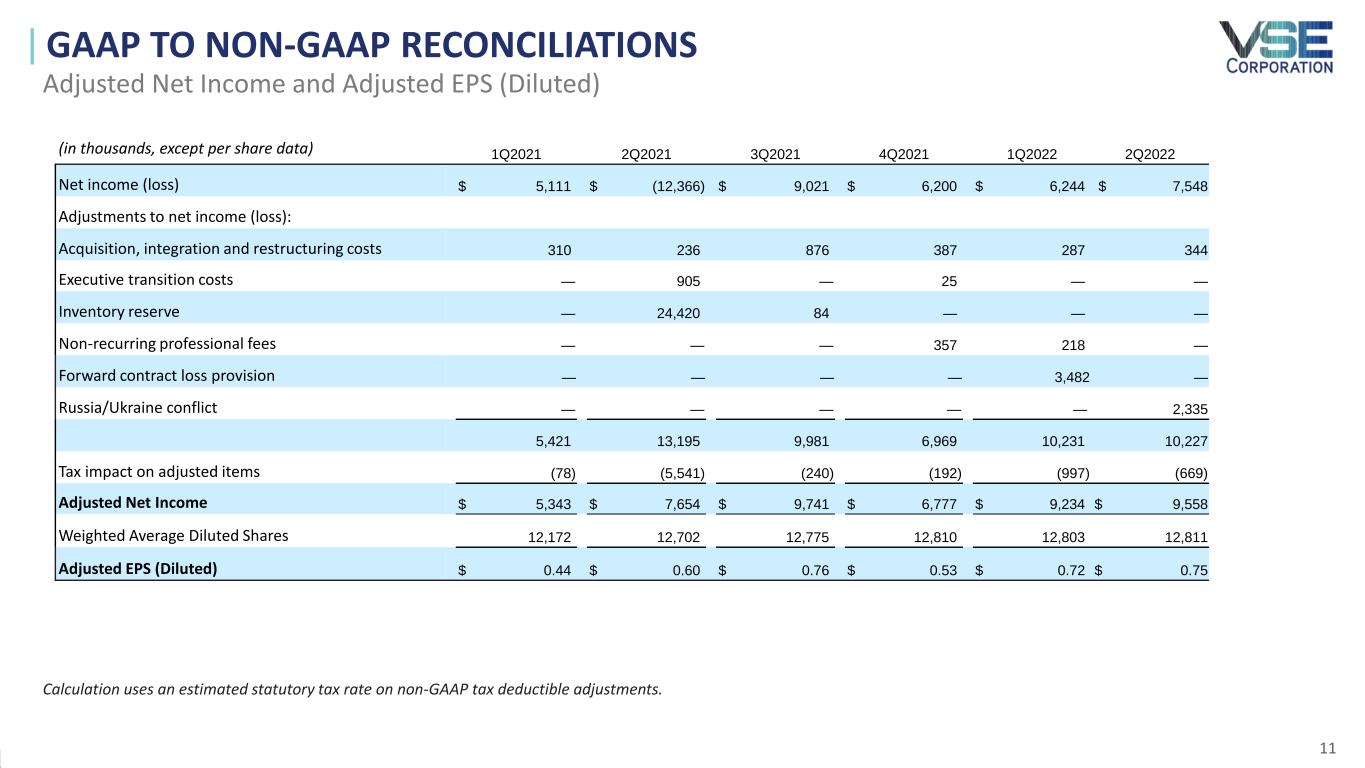
R A I S E T H E B A R 11 GAAP TO NON-GAAP RECONCILIATIONS Adjusted Net Income and Adjusted EPS (Diluted) Calculation uses an estimated statutory tax rate on non-GAAP tax deductible adjustments. (in thousands, except per share data) 1Q2021 2Q2021 3Q2021 4Q2021 1Q2022 2Q2022 Net income (loss) $ 5,111 $ (12,366) $ 9,021 $ 6,200 $ 6,244 $ 7,548 Adjustments to net income (loss): Acquisition, integration and restructuring costs 310 236 876 387 287 344 Executive transition costs — 905 — 25 — — Inventory reserve — 24,420 84 — — — Non-recurring professional fees — — — 357 218 — Forward contract loss provision — — — — 3,482 — Russia/Ukraine conflict — — — — — 2,335 5,421 13,195 9,981 6,969 10,231 10,227 Tax impact on adjusted items (78) (5,541) (240) (192) (997) (669) Adjusted Net Income $ 5,343 $ 7,654 $ 9,741 $ 6,777 $ 9,234 $ 9,558 Weighted Average Diluted Shares 12,172 12,702 12,775 12,810 12,803 12,811 Adjusted EPS (Diluted) $ 0.44 $ 0.60 $ 0.76 $ 0.53 $ 0.72 $ 0.75

R A I S E T H E B A R 12 GAAP TO NON-GAAP RECONCILIATIONS EBITDA and Adjusted EBITDA (in thousands, except per share data) 1Q2021 2Q2021 3Q2021 4Q2021 1Q2022 2Q2022 Net income (loss) $ 5,111 $ (12,366) $ 9,021 $ 6,200 $ 6,244 $ 7,548 Interest expense, net 3,030 2,666 2,780 3,593 3,609 3,872 Income taxes 1,462 (3,014) 2,091 946 2,061 2,731 Amortization of intangible assets 4,288 4,603 4,921 4,670 4,736 4,437 Depreciation and other amortization 1,360 1,424 1,599 1,635 1,600 1,659 EBITDA 15,251 (6,687) 20,412 17,044 18,250 20,247 Acquisition, integration and restructuring costs 310 236 876 387 287 344 Executive transition costs — 905 — 25 — — Inventory reserve — 24,420 84 — — — Non-recurring professional fees — — — 357 218 — Forward contract loss provision — — — — 3,482 — Russia/Ukraine conflict — — — — — 2,335 Adjusted EBITDA $ 15,561 $ 18,874 $ 21,372 $ 17,813 $ 22,237 $ 22,926
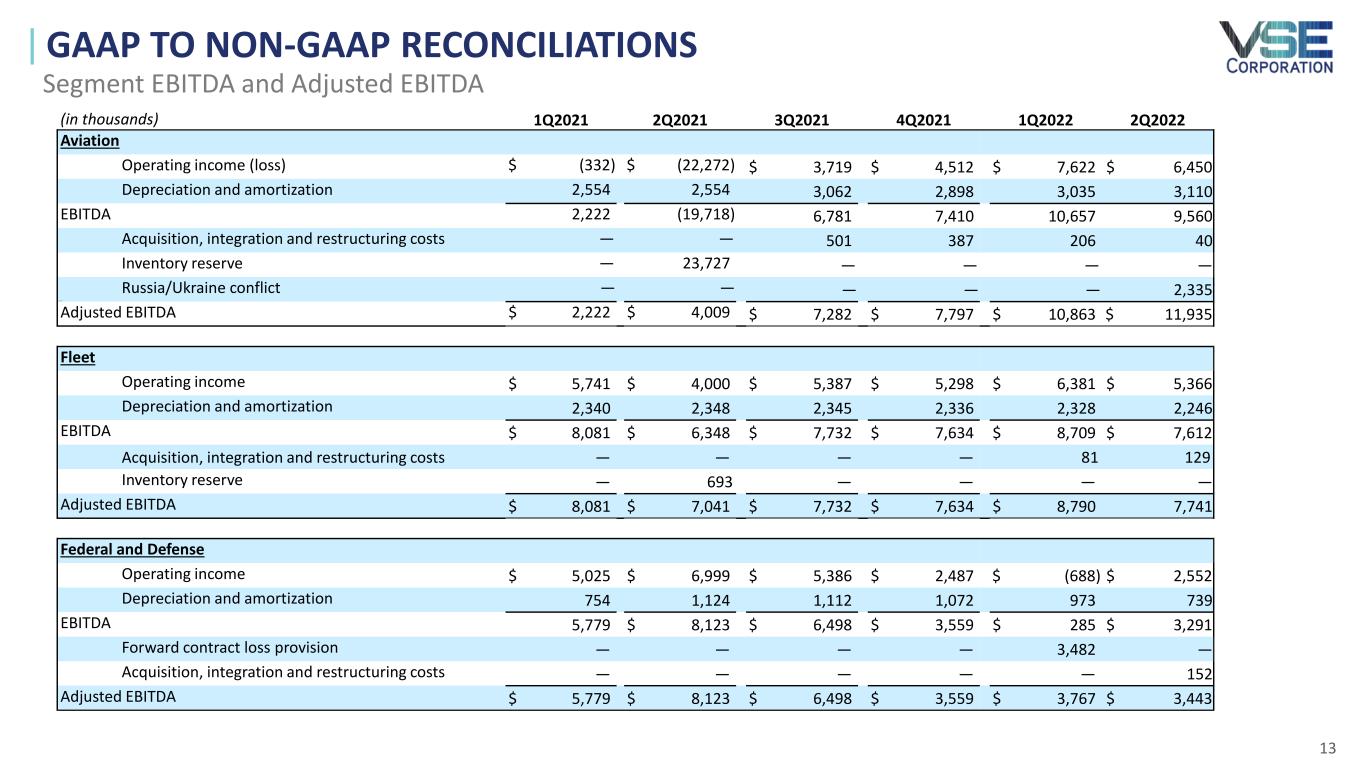
R A I S E T H E B A R 13 GAAP TO NON-GAAP RECONCILIATIONS Segment EBITDA and Adjusted EBITDA (in thousands) 1Q2021 2Q2021 3Q2021 4Q2021 1Q2022 2Q2022 Aviation Operating income (loss) $ (332) $ (22,272) $ 3,719 $ 4,512 $ 7,622 $ 6,450 Depreciation and amortization 2,554 2,554 3,062 2,898 3,035 3,110 EBITDA 2,222 (19,718) 6,781 7,410 10,657 9,560 Acquisition, integration and restructuring costs — — 501 387 206 40 Inventory reserve — 23,727 — — — — Russsdfsd Russia/Ukraine conflict — — — — — 2,335 Adjusted EBITDA $ 2,222 $ 4,009 $ 7,282 $ 7,797 $ 10,863 $ 11,935 Fleet Operating income $ 5,741 $ 4,000 $ 5,387 $ 5,298 $ 6,381 $ 5,366 Depreciation and amortization 2,340 2,348 2,345 2,336 2,328 2,246 EBITDA $ 8,081 $ 6,348 $ 7,732 $ 7,634 $ 8,709 $ 7,612 Acquisition, integration and restructuring costs — — — — 81 129 Inventory reserve — 693 — — — — Adjusted EBITDA $ 8,081 $ 7,041 $ 7,732 $ 7,634 $ 8,790 7,741 Federal and Defense Operating income $ 5,025 $ 6,999 $ 5,386 $ 2,487 $ (688) $ 2,552 Depreciation and amortization 754 1,124 1,112 1,072 973 739 EBITDA 5,779 $ 8,123 $ 6,498 $ 3,559 $ 285 $ 3,291 Forward contract loss provision — — — — 3,482 — Acquisition, integration and restructuring costs — — — — — 152 Adjusted EBITDA $ 5,779 $ 8,123 $ 6,498 $ 3,559 $ 3,767 $ 3,443
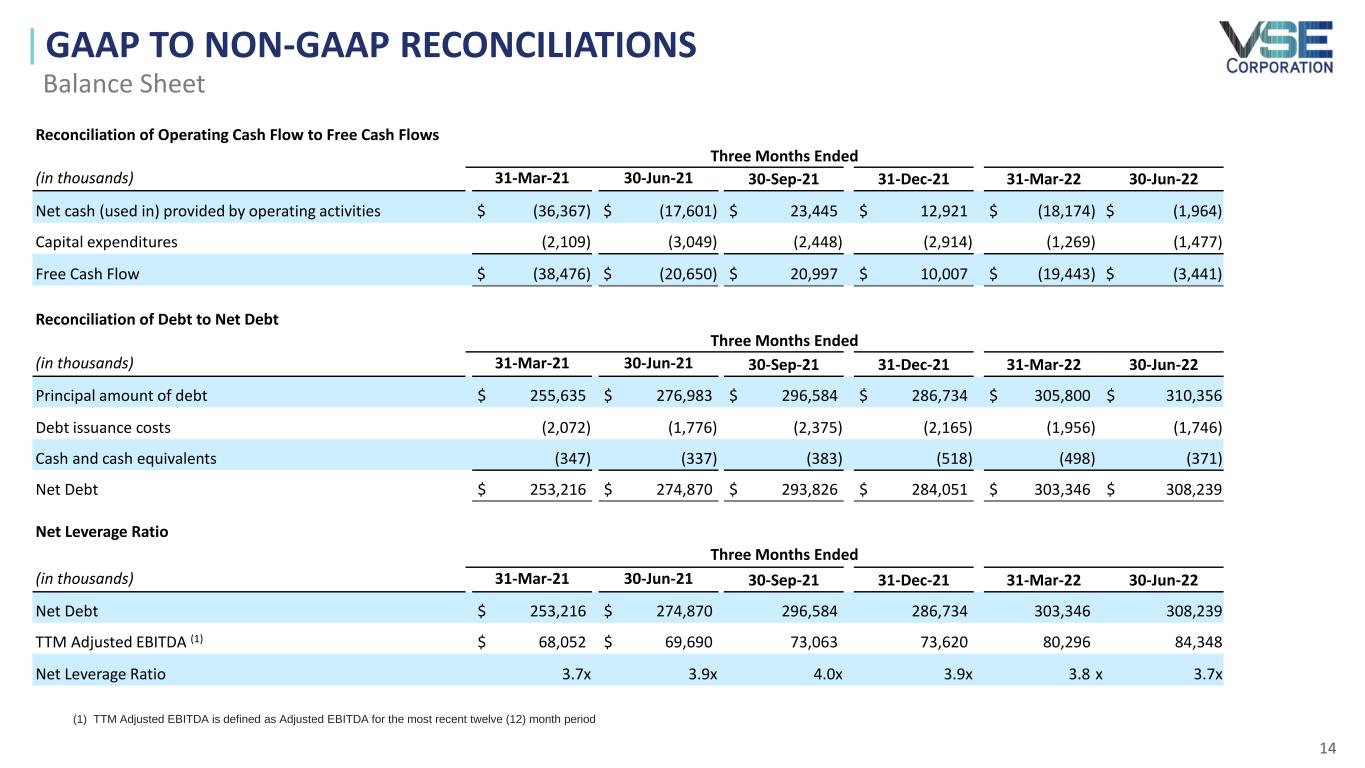
R A I S E T H E B A R 14 GAAP TO NON-GAAP RECONCILIATIONS Balance Sheet (1) TTM Adjusted EBITDA is defined as Adjusted EBITDA for the most recent twelve (12) month period Reconciliation of Operating Cash Flow to Free Cash Flows Three Months Ended (in thousands) 31-Mar-21 30-Jun-21 30-Sep-21 31-Dec-21 31-Mar-22 30-Jun-22 Net cash (used in) provided by operating activities $ (36,367) $ (17,601) $ 23,445 $ 12,921 $ (18,174) $ (1,964) Capital expenditures (2,109) (3,049) (2,448) (2,914) (1,269) (1,477) Free Cash Flow $ (38,476) $ (20,650) $ 20,997 $ 10,007 $ (19,443) $ (3,441) Reconciliation of Debt to Net Debt Three Months Ended (in thousands) 31-Mar-21 30-Jun-21 30-Sep-21 31-Dec-21 31-Mar-22 30-Jun-22 Principal amount of debt $ 255,635 $ 276,983 $ 296,584 $ 286,734 $ 305,800 $ 310,356 Debt issuance costs (2,072) (1,776) (2,375) (2,165) (1,956) (1,746) Cash and cash equivalents (347) (337) (383) (518) (498) (371) Net Debt $ 253,216 $ 274,870 $ 293,826 $ 284,051 $ 303,346 $ 308,239 Net Leverage Ratio Three Months Ended (in thousands) 31-Mar-21 30-Jun-21 30-Sep-21 31-Dec-21 31-Mar-22 30-Jun-22 Net Debt $ 253,216 $ 274,870 296,584 286,734 303,346 308,239 TTM Adjusted EBITDA (1) $ 68,052 $ 69,690 73,063 73,620 80,296 84,348 Net Leverage Ratio 3.7x 3.9x 4.0x 3.9x 3.8 x 3.7x

R A I S E T H E B A R 15 INVESTMENT HIGHLIGHTS 3 Distinct End Markets $35M Adj. Net Income ~2,000 Employees $884M Revenue 63+ Years Aftermarket Services Pure-play independent aftermarket service provider with strong organic & inorganic growth opportunities $84M Adj. EBITDA Global provider of aftermarket distribution, maintenance, repair, and overhaul (“MRO”), and other services Fragmented end-markets provide for market share capture and high-return acquisition opportunities Strong customer/supplier relationships with embedded services enhance long-term opportunities and revenue stability Cultural transformation driving higher margin sustainable growth Balanced commercial and defense customer base provides resilience through economic and market cycles Note: Figures above reflect TTM 6/30/22

R A I S E T H E B A R VSE Senior Leadership 16 VSE EXECUTIVE TEAM John Cuomo President and CEO • 21+ years of aerospace distribution and services market industry experience • Appointed Chief Executive Officer and President of VSE Corporation in 2019 • Previously served as Vice President and General Manager of Boeing Distribution Services and Group President, KLX Aerospace Solutions Stephen Griffin Chief Financial Officer • 12+ years of senior finance leadership, most recently as CFO for GE Aviation Engine Services • Appointed CFO of VSE Corporation in November 2020 • Manages the financial and accounting operations for the consolidated corporation Chad Wheeler Group President, Wheeler Fleet Solutions Robert Moore Group President, Federal & Defense Services Ben Thomas Group President, Aviation Krista Stafford Chief Human Resources Officer Background & ResponsibilitiesBackground & Responsibilities Farinaz Tehrani Chief Legal Officer
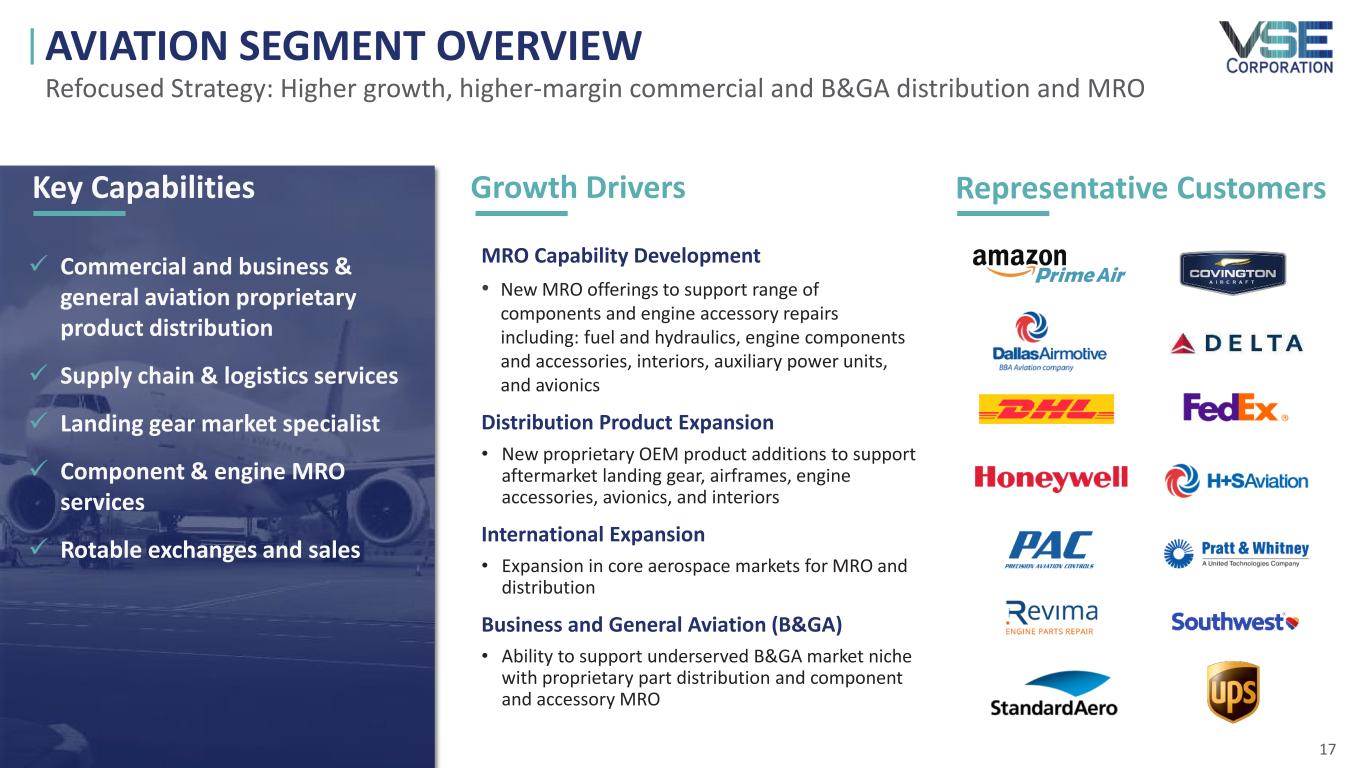
R A I S E T H E B A R Representative Customers 17 AVIATION SEGMENT OVERVIEW MRO Capability Development • New MRO offerings to support range of components and engine accessory repairs including: fuel and hydraulics, engine components and accessories, interiors, auxiliary power units, and avionics Distribution Product Expansion • New proprietary OEM product additions to support aftermarket landing gear, airframes, engine accessories, avionics, and interiors International Expansion • Expansion in core aerospace markets for MRO and distribution Business and General Aviation (B&GA) • Ability to support underserved B&GA market niche with proprietary part distribution and component and accessory MRO Refocused Strategy: Higher growth, higher-margin commercial and B&GA distribution and MRO Growth Drivers ✓ Commercial and business & general aviation proprietary product distribution ✓ Supply chain & logistics services ✓ Landing gear market specialist ✓ Component & engine MRO services ✓ Rotable exchanges and sales Key Capabilities

R A I S E T H E B A R 18 FLEET SEGMENT OVERVIEW Commercial Customer Diversification • Expansion of commercial customer base to support new medium to large, high-duty cycle fleet customers Wallet Share Expansion • Product expansion to existing just-in-time clients E-commerce • Customized technology platform to support class 4-8 vehicle parts E-commerce Fulfillment • Inventory sales through 3rd-party channels Product Expansion • Addition of both new product offerings and growth in private label product Refocused Strategy: High growth Class 4-8 commercial distribution and e-commerce ✓ High-duty cycle, Class 4-8 (medium to heavy) vehicle parts distribution ✓ Just-in-time supply chain management ✓ E-commerce & e-commerce fulfillment ✓ Customized fleet logistics & IT solutions ✓ Technical support, engineering, sourcing, warehousing & kitting ✓ Private label products Representative CustomersGrowth DriversKey Capabilities
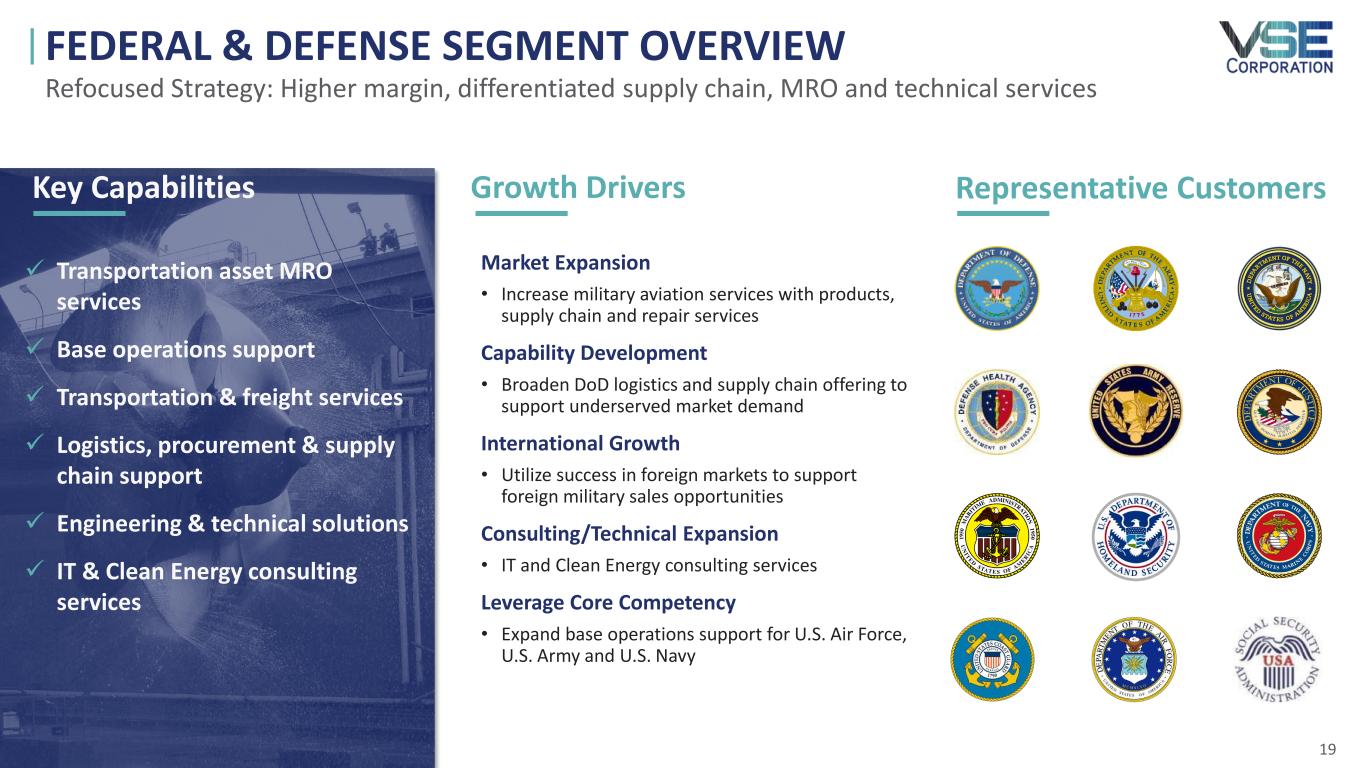
R A I S E T H E B A R 19 FEDERAL & DEFENSE SEGMENT OVERVIEW Market Expansion • Increase military aviation services with products, supply chain and repair services Capability Development • Broaden DoD logistics and supply chain offering to support underserved market demand International Growth • Utilize success in foreign markets to support foreign military sales opportunities Consulting/Technical Expansion • IT and Clean Energy consulting services Leverage Core Competency • Expand base operations support for U.S. Air Force, U.S. Army and U.S. Navy ✓ Transportation asset MRO services ✓ Base operations support ✓ Transportation & freight services ✓ Logistics, procurement & supply chain support ✓ Engineering & technical solutions ✓ IT & Clean Energy consulting services Refocused Strategy: Higher margin, differentiated supply chain, MRO and technical services Representative CustomersGrowth DriversKey Capabilities
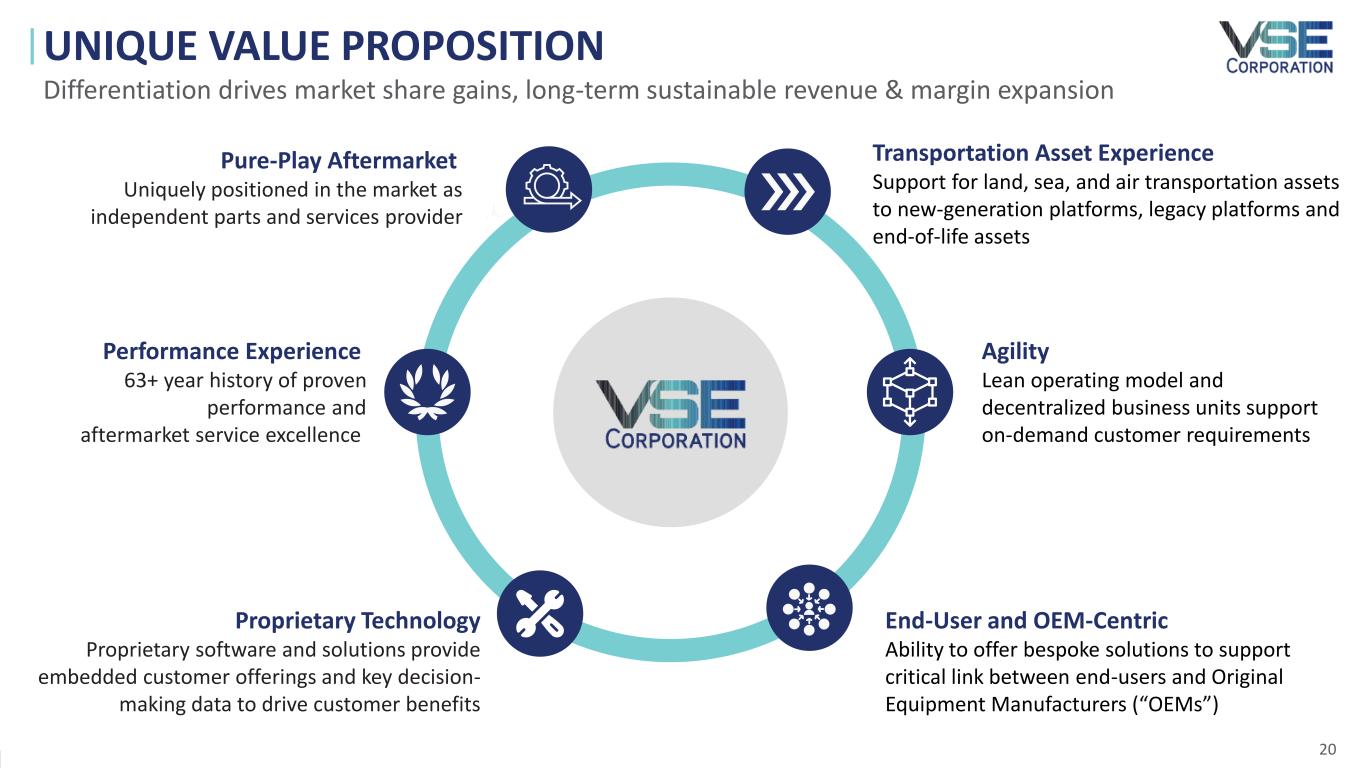
R A I S E T H E B A R 20 UNIQUE VALUE PROPOSITION Differentiation drives market share gains, long-term sustainable revenue & margin expansion End-User and OEM-Centric Ability to offer bespoke solutions to support critical link between end-users and Original Equipment Manufacturers (“OEMs”) Agility Lean operating model and decentralized business units support on-demand customer requirements Pure-Play Aftermarket Uniquely positioned in the market as independent parts and services provider Transportation Asset Experience Support for land, sea, and air transportation assets to new-generation platforms, legacy platforms and end-of-life assets Performance Experience 63+ year history of proven performance and aftermarket service excellence Proprietary Technology Proprietary software and solutions provide embedded customer offerings and key decision- making data to drive customer benefits
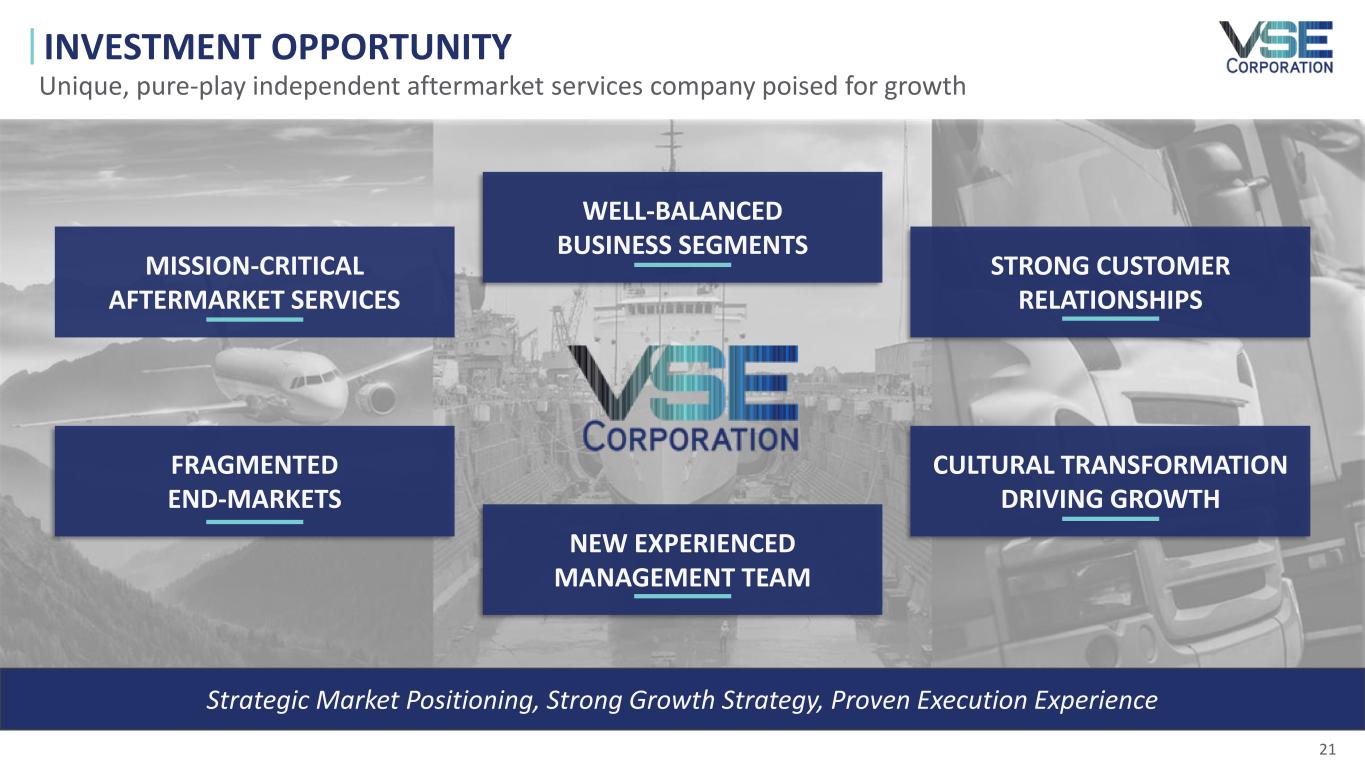
R A I S E T H E B A R 21 INVESTMENT OPPORTUNITY Unique, pure-play independent aftermarket services company poised for growth Strategic Market Positioning, Strong Growth Strategy, Proven Execution Experience MISSION-CRITICAL AFTERMARKET SERVICES CULTURAL TRANSFORMATION DRIVING GROWTH STRONG CUSTOMER RELATIONSHIPS NEW EXPERIENCED MANAGEMENT TEAM FRAGMENTED END-MARKETS WELL-BALANCED BUSINESS SEGMENTS