
Bristow Group Inc 8-K, filed Aug 5, 2022
Bristow Group Inc. (VTOL)
8-K
2022-08-05
For: 2022-08-04
View Original
Added on
April 10, 2026
About this 8-K
Bristow Group Inc filed this 8-K on August 5, 2022, reporting on events of August 4, 2022.
Items reported
- Item 2.02: Financial results
- Item 7.01: Regulation FD disclosure
- Item 9.01: Financial statements and exhibits
UNITED STATES
SECURITIES AND EXCHANGE COMMISSION
WASHINGTON, DC 20549
FORM 8-K
CURRENT REPORT
Pursuant to Section 13 or 15(d) of the
Securities Exchange Act of 1934
Date of Report (Date of earliest event reported): August 4, 2022
| (Exact Name of Registrant as Specified in Its Charter) | ||
| (State or Other Jurisdiction of Incorporation) | (Commission File Number) | (IRS Employer Identification No.) | ||||||||||||
| (Address of Principal Executive Offices) | (Zip Code) | |||||||||||||
Registrant’s telephone number, including area code | |||||||||||
| None | ||||||||||||||
| (Former Name or Former Address, if Changed Since Last Report) | ||||||||||||||
Check the appropriate box below if the Form 8-K filing is intended to simultaneously satisfy the filing obligation of the registrant under any of the following provisions:
| Written communications pursuant to Rule 425 under the Securities Act (17 CFR 230.425) | |||||
| Soliciting material pursuant to Rule 14a-12 under the Exchange Act (17 CFR 240.14a-12) | |||||
| Pre-commencement communications pursuant to Rule 14d-2(b) under the Exchange Act (17 CFR 240.14d-2(b)) | |||||
| Pre-commencement communications pursuant to Rule 13e-4(c) under the Exchange Act (17 CFR 240.13e-4(c)) | |||||
Indicate by check mark whether the registrant is an emerging growth company as defined in Rule 405 of the Securities Act of 1933 (17 CFR §230.405) or Rule 12b-2 of the Securities Exchange Act of 1934 (17 CFR §240.12b-2). Emerging growth company ☐
If an emerging growth company, indicate by check mark if the registrant has elected not to use the extended transition period for complying with any new or revised financial accounting standards provided pursuant to Section 13(a) of the Exchange Act. ☐
Title of each class | Trading Symbol(s) | Name of each exchange on which registered | ||||||||||||
Item 2.02 Results of Operations and Financial Condition
On August 4, 2022, Bristow Group Inc. (“Bristow Group”) issued a press release setting forth its first quarter fiscal year 2023 financial results. A copy of the press release is attached hereto as Exhibit 99.1 and hereby incorporated by reference. The information furnished pursuant to Item 2.02, including Exhibit 99.1, shall not be deemed “filed” for purposes of Section 18 of the Securities Exchange Act of 1934, as amended (the “Exchange Act”), or otherwise subject to the liabilities of that Section, and shall not be incorporated by reference in any filing under the Securities Act of 1933, as amended (the “Securities Act”), or the Exchange Act, except as shall be expressly set forth by specific reference in such a filing.
Item 7.01 Regulation FD Disclosure
On August 5, 2022, Bristow Group will make a presentation about its first quarter fiscal year 2023 earnings as noted in the press release described in Item 2.02 above. A copy of the presentation slides is attached hereto as Exhibit 99.2. Additionally, Bristow Group has posted the presentation on its website at www.bristowgroup.com. The information furnished pursuant to Item 7.01, including Exhibit 99.2, shall not be deemed “filed” for purposes of Section 18 of the Exchange Act, or otherwise subject to the liabilities of that Section, and shall not be incorporated by reference in any filing under the Securities Act, or the Exchange Act, except as shall be expressly set forth by specific reference in such a filing.
Item 9.01 Financial Statements and Exhibits
| Exhibit No. | Description | ||||
| 99.1 | |||||
| 99.2 | |||||
| 104 | Cover Page Interactive Data File – the cover page XBRL tags are embedded within the Inline XBRL document. | ||||
SIGNATURES
Pursuant to the requirements of the Securities Exchange Act of 1934, the registrant has duly caused this report to be signed on its behalf by the undersigned hereunto duly authorized.
| Bristow Group Inc. | ||||||||||||||
| August 4, 2022 | By: | /s/ Jennifer D. Whalen | ||||||||||||
| Name: Jennifer D. Whalen | ||||||||||||||
| Title: Senior Vice President, Chief Financial Officer | ||||||||||||||
Exhibit Index
| Exhibit No. | Description | ||||
| 99.1 | |||||
| 99.2 | |||||
| 104 | Cover Page Interactive Data File – the cover page XBRL tags are embedded within the Inline XBRL document. | ||||
Exhibit 99.1
PRESS RELEASE
BRISTOW GROUP REPORTS
FIRST QUARTER FISCAL YEAR 2023 RESULTS
Houston, Texas
August 4, 2022
•Total revenues of $301.7 million in Q1 FY23 compared to $287.4 million in Q4 FY22
•Net income of $4.0 million, or $0.14 per diluted stock, in Q1 FY23 compared to net loss of $4.3 million, or $(0.15) per diluted stock, in Q4 FY22
•EBITDA adjusted to exclude special items and asset dispositions was $51.1 million in Q1 FY23 compared to $35.9 million in Q4 FY22
•Adjusted Free Cash Flow was $26.0 million in Q1 FY23, with unrestricted cash balance of $255.0 million and total liquidity of $318.0 million
•Awarded £1.6 billion second-generation search and rescue aviation contract by the Maritime and Coastguard Agency (“UK SAR 2G”)
•Signed favorable, long-term maintenance support agreements for global AW139 helicopter fleet
FOR IMMEDIATE RELEASE — Bristow Group Inc. (NYSE: VTOL) today reported net income attributable to the Company of $4.0 million, or $0.14 per diluted stock, for its fiscal first quarter ended June 30, 2022 (“Current Quarter”) on operating revenues of $294.1 million compared to net loss attributable to the Company of $4.3 million, or $(0.15) per diluted stock, in the quarter ended March 31, 2022 (“Preceding Quarter”) on operating revenues of $275.6 million.
Earnings before interest, taxes, depreciation and amortization (“EBITDA”) was $39.0 million in the Current Quarter compared to $26.0 million in the Preceding Quarter. EBITDA adjusted to exclude special items and gains or losses on asset dispositions was $51.1 million in the Current Quarter compared to $35.9 million in the Preceding Quarter. See Reconciliation of Non-GAAP Metrics for a reconciliation of net income (loss), the most directly comparable GAAP (as defined below) measure, to EBITDA and Adjusted EBITDA. The following table provides a bridge between EBITDA, Adjusted EBITDA and Adjusted EBITDA excluding gains or losses on asset dispositions (in thousands, unaudited).
| Three Months Ended, | ||||||||||||||||||||||||||
| June 30, 2022 | March 31, 2022 | |||||||||||||||||||||||||
| EBITDA | $ | 39,024 | $ | 26,044 | ||||||||||||||||||||||
| Special items: | ||||||||||||||||||||||||||
| Restructuring costs | $ | — | $ | 2,113 | ||||||||||||||||||||||
| Loss on impairment | 5,187 | — | ||||||||||||||||||||||||
| PBH amortization | 3,291 | 3,062 | ||||||||||||||||||||||||
| Merger and integration costs | 368 | 824 | ||||||||||||||||||||||||
| Reorganization items, net | 49 | 43 | ||||||||||||||||||||||||
| Nonrecurring professional services fees | 1,091 | 3,796 | ||||||||||||||||||||||||
| $ | 9,986 | $ | 9,838 | |||||||||||||||||||||||
| Adjusted EBITDA | $ | 49,010 | $ | 35,882 | ||||||||||||||||||||||
| Loss on disposal of assets | 2,101 | 41 | ||||||||||||||||||||||||
| Adjusted EBITDA excluding asset dispositions | $ | 51,111 | $ | 35,923 | ||||||||||||||||||||||
1
“I want to thank the Bristow team members who have worked diligently over the last several months to successfully deliver on several of the Company’s strategic priorities, including securing the highly important UKSAR2G contract award, winning new government contracts to provide critical SAR services throughout the Netherlands and the Dutch Caribbean region, and completing the acquisition of British International Helicopters Limited, which expands our government services offering to the Falklands Islands and establishes an important new relationship with the British Armed Forces,” said Chris Bradshaw, President and CEO of Bristow Group. “We have continued to make investments to strengthen our business such as the new long-term, highly favorable maintenance support agreements for our global AW139 helicopter fleet, while at the same time returning capital to shareholders with $10 million of share repurchases executed over the last two months. I’m grateful to the Bristow team for their collective efforts to deliver these successful outcomes and, most importantly, to deliver another quarter of world-class safety performance and excellent customer service.”
Sequential Quarter Results
Operating revenues in the Current Quarter were $18.6 million higher compared to the Preceding Quarter. Operating revenues from oil and gas services were $5.8 million higher primarily due to higher utilization in the Africa and Europe regions and higher fuel revenues. These increases were partially offset by lower lease payment collections from Cougar Helicopters Inc. (“Cougar”), which are recognized on cash basis, and the weakening of the Norwegian krone and British pound sterling relative to the U.S. dollar. Operating revenues from government services were $3.9 million higher primarily due to higher activity, partially offset by the weakening of the British pound sterling relative to the U.S. dollar. Operating revenues from fixed wing services were $9.1 million higher primarily due to higher utilization related to the reopening of borders in Australia.
Operating expenses were $6.8 million higher in the Current Quarter primarily due to higher fuel expenses and maintenance costs, partially offset by lower personnel, insurance and leased-in equipment costs.
General and administrative expenses were $1.5 million lower in the Current Quarter primarily due to lower professional services fees and lower compensation expenses.
Merger and integration costs were $0.5 million lower in the Current Quarter primarily due to lower lease return costs related to the merger with Era Group Inc. (the "Merger").
During the Preceding Quarter, restructuring costs were $2.1 million primarily due to severance costs in the Africa region.
During the Current Quarter, the Company recognized a $5.2 million loss on impairment related to power-by-the-hour (“PBH”) intangible assets write-off.
During the Current Quarter, the Company recognized a loss on disposal of assets of $2.1 million from the sale of five helicopters for cash proceeds of $7.6 million.
During the Current Quarter, the Company recognized earnings of $0.1 million from unconsolidated affiliates compared to losses of $0.3 million in the Preceding Quarter.
Other income, net of $16.8 million in the Current Quarter resulted from foreign exchange gains of $14.0 million, government grants to fixed wing services of $2.5 million and a favorable interest adjustment to the Company’s pension liability of $0.2 million. Other income, net of $13.0 million in the Preceding Quarter resulted from foreign exchange gains of $6.0 million, government grants to fixed wing services of $3.8 million, a gain on the sale of inventory of $1.9 million, insurance gains of $0.7 million and a favorable interest adjustment to the Company’s pension liability of $0.6 million.
Income tax expense was $8.2 million in the Current Quarter compared to $3.3 million in the Preceding Quarter. The increase in income tax expense in the Current Quarter primarily related to changes in the blend of earnings, the tax impact of valuation allowances on the Company’s net operating losses and deductible business interest expense.
Liquidity and Capital Allocation
As of June 30, 2022, the Company had $255.0 million of unrestricted cash and $63.0 million of remaining availability under its amended asset-based revolving credit facility (the “ABL Facility”) for total liquidity of $318.0 million. Borrowings under the amended ABL Facility are subject to certain conditions and requirements.
In the Current Quarter, purchases of property and equipment were $9.0 million, and cash proceeds from dispositions of property and equipment were $7.6 million, resulting in net purchases of / (proceeds from) property and equipment (“Net Capex”) of $1.5 million. In the Preceding Quarter, purchases of property and equipment were
2
$7.8 million, and there were no cash proceeds from dispositions of property and equipment. See Adjusted Free Cash Flow Reconciliation for a reconciliation of Net Capex and Adjusted Free Cash Flow.
In June and July 2022, the Company repurchased 425,938 shares of common stock for gross consideration of $10.0 million, which is an average repurchase price of $23.48 per stock. As of July 29, 2022, $15.0 million remained available under the authorized $75.0 million stock repurchase program.
In August 2022, the Board of Directors of Bristow (the “Board”) approved a new $40.0 million stock repurchase program, and terminated the prior program, under which $15.0 million remained available of the original $75.0 million authorized. Purchases of the Company’s common stock under the stock repurchase program may be made in the open market, including pursuant to a Rule 10b5-1 program, by block repurchases, in private transactions (including with related parties) or otherwise, from time to time, depending on market conditions. The stock repurchase program has no expiration date and may be suspended or discontinued at any time without notice, subject to any changes in applicable law or regulations thereunder.
Recent Highlights
On August 3, 2022, the Board approved a change in the fiscal year end of the Company from March 31st to December 31st. The Company expects to change the fiscal year on a prospective basis and will not adjust operating results for prior periods, and the Company will file a transition report on Form 10-K for the transition period ended December 31, 2022. The Company believes this change to align with the calendar year will provide numerous benefits, including improving comparability between periods and relative to its peers. Bristow intends to issue financial guidance for the 2023 calendar year when it announces next quarter’s earnings.
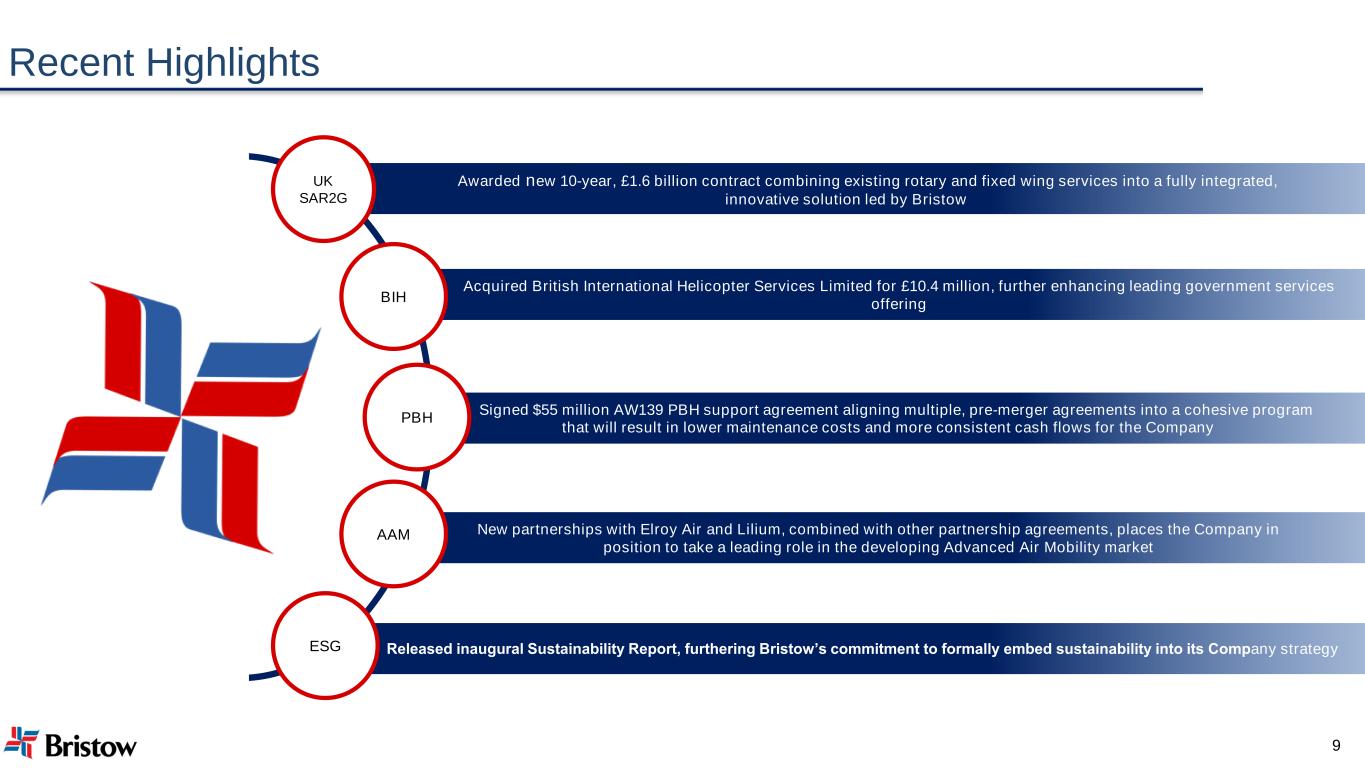
On August 2, 2022, Bristow completed the acquisition of British International Helicopter Services Limited (“BIH”) for £10.4 million, further enhancing its leading global government services offering. Bristow will integrate BIH into its U.K. operations, where BIH will adopt the Bristow name and brand throughout its operations. BIH’s more than 110 employees currently deliver combined search and rescue and support helicopter services for the U.K. Ministry of Defence (MOD) with operations in the Falkland Islands and deliver Fleet Operational Sea Training (FOST) helicopter support for the Royal Navy in the U.K. BIH currently operates a fleet of two AW189 SAR-configured helicopters, three S61 helicopters, and one AS365 helicopter, performing various passenger and freight transport as well as hoist operations. With this acquisition, Bristow established an important new relationship with the British Armed Forces, and the Company is well-positioned to further expand its government services business throughout the U.K. and beyond.
On July 27, 2022, Bristow was pleased to release its first sustainability report, which emphasizes Bristow’s commitment to formally embedding sustainability into the Company’s vision and highlighting its role as a leader in sustainability within the vertical lift industry. Bristow's global environmental sustainability highlights in 2021 include completing flights in the U.K. using sustainable aviation fuel (SAF), initiating a transition to electric ground support vehicles in Norway and the U.K., publishing the first-of-its-kind greenhouse gas emissions report in Brazil, and partnering with leading companies developing electric vertical take-off and landing (eVTOL) and electric short take-off and landing (eSTOL) aircraft. The Company's social sustainability highlights for 2021 include donating more than $500,000 to community engagement programs through its global Bristow Uplift program as well as rescuing 593 people through its U.K. search and rescue program. Additionally, Bristow's executive management team is 50% female, and the Company boasts a U.S. employee base in which one in four employees is a veteran. The complete sustainability report can be viewed at: https://www.bristowgroup.com/sustainability-report-2022.
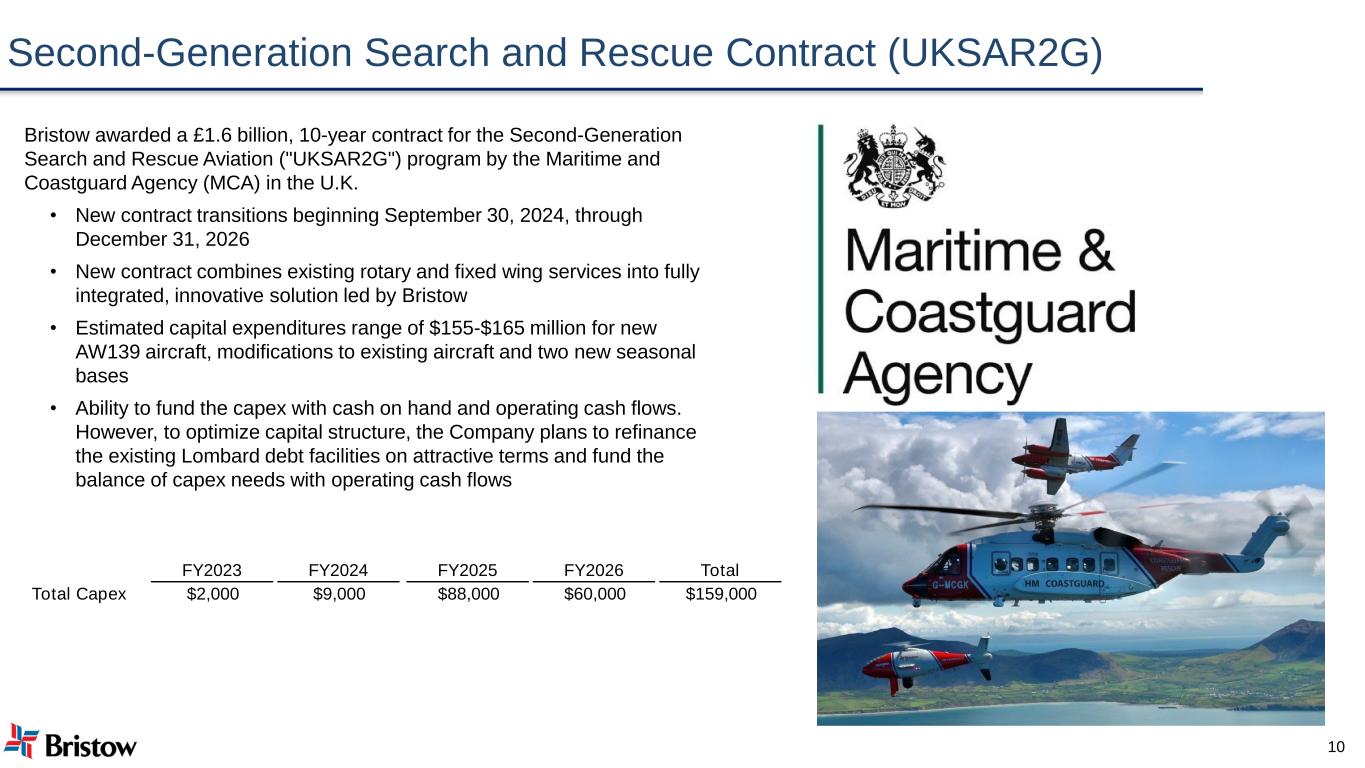
As announced on July 21, 2022, Bristow has been awarded the £1.6 billion 10-year UKSAR2G contract by the Maritime and Coastguard Agency, an executive agency of the U.K. Department for Transport. Bristow will work in partnership with 2Excel Aviation, a leading specialist in fixed wing services, and Nova Systems, the consortium's innovation partner, to deliver the contract for the MCA on behalf of Her Majesty's Coastguard. The UKSAR2G contract combines the existing two separate aviation contracts for fixed wing aircraft and rotary aircraft and will include the use of unmanned aerial systems (UAS). As part of the new contract, Bristow will continue to operate from its current 10 bases and will launch two new seasonal bases in Fort William and Carlisle. The partners will operate: 18 helicopters, including nine existing Leonardo AW189s and three existing Sikorsky S-92s augmented by the introduction of six new Leonardo AW139 helicopters; six King Air fixed-wing airplanes; and one mobile deployable Schiebel CAMCOPTER S-100 UAS. The companies will transition from the current contracts starting from September 30, 2024 through to December 31, 2026, to ensure a continuation of critical search and rescue aviation services across the whole of the U.K.
3
As announced on June 30, 2022, Bristow has signed long-term, favorable maintenance support agreements with Leonardo Helicopters for airframes and Pratt & Whitney for engines on the Company's global fleet of AW139 helicopters. The legacy Era AW139 fleet was previously covered by a limited PBH support agreement with Leonardo for the airframes, while the engines were maintained on a time and cost of materials basis. The legacy Bristow AW139 fleet was covered by multiple, disparate PBH support agreements with Leonardo for the airframes, and the engines were covered under a PBH agreement with Pratt & Whitney. The new agreements result in consistent, global maintenance support programs for Bristow's AW139 helicopters, both the airframes and the engines. These agreements mitigate cost uncertainty in an inflationary environment and will result in maintenance expenses that are more directly correlated with flight hours. The Company expects the new agreements to deliver unlevered, cash-on-cash returns of approximately 20 percent over the life of the agreements. The aggregate buy-in cost is approximately $55 million, which will be paid in installments between July and December 2022. In addition to the AW139 agreements, Bristow has also signed long-term maintenance support agreements with Leonardo for the AW189 airframe and with Honeywell for the AW139 avionics suite. Bristow has also signed a long-term maintenance agreement with General Electric for support of AW189 and S-92 engines.
Conference Call
Management will conduct a conference call starting at 9:00 a.m. ET (8:00 a.m. CT) on Friday, August 5, 2022, to review the results for the fiscal first quarter ended June 30, 2022. The conference call can be accessed as follows:
All callers will need to reference the access code 162062.
Within the U.S.: Operator Assisted Toll-Free Dial-In Number: (800) 207-0148
Outside the U.S.: Operator Assisted International Dial-In Number: (856) 344-9282
Replay
A telephone replay will be available through August 19, 2022 by dialing 888-203-1112 and using the access code 6245002. An audio replay will also be available on the Company’s website at www.bristowgroup.com shortly after the call and will be accessible through August 19, 2022. The accompanying investor presentation will be available on August 5, 2022 on Bristow’s website at www.bristowgroup.com.
For additional information concerning Bristow, contact Jennifer Whalen at InvestorRelations@bristowgroup.com, (713) 369-4636 or visit Bristow Group’s website at https://ir.bristowgroup.com/.
About Bristow Group
Bristow Group Inc. is the leading global provider of innovative and sustainable vertical flight solutions. Bristow primarily provides aviation services to a broad base of major integrated, national and independent offshore energy companies. Bristow provides commercial search and rescue (“SAR”) services in several countries and public sector SAR services in the United Kingdom (“U.K.”) on behalf of the Maritime & Coastguard Agency (“MCA”). Additionally, the Company offers ad hoc helicopter and fixed wing transportation services.
Bristow currently has customers in Australia, Brazil, Canada, Chile, the Dutch Caribbean, the Falkland Islands, Guyana, India, Mexico, the Netherlands, Nigeria, Norway, Spain, Suriname, Trinidad, the U.K. and the U.S.
4
Forward-Looking Statements Disclosure
This press release contains “forward-looking statements.” Forward-looking statements represent Bristow Group Inc.’s (the “Company”) current expectations or forecasts of future events. Forward-looking statements generally can be identified by the use of forward-looking terminology such as “may,” “will,” “expect,” “intend,” “estimate,” “anticipate,” “believe,” “project,” or “continue,” or other similar words. These statements are made under the safe harbor provisions of the Private Securities Litigation Reform Act of 1995, reflect management’s current views with respect to future events and therefore are subject to significant risks and uncertainties, both known and unknown. The Company’s actual results may vary materially from those anticipated in forward-looking statements. The Company cautions investors not to place undue reliance on any forward-looking statements. Forward-looking statements speak only as of the date of the document in which they are made. The Company disclaims any obligation or undertaking to provide any updates or revisions to any forward-looking statement to reflect any change in the Company’s expectations or any change in events, conditions or circumstances on which the forward-looking statement is based that occur after the date hereof. Risks that may affect forward-looking statements include, but are not necessarily limited to, those relating to: public health crises, such as pandemics (COVID-19) and epidemics, and any related government policies and actions; any failure to effectively manage, and receive anticipated returns from, acquisitions, divestitures, investments, joint ventures and other portfolio actions; our inability to execute our business strategy for diversification efforts related to, government services, offshore wind, and advanced air mobility; our reliance on a limited number of customers and the reduction of our customer base as a result of consolidation and/or the energy transition; the possibility that we may be unable to maintain compliance with covenants in our financing agreements; global and regional changes in the demand, supply, prices or other market conditions affecting oil and gas, including changes resulting from a public health crisis or from the imposition or lifting of crude oil production quotas or other actions that might be imposed by the Organization of Petroleum Exporting Countries (OPEC) and other producing countries; fluctuations in the demand for our services; the possibility that we may impair our long-lived assets and other assets, including inventory, property and equipment and investments in unconsolidated affiliates; the possibility of significant changes in foreign exchange rates and controls; potential effects of increased competition and the introduction of energy efficient alternative modes of transportation and solutions; the possibility that we may be unable to re-deploy our aircraft to regions with greater demand; the possibility of changes in tax and other laws and regulations and policies, including, without limitation, actions of the Biden Administration that impact oil and gas operations or favor renewable energy projects in the U.S.; the possibility that we may be unable to dispose of older aircraft through sales into the aftermarket; general economic conditions, including the capital and credit markets; the possibility that segments of our fleet may be grounded for extended periods of time or indefinitely; the existence of operating risks inherent in our business, including the possibility of declining safety performance; the possibility of political instability, war or acts of terrorism in any of the countries where we operate; the possibility that reductions in spending on aviation services by governmental agencies could lead to modifications of our search and rescue (“SAR”) contract terms with governments, our contracts with the Bureau of Safety and Environmental Enforcement (“BSEE”) or delays in receiving payments under such contracts; the effectiveness of our environmental, social and governance initiatives; the impact of supply chain disruptions and inflation and our ability to recoup rising costs in the rates we charge to our customers; and our reliance on a limited number of helicopter manufacturers and suppliers. If one or more of these risks materialize, or if underlying assumptions prove incorrect, actual results may vary materially from those expected. You should not place undue reliance on our forward-looking statements because the matters they describe are subject to known and unknown risks, uncertainties and other unpredictable factors, many of which are beyond our control. Our forward-looking statements are based on the information currently available to us and speak only as of the date hereof. New risks and uncertainties arise from time to time, and it is impossible for us to predict these matters or how they may affect us. We have included important factors in the section entitled “Risk Factors” in the Company’s Annual Report on Form 10-K for the fiscal year ended March 31, 2022 (the “Annual Report”) which we believe over time, could cause our actual results, performance or achievements to differ from the anticipated results, performance or achievements that are expressed or implied by our forward-looking statements. You should consider all risks and uncertainties disclosed in the Annual Report and in our filings with the United States Securities and Exchange Commission (the “SEC”), all of which are accessible on the SEC’s website at www.sec.gov.
5
BRISTOW GROUP INC. CONDENSED CONSOLIDATED STATEMENTS OF OPERATIONS (unaudited, in thousands, except per stock amounts) | |||||||||||||||||
| Three Months Ended | Favorable/ (Unfavorable) | ||||||||||||||||
| June 30, 2022 | March 31, 2022 | ||||||||||||||||
| Revenues: | |||||||||||||||||
| Operating revenues | $ | 294,148 | $ | 275,582 | $ | 18,566 | |||||||||||
| Reimbursable revenues | 7,589 | 11,817 | (4,228) | ||||||||||||||
| Total revenues | 301,737 | 287,399 | 14,338 | ||||||||||||||
| Costs and expenses: | |||||||||||||||||
| Operating expenses | 224,501 | 217,711 | (6,790) | ||||||||||||||
| Reimbursable expenses | 7,287 | 11,694 | 4,407 | ||||||||||||||
| General and administrative expenses | 40,159 | 41,644 | 1,485 | ||||||||||||||
| Merger and integration costs | 368 | 824 | 456 | ||||||||||||||
| Restructuring costs | — | 2,113 | 2,113 | ||||||||||||||
| Depreciation and amortization expense | 16,536 | 16,919 | 383 | ||||||||||||||
| Total costs and expenses | 288,851 | 290,905 | 2,054 | ||||||||||||||
| Loss on impairment | (5,187) | — | (5,187) | ||||||||||||||
| Loss on disposal of assets | (2,101) | (41) | (2,060) | ||||||||||||||
| Earnings (losses) from unconsolidated affiliates, net | 115 | (325) | 440 | ||||||||||||||
| Operating income (loss) | 5,713 | (3,872) | 9,585 | ||||||||||||||
| Interest income | 74 | 17 | 57 | ||||||||||||||
| Interest expense | (10,242) | (10,241) | (1) | ||||||||||||||
| Reorganization items, net | (49) | (43) | (6) | ||||||||||||||
| Other, net | 16,750 | 13,023 | 3,727 | ||||||||||||||
| Total other income, net | 6,533 | 2,756 | 3,777 | ||||||||||||||
| Income (loss) before income taxes | 12,246 | (1,116) | 13,362 | ||||||||||||||
| Income tax expense | (8,231) | (3,260) | (4,971) | ||||||||||||||
| Net income (loss) | 4,015 | (4,376) | 8,391 | ||||||||||||||
| Net (income) loss attributable to noncontrolling interests | (28) | 63 | (91) | ||||||||||||||
| Net income (loss) attributable to Bristow Group Inc. | $ | 3,987 | $ | (4,313) | $ | 8,300 | |||||||||||
| Basic income (loss) per common stock | $ | 0.14 | $ | (0.15) | |||||||||||||
| Diluted income (loss) per common stock | $ | 0.14 | $ | (0.15) | |||||||||||||
| Weighted average common stock outstanding, basic | 28,269 | 28,222 | |||||||||||||||
| Weighted average common stock outstanding, diluted | 28,912 | 28,222 | |||||||||||||||
| EBITDA | $ | 39,024 | $ | 26,044 | $ | 12,980 | |||||||||||
| Adjusted EBITDA | $ | 49,010 | $ | 35,882 | $ | 13,128 | |||||||||||
| Adjusted EBITDA excluding asset dispositions | $ | 51,111 | $ | 35,923 | $ | 15,188 | |||||||||||
6
BRISTOW GROUP INC. OPERATING REVENUES BY LINE OF SERVICE (unaudited, in thousands) | |||||||||||
| Three Months Ended | |||||||||||
| June 30, 2022 | March 31, 2022 | ||||||||||
| Oil and gas services: | |||||||||||
| Europe | $ | 90,053 | $ | 89,234 | |||||||
| Americas | 84,665 | 86,249 | |||||||||
| Africa | 20,362 | 13,837 | |||||||||
| Total oil and gas services | $ | 195,080 | $ | 189,320 | |||||||
| Government services | 70,107 | 66,239 | |||||||||
| Fixed wing services | 25,942 | 16,806 | |||||||||
| Other services | 3,019 | 3,217 | |||||||||
| $ | 294,148 | $ | 275,582 | ||||||||
FLIGHT HOURS BY LINE OF SERVICE (unaudited) | |||||||||||
| Three Months Ended | |||||||||||
| June 30, 2022 | March 31, 2022 | ||||||||||
| Oil and gas services: | |||||||||||
| Europe | 10,851 | 10,677 | |||||||||
| Americas | 10,292 | 10,244 | |||||||||
| Africa | 2,688 | 1,769 | |||||||||
| Total oil and gas services | 23,831 | 22,690 | |||||||||
| Government services | 4,536 | 3,542 | |||||||||
| Fixed wing services | 3,330 | 2,859 | |||||||||
| 31,697 | 29,091 | ||||||||||
7
BRISTOW GROUP INC. CONDENSED CONSOLIDATED BALANCE SHEETS (in thousands, unaudited) | |||||||||||
| June 30, 2022 | March 31, 2022 | ||||||||||
| ASSETS | |||||||||||
| Current assets: | |||||||||||
| Cash and cash equivalents | $ | 258,433 | $ | 266,014 | |||||||
| Accounts receivable | 212,089 | 203,771 | |||||||||
| Inventories | 81,362 | 81,674 | |||||||||
| Assets held for sale | 54 | 59 | |||||||||
| Prepaid expenses and other current assets | 30,848 | 28,367 | |||||||||
| Total current assets | 582,786 | 579,885 | |||||||||
| Property and equipment | 900,756 | 942,608 | |||||||||
| Investment in unconsolidated affiliates | 17,000 | 17,585 | |||||||||
| Right-of-use assets | 215,480 | 193,505 | |||||||||
| Other assets | 126,350 | 90,696 | |||||||||
| Total assets | $ | 1,842,372 | $ | 1,824,279 | |||||||
| LIABILITIES AND STOCKHOLDERS’ EQUITY | |||||||||||
| Current liabilities: | |||||||||||
| Accounts payable | $ | 87,249 | $ | 63,497 | |||||||
| Accrued liabilities | 238,811 | 211,499 | |||||||||
| Short-term borrowings and current maturities of long-term debt | 11,768 | 12,759 | |||||||||
| Total current liabilities | 337,828 | 287,755 | |||||||||
| Long-term debt, less current maturities | 502,603 | 512,909 | |||||||||
| Deferred taxes | 41,739 | 39,811 | |||||||||
| Long-term operating lease liabilities | 149,010 | 125,441 | |||||||||
| Deferred credits and other liabilities | 17,805 | 22,995 | |||||||||
| Total liabilities | 1,048,985 | 988,911 | |||||||||
| Stockholders’ equity: | |||||||||||
| Common stock | 306 | 303 | |||||||||
| Additional paid-in capital | 702,496 | 699,401 | |||||||||
| Retained earnings | 215,207 | 211,220 | |||||||||
| Treasury stock, at cost | (56,361) | (51,659) | |||||||||
| Accumulated other comprehensive income | (67,862) | (23,450) | |||||||||
| Total Bristow Group Inc. stockholders’ equity | 793,786 | 835,815 | |||||||||
| Noncontrolling interests | (399) | (447) | |||||||||
| Total stockholders’ equity | 793,387 | 835,368 | |||||||||
| Total liabilities stockholders’ equity | $ | 1,842,372 | $ | 1,824,279 | |||||||
8
Reconciliation of Non-GAAP Metrics
The Company’s management uses EBITDA and Adjusted EBITDA to assess the performance and operating results of its business. Each of these measures, as well as Free Cash Flow, Adjusted Free Cash Flow and Net Capex, each as detailed below, have limitations, and are provided in addition to, and not as an alternative for, and should be read in conjunction with, the information contained in the Company's financial statements prepared in accordance with generally accepted accounting principles in the U.S. (“GAAP”) (including the notes), included in the Company's filings with the SEC and posted on the Company's website. EBITDA is defined as Earnings before Interest expense, Taxes, Depreciation and Amortization. Adjusted EBITDA is defined as EBITDA further adjusted for certain special items that occurred during the reported period, as noted below. The Company includes EBITDA and Adjusted EBITDA to provide investors with a supplemental measure of its operating performance. Management believes that the use of EBITDA and Adjusted EBITDA is meaningful to investors because it provides information with respect to the Company's ability to meet its future debt service, capital expenditures and working capital requirements and the financial performance of the Company's assets without regard to financing methods, capital structure or historical cost basis. Neither EBITDA nor Adjusted EBITDA is a recognized term under GAAP. Accordingly, they should not be used as an indicator of, or an alternative to, net income as a measure of operating performance. In addition, EBITDA and Adjusted EBITDA are not intended to be measures of free cash flow available for management’s discretionary use, as they do not consider certain cash requirements, such as debt service requirements. Because the definitions of EBITDA and Adjusted EBITDA (or similar measures) may vary among companies and industries, they may not be comparable to other similarly titled measures used by other companies.
The following tables provide a reconciliation of net income (loss), the most directly comparable GAAP measure, to EBITDA and Adjusted EBITDA (in thousands, unaudited).
| Three Months Ended | ||||||||||||||
| June 30, 2022 | March 31, 2022 | |||||||||||||
| Net income (loss) | 4,015 | (4,376) | ||||||||||||
| Depreciation and amortization | 16,536 | 16,919 | ||||||||||||
| Interest expense | 10,242 | 10,241 | ||||||||||||
| Income tax expense | 8,231 | 3,260 | ||||||||||||
| EBITDA | $ | 39,024 | $ | 26,044 | ||||||||||
Special items (1) | 9,986 | 9,838 | ||||||||||||
| Adjusted EBITDA | $ | 49,010 | $ | 35,882 | ||||||||||
| Loss on disposal of assets | 2,101 | 41 | ||||||||||||
| Adjusted EBITDA excluding asset dispositions | $ | 51,111 | $ | 35,923 | ||||||||||
(1)Special items include the following:
| Three Months Ended | |||||||||||
| June 30, 2022 | March 31, 2022 | ||||||||||
| Restructuring costs | $ | — | $ | 2,113 | |||||||
| Loss on impairment | 5,187 | — | |||||||||
| PBH amortization | 3,291 | 3,062 | |||||||||
| Merger and integration costs | 368 | 824 | |||||||||
| Reorganization items, net | 49 | 43 | |||||||||
| Nonrecurring professional services fees | 1,091 | 3,796 | |||||||||
| $ | 9,986 | $ | 9,838 | ||||||||
9
Adjusted Free Cash Flow Reconciliation
Free Cash Flow represents the Company’s net cash provided by operating activities plus proceeds from disposition of property and equipment, less expenditures related to purchases of property and equipment. Adjusted Free Cash Flow is Free Cash Flow adjusted to exclude certain nonrecurring professional services fees, other costs paid in relation to the merger between Era Group Inc. (“Era”) and Bristow Group Inc. (prior to such merger, “Old Bristow”) which was completed in June 2020 (the “Merger”) and reorganization items. Management believes that Free Cash Flow and Adjusted Free Cash Flow are meaningful to investors because they provide information with respect to the Company’s ability to generate cash from the business. The GAAP measure most directly comparable to Free Cash Flow and Adjusted Free Cash Flow is net cash provided by operating activities. Since neither Free Cash Flow nor Adjusted Free Cash Flow is a recognized term under GAAP, they should not be used as an indicator of, or an alternative to, net cash provided by operating activities. Investors should note numerous methods may exist for calculating a company's free cash flow. As a result, the method used by management to calculate Free Cash Flow and Adjusted Free Cash Flow may differ from the methods used by other companies to calculate their free cash flow. As such, they may not be comparable to other similarly titled measures used by other companies.
The following table provides a reconciliation of net cash provided by operating activities, the most directly comparable GAAP measure, to Free Cash Flow and Adjusted Free Cash Flow (in thousands, unaudited).
| Three Months Ended | |||||||||||
| June 30, 2022 | March 31, 2022 | ||||||||||
| Net cash provided by operating activities | 22,750 | 5,577 | |||||||||
| Plus: Proceeds from disposition of property and equipment | 7,558 | — | |||||||||
| Less: Purchases of property and equipment | (9,046) | (7,842) | |||||||||
| Free Cash Flow | $ | 21,262 | $ | (2,265) | |||||||
| Plus: Restructuring costs | 1,479 | — | |||||||||
| Plus: Merger and integration costs | 277 | 851 | |||||||||
| Plus: Reorganization items, net | 42 | 29 | |||||||||
| Plus: Nonrecurring professional services fees | 2,966 | 819 | |||||||||
| Adjusted Free Cash Flow | $ | 26,026 | $ | (566) | |||||||
| Net purchases of property and equipment (“Net Capex”) | 1,488 | 7,842 | |||||||||
| Adjusted Free Cash Flow excluding Net Capex | $ | 27,514 | $ | 7,276 | |||||||
10
BRISTOW GROUP INC. FLEET COUNT (unaudited) | ||||||||||||||||||||||||||||||||||||||
| Number of Aircraft | ||||||||||||||||||||||||||||||||||||||
| Type | Owned Aircraft | Leased Aircraft | Aircraft Held For Sale | Consolidated Aircraft | Max Pass. Capacity | Average Age (years)(1) | ||||||||||||||||||||||||||||||||
| Heavy Helicopters: | ||||||||||||||||||||||||||||||||||||||
| S-92 | 39 | 27 | — | 66 | 19 | 13 | ||||||||||||||||||||||||||||||||
| H225 | — | — | 1 | 1 | 19 | 14 | ||||||||||||||||||||||||||||||||
| AW189 | 17 | 1 | — | 18 | 16 | 6 | ||||||||||||||||||||||||||||||||
| 56 | 28 | 1 | 85 | |||||||||||||||||||||||||||||||||||
| Medium Helicopters: | ||||||||||||||||||||||||||||||||||||||
| AW139 | 51 | 4 | — | 55 | 12 | 11 | ||||||||||||||||||||||||||||||||
| S-76 D/C++/C+ | 22 | — | — | 22 | 12 | 12 | ||||||||||||||||||||||||||||||||
| 73 | 4 | — | 77 | |||||||||||||||||||||||||||||||||||
| Light—Twin Engine Helicopters: | ||||||||||||||||||||||||||||||||||||||
| AW109 | 4 | — | — | 4 | 7 | 15 | ||||||||||||||||||||||||||||||||
| EC135 | 10 | — | — | 10 | 6 | 13 | ||||||||||||||||||||||||||||||||
| 14 | — | — | 14 | |||||||||||||||||||||||||||||||||||
| Light—Single Engine Helicopters: | ||||||||||||||||||||||||||||||||||||||
| AS350 | 17 | — | — | 17 | 4 | 25 | ||||||||||||||||||||||||||||||||
| AW119 | 13 | — | — | 13 | 7 | 16 | ||||||||||||||||||||||||||||||||
| 30 | — | — | 30 | |||||||||||||||||||||||||||||||||||
| Total Helicopters | 173 | 32 | 1 | 206 | 13 | |||||||||||||||||||||||||||||||||
| Fixed wing | 6 | 8 | — | 14 | ||||||||||||||||||||||||||||||||||
| UAV | — | 2 | — | 2 | ||||||||||||||||||||||||||||||||||
| Total Fleet | 179 | 42 | 1 | 222 | ||||||||||||||||||||||||||||||||||
(1)Reflects the average age of helicopters that are owned.
The chart below presents the number of aircraft in our fleet and their distribution among the regions in which we operate as of June 30, 2022 and the percentage of operating revenue that each of our regions provided during the Current Quarter (unaudited).
| Percentage of Current Quarter Operating Revenue | |||||||||||||||||||||||||||||||||||||||||||||||||||||||||||
| UAV | Fixed Wing | ||||||||||||||||||||||||||||||||||||||||||||||||||||||||||
| Heavy | Medium | Light Twin | Light Single | Total | |||||||||||||||||||||||||||||||||||||||||||||||||||||||
| Europe | 54 | % | 61 | 9 | — | 3 | 2 | — | 75 | ||||||||||||||||||||||||||||||||||||||||||||||||||
| Americas | 31 | % | 20 | 52 | 14 | 27 | — | — | 113 | ||||||||||||||||||||||||||||||||||||||||||||||||||
| Asia Pacific | 7 | % | — | 2 | — | — | — | 12 | 14 | ||||||||||||||||||||||||||||||||||||||||||||||||||
| Africa | 8 | % | 4 | 14 | — | — | — | 2 | 20 | ||||||||||||||||||||||||||||||||||||||||||||||||||
| Total | 100 | % | 85 | 77 | 14 | 30 | 2 | 14 | 222 | ||||||||||||||||||||||||||||||||||||||||||||||||||
11
Q1 FY23 Earnings Presentation August 5, 2022 Exhibit 99.2
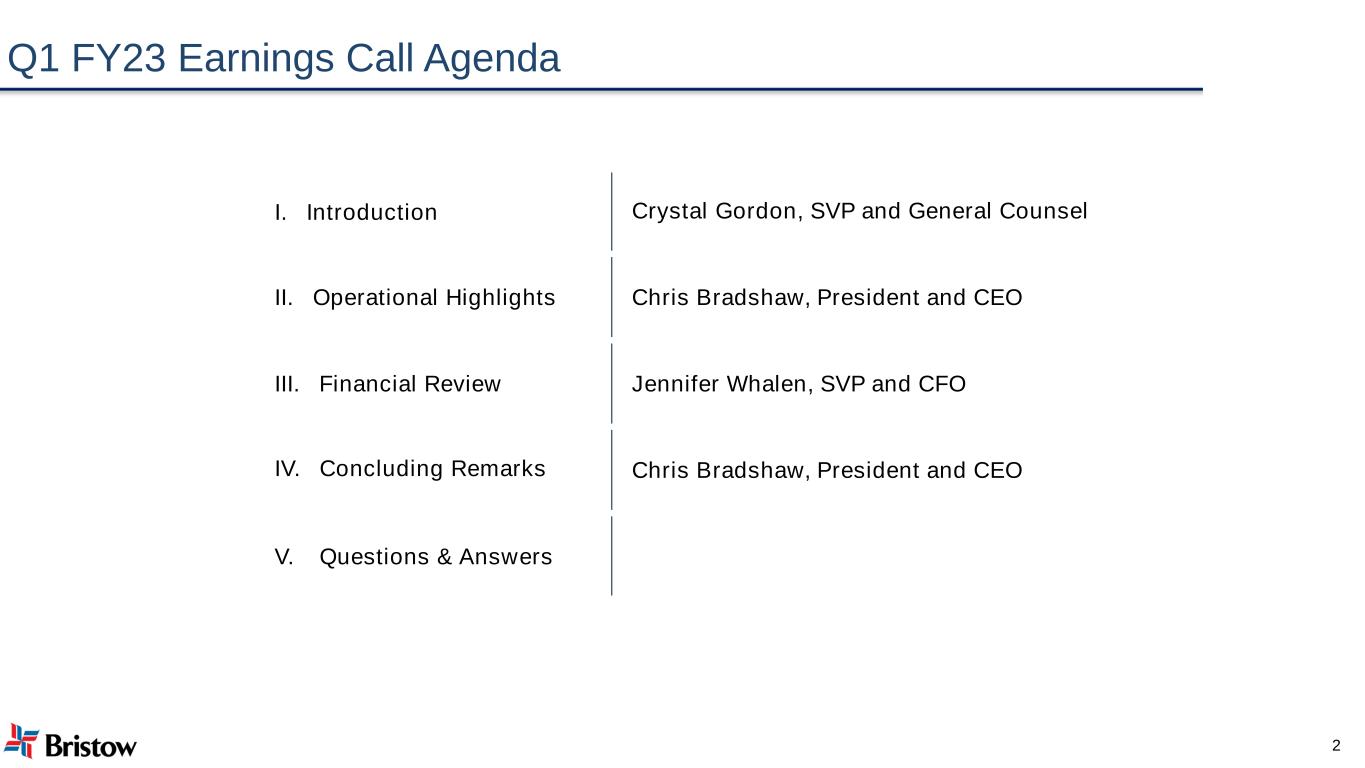
Q1 FY23 Earnings Call Agenda I. Introduction Crystal Gordon, SVP and General Counsel II. Operational Highlights Chris Bradshaw, President and CEO III. Financial Review Jennifer Whalen, SVP and CFO IV. Concluding Remarks Chris Bradshaw, President and CEO V. Questions & Answers 2
This presentation contains “forward-looking statements.” Forward-looking statements represent Bristow Group Inc.’s (the “Company”) current expectations or forecasts of future events. Forward-looking statements generally can be identified by the use of forward-looking terminology such as “may,” “will,” “expect,” “intend,” “estimate,” “anticipate,” “believe,” “project,” or “continue,” or other similar words. These statements are made under the safe harbor provisions of the Private Securities Litigation Reform Act of 1995, reflect management’s current views with respect to future events and therefore are subject to significant risks and uncertainties, both known and unknown. The Company’s actual results may vary materially from those anticipated in forward-looking statements. The Company cautions investors not to place undue reliance on any forward-looking statements. Forward-looking statements speak only as of the date of the document in which they are made. The Company disclaims any obligation or undertaking to provide any updates or revisions to any forward-looking statement to reflect any change in the Company’s expectations or any change in events, conditions or circumstances on which the forward-looking statement is based that occur after the date hereof. Risks that may affect forward-looking statements include, but are not necessarily limited to, those relating to: public health crises, such as pandemics (COVID-19) and epidemics, and any related government policies and actions; any failure to effectively manage, and receive anticipated returns from, acquisitions, divestitures, investments, joint ventures and other portfolio actions; our inability to execute our business strategy for diversification efforts related to, government services, offshore wind, and advanced air mobility; our reliance on a limited number of customers and the reduction of our customers base as a result of consolidation and/or the energy transition; the possibility that we may be unable to maintain compliance with covenants in our financing agreements; global and regional changes in the demand, supply, prices or other market conditions affecting oil and gas, including changes resulting from a public health crisis or from the imposition or lifting of crude oil production quotas or other actions that might be imposed by the Organization of Petroleum Exporting Countries (OPEC) and other producing countries; fluctuations in the demand for our services; the possibility that we may impair our long-lived assets and other assets, including inventory, property and equipment and investments in unconsolidated affiliates; the possibility of significant changes in foreign exchange rates and controls; potential effects of increased competition and the introduction of energy efficient alternative modes of transportation and solutions; the possibility that we may be unable to re-deploy our aircraft to regions with greater demand; the possibility of changes in tax and other laws and regulations and policies, including, without limitation, actions of the Biden Administration that impact oil and gas operations or favor renewable energy projects in the U.S.; the possibility that we may be unable to dispose of older aircraft through sales into the aftermarket; general economic conditions, including the capital and credit markets; the possibility that segments of our fleet may be grounded for extended periods of time or indefinitely; the existence of operating risks inherent in our business, including the possibility of declining safety performance; the possibi lity of political instability, war or acts of terrorism in any of the countries where we operate; the possibility that reductions in spending on aviation services by governmental agencies could lead to modifications of our search and rescue (“SAR”) contract terms with governments, our contracts with the Bureau of Safety and Environmental Enforcement (“BSEE”) or delays in receiving payments under such contracts; the effectiveness of our environmental, social and governance initiatives; the impact of supply chain disruptions and inflation and our ability to recoup rising costs in the rates we charge to our customers; and our reliance on a limited number of helicopter manufacturers and suppliers. If one or more of these risks materializes, or if underlying assumptions prove incorrect, actual results may vary materially from those expected. You should not place undue reliance on our forward-looking statements because the matters they describe are subject to known and unknown risks, uncertainties and other unpredictable factors, many of which are beyond our control. Our forward-looking statements are based on the information currently available to us and speak only as of the date hereof. New risks and uncertainties arise from time to time, and it is impossible for us to predict these matters or how they may affect us. We have included important factors in the section entitled “Risk Factors” in the Company’s Annual Report on Form 10-K for the fiscal year ended March 31, 2022 (the “Annual Report”) which we believe over time, could cause our actual results, performance or achievements to differ from the anticipated results, performance or achievements that are expressed or implied by our forward-looking statements. You should consider all risks and uncertainties disclosed in the Annual Report and in our filings with the United States Securities and Exchange Commission (the “SEC”), all of which are accessible on the SEC’s website at www.sec.gov. Cautionary Statement Regarding Forward-Looking Statements 3
Non-GAAP In addition to financial results calculated in accordance with U.S. generally accepted accounting principles (“GAAP”), this presentation includes certain non-GAAP measures including EBITDA, Adjusted EBITDA, Net Debt, Free Cash Flow and Adjusted Free Cash Flow. Each of these measures, detailed below, have limitations, and are provided in addition to, and not as an alternative for, and should be read in conjunction with, the information contained in our financial statements prepared in accordance with GAAP (including the notes), included in our filings with the SEC and posted on our website. EBITDA and Adjusted EBITDA are presented as supplemental measures of the Company’s operating performance. EBITDA is defined as Earnings before Interest expense, Taxes, Depreciation and Amortization. Adjusted EBITDA is defined as EBITDA further adjusted for special items that occurred during the reporting period and noted in the applicable reconciliation. Management believes that the use of EBITDA and Adjusted EBITDA is meaningful to investors because it provides information with respect to our ability to meet our future debt service, capital expenditures and working capital requirements the financial performance of our assets without regard to financing methods, capital structure or historical cost basis. The GAAP measure most directly comparable to EBITDA and Adjusted EBITDA is net income. Since neither EBITDA nor Adjusted EBITDA is a recognized term under GAAP, they should not be used as an indicator of, or an alternative to, net income as a measure of operating performance. In addition, EBITDA and Adjusted EBITDA are not intended to be measures of Free Cash Flow available for discretionary use, as they do not take into account certain cash requirements, such as debt service requirements. Because the definitions of EBITDA and Adjusted EBITDA (or similar measures) may vary among companies and industries, they may not be comparable to other similarly titled measures used by other companies. Free Cash Flow represents the Company’s net cash provided by operating activities plus proceeds from disposition of property and equipment, less expenditures related to purchases of property and equipment. Adjusted Free Cash Flow is Free Cash Flow adjusted to exclude certain nonrecurring professional services fees, government grants related to the Company’s fixed wing services, other costs paid in relation to the merger between Era Group Inc. (“Era”) and Bristow Group Inc. (prior to such merger, “Old Bristow”) which was completed in June 2020 (the “Merger”), and the implementation of fresh-start accounting and the voluntary petitions filed by Old Bristow and certain of its subsidiaries on May 11, 2019, in the U.S. Bankruptcy Court for the Southern District of Texas, Houston Division seeking relief under Chapter 11 of Title 11 of the U.S. Code (the “Chapter 11 Cases”). Management believes that Free Cash Flow and Adjusted Free Cash Flow are meaningful to investors because they provide information with respect to our ability to generate cash from the business. The GAAP measure most directly comparable to Free Cash Flow and Adjusted Free Cash Flow is net cash provided by operating activities. Since neither Free Cash Flow nor Adjusted Free Cash Flow is a recognized term under GAAP, they should not be used as an indicator of, or an alternative to, net cash provided by operating activities. Investors should note numerous methods may exist for calculating a company's Free Cash Flow. As a result, the method used by management to calculate Free Cash Flow and Adjusted Free Cash Flow may differ from the methods used by other companies to calculate their Free Cash Flow. As such, they may not be comparable to other similarly titled measures used by other companies. The Company also uses Adjusted Free Cash Flow excluding Net Capex. “Net Capex” is defined as net (proceeds from)/purchases of property and equipment. Management uses Adjusted Free Cash Flow excluding Net Capex, and believes this information is meaningful to investors, as an analytical indicator to assess the Company’s liquidity and cash generating performance. The Company also presents Net Debt, which is a non-GAAP measure, defined as total principal balance on borrowings less unrestricted cash and cash equivalents. The GAAP measure most directly comparable to Net Debt is total debt. Since Net Debt is not a recognized term under GAAP, it should not be used as an indicator of, or an alternative to, total debt. Management uses Net Debt to determine the Company’s outstanding debt obligations that would not be readily satisfied by its cash and cash equivalents on hand. Management believes this metric is useful to investors in determining the Company’s leverage position since the Company has the ability to, and may decide to, use a portion of its cash and cash equivalents to reduce debt. A reconciliation of each of EBITDA, Adjusted EBITDA, Adjusted EBITDA excluding gains or losses on asset dispositions, Free Cash Flow, Adjusted Free Cash Flow, and Net Debt is included elsewhere in this presentation. Non-GAAP Financial Measures Reconciliation 4
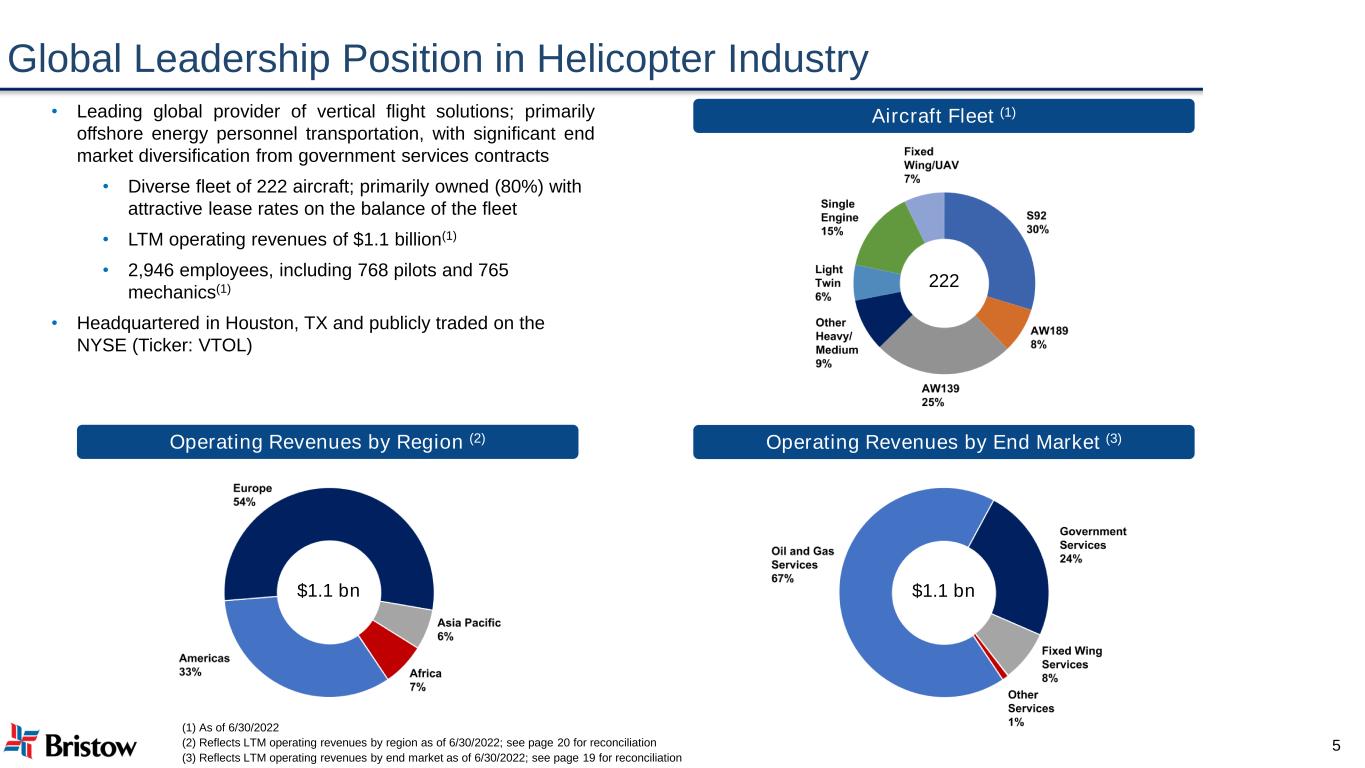
Global Leadership Position in Helicopter Industry Aircraft Fleet (1)• Leading global provider of vertical flight solutions; primarily offshore energy personnel transportation, with significant end market diversification from government services contracts • Diverse fleet of 222 aircraft; primarily owned (80%) with attractive lease rates on the balance of the fleet • LTM operating revenues of $1.1 billion(1) • 2,946 employees, including 768 pilots and 765 mechanics(1) • Headquartered in Houston, TX and publicly traded on the NYSE (Ticker: VTOL) Operating Revenues by End Market (3) (1) As of 6/30/2022 (2) Reflects LTM operating revenues by region as of 6/30/2022; see page 20 for reconciliation (3) Reflects LTM operating revenues by end market as of 6/30/2022; see page 19 for reconciliation 222 $1.1 bn 5 Operating Revenues by Region (2) $1.1 bn
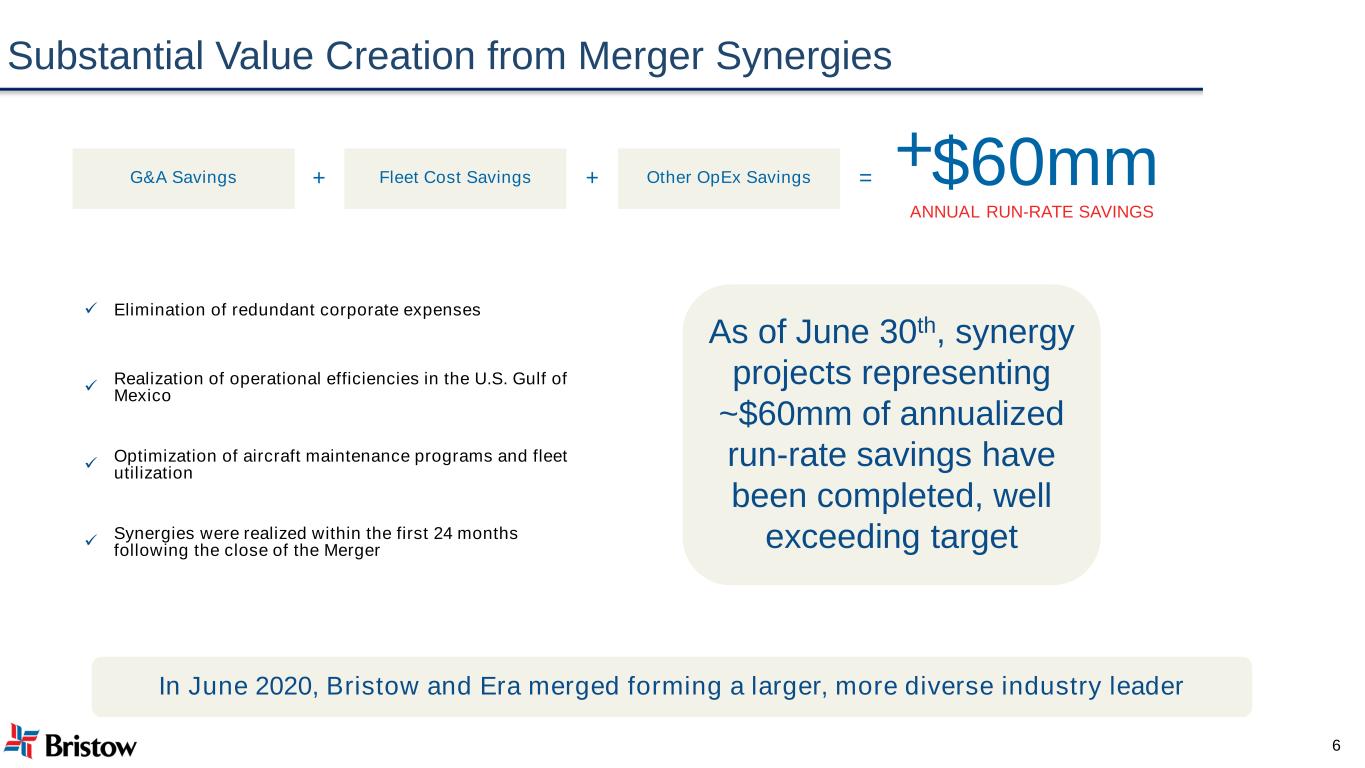
Substantial Value Creation from Merger Synergies As of June 30th, synergy projects representing ~$60mm of annualized run-rate savings have been completed, well exceeding target ✓ Elimination of redundant corporate expenses ✓ Realization of operational efficiencies in the U.S. Gulf of Mexico ✓ Optimization of aircraft maintenance programs and fleet utilization ✓ Synergies were realized within the first 24 months following the close of the Merger G&A Savings Fleet Cost Savings Other OpEx Savings 6 + + = +$60mm ANNUAL RUN-RATE SAVINGS In June 2020, Bristow and Era merged forming a larger, more diverse industry leader
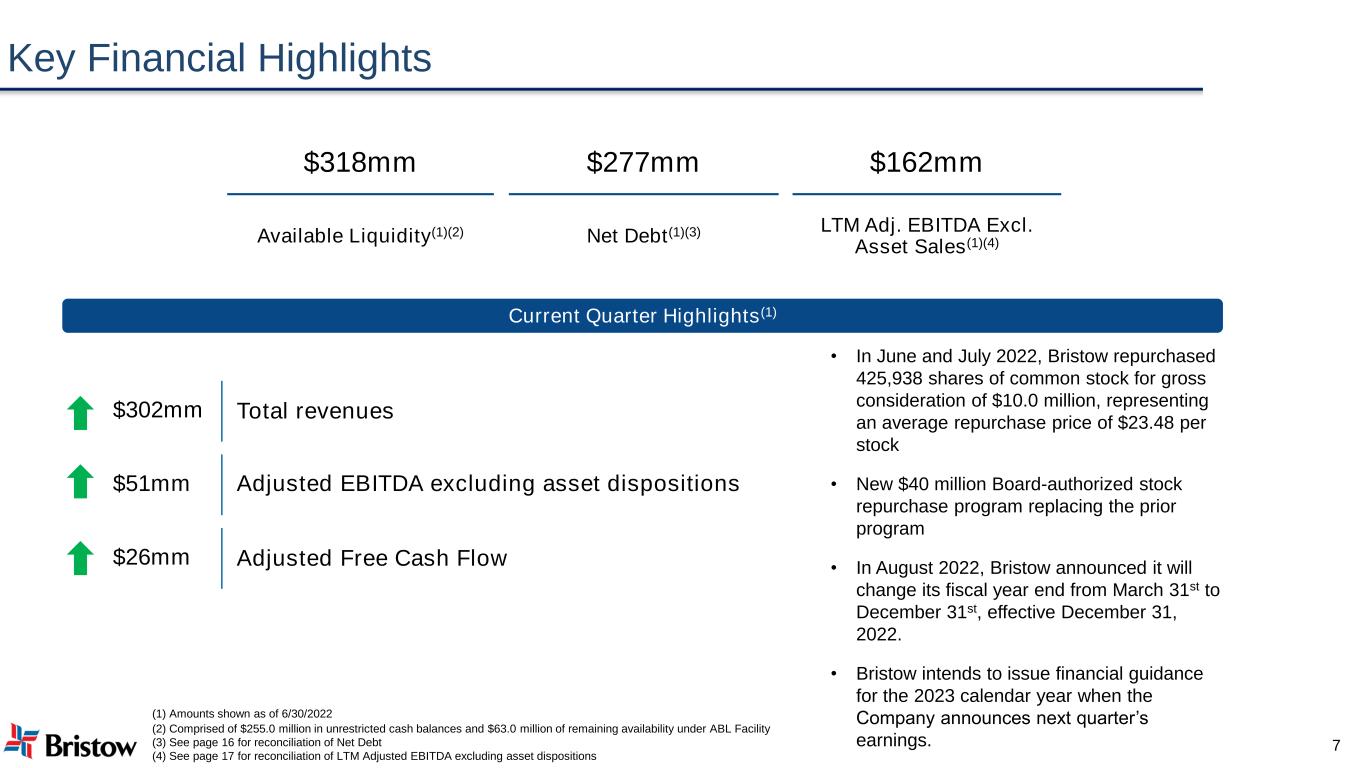
Key Financial Highlights (1) Amounts shown as of 6/30/2022 (2) Comprised of $255.0 million in unrestricted cash balances and $63.0 million of remaining availability under ABL Facility (3) See page 16 for reconciliation of Net Debt (4) See page 17 for reconciliation of LTM Adjusted EBITDA excluding asset dispositions 7 $318mm $277mm $162mm Available Liquidity(1)(2) Net Debt(1)(3) LTM Adj. EBITDA Excl. Asset Sales(1)(4) Current Quarter Highlights(1) $302mm Total revenues $51mm Adjusted EBITDA excluding asset dispositions $26mm Adjusted Free Cash Flow • In June and July 2022, Bristow repurchased 425,938 shares of common stock for gross consideration of $10.0 million, representing an average repurchase price of $23.48 per stock • New $40 million Board-authorized stock repurchase program replacing the prior program • In August 2022, Bristow announced it will change its fiscal year end from March 31st to December 31st, effective December 31, 2022. • Bristow intends to issue financial guidance for the 2023 calendar year when the Company announces next quarter’s earnings.
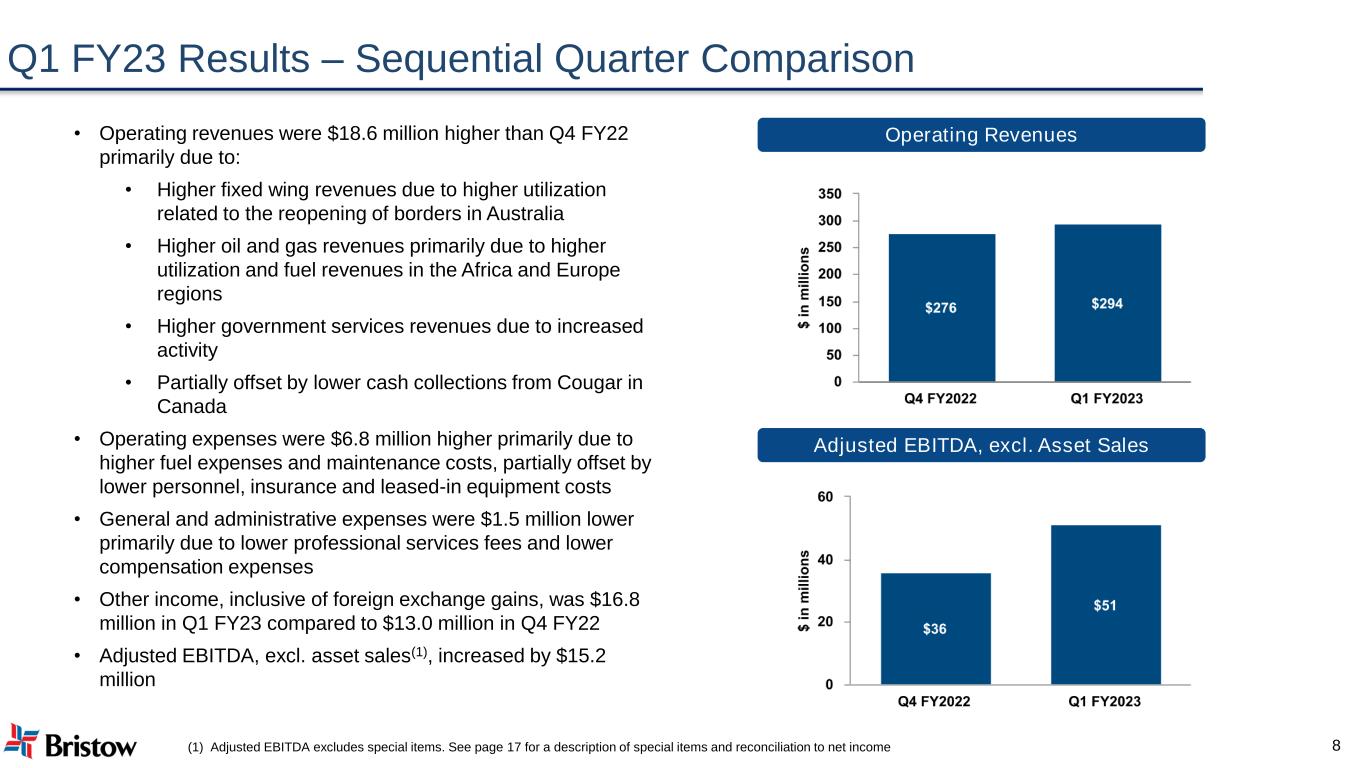
Q1 FY23 Results – Sequential Quarter Comparison Operating Revenue Operating Revenues Adjusted EBITDA, excl. Asset Sales (1) Adjusted EBITDA excludes special items. See page 17 for a description of special items and reconciliation to net income 8 • Operating revenues were $18.6 million higher than Q4 FY22 primarily due to: • Higher fixed wing revenues due to higher utilization related to the reopening of borders in Australia • Higher oil and gas revenues primarily due to higher utilization and fuel revenues in the Africa and Europe regions • Higher government services revenues due to increased activity • Partially offset by lower cash collections from Cougar in Canada • Operating expenses were $6.8 million higher primarily due to higher fuel expenses and maintenance costs, partially offset by lower personnel, insurance and leased-in equipment costs • General and administrative expenses were $1.5 million lower primarily due to lower professional services fees and lower compensation expenses • Other income, inclusive of foreign exchange gains, was $16.8 million in Q1 FY23 compared to $13.0 million in Q4 FY22 • Adjusted EBITDA, excl. asset sales(1), increased by $15.2 million
Recent Highlights 9 Awarded new 10-year, £1.6 billion contract combining existing rotary and fixed wing services into a fully integrated, innovative solution led by Bristow UK SAR2G Acquired British International Helicopter Services Limited for £10.4 million, further enhancing leading government services offering Signed $55 million AW139 PBH support agreement aligning multiple, pre-merger agreements into a cohesive program that will result in lower maintenance costs and more consistent cash flows for the Company New partnerships with Elroy Air and Lilium, combined with other partnership agreements, places the Company in position to take a leading role in the developing Advanced Air Mobility market Released inaugural Sustainability Report, furthering Bristow’s commitment to formally embed sustainability into its Company strategy BIH PBH AAM ESG
Second-Generation Search and Rescue Contract (UKSAR2G) Bristow awarded a £1.6 billion, 10-year contract for the Second-Generation Search and Rescue Aviation ("UKSAR2G") program by the Maritime and Coastguard Agency (MCA) in the U.K. • New contract transitions beginning September 30, 2024, through December 31, 2026 • New contract combines existing rotary and fixed wing services into fully integrated, innovative solution led by Bristow • Estimated capital expenditures range of $155-$165 million for new AW139 aircraft, modifications to existing aircraft and two new seasonal bases • Ability to fund the capex with cash on hand and operating cash flows. However, to optimize capital structure, the Company plans to refinance the existing Lombard debt facilities on attractive terms and fund the balance of capex needs with operating cash flows 10 FY2023 FY2024 FY2025 FY2026 Total Total Capex $2,000 $9,000 $88,000 $60,000 $159,000
Multi-year Growth in Upstream Oil & Gas Spending is Underway “…we think the growth rate will likely be much steeper with a longer duration than we initially thought, creating the best investment environment for Energy Services in almost 20 years.” “We have never seen $100/bbl oil at the trough of a cycle (global spare capacity will only be 1-2% by year end)” “This will be a margin cycle, not a build cycle…” — J. David Anderson, CFA Barclays Research Source: Company Reports, Barclays Research 11 Upstream Spending (North America / International) 1980 – 2025E
Strengthening Offshore Market Dynamics “Despite the risk of a global recession, we believe fundamentals for E&P upstream spending are strong…Fueled by years of under-investment and energy security and reliability concerns, E&P upstream spending growth is being driven by ambitions to grow spare production capacity and not by supply/demand dynamics alone.” — James West, Evercore ISI Source: Evercore ISI 12 Worldwide Average Working Floaters Worldwide Average Working Jackups
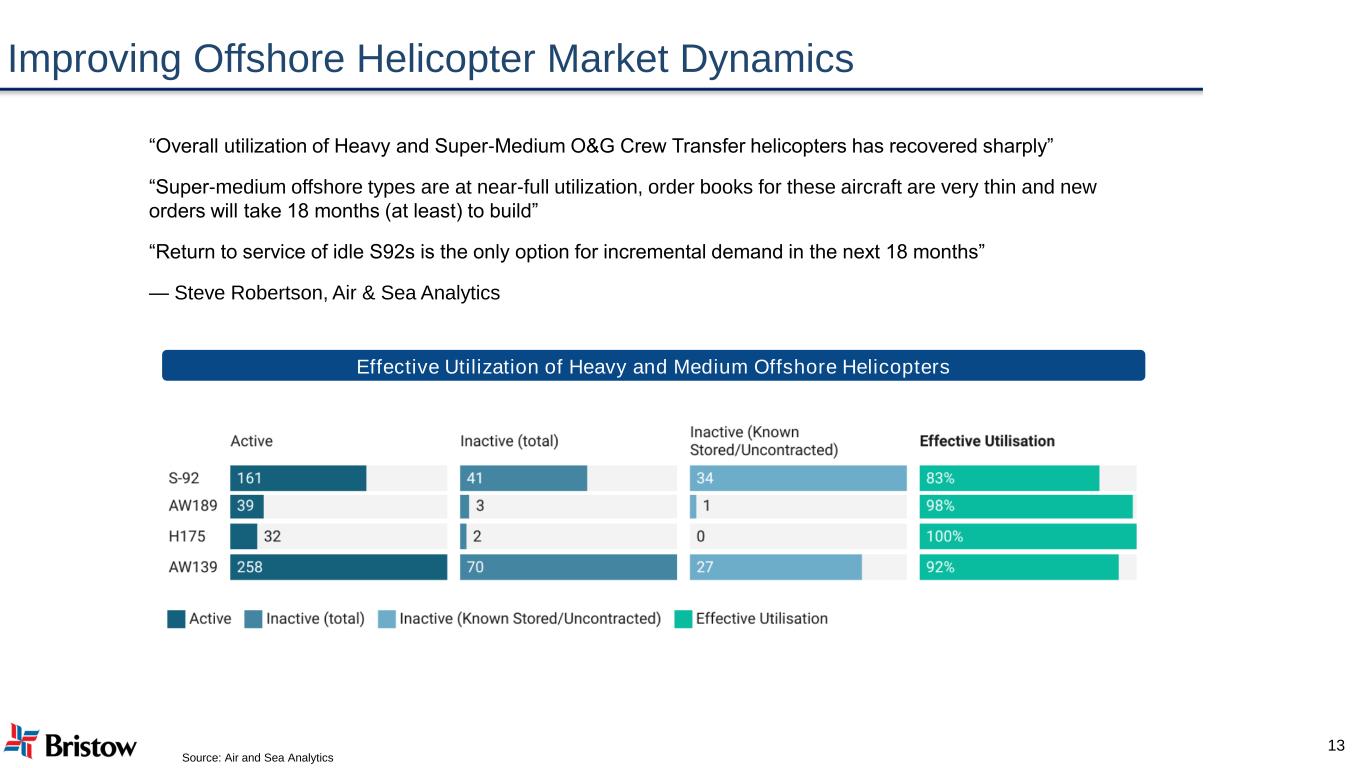
Improving Offshore Helicopter Market Dynamics “Overall utilization of Heavy and Super-Medium O&G Crew Transfer helicopters has recovered sharply” “Super-medium offshore types are at near-full utilization, order books for these aircraft are very thin and new orders will take 18 months (at least) to build” “Return to service of idle S92s is the only option for incremental demand in the next 18 months” — Steve Robertson, Air & Sea Analytics Source: Air and Sea Analytics 13 Effective Utilization of Heavy and Medium Offshore Helicopters
14 11 Appendix ⮚ Fleet Overview ⮚ Strong Balance Sheet and Liquidity Position ⮚ Reconciliation of LTM Adjusted EBITDA ⮚ Reconciliation of Free Cash Flow ⮚ Operating Revenues and Flight Hours by Line of Service ⮚ LTM Operating Revenues
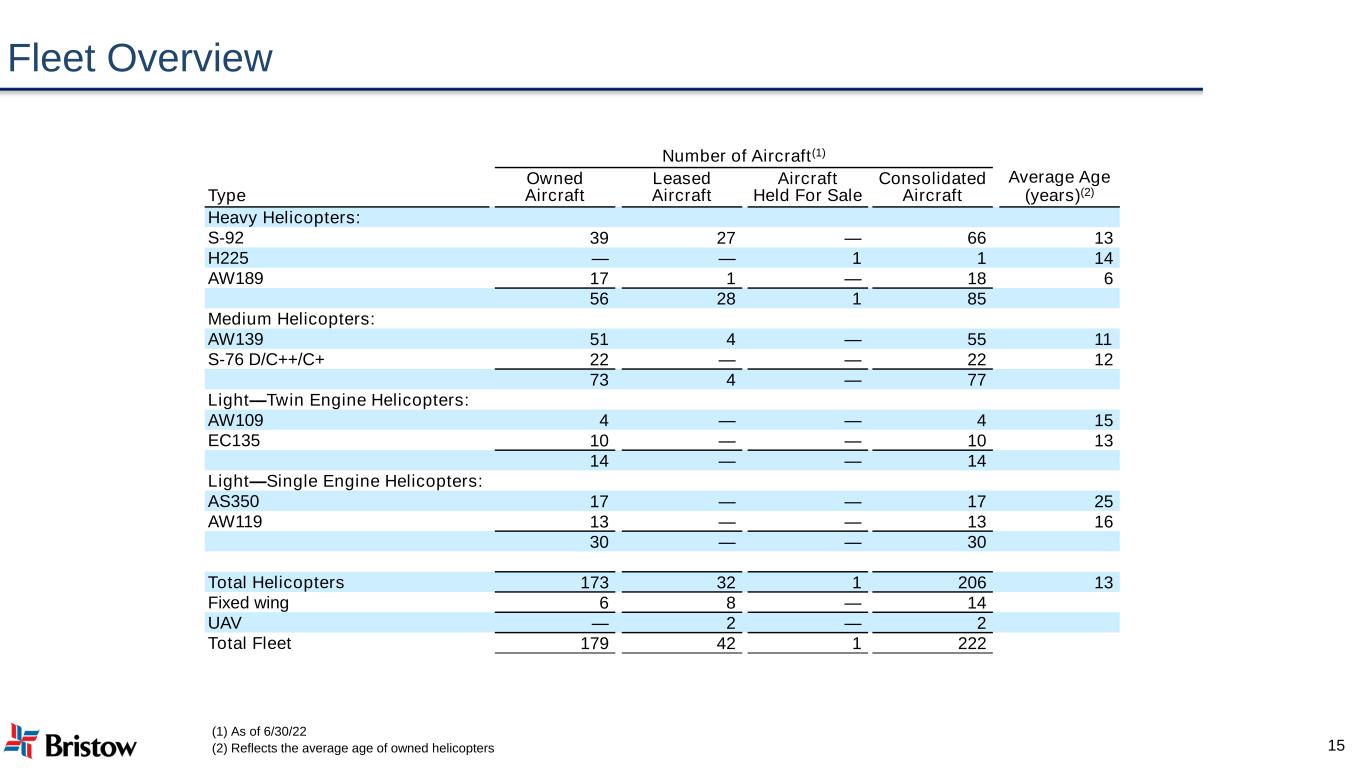
Fleet Overview (1) As of 6/30/22 (2) Reflects the average age of owned helicopters 15 Number of Aircraft(1) Type Owned Aircraft Leased Aircraft Aircraft Held For Sale Consolidated Aircraft Average Age (years)(2) Heavy Helicopters: S-92 39 27 — 66 13 H225 — — 1 1 14 AW189 17 1 — 18 6 56 28 1 85 Medium Helicopters: AW139 51 4 — 55 11 S-76 D/C++/C+ 22 — — 22 12 73 4 — 77 Light—Twin Engine Helicopters: AW109 4 — — 4 15 EC135 10 — — 10 13 14 — — 14 Light—Single Engine Helicopters: AS350 17 — — 17 25 AW119 13 — — 13 16 30 — — 30 Total Helicopters 173 32 1 206 13 Fixed wing 6 8 — 14 UAV — 2 — 2 Total Fleet 179 42 1 222
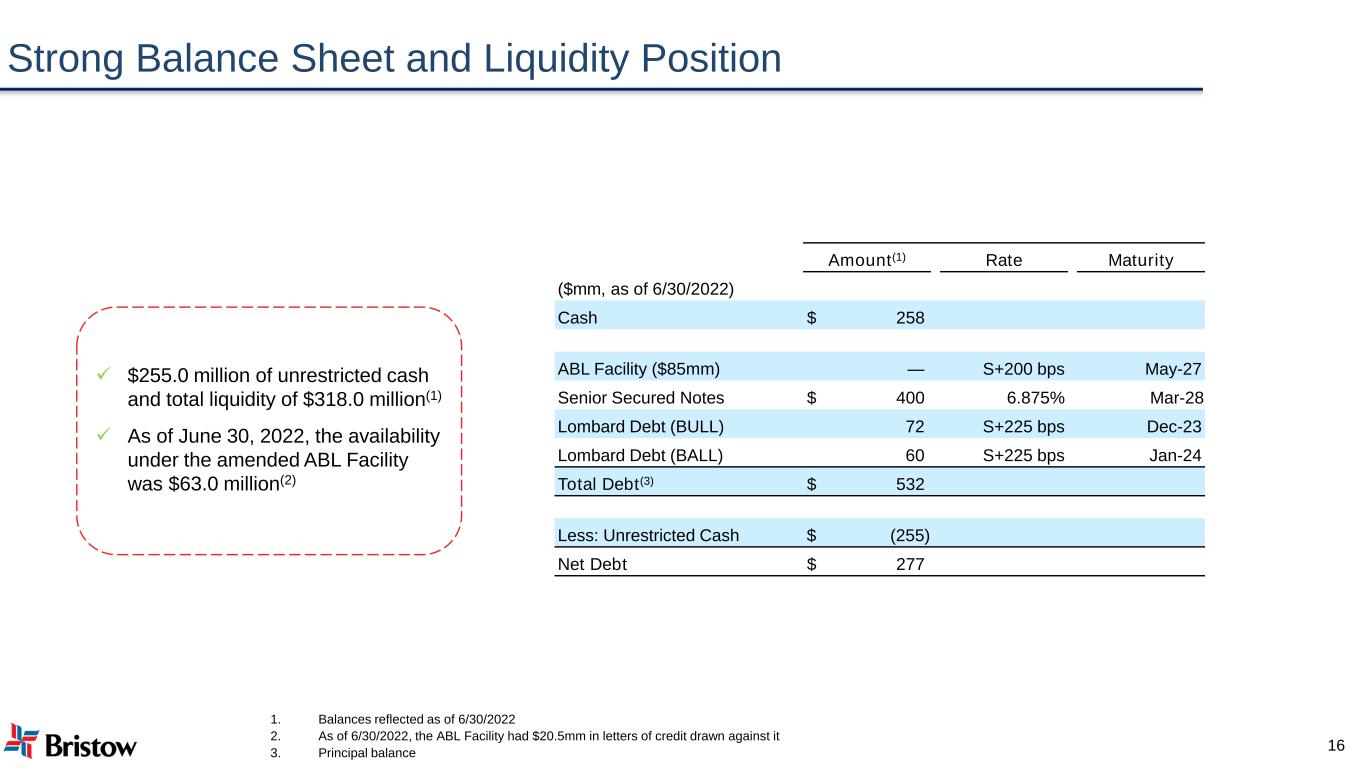
Strong Balance Sheet and Liquidity Position ✓ $255.0 million of unrestricted cash and total liquidity of $318.0 million(1) ✓ As of June 30, 2022, the availability under the amended ABL Facility was $63.0 million(2) 1. Balances reflected as of 6/30/2022 2. As of 6/30/2022, the ABL Facility had $20.5mm in letters of credit drawn against it 3. Principal balance Amount(1) Rate Maturity ($mm, as of 6/30/2022) Cash $ 258 ABL Facility ($85mm) — S+200 bps May-27 Senior Secured Notes $ 400 6.875% Mar-28 Lombard Debt (BULL) 72 S+225 bps Dec-23 Lombard Debt (BALL) 60 S+225 bps Jan-24 Total Debt(3) $ 532 Less: Unrestricted Cash $ (255) Net Debt $ 277 16
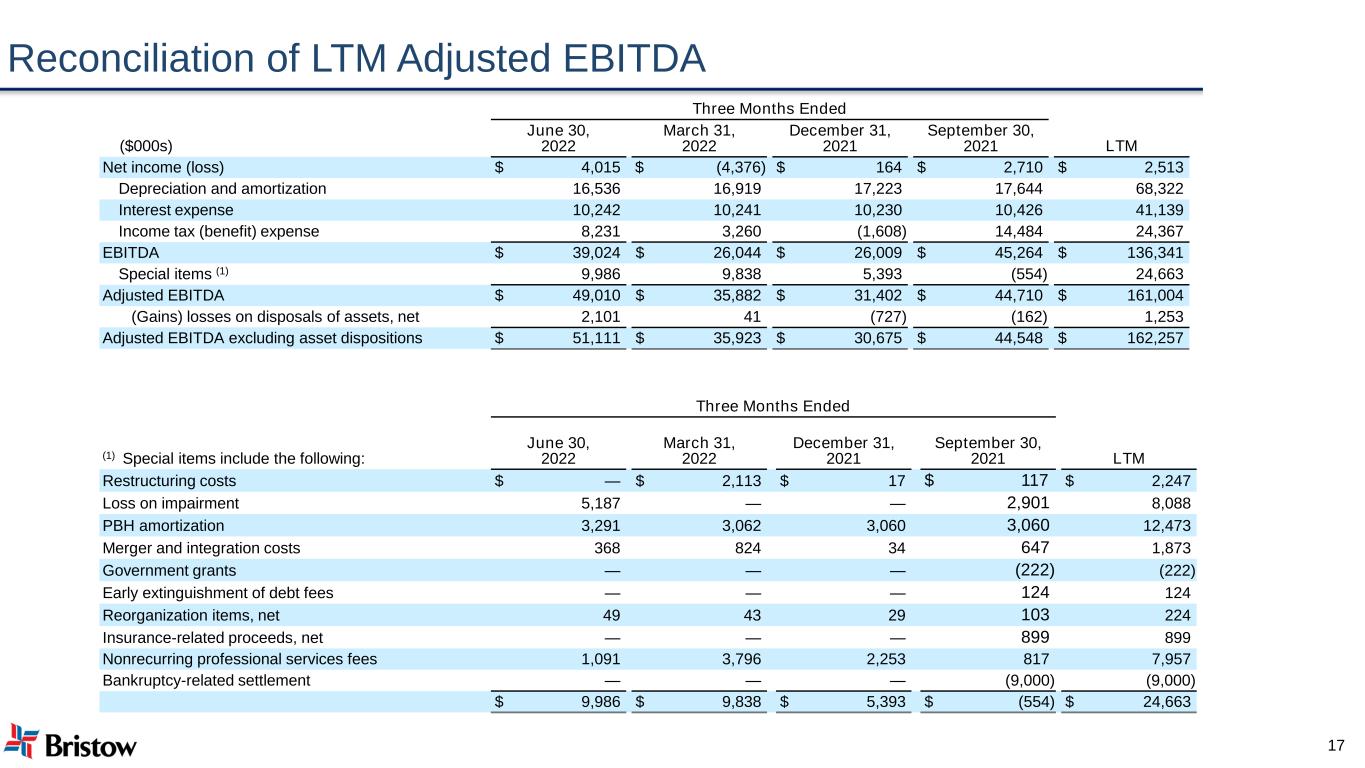
Reconciliation of LTM Adjusted EBITDA Three Months Ended ($000s) June 30, 2022 March 31, 2022 December 31, 2021 September 30, 2021 LTM Net income (loss) $ 4,015 $ (4,376) $ 164 $ 2,710 $ 2,513 Depreciation and amortization 16,536 16,919 17,223 17,644 68,322 Interest expense 10,242 10,241 10,230 10,426 41,139 Income tax (benefit) expense 8,231 3,260 (1,608) 14,484 24,367 EBITDA $ 39,024 $ 26,044 $ 26,009 $ 45,264 $ 136,341 Special items (1) 9,986 9,838 5,393 (554) 24,663 Adjusted EBITDA $ 49,010 $ 35,882 $ 31,402 $ 44,710 $ 161,004 (Gains) losses on disposals of assets, net 2,101 41 (727) (162) 1,253 Adjusted EBITDA excluding asset dispositions $ 51,111 $ 35,923 $ 30,675 $ 44,548 $ 162,257 17 Three Months Ended (1) Special items include the following: June 30, 2022 March 31, 2022 December 31, 2021 September 30, 2021 LTM Restructuring costs $ — $ 2,113 $ 17 $ 117 $ 2,247 Loss on impairment 5,187 — — 2,901 8,088 PBH amortization 3,291 3,062 3,060 3,060 12,473 Merger and integration costs 368 824 34 647 1,873 Government grants — — — (222) (222) Early extinguishment of debt fees — — — 124 124 Reorganization items, net 49 43 29 103 224 Insurance-related proceeds, net — — — 899 899 Nonrecurring professional services fees 1,091 3,796 2,253 817 7,957 Bankruptcy-related settlement — — — (9,000) (9,000) $ 9,986 $ 9,838 $ 5,393 $ (554) $ 24,663
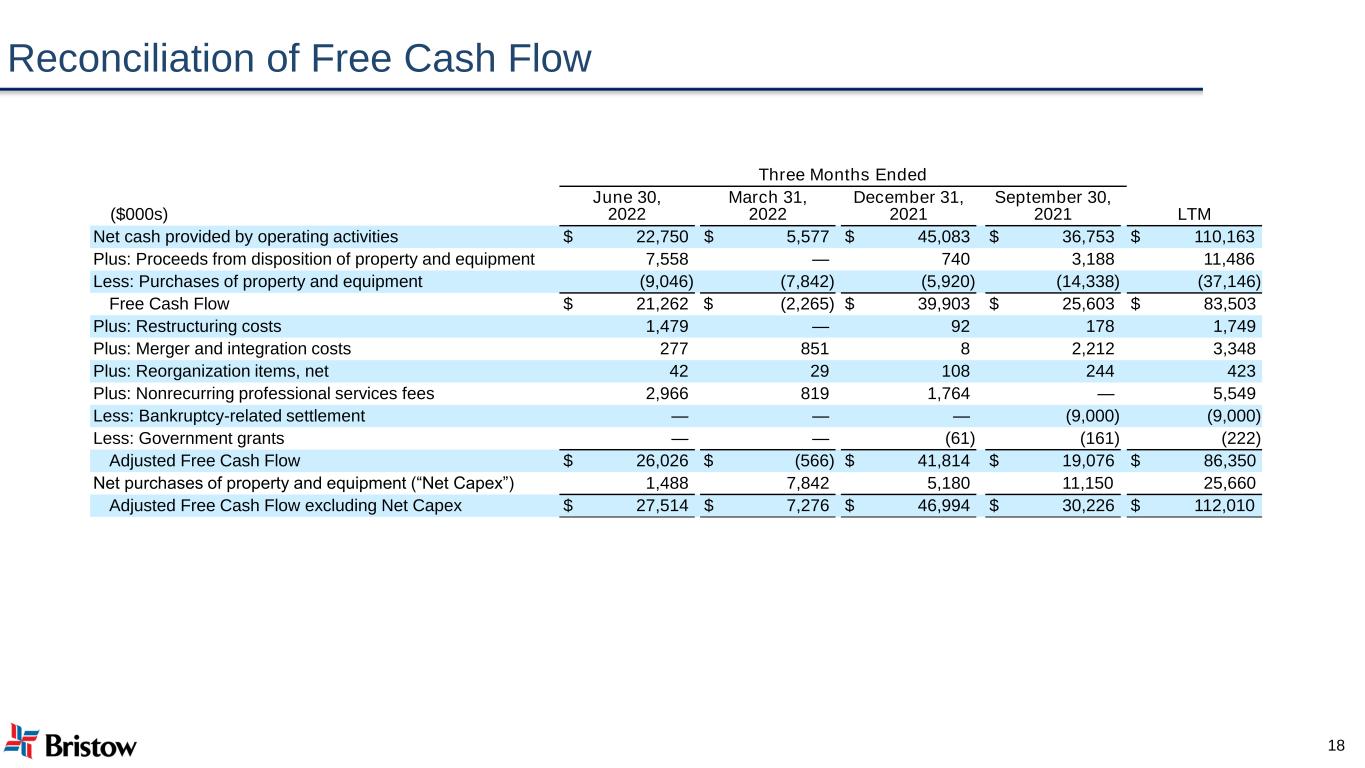
Reconciliation of Free Cash Flow 18 Three Months Ended ($000s) June 30, 2022 March 31, 2022 December 31, 2021 September 30, 2021 LTM Net cash provided by operating activities $ 22,750 $ 5,577 $ 45,083 $ 36,753 $ 110,163 Plus: Proceeds from disposition of property and equipment 7,558 — 740 3,188 11,486 Less: Purchases of property and equipment (9,046) (7,842) (5,920) (14,338) (37,146) Free Cash Flow $ 21,262 $ (2,265) $ 39,903 $ 25,603 $ 83,503 Plus: Restructuring costs 1,479 — 92 178 1,749 Plus: Merger and integration costs 277 851 8 2,212 3,348 Plus: Reorganization items, net 42 29 108 244 423 Plus: Nonrecurring professional services fees 2,966 819 1,764 — 5,549 Less: Bankruptcy-related settlement — — — (9,000) (9,000) Less: Government grants — — (61) (161) (222) Adjusted Free Cash Flow $ 26,026 $ (566) $ 41,814 $ 19,076 $ 86,350 Net purchases of property and equipment (“Net Capex”) 1,488 7,842 5,180 11,150 25,660 Adjusted Free Cash Flow excluding Net Capex $ 27,514 $ 7,276 $ 46,994 $ 30,226 $ 112,010
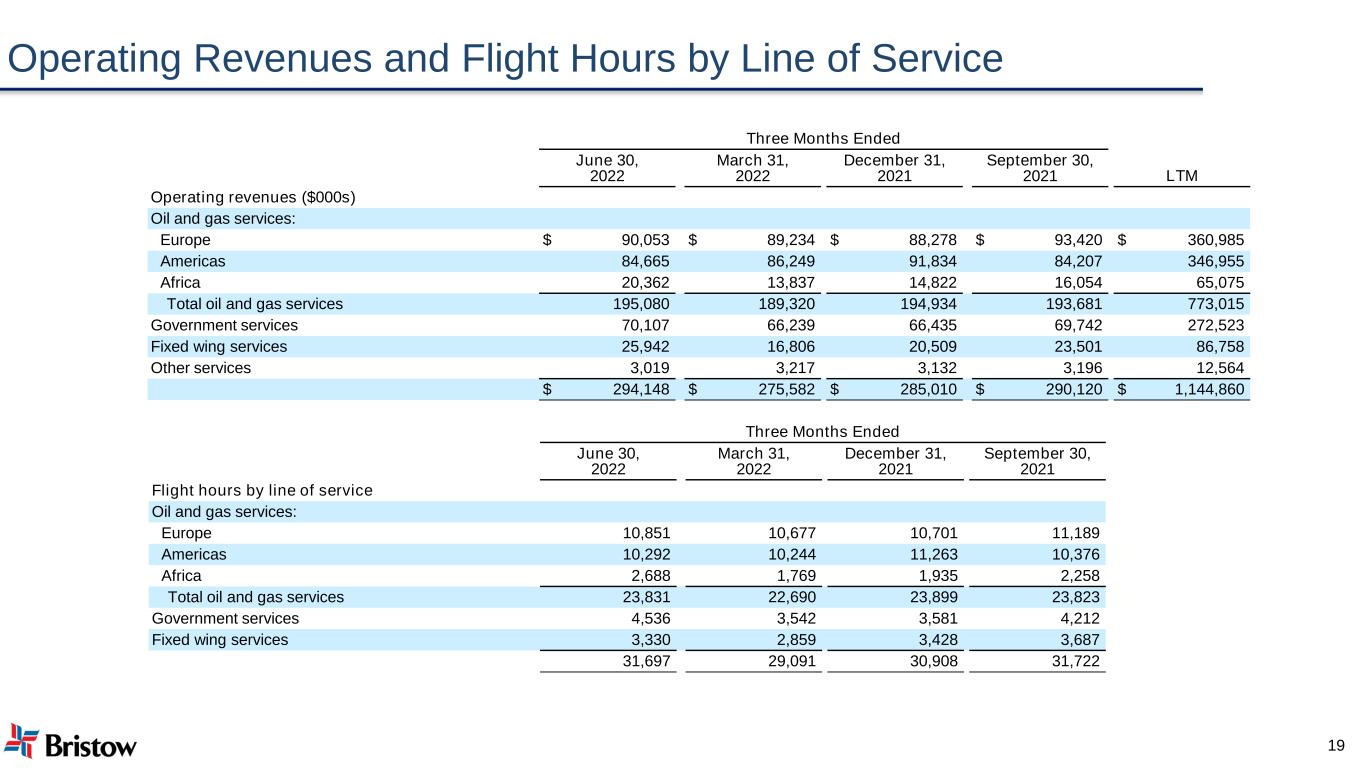
Operating Revenues and Flight Hours by Line of Service 19 Three Months Ended June 30, 2022 March 31, 2022 December 31, 2021 September 30, 2021 LTM Operating revenues ($000s) Oil and gas services: Europe $ 90,053 $ 89,234 $ 88,278 $ 93,420 $ 360,985 Americas 84,665 86,249 91,834 84,207 346,955 Africa 20,362 13,837 14,822 16,054 65,075 Total oil and gas services 195,080 189,320 194,934 193,681 773,015 Government services 70,107 66,239 66,435 69,742 272,523 Fixed wing services 25,942 16,806 20,509 23,501 86,758 Other services 3,019 3,217 3,132 3,196 12,564 $ 294,148 $ 275,582 $ 285,010 $ 290,120 $ 1,144,860 Three Months Ended June 30, 2022 March 31, 2022 December 31, 2021 September 30, 2021 Flight hours by line of service Oil and gas services: Europe 10,851 10,677 10,701 11,189 Americas 10,292 10,244 11,263 10,376 Africa 2,688 1,769 1,935 2,258 Total oil and gas services 23,831 22,690 23,899 23,823 Government services 4,536 3,542 3,581 4,212 Fixed wing services 3,330 2,859 3,428 3,687 31,697 29,091 30,908 31,722
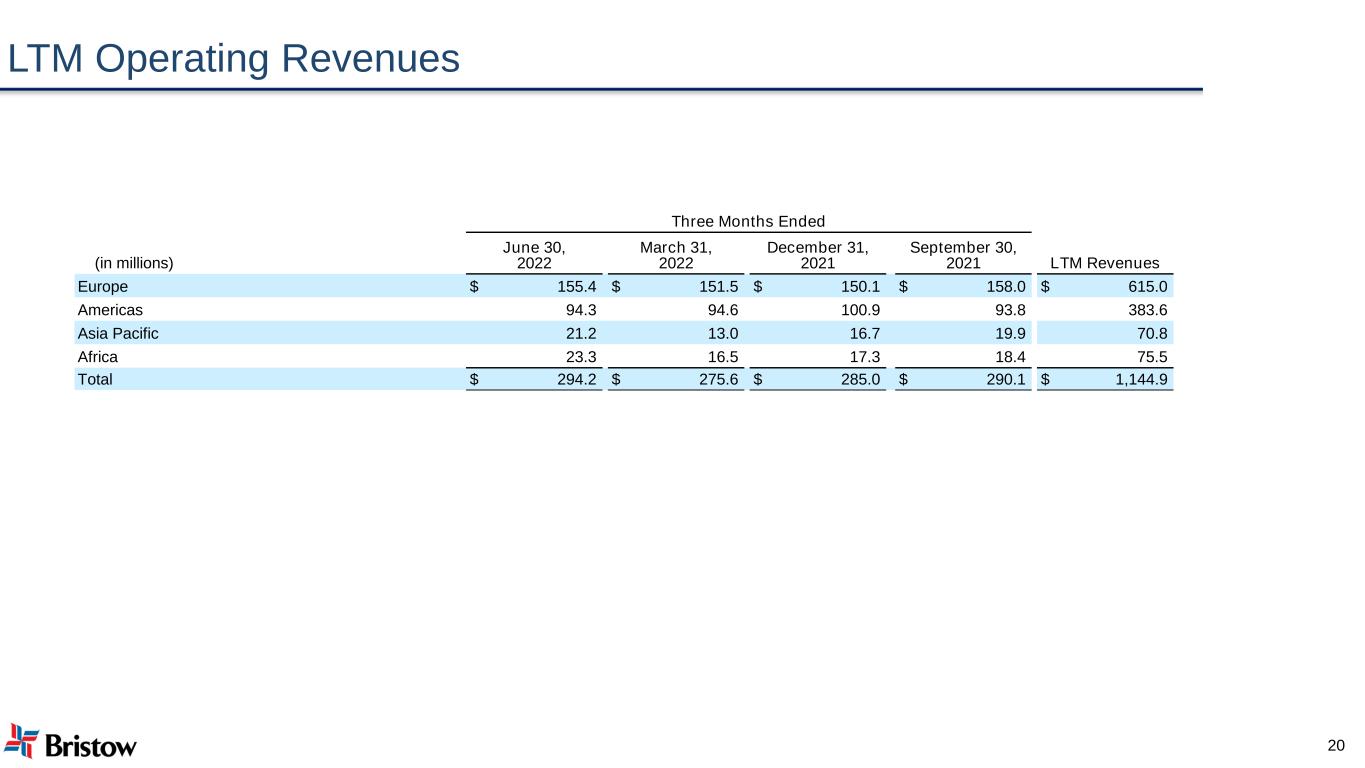
LTM Operating Revenues 20 Three Months Ended (in millions) June 30, 2022 March 31, 2022 December 31, 2021 September 30, 2021 LTM Revenues Europe $ 155.4 $ 151.5 $ 150.1 $ 158.0 $ 615.0 Americas 94.3 94.6 100.9 93.8 383.6 Asia Pacific 21.2 13.0 16.7 19.9 70.8 Africa 23.3 16.5 17.3 18.4 75.5 Total $ 294.2 $ 275.6 $ 285.0 $ 290.1 $ 1,144.9