
Bristow Group Inc 8-K, filed Feb 2, 2021
Bristow Group Inc. (VTOL)
8-K
2021-02-02
For: 2021-02-02
View Original
Added on
April 10, 2026
About this 8-K
Bristow Group Inc filed this 8-K on February 2, 2021.
Items reported
- Item 2.02: Financial results
- Item 7.01: Regulation FD disclosure
- Item 9.01: Financial statements and exhibits
UNITED STATES
SECURITIES AND EXCHANGE COMMISSION
WASHINGTON, DC 20549
FORM 8-K
CURRENT REPORT
Pursuant to Section 13 or 15(d) of the
Securities Exchange Act of 1934
Date of Report (Date of earliest event reported): February 2, 2021
| (Exact Name of Registrant as Specified in Its Charter) | ||
| (State or Other Jurisdiction of Incorporation) | (Commission File Number) | (IRS Employer Identification No.) | ||||||||||||
| (Address of Principal Executive Offices) | (Zip Code) | |||||||||||||
Registrant’s telephone number, including area code | |||||||||||
| None | ||||||||||||||
| (Former Name or Former Address, if Changed Since Last Report) | ||||||||||||||
Check the appropriate box below if the Form 8-K filing is intended to simultaneously satisfy the filing obligation of the registrant under any of the following provisions:
| Written communications pursuant to Rule 425 under the Securities Act (17 CFR 230.425) | |||||
| Soliciting material pursuant to Rule 14a-12 under the Exchange Act (17 CFR 240.14a-12) | |||||
| Pre-commencement communications pursuant to Rule 14d-2(b) under the Exchange Act (17 CFR 240.14d-2(b)) | |||||
| Pre-commencement communications pursuant to Rule 13e-4(c) under the Exchange Act (17 CFR 240.13e-4(c)) | |||||
Indicate by check mark whether the registrant is an emerging growth company as defined in Rule 405 of the Securities Act of 1933 (17 CFR §230.405) or Rule 12b-2 of the Securities Exchange Act of 1934 (17 CFR §240.12b-2). Emerging growth company ☐
If an emerging growth company, indicate by check mark if the registrant has elected not to use the extended transition period for complying with any new or revised financial accounting standards provided pursuant to Section 13(a) of the Exchange Act. ☐
Title of each class | Trading Symbol(s) | Name of each exchange on which registered | ||||||||||||
Item 2.02 Results of Operations and Financial Condition
On February 2, 2021, Bristow Group Inc. (“Bristow Group”) issued a press release setting forth its third quarter fiscal year 2021 financial results. A copy of the press release is attached hereto as Exhibit 99.1 and hereby incorporated by reference. The information furnished pursuant to Item 2.02, including Exhibit 99.1, shall not be deemed “filed” for purposes of Section 18 of the Securities Exchange Act of 1934, as amended (the “Exchange Act”), or otherwise subject to the liabilities of that Section, and shall not be incorporated by reference in any filing under the Securities Act of 1933, as amended (the “Securities Act”), or the Exchange Act, except as shall be expressly set forth by specific reference in such a filing.
Item 7.01 Regulation FD Disclosure
On February 3, 2021, Bristow Group will make a presentation about its third quarter fiscal year 2021 earnings as noted in the press release described in Item 2.02 above. A copy of the presentation slides are attached hereto as Exhibit 99.2. Additionally, Bristow Group has posted the presentation on its website at www.bristowgroup.com. The information furnished pursuant to Item 7.01, including Exhibit 99.2, shall not be deemed “filed” for purposes of Section 18 of the Exchange Act, or otherwise subject to the liabilities of that Section, and shall not be incorporated by reference in any filing under the Securities Act, or the Exchange Act, except as shall be expressly set forth by specific reference in such a filing.
Item 9.01 Financial Statements and Exhibits
| Exhibit No. | Description | ||||
| 99.1 | |||||
| 99.2 | |||||
| 104 | Cover Page Interactive Data File – the cover page XBRL tags are embedded within the Inline XBRL document. | ||||
SIGNATURES
Pursuant to the requirements of the Securities Exchange Act of 1934, the registrant has duly caused this report to be signed on its behalf by the undersigned hereunto duly authorized.
| Bristow Group Inc. | ||||||||||||||
| February 2, 2021 | By: | /s/ Jennifer D. Whalen | ||||||||||||
| Name: Jennifer D. Whalen | ||||||||||||||
| Title: Senior Vice President, Chief Financial Officer | ||||||||||||||
Exhibit Index
| Exhibit No. | Description | ||||
| 99.1 | |||||
| 99.2 | |||||
| 104 | Cover Page Interactive Data File – the cover page XBRL tags are embedded within the Inline XBRL document. | ||||
Exhibit 99.1
PRESS RELEASE
BRISTOW GROUP REPORTS
THIRD QUARTER FISCAL YEAR 2021 RESULTS
Houston, Texas
February 2, 2021
•Net loss of $57.1 million, or $1.97 per diluted share, in Q3 FY21 primarily due to a non-cash impairment charge
•EBITDA adjusted to exclude special items and gains or losses on asset dispositions was $47.4 million in Q3 FY21 compared to $54.2 million in Q2
•Adjusted Free Cash Flow excluding Net Capex was $26.8 million in Q3 FY21
•As of December 31, 2020, unrestricted cash balance was $293.5 million with total liquidity of $345.0 million
FOR IMMEDIATE RELEASE — Bristow Group Inc. (NYSE: VTOL) today reported net loss attributable to the Company of $57.1 million, or $1.97 per diluted share, for its fiscal third quarter ended December 31, 2020 (“current quarter”) on operating revenues of $300.3 million compared to net loss attributable to the Company of $27.9 million, or $0.95 per diluted share, for the quarter ended September 30, 2020 (“preceding quarter”) on operating revenues of $295.7 million. The primary driver of the net loss in the current quarter was the impairment of our investment in Cougar Helicopters Inc. (“Cougar”) in Canada.
Earnings before interest, taxes, depreciation and amortization (“EBITDA”) was $(12.7) million in the current quarter compared to $12.6 million in the preceding quarter. EBITDA adjusted to exclude special items and gains or losses on asset dispositions was $47.4 million in the current quarter compared to $54.2 million in the preceding quarter. The following table provides a bridge between EBITDA, Adjusted EBITDA and Adjusted EBITDA excluding gains or losses on asset dispositions. See Reconciliation of Non-GAAP Metrics for a reconciliation of net income, the most directly comparable GAAP measure, to EBITDA and Adjusted EBITDA.
| Three Months Ended, | ||||||||||||||||||||||||||
| September 30, 2020 | December 31, 2020 | |||||||||||||||||||||||||
| Successor | ||||||||||||||||||||||||||
| EBITDA | $ | 12,568 | $ | (12,679) | ||||||||||||||||||||||
| Special items: | ||||||||||||||||||||||||||
| Loss on impairment | 17,596 | 53,249 | ||||||||||||||||||||||||
| PBH intangible amortization | 5,644 | 5,641 | ||||||||||||||||||||||||
| Merger-related costs | 4,497 | 4,450 | ||||||||||||||||||||||||
| Organizational restructuring costs | 13,326 | 1,547 | ||||||||||||||||||||||||
| Loss on early extinguishment of debt | — | 229 | ||||||||||||||||||||||||
| Government grants | (2,201) | (1,075) | ||||||||||||||||||||||||
| Bankruptcy related costs | — | (1,984) | ||||||||||||||||||||||||
| Bargain purchase gain | (5,660) | — | ||||||||||||||||||||||||
| $ | 33,202 | $ | 62,057 | |||||||||||||||||||||||
| Adjusted EBITDA | $ | 45,770 | $ | 49,378 | ||||||||||||||||||||||
(Gains) losses on asset dispositions, net | 8,473 | (1,951) | ||||||||||||||||||||||||
| Adjusted EBITDA excluding asset dispositions | $ | 54,243 | $ | 47,427 | ||||||||||||||||||||||
“The Company continues to make significant integration progress following the merger of Era and Bristow in June 2020,” said Chris Bradshaw, President and Chief Executive Officer of Bristow. “We are pleased to announce a further increase in the amount of identified synergies to at least $50 million of annualized cost savings, of which projects representing $27 million of annualized synergies have already been completed.”
1
Sequential Quarter Results
Operating revenues were $4.6 million higher in the current quarter compared to the preceding quarter.
Operating revenues from oil and gas operations were $1.5 million higher than the preceding quarter. Higher utilization in the Americas, Africa and Asia Pacific regions was partially offset by lower utilization in the Europe Caspian region. Operating revenues from U.K. SAR services were $0.5 million lower in the current quarter primarily due to fewer flight hours, partially offset by the strengthening of the British pound sterling (“GBP”) relative to the U.S. dollar. Operating revenues from fixed wing services were $0.3 million lower in the current quarter primarily due to decreased activity, partially offset by the strengthening of the Australian dollar relative to the U.S. dollar. Operating revenues from other services were $3.8 million higher primarily due to increased part sales.
Operating expenses were $3.7 million lower in the current quarter. Lower personnel costs, due to the recognition of severance expense in the preceding quarter related to the merger of Era Group Inc. and Bristow Group Inc. (the “Merger”), were partially offset by higher maintenance costs.
General and administrative expenses were $1.3 million lower in the current quarter primarily due to decreased professional services fees.
During the current quarter, the Company recognized a loss on impairment of $51.9 million related to its investment in Cougar and a loss on impairment of $1.4 million related to helicopters held for sale. During the preceding quarter, the Company recognized a loss on impairment of $12.4 million related to the write down of inventory and a loss on impairment of $5.2 million related to helicopters that were transferred to held for sale assets.
During the current quarter, the Company sold five S-76C++ medium, two B412 medium, seven B407 single engine helicopters, and one H225 simulator for cash proceeds of $14.4 million resulting in gains of $2.0 million. During the preceding quarter, the Company sold ten H225 heavy, nine S-76C++ medium and twelve B407 single engine helicopters for cash proceeds of $40.5 million resulting in losses of $8.5 million.
During the current quarter, the Company recognized earnings of $0.9 million from equity investments compared to $1.9 million in the preceding quarter due to higher earnings from Cougar in the preceding quarter.
During the current quarter, the Company recognized a reorganization item gain of $2.0 million related to the Company’s non-qualified deferred compensation plan for the Company’s former senior executives.
During the preceding quarter, the Company recognized a bargain purchase gain of $5.7 million related to the Merger.
Other income, net of $5.6 million in the current quarter was primarily due to other income related to Airnorth (government grants) of $3.4 million, a favorable interest adjustment to the Company’s pension liability of $1.1 million and net foreign exchange gains of $0.9 million. Other income, net of $10.6 million in the preceding quarter was primarily due to net foreign exchange gains of $6.9 million, other income related to Airnorth (government grants) of $2.7 million and a favorable interest adjustment to the Company’s pension liability of $0.9 million.
Income tax expense was $13.4 million in the current quarter and $8.6 million in the preceding quarter. The expense in the current quarter was primarily due to nondeductible expenses related to impairment and the Merger, variability of earnings in different jurisdictions and the impact of valuation allowances.
Calendar Quarter Results
Operating revenues were $5.3 million higher in the current quarter compared to the three months ended December 31, 2019 (the “prior year quarter”).
Operating revenues from oil and gas operations were $2.9 million higher in the current quarter. Operating revenues in the Americas were $36.3 million higher primarily due to the impact of the Merger. Operating revenues in the Asia Pacific and Africa regions were $0.5 million and $16.2 million lower, respectively, primarily due to lower utilization. Operating revenues in the Europe Caspian region were $16.7 million lower primarily due to lower utilization, partially offset by the strengthening of the GBP relative to the U.S. dollar.
Operating revenues from U.K. SAR services were $1.8 million higher in the current quarter primarily due to the strengthening of the GBP relative to the U.S. dollar and an increase in flight hours.
2
Operating revenues from fixed wing services were $5.7 million lower in the current quarter primarily due to lower utilization.
Operating revenues from other services were $6.2 million higher due to higher part sales and the benefit of the Merger.
Operating expenses were $10.4 million lower in the current quarter. Maintenance costs were $5.4 million lower primarily due to lower activity in the current quarter and betterment-detriment expenses incurred in the prior year quarter, partially offset by the impact of the Merger. Lease costs were $2.7 million lower primarily due to fewer aircraft on lease. Fuel, training and other costs decreased $5.3 million, $1.9 million and $2.0 million, respectively, primarily due to lower activity. These decreases were partially offset by an increase in insurance costs of $3.9 million primarily due to higher premiums and the impact of the Merger and an increase in personnel costs of $3.1 million primarily due to the impact of the Merger.
General and administrative expenses were $3.4 million lower in the current quarter primarily due to decreased professional services fees.
Merger-related costs of $4.5 million in the current quarter primarily consist of professional services fees and severance costs related to the Merger.
Depreciation and amortization expenses were $2.2 million lower in the current quarter primarily due to fewer helicopters and the revaluation of assets in connection with the adoption of fresh-start accounting.
During the current quarter, the Company recognized a loss on impairment of $51.9 million related to its investment in Cougar and a loss on impairment of $1.4 million related to helicopters held for sale.
During the current quarter, the Company sold five S-76C++ medium, two B412 medium, seven B407 single engine helicopters, and one H225 simulator for cash proceeds of $14.4 million resulting in gains of $2.0 million.
During the current quarter, the Company recognized earnings of $0.9 million from its equity investments compared to $5.1 million in the prior year quarter. The prior year quarter included earnings from Líder Táxi Aéreo S.A. (“Líder”), which the Company has subsequently initiated a partial dissolution process to exit its equity investment, and from Cougar, which was impaired during the current quarter.
Interest expense was $75.7 million lower in the current quarter. During the prior year quarter, the Company incurred a $56.9 million expense related to Chapter 11 of Title 11 of the U.S. Code (“Chapter 11”) activities. Excluding this, interest expense was lower in the current quarter due to lower debt balances.
During the current quarter, the Company recognized a reorganization item gain of $2.0 million related to the Company’s non-qualified deferred compensation plan for the Company’s former senior executives. Reorganization items incurred in the prior year quarter related to Chapter 11.
Other income, net of $5.6 million in the current quarter was primarily due to other income related to Airnorth (government grants) of $3.4 million, a favorable interest adjustment to the Company’s pension liability of $1.1 million and net foreign exchange gains of $0.9 million. Other income, net of $10.7 million in the prior year quarter was primarily due to net foreign exchange gains of $10.6 million and a favorable interest adjustment to the Company’s pension liability of $0.1 million.
Income tax expense was $13.4 million in the current quarter compared to a benefit of $2.3 million in the prior year quarter. The expense in the current quarter was primarily due to nondeductible expenses related to impairment and the Merger, variability of earnings in different jurisdictions and the impact of valuation allowances.
Liquidity and Capital Allocation
As of December 31, 2020, the Company had $293.5 million of unrestricted cash and $51.5 million of remaining availability under its amended asset-based revolving credit facility (the “ABL Facility”) for total liquidity of $345.0 million. Borrowings under the amended ABL Facility are subject to certain conditions and requirements.
During the current quarter, the Company repurchased 102,925 shares of common stock in open market transactions for gross consideration of $2.4 million, which is an average purchase price per share of $23.49. During the preceding quarter, the Company repurchased 345,327 shares for gross consideration of $7.6 million, representing an average purchase price of $21.93 per share.
During the current quarter, the Company repurchased $12.1 million face value of the 7.750% Senior Notes at 97.5% for total cash of $12.2 million, including accrued interest of $0.4 million, and recognized a loss on debt
3
extinguishment of $0.2 million. The Company also made final payments of $12.7 million and $4.0 million, inclusive of interest, upon maturity of two promissory notes.
In the current quarter, cash proceeds from dispositions of property and equipment were $14.4 million and purchases of property and equipment were $3.9 million, resulting in net (proceeds from)/purchases of property and equipment (“Net Capex”) of $(10.5) million. In the preceding quarter, cash proceeds from dispositions of property and equipment were $40.5 million and purchases of property and equipment were $4.5 million, resulting in Net Capex of $(36.0) million. See Adjusted Free Cash Flow Reconciliation for a reconciliation of Net Capex and Adjusted Free Cash Flow.
Conference Call
Management will conduct a conference call starting at 10:00 a.m. ET (9:00 a.m. CT) on Wednesday, February 3, 2021, to review the results for the fiscal third quarter ended December 31, 2020. The conference call can be accessed as follows:
All callers will need to reference the access code 6114092
.
Within the U.S.: Operator Assisted Toll-Free Dial-In Number: (800) 458-4121
Outside the U.S.: Operator Assisted International Dial-In Number: (323) 794-2597
Replay
A telephone replay will be available through February 17, 2021 by dialing 888-203-1112 and utilizing the access code above. An audio replay will also be available on the Company’s website at www.bristowgroup.com shortly after the call and will be accessible through February 17, 2021. The accompanying investor presentation will be available on February 3, 2021 on Bristow’s website at www.bristowgroup.com.
For additional information concerning Bristow, contact Grant Newman at (713) 369-4692 or visit Bristow Group’s website at https://ir.bristowgroup.com/.
About Bristow Group
Bristow Group Inc. is the leading global provider of vertical flight solutions. Bristow primarily provides aviation services to a broad base of major integrated, national and independent offshore energy companies. Bristow provides commercial search and rescue (“SAR”) services in several countries and public sector SAR services in the United Kingdom (“U.K.”) on behalf of the Maritime & Coastguard Agency (“MCA”). Additionally, the Company also offers ad hoc helicopter and fixed wing transportation services.
Bristow currently has customers in Australia, Brazil, Canada, Chile, Colombia, Guyana, India, Mexico, Nigeria, Norway, Spain, Suriname, Trinidad, the U.K. and the U.S.
Forward-Looking Statements Disclosure
This press release contains “forward-looking statements.” Forward-looking statements give Bristow Group Inc.’s (the “Company”) current expectations or forecasts of future events. Forward-looking statements generally can be identified by the use of forward-looking terminology such as “may,” “will,” “expect,” “intend,” “estimate,” “anticipate,” “believe,” “project,” or “continue,” or other similar words. These statements are made under the safe harbor provisions of the Private Securities Litigation Reform Act of 1995, reflect management’s current views with respect to future events and therefore are subject to significant risks and uncertainties, both known and unknown. The Company’s actual results may vary materially from those anticipated in forward-looking statements. The Company cautions investors not to place undue reliance on any forward-looking statements.
Forward-looking statements speak only as of the date of the document in which they are made. The Company disclaims any obligation or undertaking to provide any updates or revisions to any forward-looking statement to reflect any change in the Company’s expectations or any change in events, conditions or circumstances on which the forward-looking statement is based that occur after the date hereof. Risks that may affect forward-looking statements include, but are not necessarily limited to, those relating to: the COVID-19 pandemic and related economic repercussions have resulted, and may continue to result, in a decrease in the price of and demand for oil, which has caused, and may continue to cause, a decrease in the demand for our services; expected cost synergies and other benefits of the merger (the “Merger”) of the entity formerly known as Bristow Group Inc. (“Old Bristow”)
4
and Era Group Inc.(“Era”) might not be realized within the expected time frames, might be less than projected or may not be realized at all; the ability to successfully integrate the operations, accounting and administrative functions of Era and Old Bristow; managing a significantly larger company than before the completion of the Merger; diversion of management time on issues related to integration of the companies; the increase in indebtedness as a result of the Merger; operating costs, customer loss and business disruption following the Merger, including, without limitation, difficulties in maintaining relationships with employees and customers, may be greater than expected; our reliance on a limited number of customers and the reduction of our customer base as a result of bankruptcies or consolidation; the possibility that we may be unable to maintain compliance with covenants in our financing agreements; fluctuations in worldwide prices of and demand for oil and natural gas; fluctuations in levels of oil and natural gas exploration, development and production activities; fluctuations in the demand for our services; the possibility that we may impair our long-lived assets, including goodwill, inventory, property and equipment and investments in unconsolidated affiliates; our ability to implement operational improvement efficiencies with the objective of rightsizing our global footprint and further reducing our cost structure; the possibility of significant changes in foreign exchange rates and controls, including as a result of the U.K. having exited from the European Union (“E.U.”) (“Brexit”); the impact of continued uncertainty surrounding the affects Brexit will have on the British, EU and global economies and demand for oil and natural gas; potential effects of increased competition; the inability to remediate the material weaknesses identified in internal controls over financial reporting relating to our monitoring control processes; the possibility that we may be unable to re-deploy our aircraft to regions with greater demand; the possibility of changes in tax and other laws and regulations and policies, including, without limitation, action of the Biden Administration that impact oil and gas operations or favor renewable energy projects in the U.S.; the possibility that we may be unable to dispose of older aircraft through sales into the aftermarket; general economic conditions, including the capital and credit markets; the possibility that segments of our fleet may be grounded for extended periods of time or indefinitely; the existence of operating risks inherent in our business, including the possibility of declining safety performance; the possibility of political instability, war or acts of terrorism in any of the countries where we operate; the possibility that reductions in spending on aviation services by governmental agencies could lead to modifications of our search and rescue (“SAR”) contract terms with the UK government, our contracts with the Bureau of Safety and Environmental Enforcement ("BSEE") or delays in receiving payments under such contracts; and our reliance on a limited number of helicopter manufacturers and suppliers. You should not place undue reliance on our forward-looking statements because the matters they describe are subject to known and unknown risks, uncertainties and other unpredictable factors, many of which are beyond our control. Our forward-looking statements are based on the information currently available to us and speak only as of the date hereof. New risks and uncertainties arise from time to time, and it is impossible for us to predict these matters or how they may affect us. We have included important factors in the section entitled “Risk Factors” in the Company’s joint proxy and consent solicitation statement/prospectus (File No. 333-237557), filed with the United States Securities and Exchange Commission (the “SEC”) on May 5, 2020 and the Company’s Quarterly Report on Form 10-Q for the Quarter ended December 31, 2020, which we believe over time, could cause our actual results, performance or achievements to differ from the anticipated results, performance or achievements that are expressed or implied by our forward-looking statements. You should consider all risks and uncertainties disclosed in the Proxy Statement and in our filings with the SEC, all of which are accessible on the SEC’s website at www.sec.gov.
5
BRISTOW GROUP INC. CONDENSED CONSOLIDATED STATEMENTS OF OPERATIONS (unaudited, in thousands, except share and per share amounts) | |||||||||||||||||
| Three Months Ended September 30, 2020 | Three Months Ended December 31, 2020 | Favorable/ (Unfavorable) | |||||||||||||||
| Successor | |||||||||||||||||
| Revenue: | |||||||||||||||||
| Operating revenue | $ | 295,722 | $ | 300,275 | $ | 4,553 | |||||||||||
| Reimbursable revenue | 8,918 | 9,622 | 704 | ||||||||||||||
| Total revenues | 304,640 | 309,897 | 5,257 | ||||||||||||||
| Costs and expenses: | |||||||||||||||||
| Operating expense | 231,953 | 228,246 | 3,707 | ||||||||||||||
| Reimbursable expense | 8,919 | 9,525 | (606) | ||||||||||||||
| General and administrative | 39,268 | 37,931 | 1,337 | ||||||||||||||
| Merger-related costs | 4,497 | 4,450 | 47 | ||||||||||||||
| Depreciation and amortization | 18,537 | 17,931 | 606 | ||||||||||||||
| Total costs and expenses | 303,174 | 298,083 | 5,091 | ||||||||||||||
| Loss on impairment | (17,596) | (53,249) | (35,653) | ||||||||||||||
| Gain (loss) on asset dispositions | (8,473) | 1,951 | 10,424 | ||||||||||||||
| Earnings from unconsolidated affiliates, net | 1,948 | 896 | (1,052) | ||||||||||||||
| Operating loss | (22,655) | (38,588) | (15,933) | ||||||||||||||
| Interest income | 434 | 359 | (75) | ||||||||||||||
| Interest expense | (13,445) | (13,203) | 242 | ||||||||||||||
| Reorganization items, net | — | 1,984 | 1,984 | ||||||||||||||
| Bargain purchase gain | 5,660 | — | (5,660) | ||||||||||||||
| Other, net | 10,592 | 5,635 | (4,957) | ||||||||||||||
| Total other income (expense) | 3,241 | (5,225) | (8,466) | ||||||||||||||
| Loss before income taxes | (19,414) | (43,813) | (24,399) | ||||||||||||||
| Provision for income taxes | (8,578) | (13,447) | (4,869) | ||||||||||||||
| Net loss | (27,992) | (57,260) | (29,268) | ||||||||||||||
| Net loss attributable to noncontrolling interests | 131 | 139 | 8 | ||||||||||||||
| Net loss attributable to Bristow Group Inc. | $ | (27,861) | $ | (57,121) | $ | (29,260) | |||||||||||
| Basic loss per common share | $ | (0.95) | $ | (1.97) | |||||||||||||
| Diluted loss per common share | $ | (0.95) | $ | (1.97) | |||||||||||||
| Weighted average common shares outstanding, basic | 29,357,959 | 28,944,908 | |||||||||||||||
| Weighted average common shares outstanding, diluted | 29,357,959 | 28,944,908 | |||||||||||||||
| EBITDA | $ | 12,568 | $ | (12,679) | |||||||||||||
| Adjusted EBITDA | $ | 45,770 | $ | 49,378 | |||||||||||||
| Adjusted EBITDA excluding asset dispositions | $ | 54,243 | $ | 47,427 | |||||||||||||
6
BRISTOW GROUP INC. CONDENSED CONSOLIDATED STATEMENTS OF OPERATIONS (unaudited, in thousands, except share and per share amounts) | ||||||||||||||||||||||||||||||||
| Three Months Ended December 31, 2019 | ||||||||||||||||||||||||||||||||
| One Month Ended October 31, 2019 | Two Months Ended December 31, 2019 | Three Months Ended December 31, 2019 | Three Months Ended December 31, 2020 | |||||||||||||||||||||||||||||
| Predecessor | Successor | Combined | Successor | |||||||||||||||||||||||||||||
| Revenue: | ||||||||||||||||||||||||||||||||
| Operating revenue | $ | 101,659 | $ | 193,322 | $ | 294,981 | $ | 300,275 | ||||||||||||||||||||||||
| Reimbursable revenue | 4,168 | 7,602 | 11,770 | 9,622 | ||||||||||||||||||||||||||||
| Total revenues | 105,827 | 200,924 | 306,751 | 309,897 | ||||||||||||||||||||||||||||
| Costs and expenses: | ||||||||||||||||||||||||||||||||
| Operating expense | 79,802 | 158,845 | 238,647 | 228,246 | ||||||||||||||||||||||||||||
| Reimbursable expense | 4,049 | 7,707 | 11,756 | 9,525 | ||||||||||||||||||||||||||||
| General and administrative | 15,965 | 25,358 | 41,323 | 37,931 | ||||||||||||||||||||||||||||
| Merger-related costs | — | 318 | 318 | 4,450 | ||||||||||||||||||||||||||||
| Depreciation and amortization | 8,222 | 11,926 | 20,148 | 17,931 | ||||||||||||||||||||||||||||
| Total costs and expenses | 108,038 | 204,154 | 312,192 | 298,083 | ||||||||||||||||||||||||||||
| Loss on impairment | — | — | — | (53,249) | ||||||||||||||||||||||||||||
| Gain (loss) on asset dispositions | 249 | (154) | 95 | 1,951 | ||||||||||||||||||||||||||||
| Earnings from unconsolidated affiliates, net | 3,609 | 1,499 | 5,108 | 896 | ||||||||||||||||||||||||||||
| Operating income (loss) | 1,647 | (1,885) | (238) | (38,588) | ||||||||||||||||||||||||||||
| Interest income | 165 | 202 | 367 | 359 | ||||||||||||||||||||||||||||
| Interest expense | (79,235) | (9,674) | (88,909) | (13,203) | ||||||||||||||||||||||||||||
| Reorganization items, net | (447,674) | — | (447,674) | 1,984 | ||||||||||||||||||||||||||||
| Change in fair value of preferred stock derivative liability | — | (133,315) | (133,315) | — | ||||||||||||||||||||||||||||
| Other, net | 7,009 | 3,729 | 10,738 | 5,635 | ||||||||||||||||||||||||||||
| Total other income (expense) | (519,735) | (139,058) | (658,793) | (5,225) | ||||||||||||||||||||||||||||
| Loss before income taxes | (518,088) | (140,943) | (659,031) | (43,813) | ||||||||||||||||||||||||||||
| Benefit (provision) for income taxes | 13,889 | (11,600) | 2,289 | (13,447) | ||||||||||||||||||||||||||||
| Net loss | (504,199) | (152,543) | (656,742) | (57,260) | ||||||||||||||||||||||||||||
| Net income attributable to noncontrolling interests | 5 | 31 | 36 | 139 | ||||||||||||||||||||||||||||
| Net loss attributable to Bristow Group Inc. | $ | (504,194) | $ | (152,512) | $ | (656,706) | $ | (57,121) | ||||||||||||||||||||||||
| Basic loss per common share | $ | (14.04) | $ | (14.49) | N/A(1) | $ | (1.97) | |||||||||||||||||||||||||
| Diluted loss per common share | $ | (14.04) | $ | (14.49) | N/A(1) | $ | (1.97) | |||||||||||||||||||||||||
| Weighted average common shares outstanding, basic | 35,918,916 | 11,235,535 | N/A(1) | 28,944,908 | ||||||||||||||||||||||||||||
| Weighted average common shares outstanding, diluted | 35,918,916 | 11,235,535 | N/A(1) | 28,944,908 | ||||||||||||||||||||||||||||
| EBITDA | $ | (430,631) | $ | (119,343) | $ | (549,974) | $ | (12,679) | ||||||||||||||||||||||||
| Adjusted EBITDA | $ | 17,431 | $ | 24,337 | $ | 41,768 | $ | 49,378 | ||||||||||||||||||||||||
| Adjusted EBITDA excluding asset dispositions | $ | 17,182 | $ | 24,491 | $ | 41,673 | $ | 47,427 | ||||||||||||||||||||||||
___________________________
(1) Weighted average common shares outstanding and loss per common share unavailable for “Combined” period due to the emergence from Chapter 11 Cases during this period.
7
BRISTOW GROUP INC. REVENUES BY LINE OF SERVICE (unaudited, in thousands) | |||||||||||||||||||||||||||||||||||
| Three Months Ended December 31, 2019 | |||||||||||||||||||||||||||||||||||
| One Month Ended October 31, 2019 | Two Months Ended December 31, 2019 | Three Months Ended December 31, 2019 | Three Months Ended September 30, 2020 | Three Months Ended December 31, 2020 | |||||||||||||||||||||||||||||||
| Predecessor | Successor | Combined | Successor | ||||||||||||||||||||||||||||||||
| Oil and gas: | |||||||||||||||||||||||||||||||||||
| Europe Caspian | $ | 38,200 | $ | 71,888 | $ | 110,088 | $ | 98,495 | $ | 93,383 | |||||||||||||||||||||||||
| Americas | 21,416 | 39,758 | 61,174 | 93,102 | 97,435 | ||||||||||||||||||||||||||||||
| Africa | 12,924 | 26,286 | 39,210 | 21,237 | 23,055 | ||||||||||||||||||||||||||||||
| Asia Pacific | 1,745 | 2,090 | 3,835 | 2,920 | 3,383 | ||||||||||||||||||||||||||||||
| Total oil and gas | 74,285 | 140,022 | 214,307 | 215,754 | 217,256 | ||||||||||||||||||||||||||||||
| UK SAR Services | 17,858 | 36,822 | 54,680 | 56,978 | 56,470 | ||||||||||||||||||||||||||||||
| Fixed Wing Services | 9,397 | 16,333 | 25,730 | 20,310 | 20,054 | ||||||||||||||||||||||||||||||
| Other | 119 | 145 | 264 | 2,680 | 6,495 | ||||||||||||||||||||||||||||||
| $ | 101,659 | $ | 193,322 | $ | 294,981 | $ | 295,722 | $ | 300,275 | ||||||||||||||||||||||||||
FLIGHT HOURS BY LINE OF SERVICE (unaudited) | |||||||||||||||||||||||||||||||||||
| Three Months Ended December 31, 2019 | |||||||||||||||||||||||||||||||||||
| One Month Ended October 31, 2019 | Two Months Ended December 31, 2019 | Three Months Ended December 31, 2019 | Three Months Ended September 30, 2020 | Three Months Ended December 31, 2020 | |||||||||||||||||||||||||||||||
| Predecessor | Successor | Combined | Successor | ||||||||||||||||||||||||||||||||
| Oil and gas: | |||||||||||||||||||||||||||||||||||
| Europe Caspian | 5,146 | 9,215 | 14,361 | 12,330 | 11,956 | ||||||||||||||||||||||||||||||
| Americas | 3,119 | 5,296 | 8,415 | 10,891 | 10,990 | ||||||||||||||||||||||||||||||
| Africa | 1,398 | 2,770 | 4,168 | 1,743 | 2,353 | ||||||||||||||||||||||||||||||
| Asia Pacific | 83 | 141 | 224 | 62 | 241 | ||||||||||||||||||||||||||||||
| Total oil and gas | 9,746 | 17,422 | 27,168 | 25,026 | 25,540 | ||||||||||||||||||||||||||||||
| UK SAR Services | 779 | 1,530 | 2,309 | 2,797 | 2,321 | ||||||||||||||||||||||||||||||
| Fixed Wing Services | 1,187 | 2,147 | 3,334 | 3,391 | 3,494 | ||||||||||||||||||||||||||||||
| 11,712 | 21,099 | 32,811 | 31,214 | 31,355 | |||||||||||||||||||||||||||||||
8
BRISTOW GROUP INC. CONDENSED CONSOLIDATED BALANCE SHEETS (in thousands) | ||||||||||||||||||||
| Successor | ||||||||||||||||||||
| December 31, 2020 | March 31, 2020 | |||||||||||||||||||
| ASSETS | (unaudited) | |||||||||||||||||||
| Current assets: | ||||||||||||||||||||
| Cash and cash equivalents | $ | 297,833 | $ | 199,121 | ||||||||||||||||
| Accounts receivable | 231,587 | 180,683 | ||||||||||||||||||
| Inventories | 97,422 | 82,419 | ||||||||||||||||||
| Assets held for sale | 17,531 | 32,401 | ||||||||||||||||||
| Prepaid expenses and other current assets | 31,516 | 29,527 | ||||||||||||||||||
| Total current assets | 675,889 | 524,151 | ||||||||||||||||||
| Investment in unconsolidated affiliates | 38,368 | 110,058 | ||||||||||||||||||
| Property and equipment | 1,099,878 | 901,314 | ||||||||||||||||||
| Accumulated depreciation | (71,249) | (24,560) | ||||||||||||||||||
| Net property and equipment | 1,028,629 | 876,754 | ||||||||||||||||||
Right-of-use assets | 266,651 | 305,962 | ||||||||||||||||||
| Other assets | 126,245 | 128,336 | ||||||||||||||||||
| Total assets | $ | 2,135,782 | $ | 1,945,261 | ||||||||||||||||
| LIABILITIES, REDEEMABLE NONCONTROLLING INTEREST AND STOCKHOLDERS’ EQUITY | ||||||||||||||||||||
| Current liabilities: | ||||||||||||||||||||
| Accounts payable | $ | 63,161 | $ | 52,110 | ||||||||||||||||
| Accrued liabilities | 214,661 | 200,129 | ||||||||||||||||||
| Short-term borrowings and current maturities of long-term debt | 48,069 | 45,739 | ||||||||||||||||||
| Total current liabilities | 325,891 | 297,978 | ||||||||||||||||||
| Long-term debt, less current maturities | 568,368 | 515,385 | ||||||||||||||||||
| Preferred stock embedded derivative | — | 286,182 | ||||||||||||||||||
| Deferred taxes | 65,355 | 22,775 | ||||||||||||||||||
| Long-term operating lease liabilities | 183,994 | 224,595 | ||||||||||||||||||
| Deferred credits and other liabilities | 11,670 | 22,345 | ||||||||||||||||||
| Total liabilities | 1,155,278 | 1,369,260 | ||||||||||||||||||
| Redeemable noncontrolling interests | 1,453 | — | ||||||||||||||||||
| Mezzanine equity | — | 149,785 | ||||||||||||||||||
| Stockholders’ investment | ||||||||||||||||||||
| Common stock | 303 | 1 | ||||||||||||||||||
| Additional paid-in capital | 685,575 | 295,897 | ||||||||||||||||||
| Retained earnings | 269,600 | 139,228 | ||||||||||||||||||
| Treasury shares, at cost | (10,007) | — | ||||||||||||||||||
Accumulated other comprehensive income | 34,153 | (8,641) | ||||||||||||||||||
| Total Bristow Group Inc. stockholders’ investment | 979,624 | 426,485 | ||||||||||||||||||
Noncontrolling interests | (573) | (269) | ||||||||||||||||||
Total stockholders’ investment | 979,051 | 426,216 | ||||||||||||||||||
Total liabilities, mezzanine equity and stockholders’ investment | $ | 2,135,782 | $ | 1,945,261 | ||||||||||||||||
9
Reconciliation of Non-GAAP Metrics
The Company’s management uses EBITDA and Adjusted EBITDA to assess the performance and operating results of its business. EBITDA is defined as Earnings before Interest expense, Taxes, Depreciation and Amortization. Adjusted EBITDA is defined as EBITDA further adjusted for certain special items that occurred during the reported period, as noted below. The Company includes EBITDA and Adjusted EBITDA to provide investors with a supplemental measure of its operating performance. Neither EBITDA nor Adjusted EBITDA is a recognized term under generally accepted accounting principles in the U.S. (“GAAP”). Accordingly, they should not be used as an indicator of, or an alternative to, net income as a measure of operating performance. In addition, EBITDA and Adjusted EBITDA are not intended to be measures of free cash flow available for management’s discretionary use, as they do not consider certain cash requirements, such as debt service requirements. Because the definitions of EBITDA and Adjusted EBITDA (or similar measures) may vary among companies and industries, they may not be comparable to other similarly titled measures used by other companies.
The following tables provide a reconciliation of net income, the most directly comparable GAAP measure, to EBITDA and Adjusted EBITDA (in thousands).
Sequential Quarter Results
| Three Months Ended September 30, 2020 | Three Months Ended December 31, 2020 | ||||||||||||||||||||||||||||||||||
| Successor | |||||||||||||||||||||||||||||||||||
| Net loss | $ | (27,992) | $ | (57,260) | |||||||||||||||||||||||||||||||
| Depreciation and amortization | 18,537 | 17,931 | |||||||||||||||||||||||||||||||||
| Interest expense | 13,445 | 13,203 | |||||||||||||||||||||||||||||||||
| Income tax (benefit) expense | 8,578 | 13,447 | |||||||||||||||||||||||||||||||||
| EBITDA | $ | 12,568 | $ | (12,679) | |||||||||||||||||||||||||||||||
Special items (1) | 33,202 | 62,057 | |||||||||||||||||||||||||||||||||
| Adjusted EBITDA | $ | 45,770 | $ | 49,378 | |||||||||||||||||||||||||||||||
(Gains) losses on asset dispositions, net | 8,473 | (1,951) | |||||||||||||||||||||||||||||||||
| Adjusted EBITDA excluding asset dispositions | $ | 54,243 | $ | 47,427 | |||||||||||||||||||||||||||||||
(1) Special items include the following:
| Three Months Ended September 30, 2020 | Three Months Ended December 31, 2020 | ||||||||||||||||||||||||||||||||||
| Successor | |||||||||||||||||||||||||||||||||||
| Loss on impairment | $ | 17,596 | $ | 53,249 | |||||||||||||||||||||||||||||||
| PBH intangible amortization | 5,644 | 5,641 | |||||||||||||||||||||||||||||||||
| Merger-related costs | 4,497 | 4,450 | |||||||||||||||||||||||||||||||||
| Organizational restructuring costs | 13,326 | 1,547 | |||||||||||||||||||||||||||||||||
| Loss on early extinguishment of debt | — | 229 | |||||||||||||||||||||||||||||||||
Government grants(2) | (2,201) | (1,075) | |||||||||||||||||||||||||||||||||
| Bankruptcy related costs | — | (1,984) | |||||||||||||||||||||||||||||||||
| Bargain purchase gain | (5,660) | — | |||||||||||||||||||||||||||||||||
| $ | 33,202 | $ | 62,057 | ||||||||||||||||||||||||||||||||
___________________________
(2) COVID-19 related government relief grants
10
Calendar Quarter Results
| Three Months Ended December 31, 2019 | ||||||||||||||||||||||||||||||||||||||
| One Month Ended October 31, 2019 | Two Months Ended December 31, 2019 | Three Months Ended December 31, 2019 | Three Months Ended December 31, 2020 | |||||||||||||||||||||||||||||||||||
| Predecessor | Successor | Combined | Successor | |||||||||||||||||||||||||||||||||||
| Net loss | $ | (504,199) | $ | (152,543) | $ | (656,742) | $ | (57,260) | ||||||||||||||||||||||||||||||
| Depreciation and amortization | 8,222 | 11,926 | 20,148 | 17,931 | ||||||||||||||||||||||||||||||||||
| Interest expense | 79,235 | 9,674 | 88,909 | 13,203 | ||||||||||||||||||||||||||||||||||
| Income tax (benefit) expense | (13,889) | 11,600 | (2,289) | 13,447 | ||||||||||||||||||||||||||||||||||
| EBITDA | $ | (430,631) | $ | (119,343) | $ | (549,974) | $ | (12,679) | ||||||||||||||||||||||||||||||
Special items (1) | 448,062 | 143,680 | 591,742 | 62,057 | ||||||||||||||||||||||||||||||||||
| Adjusted EBITDA | $ | 17,431 | $ | 24,337 | $ | 41,768 | $ | 49,378 | ||||||||||||||||||||||||||||||
(Gains) losses on asset dispositions, net | (249) | 154 | (95) | (1,951) | ||||||||||||||||||||||||||||||||||
| Adjusted EBITDA excluding asset dispositions | $ | 17,182 | $ | 24,491 | $ | 41,673 | $ | 47,427 | ||||||||||||||||||||||||||||||
(1) Special items include the following:
| Three Months Ended December 31, 2019 | ||||||||||||||||||||||||||||||||||||||
| One Month Ended October 31, 2019 | Two Months Ended December 31, 2019 | Three Months Ended December 31, 2019 | Three Months Ended December 31, 2020 | |||||||||||||||||||||||||||||||||||
| Predecessor | Successor | Combined | Successor | |||||||||||||||||||||||||||||||||||
| Loss on impairment | $ | — | $ | — | $ | — | $ | 53,249 | ||||||||||||||||||||||||||||||
| PBH intangible amortization | — | 10,024 | 10,024 | 5,641 | ||||||||||||||||||||||||||||||||||
| Merger-related costs | — | 318 | 318 | 4,450 | ||||||||||||||||||||||||||||||||||
| Organizational restructuring costs | 388 | 23 | 411 | 1,547 | ||||||||||||||||||||||||||||||||||
| Loss on early extinguishment of debt | — | — | — | 229 | ||||||||||||||||||||||||||||||||||
Government grants(2) | — | — | — | (1,075) | ||||||||||||||||||||||||||||||||||
| Bankruptcy related costs | 447,674 | — | 447,674 | (1,984) | ||||||||||||||||||||||||||||||||||
| Change in fair value of preferred stock derivative liability | — | 133,315 | 133,315 | — | ||||||||||||||||||||||||||||||||||
| $ | 448,062 | $ | 143,680 | $ | 591,742 | $ | 62,057 | |||||||||||||||||||||||||||||||
___________________________
(2) COVID-19 related government relief grants
11
Pro Forma Q3 FY20 Reconciliation
Pro Forma EBITDA and Pro Forma Adjusted EBITDA reflect EBITDA and Adjusted EBITDA of Old Bristow and Era Group Inc. before the Merger. The following table provides a reconciliation of net income, the most directly comparable GAAP measure, to Pro Forma EBITDA and Pro Forma Adjusted EBITDA for the three months ended December 31, 2019 (in thousands).
| Old Bristow | Era Group Inc. | Pro Forma | ||||||||||||||||||||||||||||||
| Net loss | $ | (656,742) | $ | (811) | $ | (657,553) | ||||||||||||||||||||||||||
| Depreciation and amortization | 20,148 | 9,337 | 29,485 | |||||||||||||||||||||||||||||
| Interest expense | 88,909 | 3,517 | 92,426 | |||||||||||||||||||||||||||||
| Income tax benefit | (2,289) | (1,052) | (3,341) | |||||||||||||||||||||||||||||
| EBITDA | $ | (549,974) | $ | 10,991 | $ | (538,983) | ||||||||||||||||||||||||||
Special items (1) | 591,742 | 3,730 | 595,472 | |||||||||||||||||||||||||||||
| Adjusted EBITDA | $ | 41,768 | $ | 14,721 | $ | 56,489 | ||||||||||||||||||||||||||
| Gains on asset dispositions, net | (95) | (3,095) | (3,190) | |||||||||||||||||||||||||||||
| Adjusted EBITDA excluding asset dispositions | $ | 41,673 | $ | 11,626 | $ | 53,299 | ||||||||||||||||||||||||||
(1) Special items include the following:
| Old Bristow | Era Group Inc. | Pro Forma | ||||||||||||||||||||||||||||||
| Bankruptcy related costs | $ | 447,674 | $ | — | $ | 447,674 | ||||||||||||||||||||||||||
| Change in fair value of preferred stock derivative liability | 133,315 | — | 133,315 | |||||||||||||||||||||||||||||
| PBH intangible amortization | 10,024 | 214 | 10,238 | |||||||||||||||||||||||||||||
| Involuntary separation programs | 411 | — | 411 | |||||||||||||||||||||||||||||
| Merger-related costs | 318 | 965 | 1,283 | |||||||||||||||||||||||||||||
| Loss on impairments | — | 2,551 | 2,551 | |||||||||||||||||||||||||||||
| $ | 591,742 | $ | 3,730 | $ | 595,472 | |||||||||||||||||||||||||||
12
Pro Forma LTM Reconciliation
Pro Forma EBITDA and Pro Forma Adjusted EBITDA reflect EBITDA and Adjusted EBITDA of Old Bristow and Era Group Inc. before the Merger for the period beginning January 1, 2020 through June 11, 2020, plus EBITDA and Adjusted EBITDA for the post-Merger period through December 31, 2020. The following table provides a reconciliation of net income, the most directly comparable GAAP measure, to Pro Forma EBITDA and Pro Forma Adjusted EBITDA for the twelve months ended December 31, 2020 (in thousands).
| Old Bristow | Era Group Inc. | Legacy Era | Bristow Group Inc. | Pro Forma | ||||||||||||||||||||||||||||||||||||||||
| January 1, 2020 - June 30, 2020 | January 1, 2020 - June 11, 2020 | June 12 - 30, 2020 | July 1, 2020 - December 31, 2020 | LTM December 31, 2020 | ||||||||||||||||||||||||||||||||||||||||
| Net income (loss) | $ | 367,326 | $ | (25,348) | $ | (4,305) | $ | (85,252) | $ | 252,421 | ||||||||||||||||||||||||||||||||||
| Depreciation and amortization | 32,226 | 17,325 | 443 | 36,468 | 86,462 | |||||||||||||||||||||||||||||||||||||||
| Interest expense | 25,045 | 6,089 | 749 | 26,648 | 58,531 | |||||||||||||||||||||||||||||||||||||||
| Income tax (benefit) expense | (14,915) | (3,298) | 508 | 22,025 | 4,320 | |||||||||||||||||||||||||||||||||||||||
| EBITDA | $ | 409,682 | $ | (5,232) | $ | (2,605) | $ | (111) | $ | 401,734 | ||||||||||||||||||||||||||||||||||
Special items (1) | (338,633) | 18,168 | 2,502 | 95,259 | (222,704) | |||||||||||||||||||||||||||||||||||||||
| Adjusted EBITDA | $ | 71,049 | $ | 12,936 | $ | (103) | $ | 95,148 | $ | 179,030 | ||||||||||||||||||||||||||||||||||
(Gains) losses on asset dispositions, net | (5,230) | 175 | 5 | 6,522 | 1,472 | |||||||||||||||||||||||||||||||||||||||
| Adjusted EBITDA excluding asset dispositions | $ | 65,819 | $ | 13,111 | $ | (98) | $ | 101,670 | $ | 180,502 | ||||||||||||||||||||||||||||||||||
(1) Special items include the following:
| Old Bristow | Era Group Inc. | Legacy Era | Bristow Group Inc. | Pro Forma | ||||||||||||||||||||||||||||||||||||||||
| January 1, 2020 - June 30, 2020 | January 1, 2020 - June 11, 2020 | June 12 - 30, 2020 | July 1, 2020 - December 31, 2020 | LTM December 31, 2020 | ||||||||||||||||||||||||||||||||||||||||
| Loss on impairments | $ | 28,824 | $ | (182) | $ | — | $ | 70,845 | $ | 99,487 | ||||||||||||||||||||||||||||||||||
| Merger-related costs | 21,115 | 17,968 | 2,317 | 8,947 | 50,347 | |||||||||||||||||||||||||||||||||||||||
| PBH intangible amortization | 10,429 | 382 | 185 | 11,285 | 22,281 | |||||||||||||||||||||||||||||||||||||||
| Bankruptcy related costs | 7,232 | — | — | (1,984) | 5,248 | |||||||||||||||||||||||||||||||||||||||
| Organizational restructuring costs | 3,216 | — | — | 14,873 | 18,089 | |||||||||||||||||||||||||||||||||||||||
| Loss on early extinguishment of debt | 615 | — | — | 229 | 844 | |||||||||||||||||||||||||||||||||||||||
Government grants(2) | (1,760) | — | — | (3,276) | (5,036) | |||||||||||||||||||||||||||||||||||||||
| Bargain purchase gain | (75,433) | — | — | (5,660) | (81,093) | |||||||||||||||||||||||||||||||||||||||
Change in fair value of preferred stock derivative liability | (332,871) | — | — | — | (332,871) | |||||||||||||||||||||||||||||||||||||||
| $ | (338,633) | $ | 18,168 | $ | 2,502 | $ | 95,259 | $ | (222,704) | |||||||||||||||||||||||||||||||||||
___________________________
(2) COVID-19 related government relief grants
13
Adjusted Free Cash Flow Reconciliation
Free Cash Flow represents the Company’s net cash provided by operating activities plus proceeds from disposition of property and equipment, less expenditures related to purchases of property and equipment. Adjusted Free Cash Flow is Free Cash Flow adjusted to exclude professional services fees and other costs paid in relation to the Merger, fresh-start accounting and the Chapter 11 Cases. Management believes that the use of Adjusted Free Cash Flow is meaningful as it measures the Company’s ability to generate cash from its business after excluding cash payments for special items. Management uses this information as an analytical indicator to assess the Company’s liquidity and performance. However, investors should note numerous methods may exist for calculating a company’s free cash flow. As a result, the method used by management to calculate Adjusted Free Cash Flow may differ from the methods used by other companies to calculate their free cash flow.
The following table provides a reconciliation of net cash provided by operating activities, the most directly comparable GAAP measure, to Free Cash Flow and Adjusted Free Cash Flow (in thousands).
| Three Months Ended September 30, 2020 | Three Months Ended December 31, 2020 | ||||||||||
| Successor | |||||||||||
| Net cash provided by operating activities | $ | 41,857 | $ | 25,078 | |||||||
| Plus: Proceeds from disposition of property and equipment | 40,475 | 14,361 | |||||||||
| Less: Purchases of property and equipment | (4,523) | (3,860) | |||||||||
| Free Cash Flow | $ | 77,809 | $ | 35,579 | |||||||
| Plus: Organizational restructuring costs | 13,326 | 1,547 | |||||||||
| Plus: Merger-related costs | 4,026 | 1,247 | |||||||||
| Less: Government grants | (2,201) | (1,075) | |||||||||
| Adjusted Free Cash Flow | $ | 92,960 | $ | 37,298 | |||||||
| Net (proceeds from)/purchases of property and equipment (“Net Capex”) | (35,952) | (10,501) | |||||||||
| Adjusted Free Cash Flow excluding Net Capex | $ | 57,008 | $ | 26,797 | |||||||
14
BRISTOW GROUP INC. FLEET COUNT (unaudited) | ||||||||||||||||||||||||||||||||||||||||||||||||||
| Number of Aircraft | ||||||||||||||||||||||||||||||||||||||||||||||||||
| Operating Aircraft | ||||||||||||||||||||||||||||||||||||||||||||||||||
| Type | Owned Aircraft | Leased Aircraft | Aircraft Held For Sale | Consolidated Aircraft | Max Pass. Capacity | Average Age (years)(1) | ||||||||||||||||||||||||||||||||||||||||||||
| Heavy Helicopters: | ||||||||||||||||||||||||||||||||||||||||||||||||||
| S-92A | 35 | 28 | — | 63 | 19 | 11 | ||||||||||||||||||||||||||||||||||||||||||||
| S-92A U.K. SAR | 3 | 7 | — | 10 | 19 | 6 | ||||||||||||||||||||||||||||||||||||||||||||
| H225 | — | — | 2 | 2 | 19 | 10 | ||||||||||||||||||||||||||||||||||||||||||||
| AW189 | 6 | 1 | — | 7 | 16 | 5 | ||||||||||||||||||||||||||||||||||||||||||||
AW189 U.K. SAR | 11 | — | — | 11 | 16 | 4 | ||||||||||||||||||||||||||||||||||||||||||||
| 55 | 36 | 2 | 93 | |||||||||||||||||||||||||||||||||||||||||||||||
| Medium Helicopters: | ||||||||||||||||||||||||||||||||||||||||||||||||||
| AW139 | 53 | 7 | — | 60 | 12 | 10 | ||||||||||||||||||||||||||||||||||||||||||||
| S-76 C+/C++ | 26 | — | — | 26 | 12 | 13 | ||||||||||||||||||||||||||||||||||||||||||||
| S-76D | 8 | — | 2 | 10 | 12 | 6 | ||||||||||||||||||||||||||||||||||||||||||||
| B212 | 3 | — | — | 3 | 12 | 39 | ||||||||||||||||||||||||||||||||||||||||||||
| 90 | 7 | 2 | 99 | |||||||||||||||||||||||||||||||||||||||||||||||
| Light—Twin Engine Helicopters: | ||||||||||||||||||||||||||||||||||||||||||||||||||
| AW109 | 6 | — | — | 6 | 7 | 14 | ||||||||||||||||||||||||||||||||||||||||||||
| EC135 | 10 | — | — | 10 | 6 | 12 | ||||||||||||||||||||||||||||||||||||||||||||
| BO105 | 2 | — | — | 2 | 4 | 35 | ||||||||||||||||||||||||||||||||||||||||||||
| 18 | — | — | 18 | |||||||||||||||||||||||||||||||||||||||||||||||
| Light—Single Engine Helicopters: | ||||||||||||||||||||||||||||||||||||||||||||||||||
| AS350 | 17 | — | — | 17 | 4 | 23 | ||||||||||||||||||||||||||||||||||||||||||||
| AW119 | 13 | — | — | 13 | 7 | 14 | ||||||||||||||||||||||||||||||||||||||||||||
| 30 | — | — | 30 | |||||||||||||||||||||||||||||||||||||||||||||||
| Total Helicopters | 193 | 43 | 4 | 240 | 12 | |||||||||||||||||||||||||||||||||||||||||||||
| Fixed wing | 7 | 4 | 3 | 14 | ||||||||||||||||||||||||||||||||||||||||||||||
| UAV | — | 2 | — | 2 | ||||||||||||||||||||||||||||||||||||||||||||||
| Total Fleet | 200 | 49 | 7 | 256 | ||||||||||||||||||||||||||||||||||||||||||||||
_____________
(1)Reflects the average age of helicopters that are owned.
The chart below presents the number of aircraft in our fleet and their distribution among the regions in which we operate as of December 31, 2020 and the percentage of operating revenue that each of our regions provided during the current quarter.
| Percentage of Current Quarter Operating Revenue | |||||||||||||||||||||||||||||||||||||||||||||||||||||||||||
| UAV | Fixed Wing | ||||||||||||||||||||||||||||||||||||||||||||||||||||||||||
| Heavy | Medium | Light Twin | Light Single | Total | |||||||||||||||||||||||||||||||||||||||||||||||||||||||
| Europe Caspian | 55 | % | 63 | 12 | — | 4 | 2 | — | 81 | ||||||||||||||||||||||||||||||||||||||||||||||||||
| Americas | 30 | % | 23 | 65 | 18 | 26 | — | — | 132 | ||||||||||||||||||||||||||||||||||||||||||||||||||
| Africa | 9 | % | 7 | 20 | — | — | — | 2 | 29 | ||||||||||||||||||||||||||||||||||||||||||||||||||
| Asia Pacific | 6 | % | — | 2 | — | — | — | 12 | 14 | ||||||||||||||||||||||||||||||||||||||||||||||||||
| Total | 100 | % | 93 | 99 | 18 | 30 | 2 | 14 | 256 | ||||||||||||||||||||||||||||||||||||||||||||||||||
15
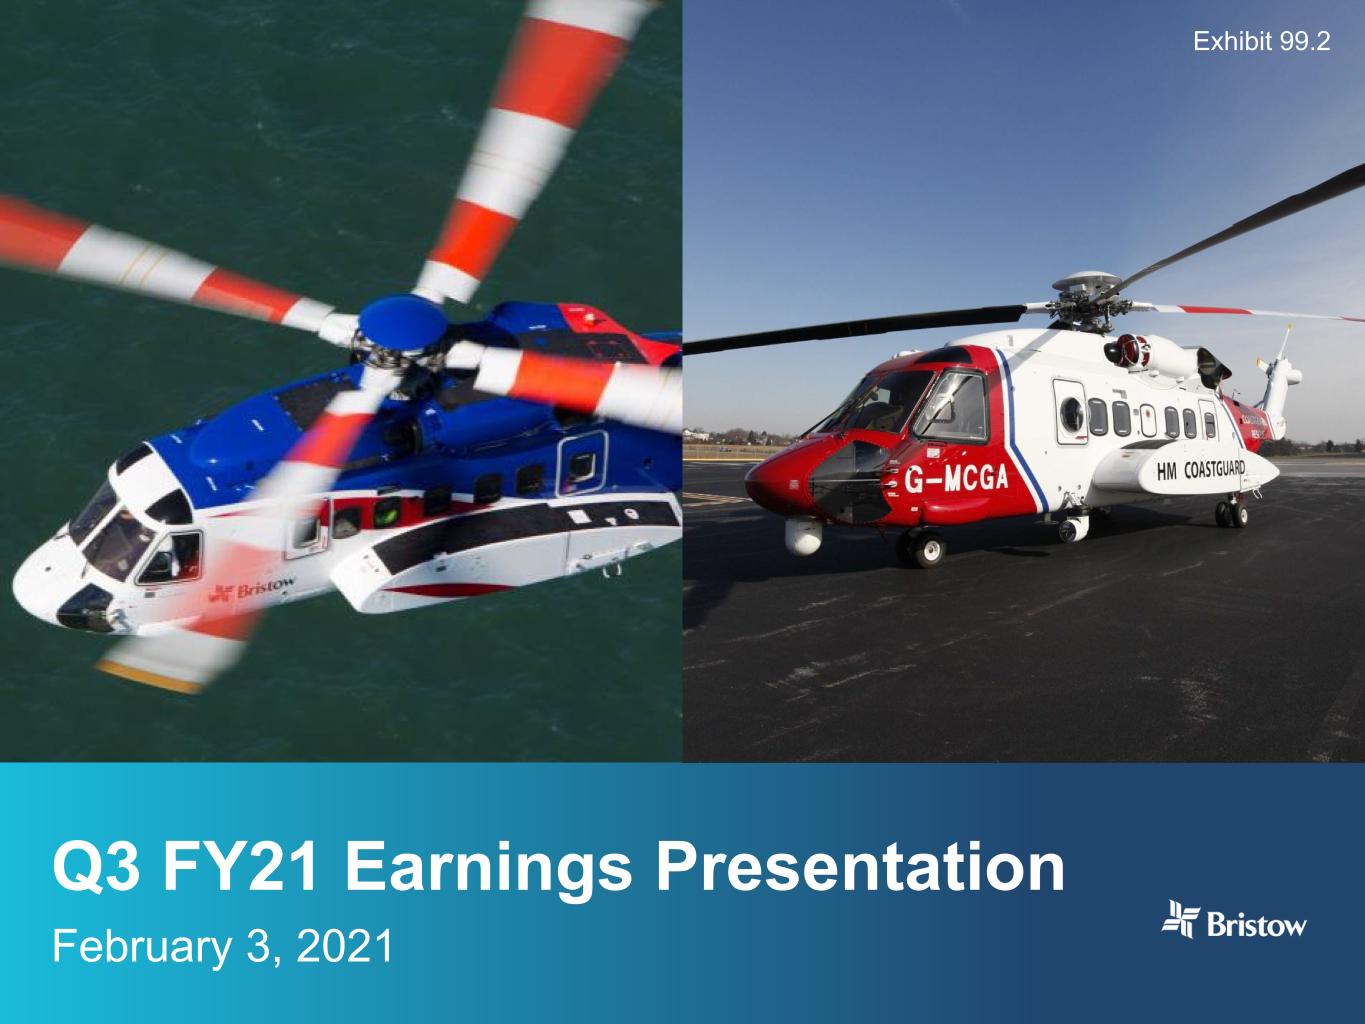
Q3 FY21 Earnings Presentation February 3, 2021 Exhibit 99.2
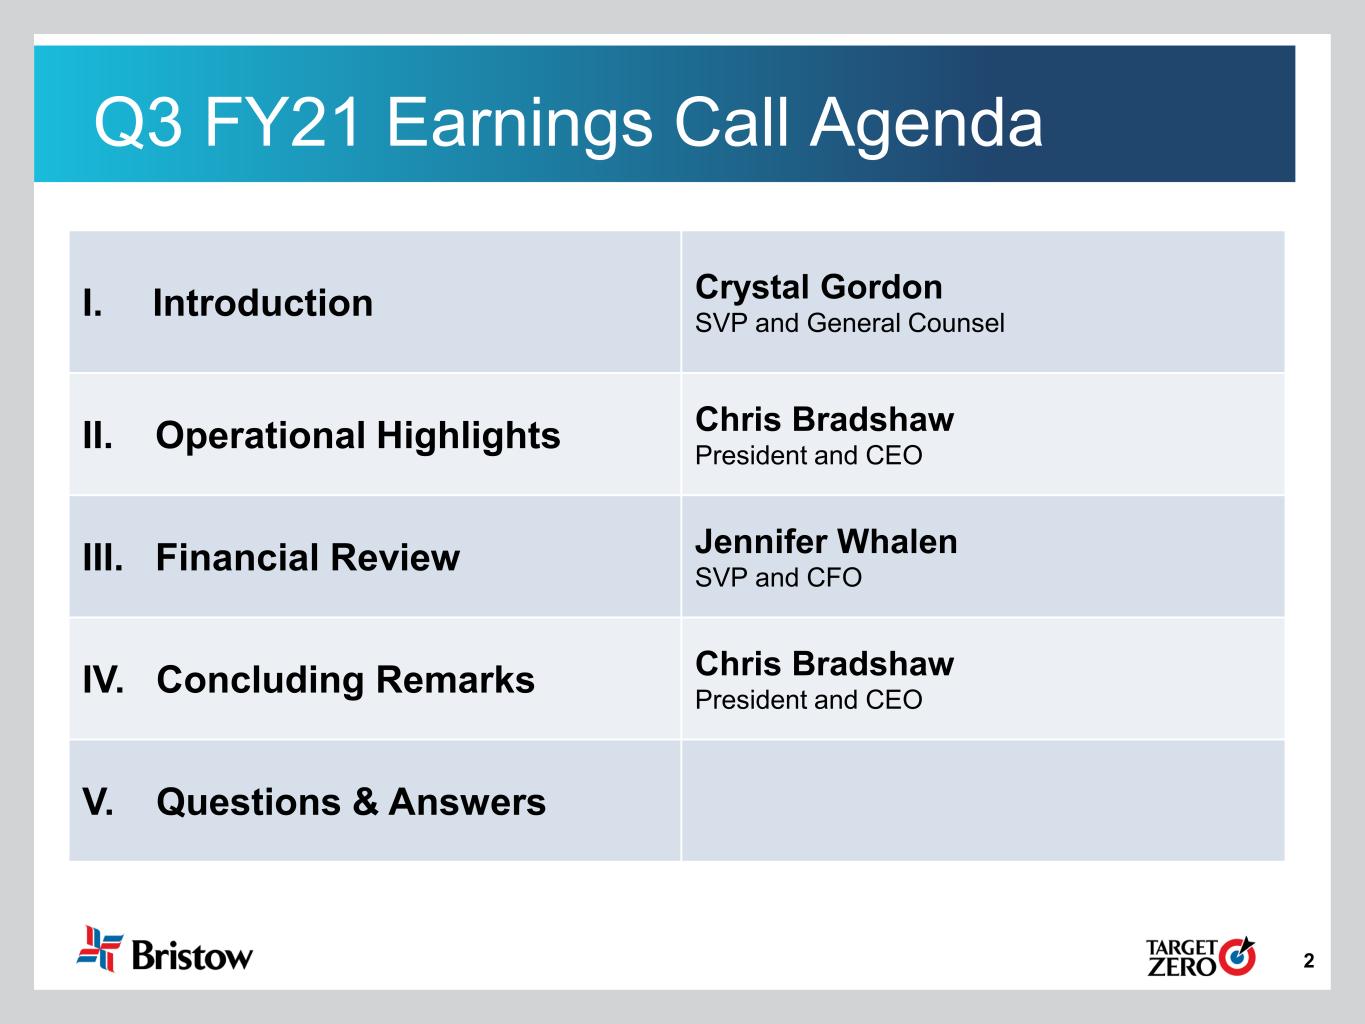
2 Q3 FY21 Earnings Call Agenda I. Introduction Crystal GordonSVP and General Counsel II. Operational Highlights Chris Bradshaw President and CEO III. Financial Review Jennifer WhalenSVP and CFO IV. Concluding Remarks Chris BradshawPresident and CEO V. Questions & Answers
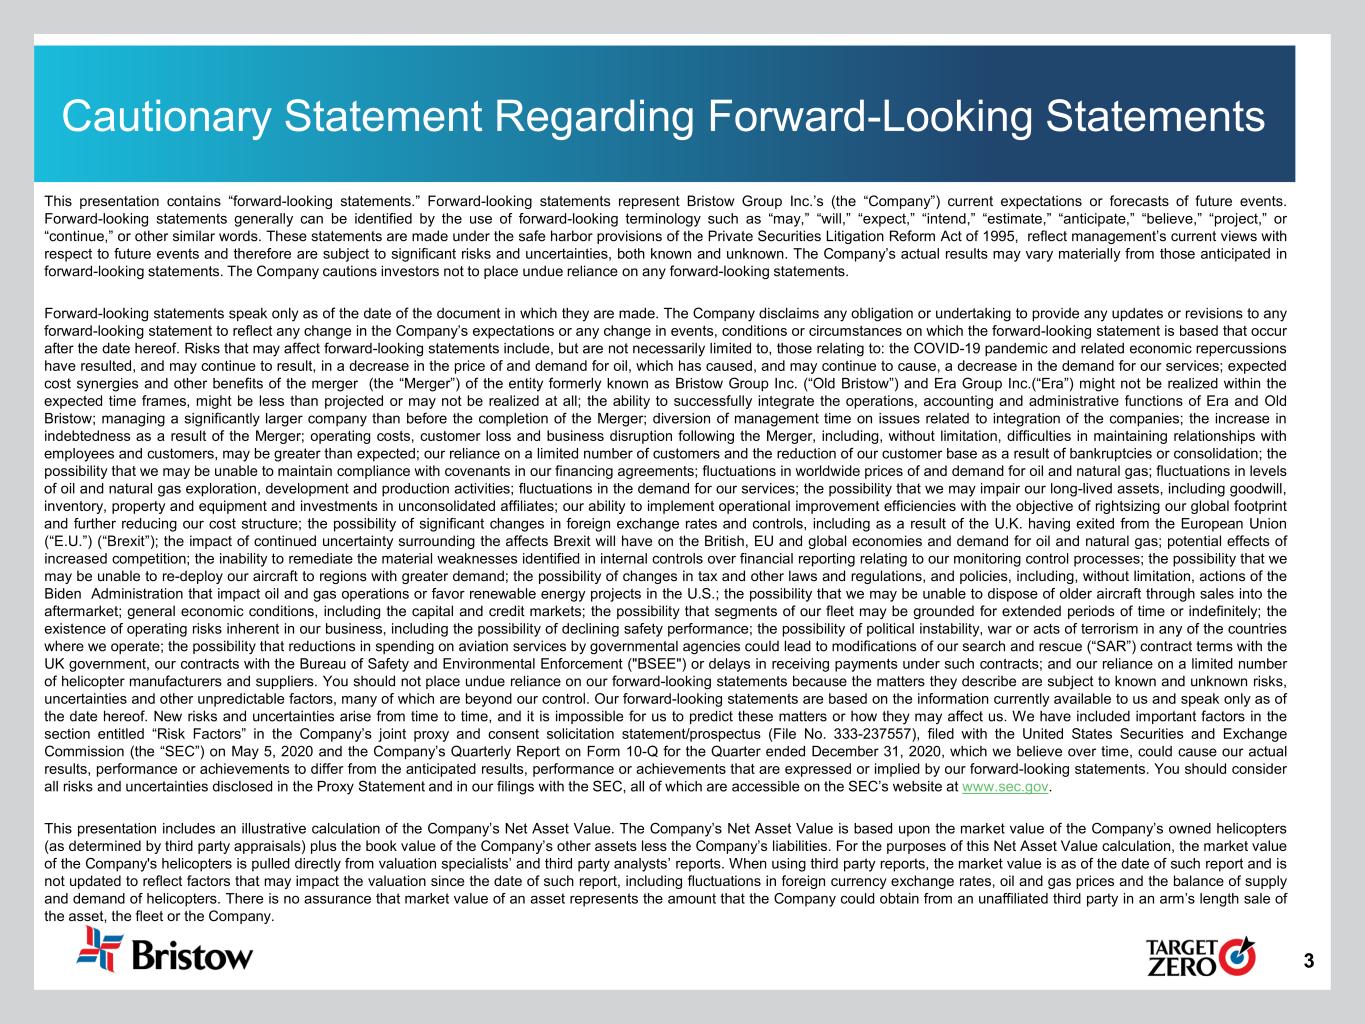
3 Cautionary Statement Regarding Forward-Looking Statements This presentation contains “forward-looking statements.” Forward-looking statements represent Bristow Group Inc.’s (the “Company”) current expectations or forecasts of future events. Forward-looking statements generally can be identified by the use of forward-looking terminology such as “may,” “will,” “expect,” “intend,” “estimate,” “anticipate,” “believe,” “project,” or “continue,” or other similar words. These statements are made under the safe harbor provisions of the Private Securities Litigation Reform Act of 1995, reflect management’s current views with respect to future events and therefore are subject to significant risks and uncertainties, both known and unknown. The Company’s actual results may vary materially from those anticipated in forward-looking statements. The Company cautions investors not to place undue reliance on any forward-looking statements. Forward-looking statements speak only as of the date of the document in which they are made. The Company disclaims any obligation or undertaking to provide any updates or revisions to any forward-looking statement to reflect any change in the Company’s expectations or any change in events, conditions or circumstances on which the forward-looking statement is based that occur after the date hereof. Risks that may affect forward-looking statements include, but are not necessarily limited to, those relating to: the COVID-19 pandemic and related economic repercussions have resulted, and may continue to result, in a decrease in the price of and demand for oil, which has caused, and may continue to cause, a decrease in the demand for our services; expected cost synergies and other benefits of the merger (the “Merger”) of the entity formerly known as Bristow Group Inc. (“Old Bristow”) and Era Group Inc.(“Era”) might not be realized within the expected time frames, might be less than projected or may not be realized at all; the ability to successfully integrate the operations, accounting and administrative functions of Era and Old Bristow; managing a significantly larger company than before the completion of the Merger; diversion of management time on issues related to integration of the companies; the increase in indebtedness as a result of the Merger; operating costs, customer loss and business disruption following the Merger, including, without limitation, difficulties in maintaining relationships with employees and customers, may be greater than expected; our reliance on a limited number of customers and the reduction of our customer base as a result of bankruptcies or consolidation; the possibility that we may be unable to maintain compliance with covenants in our financing agreements; fluctuations in worldwide prices of and demand for oil and natural gas; fluctuations in levels of oil and natural gas exploration, development and production activities; fluctuations in the demand for our services; the possibility that we may impair our long-lived assets, including goodwill, inventory, property and equipment and investments in unconsolidated affiliates; our ability to implement operational improvement efficiencies with the objective of rightsizing our global footprint and further reducing our cost structure; the possibility of significant changes in foreign exchange rates and controls, including as a result of the U.K. having exited from the European Union (“E.U.”) (“Brexit”); the impact of continued uncertainty surrounding the affects Brexit will have on the British, EU and global economies and demand for oil and natural gas; potential effects of increased competition; the inability to remediate the material weaknesses identified in internal controls over financial reporting relating to our monitoring control processes; the possibility that we may be unable to re-deploy our aircraft to regions with greater demand; the possibility of changes in tax and other laws and regulations, and policies, including, without limitation, actions of the Biden Administration that impact oil and gas operations or favor renewable energy projects in the U.S.; the possibility that we may be unable to dispose of older aircraft through sales into the aftermarket; general economic conditions, including the capital and credit markets; the possibility that segments of our fleet may be grounded for extended periods of time or indefinitely; the existence of operating risks inherent in our business, including the possibility of declining safety performance; the possibility of political instability, war or acts of terrorism in any of the countries where we operate; the possibility that reductions in spending on aviation services by governmental agencies could lead to modifications of our search and rescue (“SAR”) contract terms with the UK government, our contracts with the Bureau of Safety and Environmental Enforcement ("BSEE") or delays in receiving payments under such contracts; and our reliance on a limited number of helicopter manufacturers and suppliers. You should not place undue reliance on our forward-looking statements because the matters they describe are subject to known and unknown risks, uncertainties and other unpredictable factors, many of which are beyond our control. Our forward-looking statements are based on the information currently available to us and speak only as of the date hereof. New risks and uncertainties arise from time to time, and it is impossible for us to predict these matters or how they may affect us. We have included important factors in the section entitled “Risk Factors” in the Company’s joint proxy and consent solicitation statement/prospectus (File No. 333-237557), filed with the United States Securities and Exchange Commission (the “SEC”) on May 5, 2020 and the Company’s Quarterly Report on Form 10-Q for the Quarter ended December 31, 2020, which we believe over time, could cause our actual results, performance or achievements to differ from the anticipated results, performance or achievements that are expressed or implied by our forward-looking statements. You should consider all risks and uncertainties disclosed in the Proxy Statement and in our filings with the SEC, all of which are accessible on the SEC’s website at www.sec.gov. This presentation includes an illustrative calculation of the Company’s Net Asset Value. The Company’s Net Asset Value is based upon the market value of the Company’s owned helicopters (as determined by third party appraisals) plus the book value of the Company’s other assets less the Company’s liabilities. For the purposes of this Net Asset Value calculation, the market value of the Company's helicopters is pulled directly from valuation specialists’ and third party analysts’ reports. When using third party reports, the market value is as of the date of such report and is not updated to reflect factors that may impact the valuation since the date of such report, including fluctuations in foreign currency exchange rates, oil and gas prices and the balance of supply and demand of helicopters. There is no assurance that market value of an asset represents the amount that the Company could obtain from an unaffiliated third party in an arm’s length sale of the asset, the fleet or the Company.
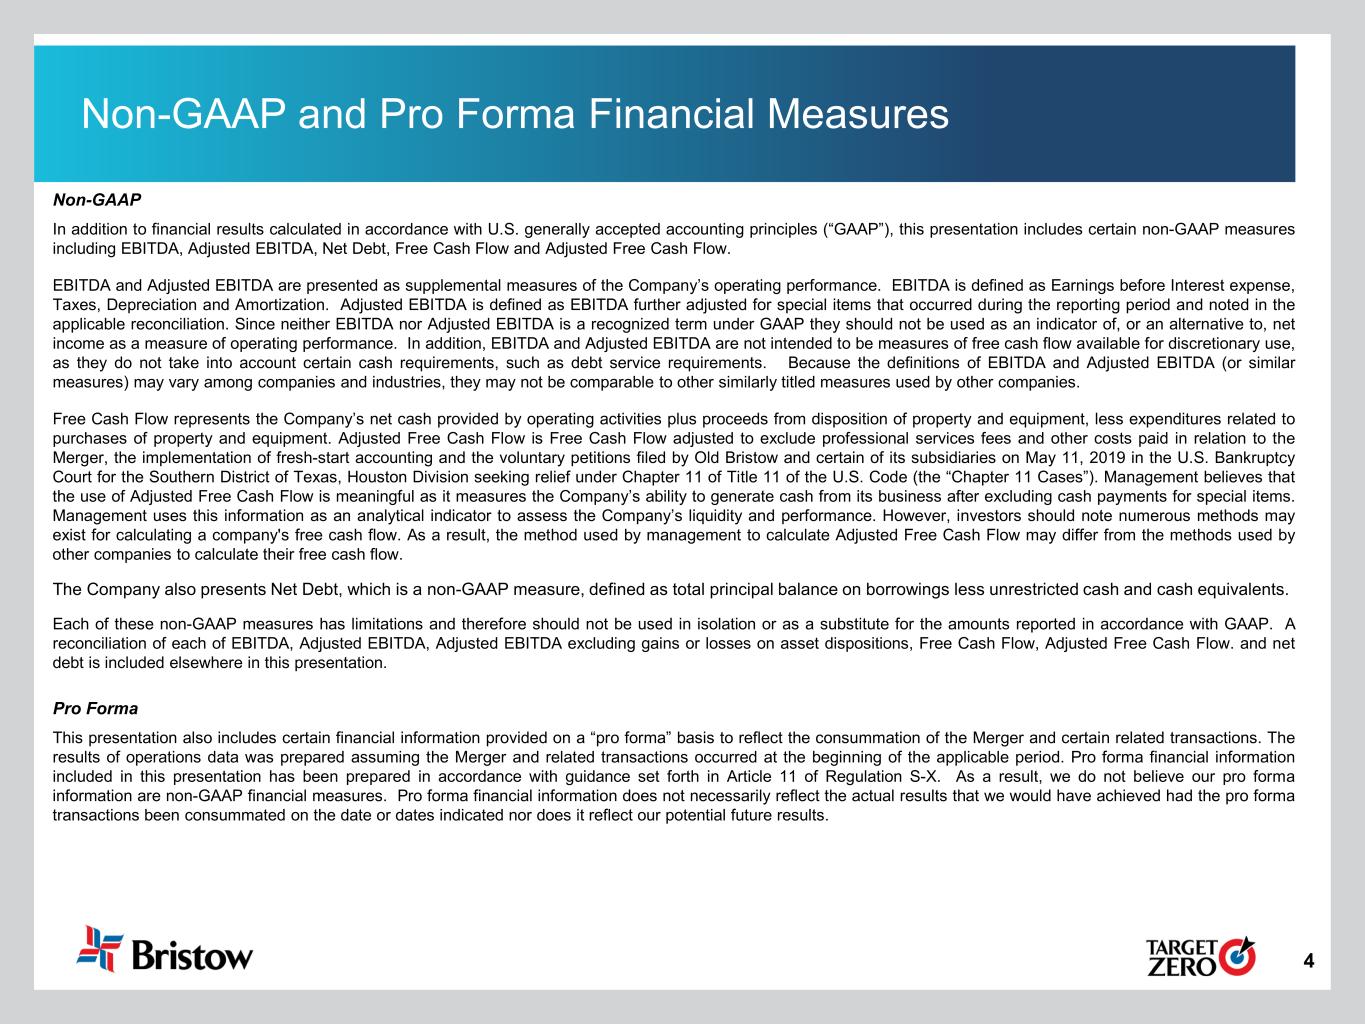
4 Non-GAAP In addition to financial results calculated in accordance with U.S. generally accepted accounting principles (“GAAP”), this presentation includes certain non-GAAP measures including EBITDA, Adjusted EBITDA, Net Debt, Free Cash Flow and Adjusted Free Cash Flow. EBITDA and Adjusted EBITDA are presented as supplemental measures of the Company’s operating performance. EBITDA is defined as Earnings before Interest expense, Taxes, Depreciation and Amortization. Adjusted EBITDA is defined as EBITDA further adjusted for special items that occurred during the reporting period and noted in the applicable reconciliation. Since neither EBITDA nor Adjusted EBITDA is a recognized term under GAAP they should not be used as an indicator of, or an alternative to, net income as a measure of operating performance. In addition, EBITDA and Adjusted EBITDA are not intended to be measures of free cash flow available for discretionary use, as they do not take into account certain cash requirements, such as debt service requirements. Because the definitions of EBITDA and Adjusted EBITDA (or similar measures) may vary among companies and industries, they may not be comparable to other similarly titled measures used by other companies. Free Cash Flow represents the Company’s net cash provided by operating activities plus proceeds from disposition of property and equipment, less expenditures related to purchases of property and equipment. Adjusted Free Cash Flow is Free Cash Flow adjusted to exclude professional services fees and other costs paid in relation to the Merger, the implementation of fresh-start accounting and the voluntary petitions filed by Old Bristow and certain of its subsidiaries on May 11, 2019 in the U.S. Bankruptcy Court for the Southern District of Texas, Houston Division seeking relief under Chapter 11 of Title 11 of the U.S. Code (the “Chapter 11 Cases”). Management believes that the use of Adjusted Free Cash Flow is meaningful as it measures the Company’s ability to generate cash from its business after excluding cash payments for special items. Management uses this information as an analytical indicator to assess the Company’s liquidity and performance. However, investors should note numerous methods may exist for calculating a company's free cash flow. As a result, the method used by management to calculate Adjusted Free Cash Flow may differ from the methods used by other companies to calculate their free cash flow. The Company also presents Net Debt, which is a non-GAAP measure, defined as total principal balance on borrowings less unrestricted cash and cash equivalents. Each of these non-GAAP measures has limitations and therefore should not be used in isolation or as a substitute for the amounts reported in accordance with GAAP. A reconciliation of each of EBITDA, Adjusted EBITDA, Adjusted EBITDA excluding gains or losses on asset dispositions, Free Cash Flow, Adjusted Free Cash Flow. and net debt is included elsewhere in this presentation. Pro Forma This presentation also includes certain financial information provided on a “pro forma” basis to reflect the consummation of the Merger and certain related transactions. The results of operations data was prepared assuming the Merger and related transactions occurred at the beginning of the applicable period. Pro forma financial information included in this presentation has been prepared in accordance with guidance set forth in Article 11 of Regulation S-X. As a result, we do not believe our pro forma information are non-GAAP financial measures. Pro forma financial information does not necessarily reflect the actual results that we would have achieved had the pro forma transactions been consummated on the date or dates indicated nor does it reflect our potential future results. Non-GAAP and Pro Forma Financial Measures
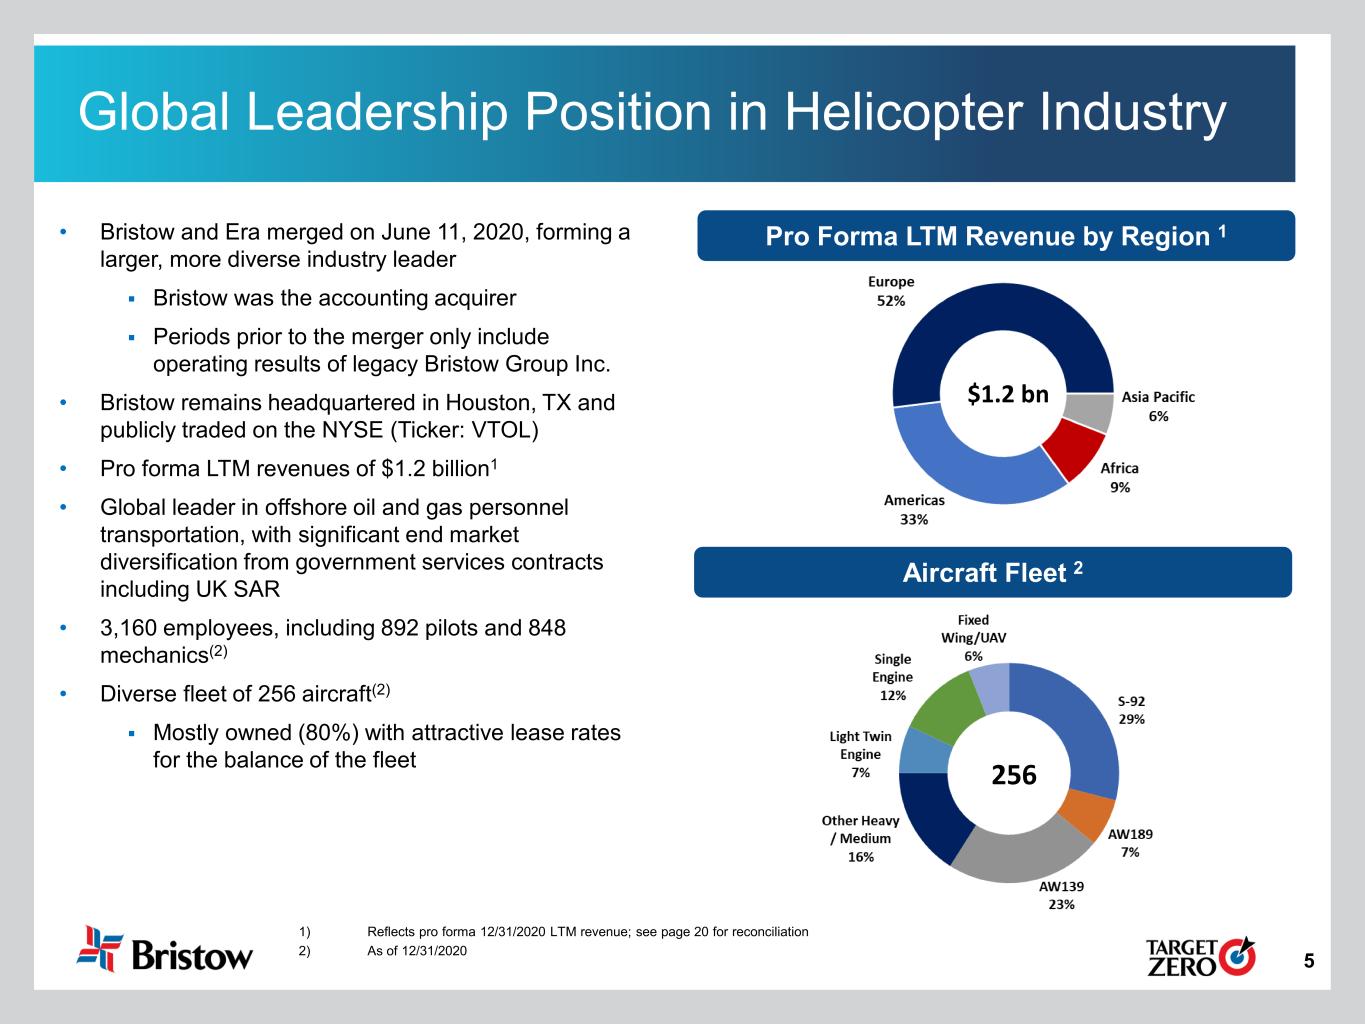
5 Global Leadership Position in Helicopter Industry Aircraft Fleet 2 Pro Forma LTM Revenue by Region 1 256 $1.2 bn • Bristow and Era merged on June 11, 2020, forming a larger, more diverse industry leader Bristow was the accounting acquirer Periods prior to the merger only include operating results of legacy Bristow Group Inc. • Bristow remains headquartered in Houston, TX and publicly traded on the NYSE (Ticker: VTOL) • Pro forma LTM revenues of $1.2 billion1 • Global leader in offshore oil and gas personnel transportation, with significant end market diversification from government services contracts including UK SAR • 3,160 employees, including 892 pilots and 848 mechanics(2) • Diverse fleet of 256 aircraft(2) Mostly owned (80%) with attractive lease rates for the balance of the fleet 1) Reflects pro forma 12/31/2020 LTM revenue; see page 20 for reconciliation 2) As of 12/31/2020
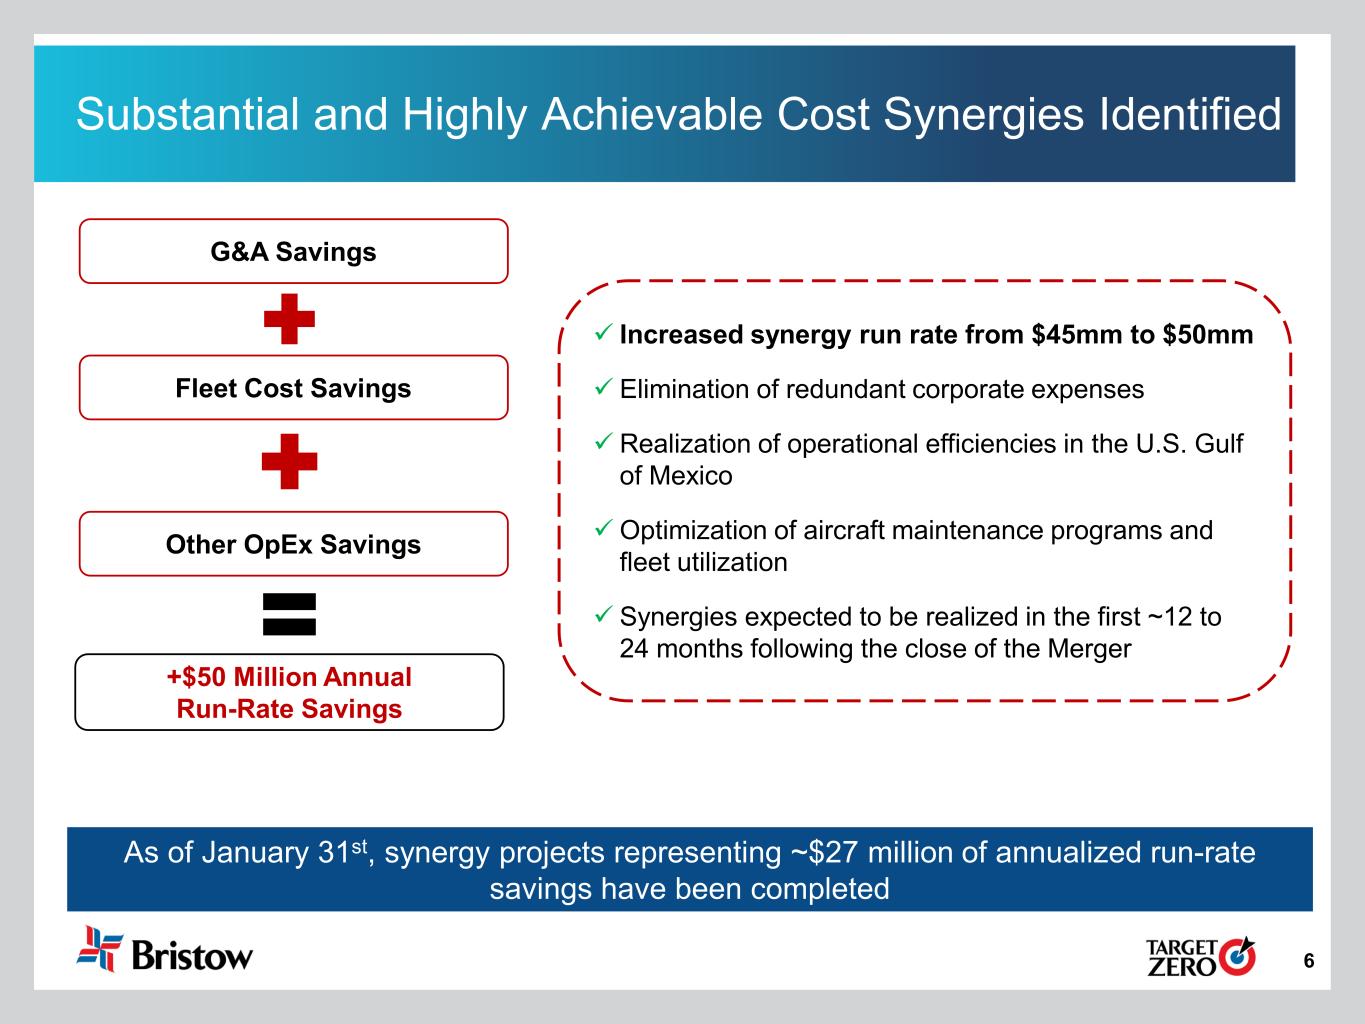
6 G&A Savings Other OpEx Savings +$50 Million Annual Run-Rate Savings Fleet Cost Savings Increased synergy run rate from $45mm to $50mm Elimination of redundant corporate expenses Realization of operational efficiencies in the U.S. Gulf of Mexico Optimization of aircraft maintenance programs and fleet utilization Synergies expected to be realized in the first ~12 to 24 months following the close of the Merger Substantial and Highly Achievable Cost Synergies Identified As of January 31st, synergy projects representing ~$27 million of annualized run-rate savings have been completed
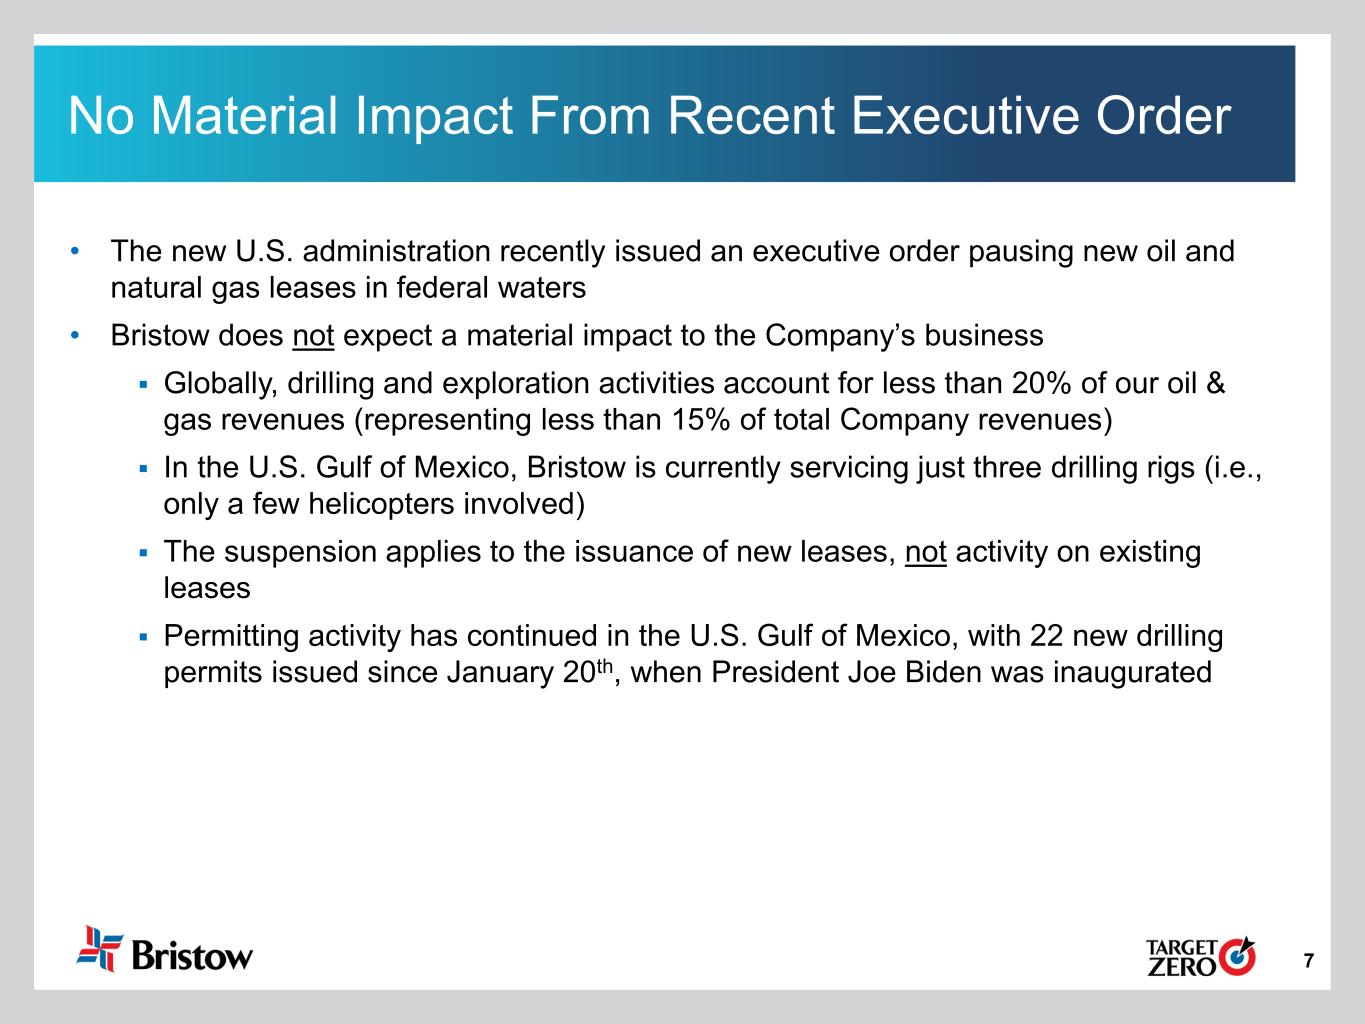
7 No Material Impact From Recent Executive Order • The new U.S. administration recently issued an executive order pausing new oil and natural gas leases in federal waters • Bristow does not expect a material impact to the Company’s business Globally, drilling and exploration activities account for less than 20% of our oil & gas revenues (representing less than 15% of total Company revenues) In the U.S. Gulf of Mexico, Bristow is currently servicing just three drilling rigs (i.e., only a few helicopters involved) The suspension applies to the issuance of new leases, not activity on existing leases Permitting activity has continued in the U.S. Gulf of Mexico, with 22 new drilling permits issued since January 20th, when President Joe Biden was inaugurated
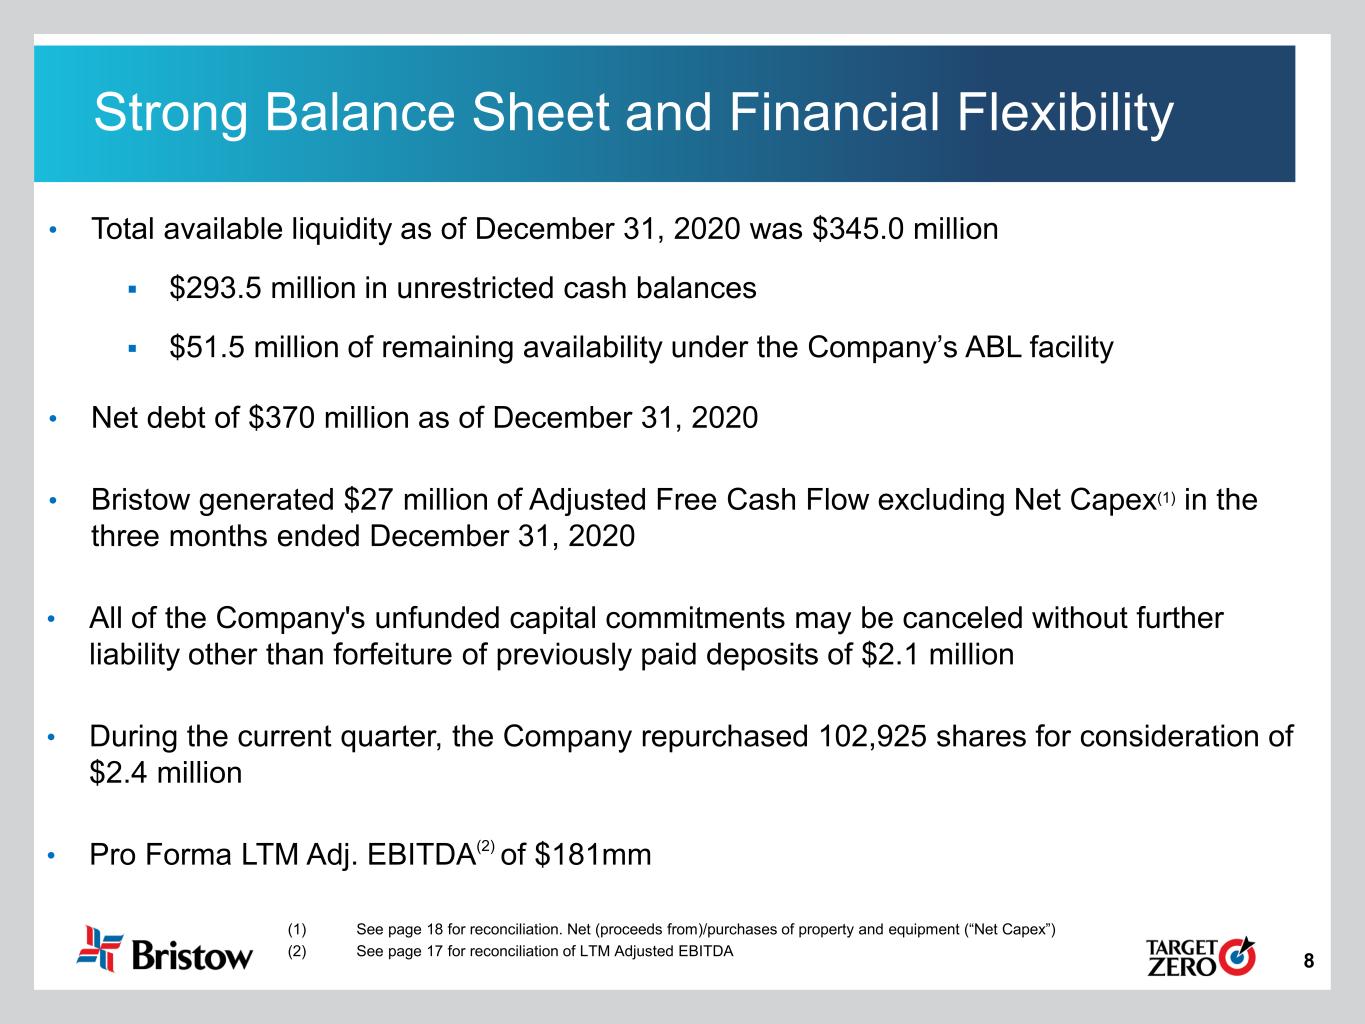
8 Strong Balance Sheet and Financial Flexibility • Total available liquidity as of December 31, 2020 was $345.0 million $293.5 million in unrestricted cash balances $51.5 million of remaining availability under the Company’s ABL facility • Net debt of $370 million as of December 31, 2020 • Bristow generated $27 million of Adjusted Free Cash Flow excluding Net Capex(1) in the three months ended December 31, 2020 • All of the Company's unfunded capital commitments may be canceled without further liability other than forfeiture of previously paid deposits of $2.1 million • During the current quarter, the Company repurchased 102,925 shares for consideration of $2.4 million • Pro Forma LTM Adj. EBITDA(2) of $181mm (1) See page 18 for reconciliation. Net (proceeds from)/purchases of property and equipment (“Net Capex”) (2) See page 17 for reconciliation of LTM Adjusted EBITDA
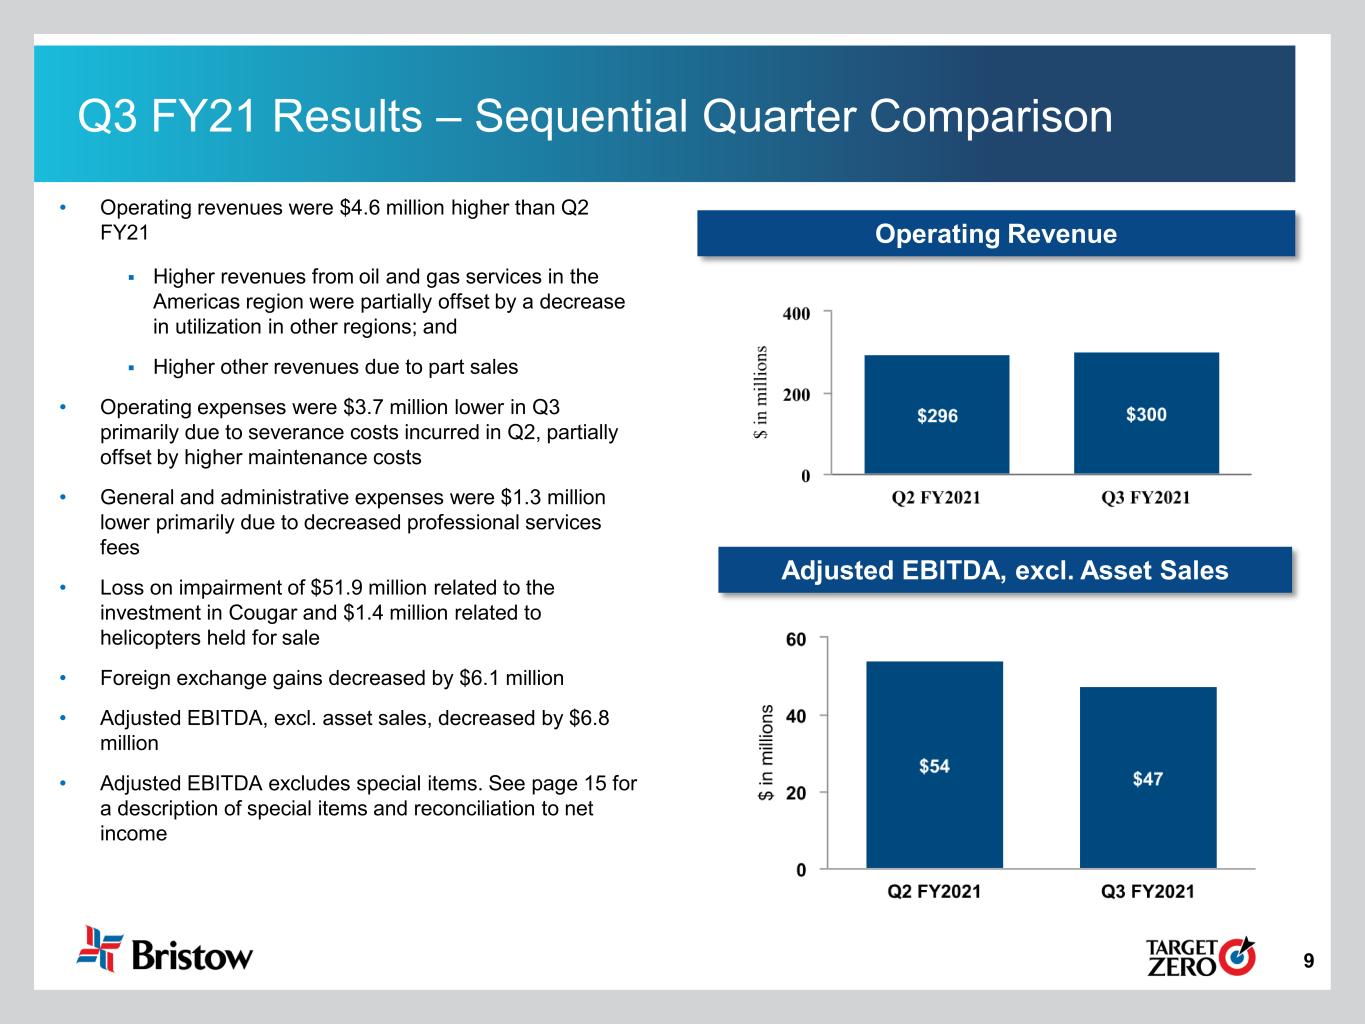
9 Q3 FY21 Results – Sequential Quarter Comparison Adjusted EBITDA, excl. Asset Sales Operating Revenue • Operating revenues were $4.6 million higher than Q2 FY21 Higher revenues from oil and gas services in the Americas region were partially offset by a decrease in utilization in other regions; and Higher other revenues due to part sales • Operating expenses were $3.7 million lower in Q3 primarily due to severance costs incurred in Q2, partially offset by higher maintenance costs • General and administrative expenses were $1.3 million lower primarily due to decreased professional services fees • Loss on impairment of $51.9 million related to the investment in Cougar and $1.4 million related to helicopters held for sale • Foreign exchange gains decreased by $6.1 million • Adjusted EBITDA, excl. asset sales, decreased by $6.8 million • Adjusted EBITDA excludes special items. See page 15 for a description of special items and reconciliation to net income
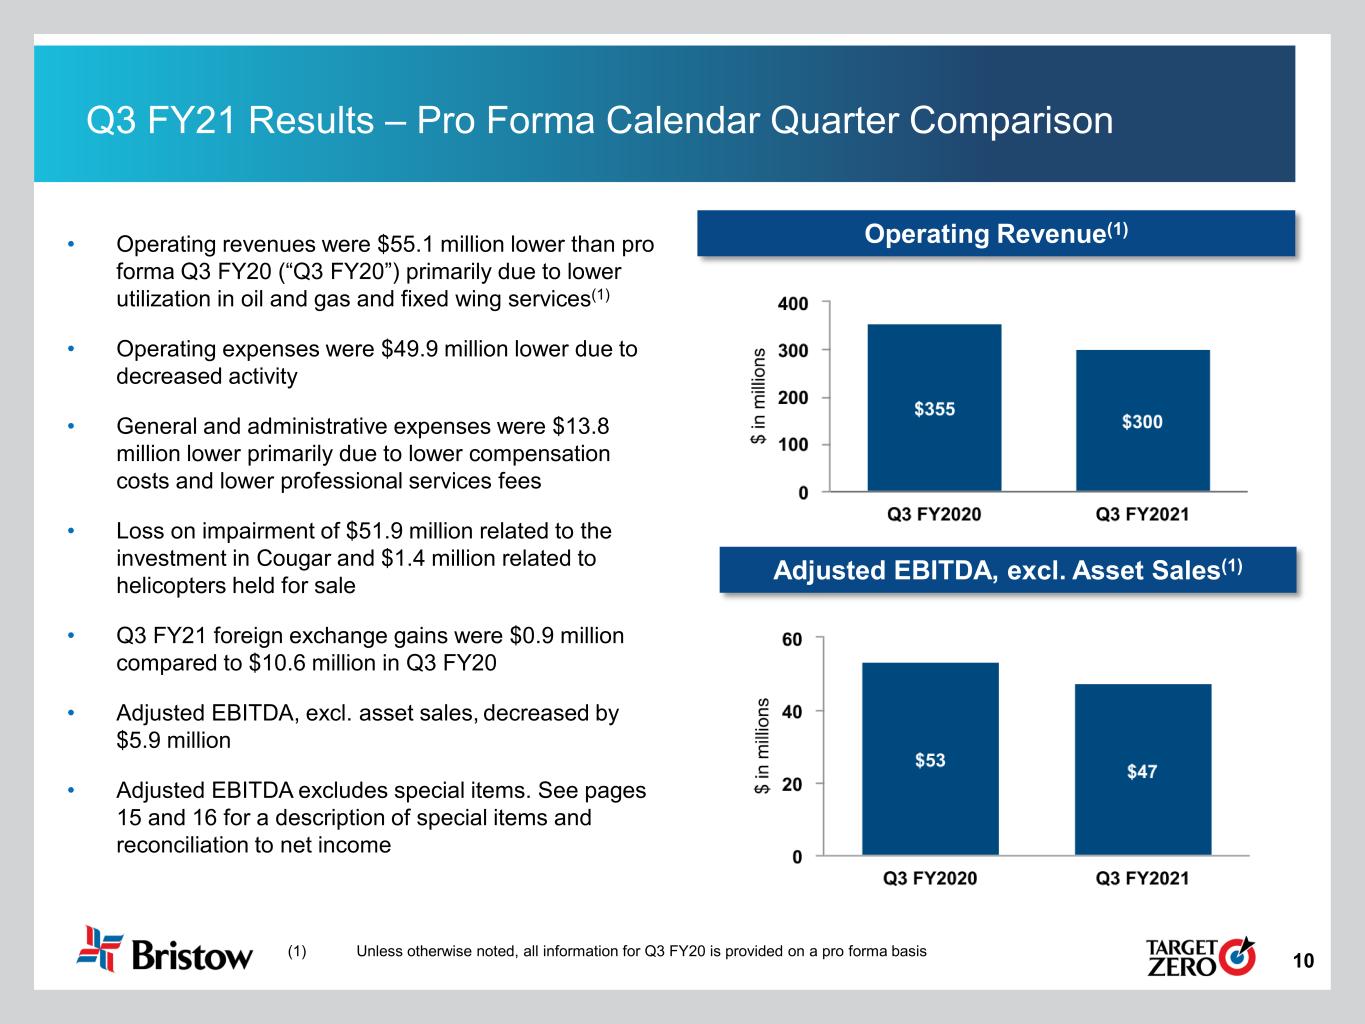
10 Adjusted EBITDA, excl. Asset Sales(1) Operating Revenue(1) Q3 FY21 Results – Pro Forma Calendar Quarter Comparison (1) Unless otherwise noted, all information for Q3 FY20 is provided on a pro forma basis • Operating revenues were $55.1 million lower than pro forma Q3 FY20 (“Q3 FY20”) primarily due to lower utilization in oil and gas and fixed wing services(1) • Operating expenses were $49.9 million lower due to decreased activity • General and administrative expenses were $13.8 million lower primarily due to lower compensation costs and lower professional services fees • Loss on impairment of $51.9 million related to the investment in Cougar and $1.4 million related to helicopters held for sale • Q3 FY21 foreign exchange gains were $0.9 million compared to $10.6 million in Q3 FY20 • Adjusted EBITDA, excl. asset sales, decreased by $5.9 million • Adjusted EBITDA excludes special items. See pages 15 and 16 for a description of special items and reconciliation to net income
11 Appendix
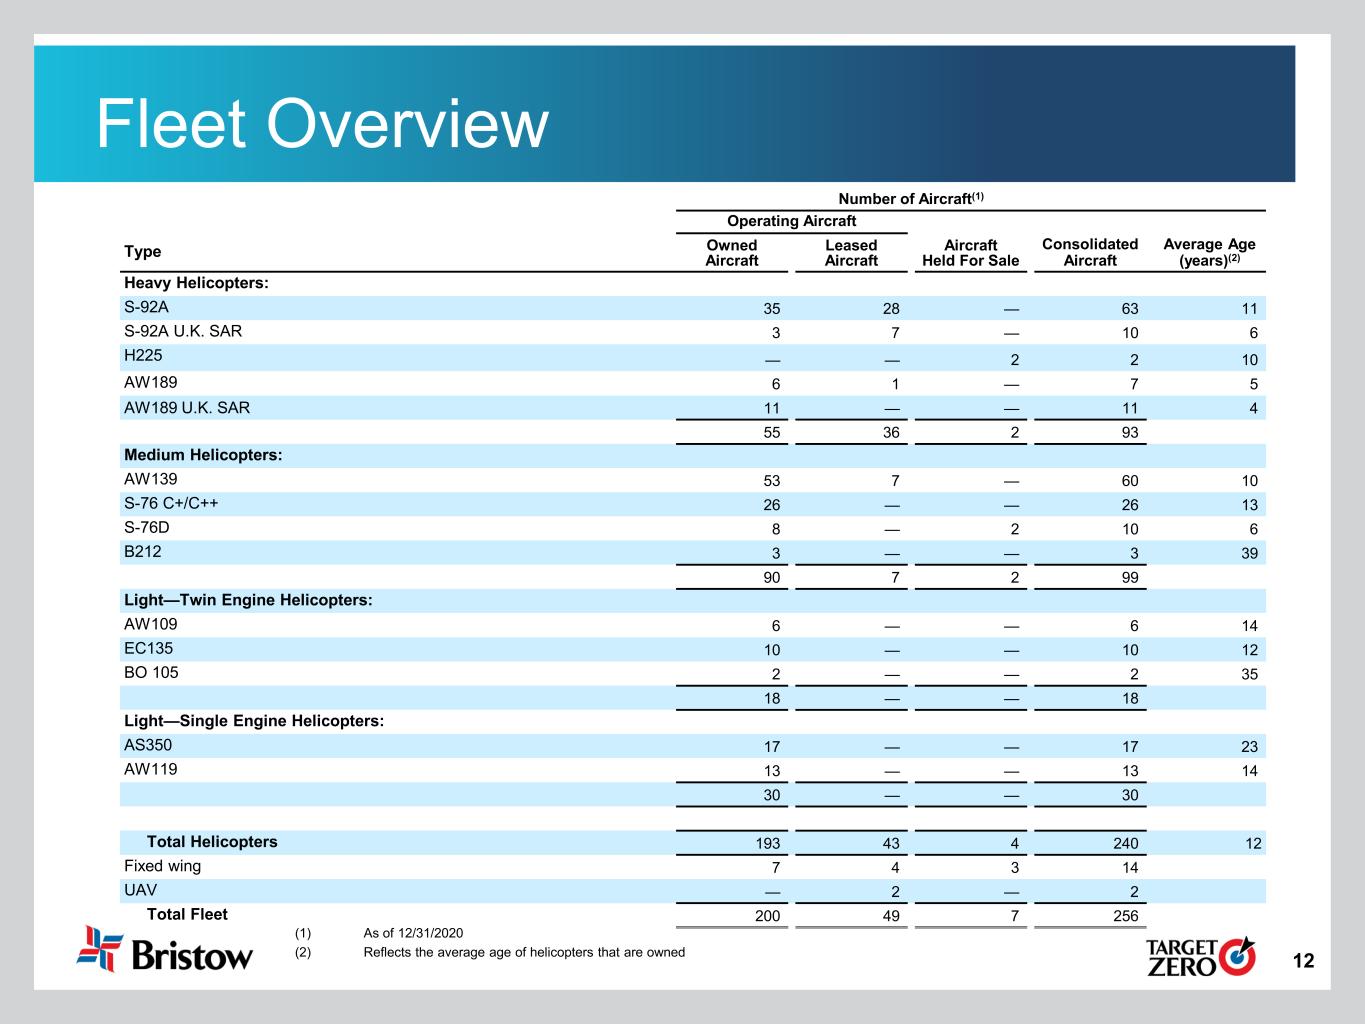
12 Fleet Overview (1) As of 12/31/2020 (2) Reflects the average age of helicopters that are owned Number of Aircraft(1) Operating Aircraft Type OwnedAircraft Leased Aircraft Aircraft Held For Sale Consolidated Aircraft Average Age (years)(2) Heavy Helicopters: S-92A 35 28 — 63 11 S-92A U.K. SAR 3 7 — 10 6 H225 — — 2 2 10 AW189 6 1 — 7 5 AW189 U.K. SAR 11 — — 11 4 55 36 2 93 Medium Helicopters: AW139 53 7 — 60 10 S-76 C+/C++ 26 — — 26 13 S-76D 8 — 2 10 6 B212 3 — — 3 39 90 7 2 99 Light—Twin Engine Helicopters: AW109 6 — — 6 14 EC135 10 — — 10 12 BO 105 2 — — 2 35 18 — — 18 Light—Single Engine Helicopters: AS350 17 — — 17 23 AW119 13 — — 13 14 30 — — 30 Total Helicopters 193 43 4 240 12 Fixed wing 7 4 3 14 UAV — 2 — 2 Total Fleet 200 49 7 256
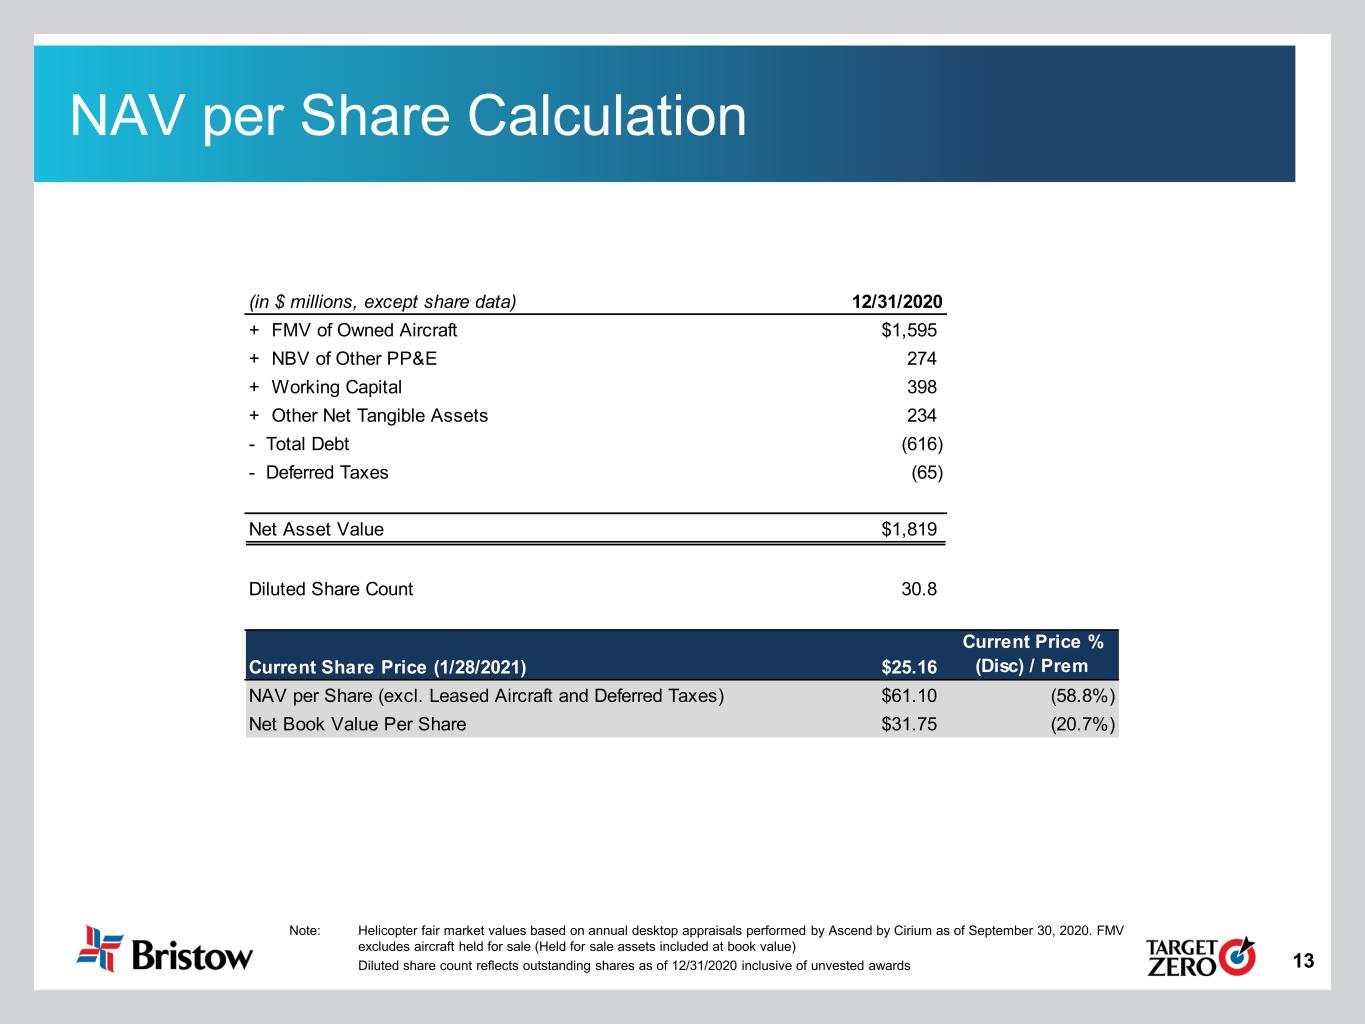
13 NAV per Share Calculation Note: Helicopter fair market values based on annual desktop appraisals performed by Ascend by Cirium as of September 30, 2020. FMV excludes aircraft held for sale (Held for sale assets included at book value) Diluted share count reflects outstanding shares as of 12/31/2020 inclusive of unvested awards (in $ millions, except share data) 12/31/2020 + FMV of Owned Aircraft $1,595 + NBV of Other PP&E 274 + Working Capital 398 + Other Net Tangible Assets 234 - Total Debt (616) - Deferred Taxes (65) Net Asset Value $1,819 Diluted Share Count 30.8 Current Share Price (1/28/2021) $25.16 Current Price % (Disc) / Prem NAV per Share (excl. Leased Aircraft and Deferred Taxes) $61.10 (58.8%) Net Book Value Per Share $31.75 (20.7%)
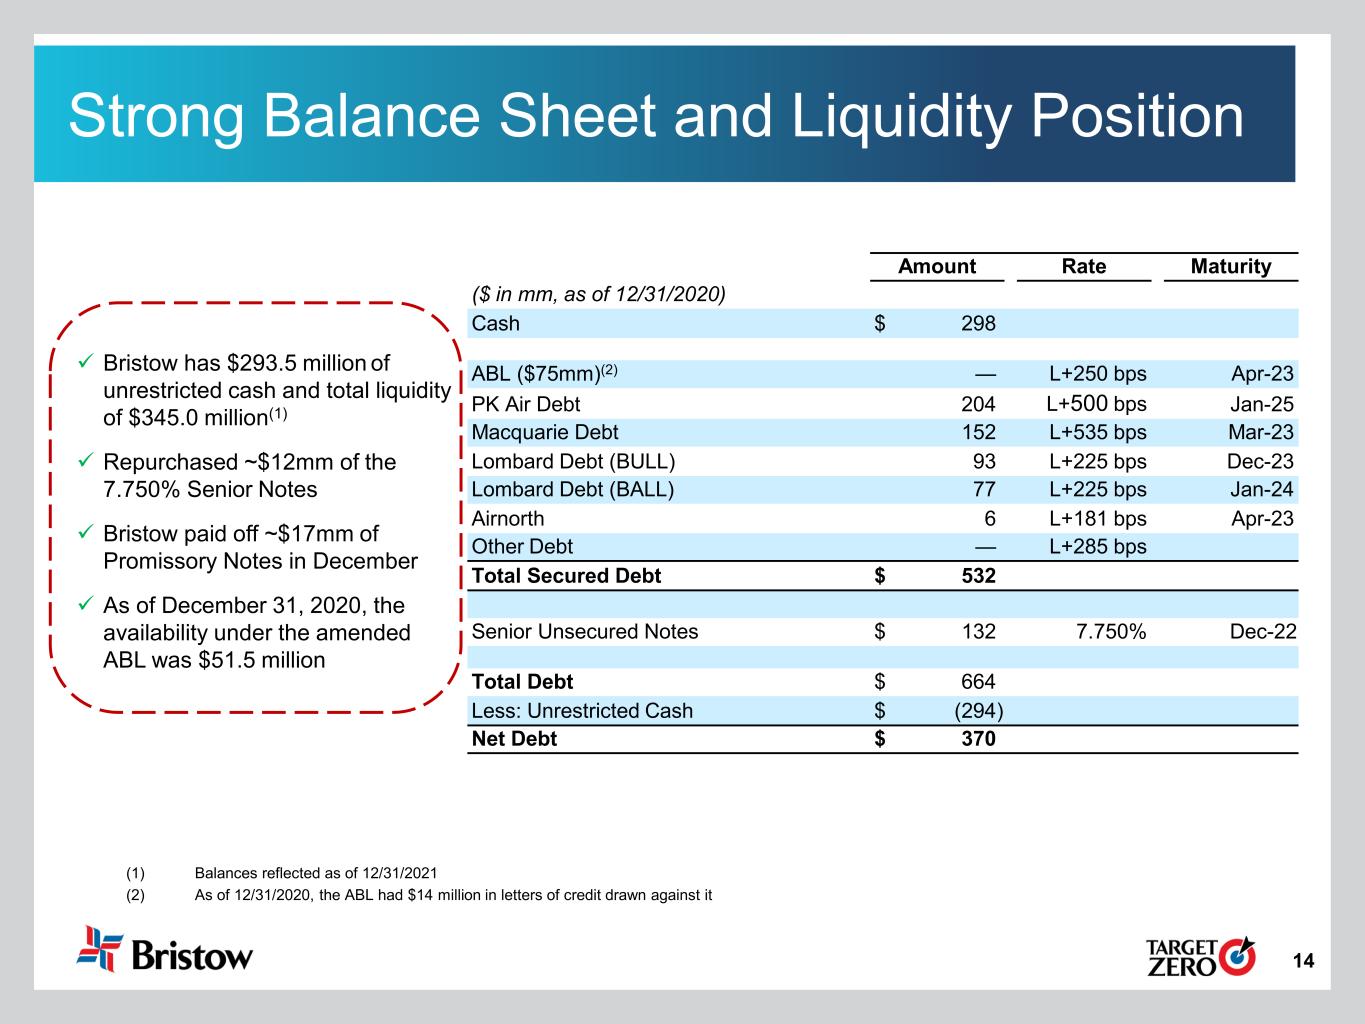
14 Strong Balance Sheet and Liquidity Position Bristow has $293.5 million of unrestricted cash and total liquidity of $345.0 million(1) Repurchased ~$12mm of the 7.750% Senior Notes Bristow paid off ~$17mm of Promissory Notes in December As of December 31, 2020, the availability under the amended ABL was $51.5 million (1) Balances reflected as of 12/31/2021 (2) As of 12/31/2020, the ABL had $14 million in letters of credit drawn against it Amount Rate Maturity ($ in mm, as of 12/31/2020) Cash $ 298 ABL ($75mm)(2) — L+250 bps Apr-23 PK Air Debt 204 L+500 bps Jan-25 Macquarie Debt 152 L+535 bps Mar-23 Lombard Debt (BULL) 93 L+225 bps Dec-23 Lombard Debt (BALL) 77 L+225 bps Jan-24 Airnorth 6 L+181 bps Apr-23 Other Debt — L+285 bps Total Secured Debt $ 532 Senior Unsecured Notes $ 132 7.750% Dec-22 Total Debt $ 664 Less: Unrestricted Cash $ (294) Net Debt $ 370
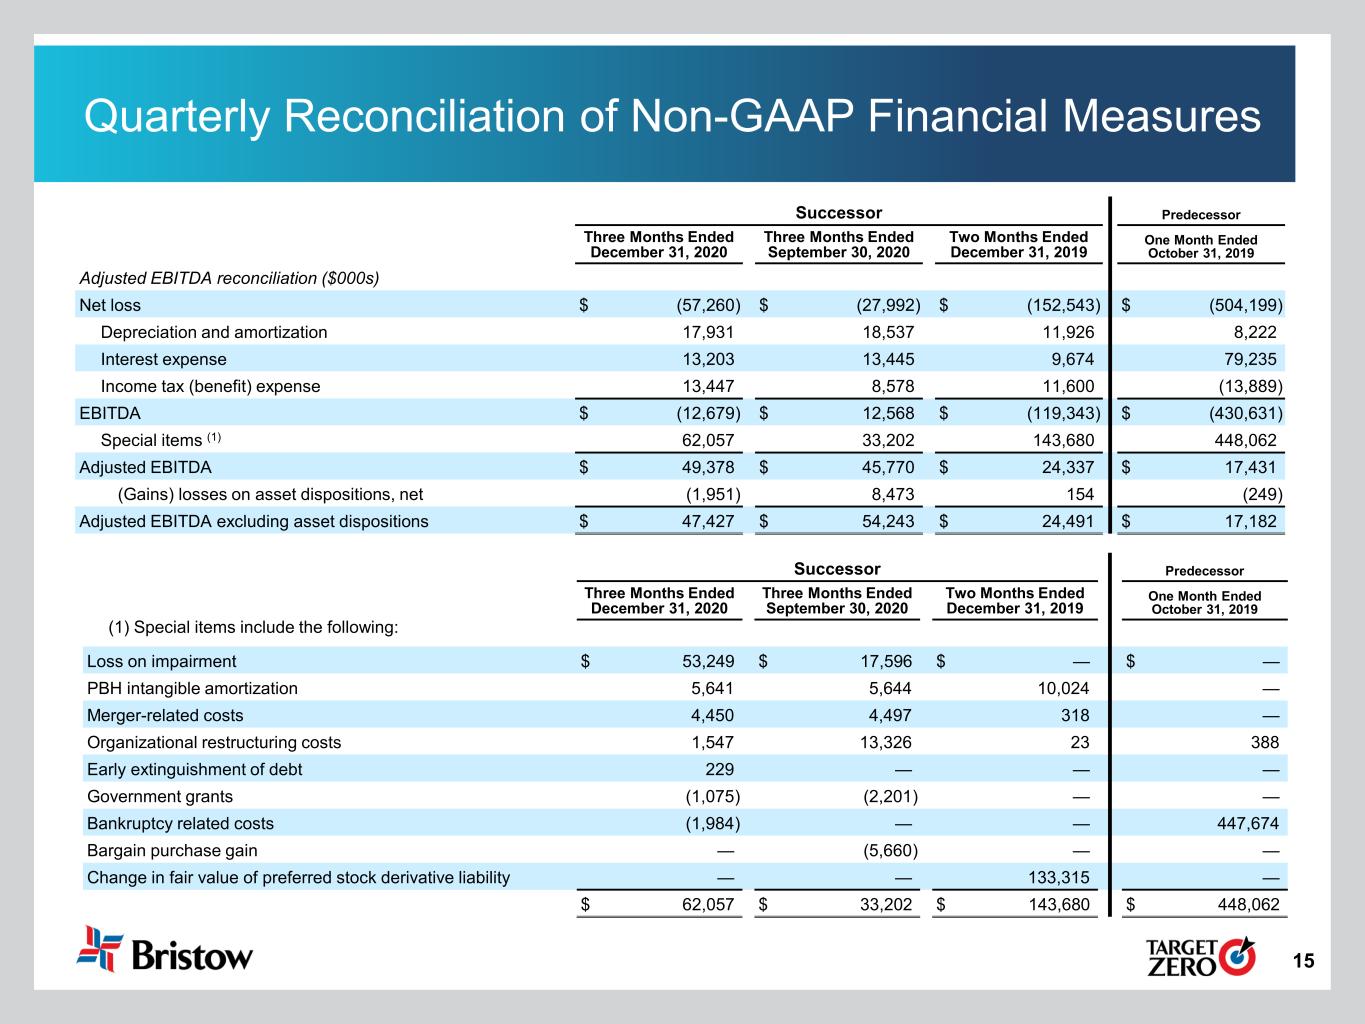
15 Quarterly Reconciliation of Non-GAAP Financial Measures Successor Predecessor Three Months Ended December 31, 2020 Three Months Ended September 30, 2020 Two Months Ended December 31, 2019 One Month Ended October 31, 2019 Adjusted EBITDA reconciliation ($000s) Net loss $ (57,260) $ (27,992) $ (152,543) $ (504,199) Depreciation and amortization 17,931 18,537 11,926 8,222 Interest expense 13,203 13,445 9,674 79,235 Income tax (benefit) expense 13,447 8,578 11,600 (13,889) EBITDA $ (12,679) $ 12,568 $ (119,343) $ (430,631) Special items (1) 62,057 33,202 143,680 448,062 Adjusted EBITDA $ 49,378 $ 45,770 $ 24,337 $ 17,431 (Gains) losses on asset dispositions, net (1,951) 8,473 154 (249) Adjusted EBITDA excluding asset dispositions $ 47,427 $ 54,243 $ 24,491 $ 17,182 Successor Predecessor Three Months Ended December 31, 2020 Three Months Ended September 30, 2020 Two Months Ended December 31, 2019 One Month Ended October 31, 2019 Loss on impairment $ 53,249 $ 17,596 $ — $ — PBH intangible amortization 5,641 5,644 10,024 — Merger-related costs 4,450 4,497 318 — Organizational restructuring costs 1,547 13,326 23 388 Early extinguishment of debt 229 — — — Government grants (1,075) (2,201) — — Bankruptcy related costs (1,984) — — 447,674 Bargain purchase gain — (5,660) — — Change in fair value of preferred stock derivative liability — — 133,315 — $ 62,057 $ 33,202 $ 143,680 $ 448,062 (1) Special items include the following:
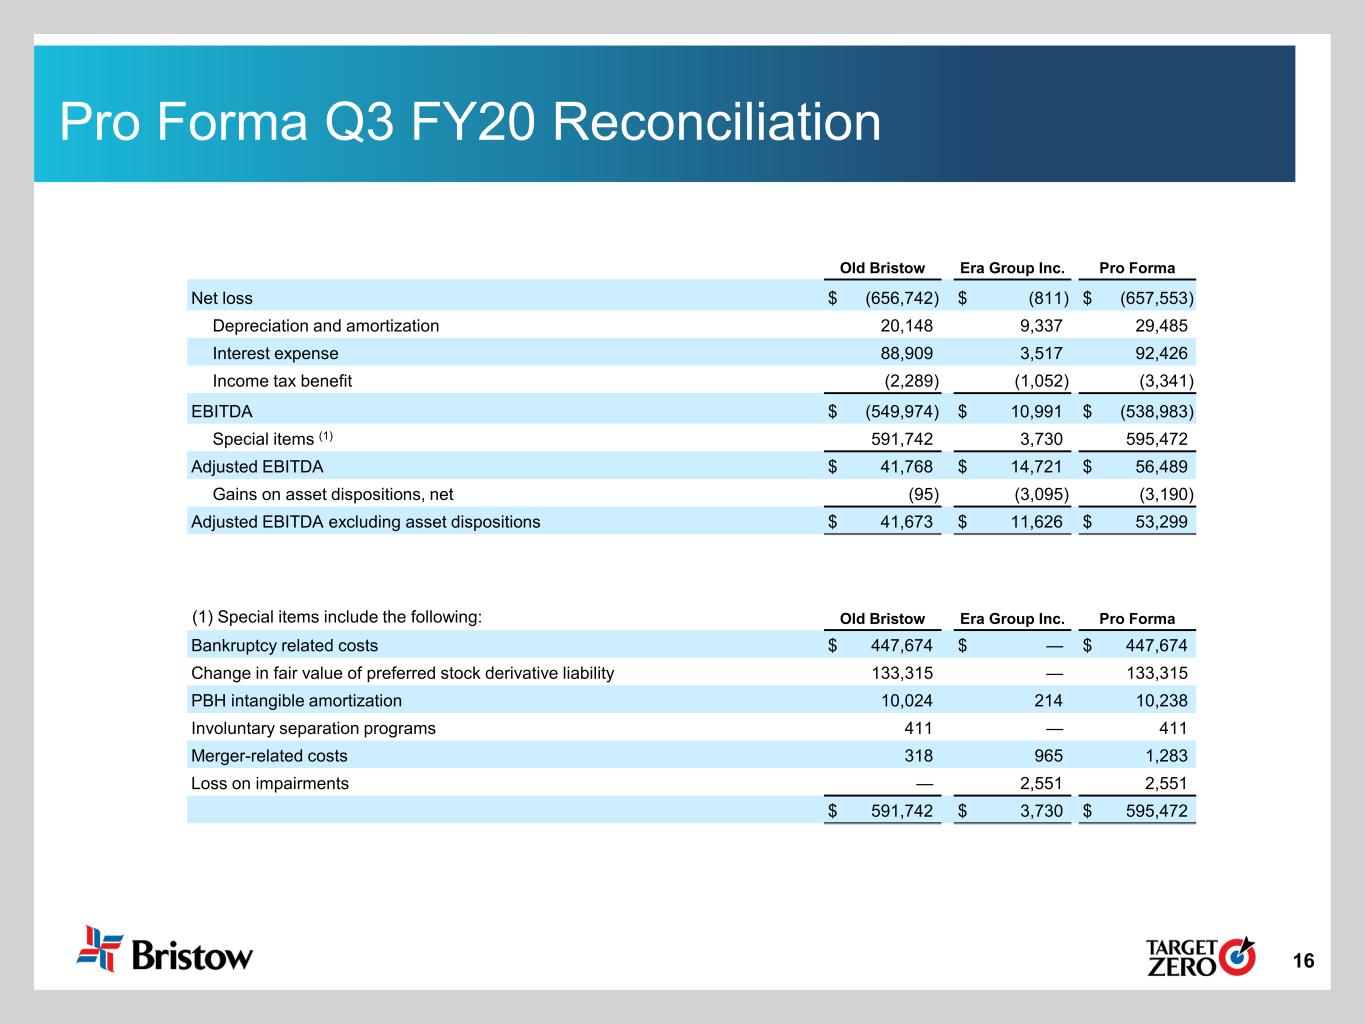
16 Old Bristow Era Group Inc. Pro Forma Bankruptcy related costs $ 447,674 $ — $ 447,674 Change in fair value of preferred stock derivative liability 133,315 — 133,315 PBH intangible amortization 10,024 214 10,238 Involuntary separation programs 411 — 411 Merger-related costs 318 965 1,283 Loss on impairments — 2,551 2,551 $ 591,742 $ 3,730 $ 595,472 Pro Forma Q3 FY20 Reconciliation (1) Special items include the following: Old Bristow Era Group Inc. Pro Forma Net loss $ (656,742) $ (811) $ (657,553) Depreciation and amortization 20,148 9,337 29,485 Interest expense 88,909 3,517 92,426 Income tax benefit (2,289) (1,052) (3,341) EBITDA $ (549,974) $ 10,991 $ (538,983) Special items (1) 591,742 3,730 595,472 Adjusted EBITDA $ 41,768 $ 14,721 $ 56,489 Gains on asset dispositions, net (95) (3,095) (3,190) Adjusted EBITDA excluding asset dispositions $ 41,673 $ 11,626 $ 53,299
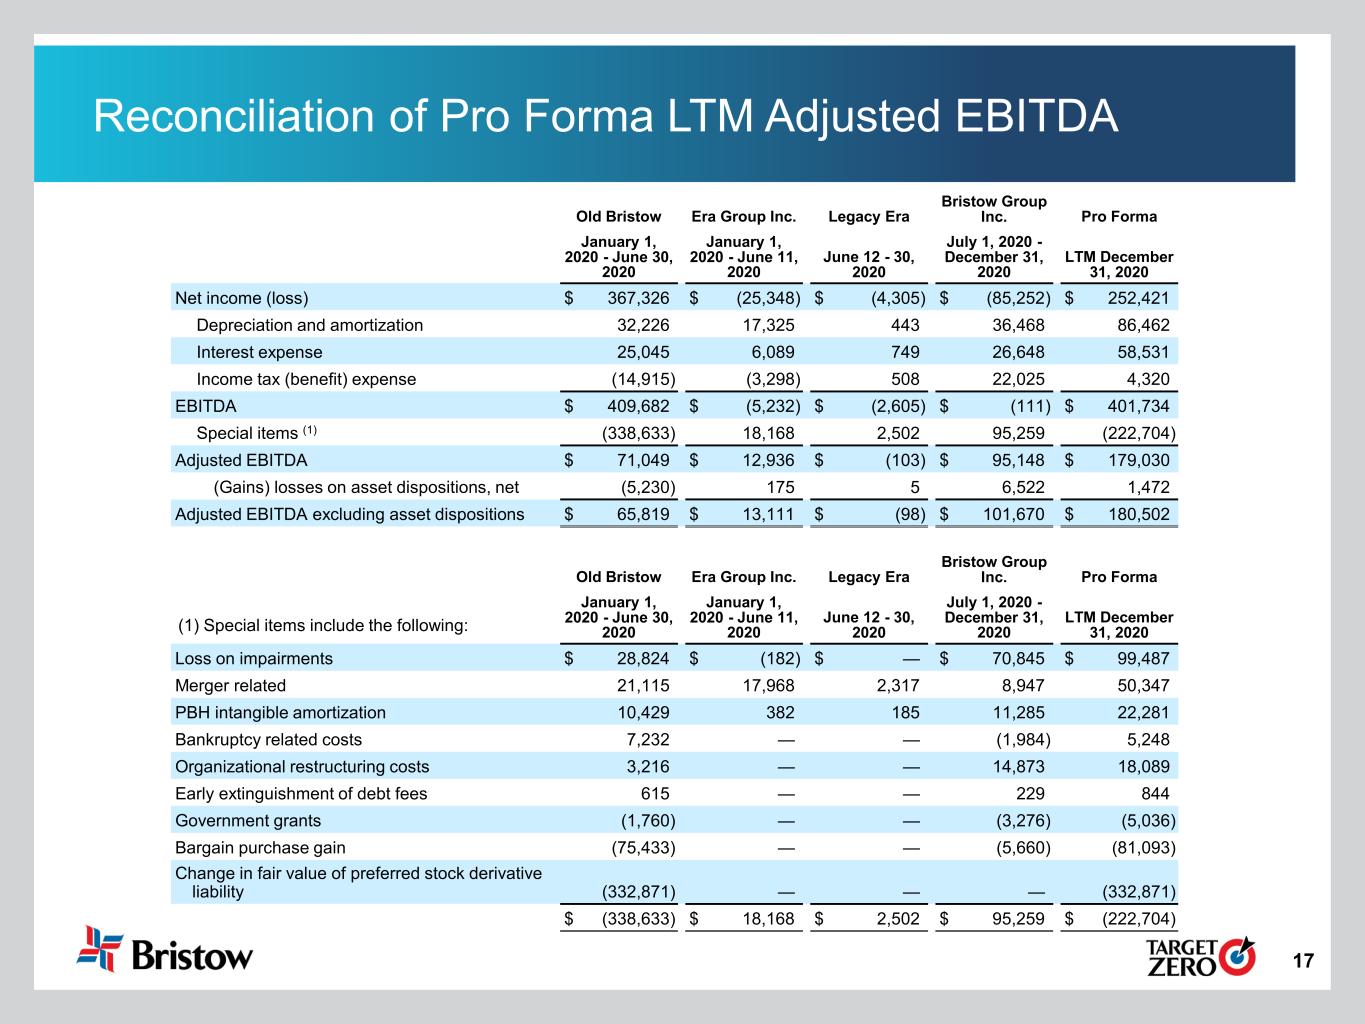
17 Old Bristow Era Group Inc. Legacy Era Bristow Group Inc. Pro Forma January 1, 2020 - June 30, 2020 January 1, 2020 - June 11, 2020 June 12 - 30, 2020 July 1, 2020 - December 31, 2020 LTM December 31, 2020 Loss on impairments $ 28,824 $ (182) $ — $ 70,845 $ 99,487 Merger related 21,115 17,968 2,317 8,947 50,347 PBH intangible amortization 10,429 382 185 11,285 22,281 Bankruptcy related costs 7,232 — — (1,984) 5,248 Organizational restructuring costs 3,216 — — 14,873 18,089 Early extinguishment of debt fees 615 — — 229 844 Government grants (1,760) — — (3,276) (5,036) Bargain purchase gain (75,433) — — (5,660) (81,093) Change in fair value of preferred stock derivative liability (332,871) — — — (332,871) $ (338,633) $ 18,168 $ 2,502 $ 95,259 $ (222,704) Reconciliation of Pro Forma LTM Adjusted EBITDA (1) Special items include the following: Old Bristow Era Group Inc. Legacy Era Bristow Group Inc. Pro Forma January 1, 2020 - June 30, 2020 January 1, 2020 - June 11, 2020 June 12 - 30, 2020 July 1, 2020 - December 31, 2020 LTM December 31, 2020 Net income (loss) $ 367,326 $ (25,348) $ (4,305) $ (85,252) $ 252,421 Depreciation and amortization 32,226 17,325 443 36,468 86,462 Interest expense 25,045 6,089 749 26,648 58,531 Income tax (benefit) expense (14,915) (3,298) 508 22,025 4,320 EBITDA $ 409,682 $ (5,232) $ (2,605) $ (111) $ 401,734 Special items (1) (338,633) 18,168 2,502 95,259 (222,704) Adjusted EBITDA $ 71,049 $ 12,936 $ (103) $ 95,148 $ 179,030 (Gains) losses on asset dispositions, net (5,230) 175 5 6,522 1,472 Adjusted EBITDA excluding asset dispositions $ 65,819 $ 13,111 $ (98) $ 101,670 $ 180,502
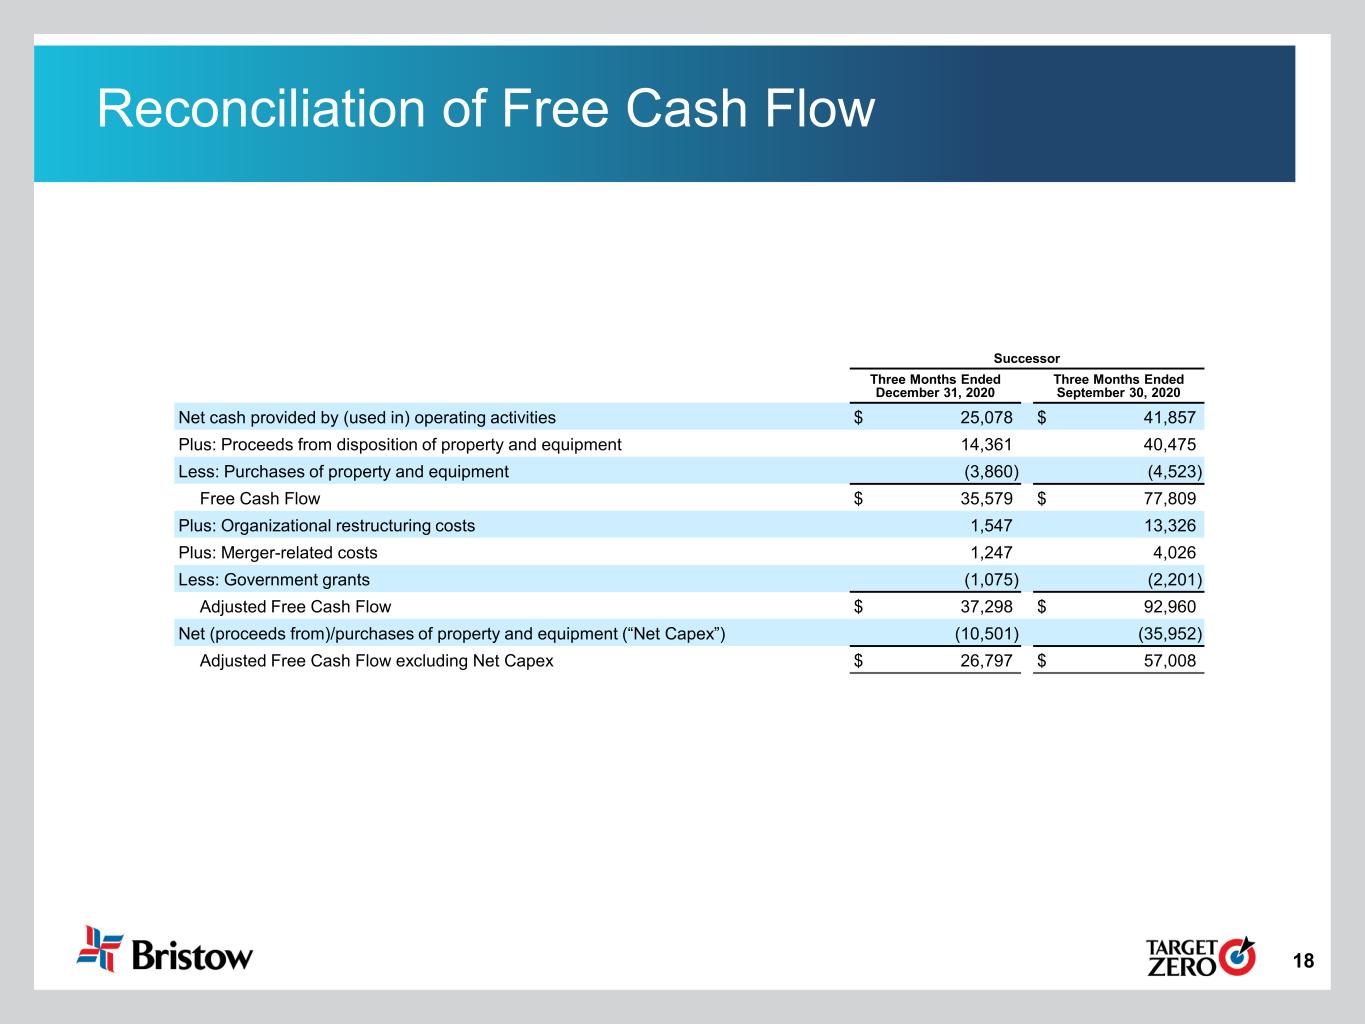
18 Reconciliation of Free Cash Flow Successor Three Months Ended December 31, 2020 Three Months Ended September 30, 2020 Net cash provided by (used in) operating activities $ 25,078 $ 41,857 Plus: Proceeds from disposition of property and equipment 14,361 40,475 Less: Purchases of property and equipment (3,860) (4,523) Free Cash Flow $ 35,579 $ 77,809 Plus: Organizational restructuring costs 1,547 13,326 Plus: Merger-related costs 1,247 4,026 Less: Government grants (1,075) (2,201) Adjusted Free Cash Flow $ 37,298 $ 92,960 Net (proceeds from)/purchases of property and equipment (“Net Capex”) (10,501) (35,952) Adjusted Free Cash Flow excluding Net Capex $ 26,797 $ 57,008
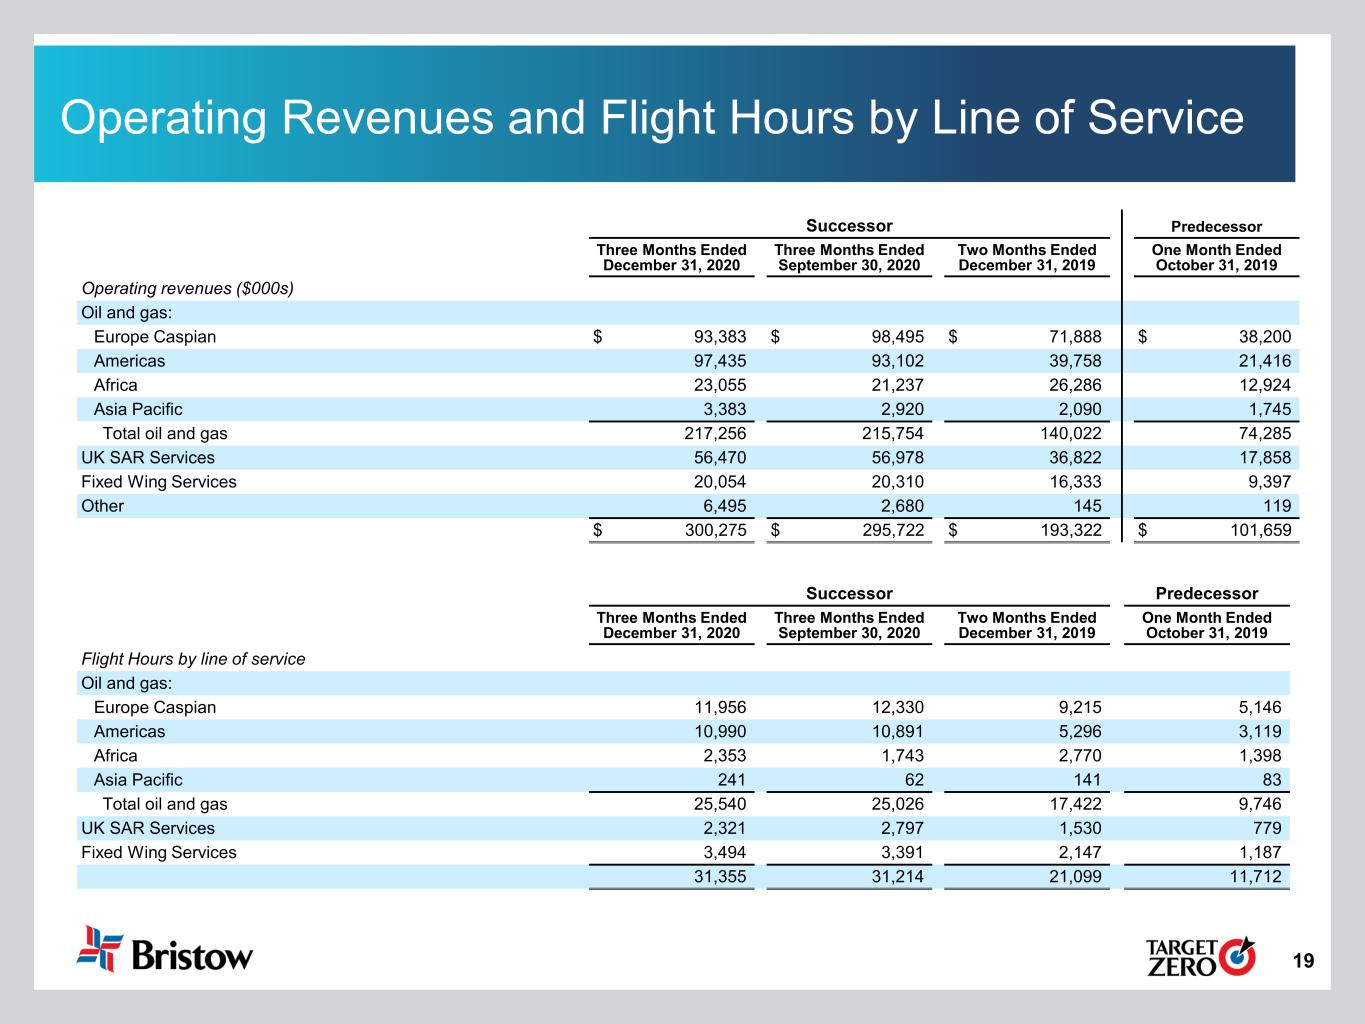
19 Operating Revenues and Flight Hours by Line of Service Successor Predecessor Three Months Ended December 31, 2020 Three Months Ended September 30, 2020 Two Months Ended December 31, 2019 One Month Ended October 31, 2019 Operating revenues ($000s) Oil and gas: Europe Caspian $ 93,383 $ 98,495 $ 71,888 $ 38,200 Americas 97,435 93,102 39,758 21,416 Africa 23,055 21,237 26,286 12,924 Asia Pacific 3,383 2,920 2,090 1,745 Total oil and gas 217,256 215,754 140,022 74,285 UK SAR Services 56,470 56,978 36,822 17,858 Fixed Wing Services 20,054 20,310 16,333 9,397 Other 6,495 2,680 145 119 $ 300,275 $ 295,722 $ 193,322 $ 101,659 Successor Predecessor Three Months Ended December 31, 2020 Three Months Ended September 30, 2020 Two Months Ended December 31, 2019 One Month Ended October 31, 2019 Flight Hours by line of service Oil and gas: Europe Caspian 11,956 12,330 9,215 5,146 Americas 10,990 10,891 5,296 3,119 Africa 2,353 1,743 2,770 1,398 Asia Pacific 241 62 141 83 Total oil and gas 25,540 25,026 17,422 9,746 UK SAR Services 2,321 2,797 1,530 779 Fixed Wing Services 3,494 3,391 2,147 1,187 31,355 31,214 21,099 11,712
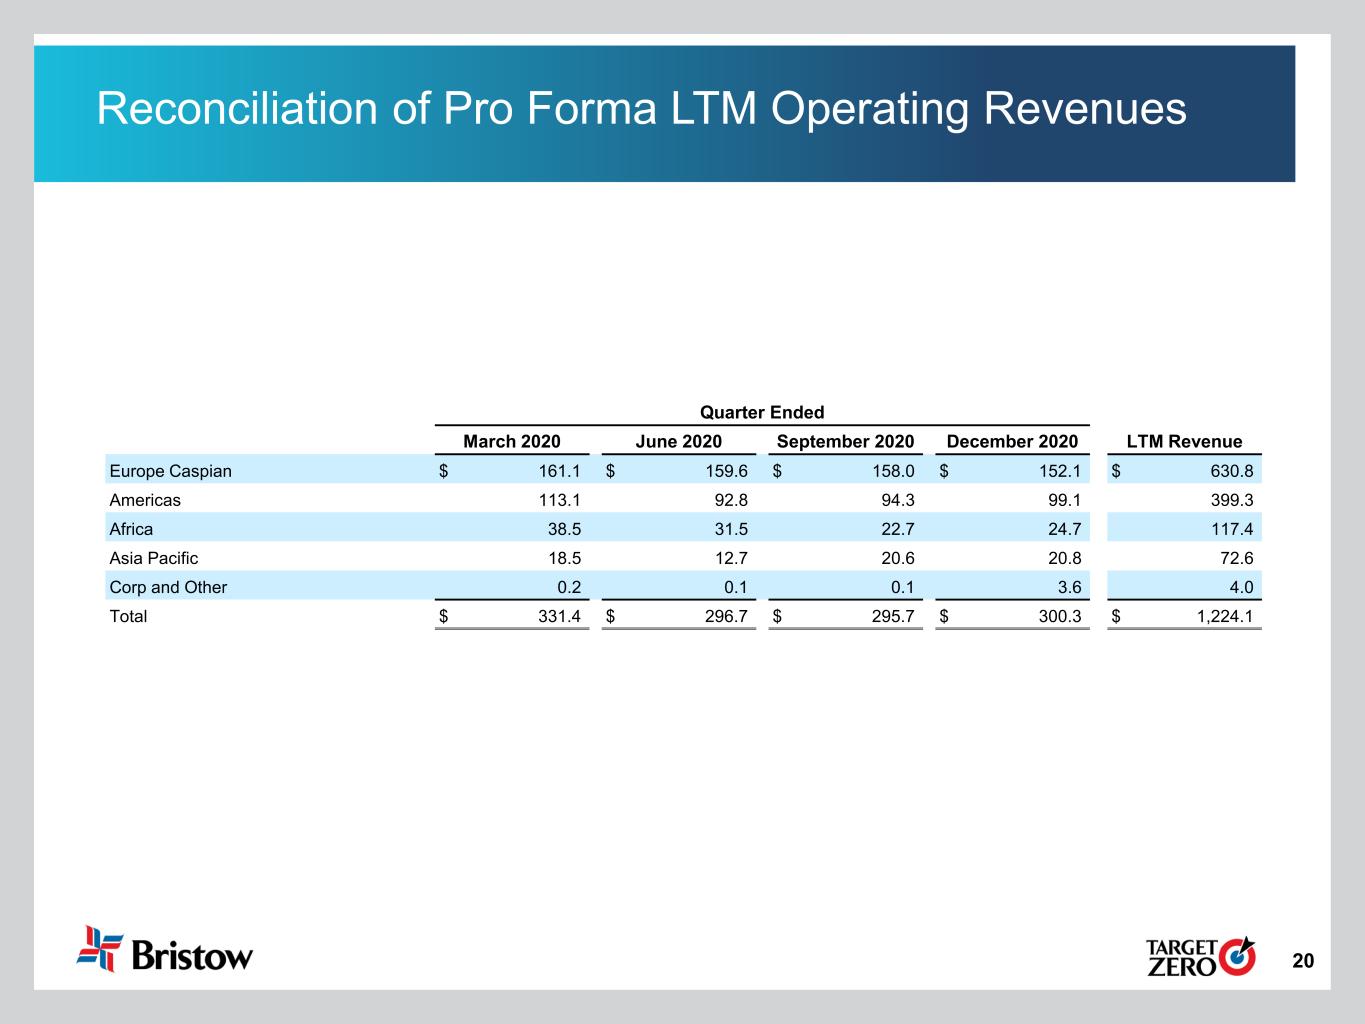
20 Reconciliation of Pro Forma LTM Operating Revenues Quarter Ended March 2020 June 2020 September 2020 December 2020 LTM Revenue Europe Caspian $ 161.1 $ 159.6 $ 158.0 $ 152.1 $ 630.8 Americas 113.1 92.8 94.3 99.1 399.3 Africa 38.5 31.5 22.7 24.7 117.4 Asia Pacific 18.5 12.7 20.6 20.8 72.6 Corp and Other 0.2 0.1 0.1 3.6 4.0 Total $ 331.4 $ 296.7 $ 295.7 $ 300.3 $ 1,224.1