
VVX 8-K
V2X, Inc. (VVX)
8-K
2021-08-10
For: 2021-08-10
View Original
Added on
April 07, 2026
UNITED STATES
SECURITIES AND EXCHANGE COMMISSION
Washington, D.C. 20549
FORM 8-K
CURRENT REPORT
Pursuant to Section 13 or 15(d) of
the Securities Exchange Act of 1934
Date of Report (Date of earliest event reported): August 10, 2021
(Exact name of Registrant as specified in its charter)
(State or other jurisdiction of incorporation) | (Commission File Number) | (I.R.S. Employer Identification No.) | ||||||
(Address of principal executive offices) (Zip Code)
Registrant's telephone number, including area code: (719 ) 591-3600
Not Applicable
(Former name or former address, if changed since last report)
Securities Registered Under Section 12(b) of the Act:
Title of each class | Trading symbol(s) | Name of each exchange on which registered | ||||||
Check the appropriate box below if the Form 8-K filing is intended to simultaneously satisfy the filing obligation of the registrant under any of the following provisions:
Indicate by check mark whether the registrant is an emerging growth company as defined in Rule 405 of the Securities Act of 1933 (§230.405 of this chapter) or Rule 12b-2 of the Securities Exchange Act of 1934 (§240.12b-2 of this chapter).
Emerging growth company ☐
If an emerging growth company, indicate by check mark if the registrant has elected not to use the extended transition period for complying with any new or revised financial accounting standards provided pursuant to Section 13(a) of the Exchange Act. ☐
ITEM 2.02 Results of Operations and Financial Condition.
Attached hereto as Exhibit 99.1 and incorporated by reference herein is a press release issued by Vectrus, Inc. (the “Company”) on August 10, 2021 that includes financial information for the Company for the second quarter of 2021 and updated guidance for fiscal 2021. This information shall not be deemed filed for purposes of Section 18 of the Securities Exchange Act of 1934, as amended (the “Exchange Act”) or incorporated by reference into any filing under the Securities Act of 1933, as amended (the “Securities Act”), or the Exchange Act, except as shall be expressly set forth by specific reference in such filing.
ITEM 7.01 Regulation FD Disclosure.
Mr. Charles Prow, President and Chief Executive Officer, and Ms. Susan Lynch, Senior Vice President and Chief Financial Officer, will present the financial information for the Company for the second quarter of 2021 and updated guidance for fiscal 2021 on August 10, 2021. A copy of the presentation is attached hereto and incorporated by reference herein as Exhibit 99.2. This information is furnished pursuant to Item 7.01 Regulation FD Disclosure and shall not be deemed filed for purposes of Section 18 of the Exchange Act or incorporated by reference into any filing under the Securities Act or the Exchange Act, except as shall be expressly set forth by specific reference in such filing.
ITEM 9.01 Financial Statements and Exhibits
(d) Exhibits.
| Exhibit No. | Description | |||||||
SIGNATURES
Pursuant to the requirements of the Securities Exchange Act of 1934, the registrant has duly caused this report to be signed on its behalf by the undersigned hereunto duly authorized.
| Date: August 10, 2021 | VECTRUS, INC. | |||||||
| By: | /s/ Courtney A. Schoch | |||||||
| Its: | Deputy General Counsel, Corporate and Corporate Secretary | |||||||
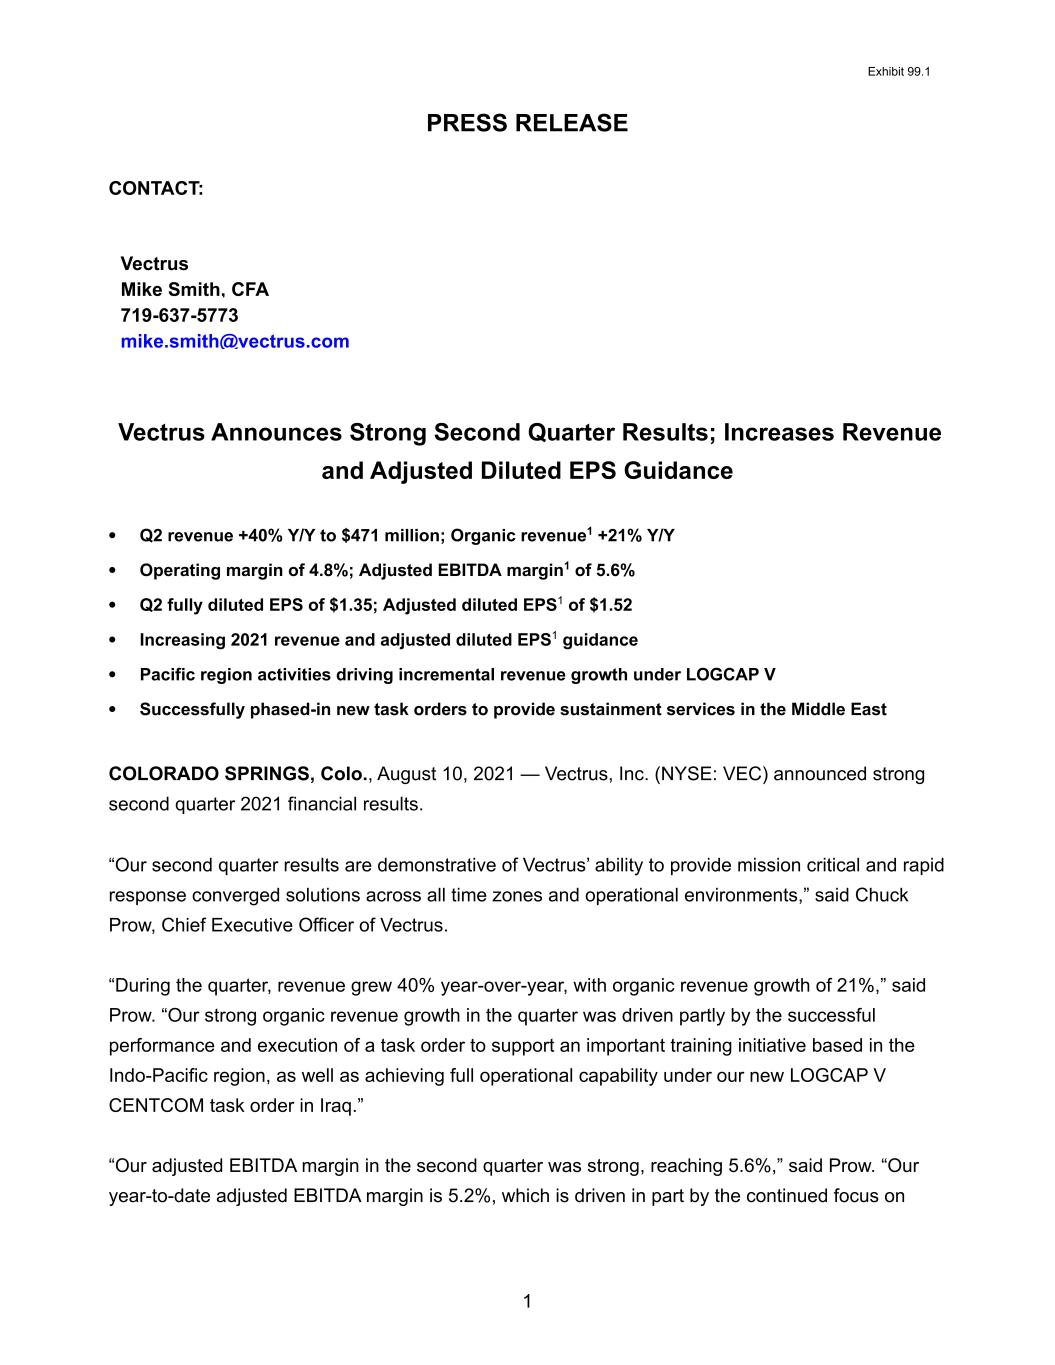
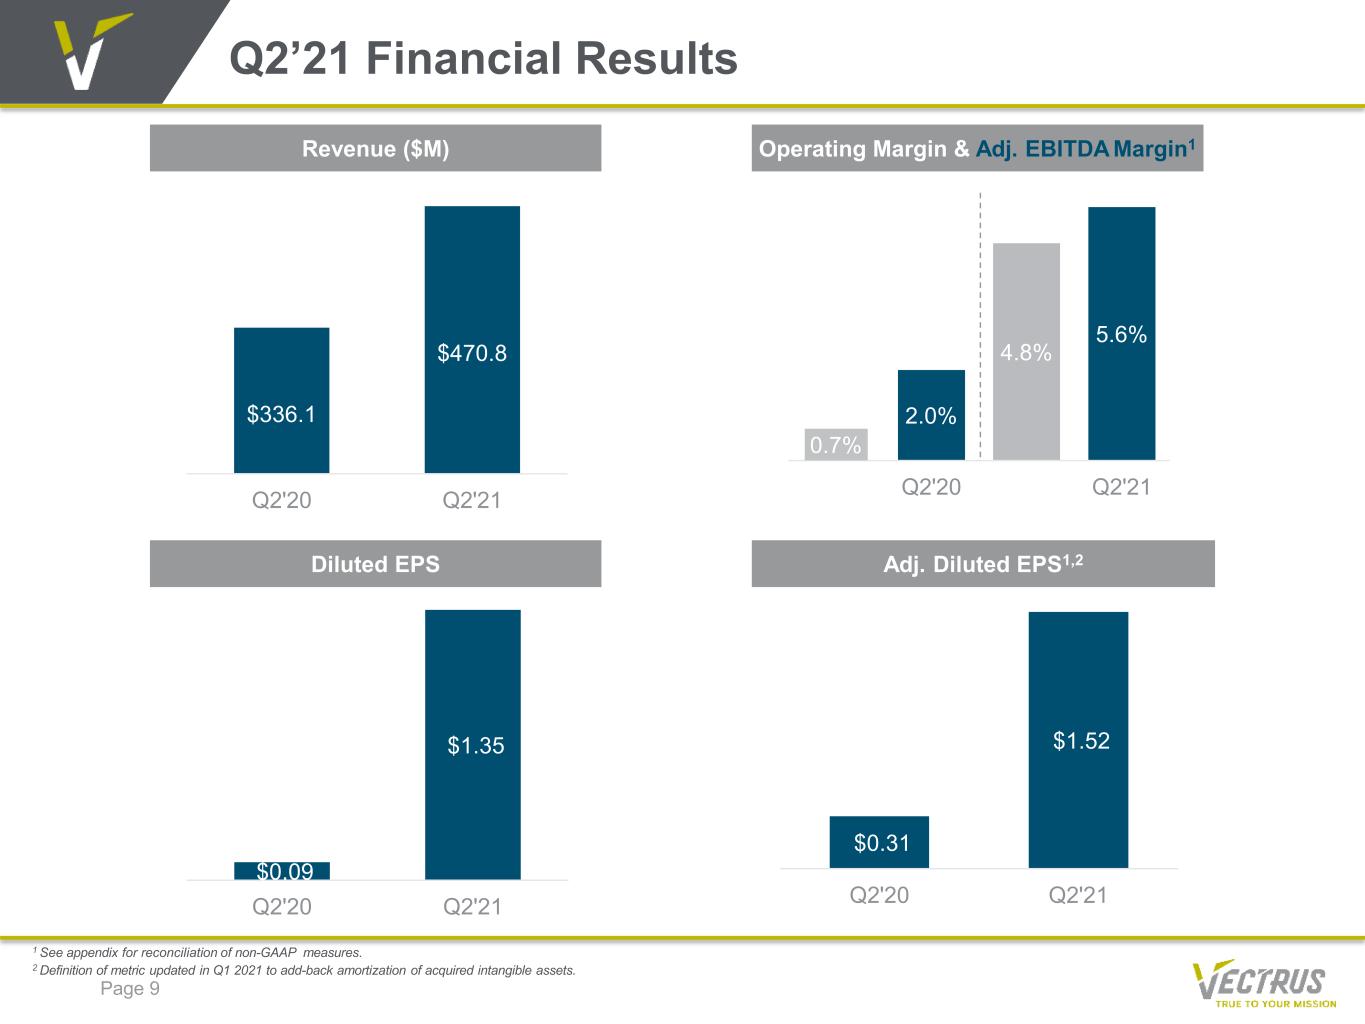
Exhibit 99.1 1 PRESS RELEASE CONTACT: Vectrus Mike Smith, CFA 719-637-5773 [email protected] Vectrus Announces Strong Second Quarter Results; Increases Revenue and Adjusted Diluted EPS Guidance • Q2 revenue +40% Y/Y to $471 million; Organic revenue1 +21% Y/Y • Operating margin of 4.8%; Adjusted EBITDA margin1 of 5.6% • Q2 fully diluted EPS of $1.35; Adjusted diluted EPS1 of $1.52 • Increasing 2021 revenue and adjusted diluted EPS1 guidance • Pacific region activities driving incremental revenue growth under LOGCAP V • Successfully phased-in new task orders to provide sustainment services in the Middle East COLORADO SPRINGS, Colo., August 10, 2021 — Vectrus, Inc. (NYSE: VEC) announced strong second quarter 2021 financial results. “Our second quarter results are demonstrative of Vectrus’ ability to provide mission critical and rapid response converged solutions across all time zones and operational environments,” said Chuck Prow, Chief Executive Officer of Vectrus. “During the quarter, revenue grew 40% year-over-year, with organic revenue growth of 21%,” said Prow. “Our strong organic revenue growth in the quarter was driven partly by the successful performance and execution of a task order to support an important training initiative based in the Indo-Pacific region, as well as achieving full operational capability under our new LOGCAP V CENTCOM task order in Iraq.” “Our adjusted EBITDA margin in the second quarter was strong, reaching 5.6%,” said Prow. “Our year-to-date adjusted EBITDA margin is 5.2%, which is driven in part by the continued focus on
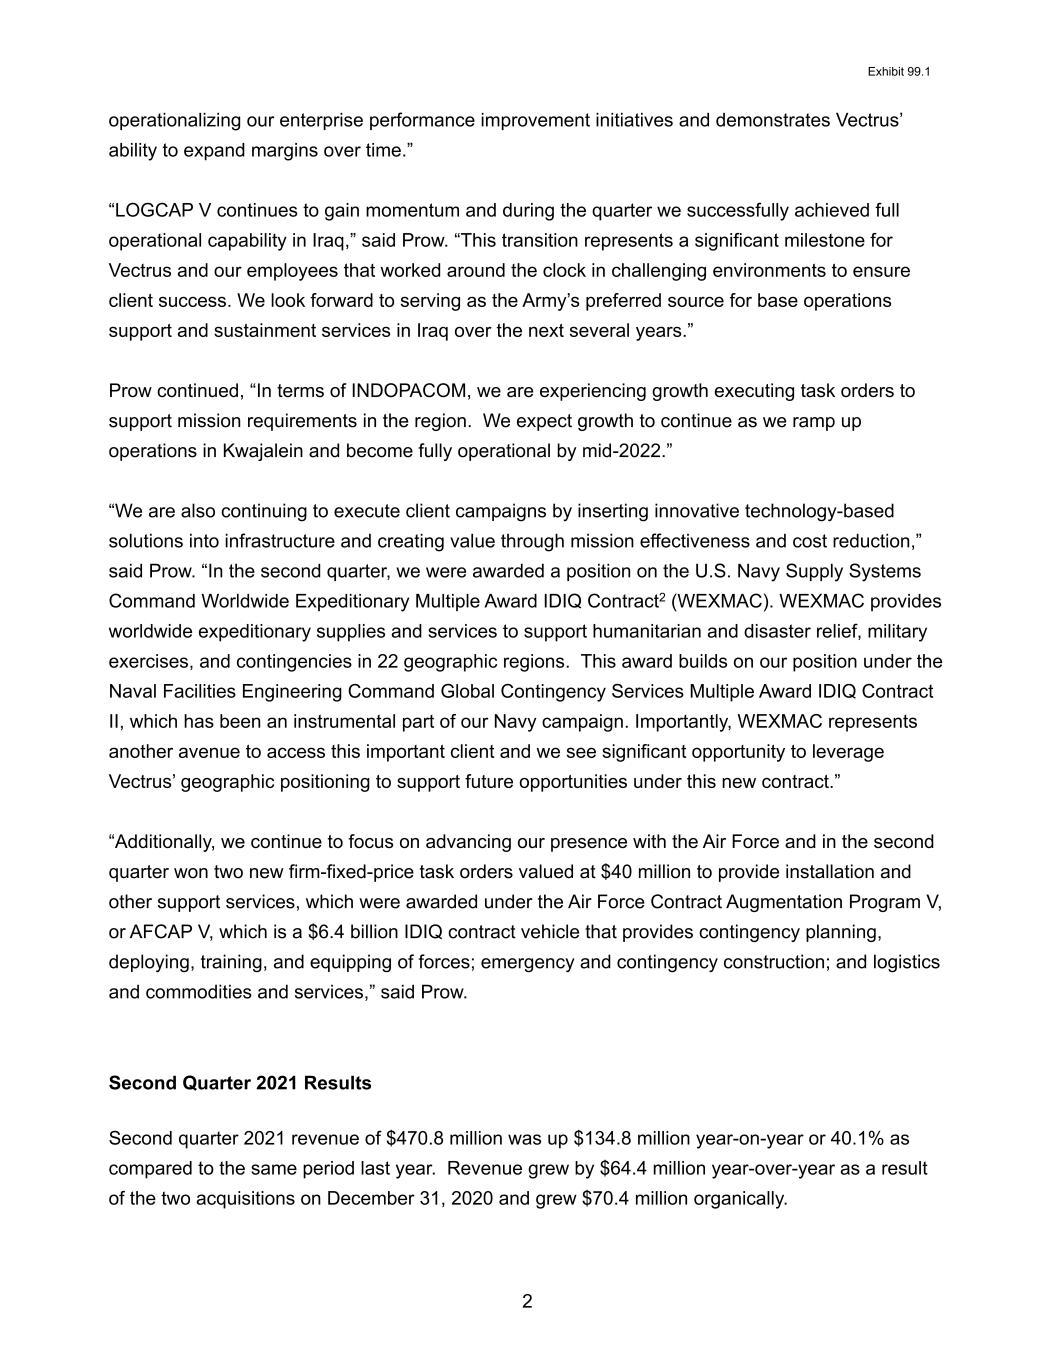
Exhibit 99.1 2 operationalizing our enterprise performance improvement initiatives and demonstrates Vectrus’ ability to expand margins over time.” “LOGCAP V continues to gain momentum and during the quarter we successfully achieved full operational capability in Iraq,” said Prow. “This transition represents a significant milestone for Vectrus and our employees that worked around the clock in challenging environments to ensure client success. We look forward to serving as the Army’s preferred source for base operations support and sustainment services in Iraq over the next several years.” Prow continued, “In terms of INDOPACOM, we are experiencing growth executing task orders to support mission requirements in the region. We expect growth to continue as we ramp up operations in Kwajalein and become fully operational by mid-2022.” “We are also continuing to execute client campaigns by inserting innovative technology-based solutions into infrastructure and creating value through mission effectiveness and cost reduction,” said Prow. “In the second quarter, we were awarded a position on the U.S. Navy Supply Systems Command Worldwide Expeditionary Multiple Award IDIQ Contract2 (WEXMAC). WEXMAC provides worldwide expeditionary supplies and services to support humanitarian and disaster relief, military exercises, and contingencies in 22 geographic regions. This award builds on our position under the Naval Facilities Engineering Command Global Contingency Services Multiple Award IDIQ Contract II, which has been an instrumental part of our Navy campaign. Importantly, WEXMAC represents another avenue to access this important client and we see significant opportunity to leverage Vectrus’ geographic positioning to support future opportunities under this new contract.” “Additionally, we continue to focus on advancing our presence with the Air Force and in the second quarter won two new firm-fixed-price task orders valued at $40 million to provide installation and other support services, which were awarded under the Air Force Contract Augmentation Program V, or AFCAP V, which is a $6.4 billion IDIQ contract vehicle that provides contingency planning, deploying, training, and equipping of forces; emergency and contingency construction; and logistics and commodities and services,” said Prow. Second Quarter 2021 Results Second quarter 2021 revenue of $470.8 million was up $134.8 million year-on-year or 40.1% as compared to the same period last year. Revenue grew by $64.4 million year-over-year as a result of the two acquisitions on December 31, 2020 and grew $70.4 million organically.
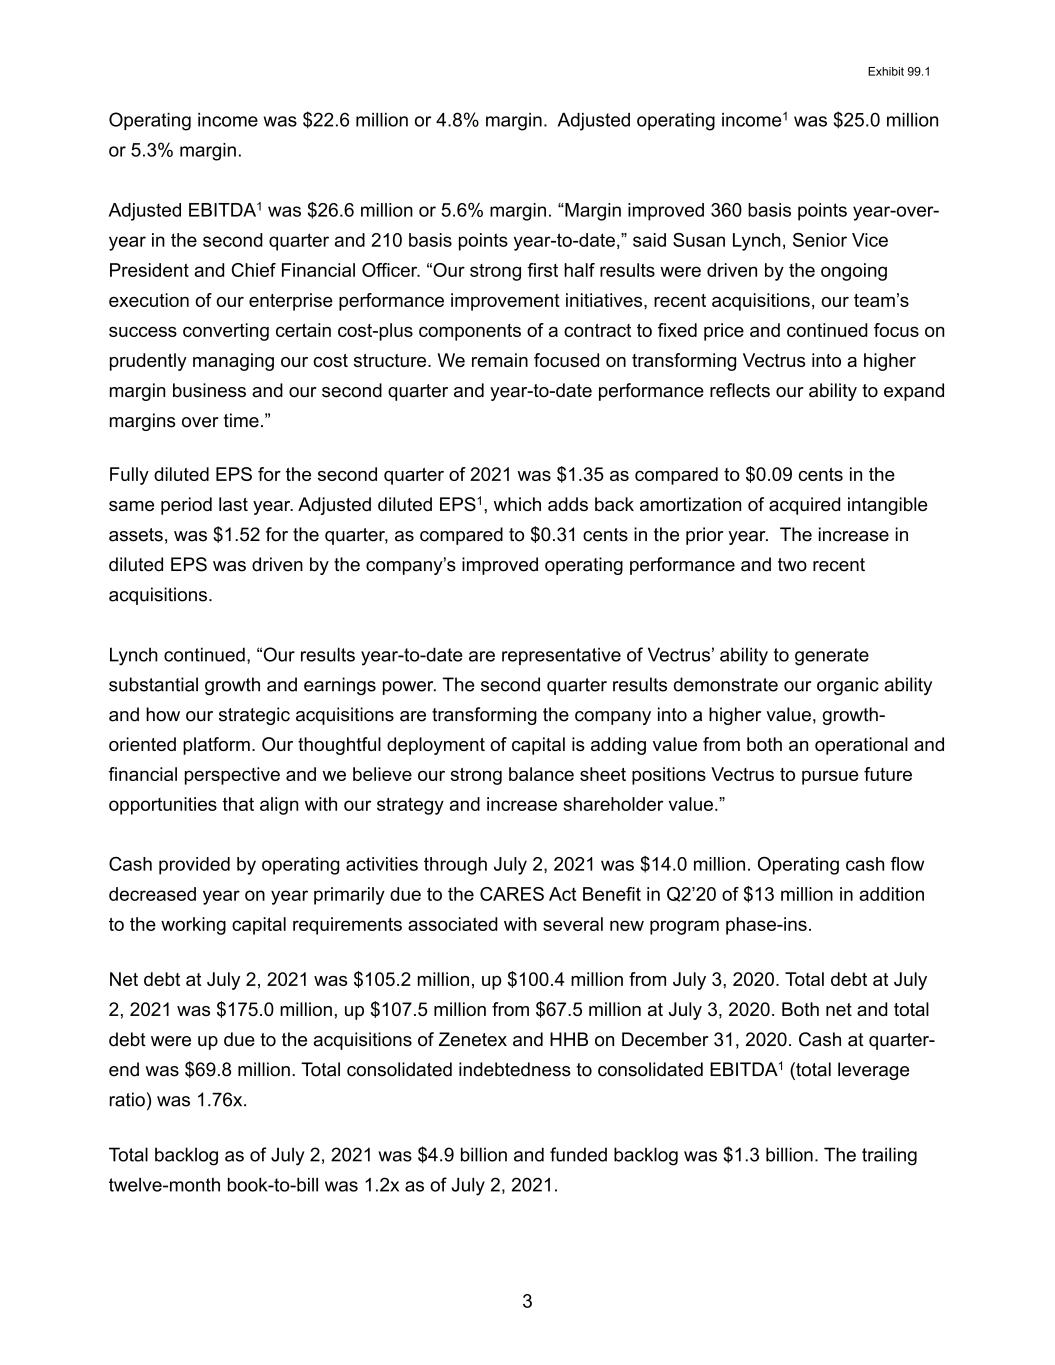
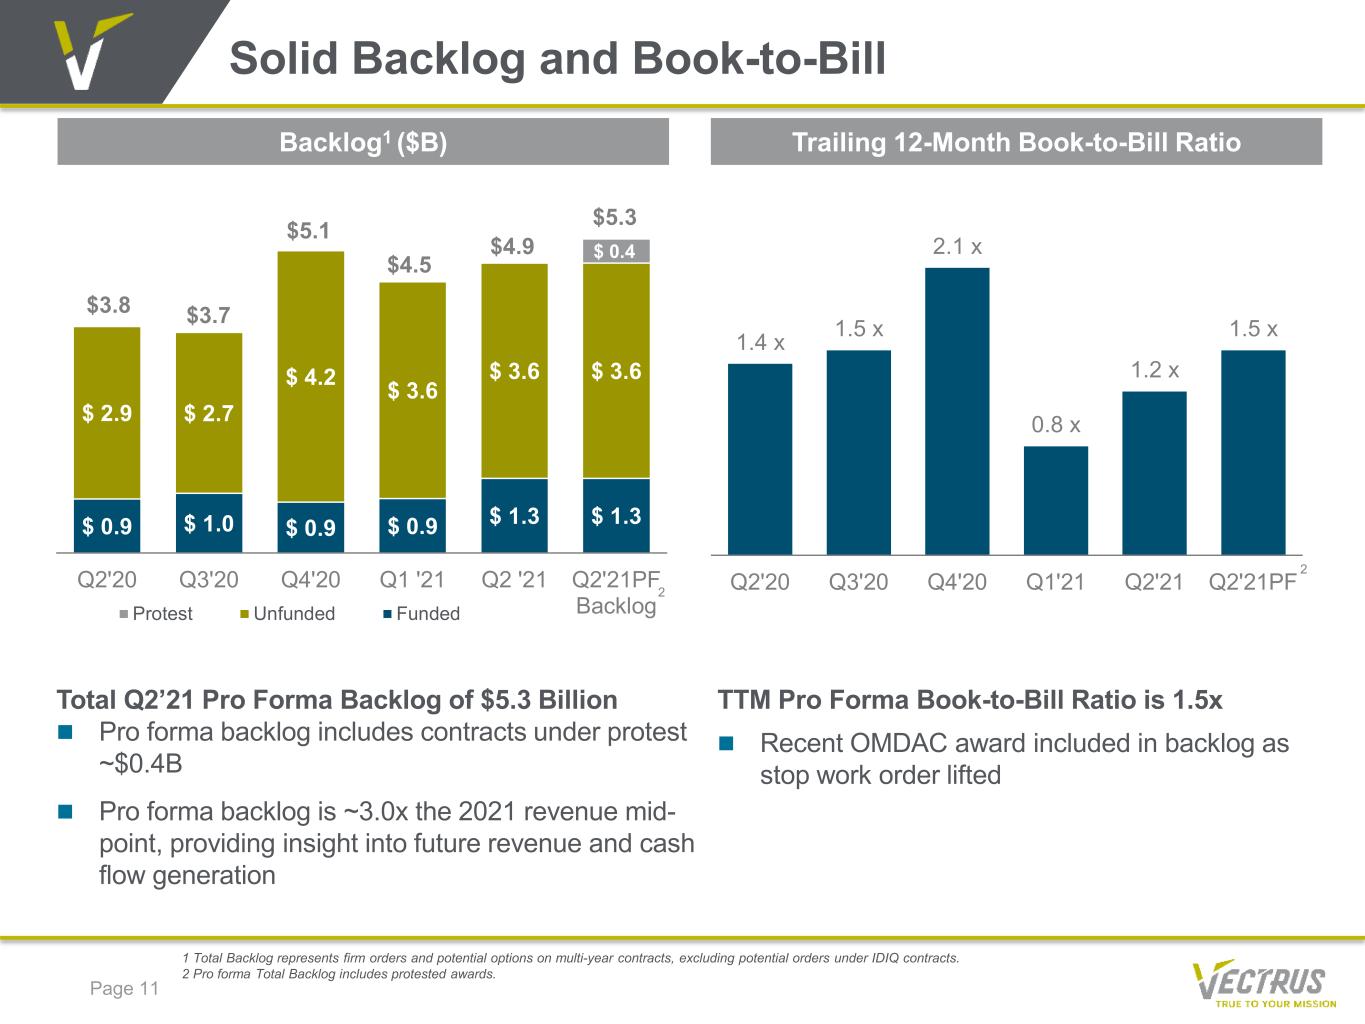
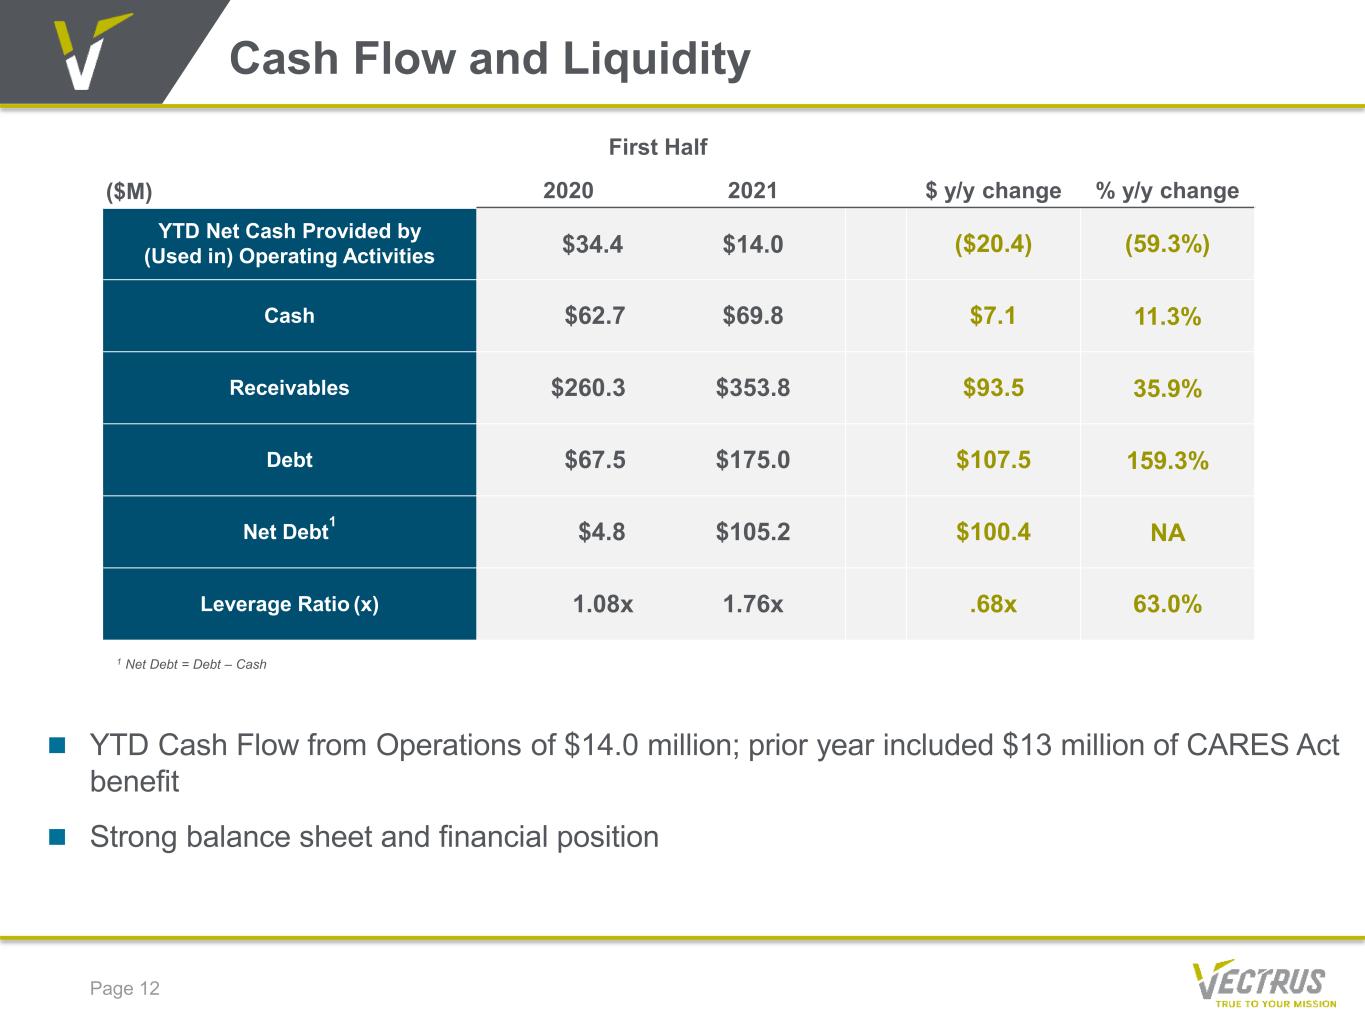
Exhibit 99.1 3 Operating income was $22.6 million or 4.8% margin. Adjusted operating income1 was $25.0 million or 5.3% margin. Adjusted EBITDA1 was $26.6 million or 5.6% margin. “Margin improved 360 basis points year-over- year in the second quarter and 210 basis points year-to-date,” said Susan Lynch, Senior Vice President and Chief Financial Officer. “Our strong first half results were driven by the ongoing execution of our enterprise performance improvement initiatives, recent acquisitions, our team’s success converting certain cost-plus components of a contract to fixed price and continued focus on prudently managing our cost structure. We remain focused on transforming Vectrus into a higher margin business and our second quarter and year-to-date performance reflects our ability to expand margins over time.” Fully diluted EPS for the second quarter of 2021 was $1.35 as compared to $0.09 cents in the same period last year. Adjusted diluted EPS1, which adds back amortization of acquired intangible assets, was $1.52 for the quarter, as compared to $0.31 cents in the prior year. The increase in diluted EPS was driven by the company’s improved operating performance and two recent acquisitions. Lynch continued, “Our results year-to-date are representative of Vectrus’ ability to generate substantial growth and earnings power. The second quarter results demonstrate our organic ability and how our strategic acquisitions are transforming the company into a higher value, growth- oriented platform. Our thoughtful deployment of capital is adding value from both an operational and financial perspective and we believe our strong balance sheet positions Vectrus to pursue future opportunities that align with our strategy and increase shareholder value.” Cash provided by operating activities through July 2, 2021 was $14.0 million. Operating cash flow decreased year on year primarily due to the CARES Act Benefit in Q2’20 of $13 million in addition to the working capital requirements associated with several new program phase-ins. Net debt at July 2, 2021 was $105.2 million, up $100.4 million from July 3, 2020. Total debt at July 2, 2021 was $175.0 million, up $107.5 million from $67.5 million at July 3, 2020. Both net and total debt were up due to the acquisitions of Zenetex and HHB on December 31, 2020. Cash at quarter- end was $69.8 million. Total consolidated indebtedness to consolidated EBITDA1 (total leverage ratio) was 1.76x. Total backlog as of July 2, 2021 was $4.9 billion and funded backlog was $1.3 billion. The trailing twelve-month book-to-bill was 1.2x as of July 2, 2021.
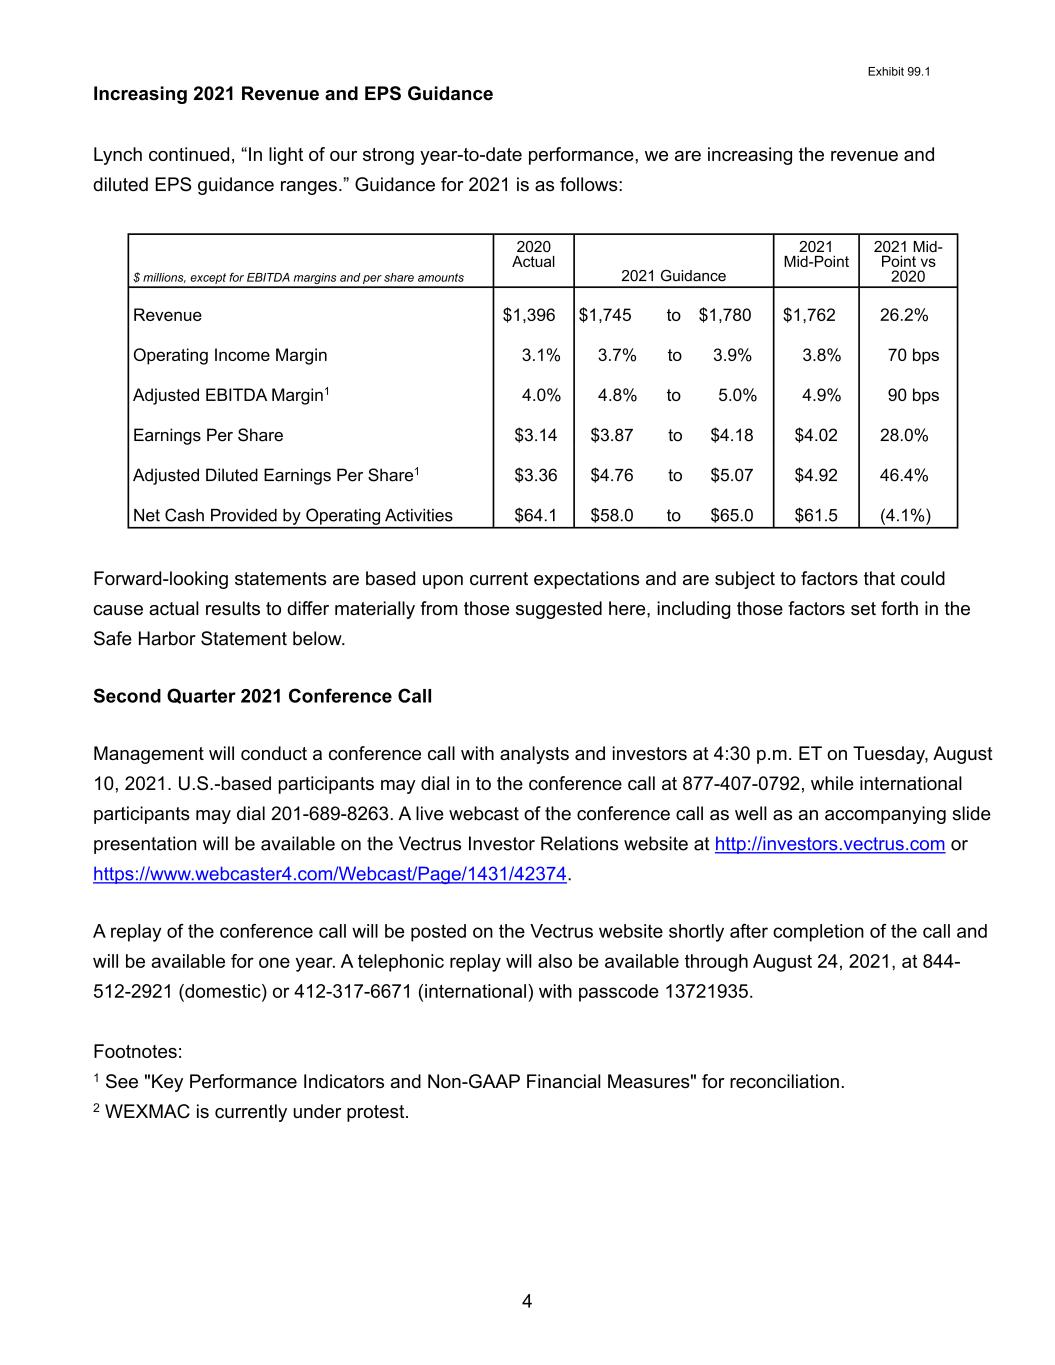
Exhibit 99.1 4 Increasing 2021 Revenue and EPS Guidance Lynch continued, “In light of our strong year-to-date performance, we are increasing the revenue and diluted EPS guidance ranges.” Guidance for 2021 is as follows: $ millions, except for EBITDA margins and per share amounts 2020 Actual 2021 Guidance 2021 Mid-Point 2021 Mid- Point vs 2020 Revenue $1,396 $1,745 to $1,780 $1,762 26.2% Operating Income Margin 3.1% 3.7% to 3.9% 3.8% 70 bps Adjusted EBITDA Margin1 4.0% 4.8% to 5.0% 4.9% 90 bps Earnings Per Share $3.14 $3.87 to $4.18 $4.02 28.0% Adjusted Diluted Earnings Per Share1 $3.36 $4.76 to $5.07 $4.92 46.4% Net Cash Provided by Operating Activities $64.1 $58.0 to $65.0 $61.5 (4.1%) Forward-looking statements are based upon current expectations and are subject to factors that could cause actual results to differ materially from those suggested here, including those factors set forth in the Safe Harbor Statement below. Second Quarter 2021 Conference Call Management will conduct a conference call with analysts and investors at 4:30 p.m. ET on Tuesday, August 10, 2021. U.S.-based participants may dial in to the conference call at 877-407-0792, while international participants may dial 201-689-8263. A live webcast of the conference call as well as an accompanying slide presentation will be available on the Vectrus Investor Relations website at http://investors.vectrus.com or https://www.webcaster4.com/Webcast/Page/1431/42374. A replay of the conference call will be posted on the Vectrus website shortly after completion of the call and will be available for one year. A telephonic replay will also be available through August 24, 2021, at 844- 512-2921 (domestic) or 412-317-6671 (international) with passcode 13721935. Footnotes: 1 See "Key Performance Indicators and Non-GAAP Financial Measures" for reconciliation. 2 WEXMAC is currently under protest.
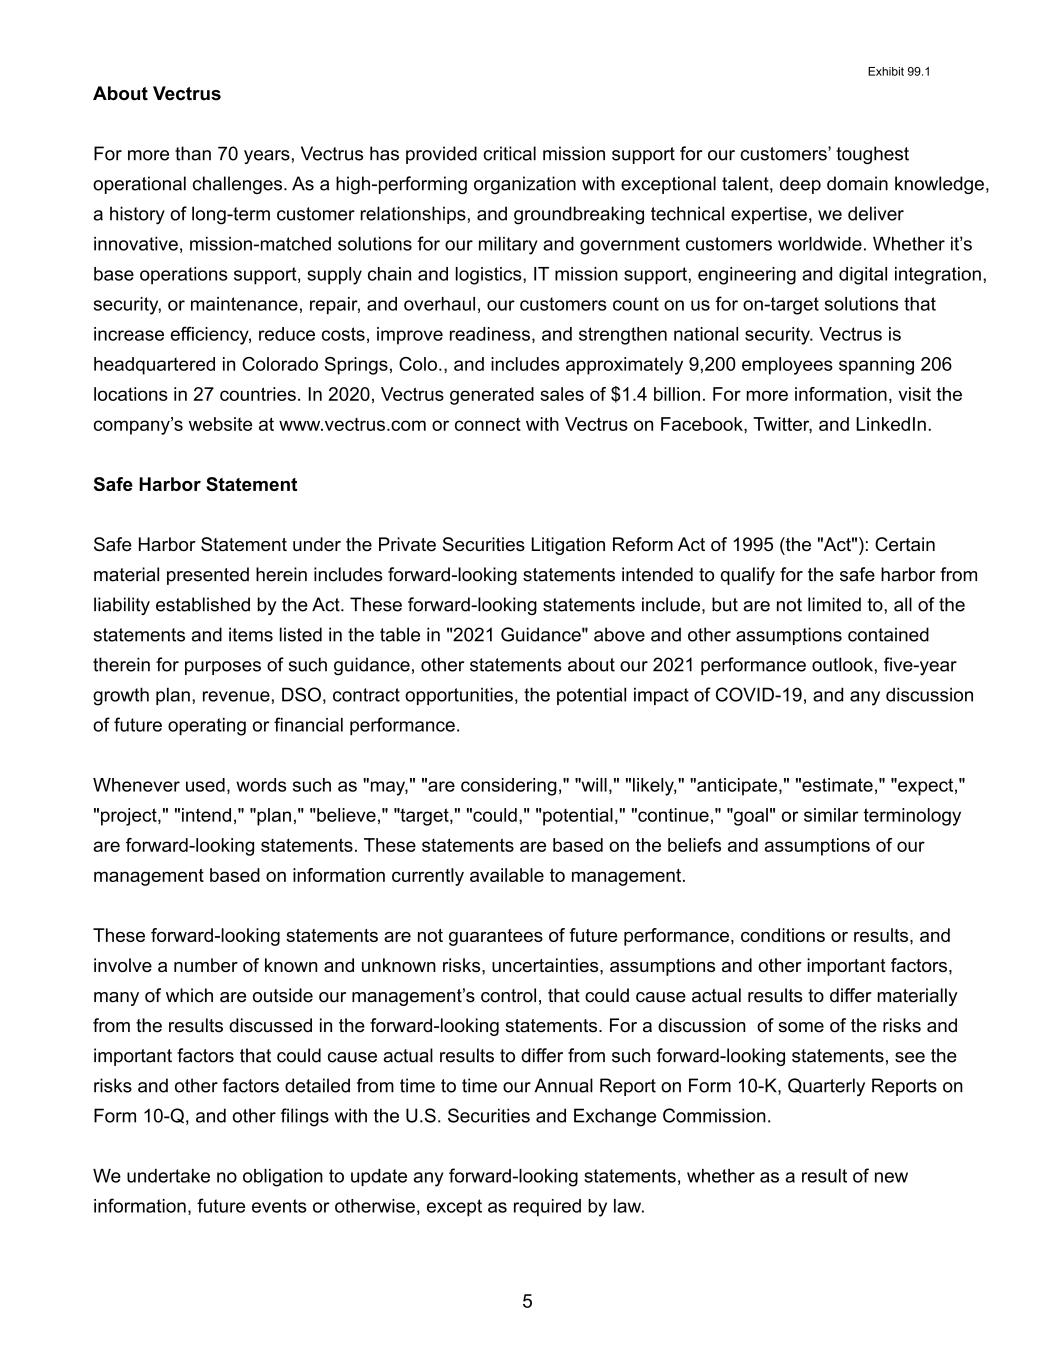
Exhibit 99.1 5 About Vectrus For more than 70 years, Vectrus has provided critical mission support for our customers’ toughest operational challenges. As a high-performing organization with exceptional talent, deep domain knowledge, a history of long-term customer relationships, and groundbreaking technical expertise, we deliver innovative, mission-matched solutions for our military and government customers worldwide. Whether it’s base operations support, supply chain and logistics, IT mission support, engineering and digital integration, security, or maintenance, repair, and overhaul, our customers count on us for on-target solutions that increase efficiency, reduce costs, improve readiness, and strengthen national security. Vectrus is headquartered in Colorado Springs, Colo., and includes approximately 9,200 employees spanning 206 locations in 27 countries. In 2020, Vectrus generated sales of $1.4 billion. For more information, visit the company’s website at www.vectrus.com or connect with Vectrus on Facebook, Twitter, and LinkedIn. Safe Harbor Statement Safe Harbor Statement under the Private Securities Litigation Reform Act of 1995 (the "Act"): Certain material presented herein includes forward-looking statements intended to qualify for the safe harbor from liability established by the Act. These forward-looking statements include, but are not limited to, all of the statements and items listed in the table in "2021 Guidance" above and other assumptions contained therein for purposes of such guidance, other statements about our 2021 performance outlook, five-year growth plan, revenue, DSO, contract opportunities, the potential impact of COVID-19, and any discussion of future operating or financial performance. Whenever used, words such as "may," "are considering," "will," "likely," "anticipate," "estimate," "expect," "project," "intend," "plan," "believe," "target," "could," "potential," "continue," "goal" or similar terminology are forward-looking statements. These statements are based on the beliefs and assumptions of our management based on information currently available to management. These forward-looking statements are not guarantees of future performance, conditions or results, and involve a number of known and unknown risks, uncertainties, assumptions and other important factors, many of which are outside our management’s control, that could cause actual results to differ materially from the results discussed in the forward-looking statements. For a discussion of some of the risks and important factors that could cause actual results to differ from such forward-looking statements, see the risks and other factors detailed from time to time our Annual Report on Form 10-K, Quarterly Reports on Form 10-Q, and other filings with the U.S. Securities and Exchange Commission. We undertake no obligation to update any forward-looking statements, whether as a result of new information, future events or otherwise, except as required by law.
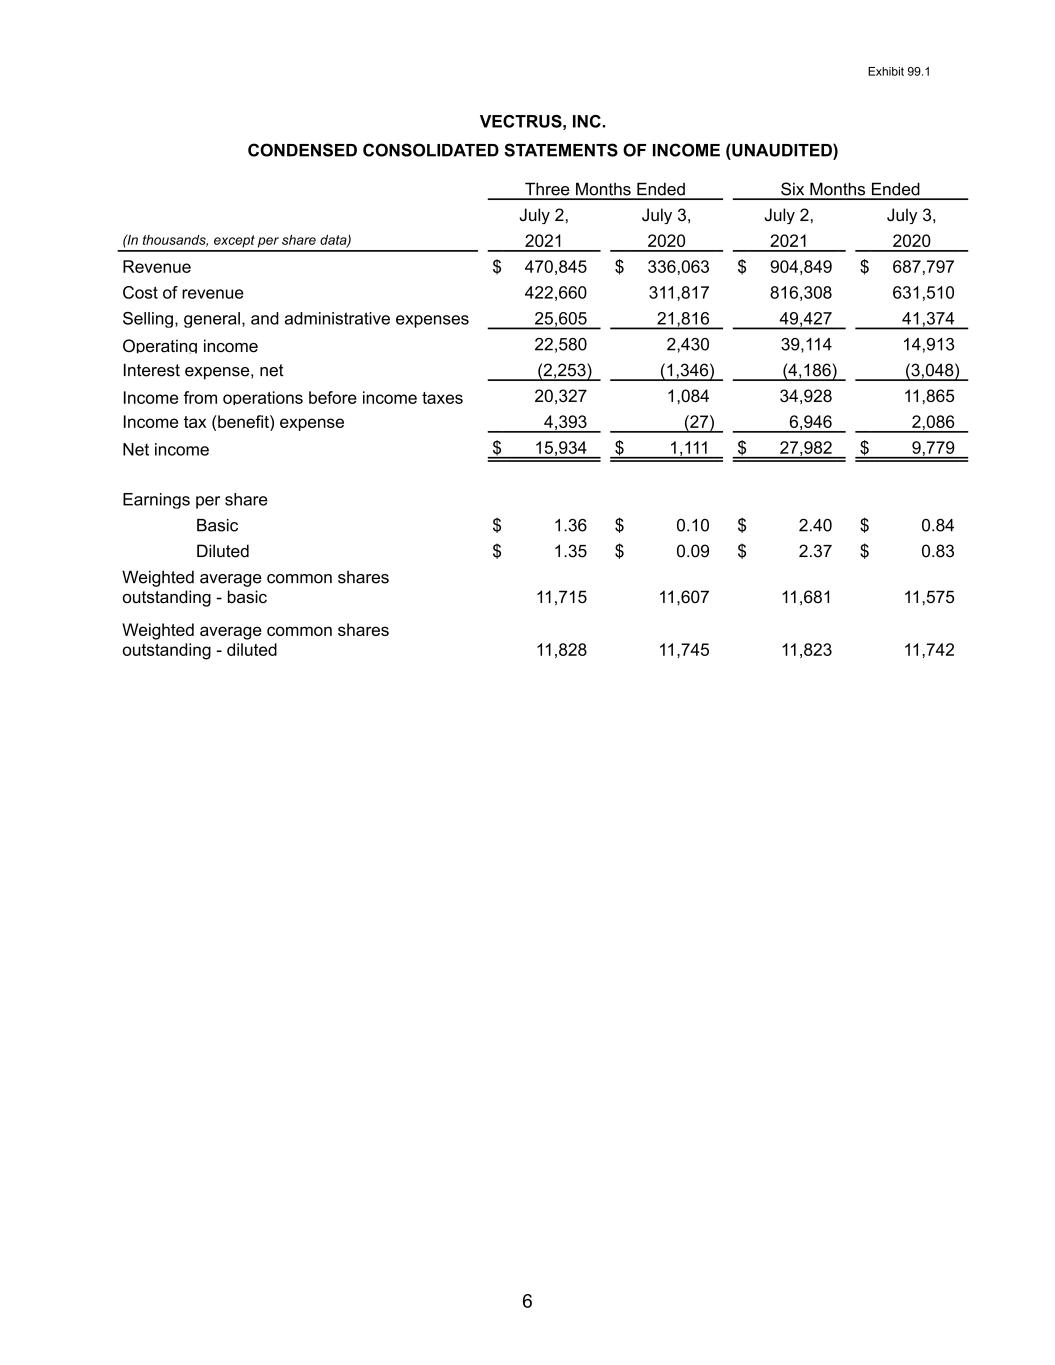
Exhibit 99.1 6 VECTRUS, INC. CONDENSED CONSOLIDATED STATEMENTS OF INCOME (UNAUDITED) Three Months Ended Six Months Ended July 2, July 3, July 2, July 3, (In thousands, except per share data) 2021 2020 2021 2020 Revenue $ 470,845 $ 336,063 $ 904,849 $ 687,797 Cost of revenue 422,660 311,817 816,308 631,510 Selling, general, and administrative expenses 25,605 21,816 49,427 41,374 Operating income 22,580 2,430 39,114 14,913 Interest expense, net (2,253) (1,346) (4,186) (3,048) Income from operations before income taxes 20,327 1,084 34,928 11,865 Income tax (benefit) expense 4,393 (27) 6,946 2,086 Net income $ 15,934 $ 1,111 $ 27,982 $ 9,779 Earnings per share Basic $ 1.36 $ 0.10 $ 2.40 $ 0.84 Diluted $ 1.35 $ 0.09 $ 2.37 $ 0.83 Weighted average common shares outstanding - basic 11,715 11,607 11,681 11,575 Weighted average common shares outstanding - diluted 11,828 11,745 11,823 11,742
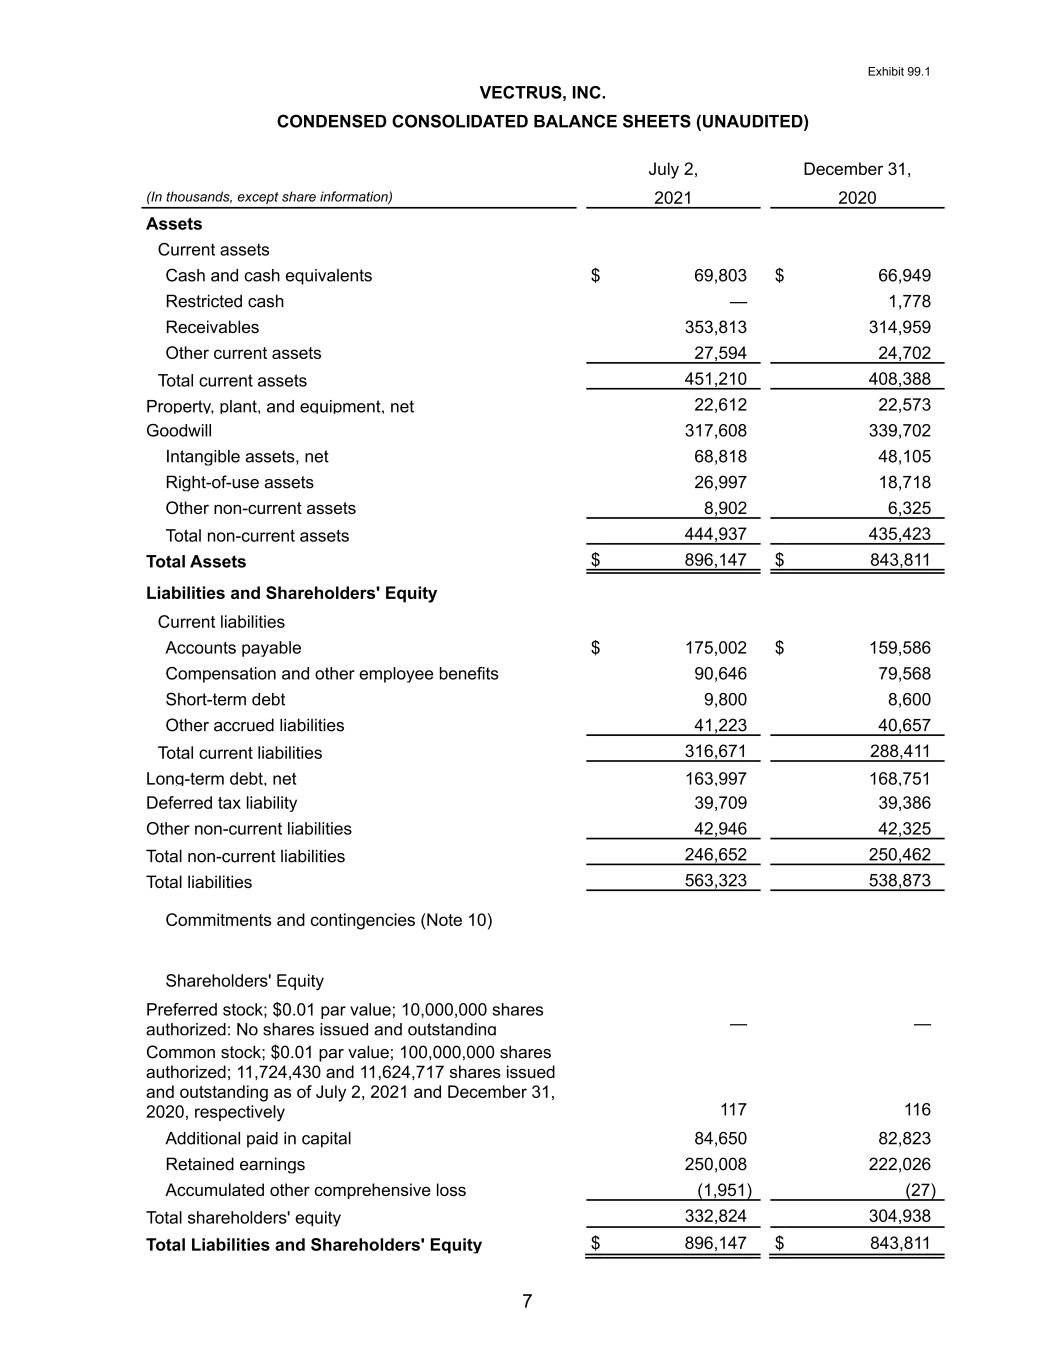
Exhibit 99.1 7 VECTRUS, INC. CONDENSED CONSOLIDATED BALANCE SHEETS (UNAUDITED) July 2, December 31, (In thousands, except share information) 2021 2020 Assets Current assets Cash and cash equivalents $ 69,803 $ 66,949 Restricted cash — 1,778 Receivables 353,813 314,959 Other current assets 27,594 24,702 Total current assets 451,210 408,388 Property, plant, and equipment, net 22,612 22,573 Goodwill 317,608 339,702 Intangible assets, net 68,818 48,105 Right-of-use assets 26,997 18,718 Other non-current assets 8,902 6,325 Total non-current assets 444,937 435,423 Total Assets $ 896,147 $ 843,811 Liabilities and Shareholders' Equity Current liabilities Accounts payable $ 175,002 $ 159,586 Compensation and other employee benefits 90,646 79,568 Short-term debt 9,800 8,600 Other accrued liabilities 41,223 40,657 Total current liabilities 316,671 288,411 Long-term debt, net 163,997 168,751 Deferred tax liability 39,709 39,386 Other non-current liabilities 42,946 42,325 Total non-current liabilities 246,652 250,462 Total liabilities 563,323 538,873 Commitments and contingencies (Note 10) Shareholders' Equity Preferred stock; $0.01 par value; 10,000,000 shares authorized; No shares issued and outstanding — — Common stock; $0.01 par value; 100,000,000 shares authorized; 11,724,430 and 11,624,717 shares issued and outstanding as of July 2, 2021 and December 31, 2020, respectively 117 116 Additional paid in capital 84,650 82,823 Retained earnings 250,008 222,026 Accumulated other comprehensive loss (1,951) (27) Total shareholders' equity 332,824 304,938 Total Liabilities and Shareholders' Equity $ 896,147 $ 843,811
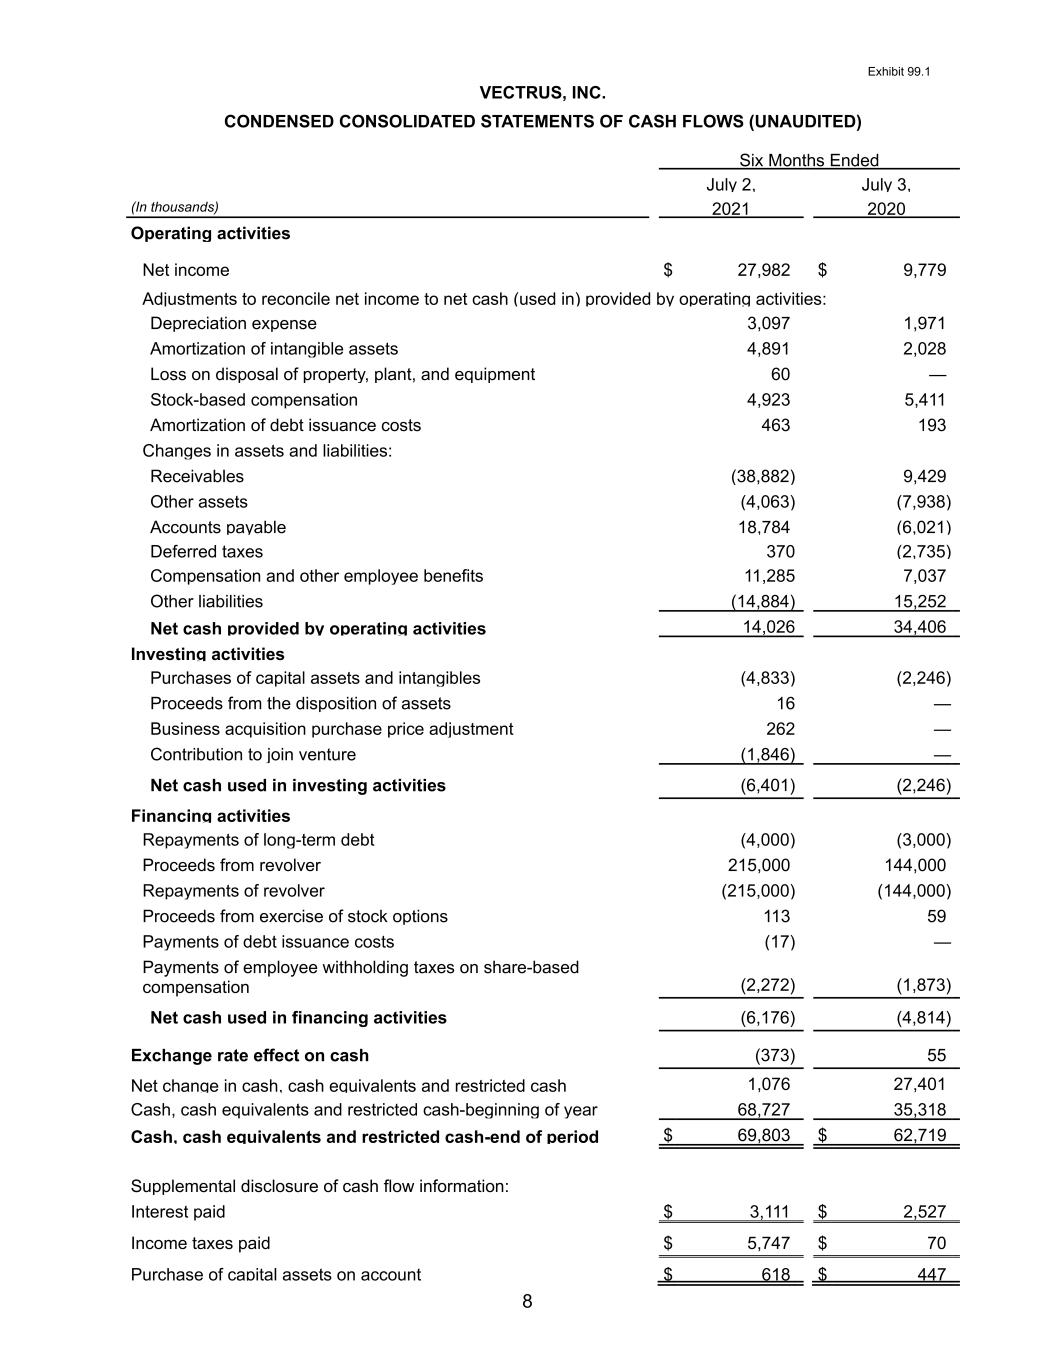
Exhibit 99.1 8 VECTRUS, INC. CONDENSED CONSOLIDATED STATEMENTS OF CASH FLOWS (UNAUDITED) Six Months Ended July 2, July 3, (In thousands) 2021 2020 Operating activities Net income $ 27,982 $ 9,779 Adjustments to reconcile net income to net cash (used in) provided by operating activities: Depreciation expense 3,097 1,971 Amortization of intangible assets 4,891 2,028 Loss on disposal of property, plant, and equipment 60 — Stock-based compensation 4,923 5,411 Amortization of debt issuance costs 463 193 Changes in assets and liabilities: Receivables (38,882) 9,429 Other assets (4,063) (7,938) Accounts payable 18,784 (6,021) Deferred taxes 370 (2,735) Compensation and other employee benefits 11,285 7,037 Other liabilities (14,884) 15,252 Net cash provided by operating activities 14,026 34,406 Investing activities Purchases of capital assets and intangibles (4,833) (2,246) Proceeds from the disposition of assets 16 — Business acquisition purchase price adjustment 262 — Contribution to join venture (1,846) — Net cash used in investing activities (6,401) (2,246) Financing activities Repayments of long-term debt (4,000) (3,000) Proceeds from revolver 215,000 144,000 Repayments of revolver (215,000) (144,000) Proceeds from exercise of stock options 113 59 Payments of debt issuance costs (17) — Payments of employee withholding taxes on share-based compensation (2,272) (1,873) Net cash used in financing activities (6,176) (4,814) Exchange rate effect on cash (373) 55 Net change in cash, cash equivalents and restricted cash 1,076 27,401 Cash, cash equivalents and restricted cash-beginning of year 68,727 35,318 Cash, cash equivalents and restricted cash-end of period $ 69,803 $ 62,719 Supplemental disclosure of cash flow information: Interest paid $ 3,111 $ 2,527 Income taxes paid $ 5,747 $ 70 Purchase of capital assets on account $ 618 $ 447
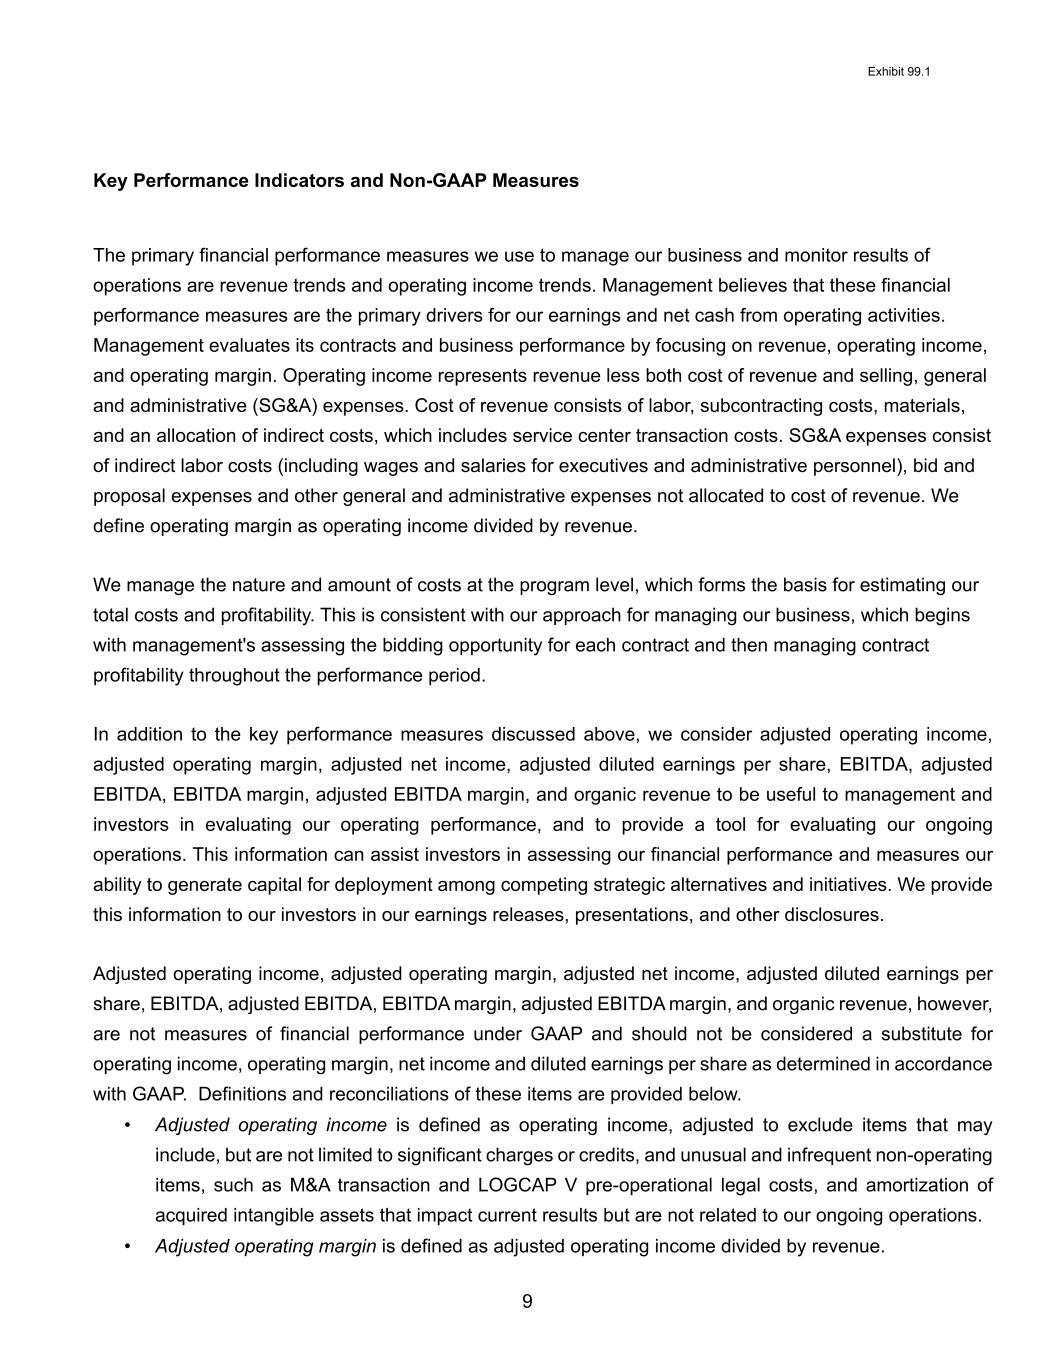
Exhibit 99.1 9 Key Performance Indicators and Non-GAAP Measures The primary financial performance measures we use to manage our business and monitor results of operations are revenue trends and operating income trends. Management believes that these financial performance measures are the primary drivers for our earnings and net cash from operating activities. Management evaluates its contracts and business performance by focusing on revenue, operating income, and operating margin. Operating income represents revenue less both cost of revenue and selling, general and administrative (SG&A) expenses. Cost of revenue consists of labor, subcontracting costs, materials, and an allocation of indirect costs, which includes service center transaction costs. SG&A expenses consist of indirect labor costs (including wages and salaries for executives and administrative personnel), bid and proposal expenses and other general and administrative expenses not allocated to cost of revenue. We define operating margin as operating income divided by revenue. We manage the nature and amount of costs at the program level, which forms the basis for estimating our total costs and profitability. This is consistent with our approach for managing our business, which begins with management's assessing the bidding opportunity for each contract and then managing contract profitability throughout the performance period. In addition to the key performance measures discussed above, we consider adjusted operating income, adjusted operating margin, adjusted net income, adjusted diluted earnings per share, EBITDA, adjusted EBITDA, EBITDA margin, adjusted EBITDA margin, and organic revenue to be useful to management and investors in evaluating our operating performance, and to provide a tool for evaluating our ongoing operations. This information can assist investors in assessing our financial performance and measures our ability to generate capital for deployment among competing strategic alternatives and initiatives. We provide this information to our investors in our earnings releases, presentations, and other disclosures. Adjusted operating income, adjusted operating margin, adjusted net income, adjusted diluted earnings per share, EBITDA, adjusted EBITDA, EBITDA margin, adjusted EBITDA margin, and organic revenue, however, are not measures of financial performance under GAAP and should not be considered a substitute for operating income, operating margin, net income and diluted earnings per share as determined in accordance with GAAP. Definitions and reconciliations of these items are provided below. • Adjusted operating income is defined as operating income, adjusted to exclude items that may include, but are not limited to significant charges or credits, and unusual and infrequent non-operating items, such as M&A transaction and LOGCAP V pre-operational legal costs, and amortization of acquired intangible assets that impact current results but are not related to our ongoing operations. • Adjusted operating margin is defined as adjusted operating income divided by revenue.
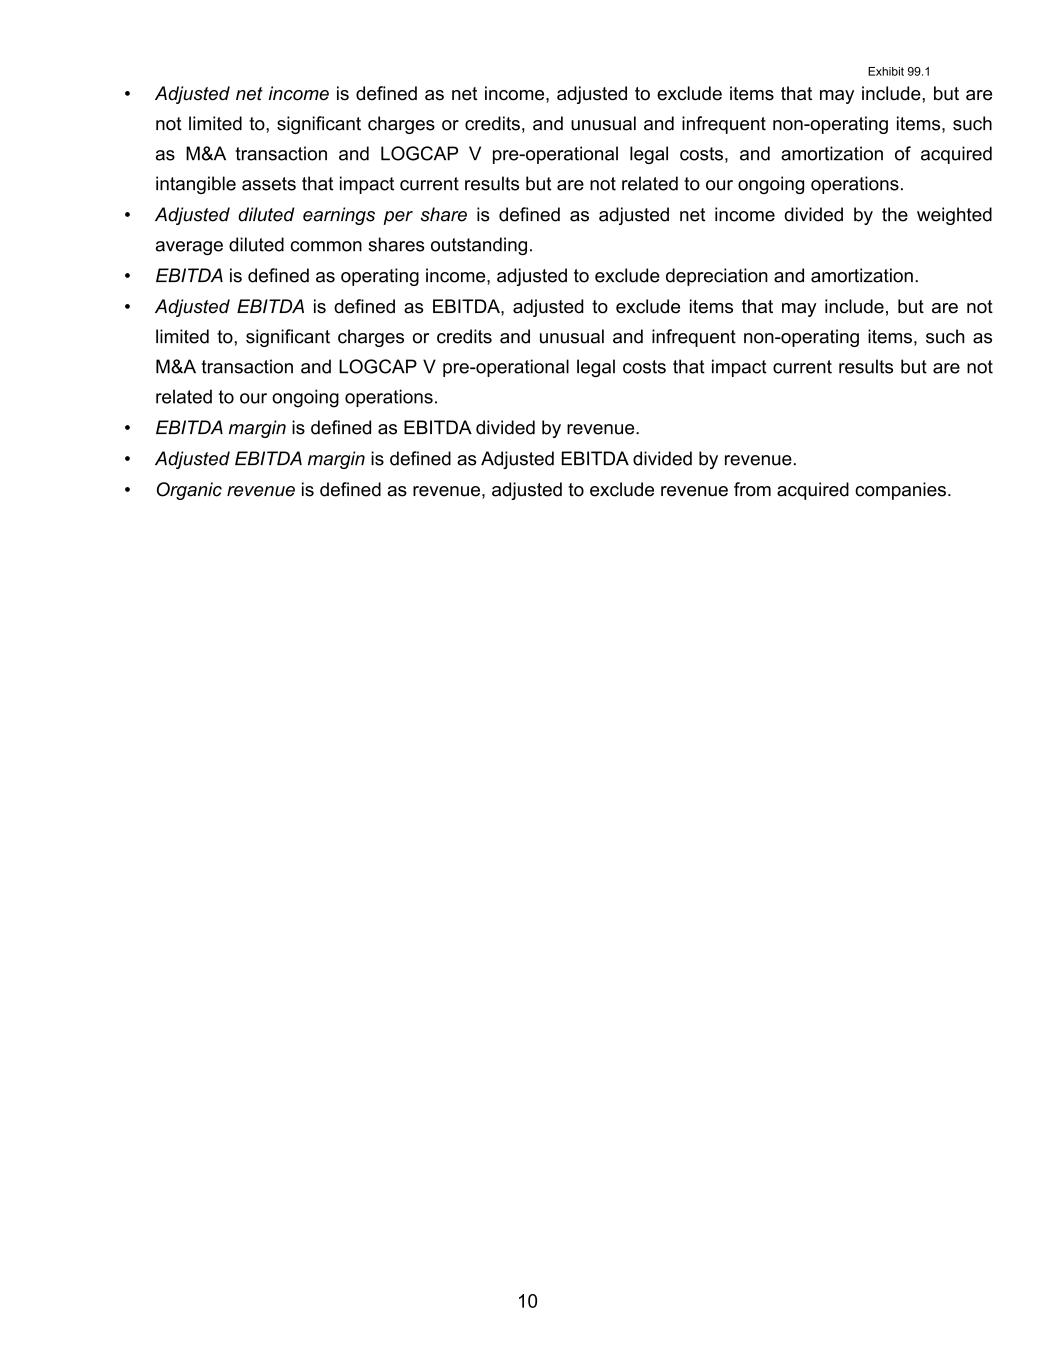
Exhibit 99.1 10 • Adjusted net income is defined as net income, adjusted to exclude items that may include, but are not limited to, significant charges or credits, and unusual and infrequent non-operating items, such as M&A transaction and LOGCAP V pre-operational legal costs, and amortization of acquired intangible assets that impact current results but are not related to our ongoing operations. • Adjusted diluted earnings per share is defined as adjusted net income divided by the weighted average diluted common shares outstanding. • EBITDA is defined as operating income, adjusted to exclude depreciation and amortization. • Adjusted EBITDA is defined as EBITDA, adjusted to exclude items that may include, but are not limited to, significant charges or credits and unusual and infrequent non-operating items, such as M&A transaction and LOGCAP V pre-operational legal costs that impact current results but are not related to our ongoing operations. • EBITDA margin is defined as EBITDA divided by revenue. • Adjusted EBITDA margin is defined as Adjusted EBITDA divided by revenue. • Organic revenue is defined as revenue, adjusted to exclude revenue from acquired companies.
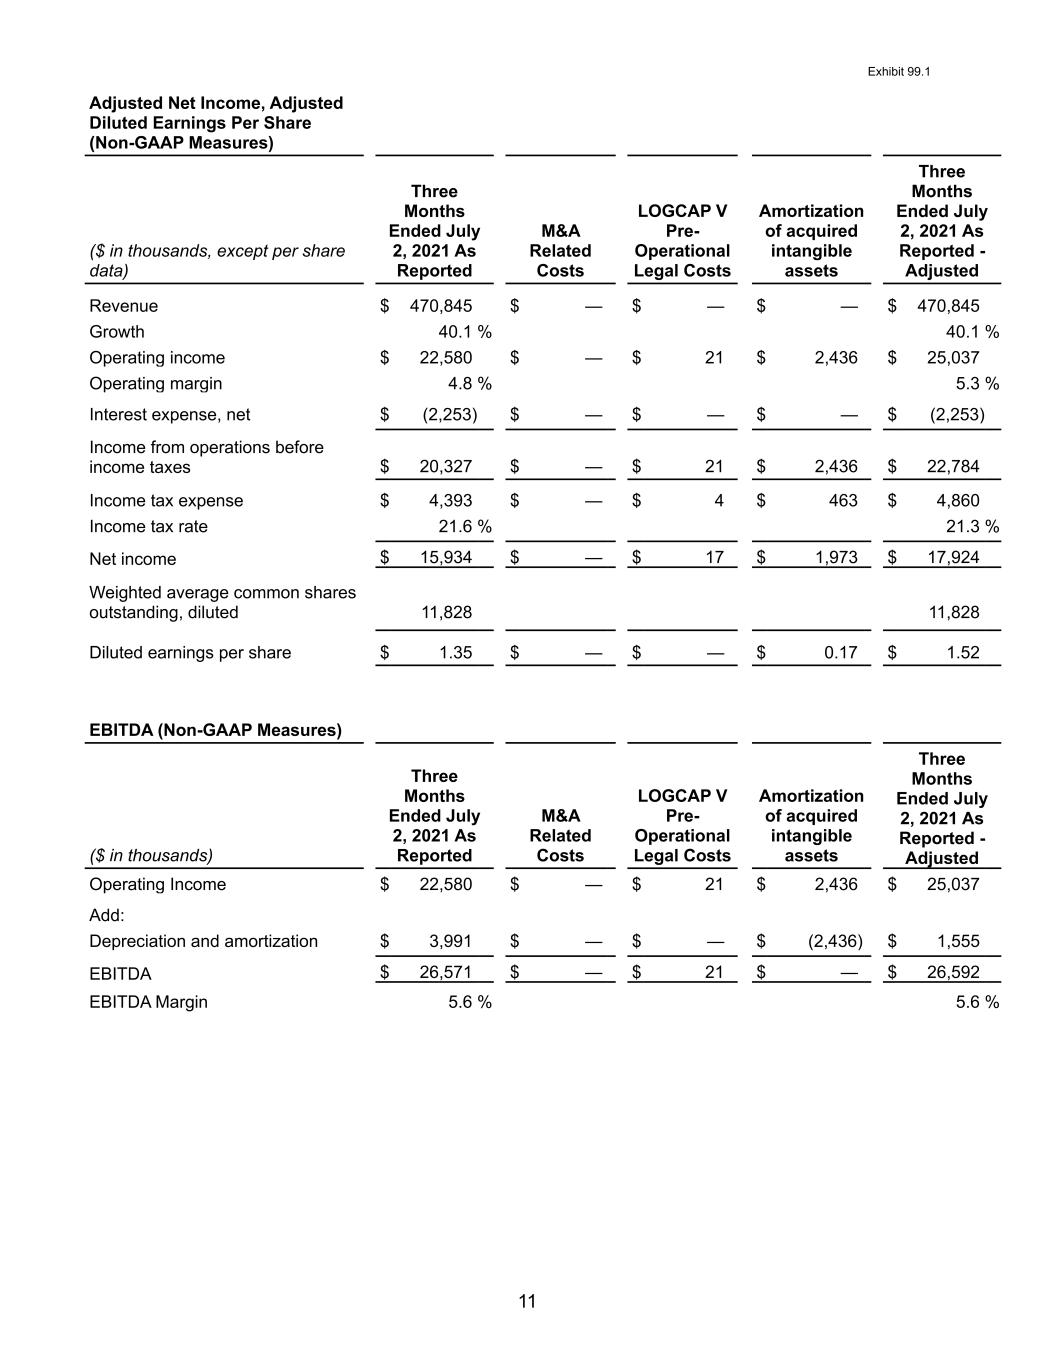
Exhibit 99.1 11 Adjusted Net Income, Adjusted Diluted Earnings Per Share (Non-GAAP Measures) ($ in thousands, except per share data) Three Months Ended July 2, 2021 As Reported M&A Related Costs LOGCAP V Pre- Operational Legal Costs Amortization of acquired intangible assets Three Months Ended July 2, 2021 As Reported - Adjusted Revenue $ 470,845 $ — $ — $ — $ 470,845 Growth 40.1 % 40.1 % Operating income $ 22,580 $ — $ 21 $ 2,436 $ 25,037 Operating margin 4.8 % 5.3 % Interest expense, net $ (2,253) $ — $ — $ — $ (2,253) Income from operations before income taxes $ 20,327 $ — $ 21 $ 2,436 $ 22,784 Income tax expense $ 4,393 $ — $ 4 $ 463 $ 4,860 Income tax rate 21.6 % 21.3 % Net income $ 15,934 $ — $ 17 $ 1,973 $ 17,924 Weighted average common shares outstanding, diluted 11,828 11,828 Diluted earnings per share $ 1.35 $ — $ — $ 0.17 $ 1.52 EBITDA (Non-GAAP Measures) ($ in thousands) Three Months Ended July 2, 2021 As Reported M&A Related Costs LOGCAP V Pre- Operational Legal Costs Amortization of acquired intangible assets Three Months Ended July 2, 2021 As Reported - Adjusted Operating Income $ 22,580 $ — $ 21 $ 2,436 $ 25,037 Add: Depreciation and amortization $ 3,991 $ — $ — $ (2,436) $ 1,555 EBITDA $ 26,571 $ — $ 21 $ — $ 26,592 EBITDA Margin 5.6 % 5.6 %
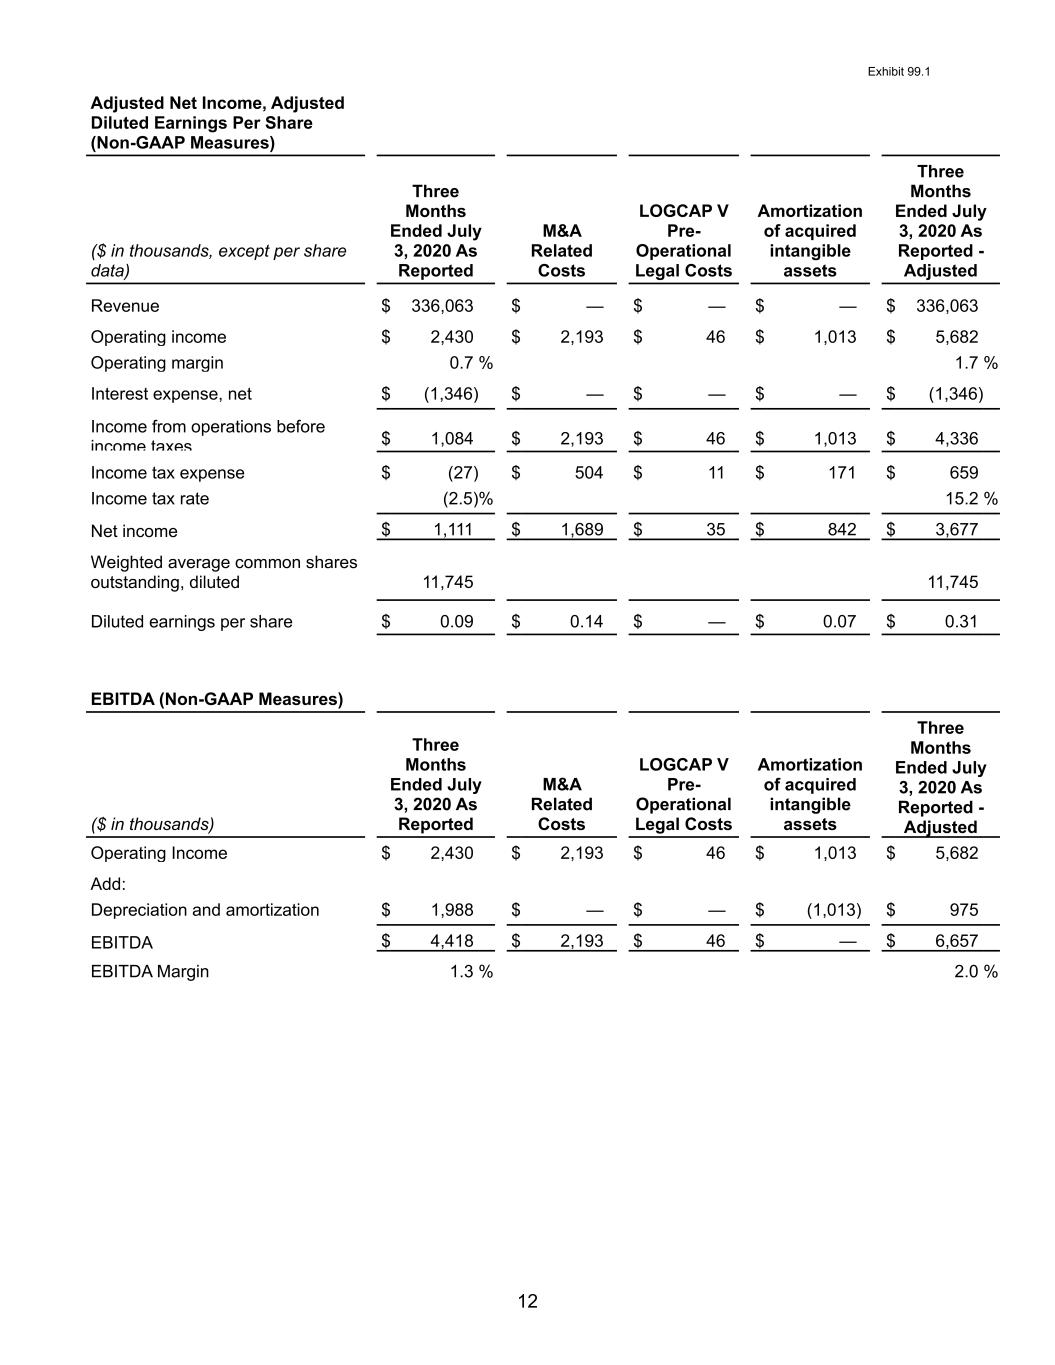
Exhibit 99.1 12 Adjusted Net Income, Adjusted Diluted Earnings Per Share (Non-GAAP Measures) ($ in thousands, except per share data) Three Months Ended July 3, 2020 As Reported M&A Related Costs LOGCAP V Pre- Operational Legal Costs Amortization of acquired intangible assets Three Months Ended July 3, 2020 As Reported - Adjusted Revenue $ 336,063 $ — $ — $ — $ 336,063 Operating income $ 2,430 $ 2,193 $ 46 $ 1,013 $ 5,682 Operating margin 0.7 % 1.7 % Interest expense, net $ (1,346) $ — $ — $ — $ (1,346) Income from operations before income taxes $ 1,084 $ 2,193 $ 46 $ 1,013 $ 4,336 Income tax expense $ (27) $ 504 $ 11 $ 171 $ 659 Income tax rate (2.5) % 15.2 % Net income $ 1,111 $ 1,689 $ 35 $ 842 $ 3,677 Weighted average common shares outstanding, diluted 11,745 11,745 Diluted earnings per share $ 0.09 $ 0.14 $ — $ 0.07 $ 0.31 EBITDA (Non-GAAP Measures) ($ in thousands) Three Months Ended July 3, 2020 As Reported M&A Related Costs LOGCAP V Pre- Operational Legal Costs Amortization of acquired intangible assets Three Months Ended July 3, 2020 As Reported - Adjusted Operating Income $ 2,430 $ 2,193 $ 46 $ 1,013 $ 5,682 Add: Depreciation and amortization $ 1,988 $ — $ — $ (1,013) $ 975 EBITDA $ 4,418 $ 2,193 $ 46 $ — $ 6,657 EBITDA Margin 1.3 % 2.0 %
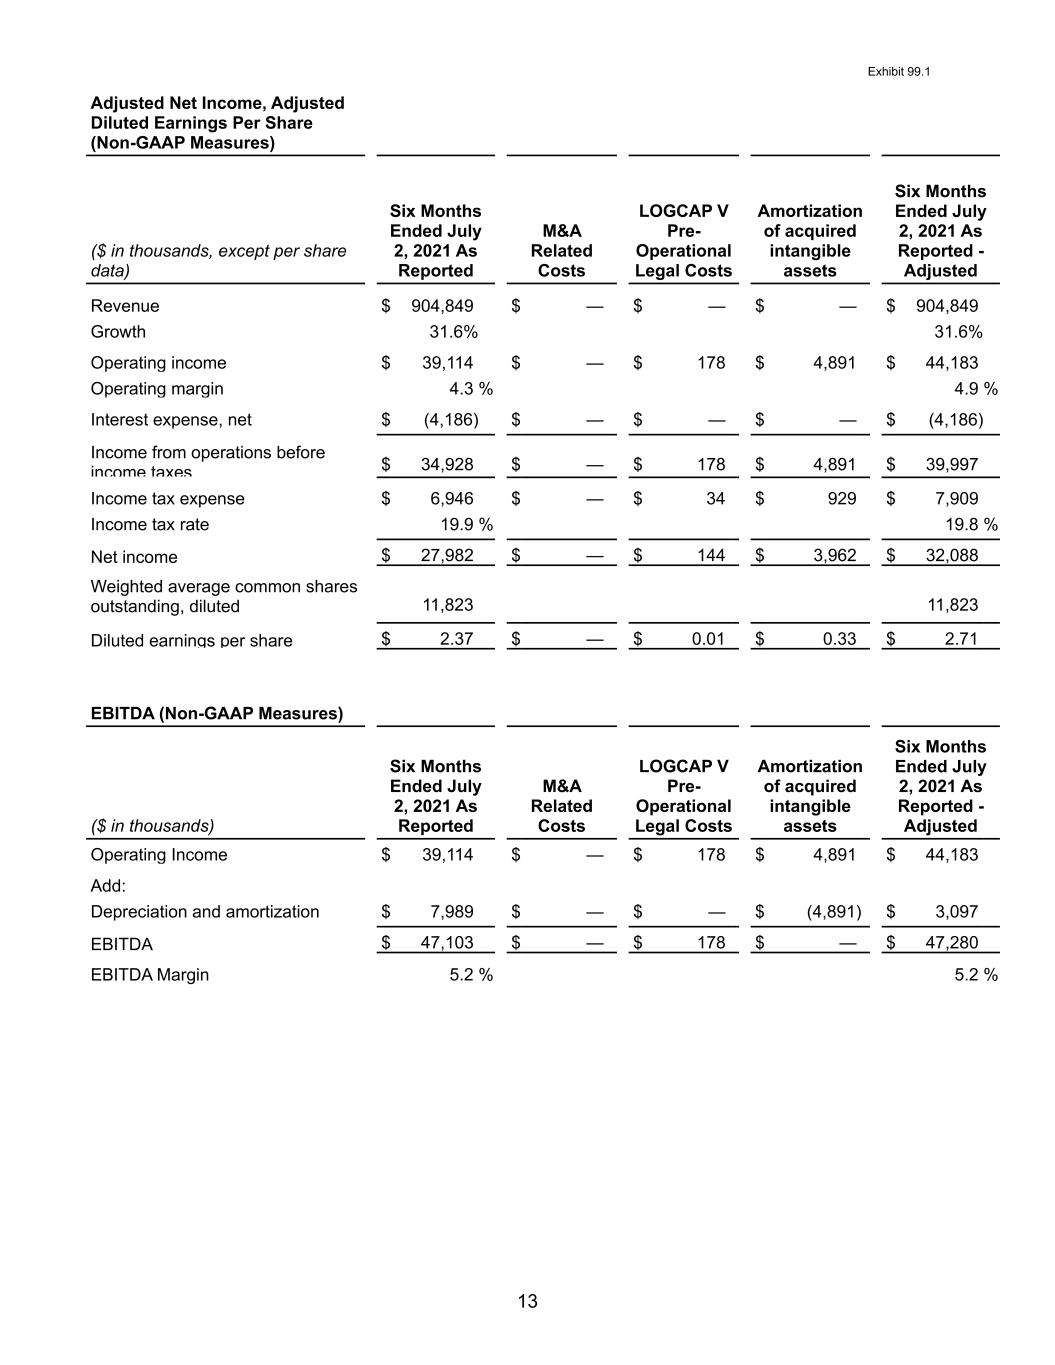
Exhibit 99.1 13 Adjusted Net Income, Adjusted Diluted Earnings Per Share (Non-GAAP Measures) ($ in thousands, except per share data) Six Months Ended July 2, 2021 As Reported M&A Related Costs LOGCAP V Pre- Operational Legal Costs Amortization of acquired intangible assets Six Months Ended July 2, 2021 As Reported - Adjusted Revenue $ 904,849 $ — $ — $ — $ 904,849 Growth 31.6% 31.6% Operating income $ 39,114 $ — $ 178 $ 4,891 $ 44,183 Operating margin 4.3 % 4.9 % Interest expense, net $ (4,186) $ — $ — $ — $ (4,186) Income from operations before income taxes $ 34,928 $ — $ 178 $ 4,891 $ 39,997 Income tax expense $ 6,946 $ — $ 34 $ 929 $ 7,909 Income tax rate 19.9 % 19.8 % Net income $ 27,982 $ — $ 144 $ 3,962 $ 32,088 Weighted average common shares outstanding, diluted 11,823 11,823 Diluted earnings per share $ 2.37 $ — $ 0.01 $ 0.33 $ 2.71 EBITDA (Non-GAAP Measures) ($ in thousands) Six Months Ended July 2, 2021 As Reported M&A Related Costs LOGCAP V Pre- Operational Legal Costs Amortization of acquired intangible assets Six Months Ended July 2, 2021 As Reported - Adjusted Operating Income $ 39,114 $ — $ 178 $ 4,891 $ 44,183 Add: Depreciation and amortization $ 7,989 $ — $ — $ (4,891) $ 3,097 EBITDA $ 47,103 $ — $ 178 $ — $ 47,280 EBITDA Margin 5.2 % 5.2 %
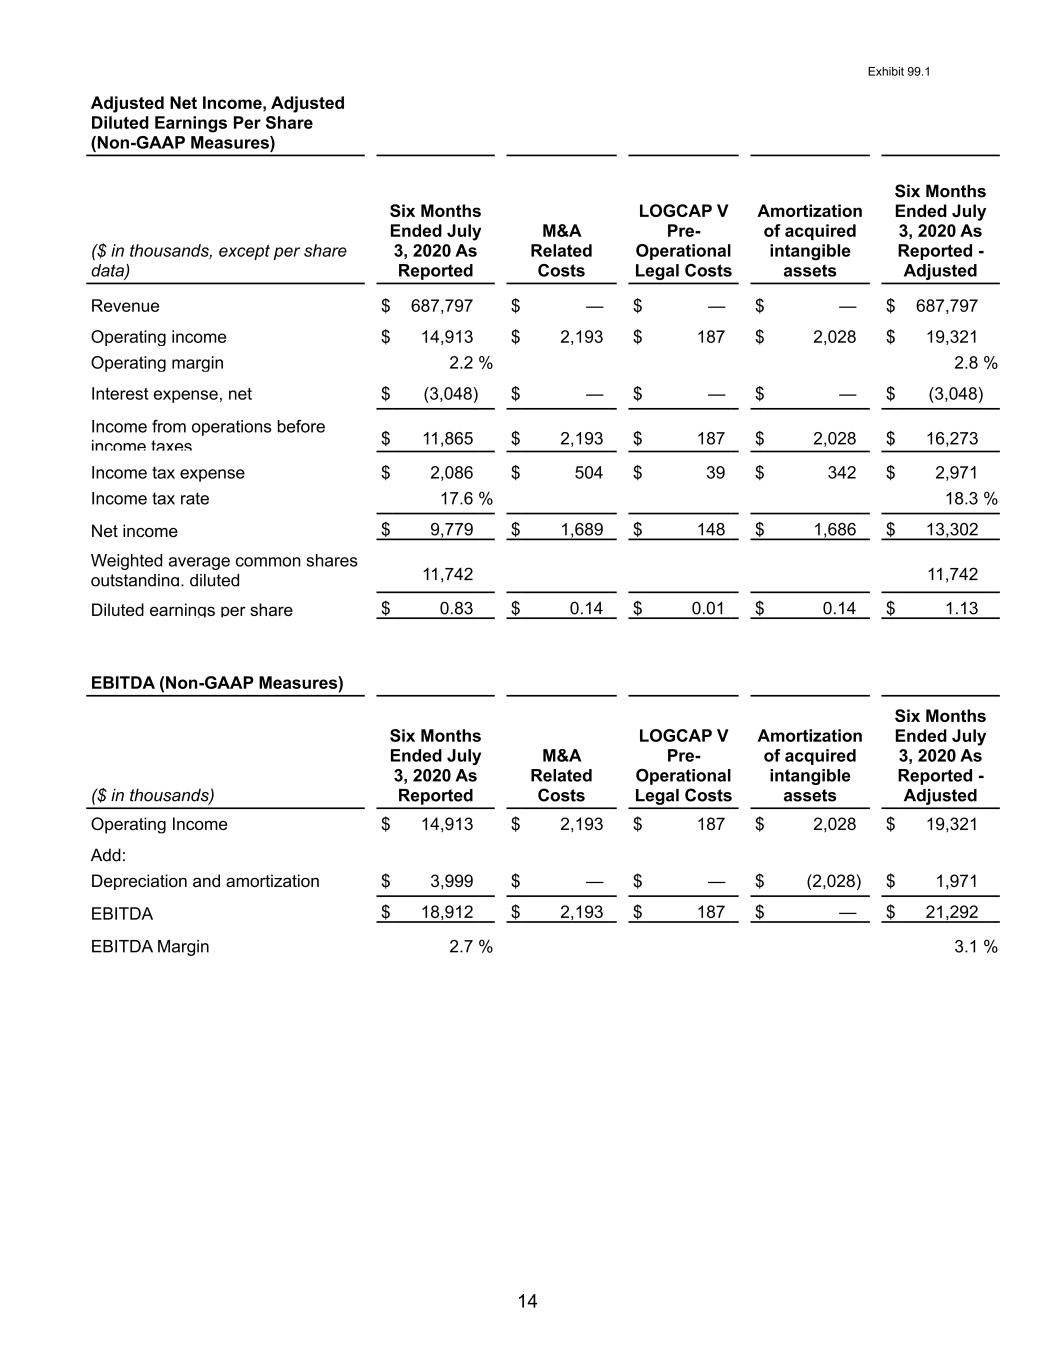
Exhibit 99.1 14 Adjusted Net Income, Adjusted Diluted Earnings Per Share (Non-GAAP Measures) ($ in thousands, except per share data) Six Months Ended July 3, 2020 As Reported M&A Related Costs LOGCAP V Pre- Operational Legal Costs Amortization of acquired intangible assets Six Months Ended July 3, 2020 As Reported - Adjusted Revenue $ 687,797 $ — $ — $ — $ 687,797 Operating income $ 14,913 $ 2,193 $ 187 $ 2,028 $ 19,321 Operating margin 2.2 % 2.8 % Interest expense, net $ (3,048) $ — $ — $ — $ (3,048) Income from operations before income taxes $ 11,865 $ 2,193 $ 187 $ 2,028 $ 16,273 Income tax expense $ 2,086 $ 504 $ 39 $ 342 $ 2,971 Income tax rate 17.6 % 18.3 % Net income $ 9,779 $ 1,689 $ 148 $ 1,686 $ 13,302 Weighted average common shares outstanding, diluted 11,742 11,742 Diluted earnings per share $ 0.83 $ 0.14 $ 0.01 $ 0.14 $ 1.13 EBITDA (Non-GAAP Measures) ($ in thousands) Six Months Ended July 3, 2020 As Reported M&A Related Costs LOGCAP V Pre- Operational Legal Costs Amortization of acquired intangible assets Six Months Ended July 3, 2020 As Reported - Adjusted Operating Income $ 14,913 $ 2,193 $ 187 $ 2,028 $ 19,321 Add: Depreciation and amortization $ 3,999 $ — $ — $ (2,028) $ 1,971 EBITDA $ 18,912 $ 2,193 $ 187 $ — $ 21,292 EBITDA Margin 2.7 % 3.1 %
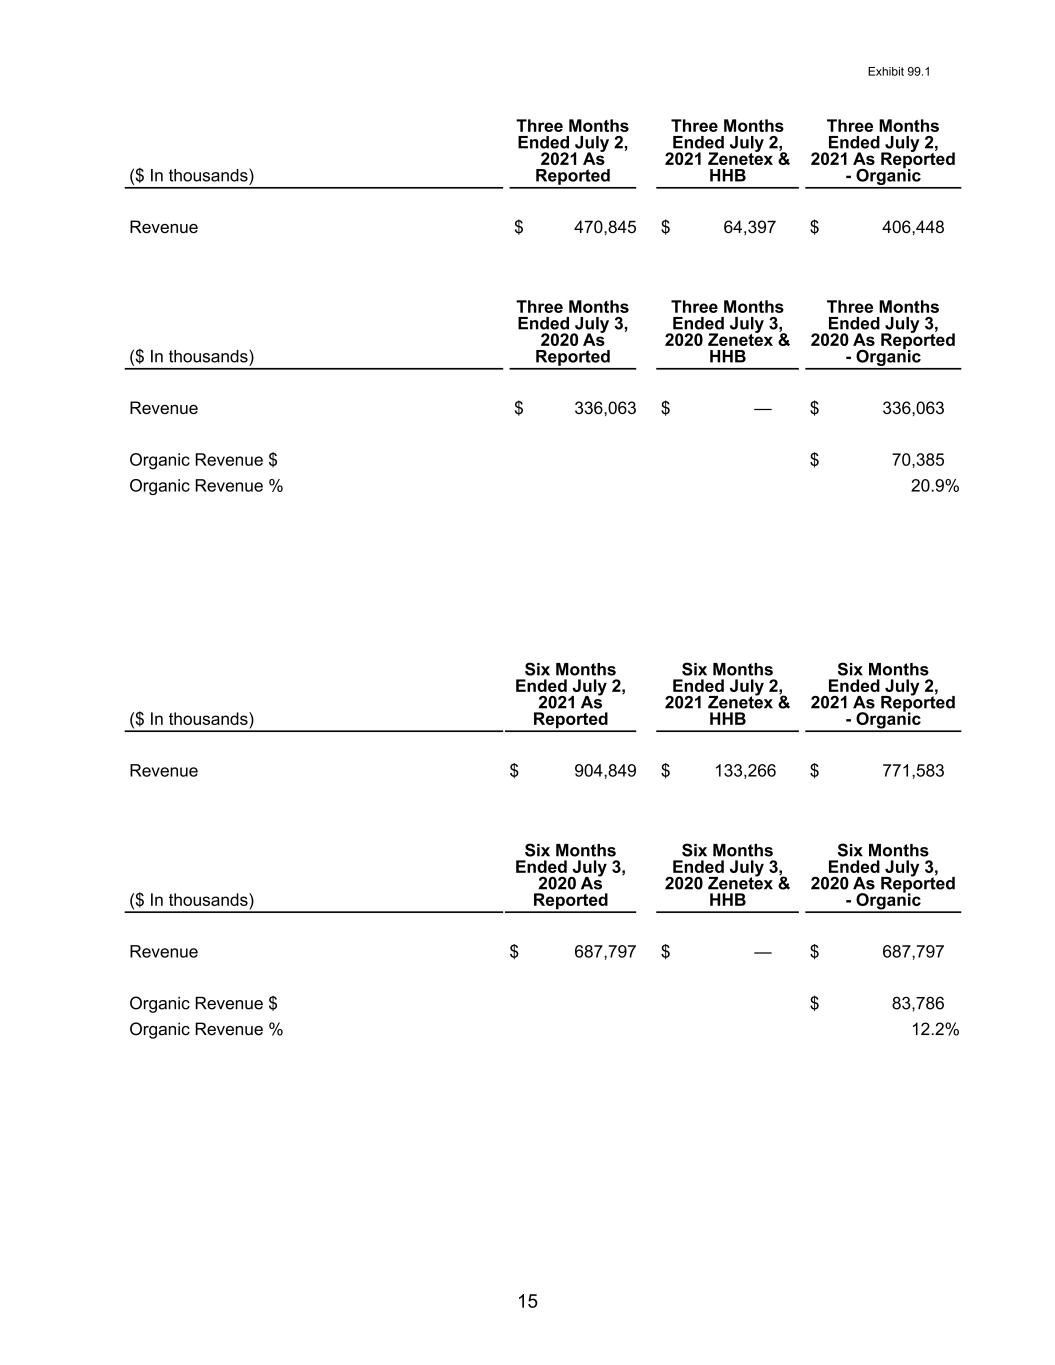
Exhibit 99.1 15 ($ In thousands) Three Months Ended July 2, 2021 As Reported Three Months Ended July 2, 2021 Zenetex & HHB Three Months Ended July 2, 2021 As Reported - Organic Revenue $ 470,845 $ 64,397 $ 406,448 ($ In thousands) Three Months Ended July 3, 2020 As Reported Three Months Ended July 3, 2020 Zenetex & HHB Three Months Ended July 3, 2020 As Reported - Organic Revenue $ 336,063 $ — $ 336,063 Organic Revenue $ $ 70,385 Organic Revenue % 20.9 % ($ In thousands) Six Months Ended July 2, 2021 As Reported Six Months Ended July 2, 2021 Zenetex & HHB Six Months Ended July 2, 2021 As Reported - Organic Revenue $ 904,849 $ 133,266 $ 771,583 ($ In thousands) Six Months Ended July 3, 2020 As Reported Six Months Ended July 3, 2020 Zenetex & HHB Six Months Ended July 3, 2020 As Reported - Organic Revenue $ 687,797 $ — $ 687,797 Organic Revenue $ $ 83,786 Organic Revenue % 12.2 %
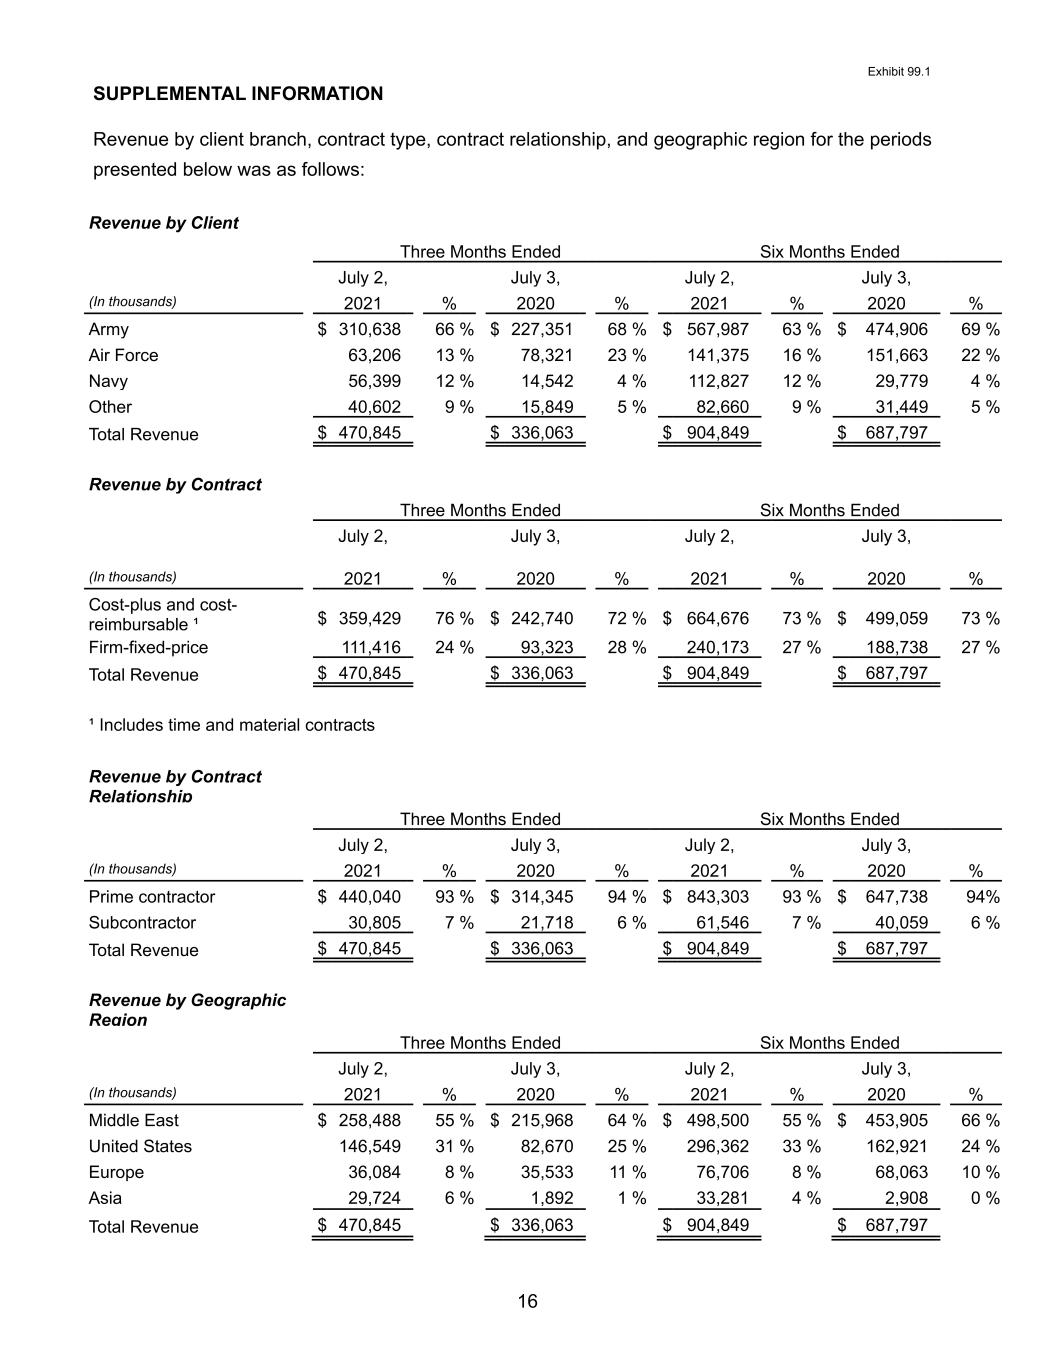
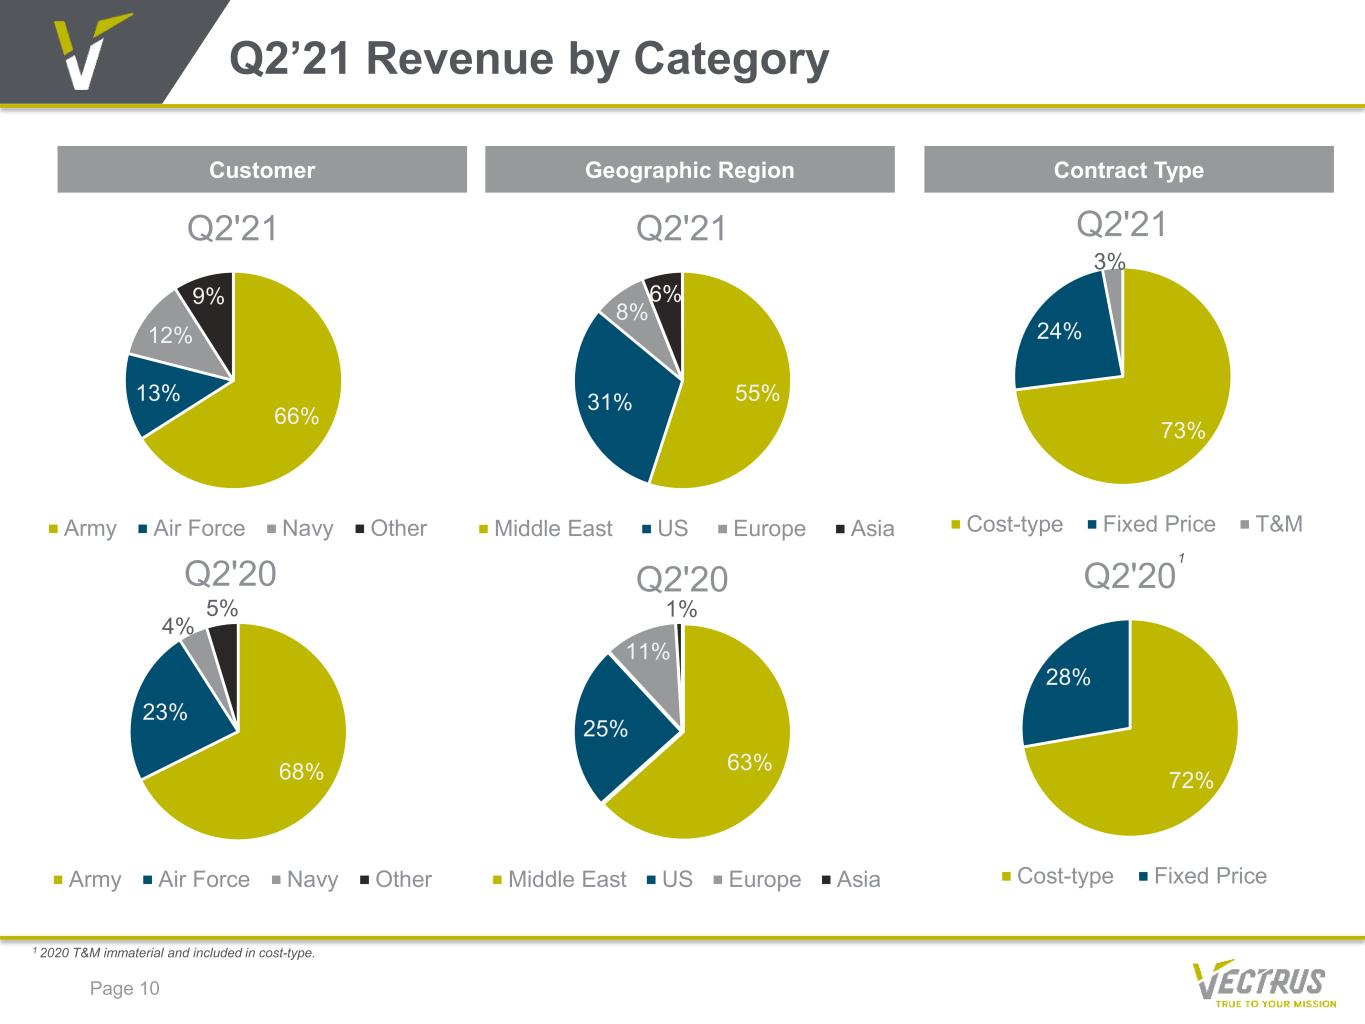
Exhibit 99.1 16 SUPPLEMENTAL INFORMATION Revenue by client branch, contract type, contract relationship, and geographic region for the periods presented below was as follows: Revenue by Client Three Months Ended Six Months Ended July 2, July 3, July 2, July 3, (In thousands) 2021 % 2020 % 2021 % 2020 % Army $ 310,638 66 % $ 227,351 68 % $ 567,987 63 % $ 474,906 69 % Air Force 63,206 13 % 78,321 23 % 141,375 16 % 151,663 22 % Navy 56,399 12 % 14,542 4 % 112,827 12 % 29,779 4 % Other 40,602 9 % 15,849 5 % 82,660 9 % 31,449 5 % Total Revenue $ 470,845 $ 336,063 $ 904,849 $ 687,797 Revenue by Contract Three Months Ended Six Months Ended July 2, July 3, July 2, July 3, (In thousands) 2021 % 2020 % 2021 % 2020 % Cost-plus and cost- reimbursable ¹ $ 359,429 76 % $ 242,740 72 % $ 664,676 73 % $ 499,059 73 % Firm-fixed-price 111,416 24 % 93,323 28 % 240,173 27 % 188,738 27 % Total Revenue $ 470,845 $ 336,063 $ 904,849 $ 687,797 ¹ Includes time and material contracts Revenue by Contract Relationship Three Months Ended Six Months Ended July 2, July 3, July 2, July 3, (In thousands) 2021 % 2020 % 2021 % 2020 % Prime contractor $ 440,040 93 % $ 314,345 94 % $ 843,303 93 % $ 647,738 94 % Subcontractor 30,805 7 % 21,718 6 % 61,546 7 % 40,059 6 % Total Revenue $ 470,845 $ 336,063 $ 904,849 $ 687,797 Revenue by Geographic Region Three Months Ended Six Months Ended July 2, July 3, July 2, July 3, (In thousands) 2021 % 2020 % 2021 % 2020 % Middle East $ 258,488 55 % $ 215,968 64 % $ 498,500 55 % $ 453,905 66 % United States 146,549 31 % 82,670 25 % 296,362 33 % 162,921 24 % Europe 36,084 8 % 35,533 11 % 76,706 8 % 68,063 10 % Asia 29,724 6 % 1,892 1 % 33,281 4 % 2,908 0 % Total Revenue $ 470,845 $ 336,063 $ 904,849 $ 687,797
VECTRUS SECOND QUARTER 2021 RESULTS CHUCK PROW – PRESIDENT AND CHIEF EXECUTIVE OFFICER SUSAN LYNCH – SENIOR VICE PRESIDENT AND CHIEF FINANCIAL OFFICER AUGUST 10, 2021
Safe Harbor Statement Page 2 SAFE HARBOR STATEMENT UNDER THE PRIVATE SECURITIES LITIGATION REFORM ACT OF 1995 (THE “ACT"): CERTAIN MATERIAL PRESENTED HEREIN INCLUDES FORWARD-LOOKING STATEMENTS INTENDED TO QUALIFY FOR THE SAFE HARBOR FROM LIABILITY ESTABLISHED BY THE ACT. THESE FORWARD- LOOKING STATEMENTS INCLUDE, BUT ARE NOT LIMITED TO, ALL OF THE STATEMENTS AND ITEMS LISTED IN THE TABLES FOR 2021 GUIDANCE AND OTHER ASSUMPTIONS CONTAINED THEREIN FOR PURPOSES OF SUCH GUIDANCE, STATEMENTS ABOUT OUR 2021 PERFORMANCE OUTLOOK, FIVE-YEAR GROWTH PLAN, REVENUE, DSO, CONTRACT OPPORTUNITIES, THE IMPACT OF COVID-19, THE CONTINUED INTEGRATION OF OUR ACQUISITIONS, AND ANY DISCUSSION OF FUTURE OPERATING OR FINANCIAL PERFORMANCE. WHENEVER USED, WORDS SUCH AS "MAY," "ARE CONSIDERING," "WILL," "LIKELY," "ANTICIPATE," "ESTIMATE," "EXPECT," "PROJECT," "INTEND," "PLAN," "BELIEVE," "TARGET," "COULD," "POTENTIAL," "CONTINUE," "GOAL" OR SIMILAR TERMINOLOGY ARE FORWARD-LOOKING STATEMENTS. THESE STATEMENTS ARE BASED ON THE BELIEFS AND ASSUMPTIONS OF OUR MANAGEMENT BASED ON INFORMATION CURRENTLY AVAILABLE TO MANAGEMENT. THESE FORWARD-LOOKING STATEMENTS ARE NOT GUARANTEES OF FUTURE PERFORMANCE, CONDITIONS OR RESULTS, AND INVOLVE A NUMBER OF KNOWN AND UNKNOWN RISKS, UNCERTAINTIES, ASSUMPTIONS AND OTHER IMPORTANT FACTORS, MANY OF WHICH ARE OUTSIDE OUR MANAGEMENT’S CONTROL, THAT COULD CAUSE ACTUAL RESULTS TO DIFFER MATERIALLY FROM THE RESULTS DISCUSSED IN THE FORWARD-LOOKING STATEMENTS. FOR A DISCUSSION OF SOME OF THE RISKS AND IMPORTANT FACTORS THAT COULD CAUSE ACTUAL RESULTS TO DIFFER FROM SUCH FORWARD-LOOKING STATEMENTS, SEE THE RISKS AND OTHER FACTORS DETAILED FROM TIME TO TIME OUR ANNUAL REPORT ON FORM 10-K, QUARTERLY REPORTS ON FORM 10-Q, AND OTHER FILINGS WITH THE U.S. SECURITIES AND EXCHANGE COMMISSION. WE UNDERTAKE NO OBLIGATION TO UPDATE ANY FORWARD-LOOKING STATEMENTS, WHETHER AS A RESULT OF NEW INFORMATION, FUTURE EVENTS OR OTHERWISE, EXCEPT AS REQUIRED BY LAW.
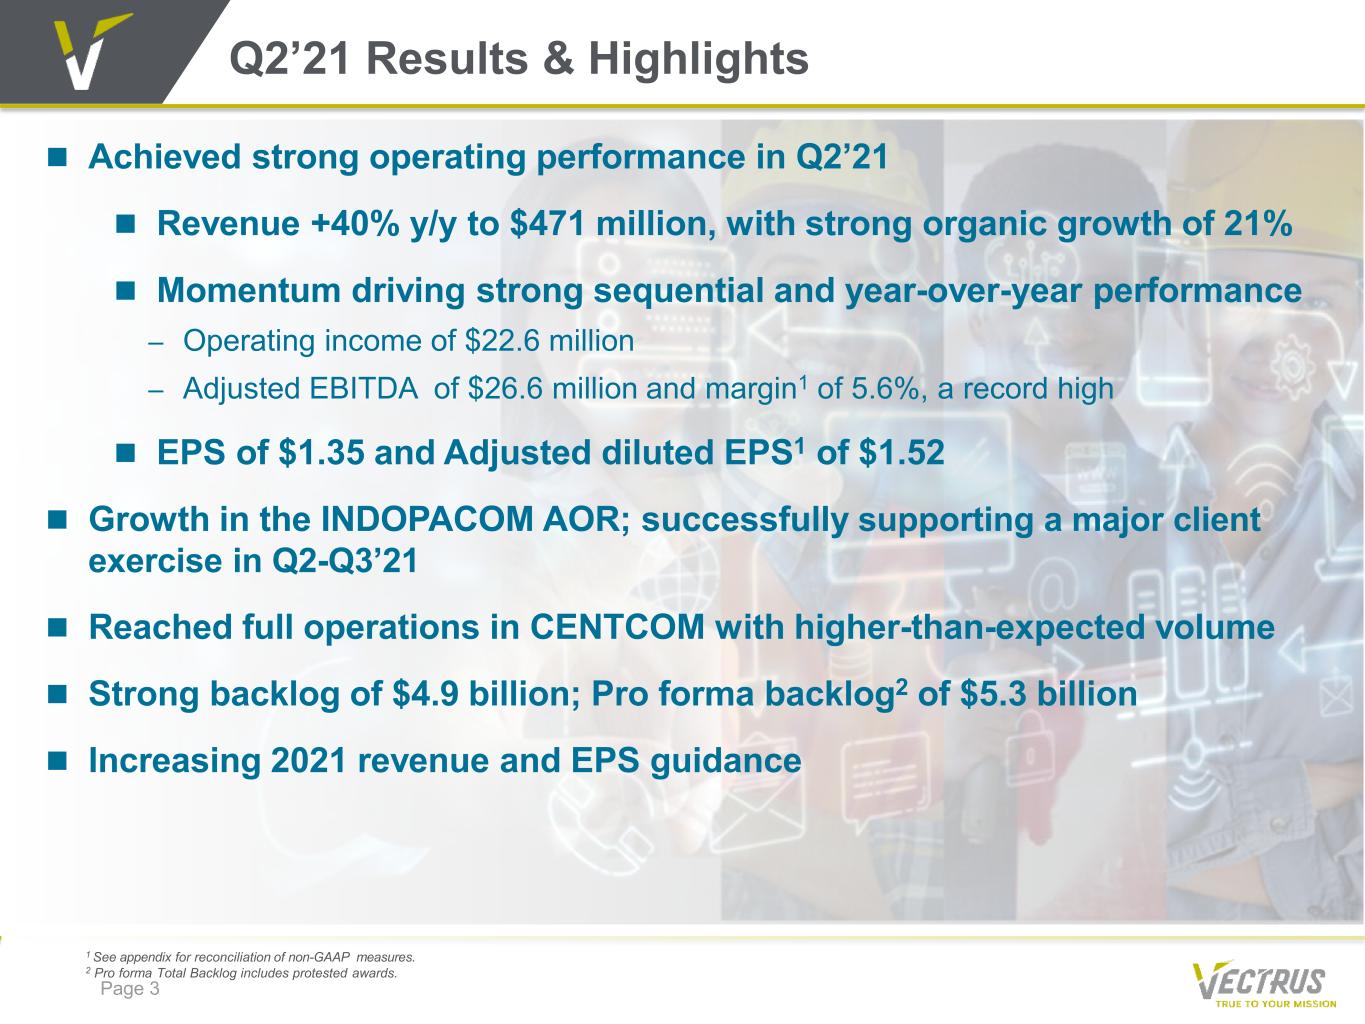
Page 3 1 See appendix for reconciliation of non-GAAP measures. 2 Pro forma Total Backlog includes protested awards. Q2’21 Results & Highlights Achieved strong operating performance in Q2’21 Revenue +40% y/y to $471 million, with strong organic growth of 21% Momentum driving strong sequential and year-over-year performance – Operating income of $22.6 million – Adjusted EBITDA of $26.6 million and margin1 of 5.6%, a record high EPS of $1.35 and Adjusted diluted EPS1 of $1.52 Growth in the INDOPACOM AOR; successfully supporting a major client exercise in Q2-Q3’21 Reached full operations in CENTCOM with higher-than-expected volume Strong backlog of $4.9 billion; Pro forma backlog2 of $5.3 billion Increasing 2021 revenue and EPS guidance
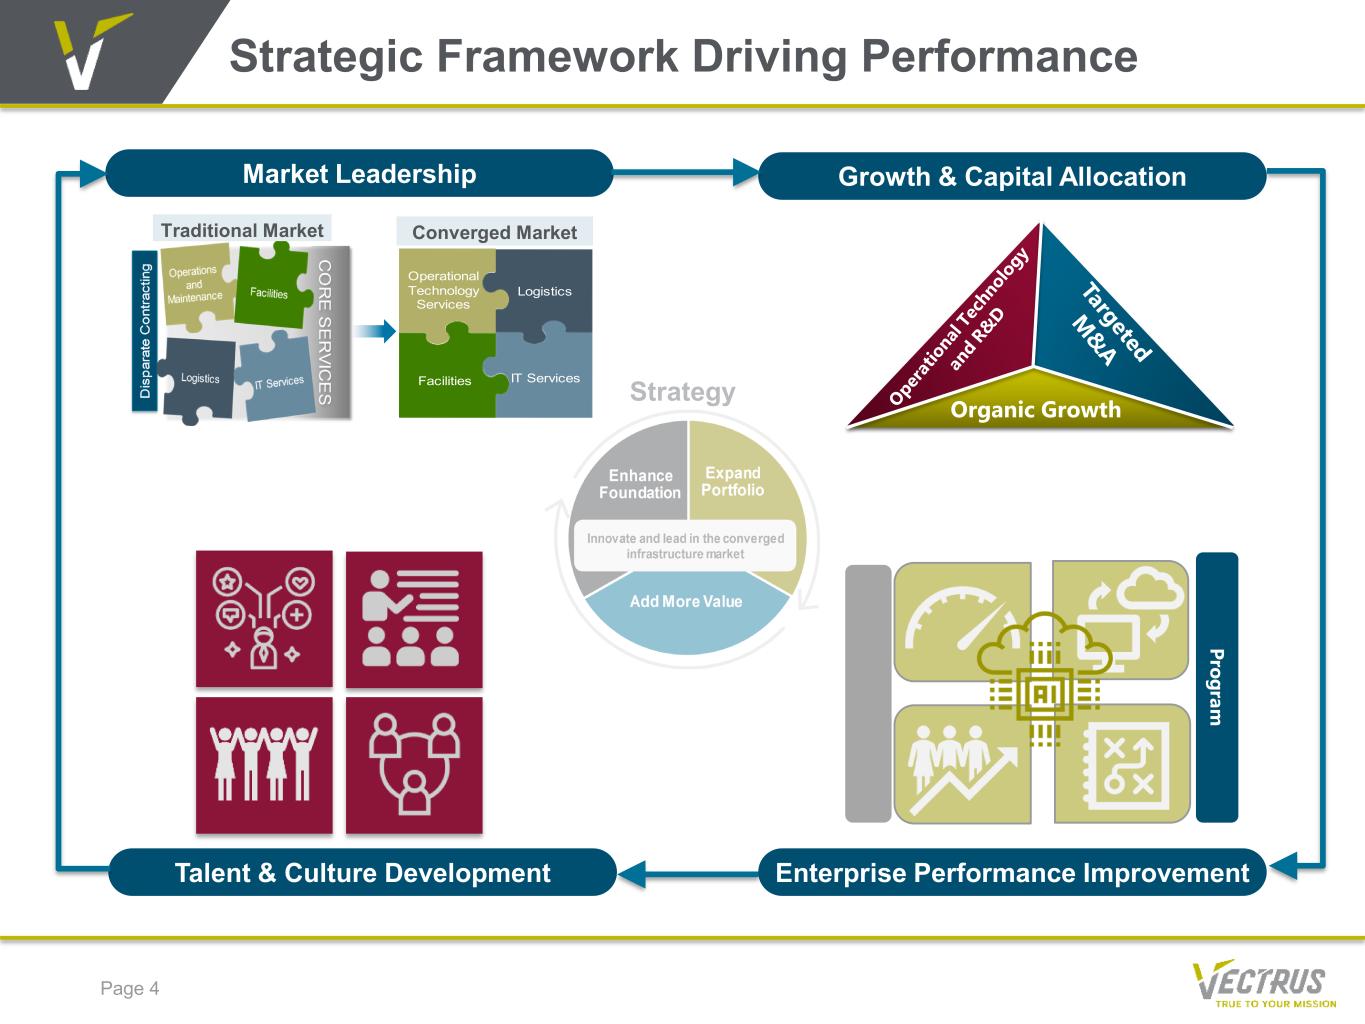
Strategic Framework Driving Performance Page 4 Market Leadership Traditional Market Converged Market Operational Technology Services Logistics IT ServicesFacilities Conv Growth & Capital Allocation Talent & Culture Development Enterprise Performance Improvement Strategy Organic Growth Program
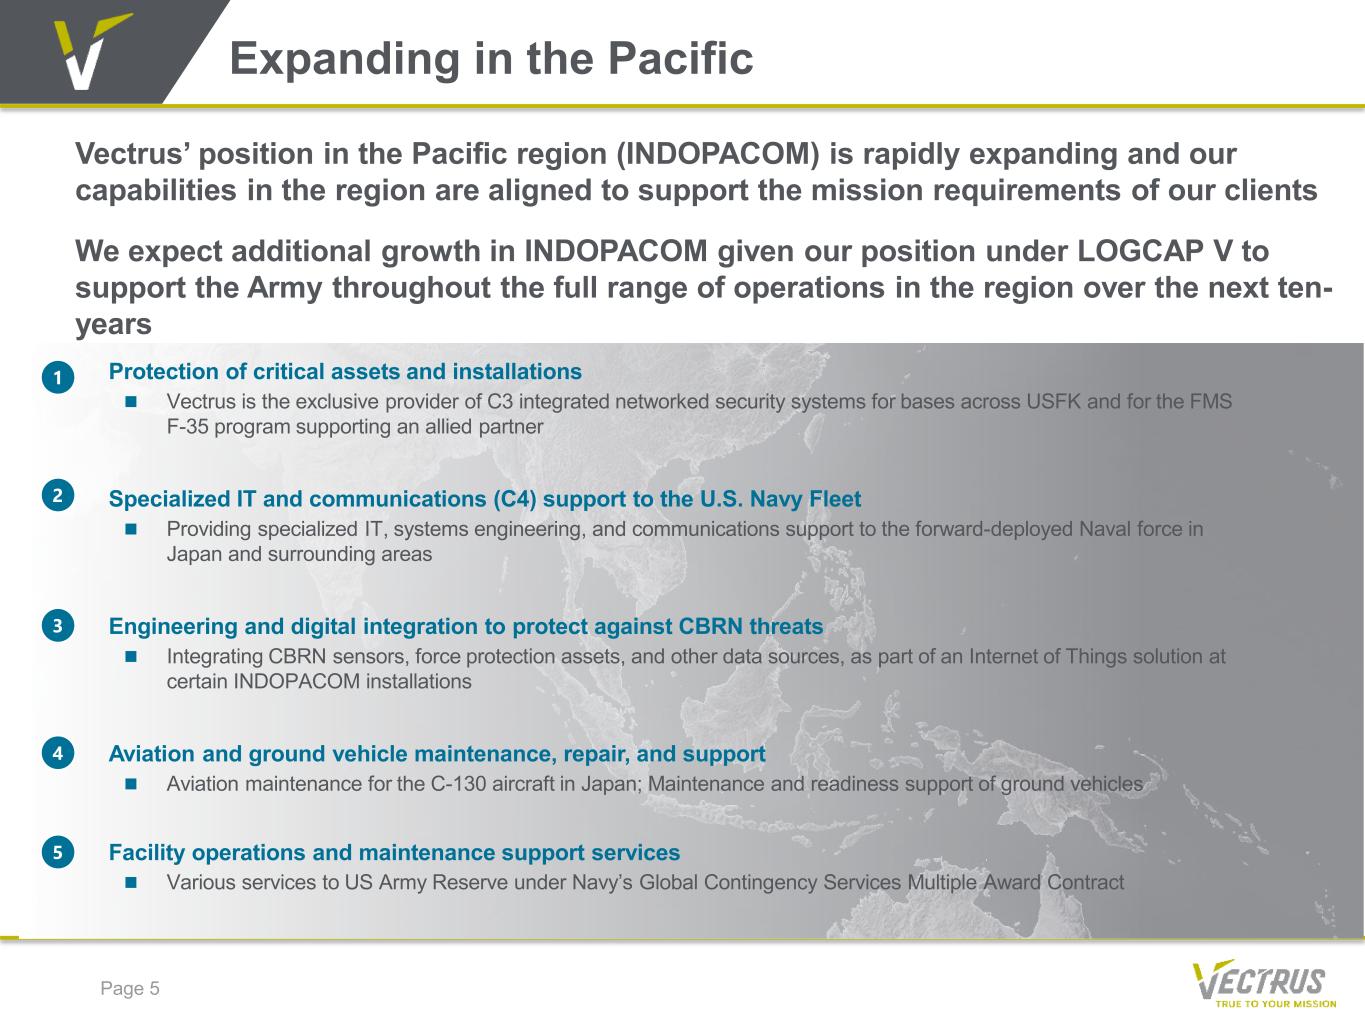
Expanding in the Pacific Page 5 Vectrus’ position in the Pacific region (INDOPACOM) is rapidly expanding and our capabilities in the region are aligned to support the mission requirements of our clients We expect additional growth in INDOPACOM given our position under LOGCAP V to support the Army throughout the full range of operations in the region over the next ten- years 1 Protection of critical assets and installations Vectrus is the exclusive provider of C3 integrated networked security systems for bases across USFK and for the FMS F-35 program supporting an allied partner Specialized IT and communications (C4) support to the U.S. Navy Fleet Providing specialized IT, systems engineering, and communications support to the forward-deployed Naval force in Japan and surrounding areas Engineering and digital integration to protect against CBRN threats Integrating CBRN sensors, force protection assets, and other data sources, as part of an Internet of Things solution at certain INDOPACOM installations Aviation and ground vehicle maintenance, repair, and support Aviation maintenance for the C-130 aircraft in Japan; Maintenance and readiness support of ground vehicles Facility operations and maintenance support services Various services to US Army Reserve under Navy’s Global Contingency Services Multiple Award Contract 2 3 4 5
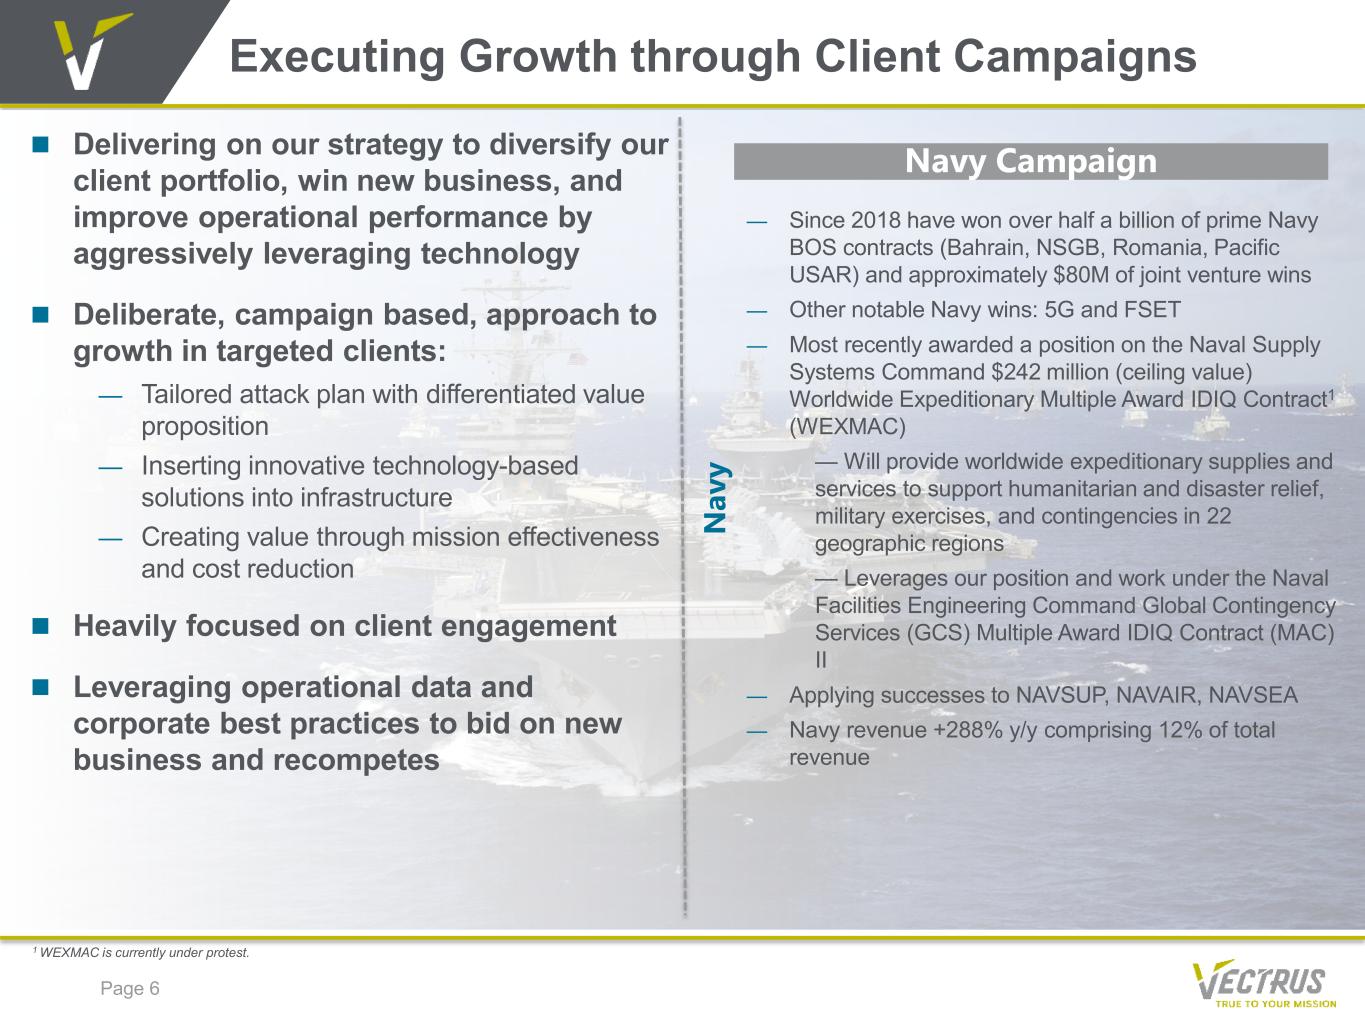
Executing Growth through Client Campaigns Page 6 Delivering on our strategy to diversify our client portfolio, win new business, and improve operational performance by aggressively leveraging technology Deliberate, campaign based, approach to growth in targeted clients: — Tailored attack plan with differentiated value proposition — Inserting innovative technology-based solutions into infrastructure — Creating value through mission effectiveness and cost reduction Heavily focused on client engagement Leveraging operational data and corporate best practices to bid on new business and recompetes Navy Campaign N av y — Since 2018 have won over half a billion of prime Navy BOS contracts (Bahrain, NSGB, Romania, Pacific USAR) and approximately $80M of joint venture wins — Other notable Navy wins: 5G and FSET — Most recently awarded a position on the Naval Supply Systems Command $242 million (ceiling value) Worldwide Expeditionary Multiple Award IDIQ Contract1 (WEXMAC) — Will provide worldwide expeditionary supplies and services to support humanitarian and disaster relief, military exercises, and contingencies in 22 geographic regions — Leverages our position and work under the Naval Facilities Engineering Command Global Contingency Services (GCS) Multiple Award IDIQ Contract (MAC) II — Applying successes to NAVSUP, NAVAIR, NAVSEA — Navy revenue +288% y/y comprising 12% of total revenue 1 WEXMAC is currently under protest.
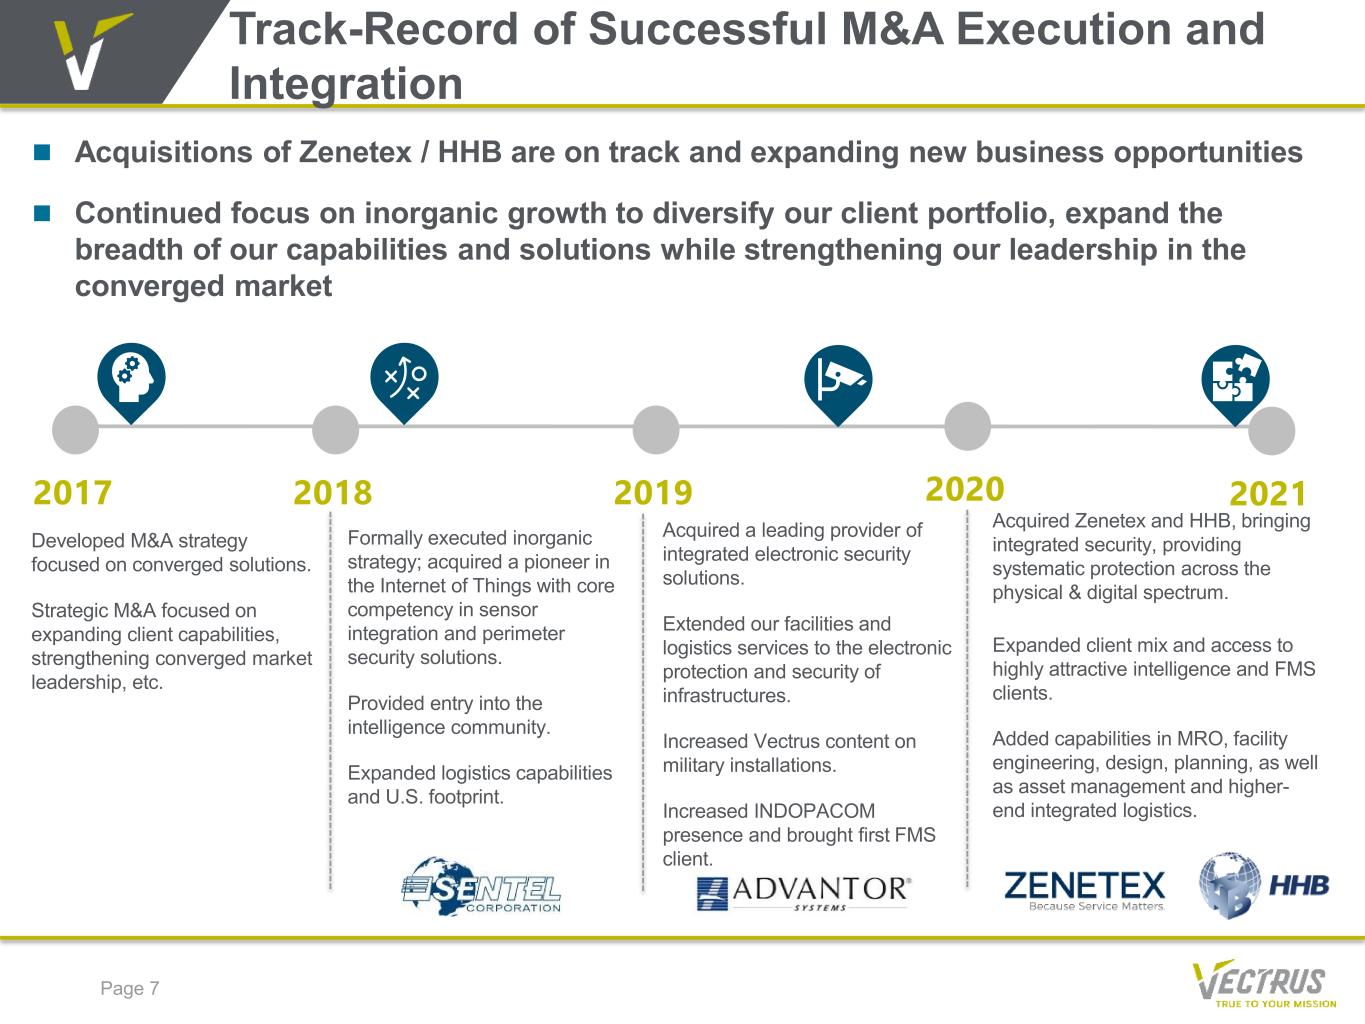
Track-Record of Successful M&A Execution and Integration Page 7 Formally executed inorganic strategy; acquired a pioneer in the Internet of Things with core competency in sensor integration and perimeter security solutions. Provided entry into the intelligence community. Expanded logistics capabilities and U.S. footprint. Acquisitions of Zenetex / HHB are on track and expanding new business opportunities Continued focus on inorganic growth to diversify our client portfolio, expand the breadth of our capabilities and solutions while strengthening our leadership in the converged market 2018 2019 2020 20212017 Developed M&A strategy focused on converged solutions. Strategic M&A focused on expanding client capabilities, strengthening converged market leadership, etc. Acquired a leading provider of integrated electronic security solutions. Extended our facilities and logistics services to the electronic protection and security of infrastructures. Increased Vectrus content on military installations. Increased INDOPACOM presence and brought first FMS client. Acquired Zenetex and HHB, bringing integrated security, providing systematic protection across the physical & digital spectrum. Expanded client mix and access to highly attractive intelligence and FMS clients. Added capabilities in MRO, facility engineering, design, planning, as well as asset management and higher- end integrated logistics.
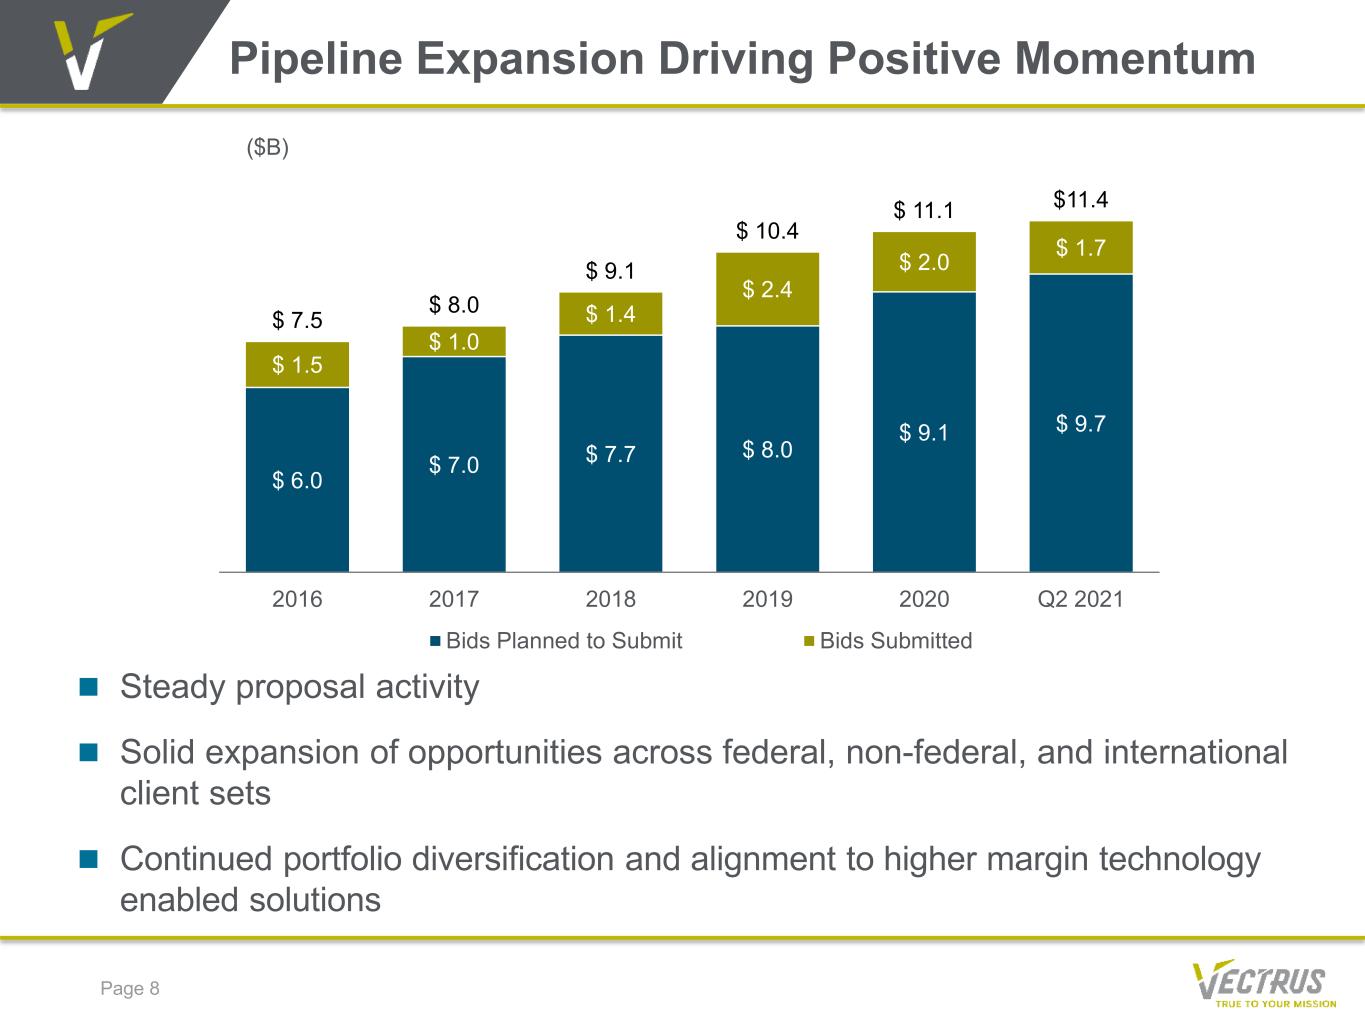
Page 8 Pipeline Expansion Driving Positive Momentum Steady proposal activity Solid expansion of opportunities across federal, non-federal, and international client sets Continued portfolio diversification and alignment to higher margin technology enabled solutions ($B) $ 6.0 $ 7.0 $ 7.7 $ 8.0 $ 9.1 $ 9.7 $ 1.5 $ 1.0 $ 1.4 $ 2.4 $ 2.0 $ 1.7 $ 7.5 $ 8.0 $ 9.1 $ 10.4 $ 11.1 $11.4 2016 2017 2018 2019 2020 Q2 2021 Bids Planned to Submit Bids Submitted
Page 9 1 See appendix for reconciliation of non-GAAP measures. 2 Definition of metric updated in Q1 2021 to add-back amortization of acquired intangible assets. Q2’21 Financial Results Revenue ($M) Operating Margin & Adj. EBITDA Margin1 Adj. Diluted EPS1,2 $336.1 $470.8 Q2'20 Q2'21 $0.31 $1.52 Q2'20 Q2'21 Diluted EPS $0.09 $1.35 Q2'20 Q2'21 0.7% 2.0% 4.8% 5.6% Q2'20 Q2'21
Page 10 Q2’21 Revenue by Category Customer Geographic Region Contract Type 1 2020 T&M immaterial and included in cost-type. 68% 23% 4% 5% Q2'20 Army Air Force Navy Other 63% 25% 11% 1% Q2'20 Middle East US Europe Asia 72% 28% Q2'20 Cost-type Fixed Price 1 73% 24% 3% Q2'21 Cost-type Fixed Price T&M 55%31% 8% 6% Q2'21 Middle East US Europe Asia 66% 13% 12% 9% Q2'21 Army Air Force Navy Other
Solid Backlog and Book-to-Bill Page 11 Total Q2’21 Pro Forma Backlog of $5.3 Billion Pro forma backlog includes contracts under protest ~$0.4B Pro forma backlog is ~3.0x the 2021 revenue mid- point, providing insight into future revenue and cash flow generation Backlog1 ($B) Trailing 12-Month Book-to-Bill Ratio TTM Pro Forma Book-to-Bill Ratio is 1.5x Recent OMDAC award included in backlog as stop work order lifted 1.4 x 1.5 x 2.1 x 0.8 x 1.2 x 1.5 x Q2'20 Q3'20 Q4'20 Q1'21 Q2'21 Q2'21PF $ 0.9 $ 1.0 $ 0.9 $ 0.9 $ 1.3 $ 1.3 $ 2.9 $ 2.7 $ 4.2 $ 3.6 $ 3.6 $ 3.6 $ 0.4 Q2'20 Q3'20 Q4'20 Q1 '21 Q2 '21 Q2'21PF BacklogProtest Unfunded Funded $4.5 $5.3$5.1 $3.7$3.8 $4.9 1 Total Backlog represents firm orders and potential options on multi-year contracts, excluding potential orders under IDIQ contracts. 2 Pro forma Total Backlog includes protested awards. 2 2
($M) 2020 2021 $ y/y change % y/y change YTD Net Cash Provided by (Used in) Operating Activities $34.4 $14.0 ($20.4) (59.3%) Cash $62.7 $69.8 $7.1 11.3% Receivables $260.3 $353.8 $93.5 35.9% Debt $67.5 $175.0 $107.5 159.3% Net Debt1 $4.8 $105.2 $100.4 NA Leverage Ratio (x) 1.08x 1.76x .68x 63.0% Page 12 Cash Flow and Liquidity 1 Net Debt = Debt – Cash YTD Cash Flow from Operations of $14.0 million; prior year included $13 million of CARES Act benefit Strong balance sheet and financial position First Half
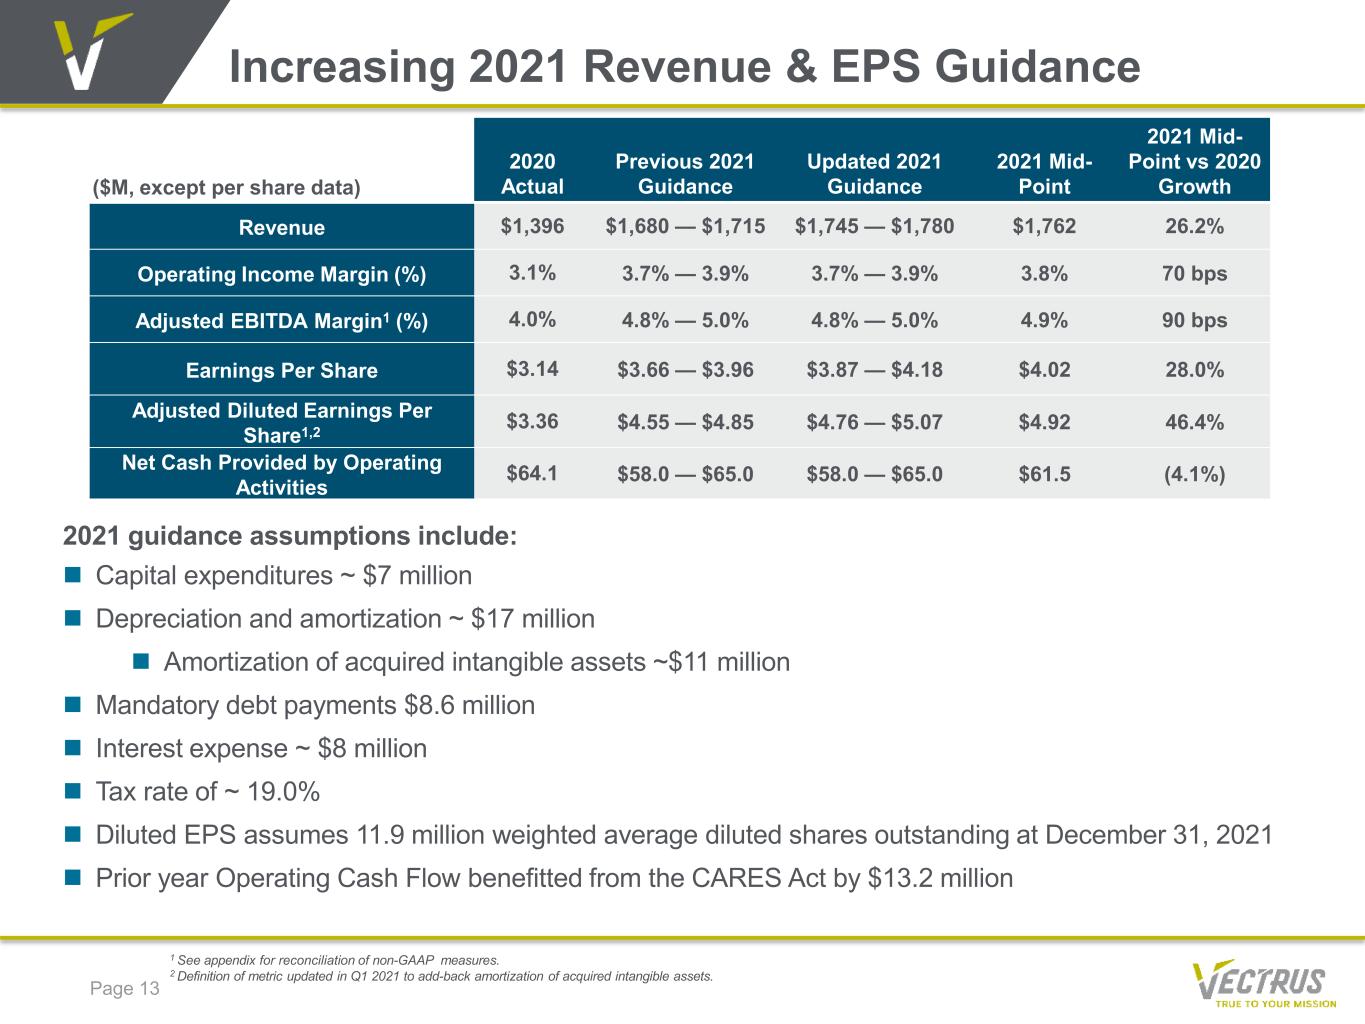
Increasing 2021 Revenue & EPS Guidance 2021 guidance assumptions include: Capital expenditures ~ $7 million Depreciation and amortization ~ $17 million Amortization of acquired intangible assets ~$11 million Mandatory debt payments $8.6 million Interest expense ~ $8 million Tax rate of ~ 19.0% Diluted EPS assumes 11.9 million weighted average diluted shares outstanding at December 31, 2021 Prior year Operating Cash Flow benefitted from the CARES Act by $13.2 million Page 13 1 See appendix for reconciliation of non-GAAP measures. 2 Definition of metric updated in Q1 2021 to add-back amortization of acquired intangible assets. ($M, except per share data) 2020 Actual Previous 2021 Guidance Updated 2021 Guidance 2021 Mid- Point 2021 Mid- Point vs 2020 Growth Revenue $1,396 $1,680 — $1,715 $1,745 — $1,780 $1,762 26.2% Operating Income Margin (%) 3.1% 3.7% — 3.9% 3.7% — 3.9% 3.8% 70 bps Adjusted EBITDA Margin1 (%) 4.0% 4.8% — 5.0% 4.8% — 5.0% 4.9% 90 bps Earnings Per Share $3.14 $3.66 — $3.96 $3.87 — $4.18 $4.02 28.0% Adjusted Diluted Earnings Per Share1,2 $3.36 $4.55 — $4.85 $4.76 — $5.07 $4.92 46.4% Net Cash Provided by Operating Activities $64.1 $58.0 — $65.0 $58.0 — $65.0 $61.5 (4.1%)
APPENDIX
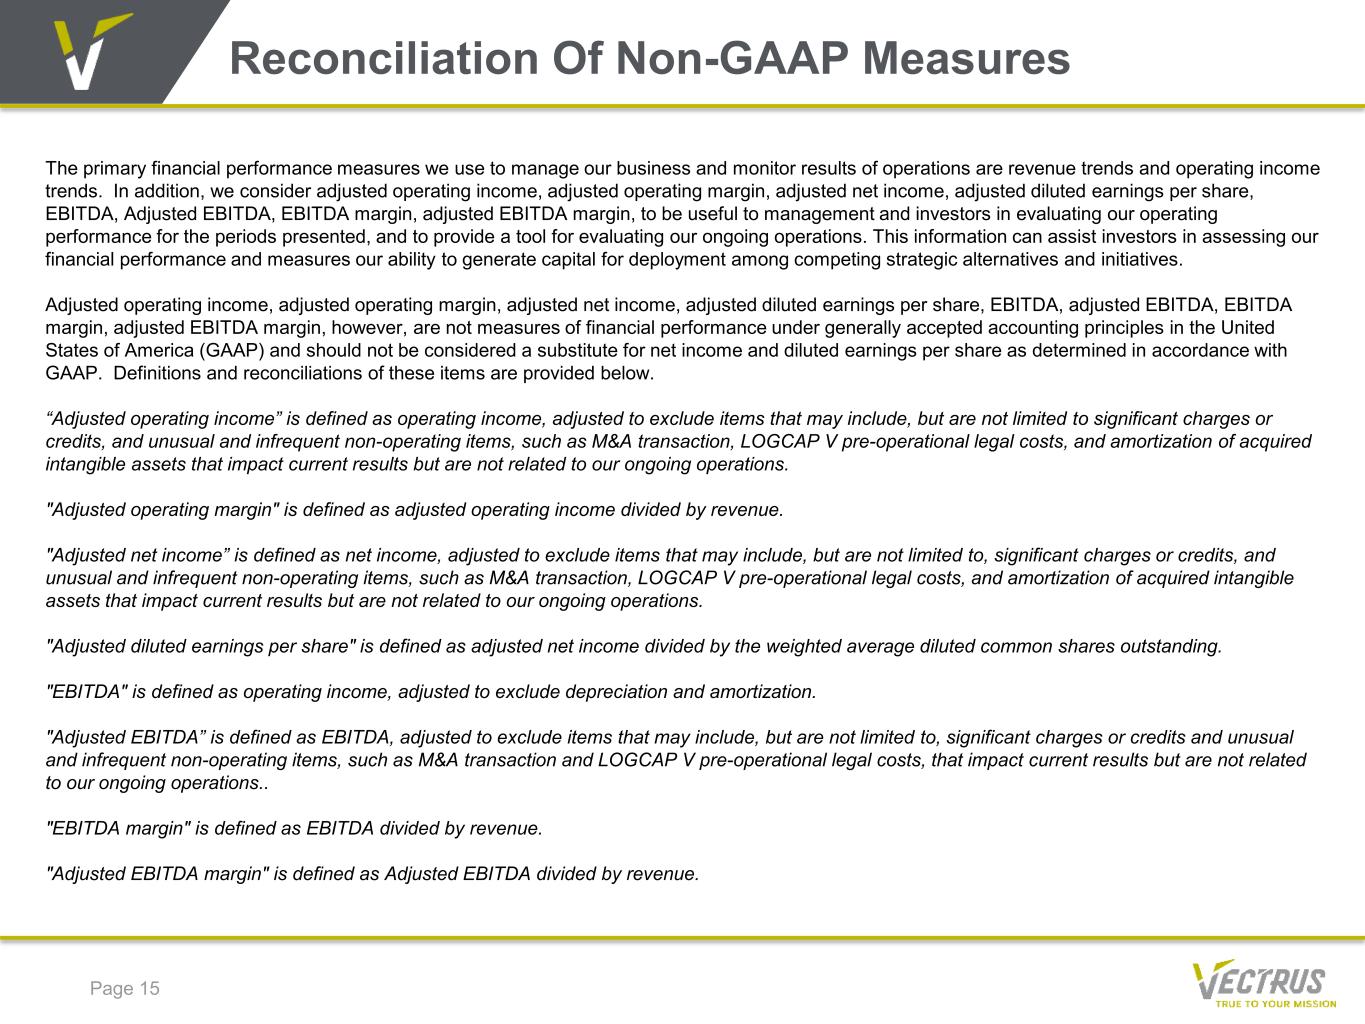
Reconciliation Of Non-GAAP Measures Page 15 The primary financial performance measures we use to manage our business and monitor results of operations are revenue trends and operating income trends. In addition, we consider adjusted operating income, adjusted operating margin, adjusted net income, adjusted diluted earnings per share, EBITDA, Adjusted EBITDA, EBITDA margin, adjusted EBITDA margin, to be useful to management and investors in evaluating our operating performance for the periods presented, and to provide a tool for evaluating our ongoing operations. This information can assist investors in assessing our financial performance and measures our ability to generate capital for deployment among competing strategic alternatives and initiatives. Adjusted operating income, adjusted operating margin, adjusted net income, adjusted diluted earnings per share, EBITDA, adjusted EBITDA, EBITDA margin, adjusted EBITDA margin, however, are not measures of financial performance under generally accepted accounting principles in the United States of America (GAAP) and should not be considered a substitute for net income and diluted earnings per share as determined in accordance with GAAP. Definitions and reconciliations of these items are provided below. “Adjusted operating income” is defined as operating income, adjusted to exclude items that may include, but are not limited to significant charges or credits, and unusual and infrequent non-operating items, such as M&A transaction, LOGCAP V pre-operational legal costs, and amortization of acquired intangible assets that impact current results but are not related to our ongoing operations. "Adjusted operating margin" is defined as adjusted operating income divided by revenue. "Adjusted net income” is defined as net income, adjusted to exclude items that may include, but are not limited to, significant charges or credits, and unusual and infrequent non-operating items, such as M&A transaction, LOGCAP V pre-operational legal costs, and amortization of acquired intangible assets that impact current results but are not related to our ongoing operations. "Adjusted diluted earnings per share" is defined as adjusted net income divided by the weighted average diluted common shares outstanding. "EBITDA" is defined as operating income, adjusted to exclude depreciation and amortization. "Adjusted EBITDA” is defined as EBITDA, adjusted to exclude items that may include, but are not limited to, significant charges or credits and unusual and infrequent non-operating items, such as M&A transaction and LOGCAP V pre-operational legal costs, that impact current results but are not related to our ongoing operations.. "EBITDA margin" is defined as EBITDA divided by revenue. "Adjusted EBITDA margin" is defined as Adjusted EBITDA divided by revenue.
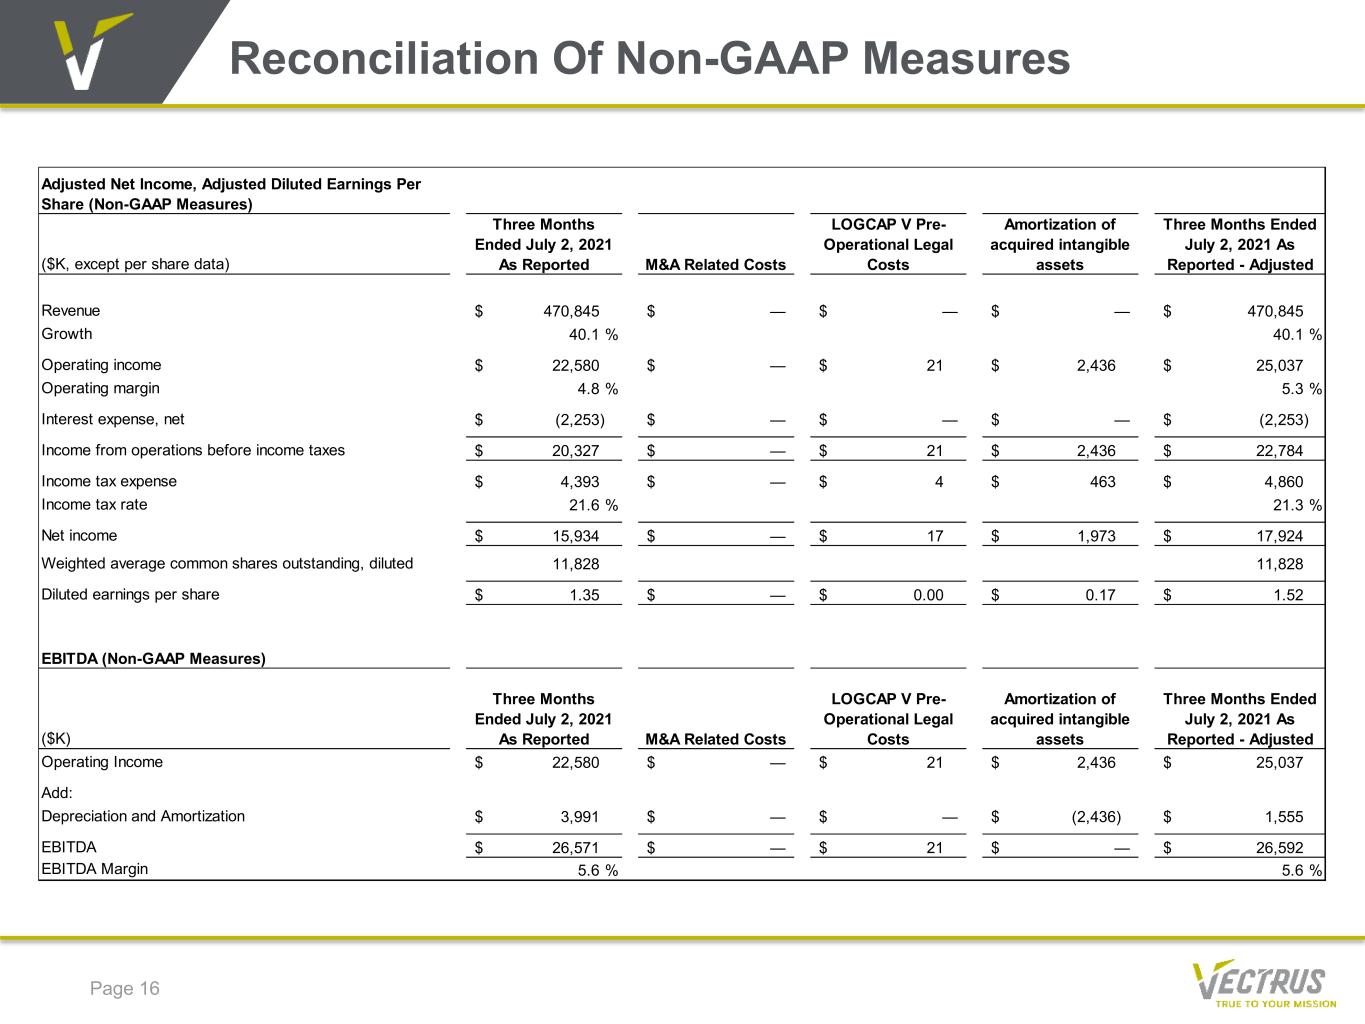
Reconciliation Of Non-GAAP Measures Page 16 Adjusted Net Income, Adjusted Diluted Earnings Per Share (Non-GAAP Measures) ($K, except per share data) Three Months Ended July 2, 2021 As Reported M&A Related Costs LOGCAP V Pre- Operational Legal Costs Amortization of acquired intangible assets Three Months Ended July 2, 2021 As Reported - Adjusted Revenue 470,845$ —$ —$ —$ 470,845$ Growth 40.1 % 40.1 % Operating income 22,580$ —$ 21$ 2,436$ 25,037$ Operating margin 4.8 % 5.3 % Interest expense, net (2,253)$ —$ —$ —$ (2,253)$ Income from operations before income taxes 20,327$ —$ 21$ 2,436$ 22,784$ Income tax expense 4,393$ —$ 4$ 463$ 4,860$ Income tax rate 21.6 % 21.3 % Net income 15,934$ —$ 17$ 1,973$ 17,924$ Weighted average common shares outstanding, diluted 11,828 11,828 Diluted earnings per share 1.35$ —$ 0.00$ 0.17$ 1.52$ EBITDA (Non-GAAP Measures) ($K) Three Months Ended July 2, 2021 As Reported M&A Related Costs LOGCAP V Pre- Operational Legal Costs Amortization of acquired intangible assets Three Months Ended July 2, 2021 As Reported - Adjusted Operating Income 22,580$ —$ 21$ 2,436$ 25,037$ Add: Depreciation and Amortization 3,991$ —$ —$ (2,436)$ 1,555$ EBITDA 26,571$ —$ 21$ —$ 26,592$ EBITDA Margin 5.6 % 5.6 %
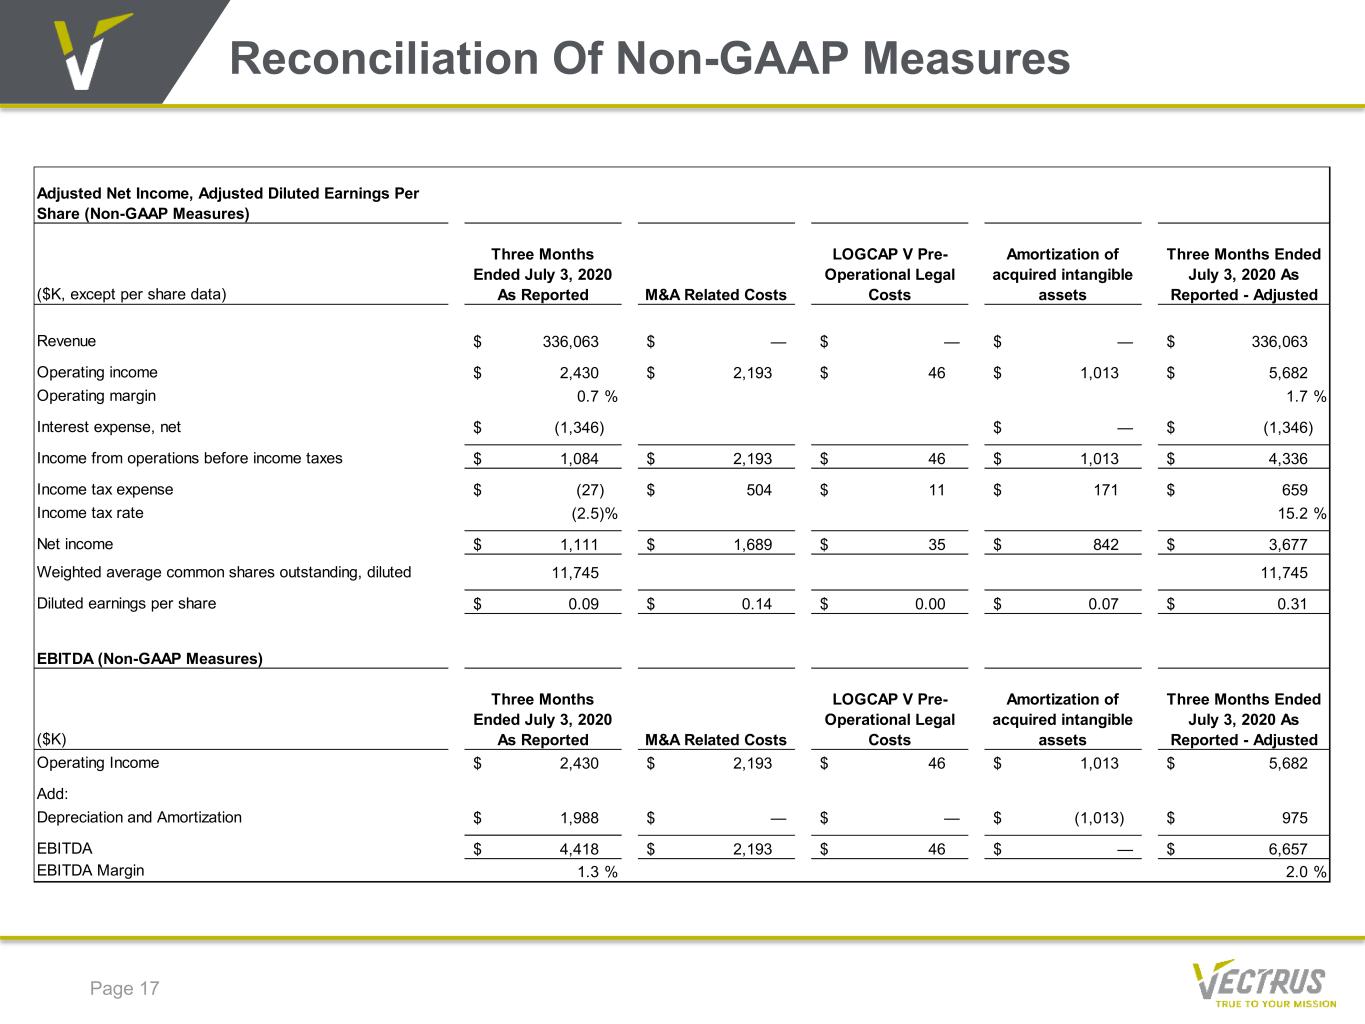
Reconciliation Of Non-GAAP Measures Page 17 Adjusted Net Income, Adjusted Diluted Earnings Per Share (Non-GAAP Measures) ($K, except per share data) Three Months Ended July 3, 2020 As Reported M&A Related Costs LOGCAP V Pre- Operational Legal Costs Amortization of acquired intangible assets Three Months Ended July 3, 2020 As Reported - Adjusted Revenue 336,063$ —$ —$ —$ 336,063$ Operating income 2,430$ 2,193$ 46$ 1,013$ 5,682$ Operating margin 0.7 % 1.7 % Interest expense, net (1,346)$ —$ (1,346)$ Income from operations before income taxes 1,084$ 2,193$ 46$ 1,013$ 4,336$ Income tax expense (27)$ 504$ 11$ 171$ 659$ Income tax rate (2.5)% 15.2 % Net income 1,111$ 1,689$ 35$ 842$ 3,677$ Weighted average common shares outstanding, diluted 11,745 11,745 Diluted earnings per share 0.09$ 0.14$ 0.00$ 0.07$ 0.31$ EBITDA (Non-GAAP Measures) ($K) Three Months Ended July 3, 2020 As Reported M&A Related Costs LOGCAP V Pre- Operational Legal Costs Amortization of acquired intangible assets Three Months Ended July 3, 2020 As Reported - Adjusted Operating Income 2,430$ 2,193$ 46$ 1,013$ 5,682$ Add: Depreciation and Amortization 1,988$ —$ —$ (1,013)$ 975$ EBITDA 4,418$ 2,193$ 46$ —$ 6,657$ EBITDA Margin 1.3 % 2.0 %
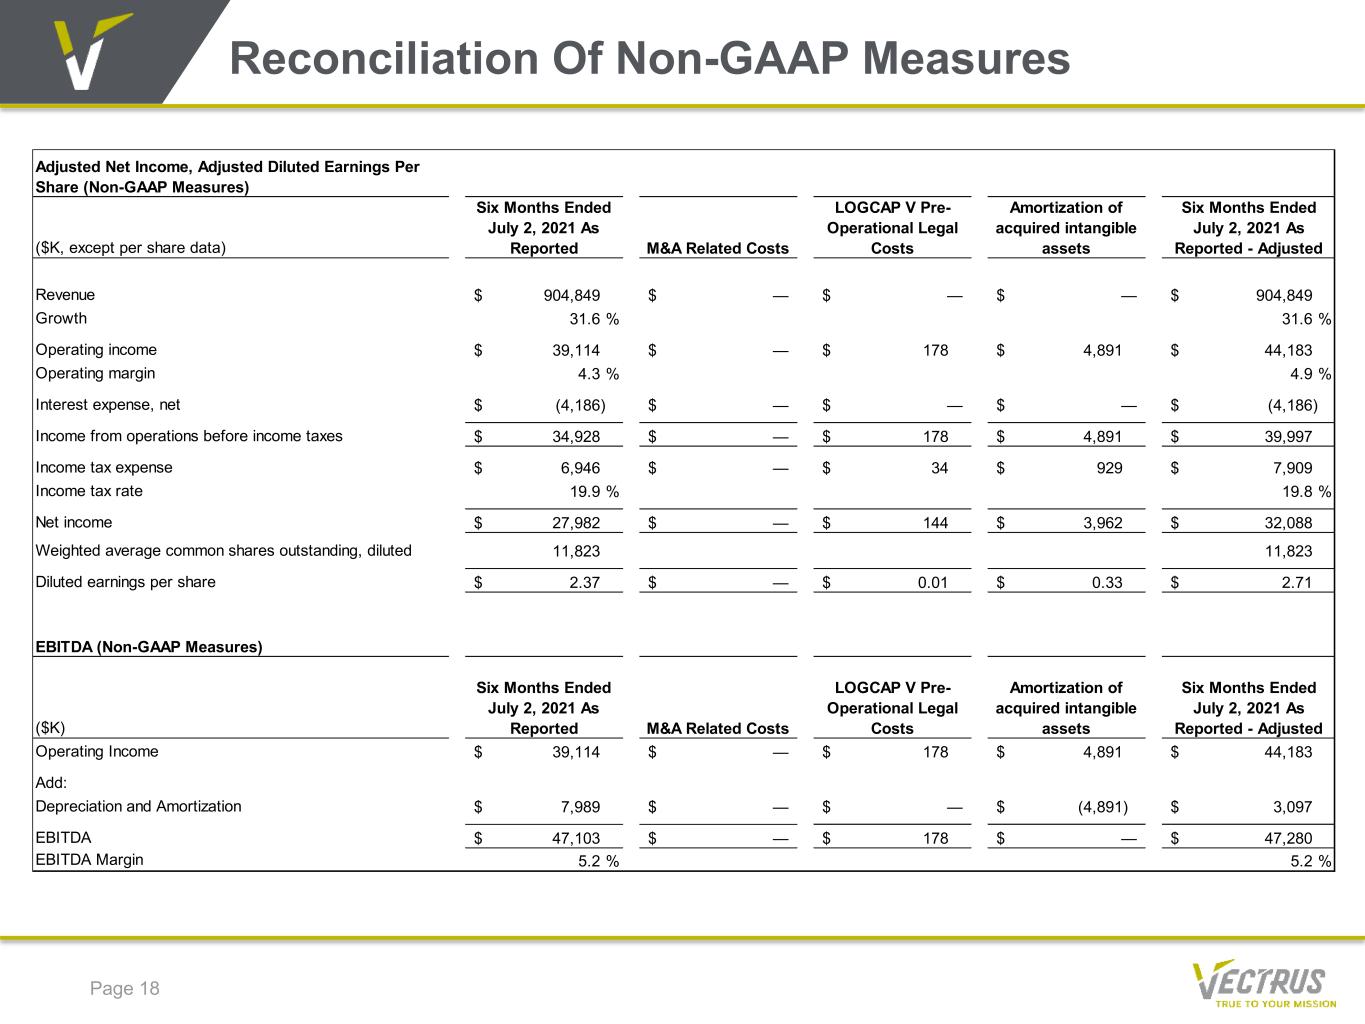
Reconciliation Of Non-GAAP Measures Page 18 Adjusted Net Income, Adjusted Diluted Earnings Per Share (Non-GAAP Measures) ($K, except per share data) Six Months Ended July 2, 2021 As Reported M&A Related Costs LOGCAP V Pre- Operational Legal Costs Amortization of acquired intangible assets Six Months Ended July 2, 2021 As Reported - Adjusted Revenue 904,849$ —$ —$ —$ 904,849$ Growth 31.6 % 31.6 % Operating income 39,114$ —$ 178$ 4,891$ 44,183$ Operating margin 4.3 % 4.9 % Interest expense, net (4,186)$ —$ —$ —$ (4,186)$ Income from operations before income taxes 34,928$ —$ 178$ 4,891$ 39,997$ Income tax expense 6,946$ —$ 34$ 929$ 7,909$ Income tax rate 19.9 % 19.8 % Net income 27,982$ —$ 144$ 3,962$ 32,088$ Weighted average common shares outstanding, diluted 11,823 11,823 Diluted earnings per share 2.37$ —$ 0.01$ 0.33$ 2.71$ EBITDA (Non-GAAP Measures) ($K) Six Months Ended July 2, 2021 As Reported M&A Related Costs LOGCAP V Pre- Operational Legal Costs Amortization of acquired intangible assets Six Months Ended July 2, 2021 As Reported - Adjusted Operating Income 39,114$ —$ 178$ 4,891$ 44,183$ Add: Depreciation and Amortization 7,989$ —$ —$ (4,891)$ 3,097$ EBITDA 47,103$ —$ 178$ —$ 47,280$ EBITDA Margin 5.2 % 5.2 %
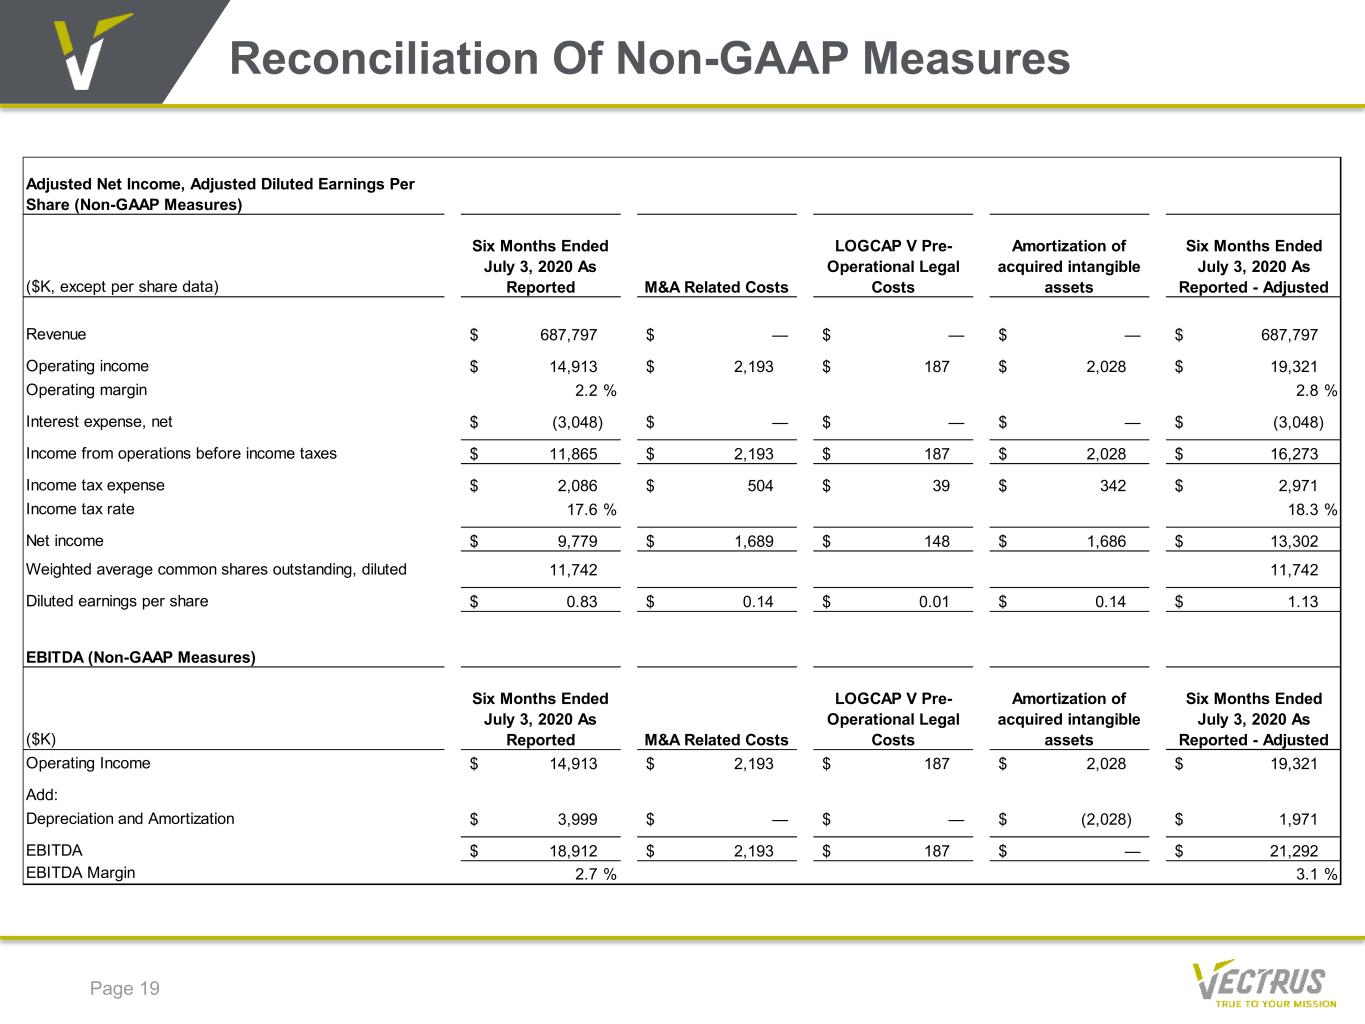
Reconciliation Of Non-GAAP Measures Page 19 Adjusted Net Income, Adjusted Diluted Earnings Per Share (Non-GAAP Measures) ($K, except per share data) Six Months Ended July 3, 2020 As Reported M&A Related Costs LOGCAP V Pre- Operational Legal Costs Amortization of acquired intangible assets Six Months Ended July 3, 2020 As Reported - Adjusted Revenue 687,797$ —$ —$ —$ 687,797$ Operating income 14,913$ 2,193$ 187$ 2,028$ 19,321$ Operating margin 2.2 % 2.8 % Interest expense, net (3,048)$ —$ —$ —$ (3,048)$ Income from operations before income taxes 11,865$ 2,193$ 187$ 2,028$ 16,273$ Income tax expense 2,086$ 504$ 39$ 342$ 2,971$ Income tax rate 17.6 % 18.3 % Net income 9,779$ 1,689$ 148$ 1,686$ 13,302$ Weighted average common shares outstanding, diluted 11,742 11,742 Diluted earnings per share 0.83$ 0.14$ 0.01$ 0.14$ 1.13$ EBITDA (Non-GAAP Measures) ($K) Six Months Ended July 3, 2020 As Reported M&A Related Costs LOGCAP V Pre- Operational Legal Costs Amortization of acquired intangible assets Six Months Ended July 3, 2020 As Reported - Adjusted Operating Income 14,913$ 2,193$ 187$ 2,028$ 19,321$ Add: Depreciation and Amortization 3,999$ —$ —$ (2,028)$ 1,971$ EBITDA 18,912$ 2,193$ 187$ —$ 21,292$ EBITDA Margin 2.7 % 3.1 %
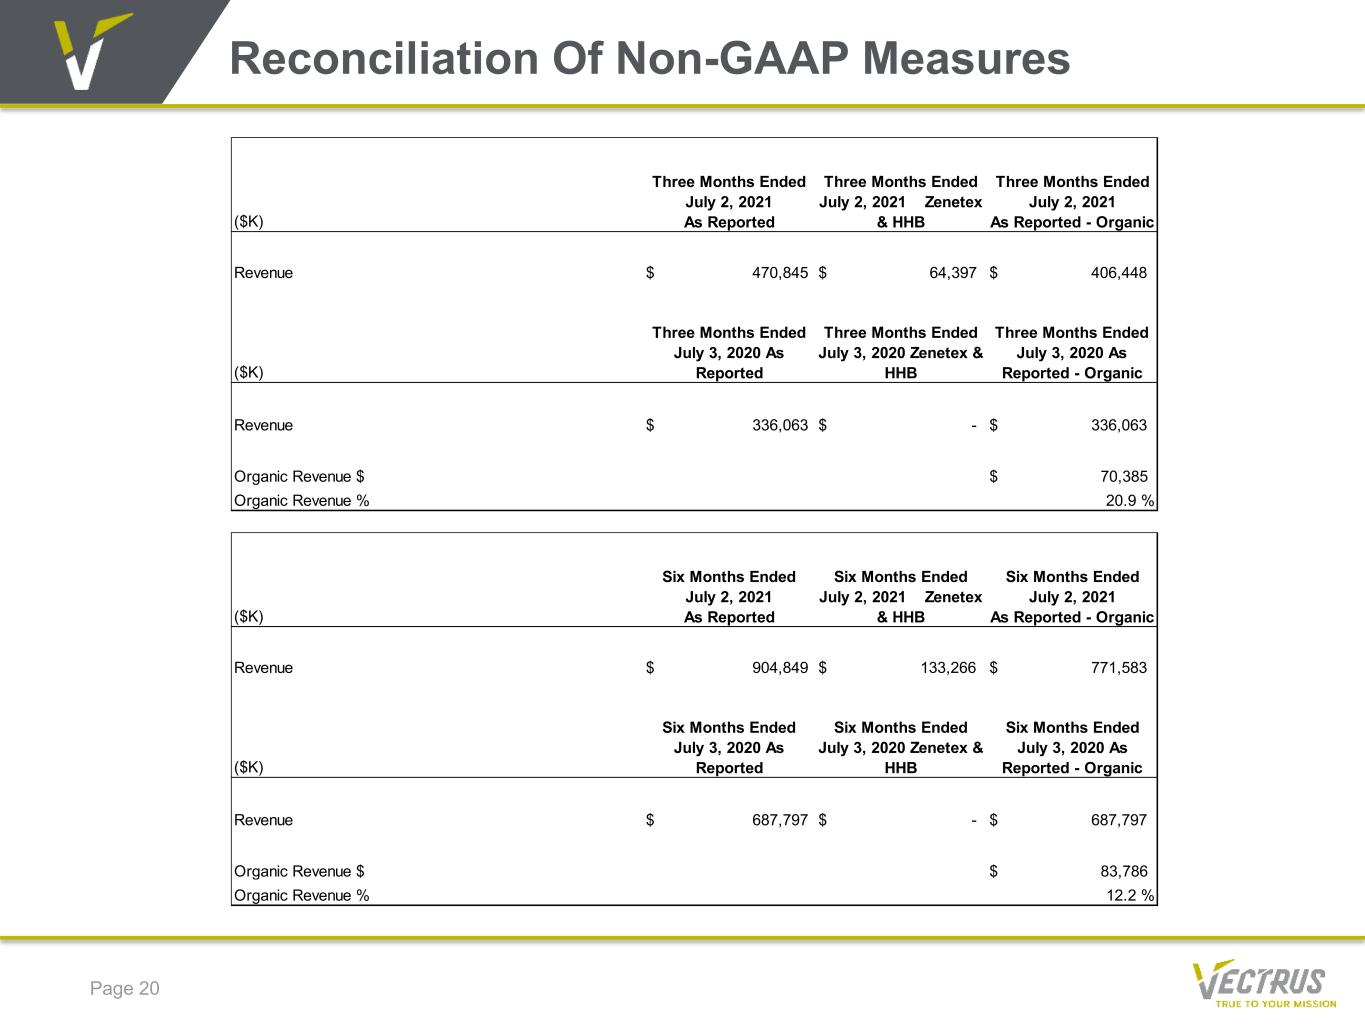
Reconciliation Of Non-GAAP Measures Page 20 ($K) Three Months Ended July 2, 2021 As Reported Three Months Ended July 2, 2021 Zenetex & HHB Three Months Ended July 2, 2021 As Reported - Organic Revenue $ 470,845 $ 64,397 $ 406,448 ($K) Three Months Ended July 3, 2020 As Reported Three Months Ended July 3, 2020 Zenetex & HHB Three Months Ended July 3, 2020 As Reported - Organic Revenue $ 336,063 $ - $ 336,063 Organic Revenue $ $ 70,385 Organic Revenue % 20.9 % ($K) Six Months Ended July 2, 2021 As Reported Six Months Ended July 2, 2021 Zenetex & HHB Six Months Ended July 2, 2021 As Reported - Organic Revenue $ 904,849 $ 133,266 $ 771,583 ($K) Six Months Ended July 3, 2020 As Reported Six Months Ended July 3, 2020 Zenetex & HHB Six Months Ended July 3, 2020 As Reported - Organic Revenue $ 687,797 $ - $ 687,797 Organic Revenue $ $ 83,786 Organic Revenue % 12.2 %