
VVX 8-K
V2X, Inc. (VVX)
8-K
2021-11-09
For: 2021-11-09
View Original
Added on
April 07, 2026
UNITED STATES
SECURITIES AND EXCHANGE COMMISSION
Washington, D.C. 20549
FORM 8-K
CURRENT REPORT
Pursuant to Section 13 or 15(d) of
the Securities Exchange Act of 1934
Date of Report (Date of earliest event reported): November 9, 2021
(Exact name of Registrant as specified in its charter)
(State or other jurisdiction of incorporation) | (Commission File Number) | (I.R.S. Employer Identification No.) | ||||||
(Address of principal executive offices) (Zip Code)
Registrant's telephone number, including area code: (719 ) 591-3600
Not Applicable
(Former name or former address, if changed since last report)
Securities Registered Under Section 12(b) of the Act:
Title of each class | Trading symbol(s) | Name of each exchange on which registered | ||||||
Check the appropriate box below if the Form 8-K filing is intended to simultaneously satisfy the filing obligation of the registrant under any of the following provisions:
Indicate by check mark whether the registrant is an emerging growth company as defined in Rule 405 of the Securities Act of 1933 (§230.405 of this chapter) or Rule 12b-2 of the Securities Exchange Act of 1934 (§240.12b-2 of this chapter).
Emerging growth company ☐
If an emerging growth company, indicate by check mark if the registrant has elected not to use the extended transition period for complying with any new or revised financial accounting standards provided pursuant to Section 13(a) of the Exchange Act. ☐
ITEM 2.02 Results of Operations and Financial Condition.
Attached hereto as Exhibit 99.1 and incorporated by reference herein is a press release issued by Vectrus, Inc. (the “Company”) on November 9, 2021 that includes financial information for the Company for the third quarter of 2021 and guidance for fiscal 2021. This information shall not be deemed filed for purposes of Section 18 of the Securities Exchange Act of 1934, as amended (the “Exchange Act”) or incorporated by reference into any filing under the Securities Act of 1933, as amended (the “Securities Act”), or the Exchange Act, except as shall be expressly set forth by specific reference in such filing.
ITEM 7.01 Regulation FD Disclosure.
Mr. Charles Prow, President and Chief Executive Officer, and Ms. Susan Lynch, Senior Vice President and Chief Financial Officer, will present the financial information for the Company for the third quarter of 2021 and guidance for fiscal 2021 on November 9, 2021. A copy of the presentation is attached hereto and incorporated by reference herein as Exhibit 99.2. This information is furnished pursuant to Item 7.01 Regulation FD Disclosure and shall not be deemed filed for purposes of Section 18 of the Exchange Act or incorporated by reference into any filing under the Securities Act or the Exchange Act, except as shall be expressly set forth by specific reference in such filing.
ITEM 9.01 Financial Statements and Exhibits
(d) Exhibits.
| Exhibit No. | Description | |||||||
SIGNATURES
Pursuant to the requirements of the Securities Exchange Act of 1934, the registrant has duly caused this report to be signed on its behalf by the undersigned hereunto duly authorized.
| Date: November 9, 2021 | VECTRUS, INC. | |||||||
| By: | /s/ Courtney A. Schoch | |||||||
| Its: | Deputy General Counsel, Corporate and Corporate Secretary | |||||||
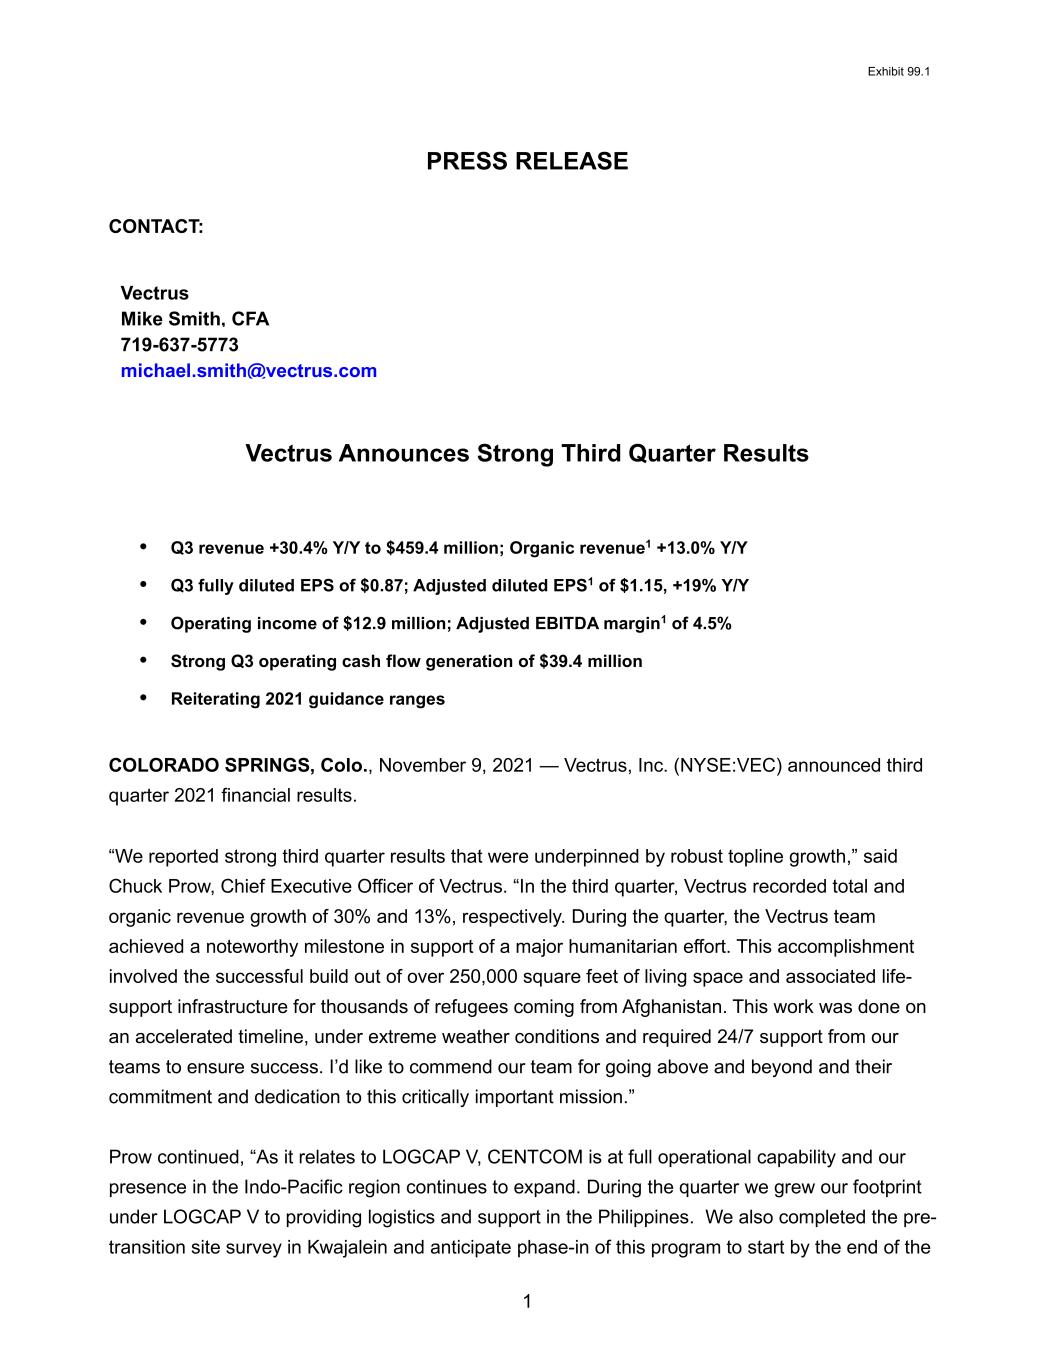
Exhibit 99.1 1 PRESS RELEASE CONTACT: Vectrus Mike Smith, CFA 719-637-5773 [email protected] Vectrus Announces Strong Third Quarter Results • Q3 revenue +30.4% Y/Y to $459.4 million; Organic revenue1 +13.0% Y/Y • Q3 fully diluted EPS of $0.87; Adjusted diluted EPS1 of $1.15, +19% Y/Y • Operating income of $12.9 million; Adjusted EBITDA margin1 of 4.5% • Strong Q3 operating cash flow generation of $39.4 million • Reiterating 2021 guidance ranges COLORADO SPRINGS, Colo., November 9, 2021 — Vectrus, Inc. (NYSE:VEC) announced third quarter 2021 financial results. “We reported strong third quarter results that were underpinned by robust topline growth,” said Chuck Prow, Chief Executive Officer of Vectrus. “In the third quarter, Vectrus recorded total and organic revenue growth of 30% and 13%, respectively. During the quarter, the Vectrus team achieved a noteworthy milestone in support of a major humanitarian effort. This accomplishment involved the successful build out of over 250,000 square feet of living space and associated life- support infrastructure for thousands of refugees coming from Afghanistan. This work was done on an accelerated timeline, under extreme weather conditions and required 24/7 support from our teams to ensure success. I’d like to commend our team for going above and beyond and their commitment and dedication to this critically important mission.” Prow continued, “As it relates to LOGCAP V, CENTCOM is at full operational capability and our presence in the Indo-Pacific region continues to expand. During the quarter we grew our footprint under LOGCAP V to providing logistics and support in the Philippines. We also completed the pre- transition site survey in Kwajalein and anticipate phase-in of this program to start by the end of the
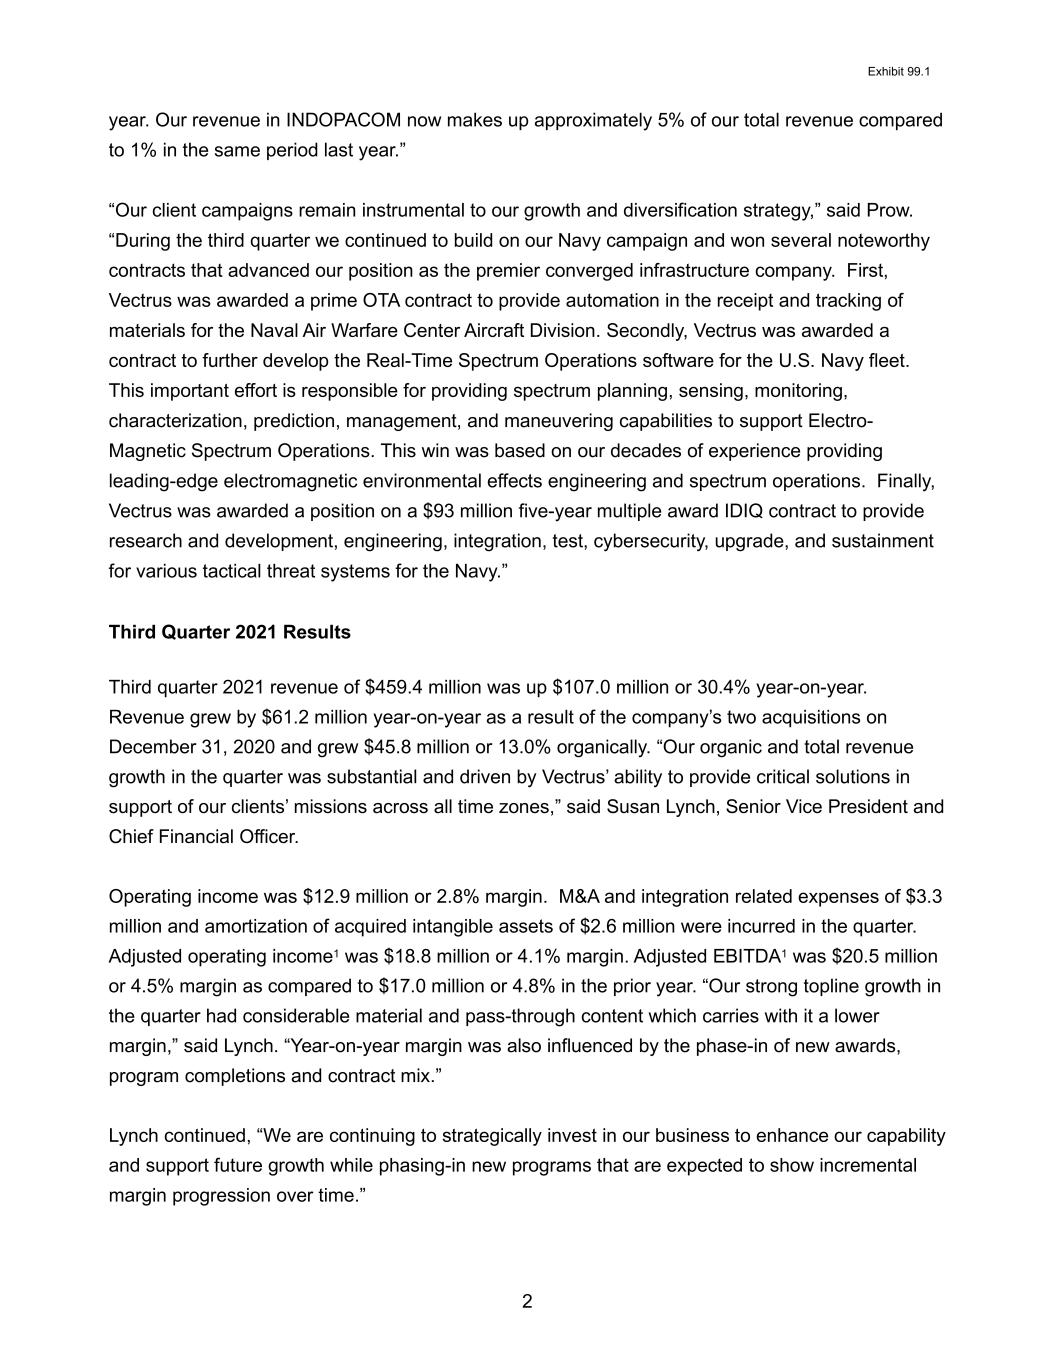
Exhibit 99.1 2 year. Our revenue in INDOPACOM now makes up approximately 5% of our total revenue compared to 1% in the same period last year.” “Our client campaigns remain instrumental to our growth and diversification strategy,” said Prow. “During the third quarter we continued to build on our Navy campaign and won several noteworthy contracts that advanced our position as the premier converged infrastructure company. First, Vectrus was awarded a prime OTA contract to provide automation in the receipt and tracking of materials for the Naval Air Warfare Center Aircraft Division. Secondly, Vectrus was awarded a contract to further develop the Real-Time Spectrum Operations software for the U.S. Navy fleet. This important effort is responsible for providing spectrum planning, sensing, monitoring, characterization, prediction, management, and maneuvering capabilities to support Electro- Magnetic Spectrum Operations. This win was based on our decades of experience providing leading-edge electromagnetic environmental effects engineering and spectrum operations. Finally, Vectrus was awarded a position on a $93 million five-year multiple award IDIQ contract to provide research and development, engineering, integration, test, cybersecurity, upgrade, and sustainment for various tactical threat systems for the Navy.” Third Quarter 2021 Results Third quarter 2021 revenue of $459.4 million was up $107.0 million or 30.4% year-on-year. Revenue grew by $61.2 million year-on-year as a result of the company’s two acquisitions on December 31, 2020 and grew $45.8 million or 13.0% organically. “Our organic and total revenue growth in the quarter was substantial and driven by Vectrus’ ability to provide critical solutions in support of our clients’ missions across all time zones,” said Susan Lynch, Senior Vice President and Chief Financial Officer. Operating income was $12.9 million or 2.8% margin. M&A and integration related expenses of $3.3 million and amortization of acquired intangible assets of $2.6 million were incurred in the quarter. Adjusted operating income1 was $18.8 million or 4.1% margin. Adjusted EBITDA1 was $20.5 million or 4.5% margin as compared to $17.0 million or 4.8% in the prior year. “Our strong topline growth in the quarter had considerable material and pass-through content which carries with it a lower margin,” said Lynch. “Year-on-year margin was also influenced by the phase-in of new awards, program completions and contract mix.” Lynch continued, “We are continuing to strategically invest in our business to enhance our capability and support future growth while phasing-in new programs that are expected to show incremental margin progression over time.”
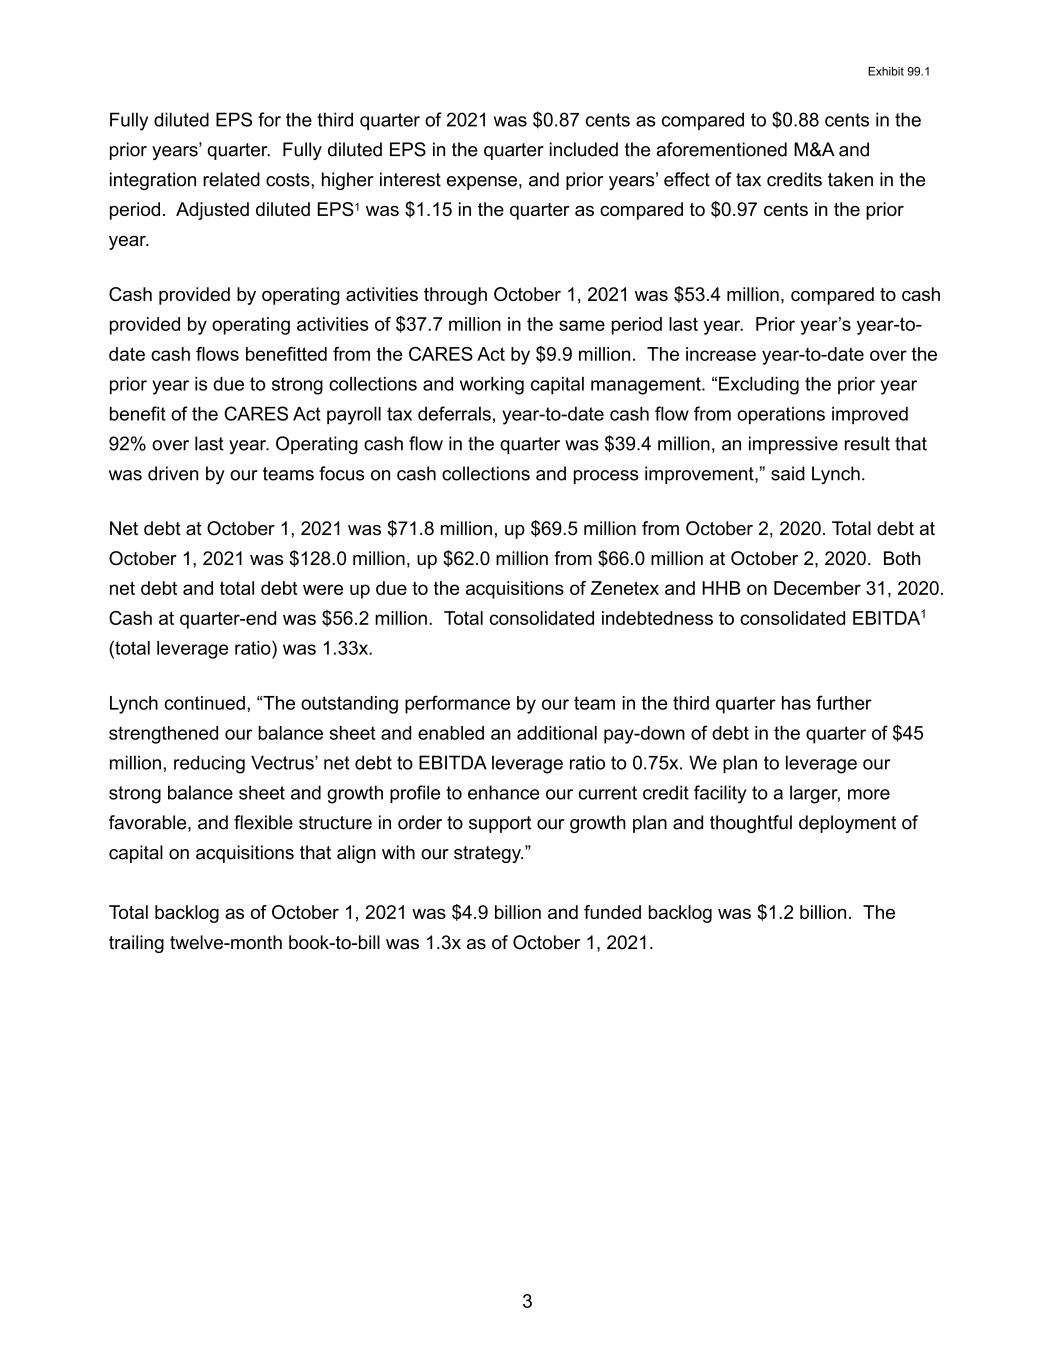
Exhibit 99.1 3 Fully diluted EPS for the third quarter of 2021 was $0.87 cents as compared to $0.88 cents in the prior years’ quarter. Fully diluted EPS in the quarter included the aforementioned M&A and integration related costs, higher interest expense, and prior years’ effect of tax credits taken in the period. Adjusted diluted EPS1 was $1.15 in the quarter as compared to $0.97 cents in the prior year. Cash provided by operating activities through October 1, 2021 was $53.4 million, compared to cash provided by operating activities of $37.7 million in the same period last year. Prior year’s year-to- date cash flows benefitted from the CARES Act by $9.9 million. The increase year-to-date over the prior year is due to strong collections and working capital management. “Excluding the prior year benefit of the CARES Act payroll tax deferrals, year-to-date cash flow from operations improved 92% over last year. Operating cash flow in the quarter was $39.4 million, an impressive result that was driven by our teams focus on cash collections and process improvement,” said Lynch. Net debt at October 1, 2021 was $71.8 million, up $69.5 million from October 2, 2020. Total debt at October 1, 2021 was $128.0 million, up $62.0 million from $66.0 million at October 2, 2020. Both net debt and total debt were up due to the acquisitions of Zenetex and HHB on December 31, 2020. Cash at quarter-end was $56.2 million. Total consolidated indebtedness to consolidated EBITDA1 (total leverage ratio) was 1.33x. Lynch continued, “The outstanding performance by our team in the third quarter has further strengthened our balance sheet and enabled an additional pay-down of debt in the quarter of $45 million, reducing Vectrus’ net debt to EBITDA leverage ratio to 0.75x. We plan to leverage our strong balance sheet and growth profile to enhance our current credit facility to a larger, more favorable, and flexible structure in order to support our growth plan and thoughtful deployment of capital on acquisitions that align with our strategy.” Total backlog as of October 1, 2021 was $4.9 billion and funded backlog was $1.2 billion. The trailing twelve-month book-to-bill was 1.3x as of October 1, 2021.
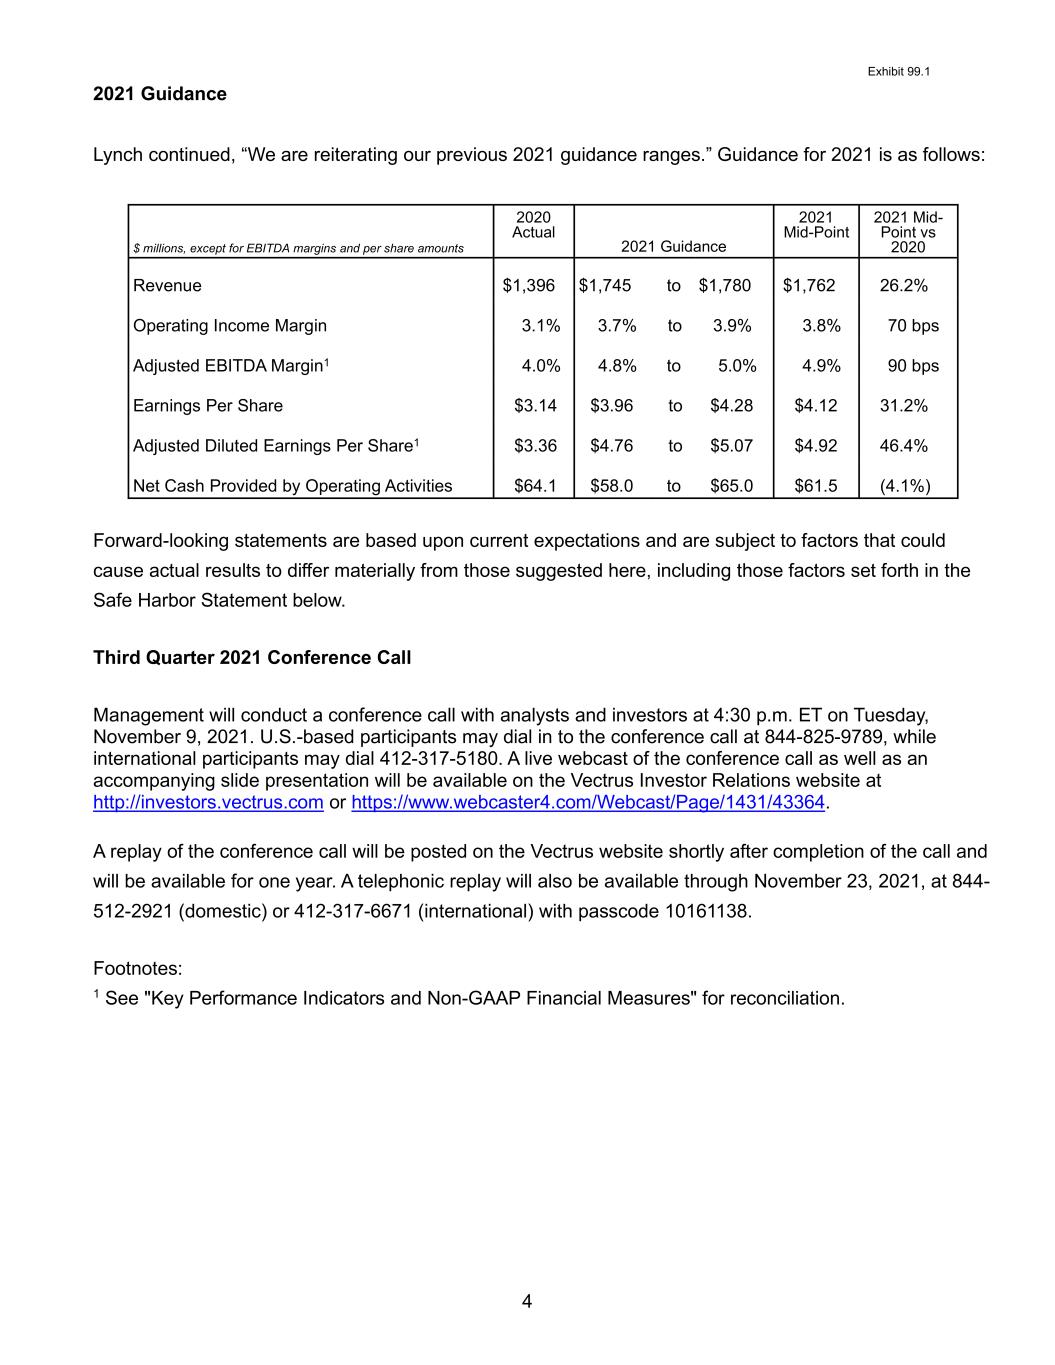
Exhibit 99.1 4 2021 Guidance Lynch continued, “We are reiterating our previous 2021 guidance ranges.” Guidance for 2021 is as follows: $ millions, except for EBITDA margins and per share amounts 2020 Actual 2021 Guidance 2021 Mid-Point 2021 Mid- Point vs 2020 Revenue $1,396 $1,745 to $1,780 $1,762 26.2% Operating Income Margin 3.1% 3.7% to 3.9% 3.8% 70 bps Adjusted EBITDA Margin1 4.0% 4.8% to 5.0% 4.9% 90 bps Earnings Per Share $3.14 $3.96 to $4.28 $4.12 31.2% Adjusted Diluted Earnings Per Share1 $3.36 $4.76 to $5.07 $4.92 46.4% Net Cash Provided by Operating Activities $64.1 $58.0 to $65.0 $61.5 (4.1%) Forward-looking statements are based upon current expectations and are subject to factors that could cause actual results to differ materially from those suggested here, including those factors set forth in the Safe Harbor Statement below. Third Quarter 2021 Conference Call Management will conduct a conference call with analysts and investors at 4:30 p.m. ET on Tuesday, November 9, 2021. U.S.-based participants may dial in to the conference call at 844-825-9789, while international participants may dial 412-317-5180. A live webcast of the conference call as well as an accompanying slide presentation will be available on the Vectrus Investor Relations website at http://investors.vectrus.com or https://www.webcaster4.com/Webcast/Page/1431/43364. A replay of the conference call will be posted on the Vectrus website shortly after completion of the call and will be available for one year. A telephonic replay will also be available through November 23, 2021, at 844- 512-2921 (domestic) or 412-317-6671 (international) with passcode 10161138. Footnotes: 1 See "Key Performance Indicators and Non-GAAP Financial Measures" for reconciliation.
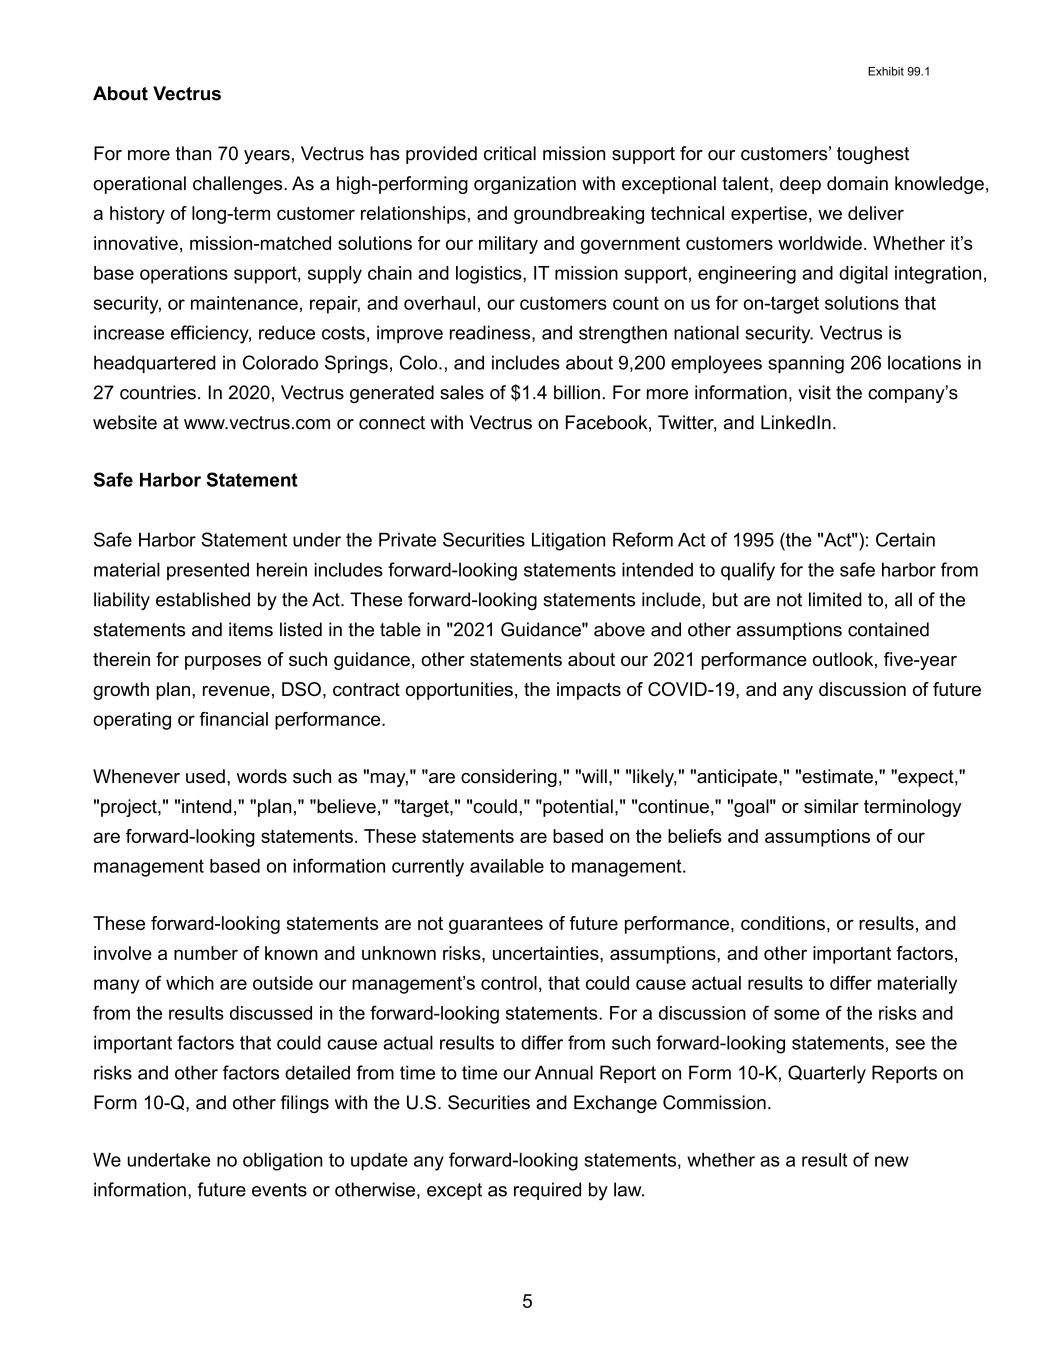
Exhibit 99.1 5 About Vectrus For more than 70 years, Vectrus has provided critical mission support for our customers’ toughest operational challenges. As a high-performing organization with exceptional talent, deep domain knowledge, a history of long-term customer relationships, and groundbreaking technical expertise, we deliver innovative, mission-matched solutions for our military and government customers worldwide. Whether it’s base operations support, supply chain and logistics, IT mission support, engineering and digital integration, security, or maintenance, repair, and overhaul, our customers count on us for on-target solutions that increase efficiency, reduce costs, improve readiness, and strengthen national security. Vectrus is headquartered in Colorado Springs, Colo., and includes about 9,200 employees spanning 206 locations in 27 countries. In 2020, Vectrus generated sales of $1.4 billion. For more information, visit the company’s website at www.vectrus.com or connect with Vectrus on Facebook, Twitter, and LinkedIn. Safe Harbor Statement Safe Harbor Statement under the Private Securities Litigation Reform Act of 1995 (the "Act"): Certain material presented herein includes forward-looking statements intended to qualify for the safe harbor from liability established by the Act. These forward-looking statements include, but are not limited to, all of the statements and items listed in the table in "2021 Guidance" above and other assumptions contained therein for purposes of such guidance, other statements about our 2021 performance outlook, five-year growth plan, revenue, DSO, contract opportunities, the impacts of COVID-19, and any discussion of future operating or financial performance. Whenever used, words such as "may," "are considering," "will," "likely," "anticipate," "estimate," "expect," "project," "intend," "plan," "believe," "target," "could," "potential," "continue," "goal" or similar terminology are forward-looking statements. These statements are based on the beliefs and assumptions of our management based on information currently available to management. These forward-looking statements are not guarantees of future performance, conditions, or results, and involve a number of known and unknown risks, uncertainties, assumptions, and other important factors, many of which are outside our management’s control, that could cause actual results to differ materially from the results discussed in the forward-looking statements. For a discussion of some of the risks and important factors that could cause actual results to differ from such forward-looking statements, see the risks and other factors detailed from time to time our Annual Report on Form 10-K, Quarterly Reports on Form 10-Q, and other filings with the U.S. Securities and Exchange Commission. We undertake no obligation to update any forward-looking statements, whether as a result of new information, future events or otherwise, except as required by law.
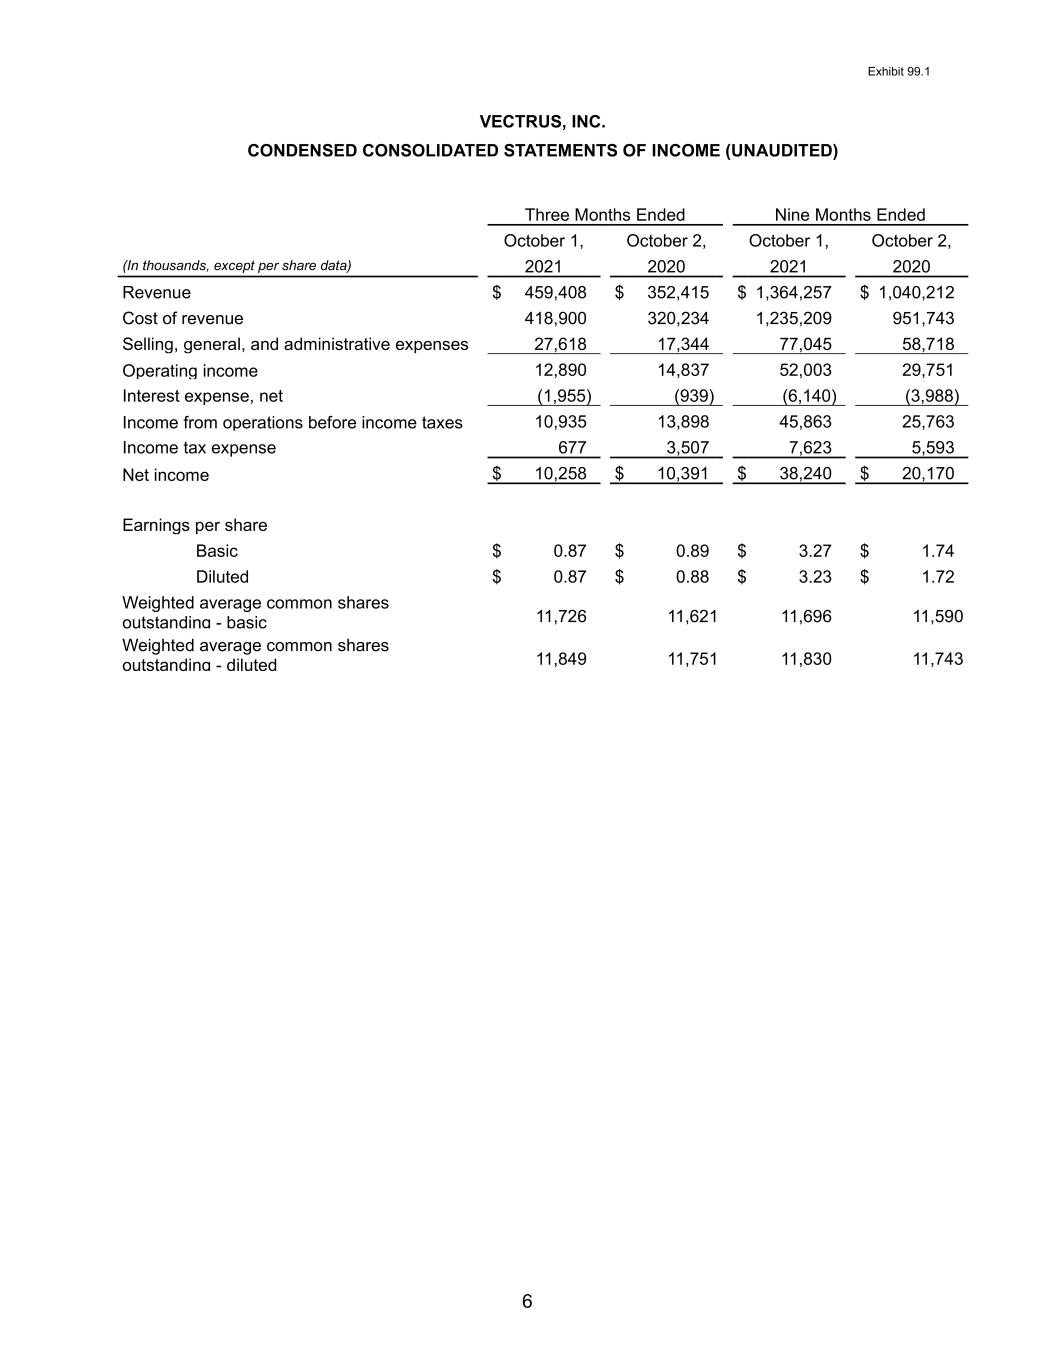
Exhibit 99.1 6 VECTRUS, INC. CONDENSED CONSOLIDATED STATEMENTS OF INCOME (UNAUDITED) Three Months Ended Nine Months Ended October 1, October 2, October 1, October 2, (In thousands, except per share data) 2021 2020 2021 2020 Revenue $ 459,408 $ 352,415 $ 1,364,257 $ 1,040,212 Cost of revenue 418,900 320,234 1,235,209 951,743 Selling, general, and administrative expenses 27,618 17,344 77,045 58,718 Operating income 12,890 14,837 52,003 29,751 Interest expense, net (1,955) (939) (6,140) (3,988) Income from operations before income taxes 10,935 13,898 45,863 25,763 Income tax expense 677 3,507 7,623 5,593 Net income $ 10,258 $ 10,391 $ 38,240 $ 20,170 Earnings per share Basic $ 0.87 $ 0.89 $ 3.27 $ 1.74 Diluted $ 0.87 $ 0.88 $ 3.23 $ 1.72 Weighted average common shares outstanding - basic 11,726 11,621 11,696 11,590 Weighted average common shares outstanding - diluted 11,849 11,751 11,830 11,743
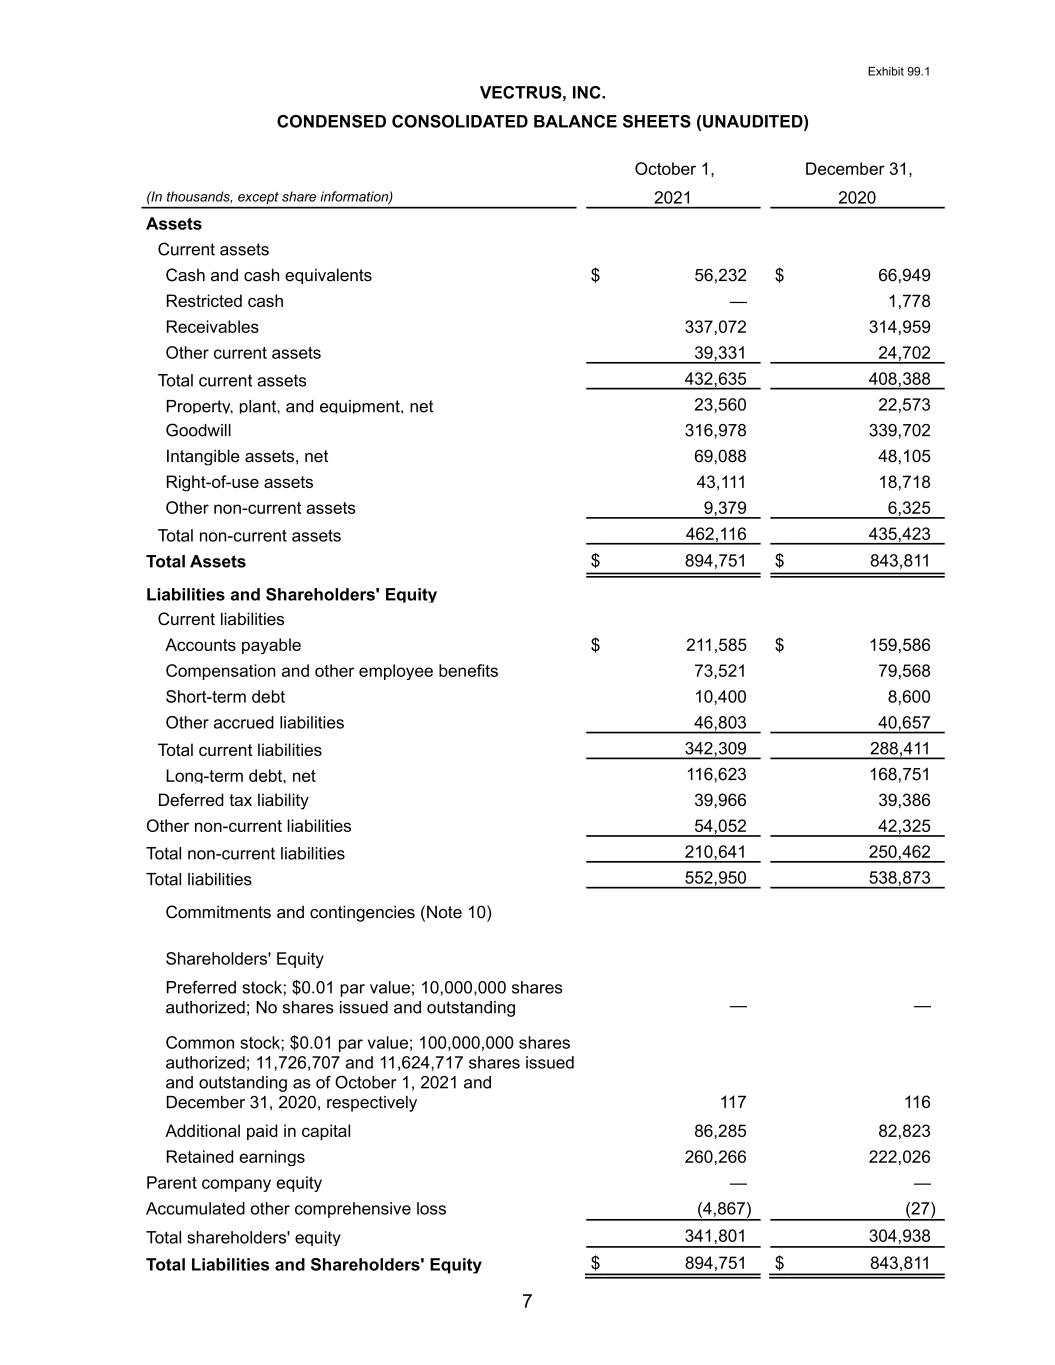
Exhibit 99.1 7 VECTRUS, INC. CONDENSED CONSOLIDATED BALANCE SHEETS (UNAUDITED) October 1, December 31, (In thousands, except share information) 2021 2020 Assets Current assets Cash and cash equivalents $ 56,232 $ 66,949 Restricted cash — 1,778 Receivables 337,072 314,959 Other current assets 39,331 24,702 Total current assets 432,635 408,388 Property, plant, and equipment, net 23,560 22,573 Goodwill 316,978 339,702 Intangible assets, net 69,088 48,105 Right-of-use assets 43,111 18,718 Other non-current assets 9,379 6,325 Total non-current assets 462,116 435,423 Total Assets $ 894,751 $ 843,811 Liabilities and Shareholders' Equity Current liabilities Accounts payable $ 211,585 $ 159,586 Compensation and other employee benefits 73,521 79,568 Short-term debt 10,400 8,600 Other accrued liabilities 46,803 40,657 Total current liabilities 342,309 288,411 Long-term debt, net 116,623 168,751 Deferred tax liability 39,966 39,386 Other non-current liabilities 54,052 42,325 Total non-current liabilities 210,641 250,462 Total liabilities 552,950 538,873 Commitments and contingencies (Note 10) Shareholders' Equity Preferred stock; $0.01 par value; 10,000,000 shares authorized; No shares issued and outstanding — — Common stock; $0.01 par value; 100,000,000 shares authorized; 11,726,707 and 11,624,717 shares issued and outstanding as of October 1, 2021 and December 31, 2020, respectively 117 116 Additional paid in capital 86,285 82,823 Retained earnings 260,266 222,026 Parent company equity — — Accumulated other comprehensive loss (4,867) (27) Total shareholders' equity 341,801 304,938 Total Liabilities and Shareholders' Equity $ 894,751 $ 843,811
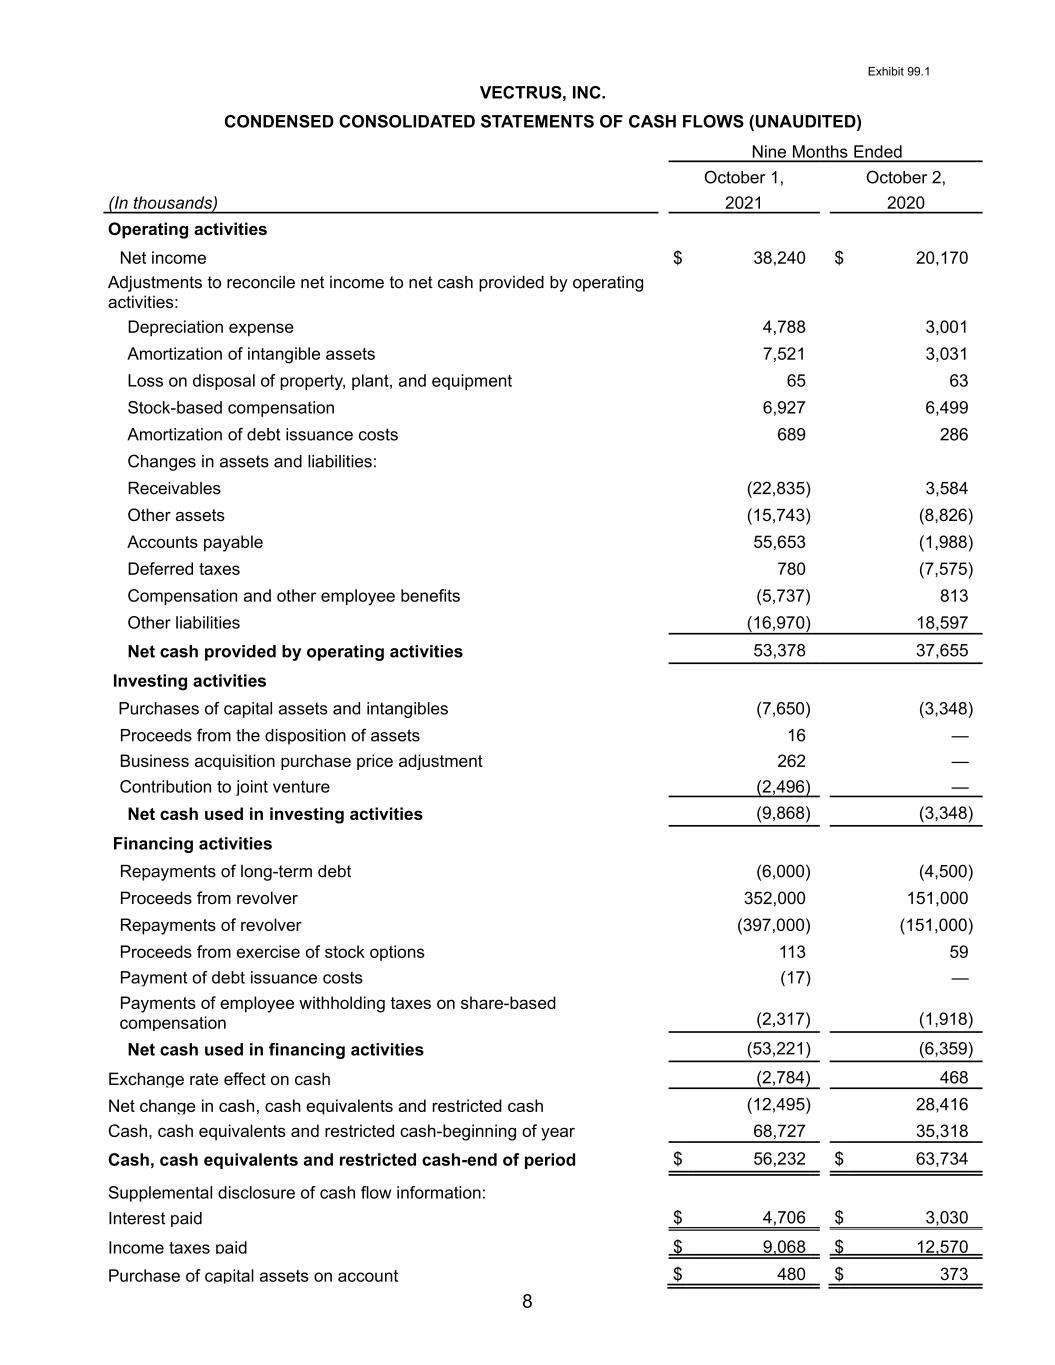
Exhibit 99.1 8 VECTRUS, INC. CONDENSED CONSOLIDATED STATEMENTS OF CASH FLOWS (UNAUDITED) Nine Months Ended October 1, October 2, (In thousands) 2021 2020 Operating activities Net income $ 38,240 $ 20,170 Adjustments to reconcile net income to net cash provided by operating activities: Depreciation expense 4,788 3,001 Amortization of intangible assets 7,521 3,031 Loss on disposal of property, plant, and equipment 65 63 Stock-based compensation 6,927 6,499 Amortization of debt issuance costs 689 286 Changes in assets and liabilities: Receivables (22,835) 3,584 Other assets (15,743) (8,826) Accounts payable 55,653 (1,988) Deferred taxes 780 (7,575) Compensation and other employee benefits (5,737) 813 Other liabilities (16,970) 18,597 Net cash provided by operating activities 53,378 37,655 Investing activities Purchases of capital assets and intangibles (7,650) (3,348) Proceeds from the disposition of assets 16 — Business acquisition purchase price adjustment 262 — Contribution to joint venture (2,496) — Net cash used in investing activities (9,868) (3,348) Financing activities Repayments of long-term debt (6,000) (4,500) Proceeds from revolver 352,000 151,000 Repayments of revolver (397,000) (151,000) Proceeds from exercise of stock options 113 59 Payment of debt issuance costs (17) — Payments of employee withholding taxes on share-based compensation (2,317) (1,918) Net cash used in financing activities (53,221) (6,359) Exchange rate effect on cash (2,784) 468 Net change in cash, cash equivalents and restricted cash (12,495) 28,416 Cash, cash equivalents and restricted cash-beginning of year 68,727 35,318 Cash, cash equivalents and restricted cash-end of period $ 56,232 $ 63,734 Supplemental disclosure of cash flow information: Interest paid $ 4,706 $ 3,030 Income taxes paid $ 9,068 $ 12,570 Purchase of capital assets on account $ 480 $ 373
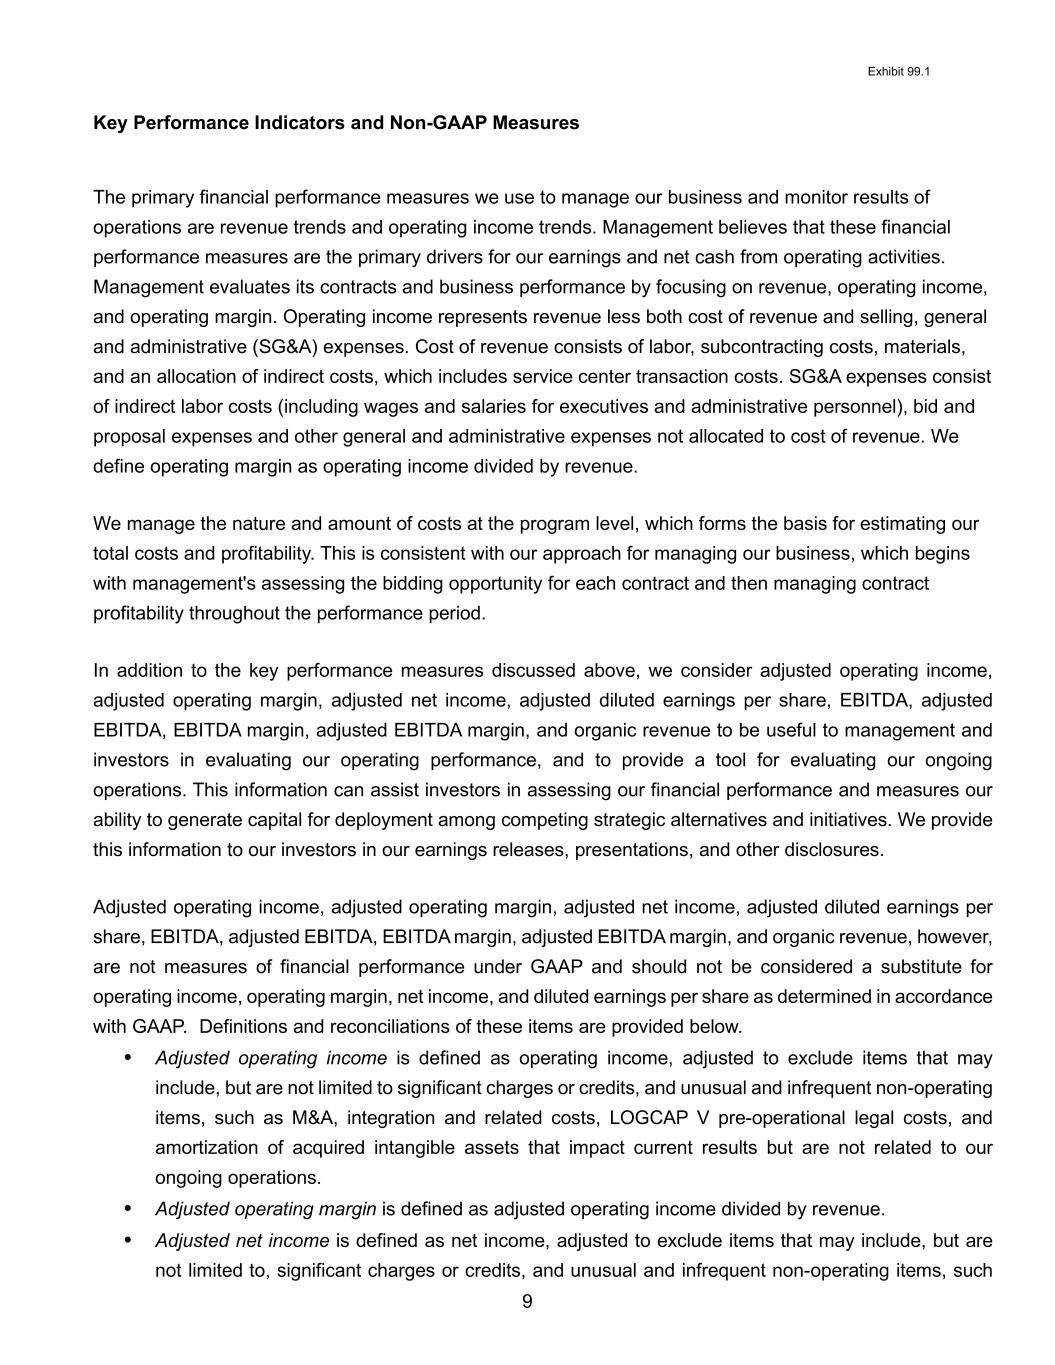
Exhibit 99.1 9 Key Performance Indicators and Non-GAAP Measures The primary financial performance measures we use to manage our business and monitor results of operations are revenue trends and operating income trends. Management believes that these financial performance measures are the primary drivers for our earnings and net cash from operating activities. Management evaluates its contracts and business performance by focusing on revenue, operating income, and operating margin. Operating income represents revenue less both cost of revenue and selling, general and administrative (SG&A) expenses. Cost of revenue consists of labor, subcontracting costs, materials, and an allocation of indirect costs, which includes service center transaction costs. SG&A expenses consist of indirect labor costs (including wages and salaries for executives and administrative personnel), bid and proposal expenses and other general and administrative expenses not allocated to cost of revenue. We define operating margin as operating income divided by revenue. We manage the nature and amount of costs at the program level, which forms the basis for estimating our total costs and profitability. This is consistent with our approach for managing our business, which begins with management's assessing the bidding opportunity for each contract and then managing contract profitability throughout the performance period. In addition to the key performance measures discussed above, we consider adjusted operating income, adjusted operating margin, adjusted net income, adjusted diluted earnings per share, EBITDA, adjusted EBITDA, EBITDA margin, adjusted EBITDA margin, and organic revenue to be useful to management and investors in evaluating our operating performance, and to provide a tool for evaluating our ongoing operations. This information can assist investors in assessing our financial performance and measures our ability to generate capital for deployment among competing strategic alternatives and initiatives. We provide this information to our investors in our earnings releases, presentations, and other disclosures. Adjusted operating income, adjusted operating margin, adjusted net income, adjusted diluted earnings per share, EBITDA, adjusted EBITDA, EBITDA margin, adjusted EBITDA margin, and organic revenue, however, are not measures of financial performance under GAAP and should not be considered a substitute for operating income, operating margin, net income, and diluted earnings per share as determined in accordance with GAAP. Definitions and reconciliations of these items are provided below. • Adjusted operating income is defined as operating income, adjusted to exclude items that may include, but are not limited to significant charges or credits, and unusual and infrequent non-operating items, such as M&A, integration and related costs, LOGCAP V pre-operational legal costs, and amortization of acquired intangible assets that impact current results but are not related to our ongoing operations. • Adjusted operating margin is defined as adjusted operating income divided by revenue. • Adjusted net income is defined as net income, adjusted to exclude items that may include, but are not limited to, significant charges or credits, and unusual and infrequent non-operating items, such
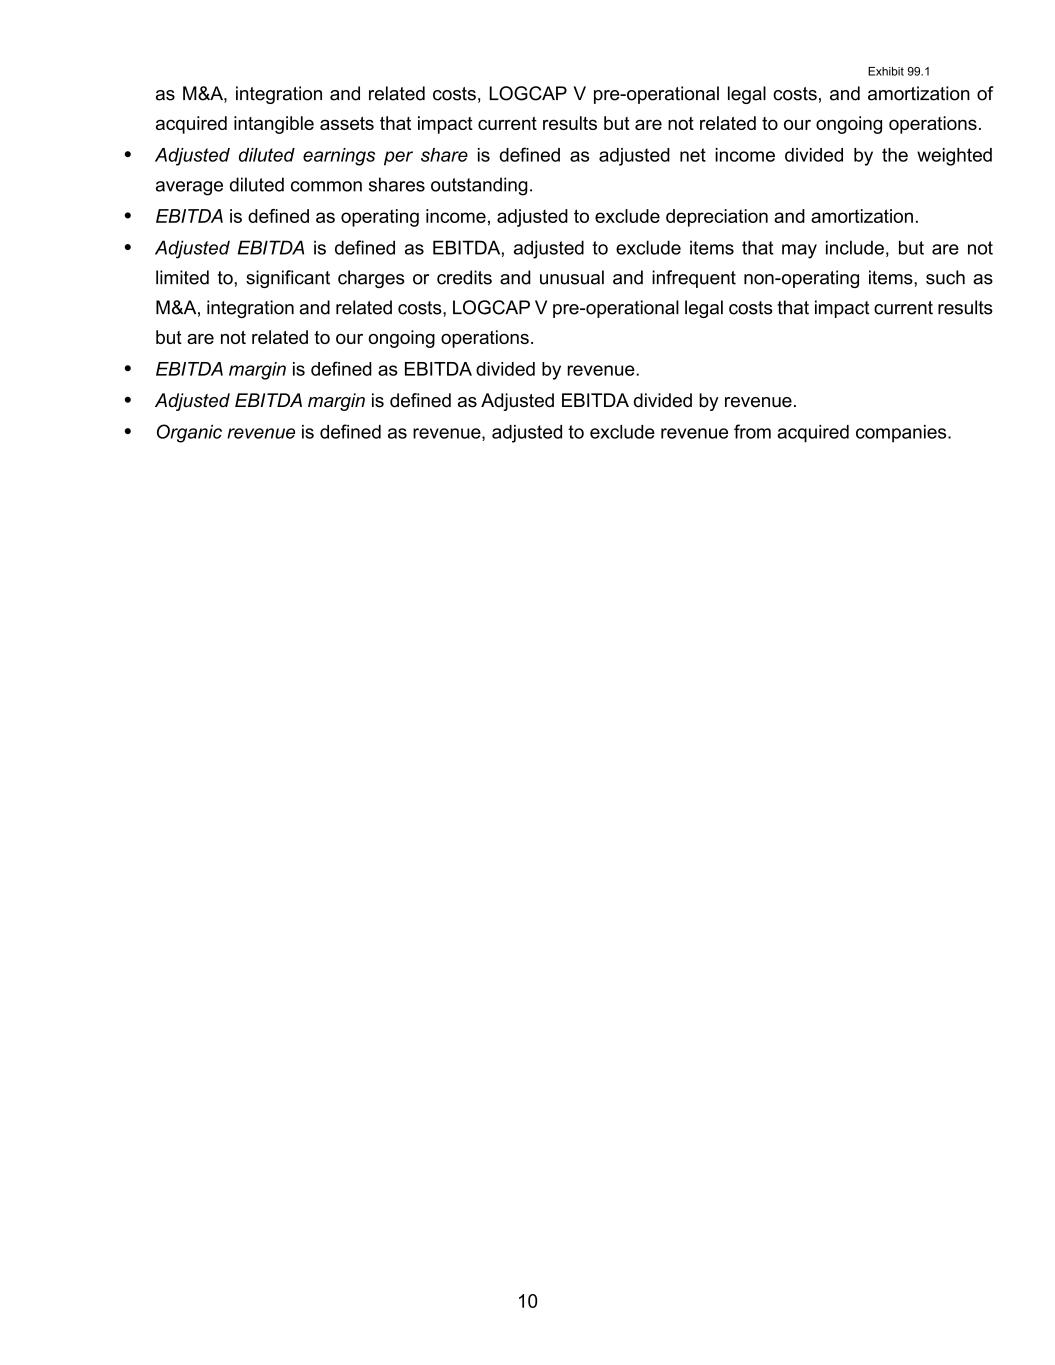
Exhibit 99.1 10 as M&A, integration and related costs, LOGCAP V pre-operational legal costs, and amortization of acquired intangible assets that impact current results but are not related to our ongoing operations. • Adjusted diluted earnings per share is defined as adjusted net income divided by the weighted average diluted common shares outstanding. • EBITDA is defined as operating income, adjusted to exclude depreciation and amortization. • Adjusted EBITDA is defined as EBITDA, adjusted to exclude items that may include, but are not limited to, significant charges or credits and unusual and infrequent non-operating items, such as M&A, integration and related costs, LOGCAP V pre-operational legal costs that impact current results but are not related to our ongoing operations. • EBITDA margin is defined as EBITDA divided by revenue. • Adjusted EBITDA margin is defined as Adjusted EBITDA divided by revenue. • Organic revenue is defined as revenue, adjusted to exclude revenue from acquired companies.
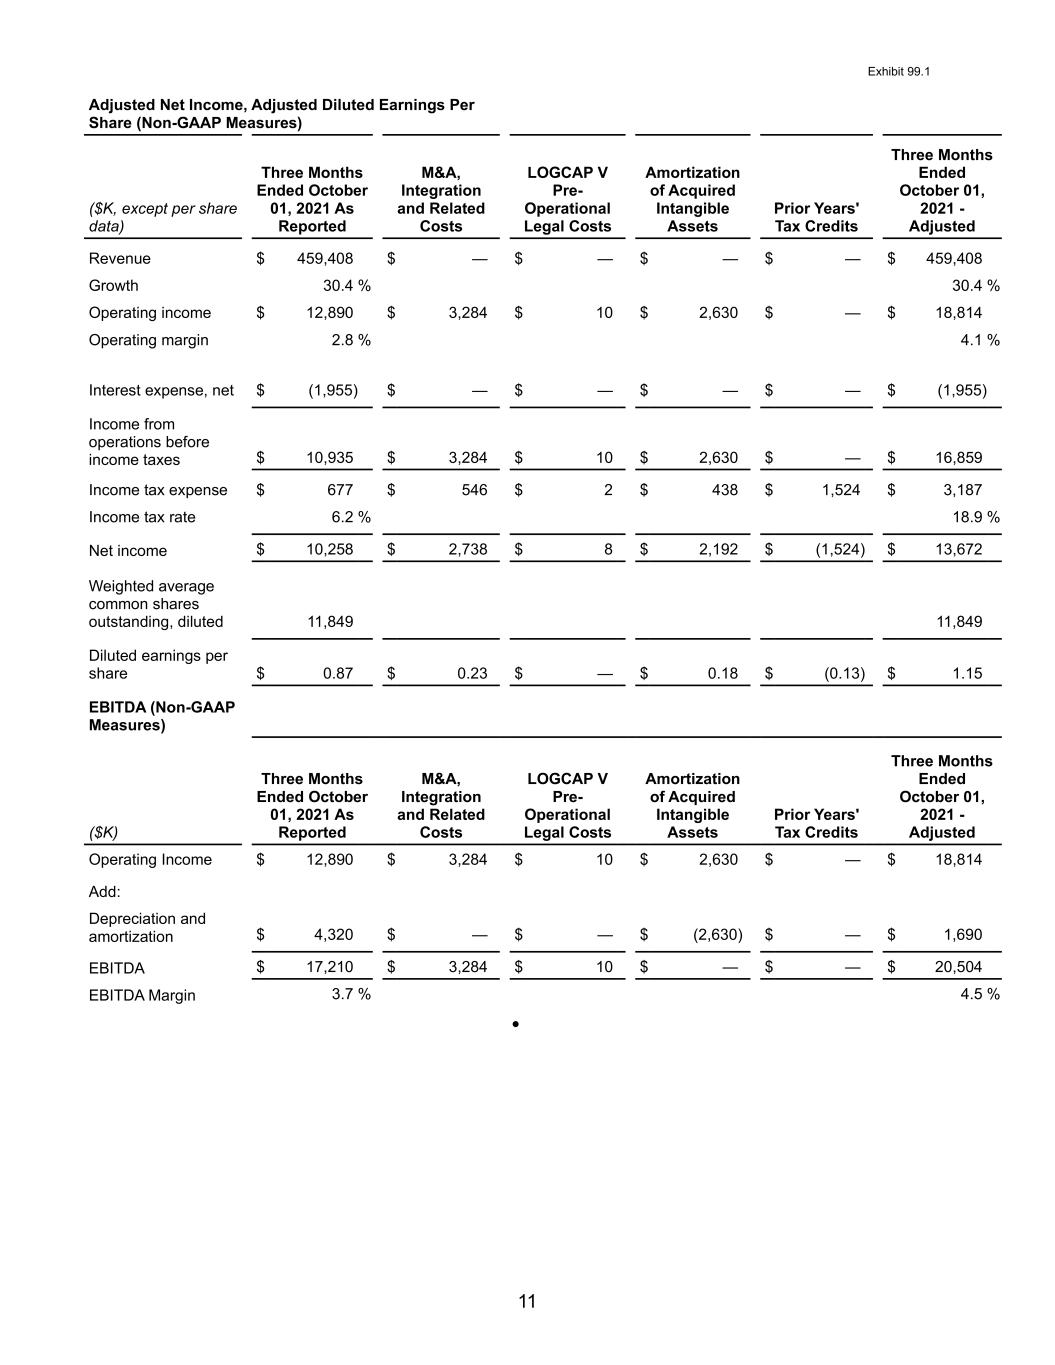
Exhibit 99.1 11 Adjusted Net Income, Adjusted Diluted Earnings Per Share (Non-GAAP Measures) ($K, except per share data) Three Months Ended October 01, 2021 As Reported M&A, Integration and Related Costs LOGCAP V Pre- Operational Legal Costs Amortization of Acquired Intangible Assets Prior Years' Tax Credits Three Months Ended October 01, 2021 - Adjusted Revenue $ 459,408 $ — $ — $ — $ — $ 459,408 Growth 30.4 % 30.4 % Operating income $ 12,890 $ 3,284 $ 10 $ 2,630 $ — $ 18,814 Operating margin 2.8 % 4.1 % Interest expense, net $ (1,955) $ — $ — $ — $ — $ (1,955) Income from operations before income taxes $ 10,935 $ 3,284 $ 10 $ 2,630 $ — $ 16,859 Income tax expense $ 677 $ 546 $ 2 $ 438 $ 1,524 $ 3,187 Income tax rate 6.2 % 18.9 % Net income $ 10,258 $ 2,738 $ 8 $ 2,192 $ (1,524) $ 13,672 Weighted average common shares outstanding, diluted 11,849 11,849 Diluted earnings per share $ 0.87 $ 0.23 $ — $ 0.18 $ (0.13) $ 1.15 EBITDA (Non-GAAP Measures) ($K) Three Months Ended October 01, 2021 As Reported M&A, Integration and Related Costs LOGCAP V Pre- Operational Legal Costs Amortization of Acquired Intangible Assets Prior Years' Tax Credits Three Months Ended October 01, 2021 - Adjusted Operating Income $ 12,890 $ 3,284 $ 10 $ 2,630 $ — $ 18,814 Add: Depreciation and amortization $ 4,320 $ — $ — $ (2,630) $ — $ 1,690 EBITDA $ 17,210 $ 3,284 $ 10 $ — $ — $ 20,504 EBITDA Margin 3.7 % 4.5 % •
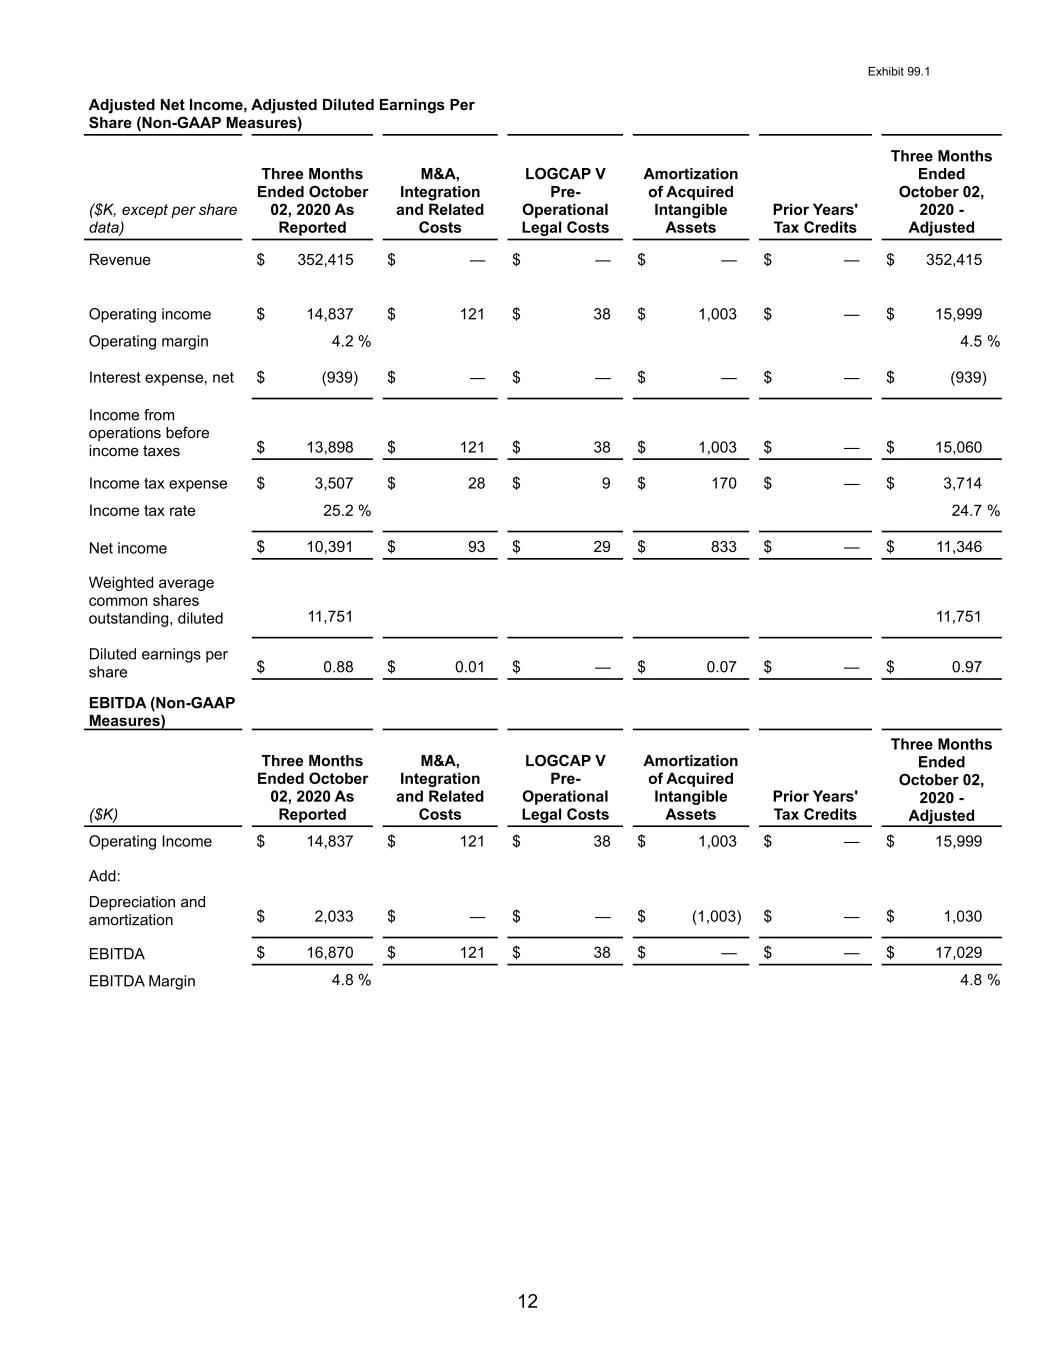
Exhibit 99.1 12 Adjusted Net Income, Adjusted Diluted Earnings Per Share (Non-GAAP Measures) ($K, except per share data) Three Months Ended October 02, 2020 As Reported M&A, Integration and Related Costs LOGCAP V Pre- Operational Legal Costs Amortization of Acquired Intangible Assets Prior Years' Tax Credits Three Months Ended October 02, 2020 - Adjusted Revenue $ 352,415 $ — $ — $ — $ — $ 352,415 Operating income $ 14,837 $ 121 $ 38 $ 1,003 $ — $ 15,999 Operating margin 4.2 % 4.5 % Interest expense, net $ (939) $ — $ — $ — $ — $ (939) Income from operations before income taxes $ 13,898 $ 121 $ 38 $ 1,003 $ — $ 15,060 Income tax expense $ 3,507 $ 28 $ 9 $ 170 $ — $ 3,714 Income tax rate 25.2 % 24.7 % Net income $ 10,391 $ 93 $ 29 $ 833 $ — $ 11,346 Weighted average common shares outstanding, diluted 11,751 11,751 Diluted earnings per share $ 0.88 $ 0.01 $ — $ 0.07 $ — $ 0.97 EBITDA (Non-GAAP Measures) ($K) Three Months Ended October 02, 2020 As Reported M&A, Integration and Related Costs LOGCAP V Pre- Operational Legal Costs Amortization of Acquired Intangible Assets Prior Years' Tax Credits Three Months Ended October 02, 2020 - Adjusted Operating Income $ 14,837 $ 121 $ 38 $ 1,003 $ — $ 15,999 Add: Depreciation and amortization $ 2,033 $ — $ — $ (1,003) $ — $ 1,030 EBITDA $ 16,870 $ 121 $ 38 $ — $ — $ 17,029 EBITDA Margin 4.8 % 4.8 %
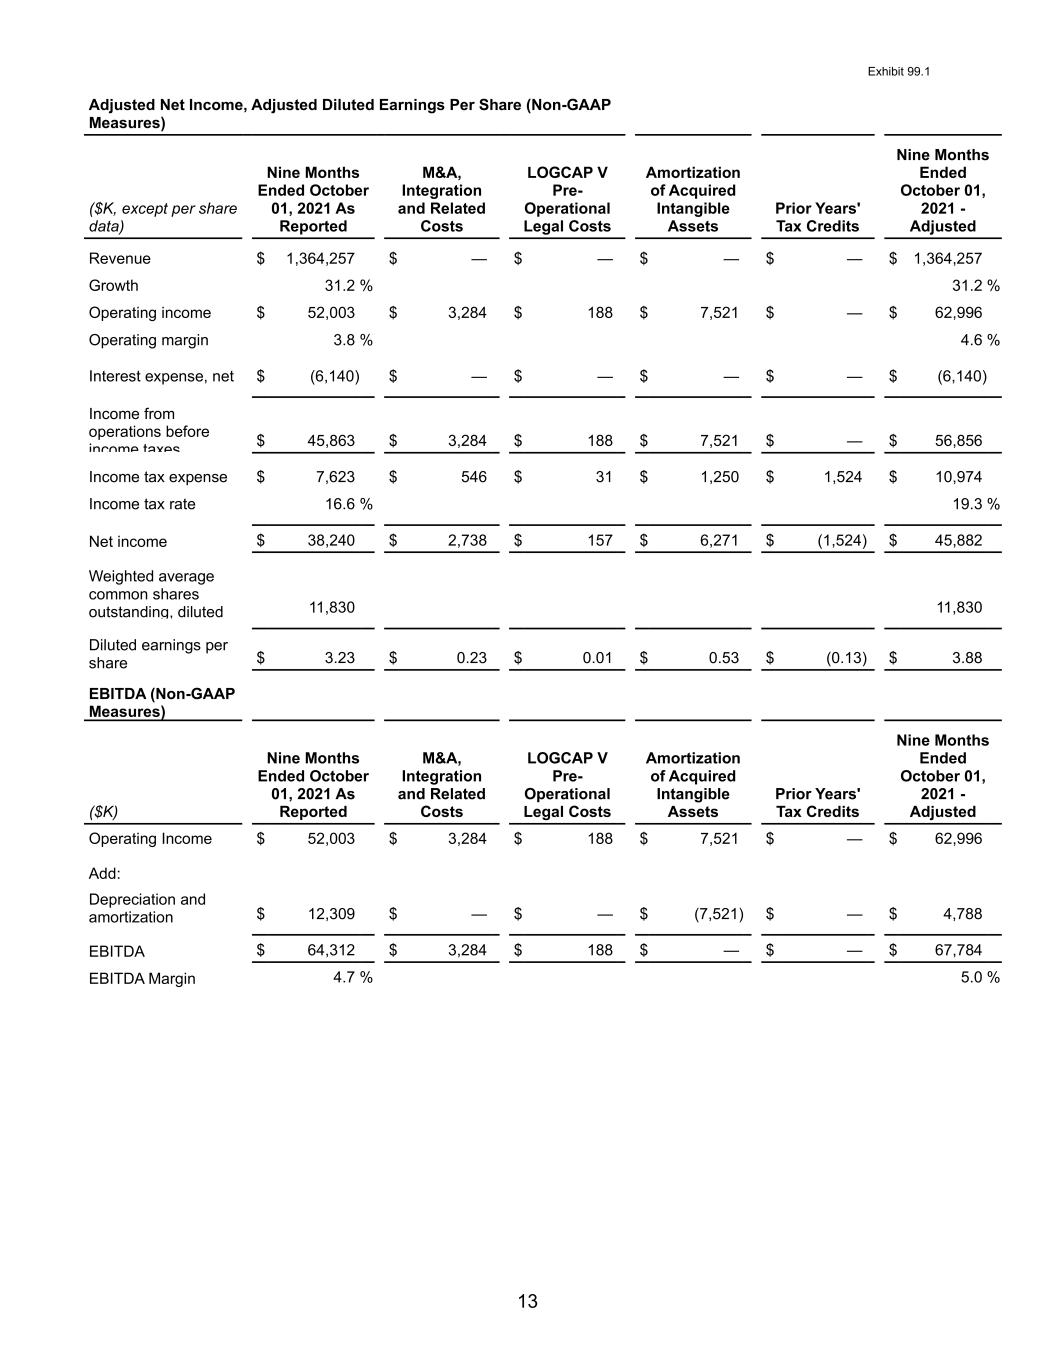
Exhibit 99.1 13 Adjusted Net Income, Adjusted Diluted Earnings Per Share (Non-GAAP Measures) ($K, except per share data) Nine Months Ended October 01, 2021 As Reported M&A, Integration and Related Costs LOGCAP V Pre- Operational Legal Costs Amortization of Acquired Intangible Assets Prior Years' Tax Credits Nine Months Ended October 01, 2021 - Adjusted Revenue $ 1,364,257 $ — $ — $ — $ — $ 1,364,257 Growth 31.2 % 31.2 % Operating income $ 52,003 $ 3,284 $ 188 $ 7,521 $ — $ 62,996 Operating margin 3.8 % 4.6 % Interest expense, net $ (6,140) $ — $ — $ — $ — $ (6,140) Income from operations before income taxes $ 45,863 $ 3,284 $ 188 $ 7,521 $ — $ 56,856 Income tax expense $ 7,623 $ 546 $ 31 $ 1,250 $ 1,524 $ 10,974 Income tax rate 16.6 % 19.3 % Net income $ 38,240 $ 2,738 $ 157 $ 6,271 $ (1,524) $ 45,882 Weighted average common shares outstanding, diluted 11,830 11,830 Diluted earnings per share $ 3.23 $ 0.23 $ 0.01 $ 0.53 $ (0.13) $ 3.88 EBITDA (Non-GAAP Measures) ($K) Nine Months Ended October 01, 2021 As Reported M&A, Integration and Related Costs LOGCAP V Pre- Operational Legal Costs Amortization of Acquired Intangible Assets Prior Years' Tax Credits Nine Months Ended October 01, 2021 - Adjusted Operating Income $ 52,003 $ 3,284 $ 188 $ 7,521 $ — $ 62,996 Add: Depreciation and amortization $ 12,309 $ — $ — $ (7,521) $ — $ 4,788 EBITDA $ 64,312 $ 3,284 $ 188 $ — $ — $ 67,784 EBITDA Margin 4.7 % 5.0 %
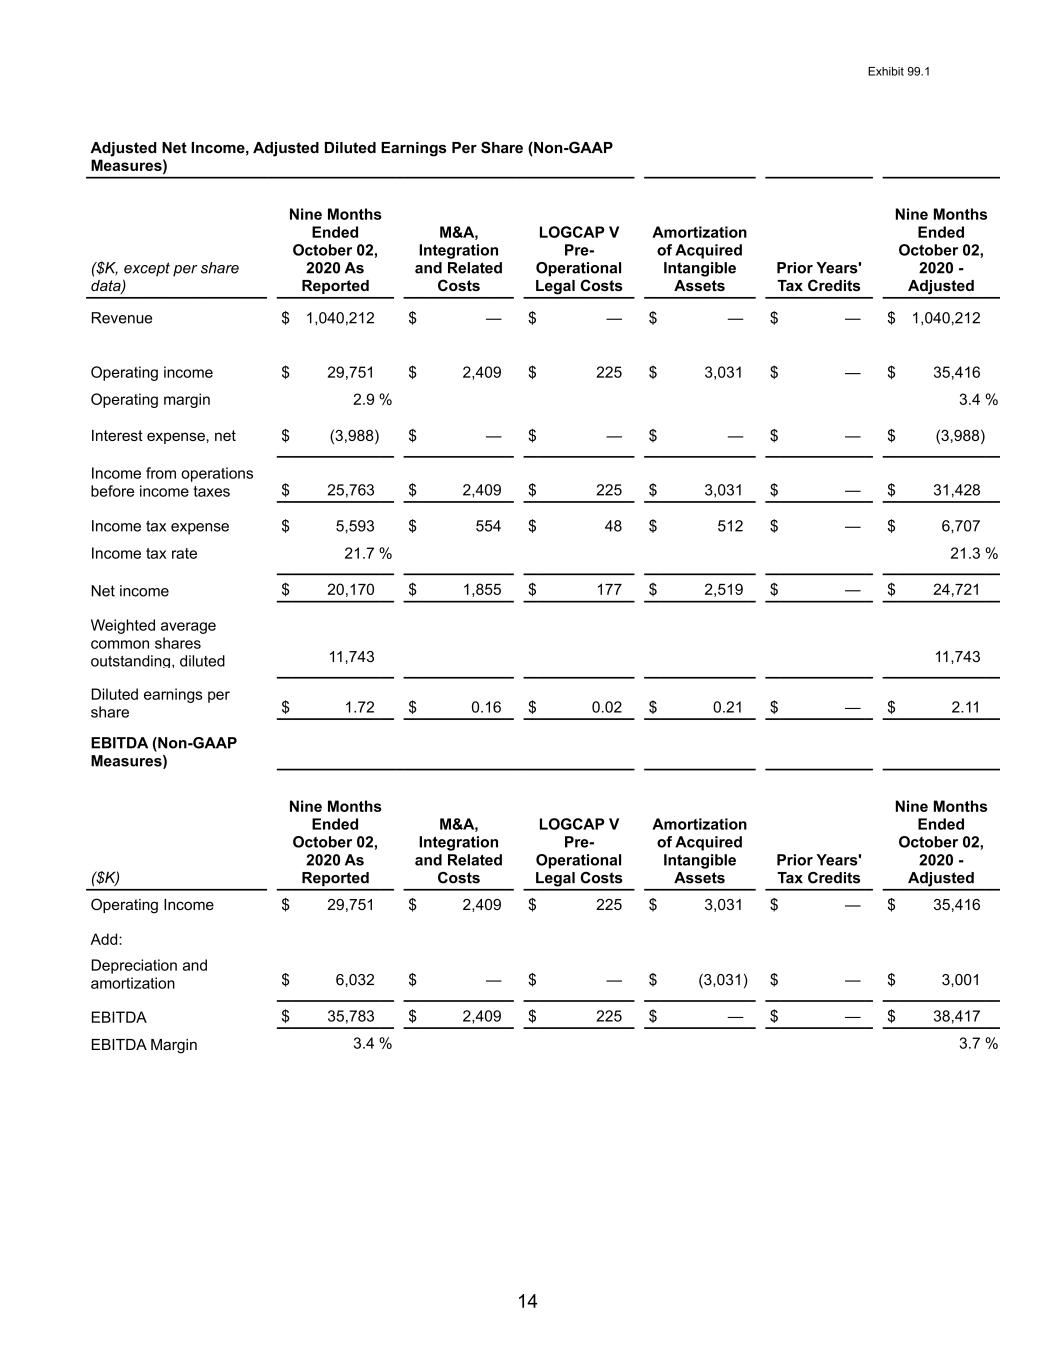
Exhibit 99.1 14 Adjusted Net Income, Adjusted Diluted Earnings Per Share (Non-GAAP Measures) ($K, except per share data) Nine Months Ended October 02, 2020 As Reported M&A, Integration and Related Costs LOGCAP V Pre- Operational Legal Costs Amortization of Acquired Intangible Assets Prior Years' Tax Credits Nine Months Ended October 02, 2020 - Adjusted Revenue $ 1,040,212 $ — $ — $ — $ — $ 1,040,212 Operating income $ 29,751 $ 2,409 $ 225 $ 3,031 $ — $ 35,416 Operating margin 2.9 % 3.4 % Interest expense, net $ (3,988) $ — $ — $ — $ — $ (3,988) Income from operations before income taxes $ 25,763 $ 2,409 $ 225 $ 3,031 $ — $ 31,428 Income tax expense $ 5,593 $ 554 $ 48 $ 512 $ — $ 6,707 Income tax rate 21.7 % 21.3 % Net income $ 20,170 $ 1,855 $ 177 $ 2,519 $ — $ 24,721 Weighted average common shares outstanding, diluted 11,743 11,743 Diluted earnings per share $ 1.72 $ 0.16 $ 0.02 $ 0.21 $ — $ 2.11 EBITDA (Non-GAAP Measures) ($K) Nine Months Ended October 02, 2020 As Reported M&A, Integration and Related Costs LOGCAP V Pre- Operational Legal Costs Amortization of Acquired Intangible Assets Prior Years' Tax Credits Nine Months Ended October 02, 2020 - Adjusted Operating Income $ 29,751 $ 2,409 $ 225 $ 3,031 $ — $ 35,416 Add: Depreciation and amortization $ 6,032 $ — $ — $ (3,031) $ — $ 3,001 EBITDA $ 35,783 $ 2,409 $ 225 $ — $ — $ 38,417 EBITDA Margin 3.4 % 3.7 %
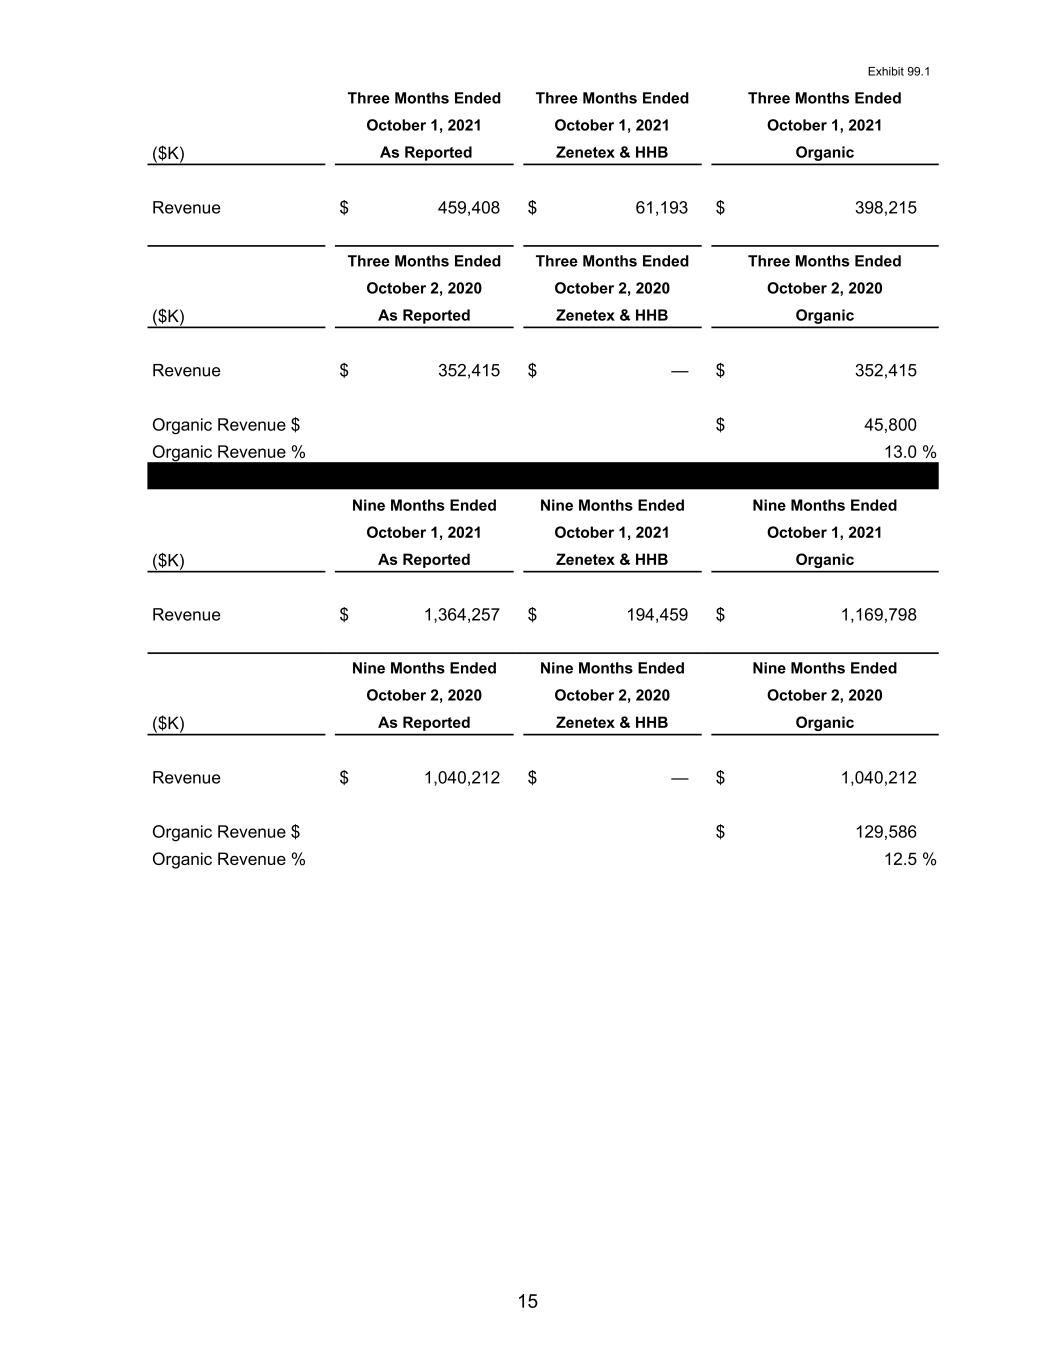
Exhibit 99.1 15 Three Months Ended Three Months Ended Three Months Ended October 1, 2021 October 1, 2021 October 1, 2021 ($K) As Reported Zenetex & HHB Organic Revenue $ 459,408 $ 61,193 $ 398,215 Three Months Ended Three Months Ended Three Months Ended October 2, 2020 October 2, 2020 October 2, 2020 ($K) As Reported Zenetex & HHB Organic Revenue $ 352,415 $ — $ 352,415 Organic Revenue $ $ 45,800 Organic Revenue % 13.0 % Nine Months Ended Nine Months Ended Nine Months Ended October 1, 2021 October 1, 2021 October 1, 2021 ($K) As Reported Zenetex & HHB Organic Revenue $ 1,364,257 $ 194,459 $ 1,169,798 Nine Months Ended Nine Months Ended Nine Months Ended October 2, 2020 October 2, 2020 October 2, 2020 ($K) As Reported Zenetex & HHB Organic Revenue $ 1,040,212 $ — $ 1,040,212 Organic Revenue $ $ 129,586 Organic Revenue % 12.5 %
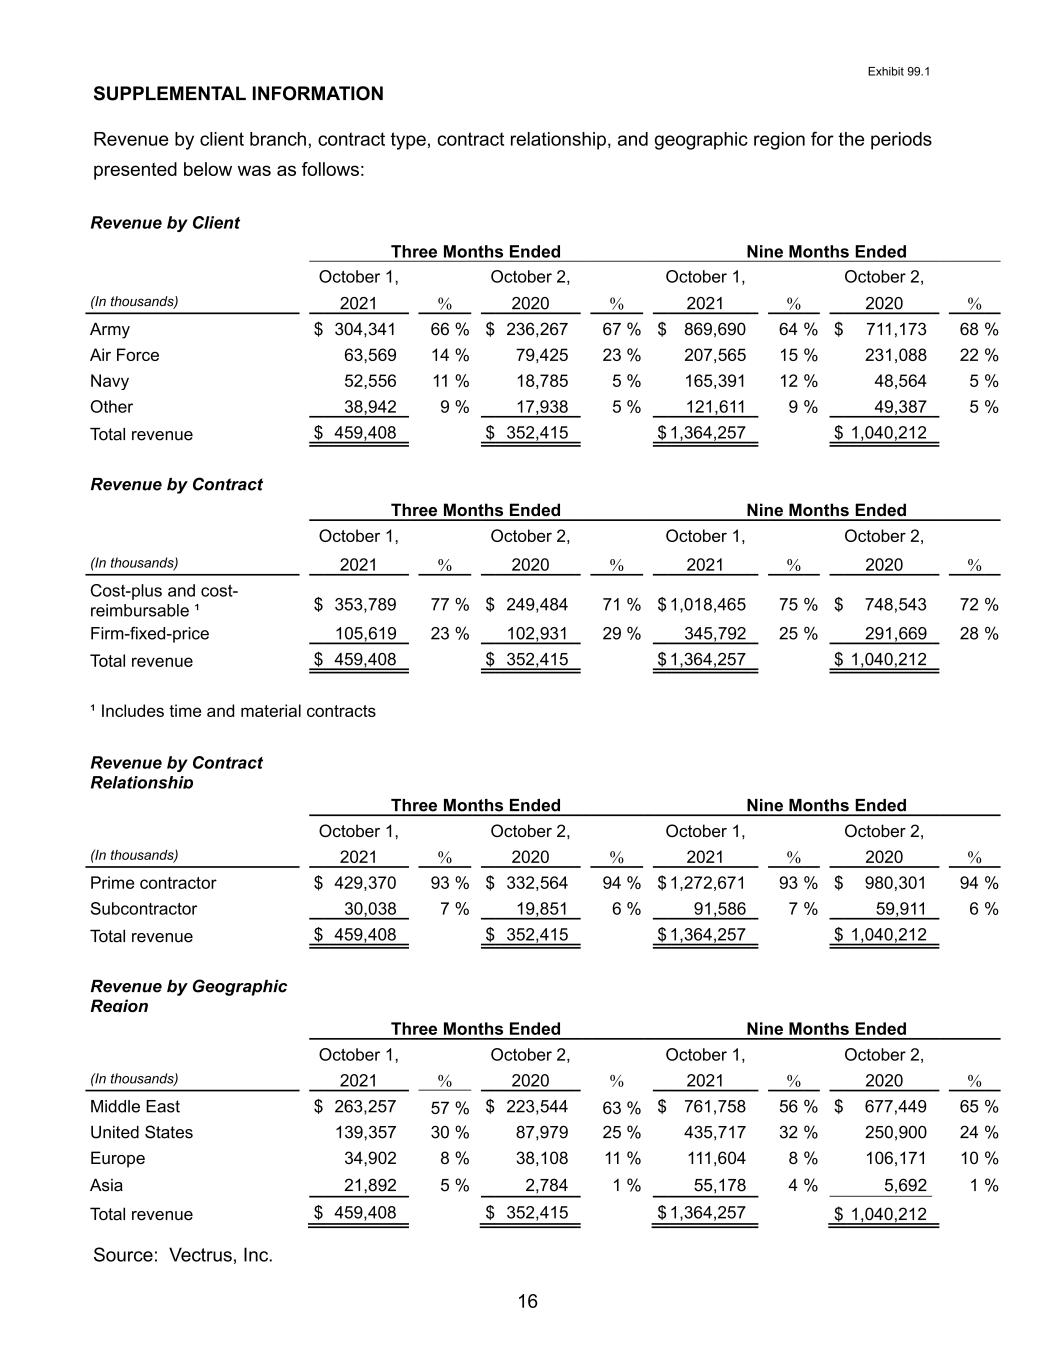
Exhibit 99.1 16 SUPPLEMENTAL INFORMATION Revenue by client branch, contract type, contract relationship, and geographic region for the periods presented below was as follows: Revenue by Client Three Months Ended Nine Months Ended October 1, October 2, October 1, October 2, (In thousands) 2021 % 2020 % 2021 % 2020 % Army $ 304,341 66 % $ 236,267 67 % $ 869,690 64 % $ 711,173 68 % Air Force 63,569 14 % 79,425 23 % 207,565 15 % 231,088 22 % Navy 52,556 11 % 18,785 5 % 165,391 12 % 48,564 5 % Other 38,942 9 % 17,938 5 % 121,611 9 % 49,387 5 % Total revenue $ 459,408 $ 352,415 $ 1,364,257 $ 1,040,212 Revenue by Contract Three Months Ended Nine Months Ended October 1, October 2, October 1, October 2, (In thousands) 2021 % 2020 % 2021 % 2020 % Cost-plus and cost- reimbursable ¹ $ 353,789 77 % $ 249,484 71 % $ 1,018,465 75 % $ 748,543 72 % Firm-fixed-price 105,619 23 % 102,931 29 % 345,792 25 % 291,669 28 % Total revenue $ 459,408 $ 352,415 $ 1,364,257 $ 1,040,212 ¹ Includes time and material contracts Revenue by Contract Relationship Three Months Ended Nine Months Ended October 1, October 2, October 1, October 2, (In thousands) 2021 % 2020 % 2021 % 2020 % Prime contractor $ 429,370 93 % $ 332,564 94 % $ 1,272,671 93 % $ 980,301 94 % Subcontractor 30,038 7 % 19,851 6 % 91,586 7 % 59,911 6 % Total revenue $ 459,408 $ 352,415 $ 1,364,257 $ 1,040,212 Revenue by Geographic Region Three Months Ended Nine Months Ended October 1, October 2, October 1, October 2, (In thousands) 2021 % 2020 % 2021 % 2020 % Middle East $ 263,257 57 % $ 223,544 63 % $ 761,758 56 % $ 677,449 65 % United States 139,357 30 % 87,979 25 % 435,717 32 % 250,900 24 % Europe 34,902 8 % 38,108 11 % 111,604 8 % 106,171 10 % Asia 21,892 5 % 2,784 1 % 55,178 4 % 5,692 1 % Total revenue $ 459,408 $ 352,415 $ 1,364,257 $ 1,040,212 Source: Vectrus, Inc.

VECTRUS THIRD QUARTER 2021 RESULTS CHUCK PROW – PRESIDENT AND CHIEF EXECUTIVE OFFICER SUSAN LYNCH – SENIOR VICE PRESIDENT AND CHIEF FINANCIAL OFFICER

Safe Harbor Statement Page 2 SAFE HARBOR STATEMENT UNDER THE PRIVATE SECURITIES LITIGATION REFORM ACT OF 1995 (THE “ACT"): CERTAIN MATERIAL PRESENTED HEREIN INCLUDES FORWARD-LOOKING STATEMENTS INTENDED TO QUALIFY FOR THE SAFE HARBOR FROM LIABILITY ESTABLISHED BY THE ACT. THESE FORWARD- LOOKING STATEMENTS INCLUDE, BUT ARE NOT LIMITED TO, ALL OF THE STATEMENTS AND ITEMS LISTED IN THE TABLES FOR 2021 GUIDANCE AND OTHER ASSUMPTIONS CONTAINED THEREIN FOR PURPOSES OF SUCH GUIDANCE, STATEMENTS ABOUT OUR 2021 PERFORMANCE OUTLOOK, FIVE-YEAR GROWTH PLAN, REVENUE, DSO, CONTRACT OPPORTUNITIES, THE IMPACT OF COVID-19, THE CONTINUED INTEGRATION OF OUR ACQUISITIONS, AND ANY DISCUSSION OF FUTURE OPERATING OR FINANCIAL PERFORMANCE. WHENEVER USED, WORDS SUCH AS "MAY," "ARE CONSIDERING," "WILL," "LIKELY," "ANTICIPATE," "ESTIMATE," "EXPECT," "PROJECT," "INTEND," "PLAN," "BELIEVE," "TARGET," "COULD," "POTENTIAL," "CONTINUE," "GOAL" OR SIMILAR TERMINOLOGY ARE FORWARD-LOOKING STATEMENTS. THESE STATEMENTS ARE BASED ON THE BELIEFS AND ASSUMPTIONS OF OUR MANAGEMENT BASED ON INFORMATION CURRENTLY AVAILABLE TO MANAGEMENT. THESE FORWARD-LOOKING STATEMENTS ARE NOT GUARANTEES OF FUTURE PERFORMANCE, CONDITIONS OR RESULTS, AND INVOLVE A NUMBER OF KNOWN AND UNKNOWN RISKS, UNCERTAINTIES, ASSUMPTIONS AND OTHER IMPORTANT FACTORS, MANY OF WHICH ARE OUTSIDE OUR MANAGEMENT’S CONTROL, THAT COULD CAUSE ACTUAL RESULTS TO DIFFER MATERIALLY FROM THE RESULTS DISCUSSED IN THE FORWARD-LOOKING STATEMENTS. FOR A DISCUSSION OF SOME OF THE RISKS AND IMPORTANT FACTORS THAT COULD CAUSE ACTUAL RESULTS TO DIFFER FROM SUCH FORWARD-LOOKING STATEMENTS, SEE THE RISKS AND OTHER FACTORS DETAILED FROM TIME TO TIME OUR ANNUAL REPORT ON FORM 10-K, QUARTERLY REPORTS ON FORM 10-Q, AND OTHER FILINGS WITH THE U.S. SECURITIES AND EXCHANGE COMMISSION. WE UNDERTAKE NO OBLIGATION TO UPDATE ANY FORWARD-LOOKING STATEMENTS, WHETHER AS A RESULT OF NEW INFORMATION, FUTURE EVENTS OR OTHERWISE, EXCEPT AS REQUIRED BY LAW.
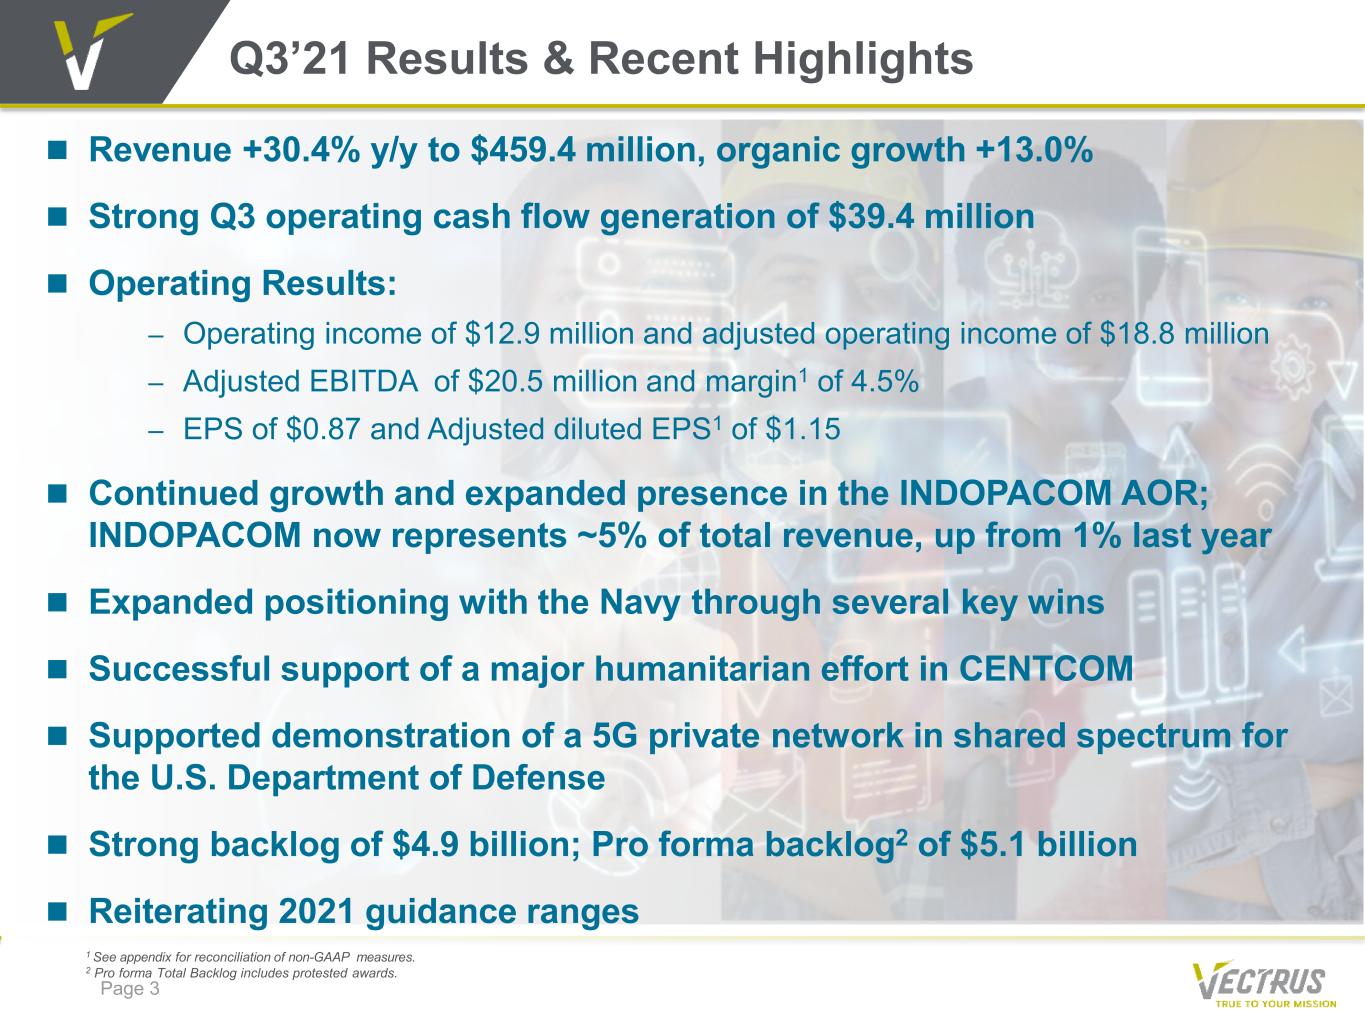
Page 3 1 See appendix for reconciliation of non-GAAP measures. 2 Pro forma Total Backlog includes protested awards. Q3’21 Results & Recent Highlights Revenue +30.4% y/y to $459.4 million, organic growth +13.0% Strong Q3 operating cash flow generation of $39.4 million Operating Results: – Operating income of $12.9 million and adjusted operating income of $18.8 million – Adjusted EBITDA of $20.5 million and margin1 of 4.5% – EPS of $0.87 and Adjusted diluted EPS1 of $1.15 Continued growth and expanded presence in the INDOPACOM AOR; INDOPACOM now represents ~5% of total revenue, up from 1% last year Expanded positioning with the Navy through several key wins Successful support of a major humanitarian effort in CENTCOM Supported demonstration of a 5G private network in shared spectrum for the U.S. Department of Defense Strong backlog of $4.9 billion; Pro forma backlog2 of $5.1 billion Reiterating 2021 guidance ranges

Support from the Ground Up Page 4 The LOGCAP V Task Order team received notice in mid- July to be prepared to build out living space for several thousand Afghan refugees In late July, we received the notice to start construction on what would become known as “Freedom Village” Vectrus had 45 days to design, solicit, and execute the construction and placement of 90 tents with over 250,000 sq ft. of housing space and associated life-support infrastructure The Vectrus team worked around the clock in the harsh desert heat to accomplish this very important humanitarian mission True to Your Mission
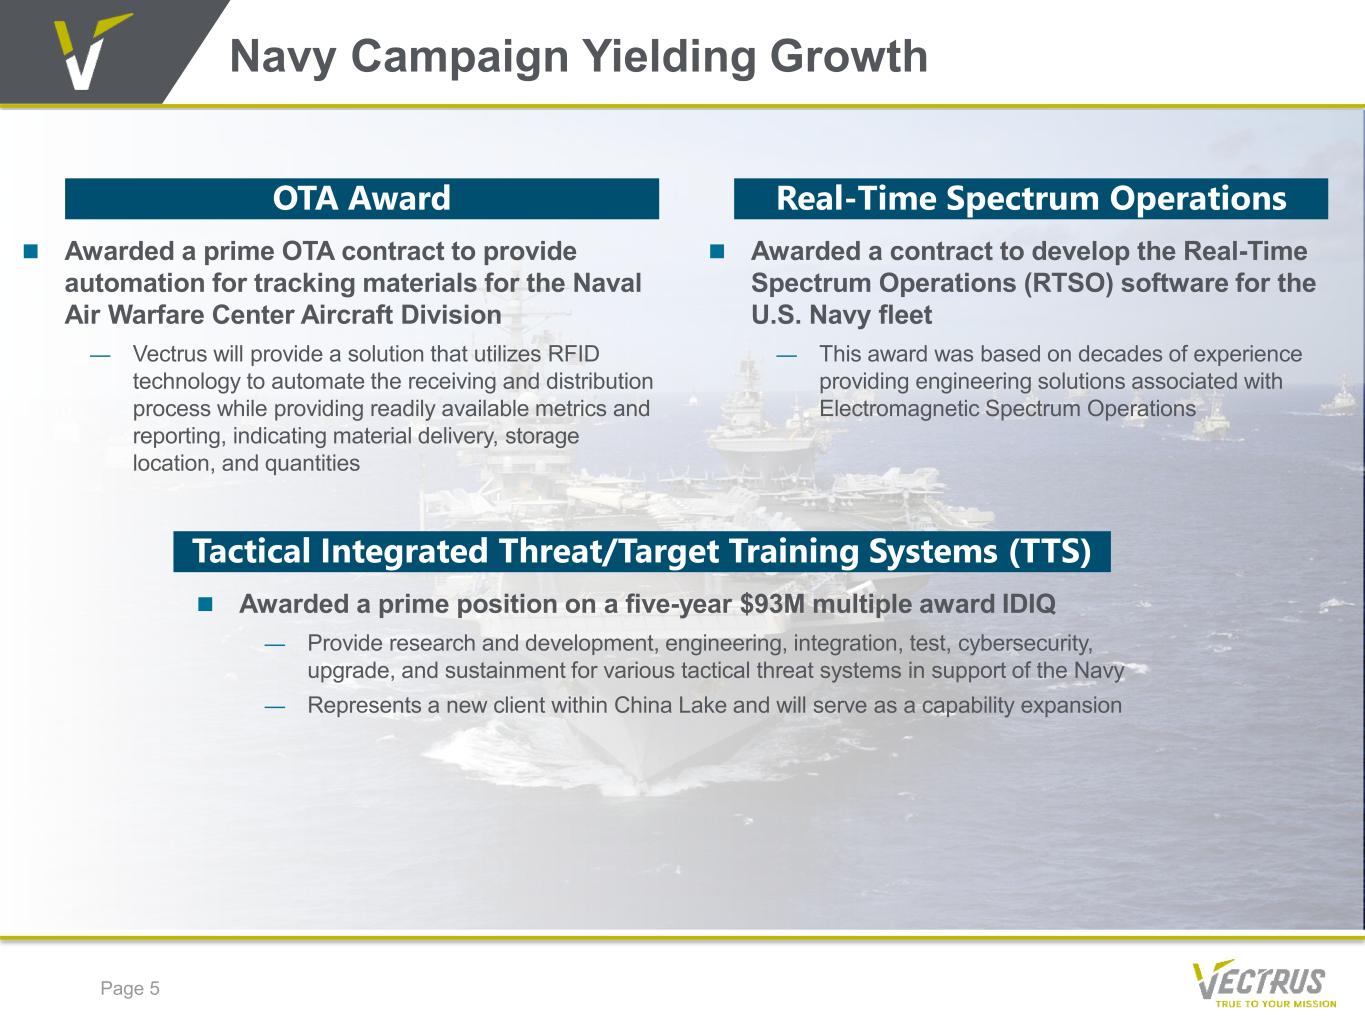
Navy Campaign Yielding Growth Page 5 Awarded a prime OTA contract to provide automation for tracking materials for the Naval Air Warfare Center Aircraft Division — Vectrus will provide a solution that utilizes RFID technology to automate the receiving and distribution process while providing readily available metrics and reporting, indicating material delivery, storage location, and quantities OTA Award Awarded a contract to develop the Real-Time Spectrum Operations (RTSO) software for the U.S. Navy fleet — This award was based on decades of experience providing engineering solutions associated with Electromagnetic Spectrum Operations Real-Time Spectrum Operations Awarded a prime position on a five-year $93M multiple award IDIQ — Provide research and development, engineering, integration, test, cybersecurity, upgrade, and sustainment for various tactical threat systems in support of the Navy — Represents a new client within China Lake and will serve as a capability expansion Tactical Integrated Threat/Target Training Systems (TTS)
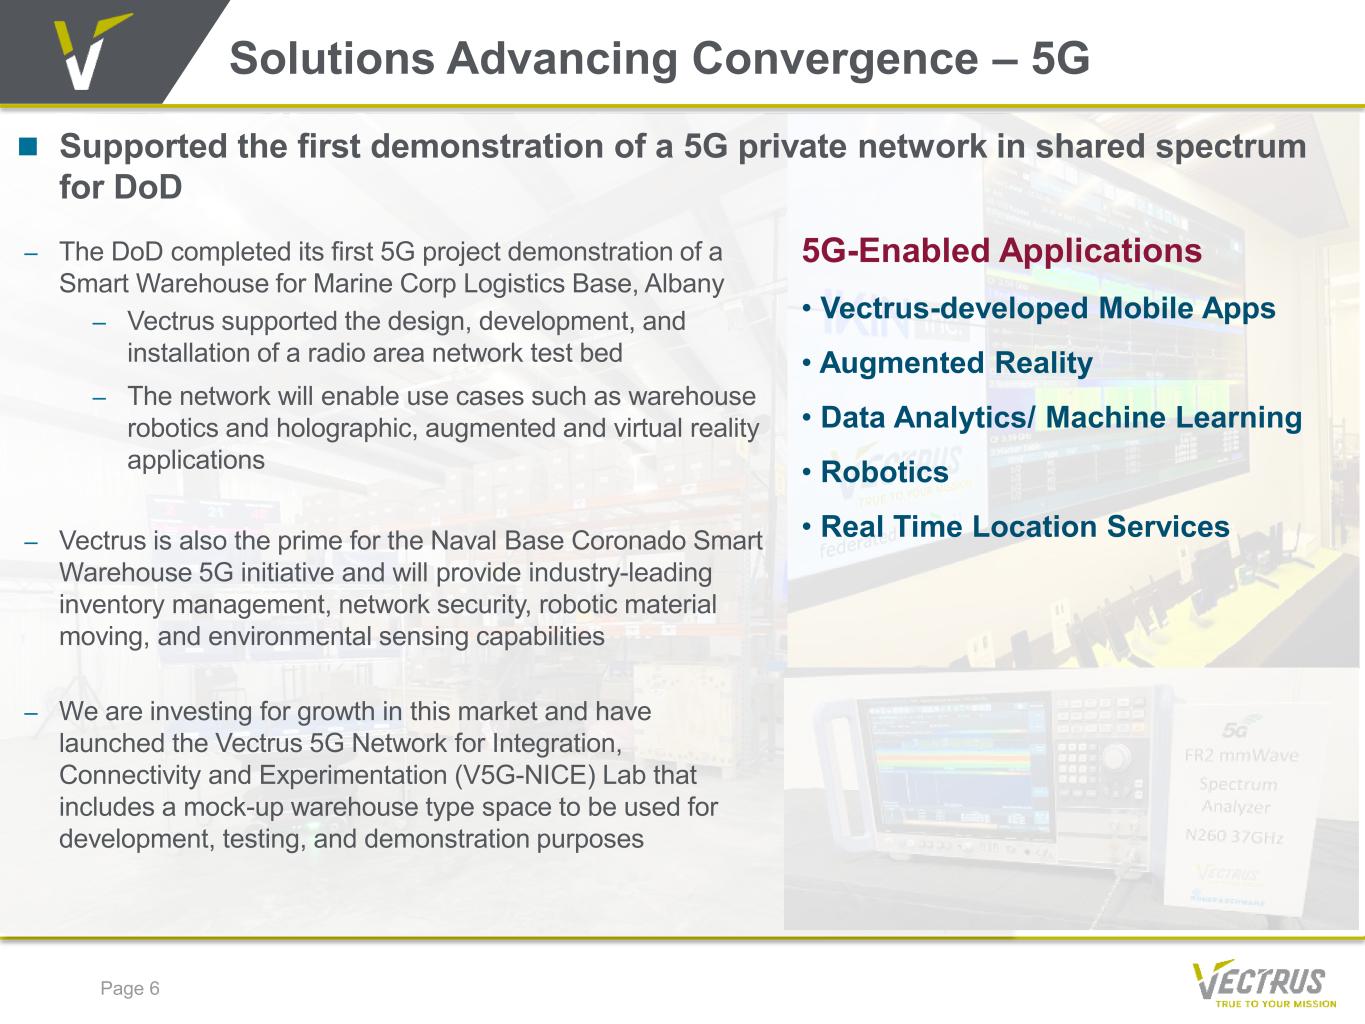
Page 6 Solutions Advancing Convergence – 5G Supported the first demonstration of a 5G private network in shared spectrum for DoD 5G-Enabled Applications • Vectrus-developed Mobile Apps • Augmented Reality • Data Analytics/ Machine Learning • Robotics • Real Time Location Services – The DoD completed its first 5G project demonstration of a Smart Warehouse for Marine Corp Logistics Base, Albany – Vectrus supported the design, development, and installation of a radio area network test bed – The network will enable use cases such as warehouse robotics and holographic, augmented and virtual reality applications – Vectrus is also the prime for the Naval Base Coronado Smart Warehouse 5G initiative and will provide industry-leading inventory management, network security, robotic material moving, and environmental sensing capabilities – We are investing for growth in this market and have launched the Vectrus 5G Network for Integration, Connectivity and Experimentation (V5G-NICE) Lab that includes a mock-up warehouse type space to be used for development, testing, and demonstration purposes
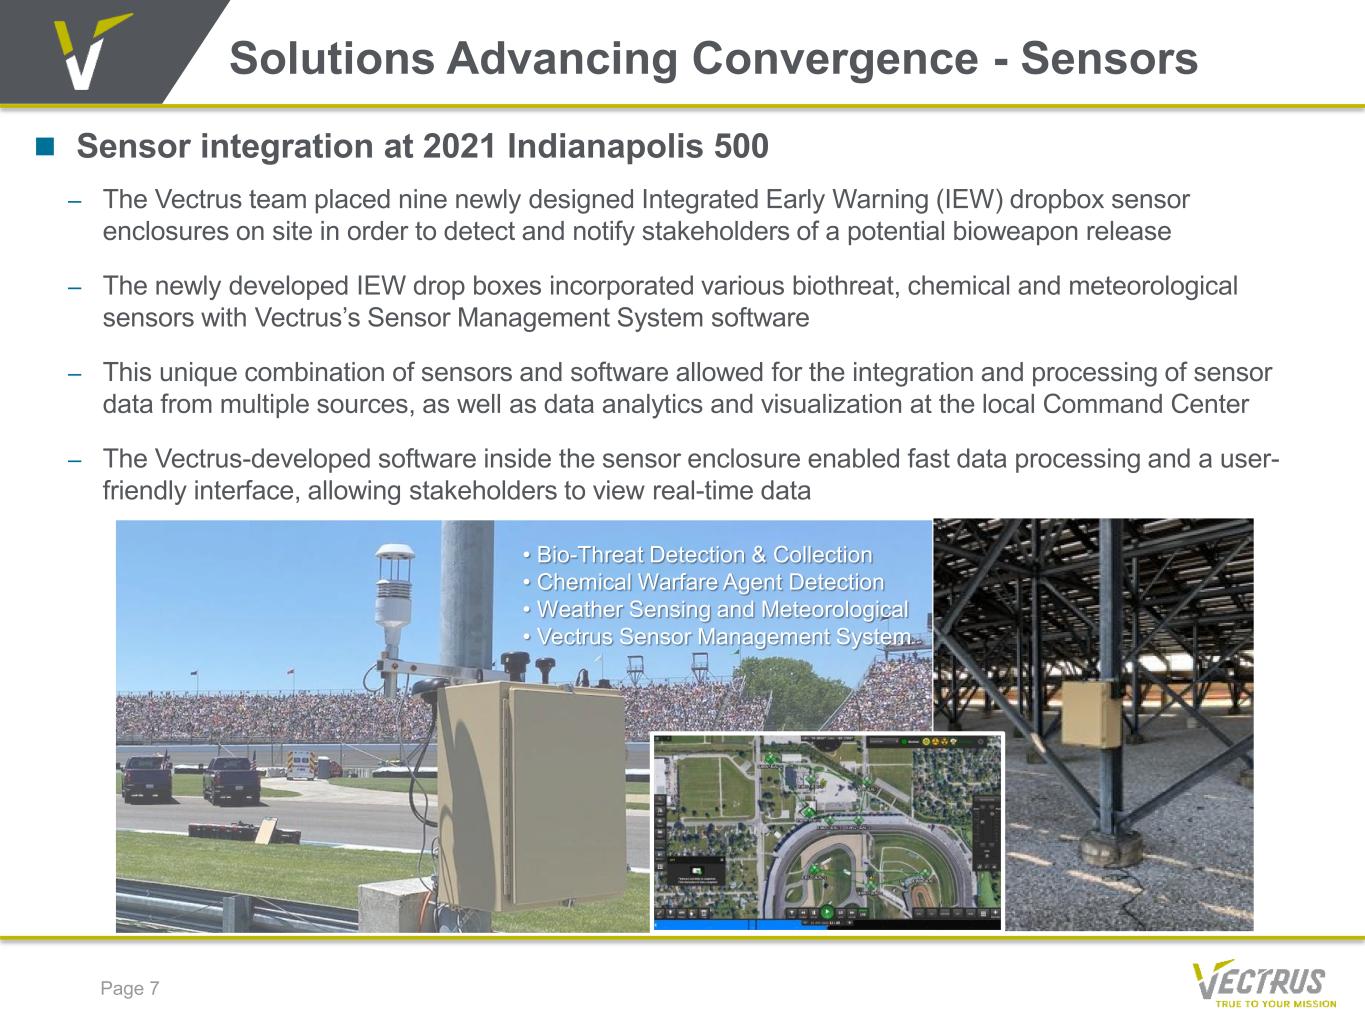
Page 7 Solutions Advancing Convergence - Sensors Sensor integration at 2021 Indianapolis 500 – The Vectrus team placed nine newly designed Integrated Early Warning (IEW) dropbox sensor enclosures on site in order to detect and notify stakeholders of a potential bioweapon release – The newly developed IEW drop boxes incorporated various biothreat, chemical and meteorological sensors with Vectrus’s Sensor Management System software – This unique combination of sensors and software allowed for the integration and processing of sensor data from multiple sources, as well as data analytics and visualization at the local Command Center – The Vectrus-developed software inside the sensor enclosure enabled fast data processing and a user- friendly interface, allowing stakeholders to view real-time data • Bio-Threat Detection & Collection • Chemical Warfare Agent Detection • Weather Sensing and Meteorological • Vectrus Sensor Management System
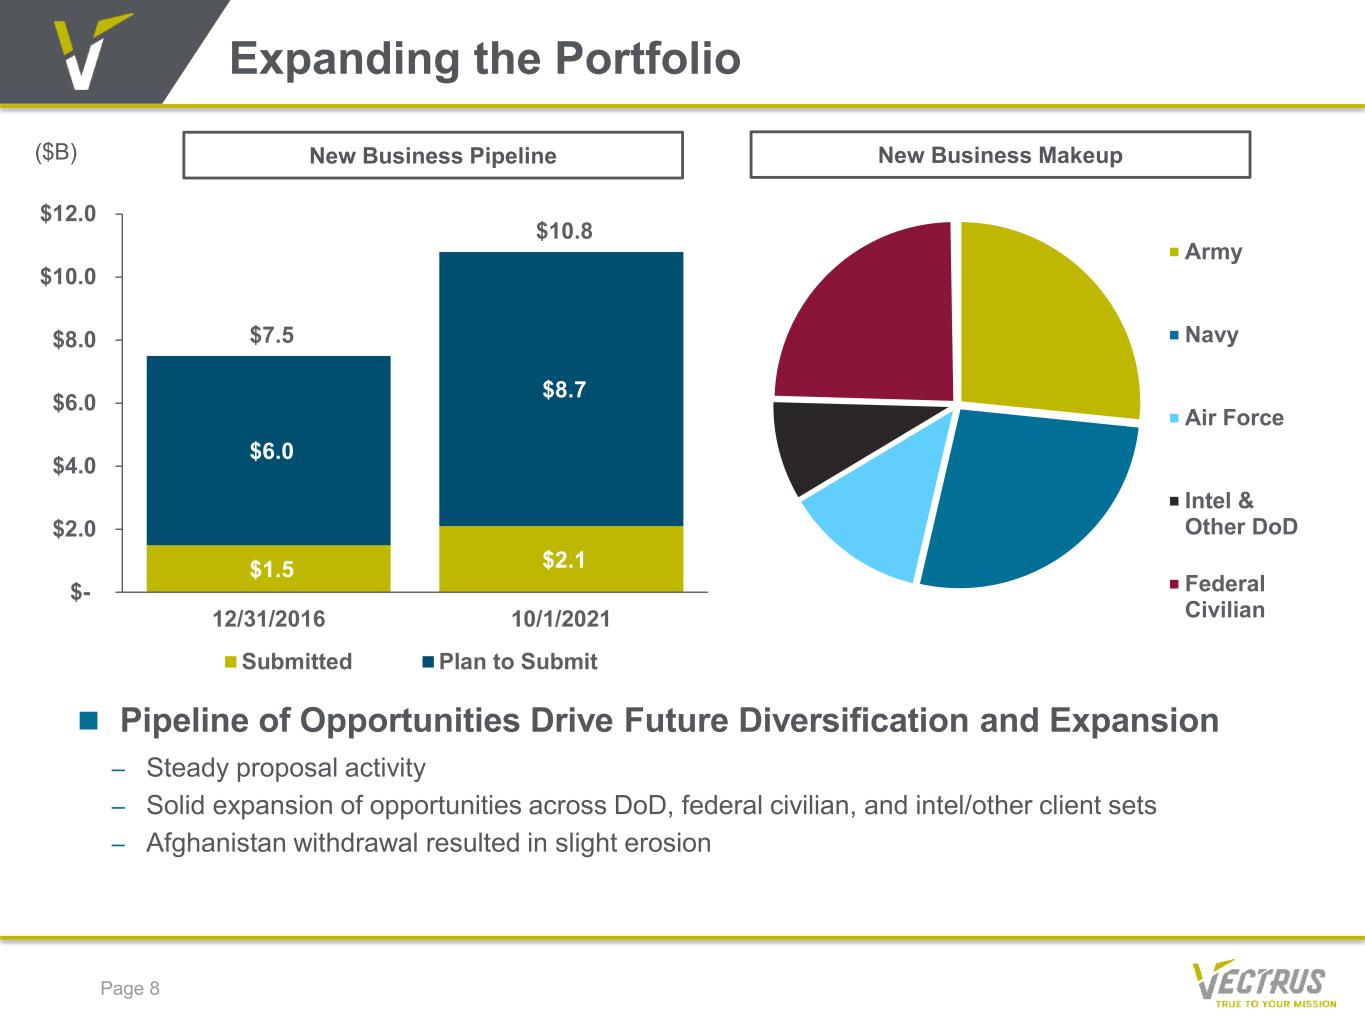
Page 8 Expanding the Portfolio Pipeline of Opportunities Drive Future Diversification and Expansion – Steady proposal activity – Solid expansion of opportunities across DoD, federal civilian, and intel/other client sets – Afghanistan withdrawal resulted in slight erosion New Business Pipeline New Business Makeup $1.5 $2.1 $6.0 $8.7 $7.5 $10.8 $- $2.0 $4.0 $6.0 $8.0 $10.0 $12.0 12/31/2016 10/1/2021 Submitted Plan to Submit Army Navy Air Force Intel & Other DoD Federal Civilian ($B)
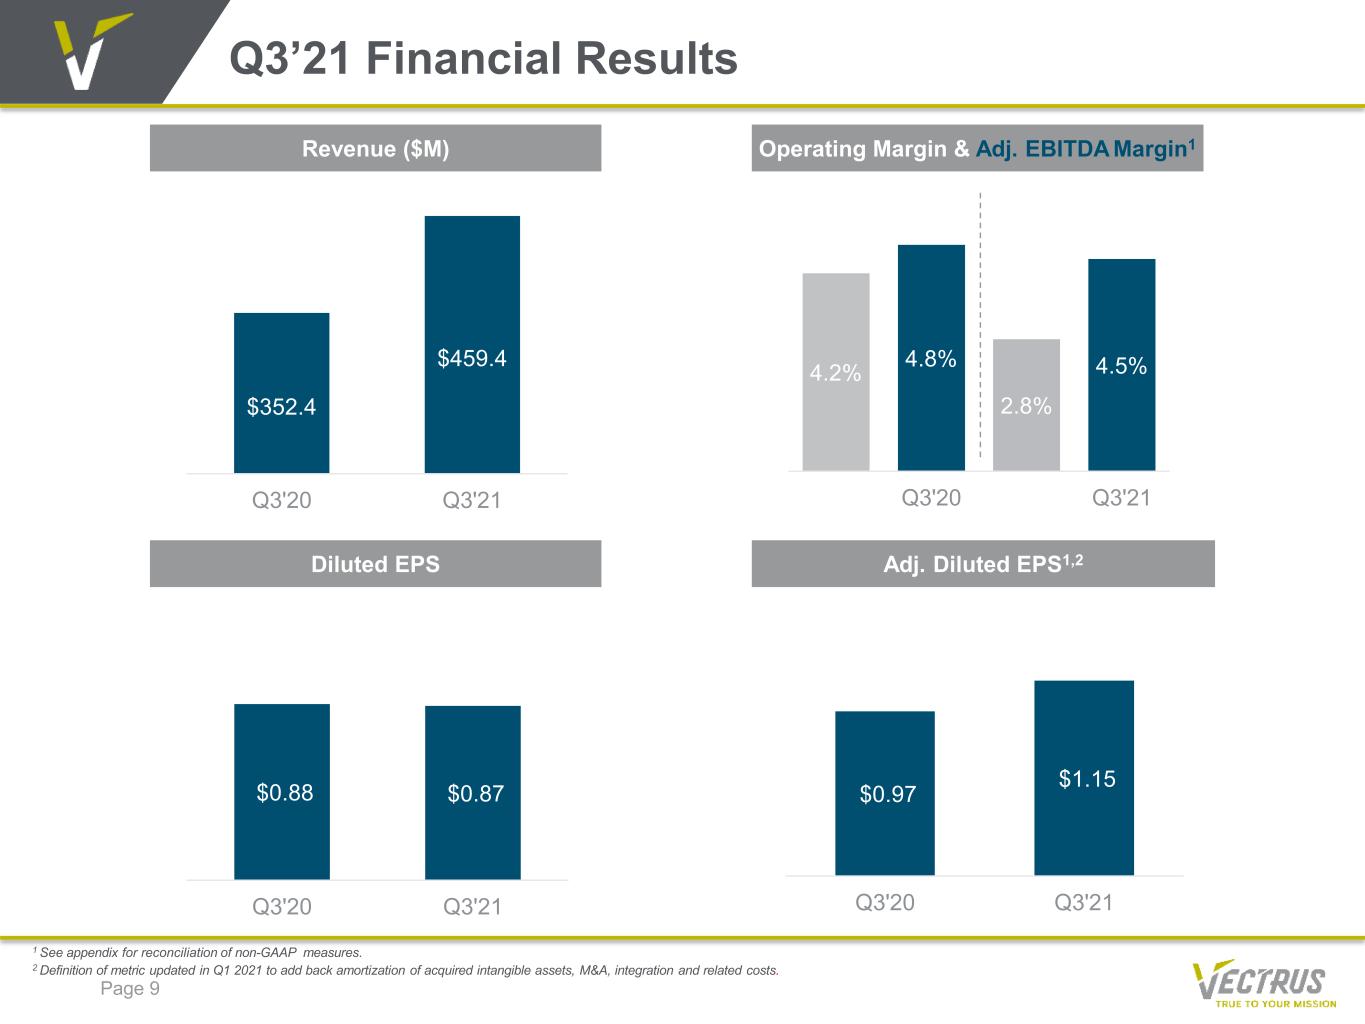
Page 9 1 See appendix for reconciliation of non-GAAP measures. 2 Definition of metric updated in Q1 2021 to add back amortization of acquired intangible assets, M&A, integration and related costs. Q3’21 Financial Results Revenue ($M) Operating Margin & Adj. EBITDA Margin1 Adj. Diluted EPS1,2 $352.4 $459.4 Q3'20 Q3'21 $0.97 $1.15 Q3'20 Q3'21 Diluted EPS $0.88 $0.87 Q3'20 Q3'21 4.2% 4.8% 2.8% 4.5% Q3'20 Q3'21

Page 10 Q3’21 Revenue by Category Customer Geographic Region Contract Type 66% 14% 11% 9% Q3'21 Army Air Force Navy Other 57%30% 8% 5% Q3'21 Middle East US Europe Asia 74% 23% 3% Q3'21 Cost-type Fixed Price T&M 1 2020 T&M immaterial and included in cost-type. 67% 23% 5% 5% Q3'20 Army Air Force Navy Other 63% 25% 11% 1% Q3'20 Middle East US Europe Asia 71% 29% Q3'20 Cost-type Fixed Price T&M 1
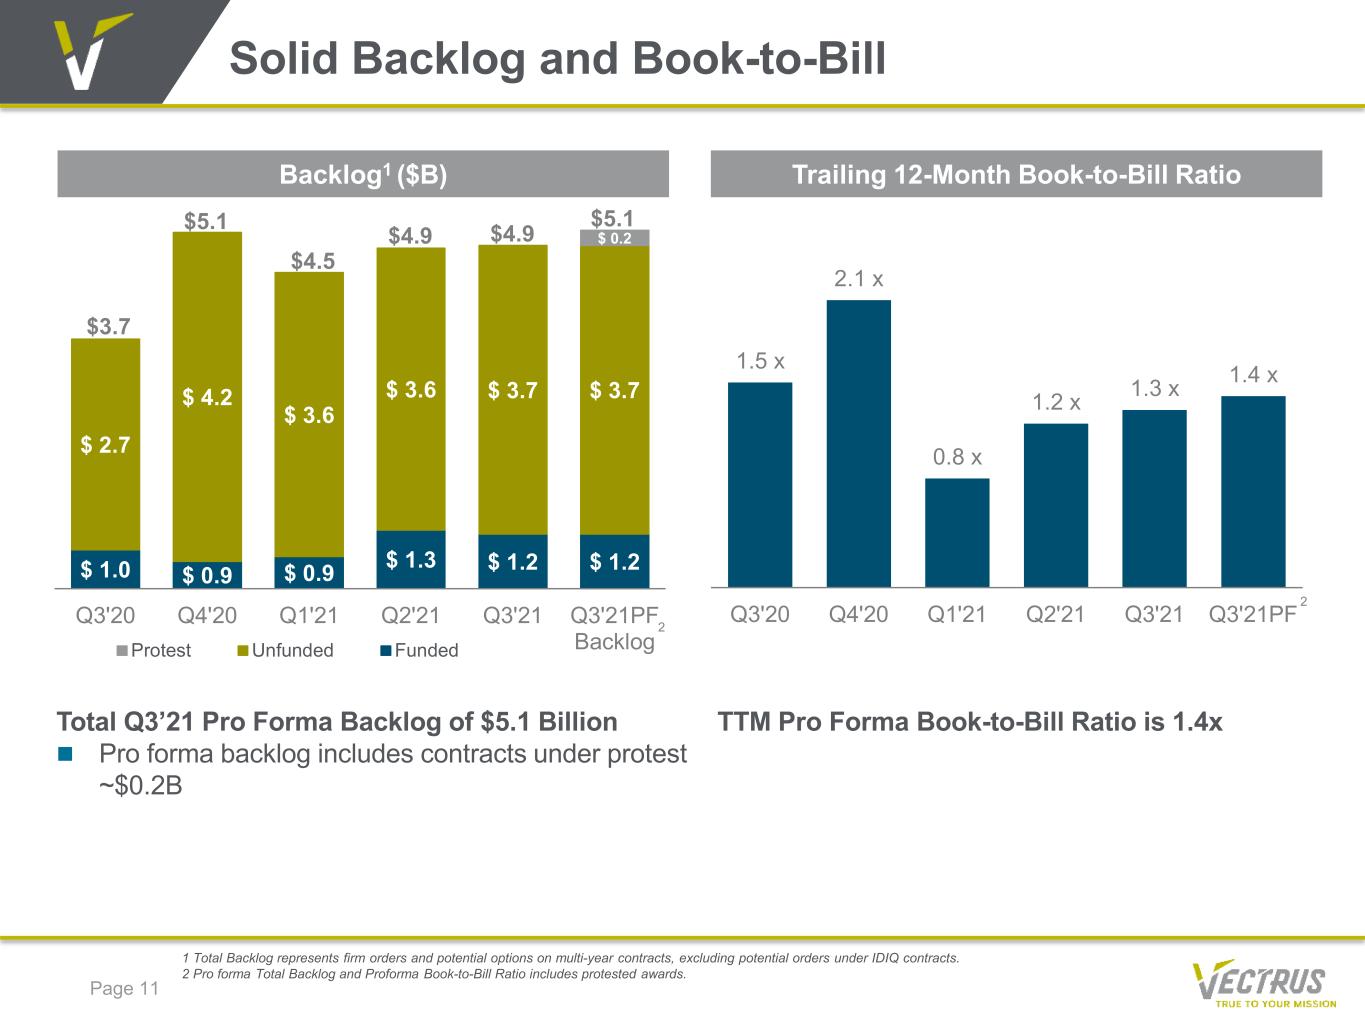
Solid Backlog and Book-to-Bill Page 11 Total Q3’21 Pro Forma Backlog of $5.1 Billion Pro forma backlog includes contracts under protest ~$0.2B Backlog1 ($B) Trailing 12-Month Book-to-Bill Ratio TTM Pro Forma Book-to-Bill Ratio is 1.4x 1.5 x 2.1 x 0.8 x 1.2 x 1.3 x 1.4 x Q3'20 Q4'20 Q1'21 Q2'21 Q3'21 Q3'21PF $ 1.0 $ 0.9 $ 0.9 $ 1.3 $ 1.2 $ 1.2 $ 2.7 $ 4.2 $ 3.6 $ 3.6 $ 3.7 $ 3.7 $ 0.2 Q3'20 Q4'20 Q1'21 Q2'21 Q3'21 Q3'21PF BacklogProtest Unfunded Funded $4.9 $4.5 $5.1 $3.7 $4.9 1 Total Backlog represents firm orders and potential options on multi-year contracts, excluding potential orders under IDIQ contracts. 2 Pro forma Total Backlog and Proforma Book-to-Bill Ratio includes protested awards. 2 2 $5.1
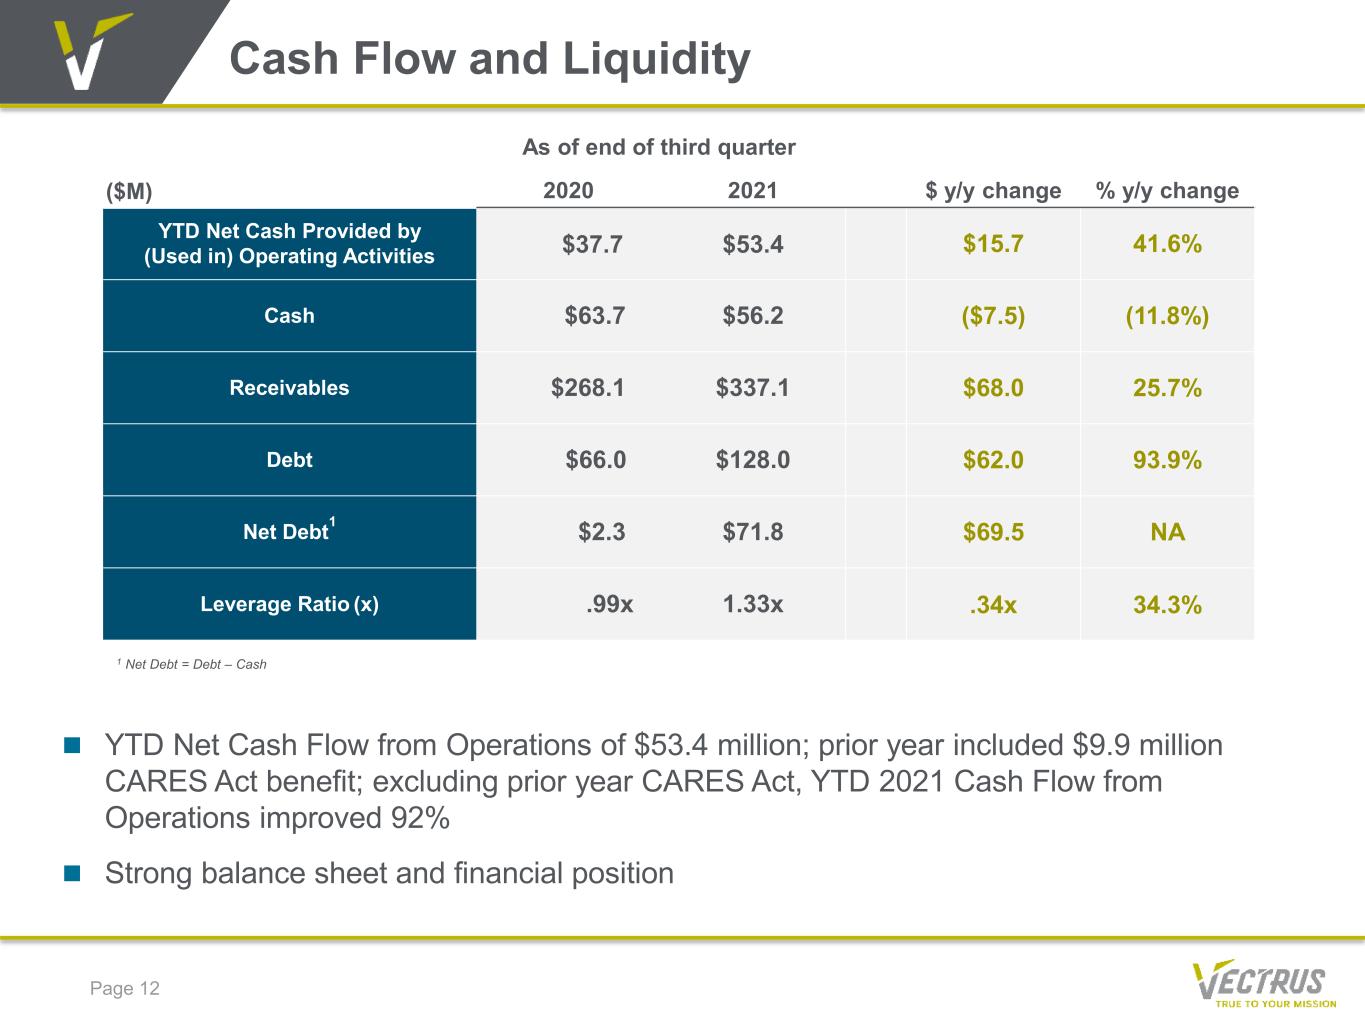
($M) 2020 2021 $ y/y change % y/y change YTD Net Cash Provided by (Used in) Operating Activities $37.7 $53.4 $15.7 41.6% Cash $63.7 $56.2 ($7.5) (11.8%) Receivables $268.1 $337.1 $68.0 25.7% Debt $66.0 $128.0 $62.0 93.9% Net Debt1 $2.3 $71.8 $69.5 NA Leverage Ratio (x) .99x 1.33x .34x 34.3% Page 12 Cash Flow and Liquidity 1 Net Debt = Debt – Cash YTD Net Cash Flow from Operations of $53.4 million; prior year included $9.9 million CARES Act benefit; excluding prior year CARES Act, YTD 2021 Cash Flow from Operations improved 92% Strong balance sheet and financial position As of end of third quarter
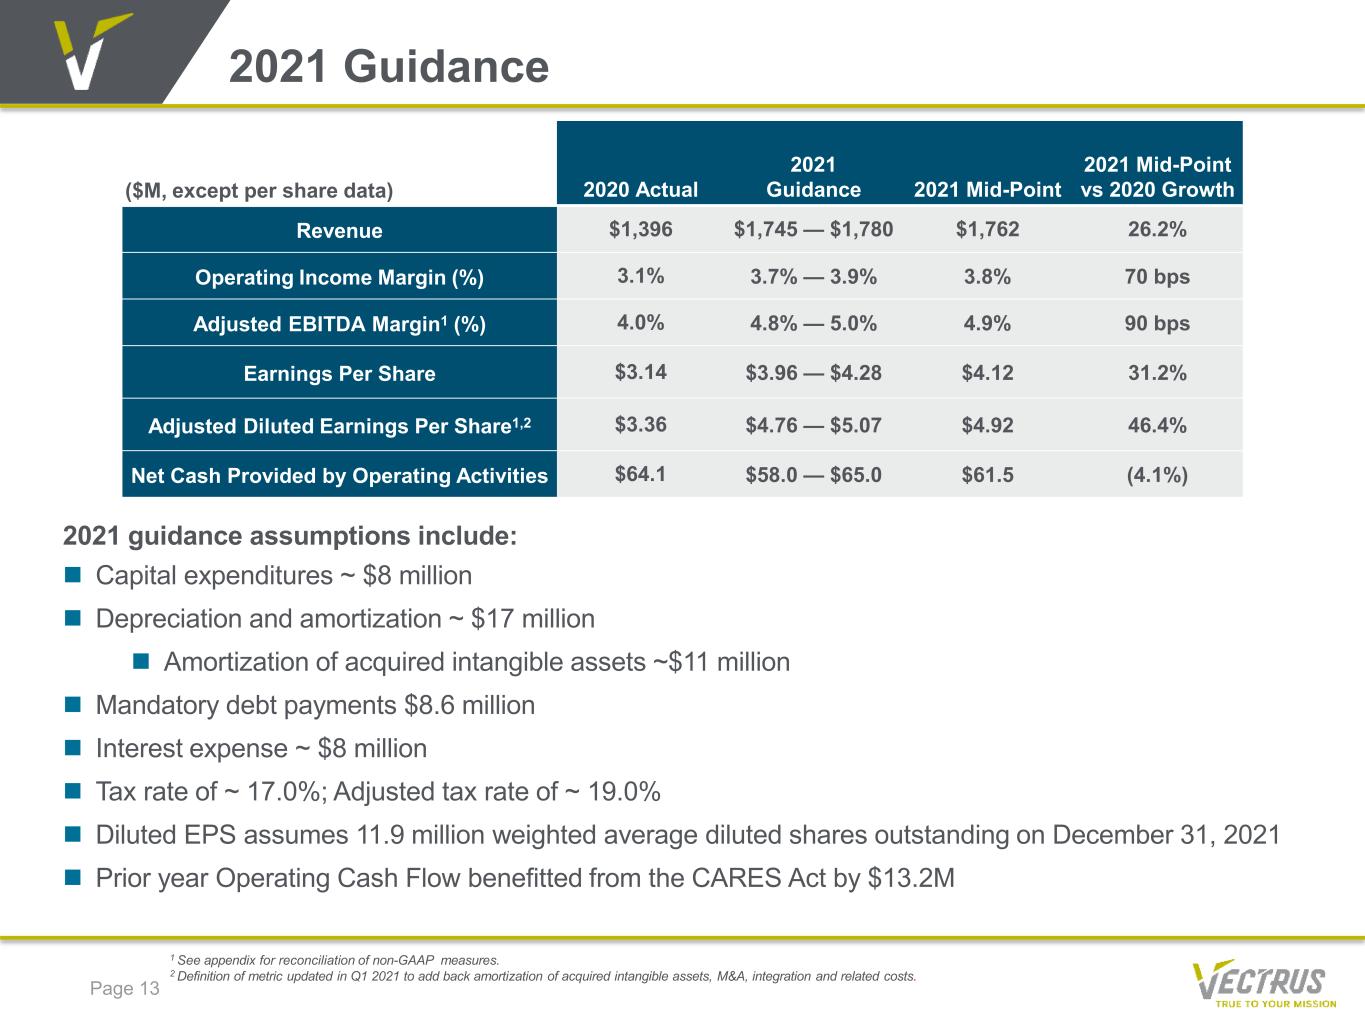
2021 Guidance 2021 guidance assumptions include: Capital expenditures ~ $8 million Depreciation and amortization ~ $17 million Amortization of acquired intangible assets ~$11 million Mandatory debt payments $8.6 million Interest expense ~ $8 million Tax rate of ~ 17.0%; Adjusted tax rate of ~ 19.0% Diluted EPS assumes 11.9 million weighted average diluted shares outstanding on December 31, 2021 Prior year Operating Cash Flow benefitted from the CARES Act by $13.2M Page 13 1 See appendix for reconciliation of non-GAAP measures. 2 Definition of metric updated in Q1 2021 to add back amortization of acquired intangible assets, M&A, integration and related costs. ($M, except per share data) 2020 Actual 2021 Guidance 2021 Mid-Point 2021 Mid-Point vs 2020 Growth Revenue $1,396 $1,745 — $1,780 $1,762 26.2% Operating Income Margin (%) 3.1% 3.7% — 3.9% 3.8% 70 bps Adjusted EBITDA Margin1 (%) 4.0% 4.8% — 5.0% 4.9% 90 bps Earnings Per Share $3.14 $3.96 — $4.28 $4.12 31.2% Adjusted Diluted Earnings Per Share1,2 $3.36 $4.76 — $5.07 $4.92 46.4% Net Cash Provided by Operating Activities $64.1 $58.0 — $65.0 $61.5 (4.1%)
APPENDIX

Reconciliation Of Non-GAAP Measures Page 15 The primary financial performance measures we use to manage our business and monitor results of operations are revenue trends and operating income trends. In addition, we consider adjusted operating income, adjusted operating margin, adjusted net income, adjusted diluted earnings per share, EBITDA, Adjusted EBITDA, EBITDA margin, adjusted EBITDA margin, to be useful to management and investors in evaluating our operating performance for the periods presented, and to provide a tool for evaluating our ongoing operations. This information can assist investors in assessing our financial performance and measures our ability to generate capital for deployment among competing strategic alternatives and initiatives. Adjusted operating income, adjusted operating margin, adjusted net income, adjusted diluted earnings per share, EBITDA, adjusted EBITDA, EBITDA margin, adjusted EBITDA margin, however, are not measures of financial performance under generally accepted accounting principles in the United States of America (GAAP) and should not be considered a substitute for net income and diluted earnings per share as determined in accordance with GAAP. Definitions and reconciliations of these items are provided below. “Adjusted operating income” is defined as operating income, adjusted to exclude items that may include, but are not limited to significant charges or credits, and unusual and infrequent non-operating items, such as M&A, integration and related costs, LOGCAP V pre-operational legal costs, and amortization of acquired intangible assets that impact current results but are not related to our ongoing operations. "Adjusted operating margin" is defined as adjusted operating income divided by revenue. "Adjusted net income” is defined as net income, adjusted to exclude items that may include, but are not limited to, significant charges or credits, and unusual and infrequent non-operating items, such as M&A, integration and related costs, LOGCAP V pre-operational legal costs, and amortization of acquired intangible assets that impact current results but are not related to our ongoing operations. "Adjusted diluted earnings per share" is defined as adjusted net income divided by the weighted average diluted common shares outstanding. "EBITDA" is defined as operating income, adjusted to exclude depreciation and amortization. "Adjusted EBITDA” is defined as EBITDA, adjusted to exclude items that may include, but are not limited to, significant charges or credits and unusual and infrequent non-operating items, such as M&A, integration and related costs, and LOGCAP V pre-operational legal costs, that impact current results but are not related to our ongoing operations.. "EBITDA margin" is defined as EBITDA divided by revenue. "Adjusted EBITDA margin" is defined as Adjusted EBITDA divided by revenue.
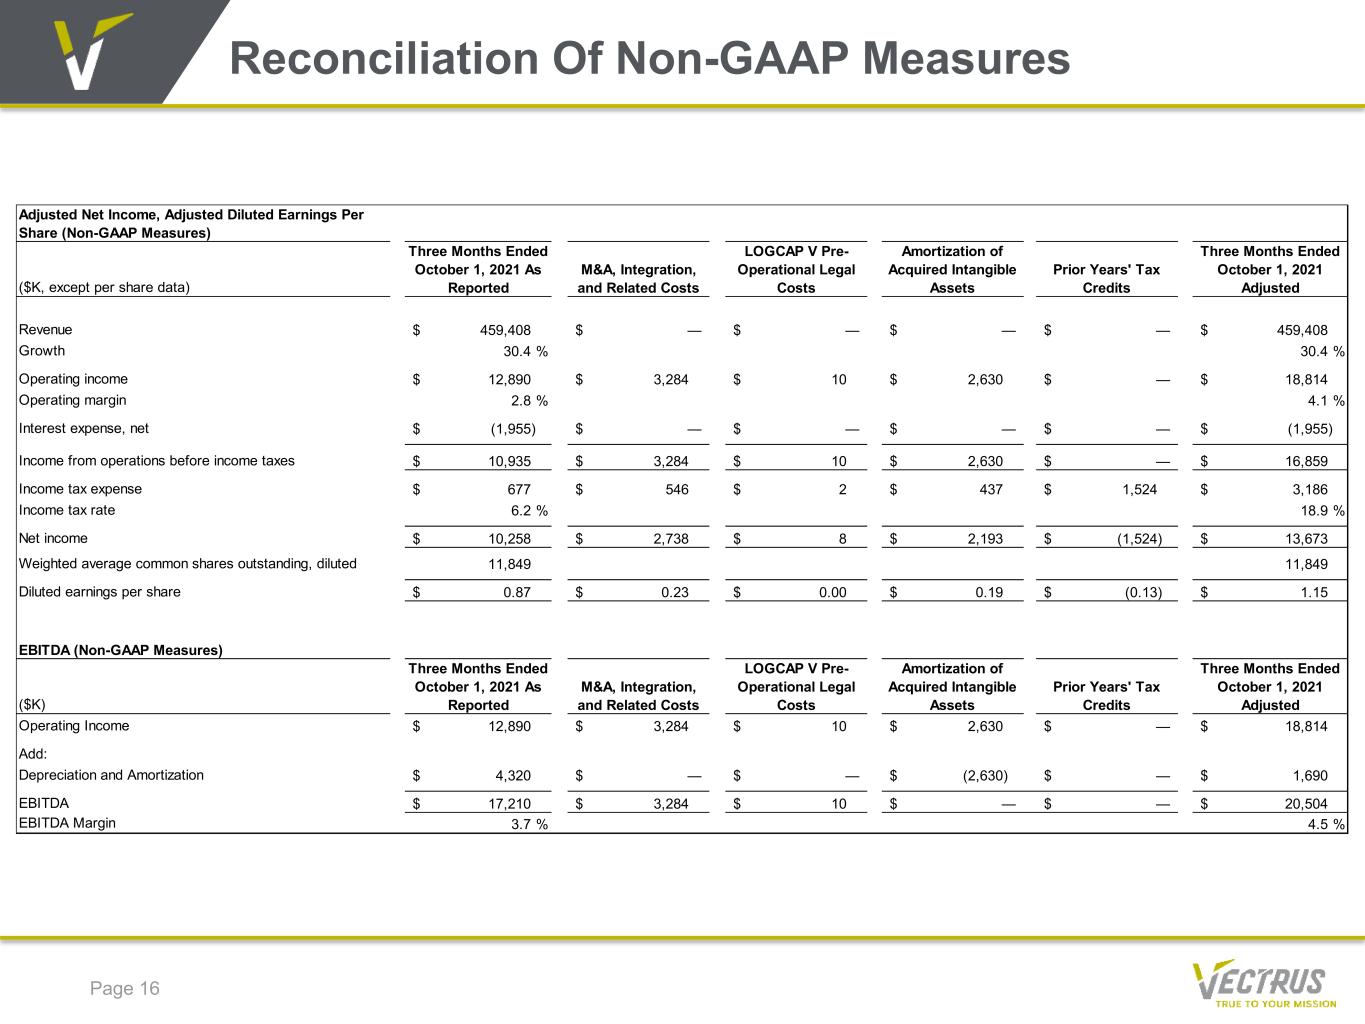
Reconciliation Of Non-GAAP Measures Page 16 Adjusted Net Income, Adjusted Diluted Earnings Per Share (Non-GAAP Measures) ($K, except per share data) Three Months Ended October 1, 2021 As Reported M&A, Integration, and Related Costs LOGCAP V Pre- Operational Legal Costs Amortization of Acquired Intangible Assets Prior Years' Tax Credits Three Months Ended October 1, 2021 Adjusted Revenue 459,408$ —$ —$ —$ —$ 459,408$ Growth 30.4 % 30.4 % Operating income 12,890$ 3,284$ 10$ 2,630$ —$ 18,814$ Operating margin 2.8 % 4.1 % Interest expense, net (1,955)$ —$ —$ —$ —$ (1,955)$ Income from operations before income taxes 10,935$ 3,284$ 10$ 2,630$ —$ 16,859$ Income tax expense 677$ 546$ 2$ 437$ 1,524$ 3,186$ Income tax rate 6.2 % 18.9 % Net income 10,258$ 2,738$ 8$ 2,193$ (1,524)$ 13,673$ Weighted average common shares outstanding, diluted 11,849 11,849 Diluted earnings per share 0.87$ 0.23$ 0.00$ 0.19$ (0.13)$ 1.15$ EBITDA (Non-GAAP Measures) ($K) Three Months Ended October 1, 2021 As Reported M&A, Integration, and Related Costs LOGCAP V Pre- Operational Legal Costs Amortization of Acquired Intangible Assets Prior Years' Tax Credits Three Months Ended October 1, 2021 Adjusted Operating Income 12,890$ 3,284$ 10$ 2,630$ —$ 18,814$ Add: Depreciation and Amortization 4,320$ —$ —$ (2,630)$ —$ 1,690$ EBITDA 17,210$ 3,284$ 10$ —$ —$ 20,504$ EBITDA Margin 3.7 % 4.5 %
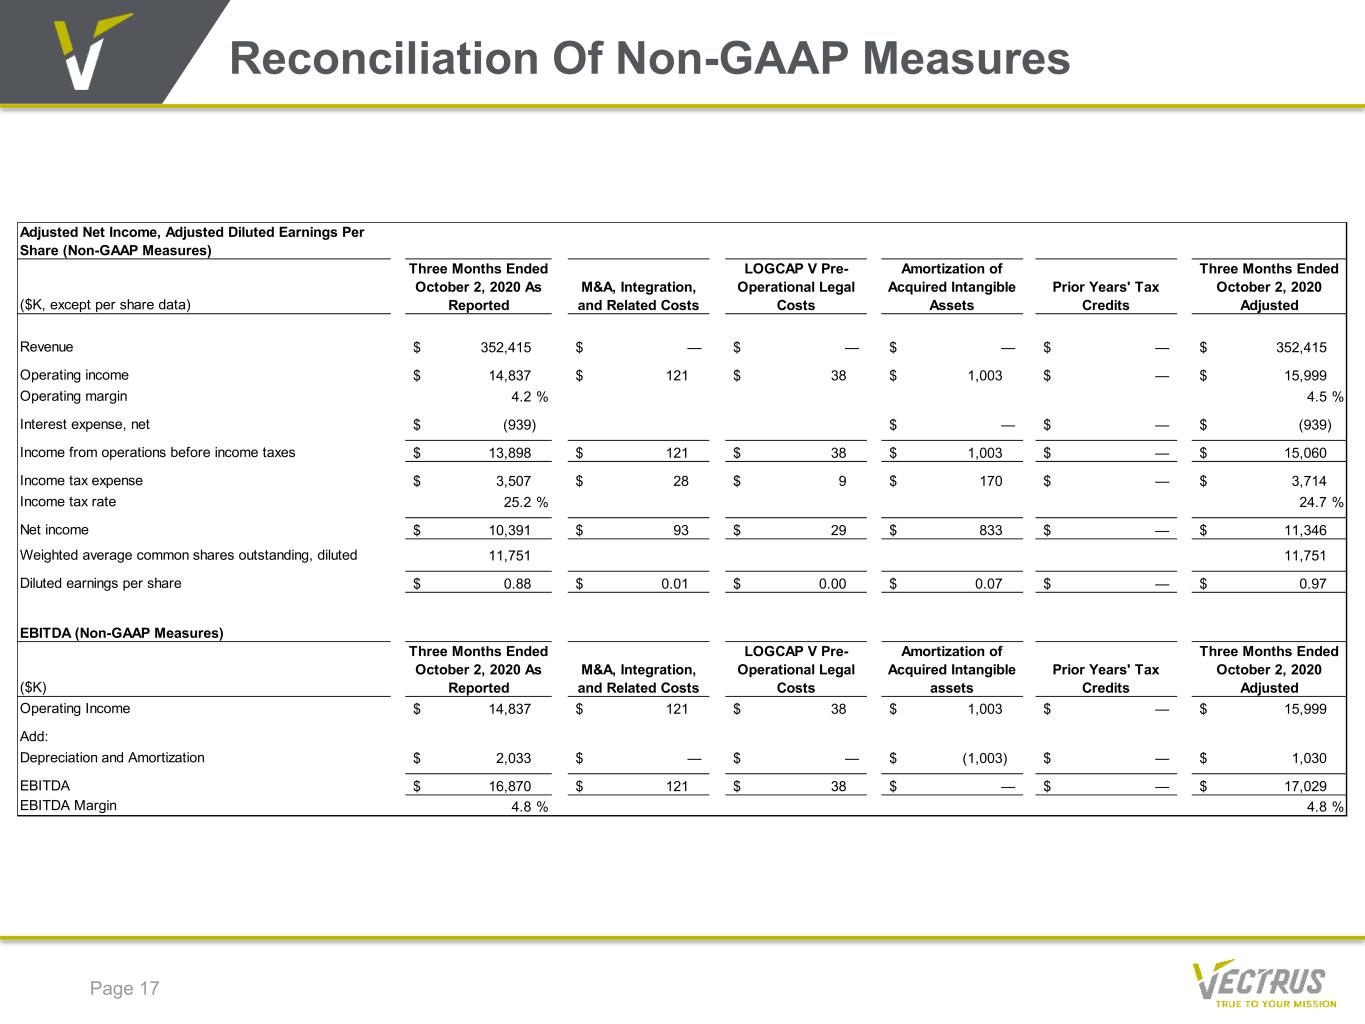
Reconciliation Of Non-GAAP Measures Page 17 Adjusted Net Income, Adjusted Diluted Earnings Per Share (Non-GAAP Measures) ($K, except per share data) Three Months Ended October 2, 2020 As Reported M&A, Integration, and Related Costs LOGCAP V Pre- Operational Legal Costs Amortization of Acquired Intangible Assets Prior Years' Tax Credits Three Months Ended October 2, 2020 Adjusted Revenue 352,415$ —$ —$ —$ —$ 352,415$ Operating income 14,837$ 121$ 38$ 1,003$ —$ 15,999$ Operating margin 4.2 % 4.5 % Interest expense, net (939)$ —$ —$ (939)$ Income from operations before income taxes 13,898$ 121$ 38$ 1,003$ —$ 15,060$ Income tax expense 3,507$ 28$ 9$ 170$ —$ 3,714$ Income tax rate 25.2 % 24.7 % Net income 10,391$ 93$ 29$ 833$ —$ 11,346$ Weighted average common shares outstanding, diluted 11,751 11,751 Diluted earnings per share 0.88$ 0.01$ 0.00$ 0.07$ —$ 0.97$ EBITDA (Non-GAAP Measures) ($K) Three Months Ended October 2, 2020 As Reported M&A, Integration, and Related Costs LOGCAP V Pre- Operational Legal Costs Amortization of Acquired Intangible assets Prior Years' Tax Credits Three Months Ended October 2, 2020 Adjusted Operating Income 14,837$ 121$ 38$ 1,003$ —$ 15,999$ Add: Depreciation and Amortization 2,033$ —$ —$ (1,003)$ —$ 1,030$ EBITDA 16,870$ 121$ 38$ —$ —$ 17,029$ EBITDA Margin 4.8 % 4.8 %
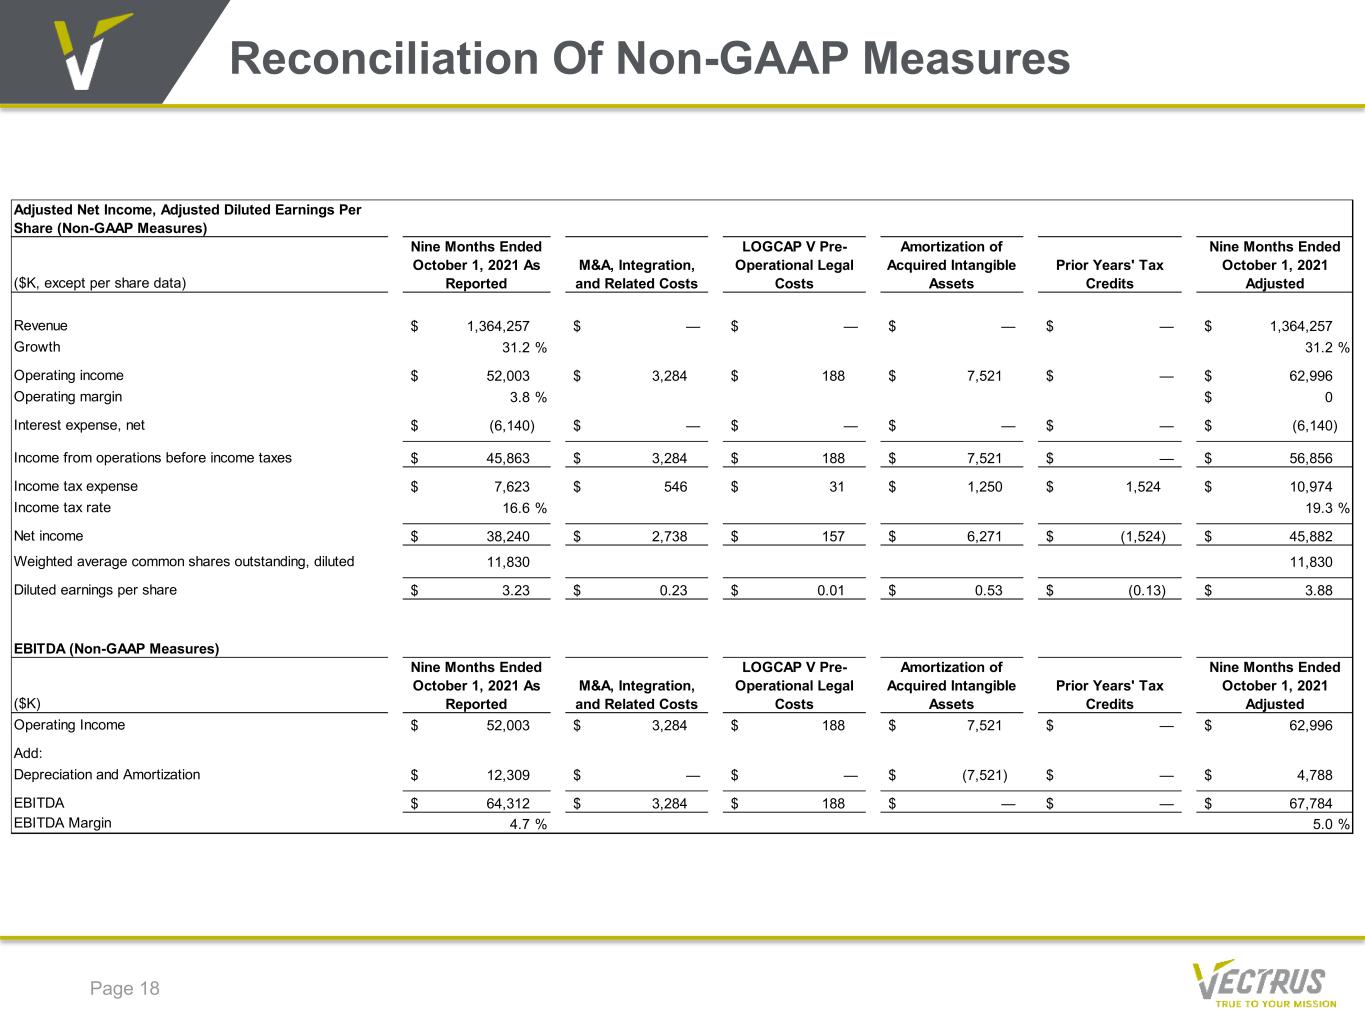
Reconciliation Of Non-GAAP Measures Page 18 Adjusted Net Income, Adjusted Diluted Earnings Per Share (Non-GAAP Measures) ($K, except per share data) Nine Months Ended October 1, 2021 As Reported M&A, Integration, and Related Costs LOGCAP V Pre- Operational Legal Costs Amortization of Acquired Intangible Assets Prior Years' Tax Credits Nine Months Ended October 1, 2021 Adjusted Revenue 1,364,257$ —$ —$ —$ —$ 1,364,257$ Growth 31.2 % 31.2 % Operating income 52,003$ 3,284$ 188$ 7,521$ —$ 62,996$ Operating margin 3.8 % 0$ Interest expense, net (6,140)$ —$ —$ —$ —$ (6,140)$ Income from operations before income taxes 45,863$ 3,284$ 188$ 7,521$ —$ 56,856$ Income tax expense 7,623$ 546$ 31$ 1,250$ 1,524$ 10,974$ Income tax rate 16.6 % 19.3 % Net income 38,240$ 2,738$ 157$ 6,271$ (1,524)$ 45,882$ Weighted average common shares outstanding, diluted 11,830 11,830 Diluted earnings per share 3.23$ 0.23$ 0.01$ 0.53$ (0.13)$ 3.88$ EBITDA (Non-GAAP Measures) ($K) Nine Months Ended October 1, 2021 As Reported M&A, Integration, and Related Costs LOGCAP V Pre- Operational Legal Costs Amortization of Acquired Intangible Assets Prior Years' Tax Credits Nine Months Ended October 1, 2021 Adjusted Operating Income 52,003$ 3,284$ 188$ 7,521$ —$ 62,996$ Add: Depreciation and Amortization 12,309$ —$ —$ (7,521)$ —$ 4,788$ EBITDA 64,312$ 3,284$ 188$ —$ —$ 67,784$ EBITDA Margin 4.7 % 5.0 %
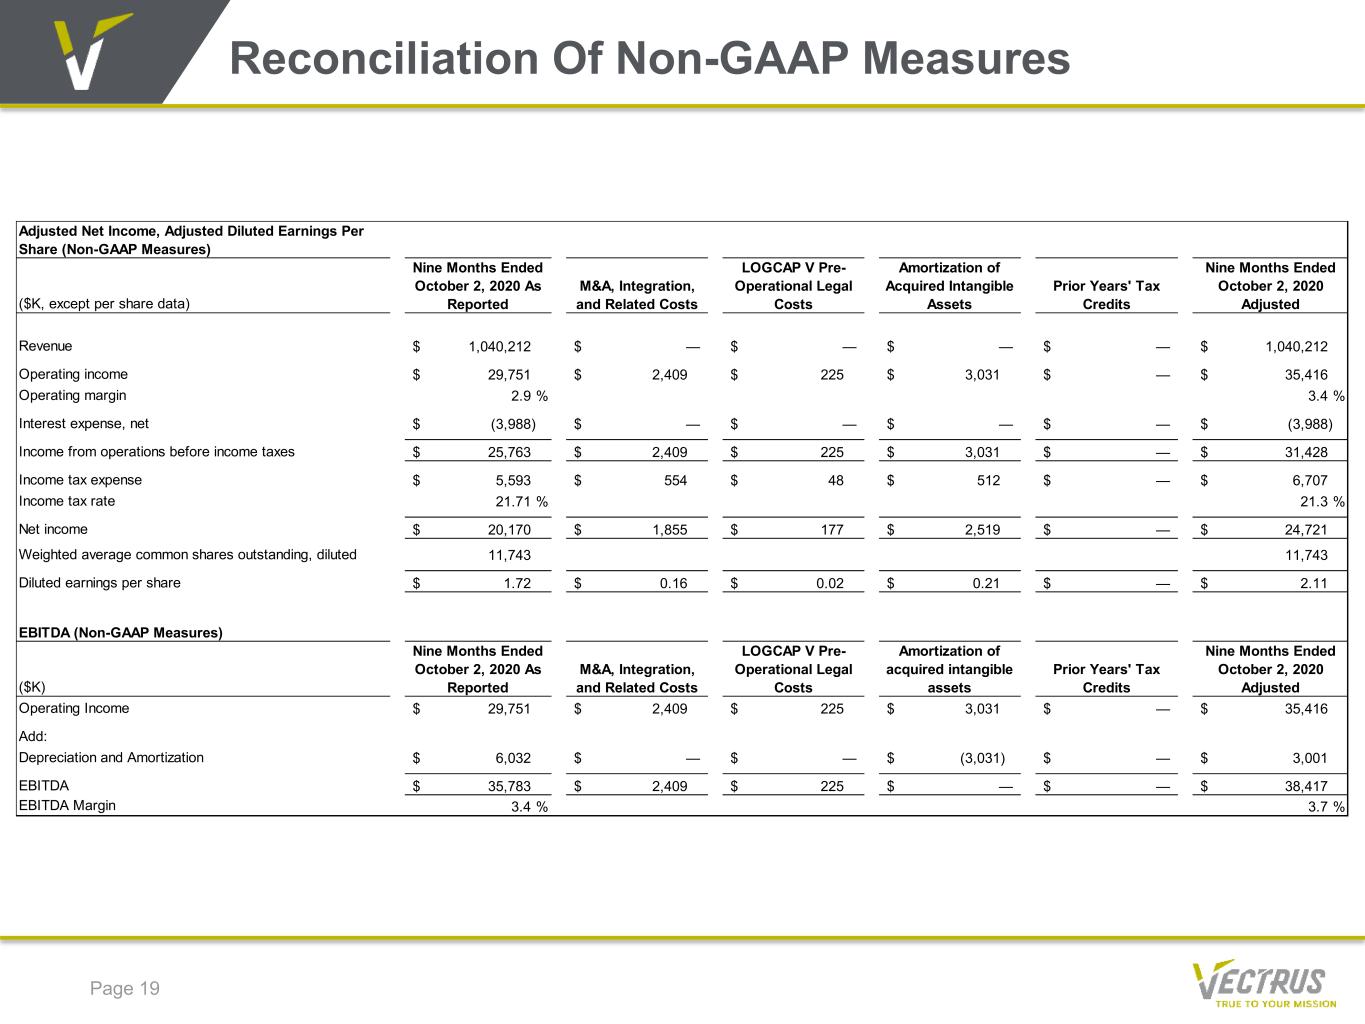
Reconciliation Of Non-GAAP Measures Page 19 Adjusted Net Income, Adjusted Diluted Earnings Per Share (Non-GAAP Measures) ($K, except per share data) Nine Months Ended October 2, 2020 As Reported M&A, Integration, and Related Costs LOGCAP V Pre- Operational Legal Costs Amortization of Acquired Intangible Assets Prior Years' Tax Credits Nine Months Ended October 2, 2020 Adjusted Revenue 1,040,212$ —$ —$ —$ —$ 1,040,212$ Operating income 29,751$ 2,409$ 225$ 3,031$ —$ 35,416$ Operating margin 2.9 % 3.4 % Interest expense, net (3,988)$ —$ —$ —$ —$ (3,988)$ Income from operations before income taxes 25,763$ 2,409$ 225$ 3,031$ —$ 31,428$ Income tax expense 5,593$ 554$ 48$ 512$ —$ 6,707$ Income tax rate 21.71 % 21.3 % Net income 20,170$ 1,855$ 177$ 2,519$ —$ 24,721$ Weighted average common shares outstanding, diluted 11,743 11,743 Diluted earnings per share 1.72$ 0.16$ 0.02$ 0.21$ —$ 2.11$ EBITDA (Non-GAAP Measures) ($K) Nine Months Ended October 2, 2020 As Reported M&A, Integration, and Related Costs LOGCAP V Pre- Operational Legal Costs Amortization of acquired intangible assets Prior Years' Tax Credits Nine Months Ended October 2, 2020 Adjusted Operating Income 29,751$ 2,409$ 225$ 3,031$ —$ 35,416$ Add: Depreciation and Amortization 6,032$ —$ —$ (3,031)$ —$ 3,001$ EBITDA 35,783$ 2,409$ 225$ —$ —$ 38,417$ EBITDA Margin 3.4 % 3.7 %
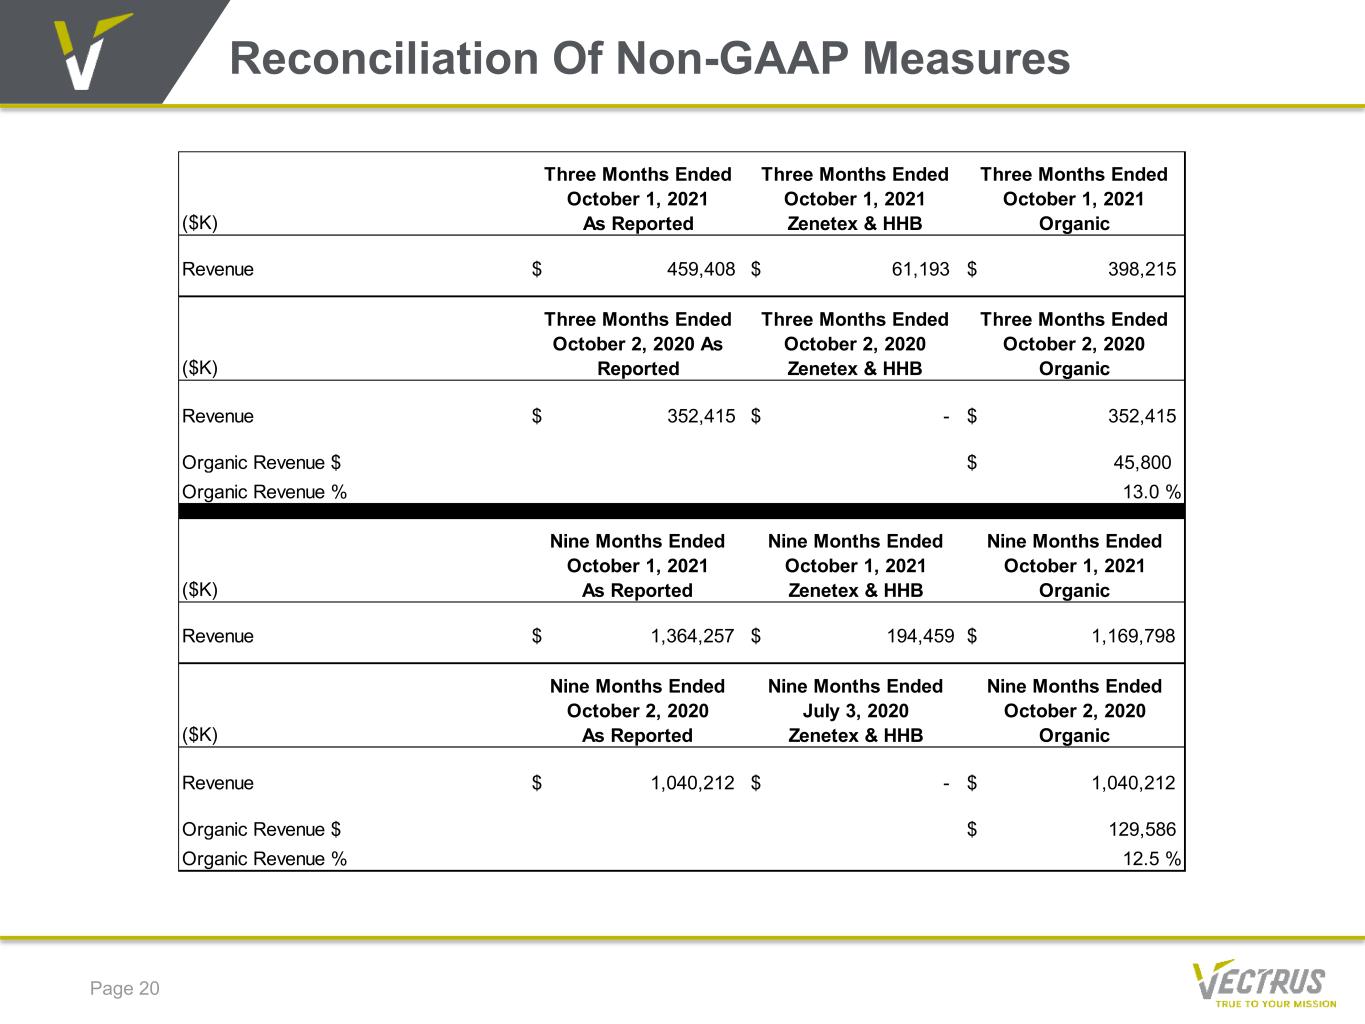
Reconciliation Of Non-GAAP Measures Page 20 ($K) Three Months Ended October 1, 2021 As Reported Three Months Ended October 1, 2021 Zenetex & HHB Three Months Ended October 1, 2021 Organic Revenue $ 459,408 $ 61,193 $ 398,215 ($K) Three Months Ended October 2, 2020 As Reported Three Months Ended October 2, 2020 Zenetex & HHB Three Months Ended October 2, 2020 Organic Revenue $ 352,415 $ - $ 352,415 Organic Revenue $ $ 45,800 Organic Revenue % 13.0 % ($K) Nine Months Ended October 1, 2021 As Reported Nine Months Ended October 1, 2021 Zenetex & HHB Nine Months Ended October 1, 2021 Organic Revenue $ 1,364,257 $ 194,459 $ 1,169,798 ($K) Nine Months Ended October 2, 2020 As Reported Nine Months Ended July 3, 2020 Zenetex & HHB Nine Months Ended October 2, 2020 Organic Revenue $ 1,040,212 $ - $ 1,040,212 Organic Revenue $ $ 129,586 Organic Revenue % 12.5 %