
WEX 8-K
WEX Inc. (WEX)
8-K
2025-02-05
For: 2025-02-05
View Original
Added on
April 08, 2026
UNITED STATES
SECURITIES AND EXCHANGE COMMISSION
Washington, D.C. 20549
FORM 8-K
CURRENT REPORT
Pursuant to Section 13 or 15(d) of the Securities Exchange Act of 1934
Date of Report (Date of earliest event reported) | |||||

(Exact name of registrant as specified in its charter) | ||
(State or other jurisdiction of incorporation) | (Commission File Number) | (IRS Employer Identification No.) | ||||||||||||
| , | , | ||||||||||||||||||||||
Address of principal executive offices | Zip Code | ||||||||||||||||||||||
Registrant's telephone number, including area code | ||||||||||||||
(Former name or former address if changes since last report) | ||
Check the appropriate box below if the Form 8-K filing is intended to simultaneously satisfy the filing obligation of the registrant under any of the following provisions:
Securities registered pursuant to Section 12(b) of the Act:
| Title of each class | Trading Symbol(s) | Name of each exchange on which registered | ||||||
Indicate by check mark whether the registrant is an emerging growth company as defined in Rule 405 of the Securities Act of 1933 (§230.405 of this chapter) or Rule 12b-2 of the Securities Exchange Act of 1934 (§240.12b-2 of this chapter).
Emerging growth company ☐
If an emerging growth company, indicate by check mark if the registrant has elected not to use the extended transition period for complying with any new or revised financial accounting standards provided pursuant to Section 13(a) of the Exchange Act. ☐
Item 2.02 Results of Operations and Financial Condition.
On February 5, 2025, WEX Inc. (the “Company”) issued a news release announcing its fourth-quarter and full year 2024 results and posted its earnings supplement to the investor section of the Company’s website at www.wexinc.com. A copy of the release and supplement are attached as Exhibits 99.1 and 99.2 and are incorporated by reference herein in their entirety.
The information in this item, including Exhibits 99.1 and 99.2, is being furnished, not filed. Accordingly, the information in this item will not be incorporated by reference into any registration statement filed by the Company under the Securities Act of 1933, as amended, unless specifically identified as being incorporated into it by reference.
Item 9.01 Financial Statements and Exhibits.
(c) See attached Exhibit Index.
EXHIBIT INDEX
Exhibit No. | Description | |||||||
99.1 | ||||||||
99.2 | ||||||||
104 | Cover Page Interactive Data File (embedded within the Inline XBRL document) | |||||||
SIGNATURE
Pursuant to the requirements of the Securities Exchange Act of 1934 the registrant has duly caused this report to be signed on its behalf by the undersigned hereunto duly authorized.
WEX INC. | ||||||||
Date: February 5, 2025 | By: | /s/ Jagtar Narula | ||||||
Jagtar Narula | ||||||||
Chief Financial Officer | ||||||||
Exhibit 99.1
WEX Inc. Reports Fourth Quarter and Full Year 2024 Financial Results
Q4 revenue decreased 4% year-over-year to $637 million; full year revenue increased 3% to $2.63 billion
Q4 GAAP net income was $1.60 per diluted share; Q4 adjusted net income was $3.57 per diluted share
Q4 GAAP operating income margin of 24.7%; Q4 adjusted operating income margin of 37.9%
PORTLAND, Maine - February 5, 2025 - WEX (NYSE: WEX), the global commerce platform that simplifies the business of running a business, today reported financial results for the three months and year ended December 31, 2024.
"As we enter 2025, we believe that our targeted investments in product innovation and sales expansion will set the stage for WEX's long-term success," said Melissa Smith, WEX's Chair, Chief Executive Officer, and President. "We anticipate that these initiatives will enhance our competitive edge and ultimately accelerate growth. This will position WEX to deliver exceptional value to our shareholders."
Fourth Quarter and Full Year 2024 Financial Results
Revenue for the fourth quarter of 2024 decreased 4% to $636.5 million from $663.3 million for the fourth quarter of 2023. The $26.8 million decrease in revenue in the quarter includes a net $26.6 million unfavorable impact from fuel prices and spreads and a $1.3 million unfavorable impact from foreign exchange rates.
On a GAAP basis, net income attributable to shareholders for the fourth quarter of 2024 was $63.9 million, or $1.60 per diluted share, compared to a net income attributable to shareholders of $84.9 million, or $1.98 per diluted share, for the same period a year ago. The Company's adjusted net income attributable to shareholders, was $142.9 million for the fourth quarter of 2024, or $3.57 per diluted share, down 7% from $163.9 million, or $3.82 per diluted share, for the same period last year. GAAP operating income margin was 24.7% in the fourth quarter of 2024 compared to 25.1% for the prior year comparable period. Adjusted operating income margin was 37.9% in the fourth quarter of 2024 compared to 39.6% for the prior year comparable period.
For the full year 2024, revenue increased 3% to $2.63 billion from $2.55 billion in 2023. The $80 million increase in revenue includes a net $74 million unfavorable impact from fuel prices and spreads and a $1 million favorable impact from foreign exchange rates. Net income attributable to shareholders on a GAAP basis was $7.50 per diluted share in 2024 compared to $6.16 per diluted share in 2023. On a non-GAAP basis, adjusted net income per diluted share increased 3% to $15.28 from $14.81 in 2023.
See Exhibit 1 for a full explanation and reconciliation of adjusted net income attributable to shareholders, adjusted net income attributable to shareholders per diluted share, total segment adjusted operating income, and adjusted operating income to the most comparable GAAP financial measures on a quarterly and full year basis. See Exhibit 5 for information on the calculation of adjusted operating income margin.
Fourth Quarter 2024 Performance Metrics and Highlights
•Total volume across all segments decreased 6% year-over-year to $53 billion.
•Mobility segment payment processing transactions were flat to last year at 138.5 million.
•Average number of vehicles serviced was approximately 19.8 million, an increase of 3% from the fourth quarter of 2023. We expect that this will be the last quarter of providing this information.
•Benefits' average number of Software-as-a-Service (SaaS) accounts grew 2% to 20.4 million from 19.9 million for the fourth quarter of 2023.
•Average HSA custodial cash assets in Q4 2024 were $4.4 billion compared to $3.9 billion a year ago.
•Corporate Payments' purchase volume decreased 27% to $16.5 billion from $22.8 billion for the fourth quarter of 2023.
•During the fourth quarter of 2024 the Company repurchased 773 thousand shares of its stock for a total cost of approximately $106 million. For the full year, the Company repurchased 3.3 million shares at a total cost of approximately $650 million.
•Cash flow provided by operating activities in 2024 was $481 million. Adjusted free cash flow was $562 million for the same period of time. Please see the reconciliation of this non-GAAP measure to operating cash flow in Exhibit 1.
"The successes we've seen to date on our targeted sales and marketing investments give us confidence to make additional investments to support our growth ambitions," said Jagtar Narula, WEX's Chief Financial Officer. "Our expectation is that these investments will help drive an acceleration in WEX's top-line growth rate over time."
1
Financial Guidance
The Company provides revenue guidance on a GAAP basis and earnings guidance on a non-GAAP basis, due to the uncertainty and the indeterminate amount of certain elements that are included in reported GAAP earnings. Beginning in fiscal year 2024, the Company began utilizing a fixed annual projected long-term non-GAAP tax rate in order to provide better consistency across reporting periods. See “Additional Information” below for more information about the Company’s forward-looking non-GAAP measures.
•For the first quarter of 2025, the Company expects revenue in the range of $625 million to $640 million and adjusted net income in the range of $132 million to $138 million, or $3.35 to $3.50 per diluted share.
•For the full year 2025, the Company expects revenue in the range of $2.60 billion to $2.66 billion and adjusted net income in the range of $571 million to $595 million, or $14.65 to $15.25 per diluted share.
First quarter and full year 2025 guidance is based on a number of assumptions including:
•Assumed average U.S. retail fuel prices of $3.26 and $3.25 per gallon, respectively. The fuel prices referenced above are based on the applicable NYMEX futures price. The full year fuel price assumption reduces 2025 revenue and adjusted EPS by approximately $44 million and $0.68 respectively compared to 2024.
•An adjusted net income effective tax rate of 25.0% for the first quarter and the full year.
•Approximately 39.5 million and 39.0 million fully diluted shares outstanding for the first quarter and the full year respectively.
The Company's adjusted net income guidance, which is a non-GAAP measure, excludes unrealized gains and losses on financial instruments, net foreign currency gains and losses, changes in fair value of contingent consideration, acquisition-related intangible amortization, other acquisition and divestiture related items, stock-based compensation, other costs, impairment charges, debt restructuring and debt issuance cost amortization, adjustments attributable to our non-controlling interests and certain tax related items. We are unable to reconcile our adjusted net income guidance to the comparable GAAP measure without unreasonable effort because of the difficulty in predicting the amounts to be adjusted, including, but not limited to, foreign currency exchange rates, unrealized gains and losses on financial instruments, and acquisition and divestiture related items, which may have a significant impact on our financial results.
Additional Information
Management uses the non-GAAP measures presented within this earnings release to evaluate the Company's performance on a comparable basis. Management believes that investors may find these measures useful for the same purposes, but cautions that they should not be considered a substitute for, or superior to, disclosure in accordance with GAAP.
Beginning in fiscal year 2024, the Company began utilizing a fixed annual projected long-term non-GAAP tax rate in order to provide better consistency across reporting periods. The fixed annual projected long-term non-GAAP tax rate could be subject to change for a variety of reasons, including the rapidly evolving global tax environment, significant changes in our geographic earnings mix including due to acquisition activity, or other changes to our strategy or business operations. The Company will re-evaluate our long-term rate as appropriate.
To provide investors with additional insight into its operational performance, WEX has included in this earnings release in Exhibit 1, reconciliations of non-GAAP measures referenced in this earnings release; in Exhibit 2, tables illustrating the impact of foreign currency rates and fuel prices for each of our reportable segments for the three and twelve months ended December 31, 2024 and 2023; and in Exhibit 3, a table of selected other metrics for the quarter ended December 31, 2024 and the four preceding quarters. The Company is also providing segment revenue for the three and twelve months ended December 31, 2024 and 2023 in Exhibit 4 and information regarding segment adjusted operating income margin and adjusted operating income margin in Exhibit 5.
Conference Call Details and Availability of Supplemental Materials
In conjunction with this announcement, WEX will host a conference call tomorrow, February 6, 2025, at 10:00 a.m. (ET). As previously announced, the conference call will be webcast live on the Internet, and can be accessed at the Investor Relations section of the WEX website, www.wexinc.com. The live conference call also can be accessed by dialing +1 888-596-4144 or +1 646-968-2525. The Conference ID number is 2902800. A replay of the webcast and the accompanying slides will be available on the Company's website. Supplemental materials to assist investors with understanding our results and performance can be reviewed at the Investor Relations section of the WEX website, www.wexinc.com.
About WEX
2
WEX (NYSE: WEX) is the global commerce platform that simplifies the business of running a business. WEX has created a powerful ecosystem that offers seamlessly embedded, personalized solutions for its customers around the world. Through its rich data and specialized expertise in simplifying benefits, reimagining mobility, and paying and getting paid, WEX aims to make it easy for companies to overcome complexity and reach their full potential. For more information, please visit www.wexinc.com.
Forward-Looking Statements
This earnings release contains forward-looking statements including, but not limited to, statements about management’s plans, goals, expectations, and guidance and assumptions with respect to future financial performance of the Company. Any statements in this earnings release that are not statements of historical facts are forward-looking statements. When used in this earnings release, the words “anticipate,” “believe,” “continue,” “could,” “estimate,” “expect,” “intend,” “may,” “plan,” “project,” “will,” “positions,” “confidence,” and similar expressions are intended to identify forward-looking statements, although not all forward-looking statements contain such words. Forward-looking statements relate to our future plans, objectives, expectations, and intentions and are not historical facts and accordingly involve known and unknown risks and uncertainties and other factors that may cause the actual results or performance to be materially different from future results or performance expressed or implied by these forward-looking statements. The following factors, among others, could cause actual results to differ materially from those contained in forward-looking statements made in this earnings release and in oral statements made by our authorized officers:
•the impact of fluctuations in demand for fuel and the volatility and prices of fuel, including fuel spreads in the Company’s international markets, and the resulting impact on the Company’s results, including margins, revenues, and net income;
•the effects of general economic conditions, including a decline in demand for fuel, corporate payment services, travel related services, or healthcare related products and services;
•the failure to comply with the applicable requirements of Mastercard or Visa contracts and rules;
•the extent to which unpredictable events in the locations in which the Company or the Company’s customers operate or elsewhere may adversely affect the Company’s employees, ability to conduct business, results of operations and financial condition;
•the impact and size of credit losses, including fraud losses, and other adverse effects if the Company fails to adequately assess and monitor credit risk or fraudulent use of our payment cards or systems;
•the impact of changes to the Company’s credit standards;
•limitations on, or compression of, interchange fees;
•the effect of adverse financial conditions affecting the banking system;
•the impact of increasing scrutiny with respect to our environmental, social and governance practices;
•failure to implement new technologies and products;
•the failure to realize or sustain the expected benefits from our cost and organizational operational efficiencies initiatives;
•the failure to compete effectively in order to maintain or renew key customer and partner agreements and relationships, or to maintain volumes under such agreements;
•the ability to attract and retain employees;
•the ability to execute the Company’s business expansion and acquisition efforts and realize the benefits of acquisitions we have completed;
•the failure to achieve commercial and financial benefits as a result of our strategic minority equity investments;
•the impact of foreign currency exchange rates on the Company’s operations, revenue and income and other risks associated with our operations outside the United States;
•the failure to adequately safeguard custodial HSA assets;
•the incurrence of impairment charges if the Company’s assessment of the fair value of certain of its reporting units changes;
•the uncertainties of investigations and litigation;
•the ability of the Company to protect its intellectual property and other proprietary rights;
•the impact of regulatory capital requirements and other regulatory requirements on the operations of WEX Bank or its ability to make payments to WEX Inc.;
•the impact of the Company’s debt instruments on the Company’s operations;
•the impact of leverage on the Company’s operations, results or borrowing capacity generally;
•changes in interest rates, including those which we must pay for our deposits, those which we earn on our investment securities, and the resultant potential impacts to our debt securities subject to early call provisions;
•the ability to refinance certain indebtedness or obtain additional financing;
•the actions of regulatory bodies, including tax, banking and securities regulators, or possible changes in tax, banking or financial regulations impacting the Company’s industrial bank, the Company as the corporate parent or other subsidiaries or affiliates;
•the failure to comply with the Treasury Regulations applicable to non-bank custodians;
•the impact from breaches of, or other issues with, the Company’s technology systems or those of its third-party service providers and any resulting negative impact on the Company’s reputation, liabilities or relationships with customers or merchants;
•the impact of regulatory developments with respect to privacy and data protection;
•the impact of any disruption to the technology and electronic communications networks we rely on;
3
•the ability to adopt, implement and use artificial intelligence technologies across our business successfully and ethically;
•the ability to maintain effective systems of internal controls;
•the impact of provisions in our charter documents, Delaware law and applicable banking laws that may delay or prevent our acquisition by a third party; as well as
•other risks and uncertainties identified in Item 1A of our Annual Report on Form 10-K for the year ended December 31, 2023, filed with the Securities and Exchange Commission on February 23, 2024 and subsequent filings with the Securities and Exchange Commission.
The forward-looking statements speak only as of the date of the initial filing of this earnings release and undue reliance should not be placed on these statements. The Company disclaims any obligation to update any forward-looking statements as a result of new information, future events, or otherwise.
4
WEX INC. CONSOLIDATED STATEMENTS OF OPERATIONS
(in millions, except per share data)
(unaudited)
| Three months ended December 31, | Year ended December 31, | ||||||||||||||||||||||
| 2024 | 2023 | 2024 | 2023 | ||||||||||||||||||||
| Revenues | |||||||||||||||||||||||
| Payment processing revenue | $ | 270.2 | $ | 311.8 | $ | 1,200.5 | $ | 1,213.7 | |||||||||||||||
| Account servicing revenue | 174.1 | 171.3 | 690.6 | 646.4 | |||||||||||||||||||
| Finance fee revenue | 79.6 | 80.0 | 298.2 | 314.2 | |||||||||||||||||||
| Other revenue | 112.6 | 100.2 | 438.9 | 373.7 | |||||||||||||||||||
| Total revenues | 636.5 | 663.3 | 2,628.1 | 2,548.0 | |||||||||||||||||||
| Cost of services | |||||||||||||||||||||||
| Processing costs | 158.7 | 169.9 | 647.7 | 621.6 | |||||||||||||||||||
| Service fees | 21.3 | 18.6 | 83.7 | 73.3 | |||||||||||||||||||
| Provision for credit losses | 15.6 | 12.3 | 68.2 | 89.8 | |||||||||||||||||||
| Operating interest | 26.5 | 26.6 | 104.1 | 84.2 | |||||||||||||||||||
| Depreciation and amortization | 35.4 | 28.5 | 134.0 | 104.4 | |||||||||||||||||||
| Total cost of services | 257.6 | 255.9 | 1,037.8 | 973.3 | |||||||||||||||||||
| General and administrative | 94.2 | 116.3 | 375.8 | 428.0 | |||||||||||||||||||
| Sales and marketing | 81.1 | 86.2 | 341.0 | 327.8 | |||||||||||||||||||
| Depreciation and amortization | 46.4 | 46.4 | 187.3 | 171.8 | |||||||||||||||||||
| Operating income | 157.3 | 158.5 | 686.3 | 647.1 | |||||||||||||||||||
| Financing interest expense, net of financial instruments | (57.4) | (62.1) | (235.9) | (204.6) | |||||||||||||||||||
| Net foreign currency gain (loss) | (16.4) | 14.3 | (26.1) | 4.9 | |||||||||||||||||||
| Change in fair value of contingent consideration | (3.0) | (2.3) | (6.5) | (8.5) | |||||||||||||||||||
| Loss on extinguishment of Convertible Notes | — | — | — | (70.1) | |||||||||||||||||||
| Income before income taxes | 80.5 | 108.4 | 417.8 | 368.8 | |||||||||||||||||||
| Income tax provision | 16.6 | 23.5 | 108.2 | 102.2 | |||||||||||||||||||
| Net income | 63.9 | 84.9 | 309.6 | 266.6 | |||||||||||||||||||
| Net income per share: | |||||||||||||||||||||||
| Basic | $ | 1.62 | $ | 2.00 | $ | 7.59 | $ | 6.23 | |||||||||||||||
| Diluted | $ | 1.60 | $ | 1.98 | $ | 7.50 | $ | 6.16 | |||||||||||||||
| Weighted average common shares outstanding: | |||||||||||||||||||||||
| Basic | 39.4 | 42.3 | 40.8 | 42.8 | |||||||||||||||||||
| Diluted | 40.0 | 42.8 | 41.3 | 43.3 | |||||||||||||||||||
5
WEX INC. CONDENSED CONSOLIDATED BALANCE SHEETS
(in millions)
(unaudited)
| December 31, | |||||||||||
| 2024 | 2023 | ||||||||||
| Assets | |||||||||||
| Cash and cash equivalents | $ | 595.8 | $ | 975.8 | |||||||
| Restricted cash | 837.8 | 1,254.2 | |||||||||
| Accounts receivable | 3,008.6 | 3,428.5 | |||||||||
| Investment securities | 3,764.7 | 3,022.1 | |||||||||
| Securitized accounts receivable, restricted | 109.6 | 129.4 | |||||||||
| Prepaid expenses and other current assets | 199.0 | 125.3 | |||||||||
| Total current assets | 8,515.5 | 8,935.3 | |||||||||
| Property, equipment and capitalized software | 261.2 | 242.9 | |||||||||
| Goodwill and other intangible assets | 4,243.3 | 4,474.4 | |||||||||
| Investment securities | 80.5 | 66.8 | |||||||||
| Deferred income taxes, net | 18.3 | 13.7 | |||||||||
| Other assets | 202.8 | 149.0 | |||||||||
| Total assets | $ | 13,321.6 | $ | 13,882.1 | |||||||
| Liabilities and Stockholders’ Equity | |||||||||||
| Accounts payable | $ | 1,090.9 | $ | 1,479.1 | |||||||
| Accrued expenses and other current liabilities | 653.6 | 802.7 | |||||||||
| Restricted cash payable | 837.0 | 1,253.5 | |||||||||
| Short-term deposits | 4,452.7 | 3,942.8 | |||||||||
| Short-term debt, net | 1,293.2 | 1,041.1 | |||||||||
| Total current liabilities | 8,327.3 | 8,519.2 | |||||||||
| Long-term debt, net | 3,082.1 | 2,827.5 | |||||||||
| Long-term deposits | — | 129.8 | |||||||||
| Deferred income taxes, net | 145.6 | 129.5 | |||||||||
| Other liabilities | 277.7 | 455.5 | |||||||||
| Total liabilities | 11,832.8 | 12,061.5 | |||||||||
| Total stockholders’ equity | 1,488.8 | 1,820.6 | |||||||||
| Total liabilities and stockholders’ equity | $ | 13,321.6 | $ | 13,882.1 | |||||||
6
WEX INC. CONDENSED CONSOLIDATED STATEMENTS OF CASH FLOWS
(in millions)
(unaudited)
| Year ended December 31, | |||||||||||
| 2024 | 2023 | ||||||||||
| Net cash provided by operating activities | $ | 481.4 | $ | 907.9 | |||||||
| Cash flows from investing activities | |||||||||||
| Purchases of property, equipment and capitalized software | (147.3) | (143.6) | |||||||||
| Cash proceeds from sale, redemption or distribution of other investments | — | 4.1 | |||||||||
| Purchases of equity securities and other investments | (54.2) | (17.8) | |||||||||
| Purchases of available-for-sale debt securities | (1,259.6) | (1,768.1) | |||||||||
| Sales and maturities of available-for-sale debt securities | 506.4 | 193.6 | |||||||||
| Acquisition of intangible assets | (5.1) | (4.5) | |||||||||
| Acquisitions, net of cash and restricted cash acquired | (0.9) | (402.0) | |||||||||
| Net cash used for investing activities | (960.6) | (2,138.3) | |||||||||
| Cash flows from financing activities | |||||||||||
| Repurchase of share-based awards to satisfy tax withholdings | (32.6) | (18.1) | |||||||||
| Repurchases of common stock | (652.0) | (303.4) | |||||||||
| Proceeds from stock option exercises | 17.1 | 16.1 | |||||||||
| Net change in restricted cash payable | (387.7) | 276.2 | |||||||||
| Net change in deposits | 382.6 | 593.1 | |||||||||
| Payments of deferred and contingent consideration | (93.7) | (52.2) | |||||||||
| Repurchase of Convertible Notes | — | (368.9) | |||||||||
| Net activity on debt1 | 505.9 | 1,430.5 | |||||||||
| Net cash provided by financing activities | (260.3) | 1,573.3 | |||||||||
| Effect of exchange rates on cash, cash equivalents and restricted cash | (53.5) | 27.4 | |||||||||
| Net change in cash, cash equivalents and restricted cash | (793.0) | 370.3 | |||||||||
| Cash, cash equivalents and restricted cash, beginning of year | 2,230.0 | 1,859.7 | |||||||||
| Cash, cash equivalents and restricted cash, end of year | $ | 1,437.0 | $ | 2,230.0 | |||||||
The following table provides a reconciliation of cash, cash equivalents and restricted cash reported within our consolidated balance sheets to amounts within our consolidated statements of cash flows for the years ended December 31, 2024 and 2023:
| December 31, | |||||||||||
| 2024 | 2023 | ||||||||||
| Cash and cash equivalents | $ | 595.8 | $ | 975.8 | |||||||
| Restricted cash | 837.8 | 1,254.2 | |||||||||
| Cash classified as held for sale within prepaid expenses and other current assets | 3.4 | — | |||||||||
| Cash, cash equivalents and restricted cash, end of year | $ | 1,437.0 | $ | 2,230.0 | |||||||
1 Net activity on debt includes: borrowings and repayments on revolving credit facility; borrowings and repayments on term loans; borrowings and repayments on BTFP; advances and repayments with the FHLB; debt issuance costs, and net activity on other short-term debt.
7
Exhibit 1 Reconciliation of Non-GAAP Measures | ||||||||||||||
| (in millions, except per share data) (unaudited) | ||||||||||||||
Reconciliation of GAAP Net Income Attributable to Shareholders to Adjusted Net Income Attributable to Shareholders
| Three Months Ended December 31, | |||||||||||||||||||||||
| 2024 | 2023 | ||||||||||||||||||||||
| per diluted share | per diluted share | ||||||||||||||||||||||
| Net income attributable to shareholders | $ | 63.9 | $ | 1.60 | $ | 84.9 | $ | 1.98 | |||||||||||||||
| Unrealized loss (gain) on financial instruments | 0.8 | 0.02 | 10.3 | 0.24 | |||||||||||||||||||
| Net foreign currency loss (gain) | 16.4 | 0.42 | (14.3) | (0.34) | |||||||||||||||||||
| Change in fair value of contingent consideration | 3.0 | 0.07 | 2.3 | 0.05 | |||||||||||||||||||
| Acquisition-related intangible amortization | 49.9 | 1.25 | 50.4 | 1.18 | |||||||||||||||||||
| Other acquisition and divestiture related items | 2.8 | 0.07 | (1.0) | (0.02) | |||||||||||||||||||
| Stock-based compensation | 22.1 | 0.55 | 37.1 | 0.86 | |||||||||||||||||||
| Other costs | 11.1 | 0.28 | 17.0 | 0.40 | |||||||||||||||||||
| Debt restructuring and debt issuance cost amortization | 3.9 | 0.10 | 5.5 | 0.13 | |||||||||||||||||||
| Tax related items | (31.1) | (0.78) | (28.4) | (0.66) | |||||||||||||||||||
| Adjusted net income attributable to shareholders | $ | 142.9 | $ | 3.57 | $ | 163.9 | $ | 3.82 | |||||||||||||||
| Year Ended December 31, | |||||||||||||||||||||||
| 2024 | 2023 | ||||||||||||||||||||||
| per diluted share | per diluted share | ||||||||||||||||||||||
| Net income attributable to shareholders | $ | 309.6 | $ | 7.50 | $ | 266.6 | $ | 6.16 | |||||||||||||||
| Unrealized loss (gain) on financial instruments | 0.2 | 0.01 | 30.4 | 0.70 | |||||||||||||||||||
| Net foreign currency loss (gain) | 26.1 | 0.63 | (4.9) | (0.11) | |||||||||||||||||||
| Change in fair value of contingent consideration | 6.5 | 0.16 | 8.5 | 0.20 | |||||||||||||||||||
| Acquisition-related intangible amortization | 201.8 | 4.89 | 184.0 | 4.25 | |||||||||||||||||||
| Other acquisition and divestiture related items | 12.1 | 0.29 | 6.6 | 0.15 | |||||||||||||||||||
| Stock-based compensation | 111.9 | 2.71 | 131.6 | 3.04 | |||||||||||||||||||
| Other costs | 48.9 | 1.19 | 45.6 | 1.05 | |||||||||||||||||||
| Debt restructuring and debt issuance cost amortization | 15.9 | 0.39 | 89.4 | 2.06 | |||||||||||||||||||
| Tax related items | (102.2) | (2.47) | (112.1) | (2.59) | |||||||||||||||||||
Dilutive impact of convertible debt1 | — | — | — | (0.10) | |||||||||||||||||||
| Adjusted net income attributable to shareholders | $ | 631.0 | $ | 15.28 | $ | 645.8 | $ | 14.81 | |||||||||||||||
1 The dilutive impact of the Convertible Notes has been calculated under the ‘if-converted’ method for the periods through which they were outstanding. During August 2023, the Company repurchased all of the Company’s outstanding Convertible Notes. Under the ‘if-converted’ method, $9.5 million of interest expense, net of tax, associated with the Convertible Notes (prior to repurchase and cancellation) was added back to adjusted net income for the year ended December 31, 2023 and approximately 0.9 million shares of the Company’s common stock associated with the assumed conversion of the Convertible Notes (prior to repurchase and cancellation) was included in the calculation of adjusted net income per diluted share for the year ended December 31, 2023, as the effect of including such adjustments was dilutive. The total number of shares used in calculating adjusted net income per diluted share for the three and twelve months ended December 31, 2024 was 40.0 million and 41.3 million, respectively.
8
| Reconciliation of GAAP Operating Income to Total Segment Adjusted Operating Income and Adjusted Operating Income | |||||||||||||||||||||||
| Three Months Ended December 31, | Year Ended December 31, | ||||||||||||||||||||||
| 2024 | 2023 | 2024 | 2023 | ||||||||||||||||||||
| Operating income | $ | 157.3 | $ | 158.5 | $ | 686.3 | $ | 647.1 | |||||||||||||||
| Unallocated corporate expenses | 28.3 | 26.2 | 102.1 | 103.0 | |||||||||||||||||||
| Acquisition-related intangible amortization | 49.9 | 50.4 | 201.8 | 184.0 | |||||||||||||||||||
| Other acquisition and divestiture related items | 0.3 | (1.0) | 5.7 | 6.6 | |||||||||||||||||||
| Stock-based compensation | 22.1 | 37.1 | 111.9 | 131.6 | |||||||||||||||||||
| Other costs | 11.9 | 17.5 | 53.9 | 46.1 | |||||||||||||||||||
| Total segment adjusted operating income | $ | 269.8 | $ | 288.7 | $ | 1,161.7 | $ | 1,118.4 | |||||||||||||||
| Unallocated corporate expenses | (28.3) | (26.2) | (102.1) | (103.0) | |||||||||||||||||||
| Adjusted operating income | $ | 241.5 | $ | 262.5 | $ | 1,059.7 | $ | 1,015.4 | |||||||||||||||
The Company's non-GAAP adjusted operating income excludes acquisition-related intangible amortization, other acquisition and divestiture related items, debt restructuring costs, stock-based compensation, other costs and certain non-recurring or non-cash operating charges that are not core to our operations, as applicable depending on the period presented. Total segment adjusted operating income incorporates these same adjustments and further excludes unallocated corporate expenses.
The Company's non-GAAP adjusted net income, which similarly excludes the impact of all items excluded in adjusted operating income, further excludes unrealized gains and losses on financial instruments, net foreign currency gains and losses, debt issuance cost amortization, tax related items, and certain other non-operating items, as applicable depending on the period presented.
Although adjusted net income, adjusted operating income and total segment adjusted operating income are not calculated in accordance with GAAP, our management team believes these non-GAAP measures are integral to our reporting and planning processes and uses them to assess operating performance because they generally exclude financial results that are outside the normal course of our business operations or management’s control. These measures are also used to allocate resources among our operating segments and for internal budgeting and forecasting purposes for both short- and long-term operating plans. For the periods presented herein, the following items have been excluded in determining one or more non-GAAP measures for the following reasons:
•Exclusion of the non-cash, mark-to-market adjustments on financial instruments, including interest rate swap agreements and investment securities, helps management identify and assess trends in the Company’s underlying business that might otherwise be obscured due to quarterly non-cash earnings fluctuations associated with these financial instruments. Additionally, the non-cash, mark-to-market adjustments on financial instruments are difficult to forecast accurately, making comparisons across historical and future quarters difficult to evaluate;
•Net foreign currency gains and losses primarily result from the remeasurement to functional currency of cash, accounts receivable and accounts payable balances, certain intercompany notes denominated in foreign currencies and any gain or loss on foreign currency hedges relating to these items. The exclusion of these items helps management compare changes in operating results between periods that might otherwise be obscured due to currency fluctuations;
•The change in fair value of contingent consideration, which is related to the acquisition of certain contractual rights to serve as custodian or sub-custodian to HSAs, is dependent upon changes in future interest rate assumptions and has no significant impact on the ongoing operations of the Company. Additionally, the non-cash, mark-to-market adjustments on financial instruments are difficult to forecast accurately, making comparisons across historical and future quarters difficult to evaluate;
•The Company considers certain acquisition-related costs, including certain financing costs, investment banking fees, warranty and indemnity insurance, certain integration-related expenses and amortization of acquired intangibles, as well as gains and losses from divestitures to be unpredictable, dependent on factors that may be outside of our control and unrelated to the continuing operations of the acquired or divested business or the Company. In addition, the size and complexity of an acquisition, which often drives the magnitude of acquisition-related costs, may not be indicative of such future costs. The Company believes that excluding acquisition-related costs and gains or losses on divestitures facilitates the comparison of our financial results to the Company’s historical operating results and to other companies in our industry;
•Stock-based compensation is different from other forms of compensation as it is a non-cash expense. For example, a cash salary generally has a fixed and unvarying cash cost. In contrast, the expense associated with an equity-based award is generally unrelated to the amount of cash ultimately received by the employee, and the cost to the Company is based on a stock-based compensation valuation methodology and underlying assumptions that may vary over time;
•Other costs are not consistently occurring and do not reflect expected future operating expense, nor do they provide insight into the fundamentals of current or past operations of our business. This also includes non-recurring professional service costs, costs related to certain identified initiatives, including restructuring and technology initiatives, to further streamline the business, improve the Company’s efficiency, create synergies and globalize the Company’s operations, all with an objective to improve scale and efficiency and increase profitability going forward.
•Debt restructuring and debt issuance cost amortization, which for the year ended December 31, 2023 includes the loss on extinguishment of Convertible Notes, are unrelated to the continuing operations of the Company. Debt restructuring costs are not consistently occurring and do not reflect expected future operating expense, nor do they provide insight into the fundamentals of current or past operations of our business. In addition, since debt issuance cost amortization is dependent
9
upon the financing method, which can vary widely company to company, we believe that excluding these costs helps to facilitate comparison to historical results as well as to other companies within our industry;
•The adjustments attributable to non-controlling interests, including adjustments to the redemption value of a non-controlling interest, have no significant impact on the ongoing operations of the business;
•The tax related items are the difference between the Company’s GAAP tax provision and a non-GAAP tax provision. Beginning in fiscal year 2024, the Company began utilizing a fixed annual projected long-term non-GAAP tax rate in order to provide better consistency across reporting periods. To determine this long-term projected tax rate, the Company performs a pro forma tax provision based upon the Company’s projected adjusted net income before taxes. The fixed annual projected long-term non-GAAP tax rate could be subject to change in future periods for a variety of reasons, including the rapidly evolving global tax environment, significant changes in our geographic earnings mix including due to acquisition activity, or other changes to our strategy or business operations; and
•The Company does not allocate certain corporate expenses to our operating segments, as these items are centrally controlled and are not directly attributable to any reportable segment.
Adjusted net income, adjusted operating income and total segment adjusted operating income may be useful to investors as a means of evaluating our performance. However, because total segment adjusted operating income and adjusted net income are non-GAAP measures, they should not be considered as a substitute for, or superior to, operating income or net income as determined in accordance with GAAP. Total segment adjusted operating income and adjusted net income as used by WEX may not be comparable to similarly titled measures employed by other companies.
Reconciliation of GAAP Operating Cash Flow to Adjusted Free Cash Flow
Adjusted free cash flow has historically been calculated as cash flows from operating activities adjusted for net purchases of current investment securities, capital expenditures, net Funding Activity, and certain other adjustments. Such calculation has historically been based on the principle that the net activity in accounts receivable, accounts payable, and investment of HSA deposits would be offset by WEX Bank Funding Activity, however, due to the nature of WEX Bank cash balances, they may be increased or decreased for reasons other than matching operating activity. As a result, beginning with the third quarter of 2024, adjusted free cash flow also includes an adjustment to reflect the change in WEX Bank cash balances and the applicable prior periods have similarly been adjusted to conform to the current presentation.
Although non-GAAP adjusted free cash flow is not calculated in accordance with GAAP, WEX believes that adjusted free cash flow is a useful measure for investors to further evaluate our results of operations because (i) adjusted free cash flow indicates the level of cash generated by the operations of the business, which excludes consideration paid on acquisitions, after appropriate reinvestment for recurring investments in property, equipment and capitalized software that are required to operate the business; (ii) net Funding Activity includes fluctuations in deposits and other borrowings primarily used as part of our accounts receivable funding strategy; (iii) purchases of current investment securities are made as a result of deposits gathered operationally; and (iv) WEX Bank cash balances may be increased or decreased for reasons other than matching operating activity. However, because adjusted free cash flow is a non-GAAP measure, it should not be considered as a substitute for, or superior to, operating cash flow as determined in accordance with GAAP. In addition, adjusted free cash flow as used by WEX may not be comparable to similarly titled measures employed by other companies.
The following table reconciles GAAP operating cash flow to adjusted free cash flow for the year ended December 31, 2024 and 2023.
| Year ended December 31, | |||||||||||
| (In millions) | 2024 | 2023 | |||||||||
| Operating cash flow, as reported | $ | 481.4 | $ | 907.9 | |||||||
| Adjustments to cash flows from operating activities: | |||||||||||
| Change in WEX Bank cash balances | 279.1 | (82.4) | |||||||||
| Other2 | 34.0 | (48.5) | |||||||||
| Adjusted for certain investing and financing activities: | |||||||||||
| Net Funding Activity | 652.7 | 1,438.2 | |||||||||
| Less: Purchases of current investment securities, net of sales and maturities | (738.0) | (1,561.0) | |||||||||
| Less: Capital expenditures | (147.3) | (143.6) | |||||||||
| Adjusted free cash flow | $ | 562.0 | $ | 510.6 | |||||||
2 For the years ended December 31, 2024 and 2023, other adjustments includes contingent consideration and deferred consideration paid to sellers in excess of acquisition-date fair value. For the year ended December 31, 2023, other adjustments also includes an adjustment for proceeds received of $50.0 million on the termination of our interest rate swap agreements.
10
Exhibit 2 Impact of Certain Macro Factors on Reported Revenue and Adjusted Net Income Attributable to Shareholders (in millions) (unaudited) | |||||||||||||||||||||||||||||||||||||||||||||||
The tables below show the impact of certain macro factors on reported revenue:
| Segment Revenue Results | |||||||||||||||||||||||||||||||||||||||||||||||
| Mobility | Corporate Payments | Benefits | Total WEX Inc. | ||||||||||||||||||||||||||||||||||||||||||||
| Three months ended December 31, | |||||||||||||||||||||||||||||||||||||||||||||||
| 2024 | 2023 | 2024 | 2023 | 2024 | 2023 | 2024 | 2023 | ||||||||||||||||||||||||||||||||||||||||
| Reported revenue | $ | 345.2 | $ | 350.1 | $ | 104.3 | $ | 135.0 | $ | 186.9 | $ | 178.2 | $ | 636.4 | $ | 663.3 | |||||||||||||||||||||||||||||||
| FX impact (favorable) / unfavorable | $ | 0.1 | $ | 1.3 | $ | 1.3 | |||||||||||||||||||||||||||||||||||||||||
| PPG impact (favorable) / unfavorable | $ | 26.6 | $ | 26.6 | |||||||||||||||||||||||||||||||||||||||||||
| Year ended December 31, | |||||||||||||||||||||||||||||||||||||||||||||||
| 2024 | 2023 | 2024 | 2023 | 2024 | 2023 | 2024 | 2023 | ||||||||||||||||||||||||||||||||||||||||
| Reported revenue | $ | 1,400.8 | $ | 1,382.7 | $ | 487.8 | $ | 496.9 | $ | 739.5 | $ | 668.4 | $ | 2,628.1 | $ | 2,548.0 | |||||||||||||||||||||||||||||||
| FX impact (favorable) / unfavorable | $ | 0.1 | $ | (0.9) | $ | (0.8) | |||||||||||||||||||||||||||||||||||||||||
| PPG impact (favorable) / unfavorable | $ | 73.8 | $ | 73.8 | |||||||||||||||||||||||||||||||||||||||||||
To determine the impact of foreign exchange translation (“FX”) on revenue, revenue from entities whose functional currency is not denominated in U.S. dollars, as well as revenue from purchase volume transacted in non-U.S. denominated currencies, were translated using the weighted average exchange rates for the same period in the prior year, exclusive of revenue derived from acquisitions for one year following the acquisition dates.
To determine the impact of price per gallon of fuel (“PPG”) on revenue, revenue subject to changes in fuel prices was calculated based on the average retail price of fuel for the same period in the prior year for the portion of our business that earns revenue based on a percentage of fuel spend, exclusive of revenue derived from acquisitions for two years following the acquisition dates. For the portions of our business that earn revenue based on margin spreads, revenue was calculated utilizing the comparable margin from the prior year.
| Segment Estimated Adjusted Net Income Attributable to Shareholders Impact | |||||||||||||||||||||||||||||||||||
| Mobility | Corporate Payments | Benefits | |||||||||||||||||||||||||||||||||
| Three months ended December 31, | |||||||||||||||||||||||||||||||||||
| 2024 | 2023 | 2024 | 2023 | 2024 | 2023 | ||||||||||||||||||||||||||||||
FX impact (favorable) / unfavorable | $ | (0.6) | $ | — | $ | 0.9 | $ | — | $ | (0.2) | $ | — | |||||||||||||||||||||||
| PPG impact (favorable) / unfavorable | $ | 17.6 | $ | — | $ | — | $ | — | |||||||||||||||||||||||||||
| Year ended December 31, | |||||||||||||||||||||||||||||||||||
| 2024 | 2023 | 2024 | 2023 | 2024 | 2023 | ||||||||||||||||||||||||||||||
FX impact (favorable) / unfavorable | $ | (0.8) | $ | (0.8) | $ | (0.3) | $ | — | |||||||||||||||||||||||||||
| PPG impact (favorable) / unfavorable | $ | 49.0 | $ | — | |||||||||||||||||||||||||||||||
To determine the estimated earnings impact of FX on revenue and expenses from entities whose functional currency is not denominated in U.S. dollars, as well as revenue and variable expenses from purchase volume transacted in non-U.S. denominated currencies, amounts were translated using the weighted average exchange rates for the same period in the prior year, net of tax, exclusive of revenue and expenses derived from acquisitions for one year following the acquisition dates.
To determine the estimated earnings impact of PPG, revenue and certain variable expenses impacted by changes in fuel prices were adjusted based on the average retail price of fuel for the same period in the prior year for the portion of our business that earns revenue based on a percentage of fuel spend, net of applicable taxes, exclusive of revenue and expenses derived from acquisitions for one year following the acquisition dates. For the portions of our business that earn revenue based on margin spreads, revenue was adjusted to the comparable margin from the prior year, net of non-controlling interests and applicable taxes.
11
Exhibit 3 Selected Other Metrics (in millions, except rate statistics) (unaudited) | |||||||||||||||||||||||||||||
Q4 2024 | Q3 2024 | Q2 2024 | Q1 2024 | Q4 2023 | |||||||||||||||||||||||||
| Mobility: | |||||||||||||||||||||||||||||
Payment processing transactions (1) | 138.5 | 146.5 | 144.9 | 136.9 | 138.1 | ||||||||||||||||||||||||
Payment processing gallons of fuel (2) | 3,600.7 | 3,730.5 | 3,694.4 | 3,567.7 | 3,578.6 | ||||||||||||||||||||||||
| Average US fuel price (US$ / gallon) | $ | 3.25 | $ | 3.45 | $ | 3.62 | $ | 3.56 | $ | 3.76 | |||||||||||||||||||
Payment processing $ of fuel (3) | $ | 12,003.4 | $ | 13,227.5 | $ | 13,729.1 | $ | 13,061.0 | $ | 13,814.3 | |||||||||||||||||||
Net payment processing rate (4) | 1.36 | % | 1.38 | % | 1.29 | % | 1.31 | % | 1.26 | % | |||||||||||||||||||
| Payment processing revenue | 163.4 | $ | 183.2 | $ | 177.2 | $ | 170.7 | $ | 174.4 | ||||||||||||||||||||
Net late fee rate (5) | 0.57 | % | 0.45 | % | 0.49 | % | 0.46 | % | 0.50 | % | |||||||||||||||||||
Late fee revenue (6) | $ | 68.4 | $ | 59.0 | $ | 67.3 | $ | 60.4 | $ | 69.0 | |||||||||||||||||||
Corporate Payments: | |||||||||||||||||||||||||||||
Purchase volume (7) | $ | 16,541.3 | $ | 23,394.4 | $ | 25,756.2 | $ | 23,947.9 | $ | 22,800.8 | |||||||||||||||||||
Net interchange rate (8) | 0.52 | % | 0.45 | % | 0.45 | % | 0.43 | % | 0.52 | % | |||||||||||||||||||
| Payment solutions processing revenue | $ | 85.5 | $ | 104.8 | $ | 116.2 | $ | 103.2 | $ | 117.4 | |||||||||||||||||||
Benefits: | |||||||||||||||||||||||||||||
Average number of SaaS accounts (9) | 20.4 | 20.3 | 20.0 | 20.3 | 19.9 | ||||||||||||||||||||||||
Purchase volume (10) | $ | 1,617.1 | $ | 1,645.7 | $ | 1,865.1 | $ | 2,114.7 | $ | 1,510.0 | |||||||||||||||||||
| Average HSA custodial cash assets | 4,366 | 4,315 | 4,231 | 4,209 | 3,925 | ||||||||||||||||||||||||
Definitions and explanations:
(1) Payment processing transactions represents the total number of purchases made by fleets that have a payment processing relationship with WEX.
(2) Payment processing gallons of fuel represents the total number of gallons of fuel purchased by fleets that have a payment processing relationship with WEX.
(3) Payment processing dollars of fuel represents the total dollar value of the fuel purchased by fleets that have a payment processing relationship with WEX.
(4) Net payment processing rate represents the percentage of the dollar value of each payment processing transaction that WEX records as revenue from merchants, less certain discounts given to customers and network fees.
(5) Net late fee rate represents late fee revenue as a percentage of fuel purchased by fleets that have a payment processing relationship with WEX.
(6) Late fee revenue represents fees charged for payments not made within the terms of the customer agreement based upon the outstanding customer receivable balance.
(7) Purchase volume represents the total dollar value of all WEX issued transactions that use WEX corporate card products and virtual card products.
(8) Net interchange rate represents the percentage of the dollar value of each payment processing transaction that WEX records as revenue from merchants, less certain discounts given to customers and network fees.
(9) Average number of SaaS accounts represents the number of active consumer-directed health, COBRA, and billing accounts on our SaaS platforms.
(10) Purchase volume represents the total dollar value of all transactions where interchange is earned by WEX.
12
Exhibit 4 Segment Revenue Information (in millions) (unaudited) | |||||||||||||||||||||||||||||||||||||||||||||||
| Three months ended December 31, | Increase (decrease) | Year ended December 31, | Increase (decrease) | ||||||||||||||||||||||||||||||||||||||||||||
| Mobility | 2024 | 2023 | Amount | Percent | 2024 | 2023 | Amount | Percent | |||||||||||||||||||||||||||||||||||||||
| Payment processing revenue | $ | 163.4 | $ | 174.4 | $ | (11.0) | (6) | % | $ | 694.5 | $ | 695.0 | $ | (0.4) | — | % | |||||||||||||||||||||||||||||||
| Account servicing revenue | 50.1 | 45.0 | 5.1 | 11 | % | 195.3 | 168.6 | 26.7 | 16 | % | |||||||||||||||||||||||||||||||||||||
| Finance fee revenue | 79.3 | 79.4 | (0.1) | — | % | 297.2 | 312.9 | (15.8) | (5) | % | |||||||||||||||||||||||||||||||||||||
| Other revenue | 52.4 | 51.3 | 1.1 | 2 | % | 213.8 | 206.2 | 7.6 | 4 | % | |||||||||||||||||||||||||||||||||||||
| Total revenues | $ | 345.2 | $ | 350.1 | $ | (4.9) | (1) | % | $ | 1,400.8 | $ | 1,382.7 | $ | 18.1 | 1 | % | |||||||||||||||||||||||||||||||
| Three months ended December 31, | Increase (decrease) | Year ended December 31, | Increase (decrease) | ||||||||||||||||||||||||||||||||||||||||||||
| Corporate Payments | 2024 | 2023 | Amount | Percent | 2024 | 2023 | Amount | Percent | |||||||||||||||||||||||||||||||||||||||
| Payment processing revenue | $ | 85.5 | $ | 117.4 | $ | (31.9) | (27) | % | $ | 409.7 | $ | 428.0 | $ | (18.3) | (4) | % | |||||||||||||||||||||||||||||||
| Account servicing revenue | 14.4 | 10.4 | 4.0 | 38 | % | 50.2 | 42.1 | 8.1 | 19 | % | |||||||||||||||||||||||||||||||||||||
| Finance fee revenue | 0.3 | 0.5 | (0.2) | (35) | % | 0.7 | 1.0 | (0.3) | (27) | % | |||||||||||||||||||||||||||||||||||||
| Other revenue | 4.1 | 6.7 | (2.6) | (39) | % | 27.2 | 25.8 | 1.3 | 5 | % | |||||||||||||||||||||||||||||||||||||
| Total revenues | $ | 104.3 | $ | 135.0 | $ | (30.7) | (23) | % | $ | 487.8 | $ | 496.9 | $ | (9.1) | (2) | % | |||||||||||||||||||||||||||||||
| Three months ended December 31, | Increase (decrease) | Year ended December 31, | Increase (decrease) | ||||||||||||||||||||||||||||||||||||||||||||
| Benefits | 2024 | 2023 | Amount | Percent | 2024 | 2023 | Amount | Percent | |||||||||||||||||||||||||||||||||||||||
| Payment processing revenue | $ | 21.2 | $ | 20.0 | $ | 1.2 | 6 | % | $ | 96.2 | $ | 90.7 | $ | 5.5 | 6 | % | |||||||||||||||||||||||||||||||
| Account servicing revenue | 109.7 | 115.9 | (6.2) | (5) | % | 445.2 | 435.7 | 9.4 | 2 | % | |||||||||||||||||||||||||||||||||||||
| Finance fee revenue | — | 0.1 | (0.1) | NM | 0.3 | 0.3 | — | NM | |||||||||||||||||||||||||||||||||||||||
| Other revenue | 56.1 | 42.2 | 13.9 | 33 | % | 197.9 | 141.7 | 56.2 | 40 | % | |||||||||||||||||||||||||||||||||||||
| Total revenues | $ | 186.9 | $ | 178.2 | $ | 8.7 | 5 | % | $ | 739.5 | $ | 668.4 | $ | 71.1 | 11 | % | |||||||||||||||||||||||||||||||
NM - Not meaningful
13
Exhibit 5 Segment Adjusted Operating Income and Adjusted Operating Income Margin Information (in millions) (unaudited) | |||||||||||||||||||||||
| Segment Adjusted Operating Income | Segment Adjusted Operating Income Margin(1) | ||||||||||||||||||||||
| Three Months Ended December 31, | Three Months Ended December 31, | ||||||||||||||||||||||
| 2024 | 2023 | 2024 | 2023 | ||||||||||||||||||||
| Mobility | $ | 146.1 | $ | 150.7 | 42.3 | % | 43.0 | % | |||||||||||||||
| Corporate Payments | $ | 45.7 | $ | 78.8 | 43.9 | % | 58.4 | % | |||||||||||||||
| Benefits | $ | 78.0 | $ | 59.2 | 41.7 | % | 33.2 | % | |||||||||||||||
| Total segment adjusted operating income | $ | 269.8 | $ | 288.7 | 42.4 | % | 43.5 | % | |||||||||||||||
| Segment Adjusted Operating Income | Segment Adjusted Operating Income Margin(1) | ||||||||||||||||||||||
| Year Ended December 31, | Year Ended December 31, | ||||||||||||||||||||||
| 2024 | 2023 | 2024 | 2023 | ||||||||||||||||||||
| Mobility | $ | 598.5 | $ | 599.4 | 42.7 | % | 43.3 | % | |||||||||||||||
| Corporate Payments | $ | 256.2 | $ | 277.2 | 52.5 | % | 55.8 | % | |||||||||||||||
| Benefits | $ | 307.0 | $ | 241.8 | 41.5 | % | 36.2 | % | |||||||||||||||
| Total segment adjusted operating income | $ | 1,161.7 | $ | 1,118.4 | 44.2 | % | 43.9 | % | |||||||||||||||
(1) Segment adjusted operating income margin is derived by dividing segment adjusted operating income by the revenue of the corresponding segment (or the entire Company in the case of total segment adjusted operating income). See Exhibit 1 for a reconciliation of GAAP operating income to total segment adjusted operating income.
| Three Months Ended December 31, | Year Ended December 31, | ||||||||||||||||||||||
| 2024 | 2023 | 2024 | 2023 | ||||||||||||||||||||
| Adjusted operating income | $ | 241.5 | $ | 262.5 | $ | 1,059.7 | $ | 1,015.4 | |||||||||||||||
Adjusted operating income margin (1) | 37.9 | % | 39.6 | % | 40.3 | % | 39.9 | % | |||||||||||||||
(1) Adjusted operating income margin is derived by dividing adjusted operating income by total revenue. See Exhibit 1 for a reconciliation of GAAP operating income to adjusted operating income.
News Media Contact:
WEX
Megan Zaroda, 610-379-6211
Investor Contact:
WEX
Steve Elder, 207-523-7769
14
Exhibit 99.2 ____
.
_

Forward-Looking Statements
These earnings supplemental materials contain forward-looking statements including, but not limited to, statements about management’s plans, goals, expectations, and guidance and assumptions with respect to future financial performance o4f the Company. Any statements in these supplemental materials that are not statements of historical facts are forward-looking statements. When used in these supplemental materials, the words “anticipate,” “believe,” “continue,” “could,” “estimate,” “expect,” “intend,” “may,” “plan,” “project,” “will,” “positions,” “confidence,” and similar expressions are intended to identify forward-looking statements, although not all forward-looking statements contain such words. Forward-looking statements relate to our future plans, objectives, expectations, and intentions and are not historical facts and accordingly involve known and unknown risks and uncertainties and other factors that may cause the actual results or performance to be materially different from future results or performance expressed or implied by these forward-looking statements. The following factors, among others, could cause actual results to differ materially from those contained in forward-looking statements made in these supplemental materials and in oral statements made by our authorized officers:
•the impact of fluctuations in demand for fuel and the volatility and prices of fuel, including fuel spreads in the Company’s international markets, and the resulting impact on the Company’s results, including margins, revenues, and net income;
•the effects of general economic conditions, including a decline in demand for fuel, corporate payment services, travel related services, or healthcare related products and services;
•the failure to comply with the applicable requirements of Mastercard or Visa contracts and rules;
•the extent to which unpredictable events in the locations in which the Company or the Company’s customers operate or elsewhere may adversely affect the Company’s employees, ability to conduct business, results of operations and financial condition;
•the impact and size of credit losses, including fraud losses, and other adverse effects if the Company fails to adequately assess and monitor credit risk or fraudulent use of our payment cards or systems;
•the impact of changes to the Company’s credit standards;
•limitations on, or compression of, interchange fees;
•the effect of adverse financial conditions affecting the banking system;
•the impact of increasing scrutiny with respect to our environmental, social and governance practices;
•failure to implement new technologies and products;
•the failure to realize or sustain the expected benefits from our cost and organizational operational efficiencies initiatives;
•the failure to compete effectively in order to maintain or renew key customer and partner agreements and relationships, or to maintain volumes under such agreements;
•the ability to attract and retain employees;
•the ability to execute the Company’s business expansion and acquisition efforts and realize the benefits of acquisitions we have completed;
•the failure to achieve commercial and financial benefits as a result of our strategic minority equity investments;
•the impact of foreign currency exchange rates on the Company’s operations, revenue and income and other risks associated with our operations outside the United States;
•the failure to adequately safeguard custodial HSA assets;
•the incurrence of impairment charges if the Company’s assessment of the fair value of certain of its reporting units changes;
•the uncertainties of investigations and litigation;
•the ability of the Company to protect its intellectual property and other proprietary rights;
•the impact of regulatory capital requirements and other regulatory requirements on the operations of WEX Bank or its ability to make payments to WEX Inc.;
•the impact of the Company’s debt instruments on the Company’s operations;
•the impact of leverage on the Company’s operations, results or borrowing capacity generally;
•changes in interest rates, including those which we must pay for our deposits, those which we earn on our investment securities, and the resultant potential impacts to our debt securities subject to early call provisions;
•the ability to refinance certain indebtedness or obtain additional financing;
2
•the actions of regulatory bodies, including tax, banking and securities regulators, or possible changes in tax, banking or financial regulations impacting the Company’s industrial bank, the Company as the corporate parent or other subsidiaries or affiliates;
•the failure to comply with the Treasury Regulations applicable to non-bank custodians;
•the impact from breaches of, or other issues with, the Company’s technology systems or those of its third-party service providers and any resulting negative impact on the Company’s reputation, liabilities or relationships with customers or merchants;
•the impact of regulatory developments with respect to privacy and data protection;
•the impact of any disruption to the technology and electronic communications networks we rely on;
•the ability to adopt, implement and use artificial intelligence technologies across our business successfully and ethically;
•the ability to maintain effective systems of internal controls;
•the impact of provisions in our charter documents, Delaware law and applicable banking laws that may delay or prevent our acquisition by a third party; as well as
•other risks and uncertainties identified in Item 1A of our Annual Report on Form 10-K for the year ended December 31, 2023, filed with the Securities and Exchange Commission on February 23, 2024 and subsequent filings with the Securities and Exchange Commission.
The forward-looking statements speak only as of the date of the initial filing of these earnings supplemental materials and undue reliance should not be placed on these statements. The Company disclaims any obligation to update any forward-looking statements as a result of new information, future events, or otherwise.
Non-GAAP Information:
For additional important information and disclosure regarding our use of non-GAAP metrics, specifically, adjusted net income, adjusted net income per diluted share, total segment adjusted operating income and margin, and adjusted free cash flow, please see our most recent earnings release issued on February 5, 2025. In addition, see the Appendix to this earnings supplement for an explanation and reconciliation of (i) GAAP operating income to non-GAAP total segment adjusted operating income and adjusted operating income, (ii) GAAP net income to non-GAAP adjusted net income, (iii) GAAP net income per diluted share to non-GAAP adjusted net income per diluted share, and (iv) GAAP operating cash flow to non-GAAP adjusted free cash flow.
Note:
The Company rounds amounts to millions within tables and text (unless otherwise specified), and calculates all percentages and per-share data from underlying whole-dollar amounts. As a result, certain amounts may not foot, crossfoot, or recalculate based on reported numbers due to rounding. Within the tables below, we present the impact of FX and PPG changes on various financial metrics. To determine the estimated earnings impact of FX on revenue and expenses from entities whose functional currency is not denominated in U.S. dollars, as well as revenue and variable expenses from purchase volume transacted in non-U.S. denominated currencies, amounts were translated using the weighted average exchange rates for the same period in the prior year, net of tax, exclusive of revenue and expenses derived from acquisitions for one year following the acquisition dates. To determine the estimated earnings impact of PPG, revenue and certain variable expenses impacted by changes in fuel prices were adjusted based on the average retail price of fuel for the same period in the prior year for the portion of our business that earns revenue based on a percentage of fuel spend, net of applicable taxes, exclusive of revenue and expenses derived from acquisitions for one year following the acquisition dates. For the portions of our business that earn revenue based on margin spreads, revenue was adjusted to the comparable margin from the prior year, net of non-controlling interests and applicable taxes.
3
Financial Results
•Total revenue for Q4 2024 decreased $26.8 million compared to Q4 2023 driven by a net $26.6 million unfavorable impact from fuel prices and spreads and a $1.3 million unfavorable impact from foreign exchange rates.
•While macroeconomic headwinds impacted results, our strategic pricing initiatives, new business, high customer retention, and performance in the Benefits segment helped mitigate these challenges. When adjusted for fuel prices and FX noted above, the underlying revenue growth during the quarter was flat with the prior year while adjusted earnings per share increased 5% on the same basis.
| (Unaudited) | For the three months ended | For the twelve months ended | |||||||||||||||||||||||||||||||||||||||
| (in millions except per share amounts) | 12/31/22 | 3/31/23 | 6/30/23 | 9/30/23 | 12/31/23 | 3/31/24 | 6/30/24 | 9/30/24 | 12/31/24 | 12/31/22 | 12/31/23 | 12/31/24 | |||||||||||||||||||||||||||||
| Revenues | $ | 618.6 | $ | 612.0 | $ | 621.4 | $ | 651.4 | $ | 663.3 | $ | 652.7 | $ | 673.5 | $ | 665.5 | $ | 636.5 | $ | 2,350.5 | $ | 2,548.0 | $ | 2,628.1 | |||||||||||||||||
| Y/Y Change | 24.3 | % | 18.3 | % | 3.9 | % | 5.7 | % | 7.2 | % | 6.7 | % | 8.4 | % | 2.2 | % | (4.0) | % | 27.0 | % | 8.4 | % | 3.1 | % | |||||||||||||||||
| FX Impact vs Prior Year1 | $ | 8.7 | $ | 4.3 | $ | (0.3) | $ | (5.3) | $ | (0.3) | $ | (0.7) | $ | 0.8 | $ | (2.2) | $ | 1.3 | $ | 31.6 | $ | (1.7) | $ | (0.8) | |||||||||||||||||
PPG Impact vs Prior Year1 | $ | (34.2) | $ | (1.3) | $ | 53.0 | $ | 31.9 | $ | 24.9 | $ | 20.5 | $ | 5.4 | $ | 21.2 | $ | 26.6 | $ | (195.2) | $ | 108.4 | $ | 73.8 | |||||||||||||||||
| PPG and FX % Impact on Revenue vs Prior Year | 5.1 | % | (0.6) | % | (8.8) | % | (4.3) | % | (4.0) | % | (3.2) | % | (1.0) | % | (2.9) | % | (4.2) | % | 8.8 | % | (4.5) | % | (2.9) | % | |||||||||||||||||
GAAP Income per Diluted Share2 | $ | 2.02 | $ | 1.56 | $ | 2.20 | $ | 0.42 | $ | 1.98 | $ | 1.55 | $ | 1.83 | $ | 2.52 | $ | 1.60 | $ | 4.50 | $ | 6.16 | $ | 7.50 | |||||||||||||||||
| Y/Y Change3 | NM | (42.4) | % | NM | NM | (2.0) | % | (0.6) | % | (16.8) | % | NM | (19.2) | % | NM | 36.9 | % | 21.8 | % | ||||||||||||||||||||||
ANI per Diluted Share2 | $ | 3.44 | $ | 3.31 | $ | 3.63 | $ | 4.05 | $ | 3.82 | $ | 3.46 | $ | 3.91 | $ | 4.35 | $ | 3.57 | $ | 13.53 | $ | 14.81 | $ | 15.28 | |||||||||||||||||
| Y/Y Change | 33.3 | % | (5.7) | % | (2.2) | % | 15.4 | % | 11.0 | % | 4.5 | % | 7.7 | % | 7.4 | % | (6.5) | % | 48.0 | % | 9.5 | % | 3.2 | % | |||||||||||||||||
FX Impact per Share vs Prior Year1 | $ | 0.07 | $ | 0.04 | $ | (0.02) | $ | (0.06) | $ | 0.04 | $ | — | $ | — | $ | (0.05) | $ | 0.01 | $ | 0.40 | $ | — | $ | (0.04) | |||||||||||||||||
PPG Impact per Share vs Prior Year1 | $ | (0.50) | $ | (0.03) | $ | 0.77 | $ | 0.49 | $ | 0.39 | $ | 0.33 | $ | 0.09 | $ | 0.33 | $ | 0.44 | $ | (2.77) | $ | 1.62 | $ | 1.19 | |||||||||||||||||
| PPG and FX % Impact on Adjusted Earnings Per Share vs Prior Year | 16.7 | % | (0.2) | % | (20.4) | % | (12.3) | % | (12.5) | % | (10.0) | % | (2.5) | % | (6.9) | % | (11.8) | % | 26.0 | % | (12.0) | % | (7.8) | % | |||||||||||||||||
(1) Favorable impacts are shown in these tables as negatives, while unfavorable impacts are shown as positive figures.
(2) Diluted earnings per share includes the impact of convertible securities under the “if-converted” method if the effect of such securities would be dilutive and includes the assumed exercise of dilutive options, the assumed issuance of unvested RSUs, performance-based awards for which the performance condition has been met as of the date of determination, and contingently issuable shares that would be issuable if the end of the reporting period was the end of the contingency period, using the treasury stock method unless the effect is anti-dilutive. On August 11, 2023, the Company repurchased all of the outstanding Convertible Notes.
(3) Due to the relative volatility in our GAAP net income per share, many of the changes are not meaningful to the reader and have been marked "NM".
4
The following table summarizes our financial results by segment for the most recent quarter and last twelve-month period.
| (Unaudited) | For the three months ended 12/31/24 | For the twelve months ended 12/31/24 | |||||||||||||||||||||||||||
| Mobility | Benefits | Corporate Payments | Total | Mobility | Benefits | Corporate Payments | Total | ||||||||||||||||||||||
| Revenues | $ | 345.2 | $ | 186.9 | $ | 104.3 | $ | 636.5 | $ | 1,400.8 | $ | 739.5 | $ | 487.8 | $ | 2,628.1 | |||||||||||||
| Segment Revenue % of Total | 54 | % | 29 | % | 16 | % | 53 | % | 28 | % | 19 | % | |||||||||||||||||
| GAAP Operating Income | $ | 114.1 | $ | 48.8 | $ | 35.4 | $ | 157.3 | $ | 469.1 | $ | 173.3 | $ | 203.5 | $ | 686.3 | |||||||||||||
| GAAP Operating Income Margin | 33.1 | % | 26.1 | % | 33.9 | % | 24.7 | % | 33.5 | % | 23.4 | % | 41.7 | % | 26.1 | % | |||||||||||||
| Adjusted Operating Income | $ | 146.1 | $ | 78.0 | $ | 45.7 | $ | 241.5 | $ | 598.5 | $ | 307.0 | $ | 256.2 | $ | 1,059.7 | |||||||||||||
| Adjusted Operating Income Margin | 42.3 | % | 41.7 | % | 43.9 | % | 37.9 | % | 42.7 | % | 41.5 | % | 52.5 | % | 40.3 | % | |||||||||||||
5
 | Mobility Segment | ||||
Within our Mobility segment, operating through North American, Over-the-Road, and International business units, WEX is a leader in fleet payment solutions, transaction processing, and information management. We serve diverse fleet needs globally, from Over-the-Road to locally operated fleets. Our proprietary closed-loop payments network in the U.S. covers more than 90% of fuel and 80% of EV charging locations. Our differentiated network offers enhanced data capture, custom controls, and tailored economics between fleets and merchants, creating customer value. Beyond fuel cards, our portfolio includes SaaS solutions for field service management, telematics, reporting and analytics, cash flow management, and mixed-energy fleets. Powered by payment intelligence and workflow optimization, these solutions deliver transformative value to operators, fleet managers, and business managers. Our solutions simplify our customers' businesses by optimizing costs, streamlining operations, and improving driver and fleet manager satisfaction while advancing sustainability and driving business growth.
Revenue in this segment is derived primarily from payment processing, based on transaction volume or fixed fees, as well as account servicing fees, finance charges, and other ancillary services.
•Mobility segment revenue for the quarter decreased 1.4% compared to the same period a year ago, including a 7.6% drag from lower fuel prices. The Q4 average domestic fuel price was 3 cents lower than our fourth quarter guidance, reducing revenue by approximately $1.8 million relative to guidance. Compared to the same period in 2023, the $0.51 decline in fuel prices reduced revenue approximately $27 million, which also includes a small impact from European fuel prices spreads.
•Payment processing transactions were up marginally in Q4 2024 compared to Q4 2023. Local fleets in North America were up 0.6% and Over-the-Road truck fleets were up 0.7%.
•Same-store sales4 have improved sequentially. Local fleets in North America were down 2.8% compared to last year, which is an improvement compared to a decline of 3.6% in Q3 2024, while Over-the-Road truck fleets were down less than 1%, which is also an improvement compared to Q3 2024. Our performance here was in line with our expectations and our new sales and retention rates remain strong.
•The net interchange rate in the Mobility segment reached 1.36%, up 10 basis points from the same quarter of 2023. This improvement reflects higher rates earned through merchant contract renewals at favorable terms and lower fuel prices which increased the rate and offset the impact of lower interest rates.
•GAAP operating income margin for the segment was 33.1%. The Mobility segment's adjusted operating income margin for the quarter was 42.3%, which is down 0.7% compared to last year. This decline was primarily driven by the impact of lower fuel prices. The control we have over our proprietary closed-loop network allows us to focus heavily on managing the costs within this segment—including processing costs, credit losses, and general expenses. These efforts have helped mitigate the impacts of softer fuel prices and we believe our consistent segment adjusted operating income margin despite macroeconomic headwinds to be reflective of our successes.
•The net late fee rate increased by 7 basis points year-over-year, while finance fee revenue was flat at $79.3 million. The increase in the net late fee rate was due primarily to pricing changes implemented during the year and was offset by an 8% decline in the number of late fee instances charged as well as the declines in fuel prices, leading to flat revenue as compared to the prior year.
•Credit losses increased by $5 million versus the same period last year, coming in at 11 basis points of spend volume, which was below our guidance range of 14-19 basis points and compares to 8 basis points last year. We remain very pleased with our efforts to minimize credit losses.
(4) Same-store sales for the Mobility segment is measured by looking at the customer base who has been with the company for at least two years and comparing how many gallons of fuel were purchased in the period adjusted for the number of business days in the period.
6
The following table reflects segment results and select other metrics within Mobility. All amounts are in millions, except for per transaction and per gallon data:
| (Unaudited) | For the three months ended | For the twelve months ended | |||||||||||||||||||||||||||||||||||||||
| 12/31/22 | 3/31/23 | 6/30/23 | 9/30/23 | 12/31/23 | 3/31/24 | 6/30/24 | 9/30/24 | 12/31/24 | 12/31/22 | 12/31/23 | 12/31/24 | ||||||||||||||||||||||||||||||
| Revenues | |||||||||||||||||||||||||||||||||||||||||
| Total Revenues | $ | 367.2 | $ | 342.3 | $ | 340.2 | $ | 350.1 | $ | 350.1 | $ | 339.0 | $ | 359.6 | $ | 357.2 | $ | 345.2 | $ | 1,443.7 | $ | 1,382.7 | $ | 1,400.8 | |||||||||||||||||
| Y/Y Change | 19.7 | % | 7.3 | % | (10.3) | % | (7.4) | % | (4.7) | % | (1.0) | % | 5.7 | % | 2.0 | % | (1.4) | % | 29.9 | % | (4.2) | % | 1.3 | % | |||||||||||||||||
| FX Impact5 | $ | 4.6 | $ | 2.5 | $ | 0.8 | $ | (0.6) | $ | (0.9) | $ | 0.1 | $ | 0.4 | $ | (0.5) | $ | 0.1 | $ | 16.8 | $ | 1.7 | $ | — | |||||||||||||||||
PPG Impact5 | $ | (34.2) | $ | (1.3) | $ | 53.0 | $ | 31.9 | $ | 24.9 | $ | 20.5 | $ | 5.4 | $ | 21.2 | $ | 26.6 | $ | (195.2) | $ | 108.4 | $ | 73.8 | |||||||||||||||||
| PPG and FX % Impact on Revenue | 9.6 | % | (0.4) | % | (14.2) | % | (8.3) | % | (6.5) | % | (6.0) | % | (1.7) | % | (5.9) | % | (7.6) | % | 16.1 | % | (7.6) | % | (5.3) | % | |||||||||||||||||
| Operating Income (GAAP) | $ | 133.0 | $ | 111.9 | $ | 118.6 | $ | 125.0 | $ | 117.3 | $ | 99.3 | $ | 119.2 | $ | 136.5 | $ | 114.1 | $ | 426.0 | $ | 472.8 | $ | 469.1 | |||||||||||||||||
| Operating Income (GAAP) Margin | 36.2 | % | 32.7 | % | 34.9 | % | 35.7 | % | 33.5 | % | 29.3 | % | 33.1 | % | 38.2 | % | 33.1 | % | 29.5 | % | 34.2 | % | 33.5 | % | |||||||||||||||||
| Adjusted Operating Income | $ | 165.8 | $ | 138.8 | $ | 150.3 | $ | 159.6 | $ | 150.7 | $ | 131.0 | $ | 154.3 | $ | 167.1 | $ | 146.1 | $ | 693.4 | $ | 599.4 | $ | 598.5 | |||||||||||||||||
| Adjusted Operating Income Margin | 45.2 | % | 40.5 | % | 44.2 | % | 45.6 | % | 43.0 | % | 38.6 | % | 42.9 | % | 46.8 | % | 42.3 | % | 48.0 | % | 43.3 | % | 42.7 | % | |||||||||||||||||
| Select Other Metrics | |||||||||||||||||||||||||||||||||||||||||
| Total Volume | $ | 23,995 | $ | 21,217 | $ | 20,228 | $ | 22,220 | $ | 21,057 | $ | 19,943 | $ | 20,849 | $ | 20,137 | $ | 18,610 | $ | 98,906 | $ | 84,721 | $ | 79,539 | |||||||||||||||||
| Y/Y Change | 32.1 | % | (2.2) | % | (27.3) | % | (12.5) | % | (12.2) | % | (6.0) | % | 3.1 | % | (9.4) | % | (11.6) | % | 52.4 | % | (14.3) | % | (6.1) | % | |||||||||||||||||
| Payment Processing Transactions | 139.2 | 137.5 | 142.4 | 144.6 | 138.1 | 136.9 | 144.9 | 146.5 | 138.5 | 560.2 | 562.6 | 566.8 | |||||||||||||||||||||||||||||
| Y/Y Change | 4.7 | % | 3.7 | % | (0.5) | % | (0.4) | % | (0.8) | % | (0.4) | % | 1.8 | % | 1.3 | % | 0.3 | % | 8.7 | % | 0.4 | % | 0.7 | % | |||||||||||||||||
| Payment Processing $ of Fuel | $ | 15,937 | $ | 14,144 | $ | 13,780 | $ | 14,945 | $ | 13,814 | $ | 13,061 | $ | 13,729 | $ | 13,227 | $ | 12,003 | $ | 66,172 | $ | 56,684 | $ | 52,021 | |||||||||||||||||
| Y/Y Change | 26.5 | % | (1.7) | % | (26.1) | % | (13.1) | % | (13.3) | % | (7.7) | % | (0.4) | % | (11.5) | % | (13.1) | % | 48.1 | % | (14.3) | % | (8.2) | % | |||||||||||||||||
| Average U.S. Fuel Price | $ | 4.34 | $ | 3.86 | $ | 3.68 | $ | 3.97 | $ | 3.76 | $ | 3.56 | $ | 3.62 | $ | 3.45 | $ | 3.25 | $ | 4.46 | $ | 3.82 | $ | 3.47 | |||||||||||||||||
| Y/Y Change | 26.9 | % | (2.3) | % | (26.1) | % | (12.6) | % | (13.4) | % | (7.8) | % | (1.6) | % | (13.1) | % | (13.6) | % | 43.4 | % | (14.3) | % | (9.2) | % | |||||||||||||||||
| Payment Processing Gallons | $ | 3,610 | $ | 3,577 | $ | 3,664 | $ | 3,687 | $ | 3,579 | $ | 3,568 | $ | 3,694 | $ | 3,731 | $ | 3,601 | $ | 14,580 | $ | 14,507 | $ | 14,593 | |||||||||||||||||
| Y/Y Change | 1.1 | % | 0.8 | % | (0.7) | % | (1.1) | % | (0.9) | % | (0.3) | % | 0.8 | % | 1.2 | % | 0.6 | % | 5.2 | % | (0.5) | % | 0.6 | % | |||||||||||||||||
| Payment Processing Revenue | $ | 177.4 | $ | 171.5 | $ | 172.1 | $ | 177.1 | $ | 174.3 | $ | 170.7 | $ | 177.2 | $ | 183.2 | $ | 163.4 | $ | 720.2 | $ | 695.0 | $ | 694.5 | |||||||||||||||||
| Y/Y Change | 21.2 | % | 12.9 | % | (15.0) | % | (6.1) | % | (1.7) | % | (0.5) | % | 3.0 | % | 3.4 | % | (6.3) | % | 40.3 | % | (3.5) | % | (0.1) | % | |||||||||||||||||
| Net Payment Processing Rate | 1.11 | % | 1.21 | % | 1.25 | % | 1.18 | % | 1.26 | % | 1.31 | % | 1.29 | % | 1.38 | % | 1.36 | % | 1.09 | % | 1.23 | % | 1.34 | % | |||||||||||||||||
| Net Late Fee Revenue | $90.0 | $70.2 | $66.3 | $66.4 | $69.0 | $60.4 | $67.3 | $59.0 | $68.4 | $307.1 | $271.8 | $255.1 | |||||||||||||||||||||||||||||
| Y/Y Change | 49.7 | % | 11.2 | % | (6.4) | % | (20.2) | % | (23.3) | % | (14.0) | % | 1.5 | % | (11.1) | % | (0.9) | % | 53.9 | % | (11.5) | % | (6.1) | % | |||||||||||||||||
| Net Late Fee Rate | 0.56 | % | 0.50 | % | 0.48 | % | 0.44 | % | 0.50 | % | 0.46 | % | 0.49 | % | 0.45 | % | 0.57 | % | 0.46 | % | 0.48 | % | 0.49 | % | |||||||||||||||||
| Credit Losses, in Basis Points | 33 | 32 | 15 | 7 | 8 | 15 | 14 | 6 | 11 | 26 | 15 | 12 | |||||||||||||||||||||||||||||
(5) Favorable impacts are shown in these tables as negatives, while unfavorable impacts are shown as positive figures.
7
 | Benefits Segment | ||||
WEX's Benefits segment simplifies employee benefit plan administration through SaaS software integrated with payment solutions. We deliver diverse product offerings including Benefit Administration, Health Savings Accounts, Flexible Spending Accounts, Health Reimbursement Arrangements, COBRA & Direct Billing, and compliance administration. These solutions empower administrators, employers, and participants to make optional benefits decisions. Our platform's flexibility supports multiple plan types and customizable designs, adapting to market changes. Our solutions streamline processes, reduce costs, and empower employees with greater choice and control. WEX combines healthcare expertise with payment intelligence and workflow optimization to deliver secure, customer-centric solutions. This simplifies daily administration, provides personalized tools, and offers proactive support, ultimately driving better business outcomes through healthier, more engaged employees.
Revenue in this segment is derived from per-participant fees, HSA deposit interest, and debit card interchange. Our business experiences annual seasonality, with Q1 peaking for account sign-ups and transactions. WEX Inc. also serves as an IRS-designated non-bank custodian, while WEX Bank provides HSA depository services.
•Benefits revenue saw positive growth versus Q4 2023 with revenue of $186.9 million, a 4.9% increase over the prior year driven by continued strong revenue growth in our HSA business.
•Average SaaS accounts for the fourth quarter increased 2.5% year-over-year to 20.4 million, consistent with Q3. While the loss of certain Medicare Advantage accounts caused approximately a 5% drag on Q4 2024 SaaS account growth, this is the final quarter that this will impact comparisons. We see ongoing strength in our offerings to customers and the core market dynamics of this business.
•Benefits purchase volume increased by 7.1% compared to the prior-year quarter. While our revenues in this space are a relatively small piece of our Benefits business, they have generated a steady interchange rate of 130 to 140 basis points and a strong flow-through to operating income.
•We realized approximately $53.4 million in revenue from the custodial HSA cash deposits that were invested by WEX Bank and from funds held at third-party banks compared to $45.3 million last year. The interest yield earned on these investments remained steady vs Q3 at 4.89% and compares to 4.62% last year.
•GAAP operating income margin for the segment was 26.1%. The Benefits segment adjusted operating income margin was 41.7% compared to 33.2% in 2023. The increase in margin versus last year is driven by the high flow-through of custodial income.
8
The following table reflects segment results and select other metrics within Benefits. All amounts are in millions, except for yields:
| (Unaudited) | For the three months ended | For the twelve months ended | |||||||||||||||||||||||||||||||||||||||
| 12/31/22 | 3/31/23 | 6/30/23 | 9/30/23 | 12/31/23 | 3/31/24 | 6/30/24 | 9/30/24 | 12/31/24 | 12/31/22 | 12/31/23 | 12/31/24 | ||||||||||||||||||||||||||||||
| Revenues | |||||||||||||||||||||||||||||||||||||||||
| Total Revenues | $ | 140.7 | $ | 164.9 | $ | 159.2 | $ | 166.1 | $ | 178.2 | $ | 191.2 | $ | 179.8 | $ | 181.5 | $ | 186.9 | $ | 504.5 | $ | 668.4 | $ | 739.5 | |||||||||||||||||
| Y/Y Change | 28.8 | % | 36.2 | % | 34.2 | % | 33.9 | % | 26.7 | % | 15.9 | % | 12.9 | % | 9.3 | % | 4.9 | % | 21.8 | % | 32.5 | % | 10.6 | % | |||||||||||||||||
| Operating Income (GAAP) | $ | 14.8 | $ | 39.8 | $ | 29.5 | $ | 26.5 | $ | 19.0 | $ | 46.7 | $ | 32.5 | $ | 45.2 | $ | 48.8 | $ | 36.7 | $ | 114.8 | $ | 173.3 | |||||||||||||||||
| Operating Income (GAAP) Margin | 10.5 | % | 24.1 | % | 18.5 | % | 16.0 | % | 10.7 | % | 24.4 | % | 18.1 | % | 24.9 | % | 26.1 | % | 7.3 | % | 17.2 | % | 23.4 | % | |||||||||||||||||
| Adjusted Operating Income | $ | 39.6 | $ | 64.5 | $ | 59.3 | $ | 58.8 | $ | 59.2 | $ | 79.4 | $ | 71.1 | $ | 78.4 | $ | 78.0 | $ | 133.7 | $ | 241.8 | $ | 307.0 | |||||||||||||||||
| Adjusted Operating Income Margin | 28.1 | % | 39.1 | % | 37.2 | % | 35.4 | % | 33.2 | % | 41.5 | % | 39.6 | % | 43.2 | % | 41.7 | % | 26.5 | % | 36.2 | % | 41.5 | % | |||||||||||||||||
| Select Other Metrics | |||||||||||||||||||||||||||||||||||||||||
| Average SaaS Accounts | 18.5 | 20.3 | 19.5 | 19.9 | 19.9 | 20.3 | 20.0 | 20.3 | 20.4 | 18.0 | 19.9 | 20.3 | |||||||||||||||||||||||||||||
| Y/Y Change | 14.3 | % | 13.8 | % | 11.2 | % | 9.2 | % | 7.6 | % | — | % | 2.6 | % | 2.0 | % | 2.5 | % | 11.0 | % | 10.6 | % | 2.0 | % | |||||||||||||||||
| Total volume | 2,598 | 3,502 | 3,236 | 2,880 | 2,823 | 3,840 | 3,496 | 3,129 | 3,135 | 11,205 | 12,442 | 13,600 | |||||||||||||||||||||||||||||
| Y/Y Change | 11.8 | % | 14.3 | % | 11.2 | % | 9.3 | % | 8.7 | % | 9.7 | % | 8.0 | % | 8.6 | % | 11.1 | % | 9.3 | % | 11.0 | % | 9.3 | % | |||||||||||||||||
| Purchase volume | $ | 1,374 | $ | 1,929 | $ | 1,716 | $ | 1,501 | $ | 1,510 | $ | 2,115 | $ | 1,865 | $ | 1,646 | $ | 1,617 | 5,869 | 6,656 | 7,243 | ||||||||||||||||||||
| Y/Y Change | 19.9 | % | 18.3 | % | 13.3 | % | 11.2 | % | 9.9 | % | 9.6 | % | 8.7 | % | 9.7 | % | 7.1 | % | 14.7 | % | 13.4 | % | 8.8 | % | |||||||||||||||||
| Average HSA Custodial Cash Assets | $ | 3,470 | $ | 3,764 | $ | 3,878 | $ | 3,909 | $ | 3,925 | $ | 4,209 | $ | 4,231 | $ | 4,315 | $ | 4,366 | 3,177 | 3,869 | 4,280 | ||||||||||||||||||||
| Y/Y Change | 40.5 | % | 25.5 | % | 24.7 | % | 23.0 | % | 13.1 | % | 11.8 | % | 9.1 | % | 10.4 | % | 11.2 | % | 31.1 | % | 21.8 | % | 10.6 | % | |||||||||||||||||
| Custodial Investment Revenue - in Other Revenue6 | $ | 11.2 | $ | 20.0 | $ | 27.1 | $ | 29.7 | $ | 32.2 | $ | 37.5 | $ | 40.0 | $ | 41.2 | $ | 44.3 | $ | 32.2 | $ | 109.0 | $ | 163.0 | |||||||||||||||||
| Custodial Investment Revenue - in Account Servicing Revenue7 | $ | 14.3 | $ | 17.1 | $ | 14.9 | $ | 14.3 | $ | 13.1 | $ | 13.0 | $ | 11.9 | $ | 12.5 | $ | 9.1 | $ | 28.9 | $ | 59.4 | $ | 46.5 | |||||||||||||||||
| Custodial Investment Revenue - Total | $ | 25.6 | $ | 37.2 | $ | 42.0 | $ | 44.0 | $ | 45.3 | $ | 50.5 | $ | 51.9 | $ | 53.7 | $ | 53.4 | $ | 61.1 | $ | 168.5 | $ | 209.5 | |||||||||||||||||
| Y/Y Change | 215.3 | % | 292.9 | % | 313.9 | % | 177.0 | % | 77.0 | % | 35.8 | % | 23.6 | % | 22.0 | % | 17.9 | % | 212.5 | % | 175.8 | % | 24.3 | % | |||||||||||||||||
| HSA Yield8 | 2.95 | % | 3.95 | % | 4.33 | % | 4.51 | % | 4.62 | % | 4.80 | % | 4.91 | % | 4.98 | % | 4.89 | % | 1.92 | % | 4.36 | % | 4.90 | % | |||||||||||||||||
(6) Represents income earned on available-for-sale securities held and managed by WEX Bank. These amounts are recorded within Other Revenue on our consolidated statement of operations.
(7) Represents income earned for custodial deposits held at third-party banks. These amounts are recorded within Account Servicing Revenue on our consolidated statement of operations.
(8) We calculate HSA yield by dividing Custodial Investment Revenue - Total by Average Custodial Cash Assets.
9
The following chart shows the maturity profile of the investment securities and deposits as of December 31, 2024, held as a result of being a custodian of HSA accounts. The blended portfolio yield shown is the current return earned on the balances maturing each year.
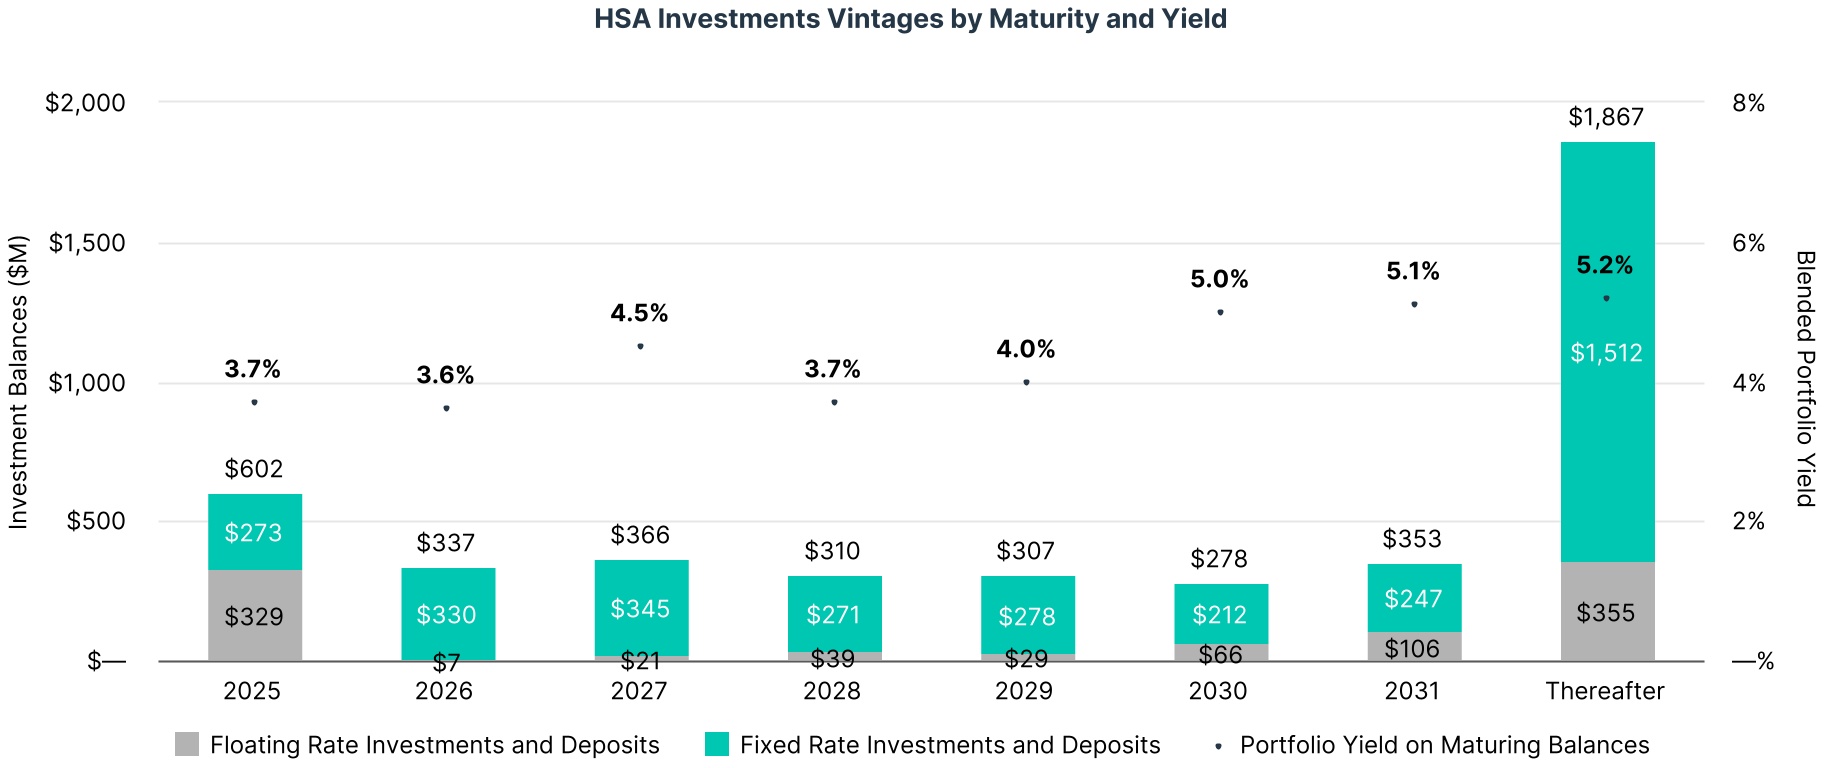
Despite benchmark interest rates that have generally trended downward throughout the year, our portfolio management efforts have maintained relatively consistent custodial investment returns throughout the year. We have substantially grown both the volume of cash assets within our custody as well as the average yield we earn on these assets compared to last year.
10
 | Corporate Payments Segment | ||||
WEX's Corporate Payments segment delivers global B2B payment solutions, powered by payment intelligence and workflow optimization, that enhance security, simplify processes, and drive revenue. Our Direct to Corporate solution automates Accounts Payable (AP) by integrating with ERPs and accounting workflows to maximize virtual payment usage. Our customizable Embedded Payments solution seamlessly integrates virtual payment capabilities into existing workflows, whether payments are core to the business, part of critical operations, or an added customer offering. This versatile solution empowers a broad range of industries, including online travel. We also offer white-label partnerships with financial institutions. Leveraging scale, network incentives, global expertise, and our supplier enablement team, we optimize revenue for our customers.
Revenue in this segment is primarily derived from net interchange, with additional contributions from licensing fees.
•Total segment revenue for the quarter decreased 22.7% to $104.3 million. The revenue decline was driven by two larger customers that had temporary volume reductions in the quarter which were largely in line with expectations. While these volumes can fluctuate from time to time, we continue to have strong relationships with these customers and expect volumes to recover. In addition, revenue was negatively impacted by the change in revenue model for a major OTA customer, which we have discussed previously. Our relationship with this customer is also strong and we expect to lap the impact of this change by Q3 2025. Foreign exchange rates were also unfavorable, reducing revenue by $1.3 million compared to the prior year.
•Purchase volumes issued by WEX declined 27.5% compared to last year. This was largely due to the large customer volume fluctuations and OTA revenue model transition mentioned above.
•The net interchange rate was up 7 basis points sequentially driven primarily by customer volume mix.
•While the Direct component of the segment is currently a small portion of volumes, it is rapidly growing and higher revenue yields lead to a relatively larger revenue impact to the segment. It also provides lower quarterly volume volatility due to our direct interaction with the end customer. Comparing Q4 2024 to Q4 2023, we have grown Direct volumes by more than 25%.
•Because of the strong potential growth opportunity in our Direct business, we intend to invest in new product capabilities and additional sales and marketing resources in 2025.
•GAAP operating income margin for the segment was 33.9%. The adjusted operating income margin in the segment was 43.9%, which is down from 58.4% in the same quarter last year due to lower revenue.
11
The following table reflects segment results and select other metrics within Corporate Payments. All amounts are in millions:
| For the three months ended | For the twelve months ended | ||||||||||||||||||||||||||||||||||||||||
| 12/31/22 | 3/31/23 | 6/30/23 | 9/30/23 | 12/31/23 | 3/31/24 | 6/30/24 | 9/30/24 | 12/31/24 | 12/31/22 | 12/31/23 | 12/31/24 | ||||||||||||||||||||||||||||||
| Revenues | |||||||||||||||||||||||||||||||||||||||||
| Total Revenues | $ | 110.7 | $ | 104.8 | $ | 121.9 | $ | 135.2 | $ | 135.0 | $ | 122.5 | $ | 134.1 | $ | 126.9 | $ | 104.3 | $ | 402.3 | $ | 496.9 | $ | 487.8 | |||||||||||||||||
| Y/Y Change | 35.8 | % | 35.6 | % | 21.4 | % | 18.6 | % | 22.0 | % | 16.9 | % | 10.0 | % | (6.1) | % | (22.7) | % | 23.8 | % | 23.5 | % | (1.8) | % | |||||||||||||||||
| FX Impact9 | $ | 4.1 | $ | 1.8 | $ | (1.1) | $ | (4.7) | $ | 0.6 | $ | (0.9) | $ | 0.5 | $ | (1.7) | $ | 1.3 | $ | 14.8 | $ | (3.3) | $ | (0.9) | |||||||||||||||||
| Operating Income (GAAP) | $ | 39.3 | $ | 36.9 | $ | 51.7 | $ | 69.6 | $ | 60.9 | $ | 51.1 | $ | 61.0 | $ | 56.1 | $ | 35.4 | $ | 133.9 | $ | 219.1 | $ | 203.5 | |||||||||||||||||
| Operating Income (GAAP) Margin | 35.5 | % | 35.2 | % | 42.4 | % | 51.5 | % | 45.1 | % | 41.7 | % | 45.5 | % | 44.2 | % | 33.9 | % | 33.3 | % | 44.1 | % | 41.7 | % | |||||||||||||||||
| Adjusted Operating Income | $ | 53.0 | $ | 49.2 | $ | 66.3 | $ | 82.9 | $ | 78.8 | $ | 64.6 | $ | 74.4 | $ | 71.5 | $ | 45.7 | $ | 192.7 | $ | 277.2 | $ | 256.2 | |||||||||||||||||
| Adjusted Operating Income Margin | 47.9 | % | 46.9 | % | 54.4 | % | 61.3 | % | 58.4 | % | 52.7 | % | 55.5 | % | 56.4 | % | 43.9 | % | 47.9 | % | 55.8 | % | 52.5 | % | |||||||||||||||||
| Select Other Metrics | |||||||||||||||||||||||||||||||||||||||||
| Total Volume | $ | 26,208 | $ | 27,589 | $ | 31,827 | $ | 36,780 | $ | 31,971 | $ | 33,026 | $ | 35,792 | $ | 39,056 | $ | 30,833 | $ | 101,616 | $ | 128,168 | $ | 138,707 | |||||||||||||||||
| Y/Y Change | 32.2 | % | 37.5 | % | 23.2 | % | 24.6 | % | 22.0 | % | 19.7 | % | 12.5 | % | 6.2 | % | (3.6) | % | 43.1 | % | 26.1 | % | 8.2 | % | |||||||||||||||||
| Total Purchase Volume | $ | 17,085 | $ | 18,635 | $ | 22,901 | $ | 27,860 | $ | 22,801 | $ | 23,948 | $ | 25,756 | $ | 23,394 | $ | 16,541 | $ | 66,671 | $ | 92,197 | $ | 89,640 | |||||||||||||||||
| Y/Y Change | 56.5 | % | 57.8 | % | 33.8 | % | 34.9 | % | 33.5 | % | 28.5 | % | 12.5 | % | (16.0) | % | (27.5) | % | 72.9 | % | 38.3 | % | (2.8) | % | |||||||||||||||||
| Net Interchange Rate | 0.58 | % | 0.48 | % | 0.46 | % | 0.42 | % | 0.52 | % | 0.43 | % | 0.45 | % | 0.45 | % | 0.52 | % | 0.53 | % | 0.46 | % | 0.46 | % | |||||||||||||||||
| Payment Solutions Processing Revenue | 98.5 | 90.1 | 104.8 | 115.7 | 117.4 | 103.2 | 116.2 | 104.8 | $ | 85.5 | $ | 353.7 | $ | 428.0 | $ | 409.7 | |||||||||||||||||||||||||
| Y/Y Change | 43.3% | 38.4% | 18.3% | 14.0% | 19.2% | 14.5% | 10.9% | (9.4)% | (27.2)% | 29.0 | % | 21.0 | % | (4.3) | % | ||||||||||||||||||||||||||
(9) Favorable impacts are shown in these tables as negatives, while unfavorable impacts are shown as positive figures.
12
Balance Sheet and Debt
The following table includes a further condensed version of our balance sheet as well as key operating metrics relevant to our balance sheet:
| (in millions, except for leverage ratio) | 12/31/22 | 3/31/23 | 6/30/23 | 9/30/23 | 12/31/23 | 3/31/24 | 6/30/24 | 9/30/24 | 12/31/24 | ||||||||||||||||||||
| Cash and Cash Equivalents | $ | 922 | $ | 922 | $ | 901 | $ | 958 | $ | 976 | $ | 780 | $ | 683 | $ | 535 | $ | 599 | |||||||||||
| Accounts Receivable | 3,276 | 3,400 | 3,622 | 4,054 | 3,429 | 3,857 | 3,966 | 3,770 | 3,023 | ||||||||||||||||||||
| Long-Term Debt, Net | 2,522 | 2,631 | 2,499 | 2,650 | 2,828 | 3,082 | 2,960 | 3,143 | 3,082 | ||||||||||||||||||||
| Corporate Cash | $ | 171 | $ | 149 | $ | 194 | $ | 170 | $ | 172 | $ | 176 | $ | 143 | $ | 123 | $ | 80 | |||||||||||
| Available Liquidity10 | $ | 1,070 | $ | 925 | $ | 1,087 | $ | 1,095 | $ | 903 | $ | 639 | $ | 947 | $ | 729 | $ | 735 | |||||||||||
| Leverage Ratio | 2.5x | 2.5x | 2.8x | 2.4x | 2.5x | 2.6x | 2.5x | 2.6x | 2.6x | ||||||||||||||||||||
| Investment Securities at Cost11 | $ | 1,536 | $ | 2,597 | $ | 2,789 | $ | 2,830 | $ | 3,102 | $ | 3,411 | $ | 3,438 | $ | 3,734 | $ | 3,875 | |||||||||||
We remain in a healthy financial position and ended the year with $735 million of available liquidity that includes our available corporate cash and capacity to borrow under our revolving credit agreement. Our leverage ratio, as defined in the credit agreement, stands at 2.6 times, and remains within our long-term target of 2.5 times to 3.5 times. Our low leverage levels support our ability to continue to invest in the business, return capital to shareholders, and maintain capacity for strategic transactions.
The following table summarizes the Company's long-term debt maturities, excluding our revolver and nominal scheduled principal payments on our term loans:
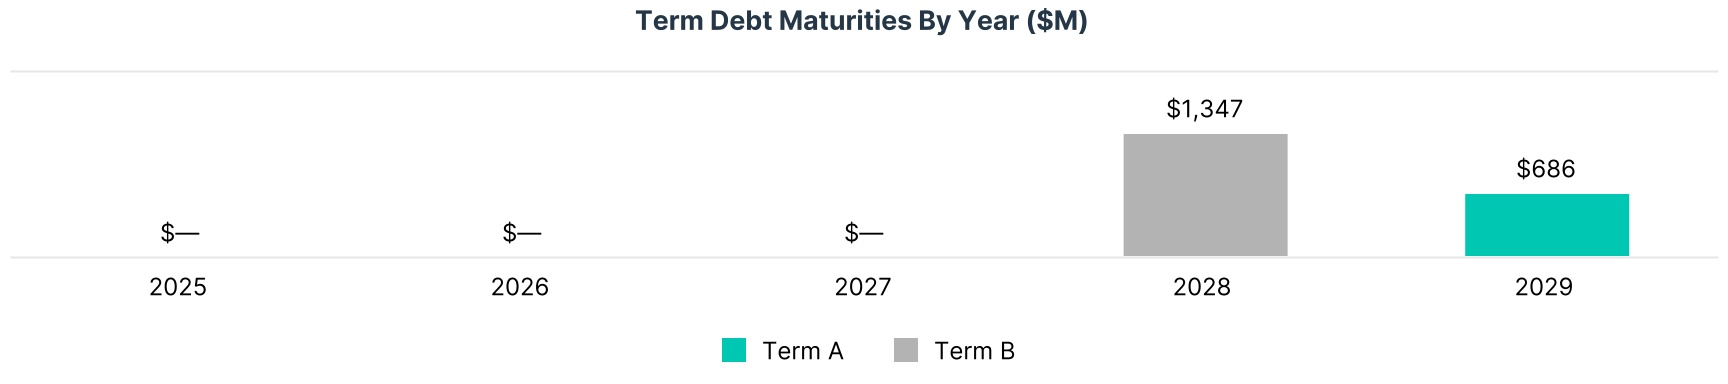
We have maintained ample access to debt markets and strategically review our debt composition and maturity schedule to align with our long-term objectives. We currently have a three-year runway before our next maturity and believe this provides an appropriate cushion to remain opportunistic in the market.
As part of our ongoing efforts to minimize interest expense, we successfully renegotiated a reduction in our Term Loan B spread by 0.25% in Q4 2024, our second reduction since January 2024. Earlier in the year, we refinanced our Term Loan A and revolving credit agreement, extending the term to 2028 and improving our pricing terms. The net effect of refinancing activity in 2024 is expected to reduce interest expense by more than $10 million on an annualized basis; assuming borrowings are consistent with Q4 2024.
(10) Available liquidity includes corporate cash, plus the portion of our revolving credit facility undrawn as of the specific balance sheet date.
(11) Our available for sale debt securities are measured and reported at fair value on the face of the balance sheet. We have additionally included the cost basis of these investments to provide greater clarity on the nature and extent of our investing activities.
13
Cash Flow
The following table presents our operating cash flow and adjusted cash flow metric:
| (Unaudited) | For the three months ended | For the twelve months ended | |||||||||||||||||||||||||||||||||||||||
| (In millions) | 12/31/22 | 3/31/23 | 6/30/23 | 9/30/23 | 12/31/23 | 3/31/24 | 6/30/24 | 9/30/24 | 12/31/24 | 12/31/22 | 12/31/23 | 12/31/24 | |||||||||||||||||||||||||||||
| Operating Cash Flow, as reported | $ | 572.8 | $ | 27.1 | $ | 72.4 | $ | 46.5 | $ | 761.9 | $ | (153.3) | $ | (7.0) | $ | 3.3 | $ | 638.4 | $ | 679.4 | $ | 907.9 | $ | 481.4 | |||||||||||||||||
| Adjustments To Cash Flows From Operating Activities: | |||||||||||||||||||||||||||||||||||||||||
| Changes in WEX Bank Cash Balances | $ | (118.1) | $ | (46.7) | $ | 71.4 | $ | (83.5) | $ | (23.6) | $ | 188.9 | $ | 69.6 | $ | 125.3 | $ | (104.7) | $ | (295.7) | $ | (82.4) | $ | 279.1 | |||||||||||||||||
| Other | $ | — | $ | 1.5 | $ | — | $ | — | $ | (50.0) | $ | 67.1 | $ | — | $ | — | $ | (33.1) | $ | — | $ | (48.5) | $ | 34.0 | |||||||||||||||||
| Adjusted for Certain Investing and Financing Activities: | |||||||||||||||||||||||||||||||||||||||||
| Net Funding Activity | $ | (150.0) | $ | 971.8 | $ | 385.9 | $ | 294.8 | $ | (214.4) | $ | 205.0 | $ | 214.8 | $ | 372.2 | $ | (139.3) | $ | 839.1 | $ | 1,438.2 | $ | 652.7 | |||||||||||||||||
| Less: Purchases of Current Investment Securities, Net of Sales and Maturities | $ | (0.9) | $ | (1,026.8) | $ | (220.8) | $ | (56.6) | $ | (256.8) | $ | (282.9) | $ | (25.6) | $ | (276.3) | $ | (153.2) | $ | (585.8) | $ | (1,561.0) | $ | (738.0) | |||||||||||||||||
| Less: Capital Expenditures | $ | (37.4) | $ | (30.6) | $ | (34.7) | $ | (36.4) | $ | (41.9) | $ | (34.0) | $ | (39.6) | $ | (35.0) | $ | (38.7) | $ | (112.9) | $ | (143.6) | $ | (147.3) | |||||||||||||||||
| Adjusted Free Cash Flow | $ | 266.4 | $ | (103.7) | $ | 274.2 | $ | 164.9 | $ | 175.2 | $ | (9.2) | $ | 212.2 | $ | 189.5 | $ | 169.5 | $ | 524.2 | $ | 510.6 | $ | 562.0 | |||||||||||||||||
| Trailing Twelve Month Adjusted Free Cash Flows | $ | 524.2 | $ | 460.4 | $ | 642.5 | $ | 601.7 | $ | 510.6 | $ | 605.0 | $ | 543.0 | $ | 567.8 | $ | 562.0 | |||||||||||||||||||||||
WEX generates a significant amount of cash each year and we utilize an adjusted free cash flow metric to describe the cash flow we consider available for investment. Using our definition, Q4 2024 adjusted free cash flow was $170 million. For the full year 2024, we generated $562 million converting a substantial portion of our ANI into adjusted free cash flow. We are able to leverage this strong cash flow generation to deliver on our disciplined capital allocation strategy including ongoing investments in our business.
14
Capital Allocation
The following table presents our uses of cash over the preceding quarters:
| For the three months ended | |||||||||||||||||||||||||||||
| (In millions) | 12/31/22 | 3/31/23 | 6/30/23 | 9/30/23 | 12/31/23 | 3/31/24 | 6/30/24 | 9/30/24 | 12/31/24 | ||||||||||||||||||||
| Capital Expenditures | $ | 37.4 | $ | 30.6 | $ | 34.6 | $ | 36.4 | $ | 41.9 | $ | 34.0 | $ | 39.6 | $ | 35.0 | $ | 38.7 | |||||||||||
| Acquisitions12 | $ | — | $ | 31.7 | $ | — | $ | 180.7 | $ | 246.3 | $ | 86.6 | $ | 5.1 | $ | 7.1 | $ | — | |||||||||||
| Share Repurchases | $ | 141.2 | $ | 92.2 | $ | 3.2 | $ | 50.0 | $ | 150.0 | $ | 73.6 | $ | 100.0 | $ | 370.0 | $ | 106.0 | |||||||||||
| Capital Deployed | $ | 178.6 | $ | 154.5 | $ | 37.8 | $ | 267.1 | $ | 438.2 | $ | 194.2 | $ | 144.7 | $ | 412.1 | $ | 144.7 | |||||||||||
WEX strategically allocates capital through a disciplined and rigorous analytical process, prioritizing investments that deliver strong long-term returns. Our primary uses of cash include growth-focused initiatives, such as investments in technology and customer experience, strategic M&A, and returning capital to shareholders via share repurchases. Our CapEx investments are central to strengthening our competitive edge and delivering greater value to our customers.
The following table presents cash spent on share buybacks and ending undiluted shares outstanding for each of the preceding quarters:
| (In millions, except per share amounts) | For the three months ended | ||||||||||||||||||||||||||||||||||
| 6/30/22 | 9/30/22 | 12/31/22 | 3/31/23 | 6/30/23 | 9/30/23 | 12/31/23 | 3/31/24 | 6/30/24 | 9/30/2413 | 12/31/202410 | |||||||||||||||||||||||||
| Cash Spent Repurchasing Shares | $ | 80.6 | $ | 69.0 | $ | 141.2 | $ | 92.2 | $ | 3.2 | $ | 50.0 | $ | 150.0 | $ | 73.6 | $ | 100.0 | $ | 370.0 | $ | 106.0 | |||||||||||||
| Cumulative Cash Spent | $ | 149.6 | $ | 290.8 | $ | 383.0 | $ | 386.1 | $ | 436.1 | $ | 586.2 | $ | 659.8 | $ | 759.8 | $ | 1,129.8 | $ | 1,235.8 | |||||||||||||||
| Share Repurchased | 0.52 | 0.43 | 0.95 | 0.53 | 0.02 | 0.26 | 0.87 | 0.35 | 0.47 | 1.72 | 0.77 | ||||||||||||||||||||||||
| Cumulative Shares Repurchased | 0.95 | 1.90 | 2.43 | 2.45 | 2.71 | 3.58 | 3.93 | 4.39 | 6.12 | 6.89 | |||||||||||||||||||||||||
Share repurchases accounted for the largest share of our capital deployment in 2024, totaling approximately $650 million and underscoring our commitment to returning value to shareholders. To support this commitment, our Board of Directors increased the share repurchase program authorization by $1 billion in September 2024, expanding the total authorization to $2.05 billion from the previous $1.05 billion through December 31, 2025. $964 million remains in our authorization as of the end of Q4 2024. Since our share count was last below 40 million in 2016, we have achieved approximately 200% revenue growth and more than 500% growth in adjusted net income.
(12) This line is presented on a cash basis and includes all consideration transferred in the related quarter, including deferred and contingent payments when they are paid as opposed to when the underlying transaction occurred.
(13) During the third quarter of 2024, we entered into an ASR agreement with JPMorgan to repurchase an aggregate of $300.0 million of the Company’s outstanding common stock. Under the ASR, the Company made a payment of $300.0 million to JPMorgan for which we received an initial delivery of approximately 1.3 million shares of our common stock. For purposes of this table, we have included the full payment amount and the initial delivery of shares in the quarter ended September 30, 2024. During the fourth quarter of 2024, the ASR was settled resulting in the receipt of an additional 0.2 million shares of WEX common stock, which is included in the quarter ended December 31, 2024.
15
Financial Guidance
We are adjusting our long-term organic revenue growth targets from 8-12% to the 5-10% range to reflect updated market insights. In addition, as a result of this change, we are also updating our long-term adjusted earnings per share target to the 10-15% range. We believe these updated long-term ranges consider the current state and trajectory of the markets we operate in while also reflecting our opportunity to remain highly competitive with our product offerings.
The following table presents our expectations for the first quarter and full year 2025:
| Financial Guidance | Q1'25 | Full Year 2025 | |||||||||||||||||||||||||||
| Current Guidance | Current Guidance | Changes from FY2024 at Midpoint | |||||||||||||||||||||||||||
| Low | High | Low | High | $ Change | % Change | Fuel Price Impact | |||||||||||||||||||||||
| Net Revenue, in millions | $ | 625 | $ | 640 | $ | 2,600 | $ | 2,660 | $ | (2) | — | % | (2)% | ||||||||||||||||
| Adjusted Net Income per Diluted Share14 | $ | 3.35 | $ | 3.50 | $ | 14.65 | $ | 15.25 | $ | (0.33) | (2) | % | (4)% | ||||||||||||||||
First quarter and full year 2025 guidance is based on a number of assumptions, including:
| Key Guidance Assumptions | Q1'25 | Full Year 2025 | |||||||||||||||||||||||||||
| Current Guidance | Current Guidance | Change from Prior Year at midpoint | % Change | ||||||||||||||||||||||||||
| Average US Retail Fuel Prices per Gallon | $3.26 | $3.25 | $(0.22) | (6)% | |||||||||||||||||||||||||
| Mobility Credit Losses (bps) | 11 | - | 16 | 12 | - | 17 | 3.1 | 27% | |||||||||||||||||||||
| Diluted Shares Outstanding, in millions | 39.5 | 39.0 | -2.3 | (6)% | |||||||||||||||||||||||||
2025 guidance also includes the following assumptions:
•Mobility segment revenue growth, excluding fuel price changes and FX rate changes, of 1-3% for the year
•Corporate Payments segment revenue growth slightly negative on a full-year basis due to OTA customer transition; accelerating growth over the second half of the year as we lap year-over-year comparisons
•Benefits segment revenue growth within the low end of the total company stated long-term range
•U.S. GDP growth of approximately 2% in 2025
•No benefits from future M&A activity
•Domestic fuel prices estimated at $3.26 per gallon for Q1 and $3.25 for the full year, based on NYMEX futures curve; this assumption reduced 2025 revenue and EPS guidance by approximately $44.0 million and $0.68, respectively
•Interest rates in line with the market Fed Funds projections
•Exchange rates are as of the end of January 2025
•Adjusted net income effective tax rate of 25.0% for 2025 (all periods)
•Share repurchases of $400 million included in share count assumption, including the $40 million we repurchased in January
(14) The Company's adjusted net income guidance, which is a non-GAAP measure, excludes unrealized gains and losses on financial instruments, net foreign currency gains and losses, changes in fair value of contingent consideration, acquisition-related intangible amortization, other acquisition and divestiture related items, stock-based compensation, other costs, impairment charges, debt restructuring and debt issuance cost amortization, adjustments attributable to our non-controlling interests, and certain tax related items. We are unable to reconcile our adjusted net income guidance to the comparable GAAP measure without unreasonable effort because of the difficulty in predicting the amounts to be adjusted, including, but not limited to, foreign currency exchange rates, unrealized gains and losses on financial instruments, and acquisition and divestiture related items, which may have a significant impact on our financial results.
16
The following tables include revenue and ANI per share sensitivities to changes in PPG and interest rates as of the date of this supplement. As a reminder, the impacts of these macro factors can and will change based upon various factors including the composition of our balance sheet. We target maintaining a materially neutral ANI per Share impact from 100bps shocks to interest rates and can adjust our profile through balance sheet strategies and hedging.
| Price Per Gallon | Interest Rates | ||||||||||||||||
| Sensitivities | +$0.10/Gal | -$0.10/Gal | +100bps | -100bps | |||||||||||||
| Impact to Net Revenue, in millions (Approximate) | $ | 20 | $ | (20) | $ | 35 | $ | (35) | |||||||||
| Impact to ANI per Share (Approximate)15 | $ | 0.30 | $ | (0.30) | $ | (0.25) | $ | 0.30 | |||||||||
The following charts present our 2025 guidance both on a revenue and on an ANI per share basis. For the 2025 presentation, one-time items includes the impact of the change in revenue model for a large OTA customer as previously discussed.
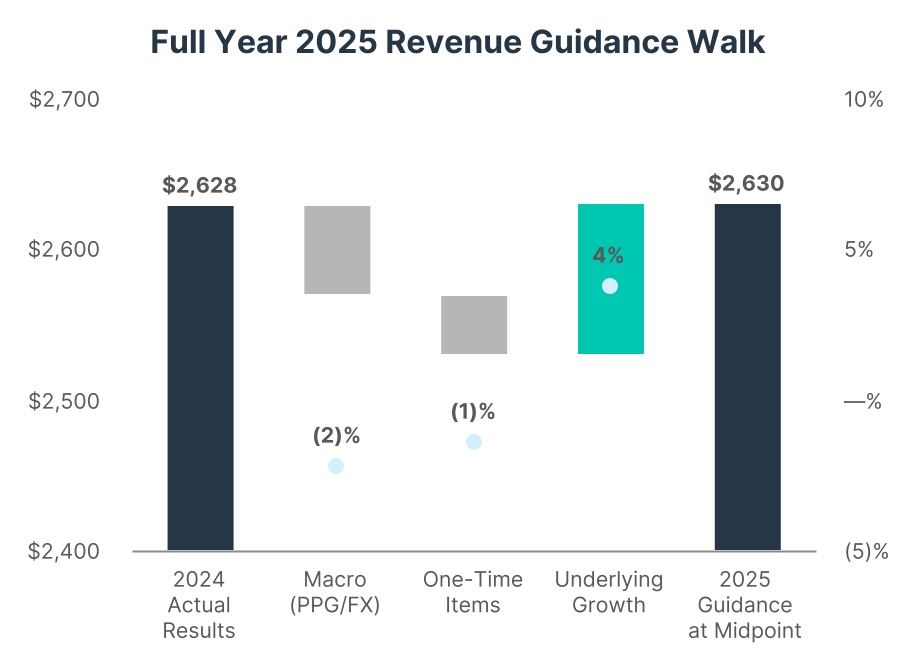
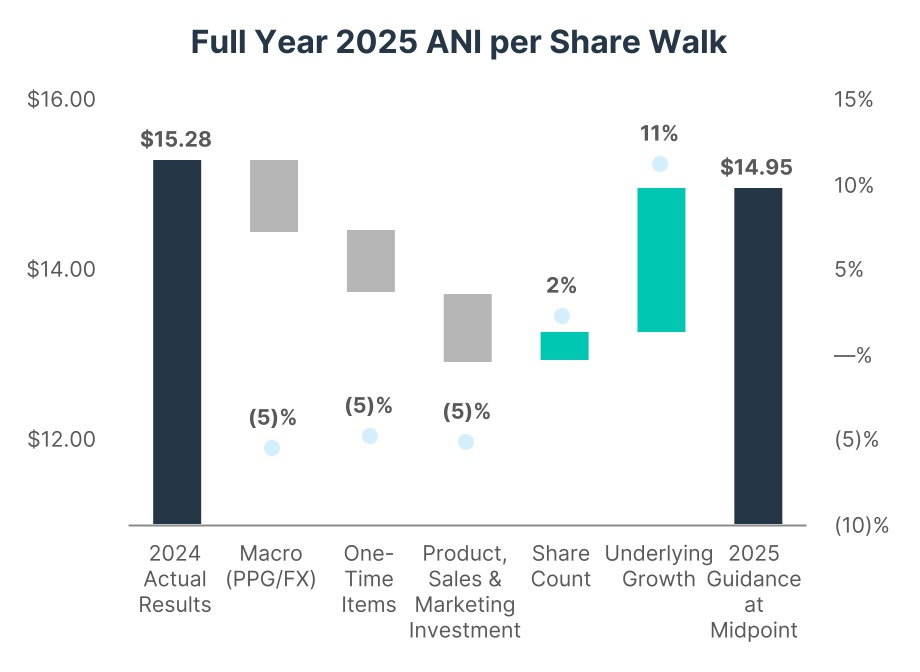
(15) The Company's adjusted net income guidance, which is a non-GAAP measure, excludes unrealized gains and losses on financial instruments, net foreign currency gains and losses, changes in fair value of contingent consideration, acquisition-related intangible amortization, other acquisition and divestiture related items, stock-based compensation, other costs, impairment charges, debt restructuring and debt issuance cost amortization, adjustments attributable to our non-controlling interests and certain tax related items. We are unable to reconcile our adjusted net income guidance to the comparable GAAP measure without unreasonable effort because of the difficulty in predicting the amounts to be adjusted, including, but not limited to, foreign currency exchange rates, unrealized gains and losses on financial instruments, and acquisition and divestiture related items, which may have a significant impact on our financial results.
17
Acronyms and Abbreviations
The acronyms and abbreviations identified below are used in these supplemental materials.
| Adjusted free cash flow | A non-GAAP measure calculated as cash flows from operating activities, adjusted for net purchases of current investment securities, capital expenditures, net Funding Activity, changes in WEX Bank cash balances, and certain other adjustments. | ||||
| Adjusted net income or ANI | A non-GAAP measure that adjusts net income (loss) to exclude all items excluded in segment adjusted operating income except unallocated corporate expenses, further excluding unrealized gains and losses on financial instruments, net foreign currency gains and losses, debt issuance cost amortization, tax related items and certain other non-operating items, as applicable depending on the period presented. | ||||
| Amended and Restated Credit Agreement | Amended and Restated Credit Agreement entered into on April 1, 2021 (as amended from time to time) by and among the Company and certain of its subsidiaries, as borrowers, and Bank of America, N.A., as administrative agent on behalf of the lenders. | ||||
| ASR | Accelerated Share Repurchase | ||||
| Average number of SaaS accounts | Represents the average number of active consumer-directed health, COBRA, and billing accounts on our SaaS platforms. HSA accounts for which WEX Inc. serves as the non-bank custodian under designation by the U.S. Department of Treasury are included in this average. | ||||
| BTFP | The Federal Reserve Bank Term Funding Program, which provides liquidity to U.S. depository institutions. | ||||
| Company | WEX Inc. and all entities included in the consolidated financial statements. | ||||
| Corporate cash | Calculated in accordance with the terms of our consolidated leverage ratio in the Company’s Amended and Restated Credit Agreement. | ||||
| FHLB | Federal Home Loan Bank | ||||
| FSA | Flexible Spending Account | ||||
| Funding activity | Includes the change in net deposits, net advances from the FHLB, changes in participation debt, and changes in borrowings under the BTFP and borrowed federal funds. | ||||
| HSA | Health Savings Account | ||||
| Net interchange rate | Represents the percentage of the dollar value of each payment processing transaction that WEX records as revenue from merchants, less certain discounts given to customers and network fees. | ||||
| Net late fee rate | Net late fee rate represents late fee revenue as a percentage of fuel purchased by fleets that have a payment processing relationship with WEX. | ||||
| Net payment processing rate | The percentage of each payment processing $ of fuel that the Company records as revenue from merchants less certain discounts given to customers and network fees. | ||||
| Net working capital | Total current assets less total current liabilities. | ||||
| Operating cash flow | Net cash provided by (used for) operating activities. | ||||
| Operating interest | Interest expense incurred on the operating debt obtained to provide liquidity for the Company’s short-term receivables or used for investing purposes in fixed income debt securities. | ||||
| Over-the-Road | Typically, heavy trucks traveling long distances. | ||||
18
| Payment processing $ of fuel | Total dollar value of the fuel purchased by fleets that have a payment processing relationship with WEX. | ||||
| Payment processing transactions | Total number of purchases made by fleets that have a payment processing relationship with the Company where the Company maintains the receivable for the total purchase. | ||||
| Processing costs | Expenses related to processing transactions, servicing customers and merchants, and costs of goods sold related to hardware and other product sales. | ||||
| Purchase volume | Purchase volume in the Corporate Payments segment represents the total dollar value of all WEX-issued transactions that use WEX corporate card products and virtual card products. Purchase volume in the Benefits segment represents the total dollar value of all transactions where interchange is earned by WEX. | ||||
| Revolving Credit Facility | The Company’s secured revolving credit facility under the Amended and Restated Credit Agreement. | ||||
| SaaS | Software-as-a-Service | ||||
| Segment adjusted operating income ("AOI") | A non-GAAP measure that adjusts operating income to exclude specified items that the Company’s management excludes in evaluating segment performance, including unallocated corporate expenses, acquisition-related intangible amortization, other acquisition and divestiture related items, debt restructuring costs, stock-based compensation, other costs and certain non-recurring or non-cash operating charges that are not core to our operations, as applicable depending on the period presented. | ||||
| Segment adjusted operating income ("AOI") margin | Segment adjusted operating income margin is calculated by dividing segment adjusted operating income by segment revenue. | ||||
| Service fees | Costs incurred from third-party networks utilized to deliver payment solutions and other third-parties utilized in performing services directly related to generating revenue. | ||||
| Total volume | Includes purchases on WEX-issued accounts as well as purchases issued by others, but using a WEX platform. | ||||
| WEX | WEX Inc., and all of its subsidiaries that are consolidated under accounting principles generally accepted in the United States, unless otherwise indicated or required by the context. | ||||
19
Exhibit 1
Reconciliation of Non-GAAP Measures
(in millions, except per share data)
(unaudited)
Reconciliation of GAAP Net Income Attributable to Shareholders to Adjusted Net Income Attributable to Shareholders
| (Unaudited) | For the three months ended | For the twelve months ended | |||||||||||||||||||||||||||||||||||||||
| 12/31/22 | 3/31/23 | 6/30/23 | 9/30/23 | 12/31/23 | 3/31/24 | 6/30/24 | 9/30/24 | 12/31/24 | 12/31/22 | 12/31/23 | 12/31/24 | ||||||||||||||||||||||||||||||
| Net income attributable to shareholders | $ | 88.7 | $ | 68.0 | $ | 95.3 | $ | 18.4 | $ | 84.9 | $ | 65.8 | $ | 77.0 | $ | 102.9 | $ | 63.9 | $ | 201.4 | $ | 266.6 | $ | 309.6 | |||||||||||||||||
| Unrealized (gain) loss on financial instruments | $ | 7.1 | $ | 14.5 | $ | (2.2) | $ | 7.8 | $ | 10.3 | $ | 0.2 | $ | 0.2 | $ | (0.9) | $ | 0.8 | $ | (83.2) | $ | 30.4 | $ | 0.2 | |||||||||||||||||
| Net foreign currency (gain) loss | $ | (15.1) | $ | 1.4 | $ | 0.2 | $ | 7.8 | $ | (14.3) | $ | 12.5 | $ | 0.4 | $ | (3.2) | $ | 16.4 | $ | 22.7 | $ | (4.9) | $ | 26.1 | |||||||||||||||||
| Change in fair value of contingent consideration | $ | 4.0 | $ | 1.8 | $ | 1.2 | $ | 3.2 | $ | 2.3 | $ | 1.7 | $ | 1.7 | $ | 0.1 | $ | 3.0 | $ | 139.1 | $ | 8.5 | $ | 6.5 | |||||||||||||||||
| Acquisition-related intangible amortization | $ | 42.8 | $ | 44.1 | $ | 44.3 | $ | 45.2 | $ | 50.4 | $ | 50.9 | $ | 50.5 | $ | 50.4 | $ | 49.9 | $ | 170.5 | $ | 184.0 | $ | 201.8 | |||||||||||||||||
| Other acquisition and divestiture related items | $ | 2.7 | $ | 1.1 | $ | 1.4 | $ | 5.1 | $ | (1.0) | $ | 3.2 | $ | 3.8 | $ | 2.4 | $ | 2.8 | $ | 17.9 | $ | 6.6 | $ | 12.1 | |||||||||||||||||
| Stock-based compensation | $ | 22.3 | $ | 26.1 | $ | 36.5 | $ | 31.9 | $ | 37.1 | $ | 26.7 | $ | 33.3 | $ | 29.8 | $ | 22.1 | $ | 100.7 | $ | 131.6 | 111.9 | ||||||||||||||||||
| Other costs | $ | 13.5 | $ | 4.5 | $ | 9.0 | $ | 15.1 | $ | 17.0 | $ | 5.8 | $ | 19.4 | $ | 12.6 | $ | 11.1 | $ | 38.4 | $ | 45.6 | 48.9 | ||||||||||||||||||
| Impairment charge | $ | — | $ | — | $ | — | $ | — | $ | — | $ | — | $ | — | $ | — | $ | — | $ | 136.5 | $ | — | $ | — | |||||||||||||||||
| Debt restructuring and debt issuance cost amortization | $ | 4.7 | $ | 4.7 | $ | 4.8 | $ | 74.4 | $ | 5.5 | $ | 4.5 | $ | 3.2 | $ | 4.3 | $ | 3.9 | $ | 17.3 | $ | 89.4 | $ | 15.9 | |||||||||||||||||
| ANI adjustments attributable to non-controlling interests | $ | — | $ | — | $ | — | $ | — | $ | — | $ | — | $ | — | $ | — | $ | — | $ | (34.6) | $ | — | $ | — | |||||||||||||||||
| Tax related items | $ | (17.8) | $ | (20.4) | $ | (31.2) | $ | (32.1) | $ | (28.4) | $ | (24.7) | $ | (25.5) | $ | (20.9) | $ | (31.1) | $ | (115.8) | $ | (112.1) | $ | (102.2) | |||||||||||||||||
| Adjusted net income attributable to shareholders | $ | 152.8 | $ | 145.8 | $ | 159.3 | $ | 176.8 | $ | 163.9 | $ | 146.7 | $ | 164.0 | $ | 177.5 | $ | 142.9 | $ | 611.0 | $ | 645.8 | $ | 631.0 | |||||||||||||||||
| ANI per Diluted Share | $ | 3.44 | $ | 3.31 | $ | 3.63 | $ | 4.05 | $ | 3.82 | $ | 3.46 | $ | 3.91 | $ | 4.35 | $ | 3.57 | $ | 13.53 | $ | 14.81 | $ | 15.28 | |||||||||||||||||
20
Reconciliation of GAAP Operating Income to Total Segment Adjusted Operating Income and Adjusted Operating Income
| (Unaudited) | For the three months ended | For the twelve months ended | |||||||||||||||||||||||||||||||||||||||
| 12/31/22 | 3/31/23 | 6/30/23 | 9/30/23 | 12/31/23 | 3/31/24 | 6/30/24 | 9/30/24 | 12/31/24 | 12/31/22 | 12/31/23 | 12/31/24 | ||||||||||||||||||||||||||||||
| Operating income | $ | 155.1 | $ | 154.3 | $ | 159.4 | $ | 174.9 | $ | 158.5 | $ | 164.5 | $ | 168.1 | $ | 196.4 | $ | 157.3 | $ | 469.8 | $ | 647.1 | $ | 686.3 | |||||||||||||||||
| Unallocated corporate expenses | $ | 20.6 | $ | 22.4 | $ | 25.3 | $ | 29.1 | $ | 26.2 | $ | 23.6 | $ | 26.1 | $ | 24.1 | $ | 28.3 | $ | 84.5 | $ | 103.0 | $ | 102.1 | |||||||||||||||||
| Acquisition-related intangible amortization | $ | 42.8 | $ | 44.1 | $ | 44.3 | $ | 45.2 | $ | 50.4 | $ | 50.9 | $ | 50.5 | $ | 50.4 | $ | 49.9 | $ | 170.5 | $ | 184.0 | $ | 201.8 | |||||||||||||||||
| Other acquisition and divestiture related items | $ | 2.7 | $ | 1.1 | $ | 1.4 | $ | 5.1 | $ | (1.0) | $ | 2.4 | $ | 1.4 | $ | 1.6 | $ | 0.3 | $ | 17.9 | $ | 6.6 | $ | 5.7 | |||||||||||||||||
| Stock-based compensation | $ | 22.3 | $ | 26.1 | $ | 36.5 | $ | 31.9 | $ | 37.1 | $ | 26.7 | $ | 33.3 | $ | 29.8 | $ | 22.1 | $ | 100.7 | $ | 131.6 | 111.9 | ||||||||||||||||||
| Other costs | $ | 15.0 | $ | 4.5 | $ | 9.0 | $ | 15.1 | $ | 17.5 | $ | 6.7 | $ | 20.6 | $ | 14.8 | $ | 11.9 | $ | 39.9 | $ | 46.1 | 53.9 | ||||||||||||||||||
| Impairment charges | $ | — | $ | — | $ | — | $ | — | $ | — | $ | — | $ | — | $ | — | $ | — | $ | 136.5 | $ | — | $ | — | |||||||||||||||||
| Total segment adjusted operating income | $ | 258.5 | $ | 252.5 | $ | 275.9 | $ | 301.3 | $ | 288.7 | $ | 274.9 | $ | 299.9 | $ | 317.1 | $ | 269.8 | $ | 1,019.8 | $ | 1,118.4 | $ | 1,161.7 | |||||||||||||||||
| Unallocated corporate expenses | $ | (20.6) | $ | (22.4) | $ | (25.3) | $ | (29.1) | $ | (26.2) | $ | (23.6) | $ | (26.1) | $ | (24.1) | $ | (28.3) | $ | (84.5) | $ | (103.0) | $ | (102.1) | |||||||||||||||||
| Adjusted operating income | $ | 237.9 | $ | 230.1 | $ | 250.6 | $ | 272.2 | $ | 262.5 | $ | 251.3 | $ | 273.9 | $ | 293.0 | $ | 241.5 | $ | 935.3 | $ | 1,015.4 | $ | 1,059.7 | |||||||||||||||||
The Company's non-GAAP adjusted operating income excludes acquisition-related intangible amortization, other acquisition and divestiture related items, debt restructuring costs, stock-based compensation, other costs and certain non-recurring or non-cash operating charges that are not core to our operations, as applicable depending on the period presented. Total segment adjusted operating income incorporates these same adjustments and further excludes unallocated corporate expenses.
The Company's non-GAAP adjusted net income, which similarly excludes the impact of all items excluded in adjusted operating income, further excludes unrealized gains and losses on financial instruments, net foreign currency gains and losses, debt issuance cost amortization, tax related items, and certain other non-operating items, as applicable depending on the period presented.
Although adjusted net income, adjusted operating income and total segment adjusted operating income are not calculated in accordance with GAAP, our management team believes these non-GAAP measures are integral to our reporting and planning processes and uses them to assess operating performance because they generally exclude financial results that are outside the normal course of our business operations or management’s control. These measures are also used to allocate resources among our operating segments and for internal budgeting and forecasting purposes for both short- and long-term operating plans.
For the periods presented herein, the following items have been excluded in determining one or more non-GAAP measures for the following reasons:
•Exclusion of the non-cash, mark-to-market adjustments on financial instruments, including interest rate swap agreements and investment securities, helps management identify and assess trends in the Company’s underlying business that might otherwise be obscured due to quarterly non-cash earnings fluctuations associated with these financial instruments. Additionally, the non-cash, mark-to-market adjustments on financial instruments are difficult to forecast accurately, making comparisons across historical and future quarters difficult to evaluate;
•Net foreign currency gains and losses primarily result from the remeasurement to functional currency of cash, accounts receivable and accounts payable balances, certain intercompany notes denominated in foreign currencies and any gain or loss on foreign currency hedges relating to these items. The exclusion of these items helps management compare changes in operating results between periods that might otherwise be obscured due to currency fluctuations;
21
•The change in fair value of contingent consideration, which is related to the acquisition of certain contractual rights to serve as custodian or sub-custodian to HSAs, is dependent upon changes in future interest rate assumptions and has no significant impact on the ongoing operations of the Company. Additionally, the non-cash, mark-to-market adjustments on financial instruments are difficult to forecast accurately, making comparisons across historical and future quarters difficult to evaluate;
•The Company considers certain acquisition-related costs, including certain financing costs, investment banking fees, warranty and indemnity insurance, certain integration-related expenses and amortization of acquired intangibles, as well as gains and losses from divestitures to be unpredictable, dependent on factors that may be outside of our control and unrelated to the continuing operations of the acquired or divested business or the Company. In addition, the size and complexity of an acquisition, which often drives the magnitude of acquisition-related costs, may not be indicative of such future costs. The Company believes that excluding acquisition-related costs and gains or losses on divestitures facilitates the comparison of our financial results to the Company’s historical operating results and to other companies in our industry;
•Stock-based compensation is different from other forms of compensation as it is a non-cash expense. For example, a cash salary generally has a fixed and unvarying cash cost. In contrast, the expense associated with an equity-based award is generally unrelated to the amount of cash ultimately received by the employee, and the cost to the Company is based on a stock-based compensation valuation methodology and underlying assumptions that may vary over time;
•Other costs are not consistently occurring and do not reflect expected future operating expense, nor do they provide insight into the fundamentals of current or past operations of our business. This also includes non-recurring professional service costs, costs related to certain identified initiatives, including restructuring and technology initiatives, to further streamline the business, improve the Company’s efficiency, create synergies and globalize the Company’s operations, all with an objective to improve scale and efficiency and increase profitability going forward.
•Impairment charges represent non-cash asset write-offs, which do not reflect recurring costs that would be relevant to the Company’s continuing operations. The Company believes that excluding these nonrecurring expenses facilitates the comparison of our financial results to the Company’s historical operating results and to other companies in its industry;
•Debt restructuring and debt issuance cost amortization, which for the year ended December 31, 2023 includes the loss on extinguishment of Convertible Notes, are unrelated to the continuing operations of the Company. Debt restructuring costs are not consistently occurring and do not reflect expected future operating expense, nor do they provide insight into the fundamentals of current or past operations of our business. In addition, since debt issuance cost amortization is dependent upon the financing method, which can vary widely company to company, we believe that excluding these costs helps to facilitate comparison to historical results as well as to other companies within our industry;
•The adjustments attributable to non-controlling interests, including adjustments to the redemption value of a non-controlling interest, have no significant impact on the ongoing operations of the business;
•The tax related items are the difference between the Company’s GAAP tax provision and a non-GAAP tax provision. Beginning in fiscal year 2024, the Company began utilizing a fixed annual projected long-term non-GAAP tax rate in order to provide better consistency across reporting periods. To determine this long-term projected tax rate, the Company performs a pro forma tax provision based upon the Company’s projected adjusted net income before taxes. The fixed annual projected long-term non-GAAP tax rate could be subject to change in future periods for a variety of reasons, including the rapidly evolving global tax environment, significant changes in our geographic earnings mix including due to acquisition activity, or other changes to our strategy or business operations; and
•The Company does not allocate certain corporate expenses to our operating segments, as these items are centrally controlled and are not directly attributable to any reportable segment.
Adjusted net income, adjusted operating income, and total segment adjusted operating income may be useful to investors as a means of evaluating our performance. However, because total segment adjusted operating income and adjusted net income are non-GAAP measures, they should not be considered as a substitute for, or superior to, operating income or net income as determined in accordance with GAAP. Total segment adjusted operating income and adjusted net income as used by WEX may not be comparable to similarly titled measures employed by other companies.
22
Reconciliation of GAAP Operating Cash Flow to Adjusted Free Cash Flow
The Company’s non-GAAP adjusted free cash flow is calculated as cash flows from operating activities, adjusted for net purchases of current investment securities, capital expenditures, net funding activity including the change in net deposits, net advances from the FHLB, and changes in borrowings under the BTFP and borrowed federal funds, and certain other adjustments. Although non-GAAP adjusted free cash flow is not calculated in accordance with GAAP, WEX believes that adjusted free cash flow is a useful measure for investors to further evaluate our results of operations because (i) adjusted free cash flow indicates the level of cash generated by the operations of the business, which excludes consideration paid on acquisitions, after appropriate reinvestment for recurring investments in property, equipment and capitalized software that are required to operate the business; (ii) net Funding Activity includes fluctuations in deposits and other borrowings primarily used as part of our accounts receivable funding strategy; (iii) purchases of current investment securities are made as a result of deposits gathered operationally; and (iv) WEX Bank cash balances may be increased or decreased for reasons other than matching operating activity. However, because adjusted free cash flow is a non-GAAP measure, it should not be considered as a substitute for, or superior to, operating cash flow as determined in accordance with GAAP. In addition, adjusted free cash flow as used by WEX may not be comparable to similarly titled measures employed by other companies.
The following table reconciles GAAP operating cash flow to adjusted free cash flow for the three and twelve-month periods presented:
| For the three months ended | For the twelve months ended | ||||||||||||||||||||||||||||||||||||||||
| (In millions) | 12/31/22 | 3/31/23 | 6/30/23 | 9/30/23 | 12/31/23 | 3/31/24 | 6/30/24 | 9/30/24 | 12/31/24 | 12/31/22 | 12/31/23 | 12/31/24 | |||||||||||||||||||||||||||||
| Operating Cash Flow, as reported | $ | 572.8 | $ | 27.1 | $ | 72.4 | $ | 46.5 | $ | 761.9 | $ | (153.3) | $ | (7.0) | $ | 3.3 | $ | 638.4 | $ | 679.4 | $ | 907.9 | $ | 481.4 | |||||||||||||||||
| Adjustments To Cash Flows From Operating Activities: | |||||||||||||||||||||||||||||||||||||||||
| Changes in WEX Bank Cash Balances | $ | (118.1) | $ | (46.7) | $ | 71.4 | $ | (83.5) | $ | (23.6) | $ | 188.9 | $ | 69.6 | $ | 125.3 | $ | (104.7) | $ | (295.7) | $ | (82.4) | $ | 279.1 | |||||||||||||||||
| Other | $ | — | $ | 1.5 | $ | — | $ | — | $ | (50.0) | $ | 67.1 | $ | — | $ | — | $ | (33.1) | $ | — | $ | (48.5) | $ | 34.0 | |||||||||||||||||
| Adjusted for Certain Investing and Financing Activities: | |||||||||||||||||||||||||||||||||||||||||
| Net Funding Activity | $ | (150.0) | $ | 971.8 | $ | 385.9 | $ | 294.8 | $ | (214.4) | $ | 205.0 | $ | 214.8 | $ | 372.2 | $ | (139.3) | $ | 839.1 | $ | 1,438.2 | $ | 652.7 | |||||||||||||||||
| Less: Purchases of Current Investment Securities, Net of Sales and Maturities | $ | (0.9) | $ | (1,026.8) | $ | (220.8) | $ | (56.6) | $ | (256.8) | $ | (282.9) | $ | (25.6) | $ | (276.3) | $ | (153.2) | $ | (585.8) | $ | (1,561.0) | $ | (738.0) | |||||||||||||||||
| Less: Capital Expenditures | $ | (37.4) | $ | (30.6) | $ | (34.7) | $ | (36.4) | $ | (41.9) | $ | (34.0) | $ | (39.6) | $ | (35.0) | $ | (38.7) | $ | (112.9) | $ | (143.6) | $ | (147.3) | |||||||||||||||||
| Adjusted Free Cash Flow | $ | 266.4 | $ | (103.7) | $ | 274.2 | $ | 164.9 | $ | 175.2 | $ | (9.2) | $ | 212.2 | $ | 189.5 | $ | 169.5 | $ | 524.2 | $ | 510.6 | $ | 562.0 | |||||||||||||||||
23