
WMS 8-K
Advanced Drainage Systems, Inc. (WMS)
8-K
2022-08-04
For: 2022-08-04
View Original
Added on
April 10, 2026
UNITED STATES
SECURITIES AND EXCHANGE COMMISSION
WASHINGTON, D.C. 20549
FORM 8-K
CURRENT REPORT
Pursuant to Section 13 or 15(d) of the Securities Exchange Act of 1934
Date of Report (Date of earliest event reported): August 4, 2022
(Exact name of Registrant as Specified in Its Charter)
(State or Other Jurisdiction of Incorporation) | (Commission File Number) | (IRS Employer Identification No.) | |||||||||
| (Address of Principal Executive Offices) | (Zip Code) | ||||||||||
Registrant’s Telephone Number, Including Area Code: (614 ) 658-0050
Not Applicable
(Former Name or Former Address, if Changed Since Last Report)
Check the appropriate box below if the Form 8-K filing is intended to simultaneously satisfy the filing obligation of the registrant under any of the following provisions (see General Instructions A.2. below):
| Written communications pursuant to Rule 425 under the Securities Act (17 CFR 230.425) | |||||
| Soliciting material pursuant to Rule 14a-12 under the Exchange Act (17 CFR 240.14a-12) | |||||
| Pre-commencement communications pursuant to Rule 14d-2(b) under the Exchange Act (17 CFR 240.14d-2(b)) | |||||
| Pre-commencement communications pursuant to Rule 13e-4(c) under the Exchange Act (17 CFR 240.13e-4(c)) | |||||
Securities registered pursuant to Section 12(b) of the Act:
| Title of each class | Trading Symbol(s) | Name of each exchange on which registered | ||||||||||||
Indicate by check mark whether the registrant is an emerging growth company as defined in Rule 405 of the Securities Act of 1933 (§ 230.405 of this chapter) or Rule 12b-2 of the Securities Exchange Act of 1934 (§ 240.12b-2 of this chapter).
Emerging growth company ☐
If an emerging growth company, indicate by check mark if the registrant has elected not to use the extended transition period for complying with any new or revised financial accounting standards provided pursuant to Section 13(a) of the Exchange Act. ☐
Item 2.02 Results of Operations and Financial Condition
On August 4, 2022, Advanced Drainage Systems, Inc. (the "Company") issued a press release setting forth the Company’s unaudited results for the fiscal first quarter ended June 30, 2022. A copy of the Company’s press release with the results is being furnished as Exhibit 99.1 and hereby incorporated by reference.
The information furnished pursuant to this Item 2.02, including Exhibit 99.1, shall not be deemed “filed” for purposes of Section 18 of the Securities Exchange Act of 1934 (the "Exchange Act") or otherwise subject to the liabilities under Section 18 of the Exchange Act and shall not be deemed to be incorporated by reference into any filing of the Company under the Securities Act of 1933 or the Exchange Act.
Item 7.01 Regulation FD Disclosure
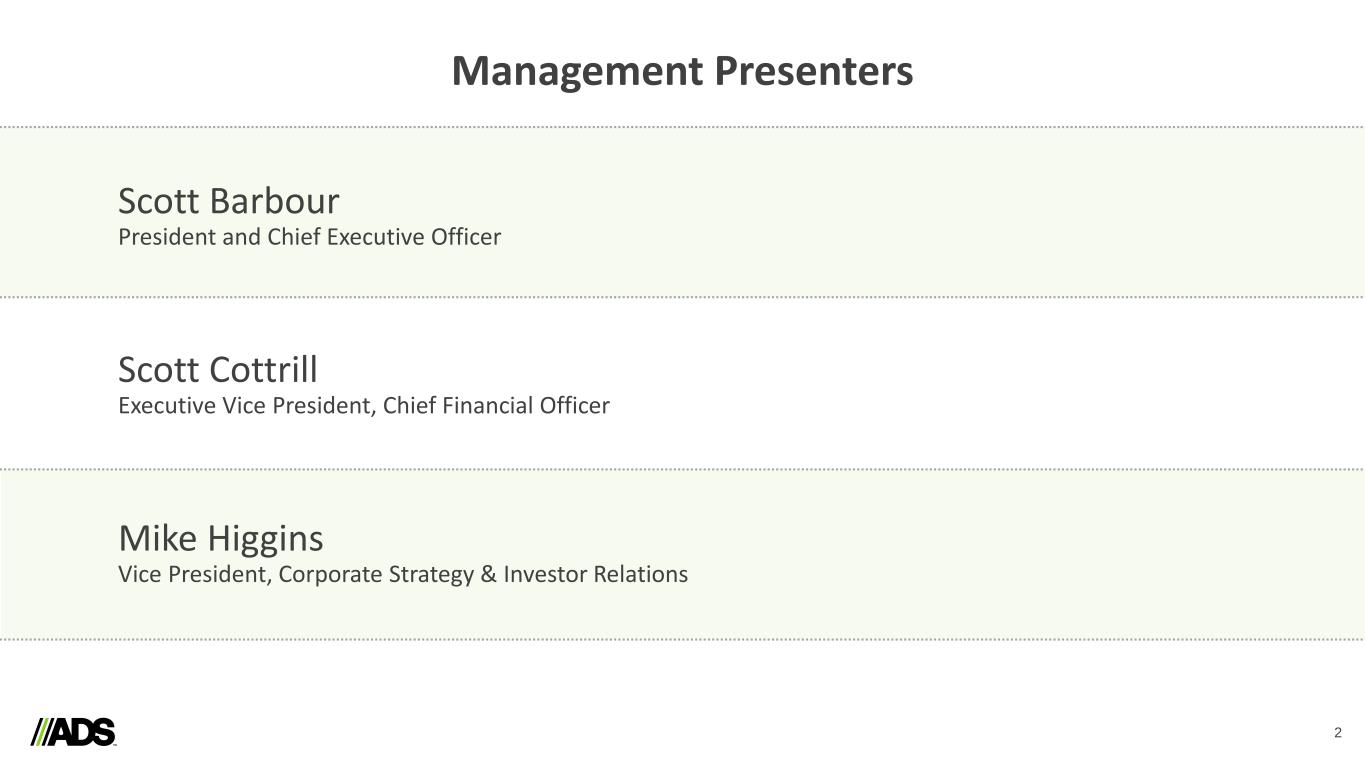
As previously announced, at 10:00 a.m. (Eastern time) on August 4, 2022, the Company’s President and Chief Executive Officer, Scott Barbour, and Chief Financial Officer, Scott Cottrill, will host a conference call and webcast to discuss the Company’s unaudited results for the fiscal first quarter ended June 30, 2022. A copy of the Company’s slides forming the basis of the presentation is being furnished as Exhibit 99.2 and hereby incorporated by reference.
The live webcast will also be accessible via the "Events Calendar" section of the Company’s Investor Relations website, www.investors.ads-pipe.com. An archived version of the webcast will be available following the call.
Item 8.01 Other Events
On August 4, 2022, the Company issued a press release announcing the approval by the Board of Directors (the "Board") of the Company of the declaration of a cash dividend of $0.12 per share, payable on September 15, 2022, to stockholders of record at the close of business on September 1, 2022. A copy of the Company’s press release is attached hereto as Exhibit 99.3 and hereby incorporated by reference.
Item 9.01 Financial Statements and Exhibits.
(d)Exhibits
The following exhibits are being furnished as part of this report:
| 99.1 | ||||||||
| 99.2 | ||||||||
| 99.3 | ||||||||
| 104 | Cover Page Interactive Data File (embedded within the Inline XBRL document) | |||||||
1
SIGNATURES
Pursuant to the requirements of the Securities Exchange Act of 1934, the Registrant has duly caused this report to be signed on its behalf by the undersigned hereunto duly authorized.
| ADVANCED DRAINAGE SYSTEMS, INC. | |||||||||||
| Date: August 4, 2022 | By: | /s/ Scott A. Cottrill | |||||||||
| Name: | Scott A. Cottrill | ||||||||||
| Title: | EVP, CFO & Secretary | ||||||||||
2
Exhibit 99.1
ADVANCED DRAINAGE SYSTEMS ANNOUNCES FIRST QUARTER
FISCAL 2023 RESULTS
HILLIARD, Ohio – (August 4, 2022) – Advanced Drainage Systems, Inc. (NYSE: WMS) (“ADS” or the “Company”), a leading provider of innovative water management solutions in the stormwater and onsite septic wastewater industries today announced financial results for the fiscal first quarter ended June 30, 2022.
First Quarter Fiscal 2023 Results
•Net sales increased 36.6% to $914.2 million
•Net income increased 144.4% to $188.5 million
•Adjusted EBITDA (Non-GAAP) increased 79.5% to $299.0 million
Scott Barbour, President and Chief Executive Officer of ADS commented, "We achieved record revenue and Adjusted EBITDA results in the first quarter of fiscal 2023, with results coming in well above plan. Sales growth of 37% was driven by favorable pricing at both ADS and Infiltrator, as well as strong volume growth in Allied Products, Infiltrator and the residential end market driven by share gains. In addition, the new production equipment installed during the fourth quarter of fiscal year 2022, at both ADS and Infiltrator is producing to expected rates and helping to bring down elevated backlogs. While pipe volume in our non-residential, infrastructure and agriculture end markets started slower than anticipated, year-over-year volume performance improved as the quarter progressed and we remain confident in the outlook for all of our end markets for the remainder of the fiscal year."
Barbour continued, "The favorable top line growth we achieved in the first quarter was broad based across our construction end markets and geographies, with notable strength in our priority states. This growth offset inflationary cost pressures that we continue to see in transportation and our manufacturing operations. In addition, the pricing actions we have taken have more than offset our raw material costs, which moderated, but remain at elevated levels. As a result of these actions, we generated strong growth in Adjusted EBITDA, which in combination with improvements in working capital, helped drive significant free cash flow generation."
Barbour concluded, "Based on better than expected performance this quarter that we anticipate will continue into the second quarter, we are raising our fiscal year guidance for both revenue and Adjusted EBITDA. While there is uncertainty around general economic conditions, specifically in residential construction, the strength we see in our leading indicators including project identification, quoting, book-to-bill and order trends, give us confidence we can achieve the updated guidance issued today."
First Quarter Fiscal 2023 Results
Net sales increased $244.9 million, or 36.6%, to $914.2 million, as compared to $669.3 million in the prior year quarter. Domestic pipe sales increased $150.8 million, or 40.3%, to $524.9 million. Domestic allied products & other sales increased $71.9 million, or 56.6%, to $198.9 million. Infiltrator sales increased $39.5 million, or 31.2%, to $166.3 million. These increases were driven by double-digit sales growth in the U.S. construction end markets. International sales increased $6.1 million, or 9.4%, to $71.5 million, driven by strong sales growth in the Canadian, Mexican and Exports businesses.
Gross profit increased $151.0 million, or 75.1%, to $352.1 million as compared to $201.1 million in the prior year. The increase in gross profit is primarily due to the increase in sales volume and favorable pricing on pipe, onsite septic and allied products. The increase in our gross profit was due to an increase in net sales from improved pricing partially offset by inflationary pressures of higher material and transportation costs along with higher manufacturing costs.
Adjusted EBITDA (Non-GAAP) increased $132.5 million, or 79.5%, to $299.0 million, as compared to $166.6 million in the prior year. The increase is primarily due to the factors mentioned above. As a percentage of net sales, Adjusted EBITDA was 32.7% as compared to 24.9% in the prior year.
Reconciliations of GAAP to Non-GAAP financial measures for Adjusted EBITDA and Free Cash Flow have been provided in the financial statement tables included in this press release. An explanation of these measures is also included below under the heading “Non-GAAP Financial Measures.”
1
Balance Sheet and Liquidity
Net cash provided by operating activities was $249.8 million, as compared to $104.3 million in the prior year. Free cash flow (Non-GAAP) was $213.6 million, as compared to $78.8 million in the prior year. Net debt (total debt and finance lease obligations net of cash) was $850.2 million as of June 30, 2022, a decrease of $74.3 million from March 31, 2022.
On June 9, 2022 the Company issued $500.0 million aggregate principal amount of 6.375% Senior Notes due 2030. Some of the proceeds of this issuance were used to repay the outstanding borrowings under its senior secured revolving credit facility.
ADS had total liquidity of $1,059 million, comprised of cash of $464 million as of June 30, 2022 and $595 million of availability under committed credit facilities. As of June 30, 2022, the Company’s leverage ratio was 1.1 times.
In the three months ended June 30, 2022, the Company repurchased 0.8 million shares of its common stock for a total cost of $67.4 million. As of June 30, 2022, approximately $932.6 million of common stock may be repurchased under the authorization.
Fiscal 2023 Outlook
Based on current visibility, backlog of existing orders and business trends, the Company raised its financial targets for fiscal 2023. Net sales are now expected to be in the range of $3.250 billion to $3.350 billion. Adjusted EBITDA is expected to be in the range of $900 to $940 million. Capital expenditures are expected to be in the range of $150 million to $180 million.
Conference Call Information
Webcast: Interested investors and other parties can listen to a webcast of the live conference call by logging in through the Investor Relations section of the Company's website at https://investors.ads-pipe.com/events-and-presentations. An online replay will be available on the same website following the call.
Teleconference: To participate in the live teleconference, participants may register at https://ige.netroadshow.com/registration/q4inc/11113/ads/#39-first-quarter-fiscal-year-2023-financial-results/. After registering, participants will receive a confirmation through email, including dial in details and unique conference call codes for entry. Registration is open through the live call. To ensure participants are connected for the full call, please register at least 10 minutes before the start of the call.
About the Company
Advanced Drainage Systems is a leading manufacturer of innovative stormwater and onsite septic wastewater solutions that manages the world’s most precious resource: water. ADS provides superior drainage solutions for use in a wide variety of markets and applications including commercial, residential, infrastructure and agriculture. ADS delivers tremendous service to its customers with the industry’s largest company-owned fleet, an expansive sales team, and a vast manufacturing network of approximately 70 manufacturing plants and 38 distribution centers. ADS is the largest plastic recycling company in North America, ensuring over half a billion pounds of plastic is kept out of landfills every year. Founded in 1966, ADS’ water management solutions are designed to last for decades. To learn more, visit the Company’s website at www.adspipe.com.
Forward Looking Statements
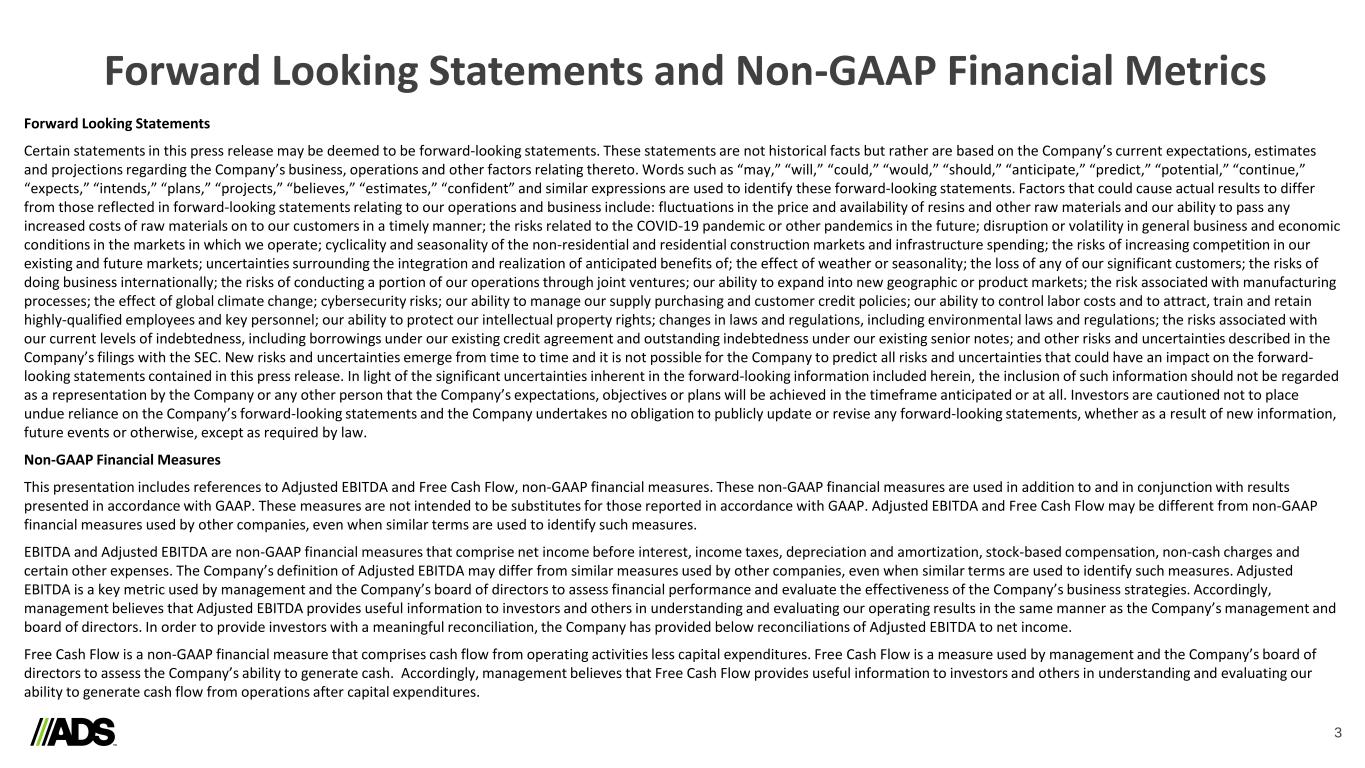
Certain statements in this press release may be deemed to be forward-looking statements. These statements are not historical facts but rather are based on the Company’s current expectations, estimates and projections regarding the Company’s business, operations and other factors relating thereto. Words such as “may,” “will,” “could,” “would,” “should,” “anticipate,” “predict,” “potential,” “continue,” “expects,” “intends,” “plans,” “projects,” “believes,” “estimates,” “confident” and similar expressions are used to identify these forward-looking statements. Factors that could cause actual results to differ from those reflected in forward-looking statements relating to our operations and business include: fluctuations in the price and availability of resins and other raw materials and our ability to pass any increased costs of raw materials on to our customers in a timely manner; the risks related to the COVID-19 pandemic or other pandemics in the future; disruption or volatility in general business and economic conditions in the markets in which we operate; cyclicality and seasonality of the non-residential and residential construction markets and infrastructure spending; the risks of increasing competition in our existing and future markets; uncertainties surrounding the integration and realization of anticipated benefits of; the effect of weather or seasonality; the loss of any of our significant customers; the risks of doing business internationally; the risks of conducting a portion of our operations through joint ventures; our ability to expand into new geographic or product markets; the risk associated with manufacturing processes; the effect of global climate change; cybersecurity risks; our ability to manage our supply purchasing and customer credit policies; our ability to control labor costs and to attract, train and retain highly-qualified employees and key personnel; our ability to protect our intellectual property rights; changes in laws and regulations, including environmental laws and regulations; the risks associated with our current levels of indebtedness, including borrowings under our existing credit agreement and outstanding indebtedness under our existing senior notes; and other risks and uncertainties described in the Company’s filings with the SEC. New risks and uncertainties emerge from time to time and it is not possible for the Company to predict all risks and uncertainties that could have an impact on the forward-looking statements contained in this press release. In light of the significant uncertainties inherent in the forward-looking information included herein, the inclusion of such information should not be regarded as a representation by the Company or any other person that the Company’s expectations, objectives or plans will be achieved in the timeframe anticipated or at all. Investors are cautioned not to place undue reliance on the Company’s forward-
2
looking statements and the Company undertakes no obligation to publicly update or revise any forward-looking statements, whether as a result of new information, future events or otherwise, except as required by law.
For more information, please contact:
Michael Higgins
VP, Corporate Strategy & Investor Relations
(614) 658-0050
3
Financial Statements
ADVANCED DRAINAGE SYSTEMS, INC. AND SUBSIDIARIES
CONSOLIDATED STATEMENTS OF INCOME
(unaudited)
| Three Months Ended June 30, | |||||||||||
| (In thousands, except per share data) | 2022 | 2021 | |||||||||
| Net sales | $ | 914,186 | $ | 669,300 | |||||||
| Cost of goods sold | 562,079 | 468,179 | |||||||||
| Gross profit | 352,107 | 201,121 | |||||||||
| Operating expenses: | |||||||||||
| Selling, general and administrative | 86,520 | 76,221 | |||||||||
Loss (gain) on disposal of assets and costs from exit and disposal activities | 303 | (11) | |||||||||
| Intangible amortization | 13,677 | 15,645 | |||||||||
| Income from operations | 251,607 | 109,266 | |||||||||
| Other expense: | |||||||||||
| Interest expense | 11,072 | 7,907 | |||||||||
| Derivative gains and other income, net | (1,902) | (2,014) | |||||||||
| Income before income taxes | 242,437 | 103,373 | |||||||||
| Income tax expense | 55,065 | 26,455 | |||||||||
| Equity in net income of unconsolidated affiliates | (1,110) | (205) | |||||||||
| Net income | 188,482 | 77,123 | |||||||||
| Less: net income attributable to noncontrolling interest | 1,336 | 1,136 | |||||||||
| Net income attributable to ADS | 187,146 | 75,987 | |||||||||
Dividends to participating securities | — | (1,635) | |||||||||
Net income available to common stockholders and participating securities | 187,146 | 74,352 | |||||||||
Undistributed income allocated to participating securities | — | (10,933) | |||||||||
| Net income available to common stockholders | $ | 187,146 | $ | 63,419 | |||||||
| Weighted average common shares outstanding: | |||||||||||
| Basic | 83,144 | 71,534 | |||||||||
| Diluted | 84,389 | 73,124 | |||||||||
| Net income per share: | |||||||||||
| Basic | $ | 2.25 | $ | 0.89 | |||||||
| Diluted | $ | 2.22 | $ | 0.87 | |||||||
| Cash dividends declared per share | $ | 0.12 | $ | 0.11 | |||||||
4
ADVANCED DRAINAGE SYSTEMS, INC. AND SUBSIDIARIES
CONSOLIDATED BALANCE SHEETS
(unaudited)
| As of | |||||||||||
| (Amounts in thousands) | June 30, 2022 | March 31, 2022 | |||||||||
| ASSETS | |||||||||||
| Current assets: | |||||||||||
| Cash | $ | 463,696 | $ | 20,125 | |||||||
| Receivables, net | 427,620 | 341,753 | |||||||||
| Inventories | 489,492 | 494,324 | |||||||||
| Other current assets | 20,532 | 15,696 | |||||||||
| Total current assets | 1,401,340 | 871,898 | |||||||||
| Property, plant and equipment, net | 636,042 | 619,383 | |||||||||
| Other assets: | |||||||||||
| Goodwill | 619,626 | 610,293 | |||||||||
| Intangible assets, net | 449,115 | 431,385 | |||||||||
| Other assets | 119,240 | 116,799 | |||||||||
| Total assets | $ | 3,225,363 | $ | 2,649,758 | |||||||
| LIABILITIES, MEZZANINE EQUITY AND STOCKHOLDERS’ EQUITY | |||||||||||
| Current liabilities: | |||||||||||
| Current maturities of debt obligations | $ | 18,113 | $ | 19,451 | |||||||
| Current maturities of finance lease obligations | 5,227 | 5,089 | |||||||||
| Accounts payable | 274,606 | 224,986 | |||||||||
| Other accrued liabilities | 148,605 | 134,877 | |||||||||
| Accrued income taxes | 58,207 | 6,838 | |||||||||
| Total current liabilities | 504,758 | 391,241 | |||||||||
| Long-term debt obligations, net | 1,279,176 | 908,705 | |||||||||
| Long-term finance lease obligations | 11,429 | 11,393 | |||||||||
| Deferred tax liabilities | 166,741 | 168,435 | |||||||||
| Other liabilities | 66,472 | 64,939 | |||||||||
| Total liabilities | 2,028,576 | 1,544,713 | |||||||||
| Mezzanine equity: | |||||||||||
| Redeemable common stock | 188,828 | — | |||||||||
| Redeemable convertible preferred stock | — | 195,384 | |||||||||
| Total mezzanine equity | 188,828 | 195,384 | |||||||||
| Stockholders’ equity: | |||||||||||
| Common stock | 11,623 | 11,612 | |||||||||
| Paid-in capital | 1,079,701 | 1,065,628 | |||||||||
| Common stock in treasury, at cost | (408,861) | (318,691) | |||||||||
| Accumulated other comprehensive loss | (28,289) | (24,386) | |||||||||
| Retained earnings | 335,822 | 158,876 | |||||||||
| Total ADS stockholders’ equity | 989,996 | 893,039 | |||||||||
| Noncontrolling interest in subsidiaries | 17,963 | 16,622 | |||||||||
| Total stockholders’ equity | 1,007,959 | 909,661 | |||||||||
| Total liabilities, mezzanine equity and stockholders’ equity | $ | 3,225,363 | $ | 2,649,758 | |||||||
5
ADVANCED DRAINAGE SYSTEMS, INC. AND SUBSIDIARIES
CONSOLIDATED STATEMENTS OF CASH FLOWS
(unaudited)
| Three Months Ended June 30, | ||||||||||||||
| (Amounts in thousands) | 2022 | 2021 | ||||||||||||
| Cash Flow from Operating Activities | ||||||||||||||
| Net income | $ | 188,482 | $ | 77,123 | ||||||||||
| Adjustments to reconcile net income to net cash provided by operating activities: | ||||||||||||||
| Depreciation and amortization | 35,578 | 34,656 | ||||||||||||
| Deferred income taxes | (1,272) | 64 | ||||||||||||
| Loss (gain) on disposal of assets and costs from exit and disposal activities | 303 | (11) | ||||||||||||
| ESOP and stock-based compensation | 6,273 | 20,806 | ||||||||||||
| Amortization of deferred financing charges | 344 | 95 | ||||||||||||
| Fair market value adjustments to derivatives | (90) | (675) | ||||||||||||
| Equity in net income of unconsolidated affiliates | (1,110) | (205) | ||||||||||||
| Other operating activities | (3,535) | 450 | ||||||||||||
| Changes in working capital: | ||||||||||||||
| Receivables | (79,616) | (67,388) | ||||||||||||
| Inventories | 8,039 | (28,985) | ||||||||||||
| Prepaid expenses and other current assets | (4,840) | (7,442) | ||||||||||||
| Accounts payable, accrued expenses, and other liabilities | 101,209 | 75,860 | ||||||||||||
| Net cash provided by operating activities | 249,765 | 104,348 | ||||||||||||
| Cash Flows from Investing Activities | ||||||||||||||
| Capital expenditures | (36,189) | (25,546) | ||||||||||||
| Acquisition, net of cash acquired | (47,492) | — | ||||||||||||
| Other investing activities | 13 | 53 | ||||||||||||
| Net cash used in investing activities | (83,668) | (25,493) | ||||||||||||
| Cash Flows from Financing Activities | ||||||||||||||
| Payments on syndicated Term Loan Facility | (1,750) | (1,750) | ||||||||||||
| Proceeds from Revolving Credit Agreement | 26,200 | — | ||||||||||||
| Payments on Revolving Credit Agreement | (140,500) | — | ||||||||||||
| Proceeds from Amended Revolving Credit Agreement | 97,000 | — | ||||||||||||
| Payments on Amended Revolving Credit Agreement | (97,000) | — | ||||||||||||
| Proceeds from Senior Notes due 2030 | 500,000 | — | ||||||||||||
| Debt issuance costs | (11,575) | — | ||||||||||||
| Payments on Equipment Financing | (3,548) | — | ||||||||||||
| Payments on finance lease obligations | (1,721) | (5,379) | ||||||||||||
| Repurchase of common stock | (57,699) | (102,013) | ||||||||||||
| Cash dividends paid | (10,170) | (9,451) | ||||||||||||
| Dividends paid to noncontrolling interest holder | — | (957) | ||||||||||||
| Proceeds from exercise of stock options | 1,249 | 1,336 | ||||||||||||
| Payment of withholding taxes on vesting of restricted stock units | (22,809) | (12,976) | ||||||||||||
| Other financing activities | — | (131) | ||||||||||||
| Net cash provided by (used in) financing activities | 277,677 | (131,321) | ||||||||||||
| Effect of exchange rate changes on cash | (203) | 290 | ||||||||||||
| Net change in cash | 443,571 | (52,176) | ||||||||||||
| Cash at beginning of period | 20,125 | 195,009 | ||||||||||||
| Cash at end of period | $ | 463,696 | $ | 142,833 | ||||||||||
6
Selected Financial Data
The following tables set forth net sales by reportable segment for each of the periods indicated.
| Three Months Ended | |||||||||||||||||||||||||||||||||||
| June 30, 2022 | June 30, 2021 | ||||||||||||||||||||||||||||||||||
| (In thousands) | Net Sales | Intersegment Net Sales | Net Sales from External Customers | Net Sales | Intersegment Net Sales | Net Sales from External Customers | |||||||||||||||||||||||||||||
| Pipe | $ | 524,857 | $ | (9,874) | $ | 514,983 | $ | 374,010 | $ | (1,903) | $ | 372,107 | |||||||||||||||||||||||
| Infiltrator Water Technologies | 166,290 | (28,906) | 137,384 | 126,742 | (19,037) | 107,705 | |||||||||||||||||||||||||||||
| International | |||||||||||||||||||||||||||||||||||
| International - Pipe | 53,419 | (5,859) | 47,560 | 50,838 | (2,914) | 47,924 | |||||||||||||||||||||||||||||
| International - Allied Products & Other | 18,095 | — | 18,095 | 14,528 | — | 14,528 | |||||||||||||||||||||||||||||
| Total International | 71,514 | (5,859) | 65,655 | 65,366 | (2,914) | 62,452 | |||||||||||||||||||||||||||||
| Allied Products & Other | 198,909 | (2,745) | 196,164 | 127,036 | — | 127,036 | |||||||||||||||||||||||||||||
| Intersegment Eliminations | (47,384) | 47,384 | — | (23,854) | 23,854 | — | |||||||||||||||||||||||||||||
| Total Consolidated | $ | 914,186 | $ | — | $ | 914,186 | $ | 669,300 | $ | — | $ | 669,300 | |||||||||||||||||||||||
Non-GAAP Financial Measures
This press release contains financial information determined by methods other than in accordance with accounting principles generally accepted in the United States of America (“GAAP”). ADS management uses non-GAAP measures in its analysis of the Company’s performance. Investors are encouraged to review the reconciliation of non-GAAP financial measures to the comparable GAAP results available in the accompanying tables.
Reconciliation of Non-GAAP Financial Measures
This press release includes references to organic results, Adjusted EBITDA and Free Cash Flow, non-GAAP financial measures. These non-GAAP financial measures are used in addition to and in conjunction with results presented in accordance with GAAP. These measures are not intended to be substitutes for those reported in accordance with GAAP. Adjusted EBITDA and Free Cash Flow may be different from non-GAAP financial measures used by other companies, even when similar terms are used to identify such measures.
EBITDA and Adjusted EBITDA are non-GAAP financial measures that comprise net income before interest, income taxes, depreciation and amortization, stock-based compensation, non-cash charges and certain other expenses. The Company’s definition of Adjusted EBITDA may differ from similar measures used by other companies, even when similar terms are used to identify such measures. Adjusted EBITDA is a key metric used by management and the Company’s board of directors to assess financial performance and evaluate the effectiveness of the Company’s business strategies. Accordingly, management believes that Adjusted EBITDA provides useful information to investors and others in understanding and evaluating our operating results in the same manner as the Company’s management and board of directors. In order to provide investors with a meaningful reconciliation, the Company has provided below reconciliations of Adjusted EBITDA to net income.
Free Cash Flow is a non-GAAP financial measure that comprises cash flow from operating activities less capital expenditures. Free Cash Flow is a measure used by management and the Company’s board of directors to assess the Company’s ability to generate cash. Accordingly, management believes that Free Cash Flow provides useful information to investors and others in understanding and evaluating our ability to generate cash flow from operations after capital expenditures. In order to provide investors with a meaningful reconciliation, the Company has provided below a reconciliation of cash flow from operating activities to Free Cash Flow.
The following tables present a reconciliation of EBITDA and Adjusted EBITDA to Net Income and Free Cash Flow to Cash Flow from Operating Activities, the most comparable GAAP measures, for each of the periods indicated.
7
Reconciliation of Segment Adjusted Gross Profit to Gross profit
| Three Months Ended June 30, | |||||||||||
| (Amounts in thousands) | 2022 | 2021 | |||||||||
| Segment adjusted gross profit | |||||||||||
| Pipe | $ | 168,579 | $ | 84,143 | |||||||
| Infiltrator Water Technologies | 75,794 | 59,402 | |||||||||
| International | 20,484 | 21,378 | |||||||||
| Allied Products & Other | 109,041 | 63,299 | |||||||||
| Intersegment Eliminations | (815) | (14) | |||||||||
| Total Segment Adjusted Gross Profit | 373,083 | 228,208 | |||||||||
| Depreciation and amortization | 20,302 | 17,532 | |||||||||
| ESOP and stock-based compensation expense | 674 | 9,555 | |||||||||
| Total Gross Profit | $ | 352,107 | $ | 201,121 | |||||||
Reconciliation of Adjusted EBITDA to Net Income
| Three Months Ended June 30, | |||||||||||
| (Amounts in thousands) | 2022 | 2021 | |||||||||
| Net income | $ | 188,482 | $ | 77,123 | |||||||
| Depreciation and amortization | 35,578 | 34,656 | |||||||||
| Interest expense | 11,072 | 7,907 | |||||||||
| Income tax expense | 55,065 | 26,455 | |||||||||
| EBITDA | 290,197 | 146,141 | |||||||||
Loss (gain) on disposal of assets and costs from exit and disposal activities | 303 | (11) | |||||||||
| Stock-based compensation expense | 6,273 | 6,651 | |||||||||
| ESOP compensation expense | — | 14,155 | |||||||||
| Transaction costs | 1,715 | 43 | |||||||||
Other adjustments(a) | 555 | (397) | |||||||||
| Adjusted EBITDA | $ | 299,043 | $ | 166,582 | |||||||
(a)Includes derivative fair value adjustments, foreign currency transaction (gains) losses, the proportionate share of interest, income taxes, depreciation and amortization related to the South American Joint Venture, which is accounted for under the equity method of accounting and executive retirement expense.
Reconciliation of Free Cash Flow to Cash flow from Operating Activities
| Three Months Ended June 30, | ||||||||||||||
| (Amounts in thousands) | 2022 | 2021 | ||||||||||||
| Net cash flow from operating activities | $ | 249,765 | $ | 104,348 | ||||||||||
| Capital expenditures | (36,189) | (25,546) | ||||||||||||
| Free cash flow | $ | 213,576 | $ | 78,802 | ||||||||||
8
Q1 Fiscal 2023 Financial Results August 4, 2022 Exhibit 99.2
Management Presenters 2 Scott Barbour President and Chief Executive Officer Scott Cottrill Executive Vice President, Chief Financial Officer Mike Higgins Vice President, Corporate Strategy & Investor Relations
Forward Looking Statements and Non-GAAP Financial Metrics 3 Forward Looking Statements Certain statements in this press release may be deemed to be forward-looking statements. These statements are not historical facts but rather are based on the Company’s current expectations, estimates and projections regarding the Company’s business, operations and other factors relating thereto. Words such as “may,” “will,” “could,” “would,” “should,” “anticipate,” “predict,” “potential,” “continue,” “expects,” “intends,” “plans,” “projects,” “believes,” “estimates,” “confident” and similar expressions are used to identify these forward-looking statements. Factors that could cause actual results to differ from those reflected in forward-looking statements relating to our operations and business include: fluctuations in the price and availability of resins and other raw materials and our ability to pass any increased costs of raw materials on to our customers in a timely manner; the risks related to the COVID-19 pandemic or other pandemics in the future; disruption or volatility in general business and economic conditions in the markets in which we operate; cyclicality and seasonality of the non-residential and residential construction markets and infrastructure spending; the risks of increasing competition in our existing and future markets; uncertainties surrounding the integration and realization of anticipated benefits of; the effect of weather or seasonality; the loss of any of our significant customers; the risks of doing business internationally; the risks of conducting a portion of our operations through joint ventures; our ability to expand into new geographic or product markets; the risk associated with manufacturing processes; the effect of global climate change; cybersecurity risks; our ability to manage our supply purchasing and customer credit policies; our ability to control labor costs and to attract, train and retain highly-qualified employees and key personnel; our ability to protect our intellectual property rights; changes in laws and regulations, including environmental laws and regulations; the risks associated with our current levels of indebtedness, including borrowings under our existing credit agreement and outstanding indebtedness under our existing senior notes; and other risks and uncertainties described in the Company’s filings with the SEC. New risks and uncertainties emerge from time to time and it is not possible for the Company to predict all risks and uncertainties that could have an impact on the forward- looking statements contained in this press release. In light of the significant uncertainties inherent in the forward-looking information included herein, the inclusion of such information should not be regarded as a representation by the Company or any other person that the Company’s expectations, objectives or plans will be achieved in the timeframe anticipated or at all. Investors are cautioned not to place undue reliance on the Company’s forward-looking statements and the Company undertakes no obligation to publicly update or revise any forward-looking statements, whether as a result of new information, future events or otherwise, except as required by law. Non-GAAP Financial Measures This presentation includes references to Adjusted EBITDA and Free Cash Flow, non-GAAP financial measures. These non-GAAP financial measures are used in addition to and in conjunction with results presented in accordance with GAAP. These measures are not intended to be substitutes for those reported in accordance with GAAP. Adjusted EBITDA and Free Cash Flow may be different from non-GAAP financial measures used by other companies, even when similar terms are used to identify such measures. EBITDA and Adjusted EBITDA are non-GAAP financial measures that comprise net income before interest, income taxes, depreciation and amortization, stock-based compensation, non-cash charges and certain other expenses. The Company’s definition of Adjusted EBITDA may differ from similar measures used by other companies, even when similar terms are used to identify such measures. Adjusted EBITDA is a key metric used by management and the Company’s board of directors to assess financial performance and evaluate the effectiveness of the Company’s business strategies. Accordingly, management believes that Adjusted EBITDA provides useful information to investors and others in understanding and evaluating our operating results in the same manner as the Company’s management and board of directors. In order to provide investors with a meaningful reconciliation, the Company has provided below reconciliations of Adjusted EBITDA to net income. Free Cash Flow is a non-GAAP financial measure that comprises cash flow from operating activities less capital expenditures. Free Cash Flow is a measure used by management and the Company’s board of directors to assess the Company’s ability to generate cash. Accordingly, management believes that Free Cash Flow provides useful information to investors and others in understanding and evaluating our ability to generate cash flow from operations after capital expenditures.
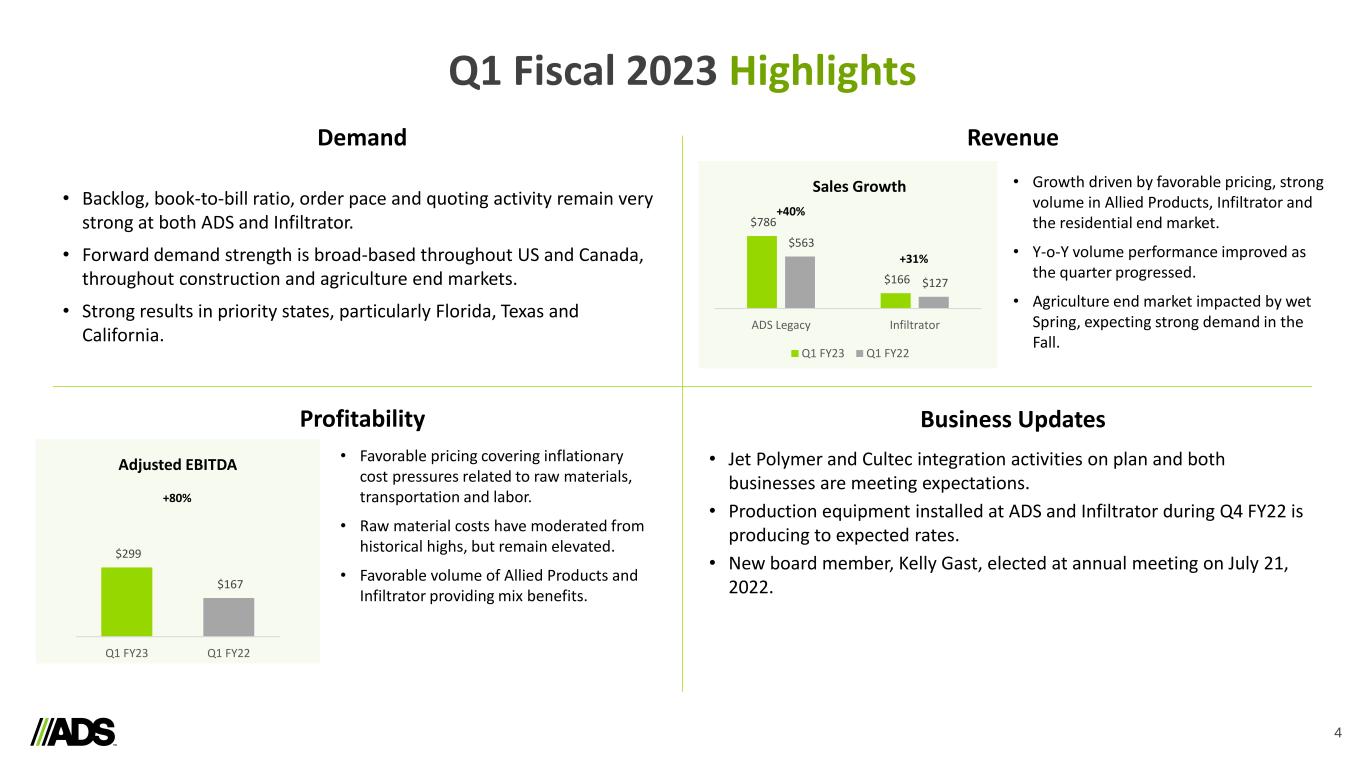
Q1 Fiscal 2023 Highlights 4 $786 $166 $563 $127 ADS Legacy Infiltrator Q1 FY23 Q1 FY22 Sales Growth +40% +31% Demand Revenue Business UpdatesProfitability $299 $167 Q1 FY23 Q1 FY22 Adjusted EBITDA +80% • Favorable pricing covering inflationary cost pressures related to raw materials, transportation and labor. • Raw material costs have moderated from historical highs, but remain elevated. • Favorable volume of Allied Products and Infiltrator providing mix benefits. • Backlog, book-to-bill ratio, order pace and quoting activity remain very strong at both ADS and Infiltrator. • Forward demand strength is broad-based throughout US and Canada, throughout construction and agriculture end markets. • Strong results in priority states, particularly Florida, Texas and California. • Jet Polymer and Cultec integration activities on plan and both businesses are meeting expectations. • Production equipment installed at ADS and Infiltrator during Q4 FY22 is producing to expected rates. • New board member, Kelly Gast, elected at annual meeting on July 21, 2022. • Growth driven by favorable pricing, strong volume in Allied Products, Infiltrator and the residential end market. • Y-o-Y volume performance improved as the quarter progressed. • Agriculture end market impacted by wet Spring, expecting strong demand in the Fall.
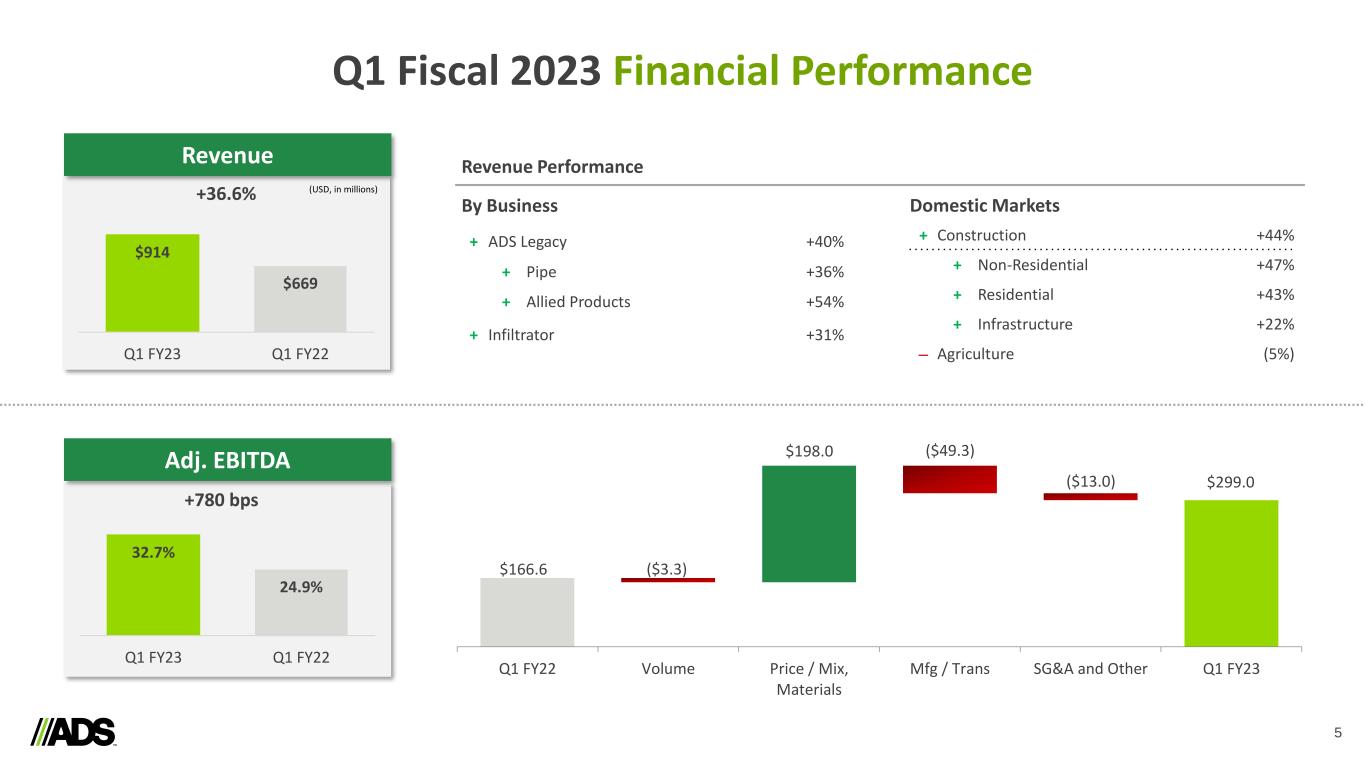
Q1 Fiscal 2023 Financial Performance 5 32.7% 24.9% Q1 FY23 Q1 FY22 $914 $669 Q1 FY23 Q1 FY22 +780 bps (USD, in millions)+36.6% Domestic Markets + Construction +44% + Non-Residential +47% + Residential +43% + Infrastructure +22% ‒ Agriculture (5%) Revenue Performance By Business + ADS Legacy +40% + Pipe +36% + Allied Products +54% + Infiltrator +31% Q1 FY22 Volume Price / Mix, Materials Mfg / Trans SG&A and Other Q1 FY23 $166.6 ($3.3) $198.0 ($13.0) $299.0 Revenue Adj. EBITDA ($49.3)
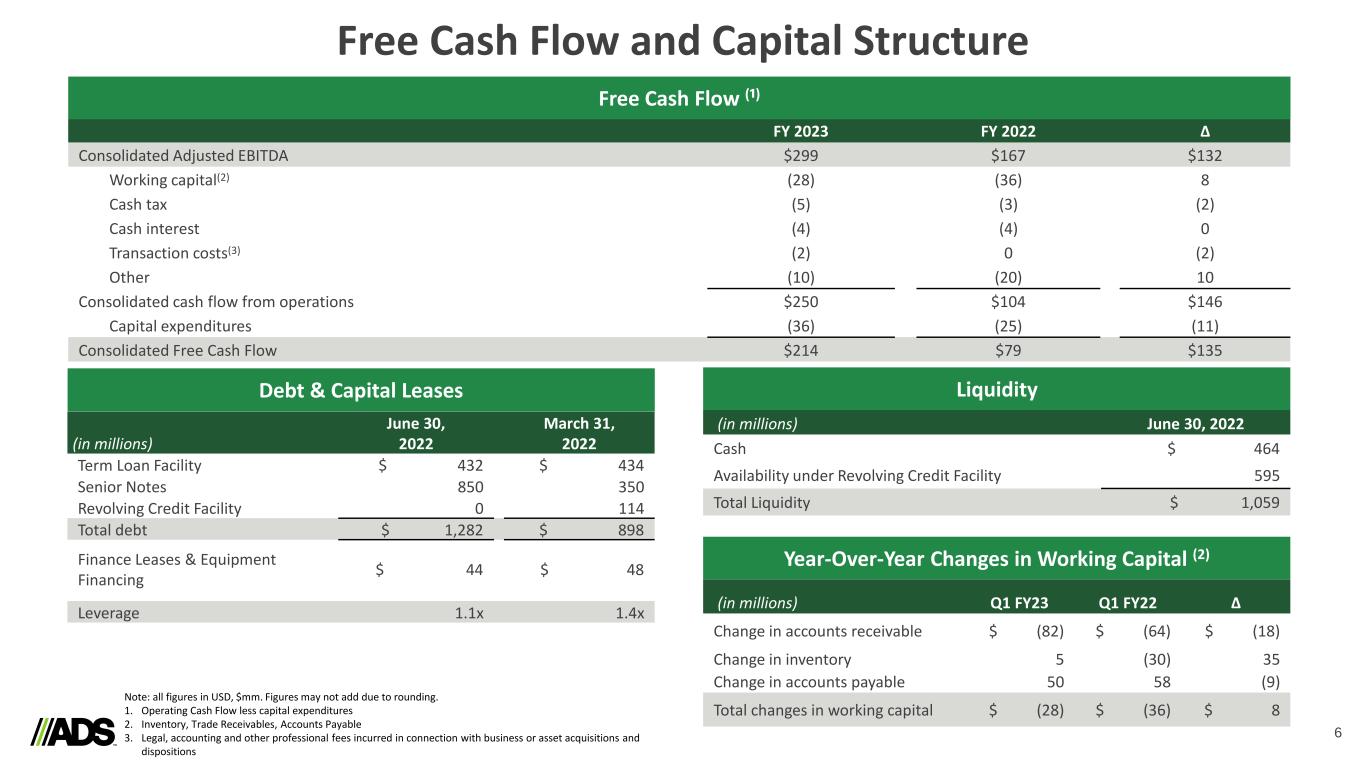
Free Cash Flow and Capital Structure 6 FY 2023 FY 2022 ∆ Consolidated Adjusted EBITDA $299 $167 $132 Working capital(2) (28) (36) 8 Cash tax (5) (3) (2) Cash interest (4) (4) 0 Transaction costs(3) (2) 0 (2) Other (10) (20) 10 Consolidated cash flow from operations $250 $104 $146 Capital expenditures (36) (25) (11) Consolidated Free Cash Flow $214 $79 $135 Free Cash Flow (¹) Note: all figures in USD, $mm. Figures may not add due to rounding. 1. Operating Cash Flow less capital expenditures 2. Inventory, Trade Receivables, Accounts Payable 3. Legal, accounting and other professional fees incurred in connection with business or asset acquisitions and dispositions (in millions) June 30, 2022 March 31, 2022 Term Loan Facility $ 432 $ 434 Senior Notes 850 350 Revolving Credit Facility 0 114 Total debt $ 1,282 $ 898 Finance Leases & Equipment Financing $ 44 $ 48 Leverage 1.1x 1.4x Debt & Capital Leases (in millions) June 30, 2022 Cash $ 464 Availability under Revolving Credit Facility 595 Total Liquidity $ 1,059 Liquidity (in millions) Q1 FY23 Q1 FY22 ∆ Change in accounts receivable $ (82) $ (64) $ (18) Change in inventory 5 (30) 35 Change in accounts payable 50 58 (9) Total changes in working capital $ (28) $ (36) $ 8 Year-Over-Year Changes in Working Capital (2)
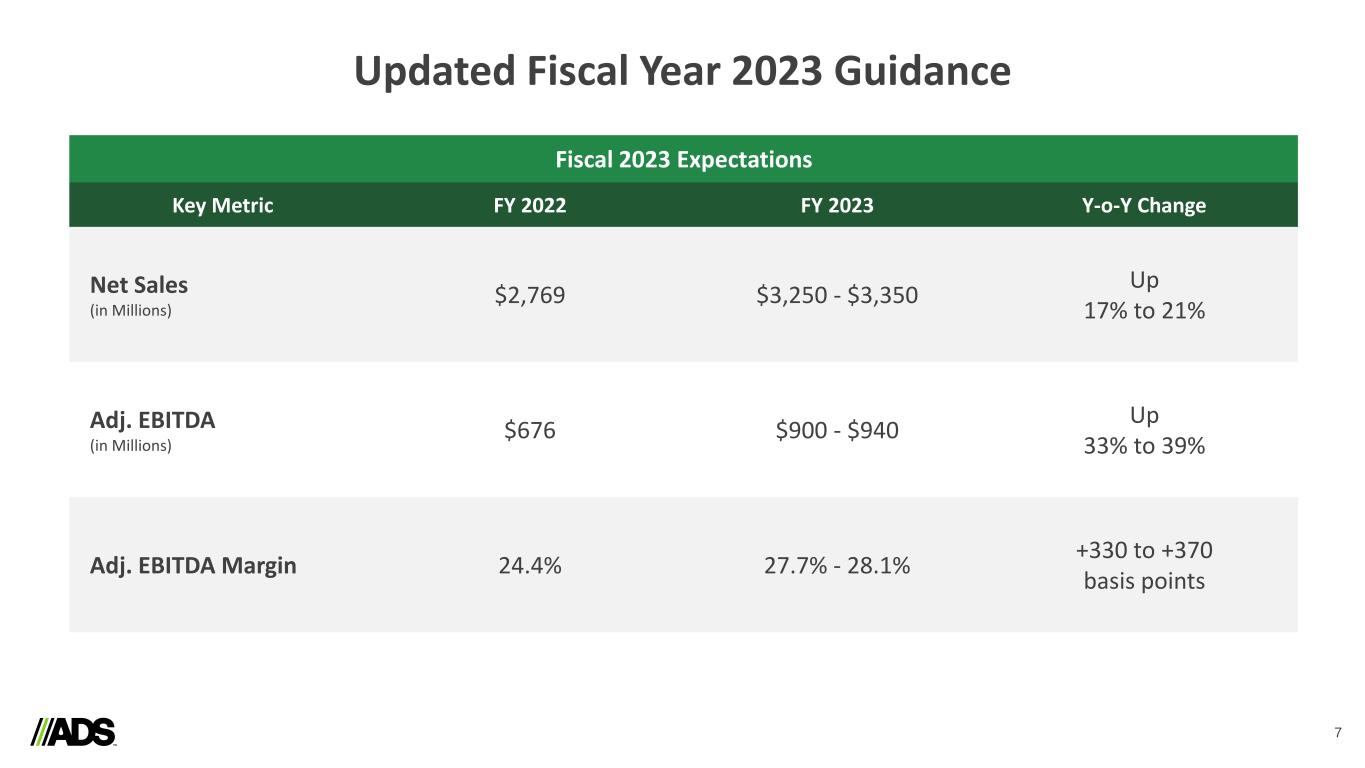
Updated Fiscal Year 2023 Guidance 7 Key Metric FY 2022 FY 2023 Y-o-Y Change Net Sales (in Millions) $2,769 $3,250 - $3,350 Up 17% to 21% Adj. EBITDA (in Millions) $676 $900 - $940 Up 33% to 39% Adj. EBITDA Margin 24.4% 27.7% - 28.1% +330 to +370 basis points Fiscal 2023 Expectations

Q&A

Appendix 9
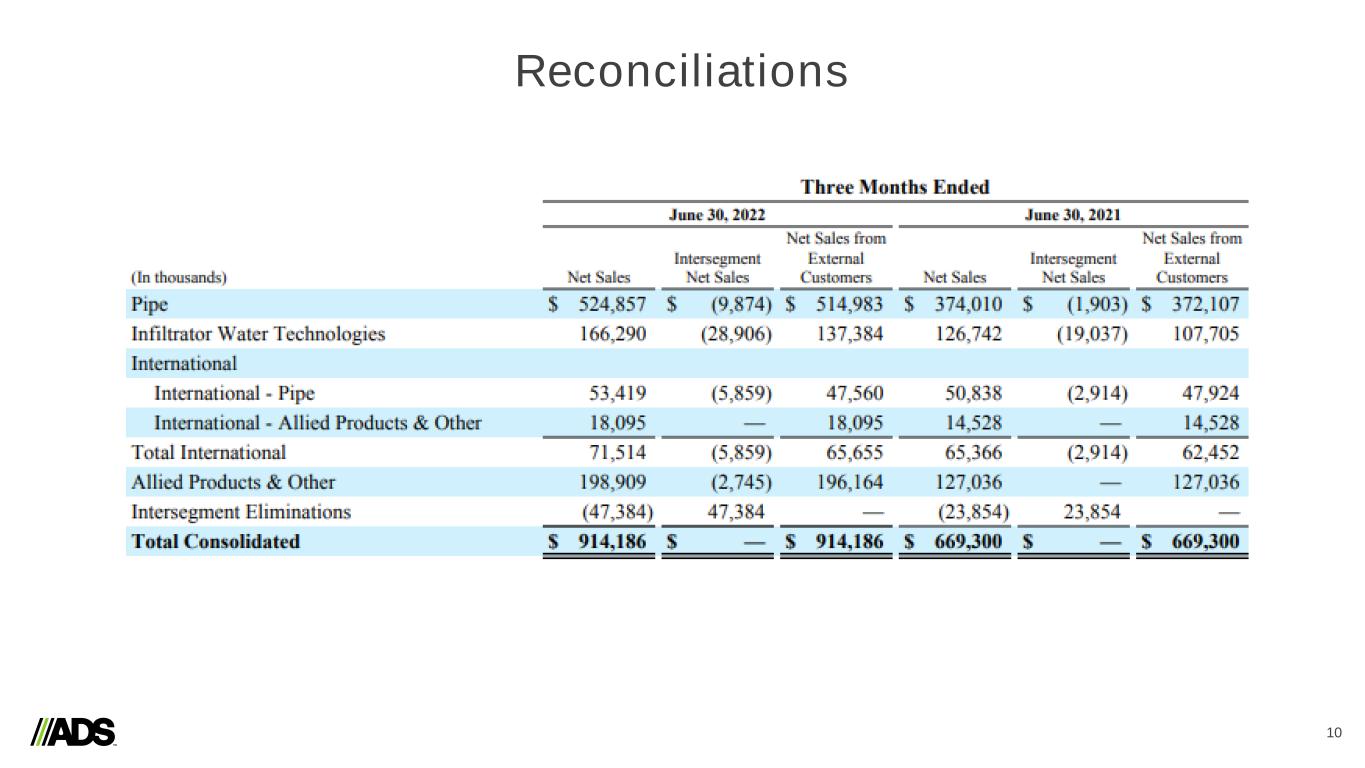
Reconciliations 10
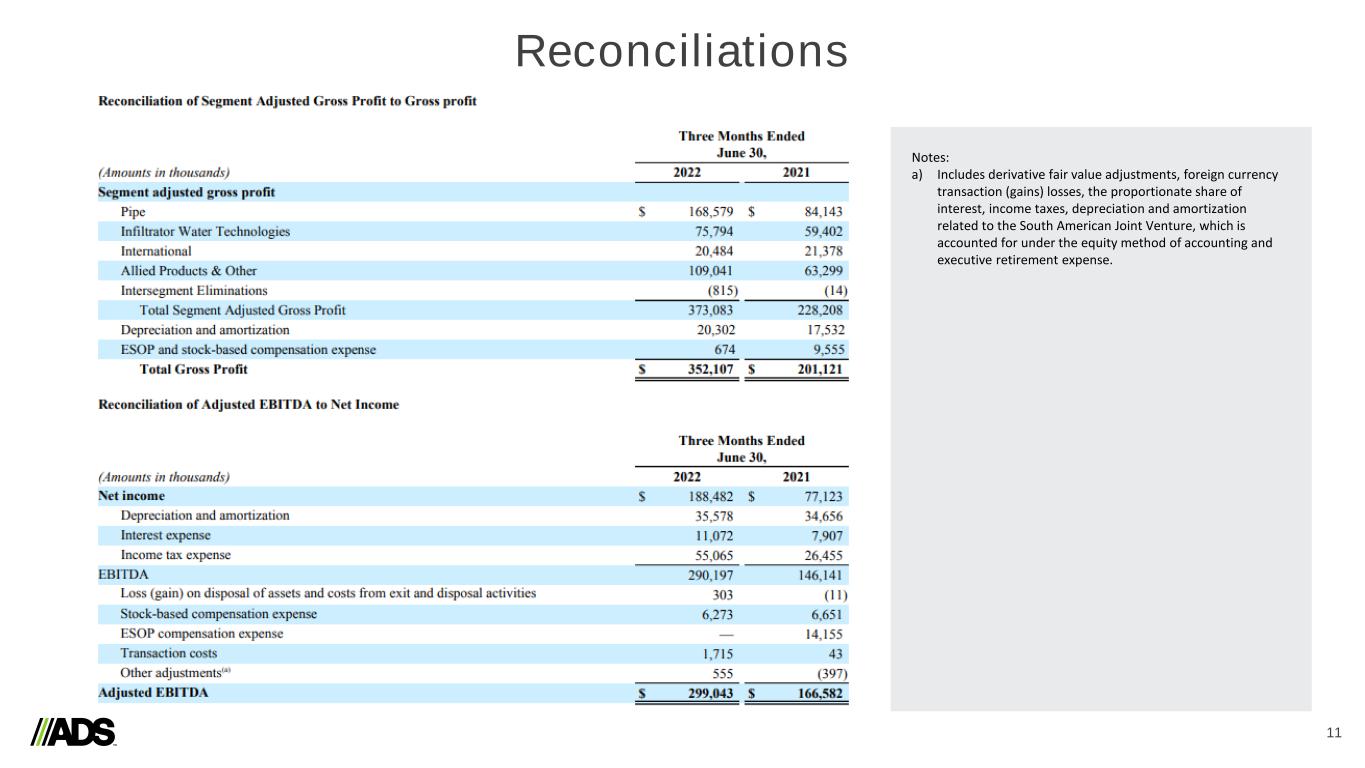
Reconciliations 11 Notes: a) Includes derivative fair value adjustments, foreign currency transaction (gains) losses, the proportionate share of interest, income taxes, depreciation and amortization related to the South American Joint Venture, which is accounted for under the equity method of accounting and executive retirement expense.
Exhibit 99.3
ADVANCED DRAINAGE SYSTEMS ANNOUNCES QUARTERLY CASH DIVIDEND
HILLIARD, Ohio – (August 4, 2022) – Advanced Drainage Systems, Inc. (NYSE: WMS) (“ADS” or the “Company”), a leading provider of innovative water management solutions in the stormwater and on-site septic waste water industries, today announced that its Board of Directors (the “Board”) has approved a quarterly cash dividend to its shareholders in the amount of $0.12 per share, a 9% increase over the prior year dividend amount.
Scott Barbour, President and Chief Executive Officer of Advanced Drainage Systems commented, “Today’s dividend announcement is predicated on the strength of our balance sheet, formidable cash generation, and ongoing commitment to returning capital to shareholders. Our strong financial performance and operational excellence initiatives provide us with the confidence and financial flexibility to return excess cash to our shareholders while simultaneously continuing to strategically invest in our business.”
The quarterly cash dividend of $0.12 per share will be paid on September 15, 2022, to shareholders of record at the close of business on September 1, 2022.
About the Company
Advanced Drainage Systems is a leading manufacturer of innovative stormwater and onsite septic wastewater solutions that manages the world’s most precious resource: water. ADS provides superior drainage solutions for use in a wide variety of markets and applications including commercial, residential, infrastructure and agriculture. ADS delivers tremendous service to its customers with the industry’s largest company-owned fleet, an expansive sales team, and a vast manufacturing network of approximately 70 manufacturing plants and 38 distribution centers. ADS is the largest plastic recycling company in North America, ensuring over half a billion pounds of plastic is kept out of landfills every year. Founded in 1966, ADS’ water management solutions are designed to last for decades. To learn more, visit the Company’s website at www.adspipe.com.
Forward Looking Statements
Certain statements in this press release may be deemed to be forward-looking statements. These statements are not historical facts but rather are based on the Company’s current expectations, estimates and projections regarding the Company’s business, operations and other factors relating thereto. Words such as “may,” “will,” “could,” “would,” “should,” “anticipate,” “predict,” “potential,” “continue,” “expects,” “intends,” “plans,” “projects,” “believes,” “estimates,” “confident” and similar expressions are used to identify these forward-looking statements. Factors that could cause actual results to differ from those reflected in forward-looking statements relating to our operations and business include: fluctuations in the price and availability of resins and other raw materials and our ability to pass any increased costs of raw materials on to our customers in a timely manner; the risks related to the COVID-19 pandemic or other pandemics in the future; disruption or volatility in general business and economic conditions in the markets in which we operate; cyclicality and seasonality of the non-residential and residential construction markets and infrastructure spending; the risks of increasing competition in our existing and future markets; uncertainties surrounding the integration and realization of anticipated benefits of; the effect of weather or seasonality; the loss of any of our significant customers; the risks of doing business internationally; the risks of conducting a portion of our operations through joint ventures; our ability to expand into new geographic or product markets; the risk associated with manufacturing processes; the effect of global climate change; cybersecurity risks; our ability to manage our supply purchasing and customer credit policies; our ability to control labor costs and to attract, train and retain highly-qualified employees and key personnel; our ability to protect our intellectual property rights; changes in laws and regulations, including environmental laws and regulations; the risks associated with our current levels of indebtedness, including borrowings under our existing credit agreement and outstanding indebtedness under our existing senior notes; and other risks and uncertainties described in the Company’s filings with the SEC. New risks and uncertainties emerge from time to time and it is not possible for the Company to predict all risks and uncertainties that could have an impact on the forward-looking statements contained in this press release. In light of the significant uncertainties inherent in the forward-looking information included herein, the inclusion of such information should not be regarded as a representation by the Company or any other person that the Company’s expectations, objectives or plans will be achieved in the timeframe anticipated or at all. Investors are cautioned not to place undue reliance on the Company’s forward-looking statements and the Company undertakes no obligation to publicly update or revise any forward-looking statements, whether as a result of new information, future events or otherwise, except as required by law.
For more information, please contact:
Michael Higgins
VP, Corporate Strategy & Investor Relations
(614) 658-0050