
ZG 8-K
Zillow Group, Inc. (ZG)
8-K
2020-05-07
For: 2020-05-07
View Original
Added on
April 08, 2026
UNITED STATES
SECURITIES AND EXCHANGE COMMISSION
Washington, D.C. 20549
FORM 8-K
CURRENT REPORT
Pursuant to Section 13 or 15(d)
of the Securities Exchange Act of 1934
Date of Report (Date of Earliest Event Reported): May 7, 2020
(Exact name of registrant as specified in its charter)
| (State or other jurisdiction of incorporation) | (Commission File Number) | (I.R.S. Employer Identification No.) | ||||||||||||
| (Address of principal executive offices) | (Zip Code) | |||||||||||||
(206 ) 470-7000
(Registrant’s telephone number, including area code)
Check the appropriate box below if the Form 8-K filing is intended to simultaneously satisfy the filing obligation of the registrant under any of the following provisions: | |||||
| Written communications pursuant to Rule 425 under the Securities Act (17 CFR 230.425) | |||||
| Soliciting material pursuant to Rule 14a-12 under the Exchange Act (17 CFR 240.14a-12) | |||||
| Pre-commencement communications pursuant to Rule 14d-2(b) under the Exchange Act (17 CFR 240.14d-2(b)) | |||||
| Pre-commencement communications pursuant to Rule 13e-4(c) under the Exchange Act (17 CFR 240.13e-4(c)) | |||||
Securities registered pursuant to Section 12(b) of the Act:
| Title of each class | Trading Symbol(s) | Name of each exchange on which registered | ||||||
Indicate by check mark whether the registrant is an emerging growth company as defined in Rule 405 of the Securities Act of 1933 (§230.405 of this chapter) or Rule 12b-2 of the Securities Exchange Act of 1934 (§240.12b-2 of this chapter).
Emerging growth company ☐
If an emerging growth company, indicate by check mark if the registrant has elected not to use the extended transition period for complying with any new or revised financial accounting standards provided pursuant to Section 13(a) of the Exchange Act. ☐
| Item 2.02 | Results of Operations and Financial Condition. | ||||
Zillow Group, Inc. (“Zillow Group”) today issued a press release and a shareholder letter announcing its financial results for the fiscal quarter ended March 31, 2020. The full text of the press release issued in connection with the announcement is furnished as Exhibit 99.1, accompanying supporting tables as Exhibit 99.2 and the shareholder letter as Exhibit 99.3 to this Current Report on Form 8-K.
The information in this Item 2.02 and Exhibits 99.1, 99.2 and 99.3 of this Current Report on Form 8-K shall not be deemed to be “filed” for purposes of Section 18 of the Securities Exchange Act of 1934, as amended (the “Exchange Act”), or otherwise subject to the liabilities of that section, nor shall it be deemed incorporated by reference into any filing under the Securities Act of 1933, as amended, or the Exchange Act, except as expressly set forth by specific reference in such a filing.
| Item 9.01 | Financial Statements and Exhibits. | ||||
(d) Exhibits.
| Exhibit Number | Description | |||||||
| 99.1 | ||||||||
| 99.2 | ||||||||
| 99.3 | ||||||||
| 104 | Cover Page Interactive Data File (embedded within the Inline XBRL document). | |||||||
SIGNATURES
Pursuant to the requirements of the Securities Exchange Act of 1934, the registrant has duly caused this report to be signed on its behalf by the undersigned hereunto duly authorized.
| Dated: May 7, 2020 | ZILLOW GROUP, INC. | ||||||||||
| By: | /s/ JENNIFER ROCK | ||||||||||
| Name: | Jennifer Rock | ||||||||||
| Title: | Chief Accounting Officer | ||||||||||
Exhibit 99.1

| Contacts: | ||
| Brad Berning | ||
| Investor Relations | ||
| [email protected] | ||
| Emily Heffter | ||
| Public Relations | ||
| [email protected] | ||
Zillow Group Reports First Quarter 2020 Financial Results
Q1 results met or exceeded pre-COVID-19 outlook;
Customer signals show real estate’s resiliency as people still shopping and moving
SEATTLE – May 7, 2020 – Zillow Group, Inc. (NASDAQ:Z) (NASDAQ:ZG), which is transforming the way people buy, sell, rent and finance homes, today announced its consolidated financial results for the three months ended March 31, 2020. The company’s consolidated quarterly revenue grew by 148% year over year, driven by increasing Zillow Offers sales velocity and strong performance in the Premier Agent business, despite headwinds in March because of the coronavirus pandemic.
Complete financial results and outlook for the second quarter of 2020 can be found in our shareholder letter and in the investor relations section of Zillow Group’s website at https://investors.zillowgroup.com/investors/financials/quarterly-results/default.aspx.
“During Q1, we learned the true value of home. We also learned real estate is resilient as we’re seeing clear signals that people are still shopping for homes and want to move,” said Rich Barton, CEO and co-founder of Zillow Group. “Our Q1 results met or beat our outlook on all measures despite some volatility in the second half of March. We started the year strong, coming off a solid 2019 and ended the first quarter with an even stronger balance sheet, including a record cash balance. There is light on the horizon, and we’re well positioned to move faster to the future, offering our customers and partners innovative products and services, such as our proprietary 3D Home Tours, to enable seamless and safe transactions in a more virtual world. The virtual tools home shoppers need for safety today will become their expectations for convenience tomorrow.”
First quarter 2020 highlights include:
•Total consolidated revenue grew 148% year over year to $1.1 billion.
•Segment loss before income taxes was $41.5 million, $98 million and $13.1 million for the IMT, Homes and Mortgages segments, respectively.
•Adjusted EBITDA beat company expectations for all three segments.
•The company exited the quarter with a strong balance sheet, growing cash and investments to $2.6 billion from $2.4 billion as of the end of 2019.
•Premier Agent year-over-year revenue growth accelerated to 11% from 6% in Q4 2019 driven by strategy execution to connect our customers with high-performing partners.
•Homes segment revenue and Adjusted EBITDA outperformed company expectations significantly, delivering nearly $770 million in revenue. The company achieved the highest sales velocity since Zillow Offers launched.*
•During the quarter, the company sold 2,394 homes and purchased 1,479 homes through Zillow Offers, ending Q1 with 1,791 homes in inventory, intentionally down from 2,707 homes at the end of the fourth quarter.
•Traffic to Zillow Group’s mobile apps and websites reached 192.5 million average monthly unique users, an increase of 6% year over year, driving 2.1 billion visits during the quarter.
*Monthly sales velocity is calculated by dividing the number of homes sold in a given calendar month by the number of homes held in inventory as of the beginning of such calendar month. Quarterly sales velocity is calculated by averaging the monthly sales velocities during a given quarter.
First Quarter 2020 Financial Highlights
The following table sets forth Zillow Group’s financial highlights for the periods presented (in thousands, unaudited):
| Three Months Ended March 31, | 2019 to 2020 % Change | ||||||||||||||||
| 2020 | 2019 | ||||||||||||||||
| Revenue: | |||||||||||||||||
| Homes segment: | |||||||||||||||||
Zillow Offers | $ | 769,112 | $ | 128,472 | 499% | ||||||||||||
Other (1) | 761 | — | N/A | ||||||||||||||
| Total Homes segment revenue | 769,873 | 128,472 | 499% | ||||||||||||||
| IMT segment: | |||||||||||||||||
Premier Agent | 242,106 | 217,735 | 11% | ||||||||||||||
Other (2) | 88,560 | 80,537 | 10% | ||||||||||||||
| Total IMT segment revenue | 330,666 | 298,272 | 11% | ||||||||||||||
| Mortgages segment | 25,282 | 27,360 | (8)% | ||||||||||||||
| Total revenue | $ | 1,125,821 | $ | 454,104 | 148% | ||||||||||||
| Other Financial Data: | |||||||||||||||||
| Segment loss before income taxes: | |||||||||||||||||
Homes segment | $ | (97,958) | $ | (45,205) | |||||||||||||
IMT segment | (41,507) | (11,452) | |||||||||||||||
Mortgages segment | (13,145) | (9,616) | |||||||||||||||
| Total segment loss before income taxes | $ | (152,610) | $ | (66,273) | |||||||||||||
| Net loss | $ | (163,273) | $ | (67,525) | |||||||||||||
| Adjusted EBITDA (3): | |||||||||||||||||
Homes segment | $ | (74,995) | $ | (34,524) | |||||||||||||
IMT segment | 85,717 | 61,047 | |||||||||||||||
Mortgages segment | (5,603) | (2,601) | |||||||||||||||
| Total Adjusted EBITDA | $ | 5,119 | $ | 23,922 | |||||||||||||
| Percentage of Revenue: | |||||||||||||||||
| Segment loss before income taxes: | |||||||||||||||||
Homes segment | (13) | % | (35) | % | |||||||||||||
IMT segment | (13) | % | (4) | % | |||||||||||||
Mortgages segment | (52) | % | (35) | % | |||||||||||||
| Total segment loss before income taxes | (14) | % | (15) | % | |||||||||||||
| Net loss | (15) | % | (15) | % | |||||||||||||
| Adjusted EBITDA: | |||||||||||||||||
Homes segment | (10) | % | (27) | % | |||||||||||||
IMT segment | 26 | % | 20 | % | |||||||||||||
Mortgages segment | (22) | % | (10) | % | |||||||||||||
| Total Adjusted EBITDA | — | % | 5 | % | |||||||||||||
(1) Other Homes segment revenue includes revenue generated through Zillow Closing Services. (2) Other IMT segment revenue includes revenue generated by rentals, new construction and display, as well as revenue from the sale of various other marketing and business products and services to real estate professionals. (3) Adjusted EBITDA is a non-GAAP financial measure; it is not calculated or presented in accordance with U.S. generally accepted accounting principles, or GAAP. See below for more information regarding our presentation of Adjusted EBITDA, including a reconciliation of Adjusted EBITDA to the most directly comparable GAAP financial measure, which is net loss on a consolidated basis and loss before income taxes for each segment, for each of the periods presented. | |||||||||||||||||
Conference Call and Webcast Information
Zillow Group CEO & co-founder Rich Barton and CFO Allen Parker will host a live conference call and webcast to discuss the results today at 2 p.m. Pacific Time (5 p.m. Eastern Time). A Shareholder Letter is available on the Quarterly Results section of Zillow Group’s investor relations website at https://investors.zillowgroup.com/financials/quarterly-results/default.aspx prior to the live conference call and webcast.
A link to the live webcast and recorded replay of the conference call will be available on the investor relations section of Zillow Group’s website. The live call may also be accessed via telephone at (866) 324-3683 toll-free domestically and at (509) 844-0959 internationally. The conference ID number is 9294903 and can be used for both domestic and international callers.
Forward-Looking Statements
This press release contains forward-looking statements within the meaning of Section 27A of the Securities Act of 1933 and Section 21E of the Securities Exchange Act of 1934 that involve risks and uncertainties, including, without limitation, statements regarding our business outlook for 2020; the future performance and operation of the Homes, Mortgages and IMT segments in 2020 and beyond; and the current and future health and stability of the residential housing market and economy. Statements containing words such as “may,” “believe,” “anticipate,” “expect,” “intend,” “plan,” “project,” “predict,” “will,” “projections,” “continue,” “estimate,” “outlook,” “guidance,” or similar expressions constitute forward-looking statements. Forward-looking statements are made based on assumptions as of May 7, 2020, and although we believe the expectations reflected in the forward-looking statements are reasonable, we cannot guarantee these results. Differences in Zillow Group’s actual results from those described in these forward-looking statements may result from actions taken by Zillow Group as well as from risks and uncertainties beyond Zillow Group’s control. Factors that may contribute to such differences include, but are not limited to, the impact of the novel coronavirus (“COVID-19”) pandemic and any associated economic downturn on Zillow Group’s future financial position, operations and financial performance; the magnitude, duration and severity of the COVID-19 pandemic; the current and future health and stability of the economy and residential housing market, including any extended slowdown in the real estate markets as a result of COVID-19; Zillow Group’s ability to execute on strategy; Zillow Group’s ability to maintain and effectively manage an adequate rate of growth; Zillow Group’s ability to innovate and provide products and services that are attractive to its users and advertisers; Zillow Group’s investment of resources to pursue strategies that may not prove effective; Zillow Group’s ability to compete successfully against existing or future competitors; the impact of pending legal proceedings described in Zillow Group’s filings with the Securities and Exchange Commission, or SEC; Zillow Group’s ability to successfully integrate and realize the benefits of its past or future strategic acquisitions or investments; Zillow Group’s ability to maintain or establish relationships with listings and data providers; the reliable performance of Zillow Group’s network infrastructure and content delivery processes; Zillow Group’s ability to obtain or maintain licenses and permits to support our current and future businesses; actual or anticipated changes to our products and services; and Zillow Group’s ability to protect its intellectual property. The foregoing list of risks and uncertainties is illustrative but not exhaustive. For more information about potential factors that could affect Zillow Group’s business and financial results, please review the “Risk Factors” described in Zillow Group’s Annual Report on Form 10-K for the year ended December 31, 2019 and in Zillow Group’s Quarterly Report on Form 10-Q for the three months ended March 31, 2020 filed with the SEC and in Zillow Group’s other filings with the SEC. Except as may be required by law, Zillow Group does not intend and undertakes no duty to update this information to reflect future events or circumstances.
Use of Non-GAAP Financial Measures
To provide investors with additional information regarding our financial results, this press release includes references to Adjusted EBITDA in total and for each segment, each a non-GAAP financial measure. We have provided a reconciliation within this earnings release of Adjusted EBITDA in total to net loss and Adjusted EBITDA by segment to loss before income taxes for each segment, the most directly comparable GAAP financial measures.
Adjusted EBITDA is a key metric used by our management and board of directors to measure operating performance and trends and to prepare and approve our annual budget. In particular, the exclusion of certain expenses in calculating Adjusted EBITDA facilitates operating performance comparisons on a period-to-period basis.
Our use of Adjusted EBITDA in total and for each segment has limitations as an analytical tool, and you should not consider these measures in isolation or as a substitute for analysis of our results as reported under GAAP. Some of these limitations are:
▪Adjusted EBITDA does not reflect our cash expenditures or future requirements for capital expenditures or contractual commitments;
▪Adjusted EBITDA does not reflect changes in, or cash requirements for, our working capital needs;
▪Adjusted EBITDA does not consider the potentially dilutive impact of share-based compensation;
▪Although depreciation and amortization are non-cash charges, the assets being depreciated and amortized may have to be replaced in the future, and Adjusted EBITDA does not reflect cash capital expenditure requirements for such replacements or for new capital expenditure requirements;
▪Adjusted EBITDA does not reflect impairment costs;
▪Adjusted EBITDA does not reflect interest expense or other income;
▪Adjusted EBITDA does not reflect income taxes; and
▪Other companies, including companies in our own industry, may calculate Adjusted EBITDA differently than we do, limiting its usefulness as a comparative measure.
Because of these limitations, you should consider Adjusted EBITDA in total and for each segment alongside other financial performance measures, including various cash flow metrics, net loss, loss before income taxes for each segment and our other GAAP results.
About Zillow Group, Inc.
Zillow Group, Inc. (NASDAQ:Z) (NASDAQ:ZG), the largest portfolio of real estate brands on mobile and the web that attracted 192.5 million average monthly unique users during the first quarter of 2020, is building an on-demand real estate experience. Whether selling, buying, renting or financing, customers can turn to the businesses of its flagship brand, Zillow®, to find and get into their next home with speed, certainty and ease.
In addition to Zillow’s for-sale and rental listings, Zillow Offers™ buys and sells homes directly in dozens of markets across the country, allowing sellers control over their timeline. Zillow Closing Services now offers title and escrow services as another important step to unify the real estate transaction. Zillow Home Loans, our affiliate lender, provides our customers with an easy option to get pre-approved and secure financing for their next home purchase.
Other consumer brands include Trulia®, StreetEasy®, HotPads®, Naked Apartments® and Out East®. In addition, Zillow Group provides a comprehensive suite of marketing software and technology solutions which include Mortech®, dotloop®, Bridge Interactive® and New Home Feed®. The company is headquartered in Seattle, Washington.
Please visit http://investors.zillowgroup.com, www.zillowgroup.com/ir-blog, and www.twitter.com/zillowgroup, where Zillow Group discloses information about the company, its financial information, and its business which may be deemed material.
The Zillow Group logo is available at http://zillowgroup.mediaroom.com/logos-photos.
Zillow, Premier Agent, Mortech, Bridge Interactive, StreetEasy, HotPads, Out East and New Home Feed are registered trademarks of Zillow, Inc. Zillow Offers is a trademark of Zillow, Inc. Trulia is a registered trademark of Trulia, LLC. dotloop is a registered trademark of DotLoop, LLC. Naked Apartments is a registered trademark of Naked Apartments, LLC. Zillow Home Loans, LLC is an Equal Housing Lender; NMLS #10287.
(ZFIN)
Adjusted EBITDA
The following tables set forth a reconciliation of Adjusted EBITDA to the most directly comparable GAAP financial measure, which is net loss on a consolidated basis and loss before income taxes for each segment, for each of the periods presented (in thousands, unaudited):
| Three Months Ended March 31, 2020 | |||||||||||||||||||||||||||||
| Homes | IMT | Mortgages | Corporate Items (2) | Consolidated | |||||||||||||||||||||||||
| Reconciliation of Adjusted EBITDA to Net Loss and Loss Before Income Taxes: | |||||||||||||||||||||||||||||
| Net loss (1) | N/A | N/A | N/A | N/A | $ | (163,273) | |||||||||||||||||||||||
| Income tax benefit | N/A | N/A | N/A | N/A | (9,228) | ||||||||||||||||||||||||
| Loss before income taxes | $ | (97,958) | $ | (41,507) | $ | (13,145) | $ | (19,891) | $ | (172,501) | |||||||||||||||||||
| Other income | — | — | (202) | (9,391) | (9,593) | ||||||||||||||||||||||||
| Depreciation and amortization expense | 3,575 | 23,777 | 1,674 | — | 29,026 | ||||||||||||||||||||||||
| Share-based compensation expense | 11,304 | 29,547 | 2,944 | — | 43,795 | ||||||||||||||||||||||||
| Impairment costs | — | 73,900 | 2,900 | — | 76,800 | ||||||||||||||||||||||||
| Interest expense | 8,084 | — | 226 | 29,282 | 37,592 | ||||||||||||||||||||||||
| Adjusted EBITDA | $ | (74,995) | $ | 85,717 | $ | (5,603) | $ | — | $ | 5,119 | |||||||||||||||||||
| Three Months Ended March 31, 2019 | |||||||||||||||||||||||||||||
| Homes | IMT | Mortgages | Corporate Items (2) | Consolidated | |||||||||||||||||||||||||
| Reconciliation of Adjusted EBITDA to Net Loss and Loss Before Income Taxes: | |||||||||||||||||||||||||||||
| Net loss (1) | N/A | N/A | N/A | N/A | $ | (67,525) | |||||||||||||||||||||||
| Income tax benefit | N/A | N/A | N/A | N/A | (2,500) | ||||||||||||||||||||||||
| Loss before income taxes | $ | (45,205) | $ | (11,452) | $ | (9,616) | $ | (3,752) | $ | (70,025) | |||||||||||||||||||
| Other income | — | — | (313) | (8,855) | (9,168) | ||||||||||||||||||||||||
| Depreciation and amortization expense | 1,321 | 17,594 | 1,610 | — | 20,525 | ||||||||||||||||||||||||
| Share-based compensation expense | 5,602 | 54,905 | 5,617 | — | 66,124 | ||||||||||||||||||||||||
| Interest expense | 3,758 | — | 101 | 12,607 | 16,466 | ||||||||||||||||||||||||
| Adjusted EBITDA | $ | (34,524) | $ | 61,047 | $ | (2,601) | $ | — | $ | 23,922 | |||||||||||||||||||
(1) We use loss before income taxes as our profitability measure in making operating decisions and assessing the performance of our segments, therefore, net loss and income tax benefit are calculated and presented only on a consolidated basis within our financial statements.
(2) Certain corporate items are not directly attributable to any of our segments, including interest income earned on our short-term investments included in Other income and interest costs on our convertible senior notes included in Interest expense.
Exhibit 99.2
Reported Consolidated Results
ZILLOW GROUP, INC.
UNAUDITED CONDENSED CONSOLIDATED BALANCE SHEETS
(in thousands)
| March 31, 2020 | December 31, 2019 | ||||||||||
| Assets | |||||||||||
| Current assets: | |||||||||||
| Cash and cash equivalents | $ | 1,567,710 | $ | 1,141,263 | |||||||
Short-term investments | 993,258 | 1,280,989 | |||||||||
Accounts receivable, net | 71,782 | 67,005 | |||||||||
| Mortgage loans held for sale | 36,848 | 36,507 | |||||||||
| Inventory | 533,989 | 836,627 | |||||||||
| Prepaid expenses and other current assets | 57,635 | 58,117 | |||||||||
| Restricted cash | 56,428 | 89,646 | |||||||||
| Total current assets | 3,317,650 | 3,510,154 | |||||||||
| Contract cost assets | 46,565 | 45,209 | |||||||||
| Property and equipment, net | 188,032 | 170,489 | |||||||||
| Right of use assets | 205,688 | 212,153 | |||||||||
| Goodwill | 1,984,907 | 1,984,907 | |||||||||
| Intangible assets, net | 112,274 | 190,567 | |||||||||
| Other assets | 16,624 | 18,494 | |||||||||
| Total assets | $ | 5,871,740 | $ | 6,131,973 | |||||||
| Liabilities and shareholders’ equity | |||||||||||
| Current liabilities: | |||||||||||
| Accounts payable | $ | 17,819 | $ | 8,343 | |||||||
| Accrued expenses and other current liabilities | 88,897 | 85,442 | |||||||||
| Accrued compensation and benefits | 32,838 | 37,805 | |||||||||
| Borrowings under credit facilities | 466,647 | 721,951 | |||||||||
| Deferred revenue | 35,347 | 39,747 | |||||||||
| Lease liabilities, current portion | 20,290 | 17,592 | |||||||||
| Convertible senior notes, current portion | 9,637 | 9,637 | |||||||||
| Total current liabilities | 671,475 | 920,517 | |||||||||
| Lease liabilities, net of current portion | 216,122 | 220,445 | |||||||||
| Long-term debt | 1,565,949 | 1,543,402 | |||||||||
| Deferred tax liabilities and other long-term liabilities | 2,433 | 12,188 | |||||||||
| Total liabilities | 2,455,979 | 2,696,552 | |||||||||
| Shareholders’ equity: | |||||||||||
Class A common stock | 6 | 6 | |||||||||
Class B common stock | 1 | 1 | |||||||||
Class C capital stock | 15 | 14 | |||||||||
| Additional paid-in capital | 4,551,866 | 4,412,200 | |||||||||
| Accumulated other comprehensive income | 4,286 | 340 | |||||||||
| Accumulated deficit | (1,140,413) | (977,140) | |||||||||
| Total shareholders’ equity | 3,415,761 | 3,435,421 | |||||||||
| Total liabilities and shareholders’ equity | $ | 5,871,740 | $ | 6,131,973 | |||||||
ZILLOW GROUP, INC.
UNAUDITED CONDENSED CONSOLIDATED STATEMENTS OF OPERATIONS
(in thousands, except per share data)
| Three Months Ended March 31, | |||||||||||
| 2020 | 2019 | ||||||||||
| Revenue: | |||||||||||
| Homes | $ | 769,873 | $ | 128,472 | |||||||
| IMT | 330,666 | 298,272 | |||||||||
| Mortgages | 25,282 | 27,360 | |||||||||
| Total revenue | 1,125,821 | 454,104 | |||||||||
| Cost of revenue (exclusive of amortization) (1)(2): | |||||||||||
| Homes | 732,199 | 122,419 | |||||||||
| IMT | 24,318 | 24,251 | |||||||||
| Mortgages | 5,155 | 4,678 | |||||||||
| Total cost of revenue | 761,672 | 151,348 | |||||||||
| Sales and marketing (2) | 204,648 | 161,587 | |||||||||
| Technology and development (2) | 134,918 | 107,770 | |||||||||
| General and administrative (2) | 92,285 | 95,774 | |||||||||
| Impairment costs | 76,800 | — | |||||||||
| Integration costs | — | 352 | |||||||||
| Total costs and expenses | 1,270,323 | 516,831 | |||||||||
| Loss from operations | (144,502) | (62,727) | |||||||||
| Other income | 9,593 | 9,168 | |||||||||
| Interest expense | (37,592) | (16,466) | |||||||||
| Loss before income taxes | (172,501) | (70,025) | |||||||||
| Income tax benefit | 9,228 | 2,500 | |||||||||
| Net loss | $ | (163,273) | $ | (67,525) | |||||||
| Net loss per share — basic and diluted | $ | (0.78) | $ | (0.33) | |||||||
| Weighted-average shares outstanding — basic and diluted | 210,674 | 204,514 | |||||||||
| _________________ (1) Amortization of website development costs and intangible assets included in technology and development | $ | 17,184 | $ | 14,400 | |||||||
| (2) Includes share-based compensation expense as follows: | |||||||||||
| Cost of revenue | $ | 1,173 | $ | 881 | |||||||
| Sales and marketing | 6,993 | 5,650 | |||||||||
| Technology and development | 18,917 | 15,508 | |||||||||
| General and administrative | 16,712 | 44,085 | |||||||||
| Total | $ | 43,795 | $ | 66,124 | |||||||
| Other Financial Data: | |||||||||||
| Segment loss before income taxes: | |||||||||||
| Homes segment | $ | (97,958) | $ | (45,205) | |||||||
| IMT segment | (41,507) | (11,452) | |||||||||
| Mortgages segment | (13,145) | (9,616) | |||||||||
| Total segment loss before income taxes | $ | (152,610) | $ | (66,273) | |||||||
| Adjusted EBITDA (3): | |||||||||||
| Homes segment | $ | (74,995) | $ | (34,524) | |||||||
| IMT segment | 85,717 | 61,047 | |||||||||
| Mortgages segment | (5,603) | (2,601) | |||||||||
| Total Adjusted EBITDA | $ | 5,119 | $ | 23,922 | |||||||
| (3) Adjusted EBITDA is a non-GAAP financial measure; it is not calculated or presented in accordance with U.S. generally accepted accounting principles, or GAAP. See Exhibit 99.1 for more information regarding our presentation of Adjusted EBITDA and for a reconciliation of Adjusted EBITDA to net loss on a consolidated basis and loss before income taxes for each segment, the most directly comparable GAAP financial measures, for each of the periods presented. | |||||||||||
ZILLOW GROUP, INC.
UNAUDITED CONDENSED CONSOLIDATED STATEMENTS OF CASH FLOWS
(in thousands)
| Three Months Ended March 31, | |||||||||||
| 2020 | 2019 | ||||||||||
| Operating activities | |||||||||||
| Net loss | $ | (163,273) | $ | (67,525) | |||||||
| Adjustments to reconcile net loss to net cash provided by (used in) operating activities: | |||||||||||
| Depreciation and amortization | 29,026 | 20,525 | |||||||||
| Share-based compensation expense | 43,795 | 66,124 | |||||||||
| Amortization of right of use assets | 6,465 | 4,440 | |||||||||
| Amortization of contract cost assets | 8,415 | 8,746 | |||||||||
| Amortization of discount and issuance costs on convertible senior notes maturing in 2021, 2023, 2024 and 2026 | 22,547 | 8,840 | |||||||||
| Impairment costs | 76,800 | — | |||||||||
| Deferred income taxes | (9,228) | (2,500) | |||||||||
| Loss on disposal of property and equipment and other assets | 1,952 | 1,704 | |||||||||
| Credit loss expense | 558 | 128 | |||||||||
| Net loss on investment securities | 434 | — | |||||||||
| Accretion of bond discount | (473) | (1,733) | |||||||||
| Changes in operating assets and liabilities: | |||||||||||
| Accounts receivable | (5,335) | (4,650) | |||||||||
| Mortgage loans held for sale | (341) | 5,940 | |||||||||
| Inventory | 302,593 | (162,325) | |||||||||
| Prepaid expenses and other assets | (2,916) | (8,537) | |||||||||
| Lease liabilities | (1,625) | (7,010) | |||||||||
| Contract cost assets | (9,771) | (9,103) | |||||||||
| Accounts payable | 7,673 | (133) | |||||||||
| Accrued expenses and other current liabilities | 4,588 | 328 | |||||||||
| Accrued compensation and benefits | (4,967) | (1,088) | |||||||||
| Deferred revenue | (4,400) | 2,025 | |||||||||
| Other long-term liabilities | (527) | 290 | |||||||||
| Net cash provided by (used in) operating activities | 301,990 | (145,514) | |||||||||
| Investing activities | |||||||||||
| Proceeds from maturities of investments | 296,272 | 302,187 | |||||||||
| Proceeds from sales of investments | 53,997 | — | |||||||||
| Purchases of investments | (58,459) | (176,412) | |||||||||
| Purchases of property and equipment | (32,966) | (14,202) | |||||||||
| Purchases of intangible assets | (4,503) | (3,269) | |||||||||
| Net cash provided by investing activities | 254,341 | 108,304 | |||||||||
| Financing activities | |||||||||||
| Proceeds from borrowings on credit facilities | 34,460 | 129,328 | |||||||||
| Repayments of borrowings on credit facilities | (294,150) | — | |||||||||
| Net borrowings (repayments) on warehouse lines of credit and repurchase agreement | 4,386 | (5,025) | |||||||||
| Proceeds from exercise of stock options | 92,202 | 13,564 | |||||||||
| Value of equity awards withheld for tax liability | — | 2 | |||||||||
| Net cash provided by (used in) financing activities | (163,102) | 137,869 | |||||||||
| Net increase in cash, cash equivalents and restricted cash during period | 393,229 | 100,659 | |||||||||
| Cash, cash equivalents and restricted cash at beginning of period | 1,230,909 | 663,443 | |||||||||
| Cash, cash equivalents and restricted cash at end of period | $ | 1,624,138 | $ | 764,102 | |||||||
| Supplemental disclosures of cash flow information | |||||||||||
| Cash paid for interest | $ | 17,038 | $ | 4,956 | |||||||
| Noncash transactions: | |||||||||||
| Capitalized share-based compensation | $ | 3,670 | $ | 2,690 | |||||||
| Write-off of fully depreciated property and equipment | $ | 4,143 | $ | 6,269 | |||||||
| Write-off of fully amortized intangible assets | $ | — | $ | 3,200 | |||||||
| Property and equipment purchased on account | $ | 9,445 | $ | 4,792 | |||||||
Non-GAAP Net Loss per Share
Our presentation of non-GAAP net loss per share excludes the impact of share-based compensation expense, impairment costs and income taxes. This measure is not a key metric used by our management and board of directors to measure operating performance or otherwise manage the business. However, we provide non-GAAP net loss per share as supplemental information to investors, as we believe the exclusion of share-based compensation expense, impairment costs and income taxes facilitates investors’ operating performance comparisons on a period-to-period basis. You should not consider non-GAAP net loss per share in isolation or as a substitute for analysis of our results as reported under GAAP.
The following table sets forth a reconciliation of non-GAAP net loss, adjusted, to net loss, as reported on a GAAP basis, and the calculation of non-GAAP net loss per share - basic and diluted, for each of the periods presented (in thousands, except per share data, unaudited):
| Three Months Ended March 31, | |||||||||||
| 2020 | 2019 | ||||||||||
| Net loss, as reported | $ | (163,273) | $ | (67,525) | |||||||
| Share-based compensation expense | 43,795 | 66,124 | |||||||||
| Impairment costs | 76,800 | — | |||||||||
| Income tax benefit | (9,228) | (2,500) | |||||||||
| Net loss, adjusted | $ | (51,906) | $ | (3,901) | |||||||
| Non-GAAP net loss per share — basic and diluted | $ | (0.25) | $ | (0.02) | |||||||
| Weighted-average shares outstanding — basic and diluted | 210,674 | 204,514 | |||||||||
Segment Results of Operations
The following table presents our segment results for the periods presented (in thousands, unaudited):
| Three Months Ended March 31, 2020 | Three Months Ended March 31, 2019 | ||||||||||||||||||||||||||||||||||
| Homes | IMT | Mortgages | Homes | IMT | Mortgages | ||||||||||||||||||||||||||||||
| Revenue | $ | 769,873 | $ | 330,666 | $ | 25,282 | $ | 128,472 | $ | 298,272 | $ | 27,360 | |||||||||||||||||||||||
| Costs and expenses: | |||||||||||||||||||||||||||||||||||
| Cost of revenue | 732,199 | 24,318 | 5,155 | 122,419 | 24,251 | 4,678 | |||||||||||||||||||||||||||||
| Sales and marketing | 71,589 | 120,173 | 12,886 | 20,862 | 126,654 | 14,071 | |||||||||||||||||||||||||||||
| Technology and development | 32,538 | 95,028 | 7,352 | 12,281 | 87,969 | 7,520 | |||||||||||||||||||||||||||||
| General and administrative | 23,421 | 58,754 | 10,110 | 14,357 | 70,850 | 10,567 | |||||||||||||||||||||||||||||
| Impairment costs | — | 73,900 | 2,900 | — | — | — | |||||||||||||||||||||||||||||
| Integration costs | — | — | — | — | — | 352 | |||||||||||||||||||||||||||||
| Total costs and expenses | 859,747 | 372,173 | 38,403 | 169,919 | 309,724 | 37,188 | |||||||||||||||||||||||||||||
| Loss from operations | (89,874) | (41,507) | (13,121) | (41,447) | (11,452) | (9,828) | |||||||||||||||||||||||||||||
| Segment other income | — | — | 202 | — | — | 313 | |||||||||||||||||||||||||||||
| Segment interest expense | (8,084) | — | (226) | (3,758) | — | (101) | |||||||||||||||||||||||||||||
| Loss before income taxes (1) | $ | (97,958) | $ | (41,507) | $ | (13,145) | $ | (45,205) | $ | (11,452) | $ | (9,616) | |||||||||||||||||||||||
(1) The following table presents the reconciliation of total segment loss before income taxes to consolidated loss before income taxes for the periods presented (in thousands, unaudited):
| Three Months Ended March 31, | |||||||||||
| 2020 | 2019 | ||||||||||
| Total segment loss before income taxes | $ | (152,610) | $ | (66,273) | |||||||
| Corporate interest expense | (29,282) | (12,607) | |||||||||
| Corporate other income | 9,391 | 8,855 | |||||||||
| Consolidated loss before income taxes | $ | (172,501) | $ | (70,025) | |||||||
Key Metrics
The following table sets forth our key metrics for each of the periods presented (in millions, except number of homes sold, unaudited):
| Three Months Ended March 31, | 2019 to 2020 % Change | ||||||||||||||||
| 2020 | 2019 | ||||||||||||||||
| Visits (1) | 2,117.6 | 2,019.8 | 5 | % | |||||||||||||
| Average Monthly Unique Users (2) | 192.5 | 181.1 | 6 | % | |||||||||||||
| Number of Homes Sold | 2,394 | 414 | 478 | % | |||||||||||||
(1)Visits includes visits to the Zillow, Trulia and StreetEasy mobile apps and websites. We measure Zillow and StreetEasy visits with Google Analytics and Trulia visits with Adobe Analytics.
(2)Zillow, StreetEasy, HotPads and Naked Apartments measure unique users with Google Analytics, and Trulia measures unique users with Adobe Analytics.
Non-GAAP Average Return on Homes Sold After Interest Expense
To provide investors with additional information regarding our Zillow Offers financial results, this Exhibit includes a calculation of Average Return on Homes Sold After Interest Expense, which is a non-GAAP financial measure. We have provided a reconciliation of Average Return on Homes Sold After Interest Expense to the most directly comparable GAAP financial measure, which is average gross profit per home for the Zillow Offers business.
We believe that Average Return on Homes Sold After Interest Expense is a useful financial measure to investors as it is one of the primary measures used by management in making investment decisions, measuring unit level economics and evaluating operating performance for the Zillow Offers business. The measure is intended to convey the unit level economics of homes sold during the period by presenting the average revenue and associated expenses directly attributed to the homes sold. We believe this average per unit measure facilitates meaningful period over period comparisons notwithstanding variability in the number of homes sold during a period and indicates ability to generate average returns on assets sold after considering home purchase costs, renovation costs, holding costs and selling costs.
We calculate the average return on homes sold after interest expense as revenue associated with homes sold during the period less direct costs attributable to those homes divided by the number of homes sold during the period. Specifically, direct costs include, with respect to each home sold during the period (1) home acquisition and renovation costs, which in turn include certain labor costs directly associated with these activities; (2) holding and selling costs; and (3) interest costs incurred.
Included in direct holding and interest expense amounts for the periods presented are holding and interest costs recorded as period expenses in prior periods associated with homes sold in the presented period, which are not calculated in accordance with, or as an alternative for, GAAP and should not be considered in isolation or as a substitute for results reported under GAAP. Excluded from certain of these direct cost amounts are costs recorded in the presented period related to homes that remain in inventory at the end of the period, as shown in the tables below. We make these period adjustments because we believe presenting Average Return on Homes Sold After Interest Expense in this manner provides a focused view on a subset of our assets - homes sold during the period - and reflecting costs associated with those homes sold from the time we acquire to the time we sell the home, which may be useful to investors.
Average Return on Homes Sold After Interest Expense is intended to illustrate the performance of homes sold during the period and is not intended to be a segment or company performance metric. Average Return on Homes Sold After Interest Expense is a
supplemental measure of operating performance for a subset of assets and has limitations as an analytical tool, and you should not consider it in isolation or as a substitute for analysis of our results as reported under GAAP. Some of these limitations are:
•Although depreciation and amortization are non-cash charges, the assets being depreciated and amortized may have to be replaced in the future, and Average Return on Homes Sold After Interest Expense does not reflect capital expenditure requirements for such replacements or for new capital expenditure requirements;
•Average Return on Homes Sold After Interest Expense does not consider the potentially dilutive impact of share-based compensation;
•Average Return on Homes Sold After Interest Expense does not include period costs that were not eligible for inventory capitalization associated with homes held in inventory at the end of the period;
•Average Return on Homes Sold After Interest Expense does not reflect indirect expenses included in cost of revenue, sales and marketing, technology and development, or general and administrative expenses, some of which are recurring cash expenditures necessary to operate the business; and
•Average Return on Homes Sold After Interest Expense does not reflect income taxes.
On a GAAP basis, Zillow Offers average gross profit per home was $16,113 and $14,621, respectively, for the three months ended March 31, 2020 and 2019.
The following table presents the total return on homes sold after interest expense and the Average Return on Homes Sold After Interest Expense for the periods presented (unaudited):
| Three Months Ended March 31, 2020 | Three Months Ended March 31, 2019 | ||||||||||||||||||||||
| Total | Average Per Home | Total | Average Per Home | ||||||||||||||||||||
| Homes sold | 2,394 | 414 | |||||||||||||||||||||
| Zillow Offers revenue | $ | 769,112,000 | $ | 321,266 | $ | 128,472,000 | $ | 310,319 | |||||||||||||||
| Operating costs: | |||||||||||||||||||||||
| Home acquisition costs (1) | 689,654,000 | 288,076 | 116,709,000 | 281,906 | |||||||||||||||||||
| Renovation costs (1) | 36,591,000 | 15,284 | 4,681,000 | 11,307 | |||||||||||||||||||
| Holding costs (1)(2) | 9,618,000 | 4,018 | 1,238,000 | 2,990 | |||||||||||||||||||
| Selling costs | 32,913,000 | 13,748 | 5,542,000 | 13,386 | |||||||||||||||||||
| Total operating costs | 768,776,000 | 321,126 | 128,170,000 | 309,589 | |||||||||||||||||||
| Interest expense (1)(2) | 11,056,000 | 4,618 | 1,655,000 | 3,998 | |||||||||||||||||||
| Return on homes sold after interest expense | $ | (10,720,000) | $ | (4,478) | $ | (1,353,000) | $ | (3,268) | |||||||||||||||
| (1) Amount excludes expenses incurred during the period that are not related to homes sold during the period. (2) Holding costs and interest expense include $5.2 million and $6.6 million, respectively, of costs incurred in prior periods associated with homes sold in the first quarter of 2020 and $0.6 million and $0.6 million, respectively, of costs incurred in prior periods associated with homes sold in the first quarter of 2019. | |||||||||||||||||||||||
The calculation of Average Return on Homes Sold After Interest Expense includes only those expenses directly attributed to the homes sold during the period. To arrive at return on homes sold after interest expense, the Company deducts from Zillow Offers gross profit (1) holding costs incurred in the presented period and prior periods for homes sold during the presented period that are included in sales and marketing expense, (2) selling costs incurred in the presented period for homes sold during the presented period that are included in sales and marketing expense and (3) interest expense incurred in the presented period and prior periods for homes sold during the presented period. The Company adds to Zillow Offers gross profit (1) inventory valuation adjustments recorded during the presented period associated with homes that remain in inventory at period end, net of inventory valuation adjustments recorded in prior periods related to homes sold in the presented period, and indirect expenses included in cost of revenue and (2) share-based compensation expense and depreciation and amortization expense included in cost of revenue. The following table presents the calculation of Zillow Offers average gross profit per home and Average Return on Homes Sold After Interest Expense and a reconciliation of return on homes sold after interest expense to Zillow Offers gross profit for the periods presented (unaudited):
| Three Months Ended March 31, | |||||||||||
| Calculation of Average Gross Profit per Home | 2020 | 2019 | |||||||||
| Zillow Offers revenue | $ | 769,112,000 | $ | 128,472,000 | |||||||
| Zillow Offers cost of revenue | 730,537,000 | 122,419,000 | |||||||||
| Zillow Offers gross profit | $ | 38,575,000 | $ | 6,053,000 | |||||||
| Homes sold | 2,394 | 414 | |||||||||
| Average Zillow Offers gross profit per home | $ | 16,113 | $ | 14,621 | |||||||
| Reconciliation of Non-GAAP Measure to Nearest GAAP Measure | |||||||||||
| Zillow Offers gross profit | $ | 38,575,000 | $ | 6,053,000 | |||||||
| Holding costs included in sales and marketing (1) | (9,618,000) | (1,238,000) | |||||||||
| Selling costs included in sales and marketing (2) | (32,913,000) | (5,542,000) | |||||||||
| Interest expense (3) | (11,056,000) | (1,655,000) | |||||||||
| Direct and indirect expenses included in cost of revenue (4) | 3,830,000 | 922,000 | |||||||||
| Share-based compensation expense and depreciation and amortization expense included in cost of revenue | 462,000 | 107,000 | |||||||||
| Return on homes sold after interest expense | $ | (10,720,000) | $ | (1,353,000) | |||||||
| Homes sold | 2,394 | 414 | |||||||||
| Average return on homes sold after interest expense | $ | (4,478) | $ | (3,268) | |||||||
| (1) Amount represents holding costs incurred related to homes sold in the presented period that were not eligible for inventory capitalization and were therefore expensed as period costs in the presented period and prior periods. These costs primarily include homeowners association dues, property taxes, insurance, utilities, and cleaning and maintenance costs incurred during the time a home is held for sale after the renovation period is complete. On a GAAP basis, the Company incurred a total of $5.3 million and $2.3 million of holding costs included in sales and marketing expense for the three months ended March 31, 2020 and 2019, respectively. (2) Amount represents selling costs incurred related to homes sold in the presented period that were not eligible for inventory capitalization and were therefore expensed as period costs in the presented period. These costs primarily include agent commissions paid upon the sale of a home. (3) Amount represents interest expense incurred related to homes sold in the presented period that was not eligible for inventory capitalization and was therefore expensed as a period cost in the presented period and prior periods. (4) Amount includes inventory valuation adjustments recorded during the period associated with homes that remain in inventory at period end, net of inventory valuation adjustments recorded in prior periods related to homes sold in the presented period, as well as corporate costs allocated to Zillow Offers such as headcount expenses and hosting-related costs related to the operation of our website. | |||||||||||

1 | Q1.2020 February 19, 2020
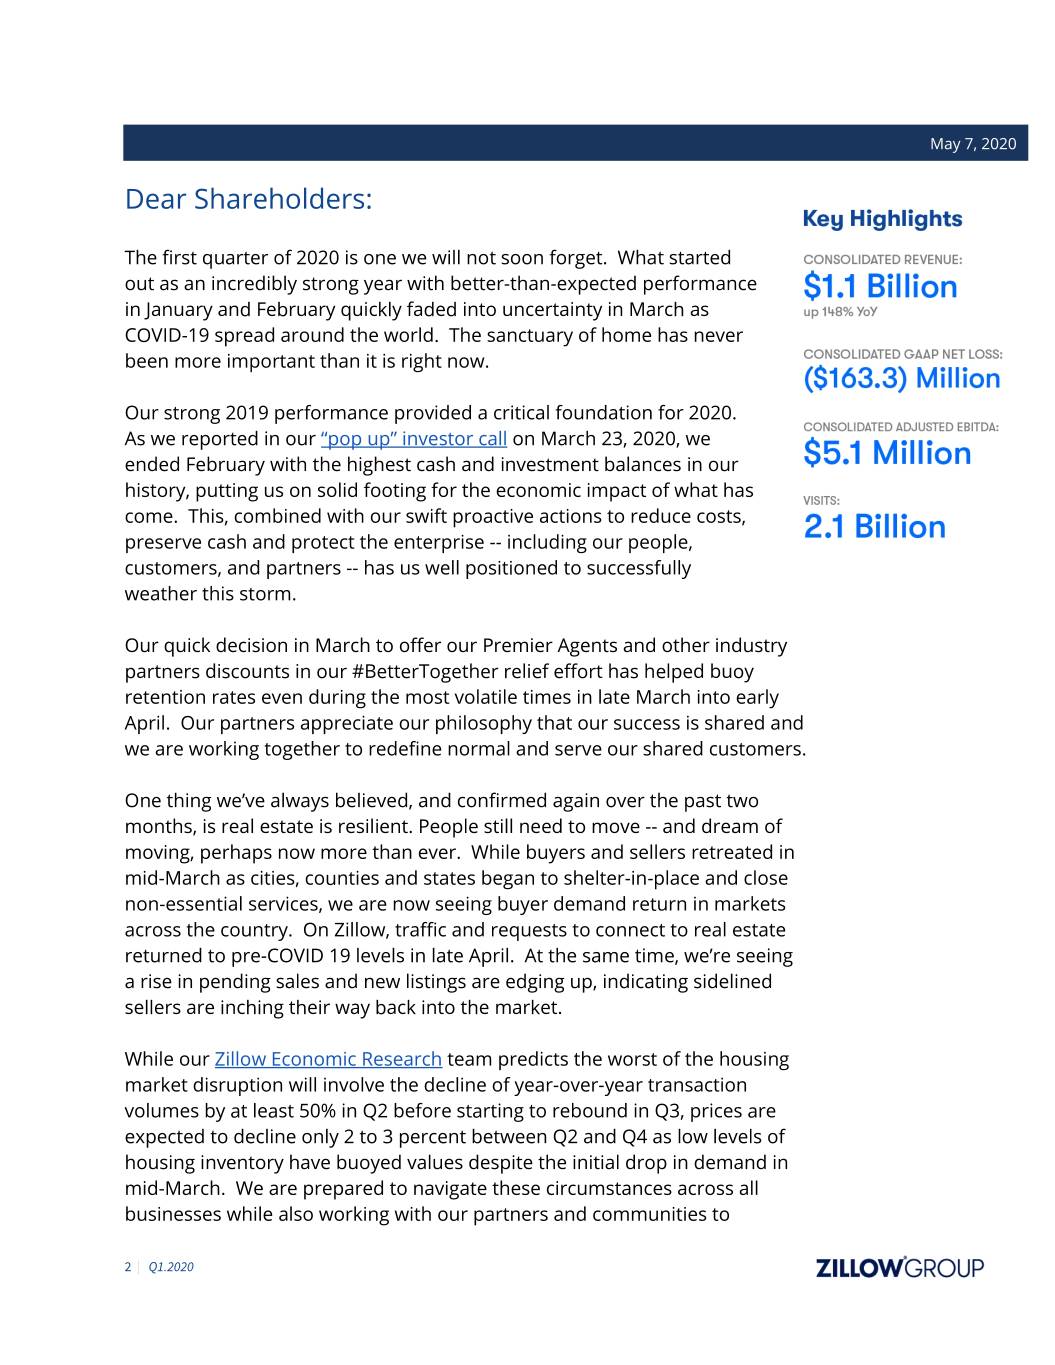
May 7, 2020 Dear Shareholders: The first quarter of 2020 is one we will not soon forget. What started out as an incredibly strong year with better-than-expected performance in January and February quickly faded into uncertainty in March as COVID-19 spread around the world. The sanctuary of home has never been more important than it is right now. Our strong 2019 performance provided a critical foundation for 2020. As we reported in our “pop up” investor call on March 23, 2020, we ended February with the highest cash and investment balances in our history, putting us on solid footing for the economic impact of what has come. This, combined with our swift proactive actions to reduce costs, preserve cash and protect the enterprise -- including our people, customers, and partners -- has us well positioned to successfully weather this storm. Our quick decision in March to offer our Premier Agents and other industry partners discounts in our #BetterTogether relief effort has helped buoy retention rates even during the most volatile times in late March into early April. Our partners appreciate our philosophy that our success is shared and we are working together to redefine normal and serve our shared customers. One thing we’ve always believed, and confirmed again over the past two months, is real estate is resilient. People still need to move -- and dream of moving, perhaps now more than ever. While buyers and sellers retreated in mid-March as cities, counties and states began to shelter-in-place and close non-essential services, we are now seeing buyer demand return in markets across the country. On Zillow, traffic and requests to connect to real estate returned to pre-COVID 19 levels in late April. At the same time, we’re seeing a rise in pending sales and new listings are edging up, indicating sidelined sellers are inching their way back into the market. While our Zillow Economic Research team predicts the worst of the housing market disruption will involve the decline of year-over-year transaction volumes by at least 50% in Q2 before starting to rebound in Q3, prices are expected to decline only 2 to 3 percent between Q2 and Q4 as low levels of housing inventory have buoyed values despite the initial drop in demand in mid-March. We are prepared to navigate these circumstances across all businesses while also working with our partners and communities to 2 | Q1.2020
innovate and facilitate technology-enabled transactions in a more virtual world. Real estate will keep moving forward and we’ll help people move safely into life’s next chapter. Despite the unimaginable happening late in Q1, Zillow Group delivered results that came within or beat our outlook due to strong execution in January and February. The results are summarized below. First Quarter & Recent 2020 Highlights: ● Total consolidated revenue grew 148% year over year to $1.1 billion. ● Adjusted EBITDA beat our expectations for all three segments. ● Premier Agent year-over-year revenue growth accelerated to 11% from 6% in Q4 2019 as we executed our strategy of connecting more and higher-intent customers with better partners. ● Homes segment revenue and Adjusted EBITDA outperformed our expectations significantly, delivering $770 million in revenue. Enhancements to our resale strategy enabled us to achieve the highest sales velocity since we launched Zillow Offers without sacrificing unit economics. ● We sold 2,394 homes, bought 1,479 homes and as of end of Q1 had 1,791 homes in inventory. ● On March 23, we took a number of immediate actions to preserve liquidity and announced immediate cost saving actions, including delaying most hiring, pausing most marketing and reducing other discretionary spending. We also paused Zillow Offers’ home buying. ● We strengthened our balance sheet by growing cash and investments to $2.6 billion from $2.4 billion as of the end of 2019. Contributing to this was the reduction of our inventory of homes from $837 million as of the end of Q4 to $534 million as of the end of Q1. Cash flow from operations before considering changes in inventory was near break even. ● Traffic to Zillow Group mobile apps and websites reached 192.5 million average monthly unique users, an increase of 6% year over year, driving 2.1 billion visits during the quarter, up 5% year over year. Visits were trending at low double-digit year-over-year growth rates prior to mid-March. While visits dropped in late March, they have subsequently improved back to pre-mid-March rates. 3 | Q1.2020
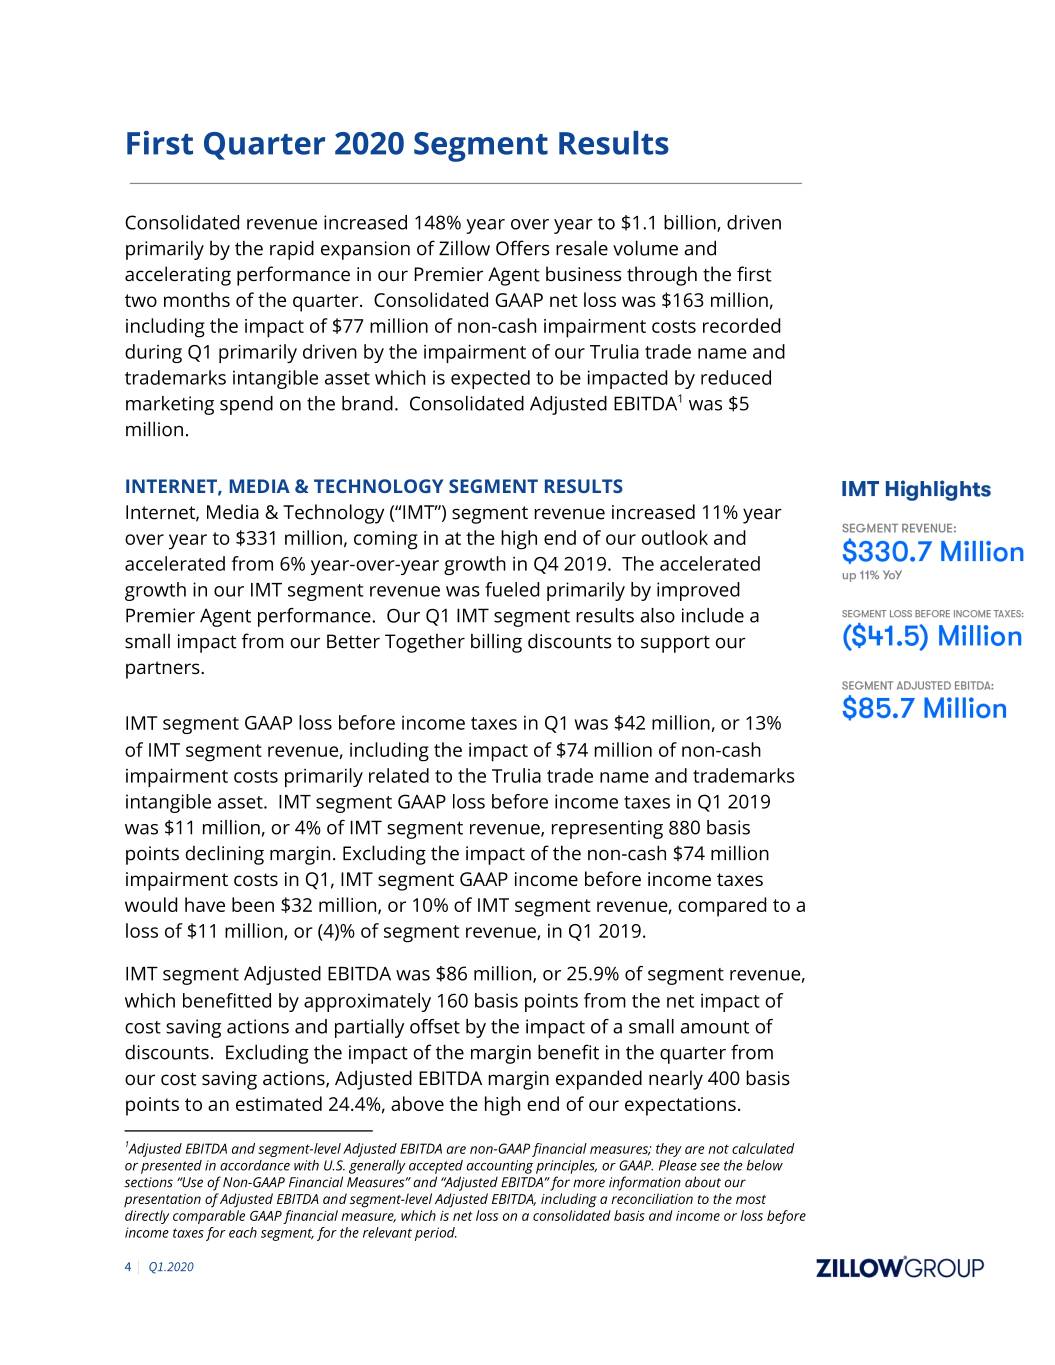
First Quarter 2020 Segment Results Consolidated revenue increased 148% year over year to $1.1 billion, driven primarily by the rapid expansion of Zillow Offers resale volume and accelerating performance in our Premier Agent business through the first two months of the quarter. Consolidated GAAP net loss was $163 million, including the impact of $77 million of non-cash impairment costs recorded during Q1 primarily driven by the impairment of our Trulia trade name and trademarks intangible asset which is expected to be impacted by reduced marketing spend on the brand. Consolidated Adjusted EBITDA1 was $5 million. INTERNET, MEDIA & TECHNOLOGY SEGMENT RESULTS Internet, Media & Technology (“IMT”) segment revenue increased 11% year over year to $331 million, coming in at the high end of our outlook and accelerated from 6% year-over-year growth in Q4 2019. The accelerated growth in our IMT segment revenue was fueled primarily by improved Premier Agent performance. Our Q1 IMT segment results also include a small impact from our Better Together billing discounts to support our partners. IMT segment GAAP loss before income taxes in Q1 was $42 million, or 13% of IMT segment revenue, including the impact of $74 million of non-cash impairment costs primarily related to the Trulia trade name and trademarks intangible asset. IMT segment GAAP loss before income taxes in Q1 2019 was $11 million, or 4% of IMT segment revenue, representing 880 basis points declining margin. Excluding the impact of the non-cash $74 million impairment costs in Q1, IMT segment GAAP income before income taxes would have been $32 million, or 10% of IMT segment revenue, compared to a loss of $11 million, or (4)% of segment revenue, in Q1 2019. IMT segment Adjusted EBITDA was $86 million, or 25.9% of segment revenue, which benefitted by approximately 160 basis points from the net impact of cost saving actions and partially offset by the impact of a small amount of discounts. Excluding the impact of the margin benefit in the quarter from our cost saving actions, Adjusted EBITDA margin expanded nearly 400 basis points to an estimated 24.4%, above the high end of our expectations. 1Adjusted EBITDA and segment-level Adjusted EBITDA are non-GAAP financial measures; they are not calculated or presented in accordance with U.S. generally accepted accounting principles, or GAAP. Please see the below sections “Use of Non-GAAP Financial Measures” and “Adjusted EBITDA” for more information about our presentation of Adjusted EBITDA and segment-level Adjusted EBITDA, including a reconciliation to the most directly comparable GAAP financial measure, which is net loss on a consolidated basis and income or loss before income taxes for each segment, for the relevant period. 4 | Q1.2020
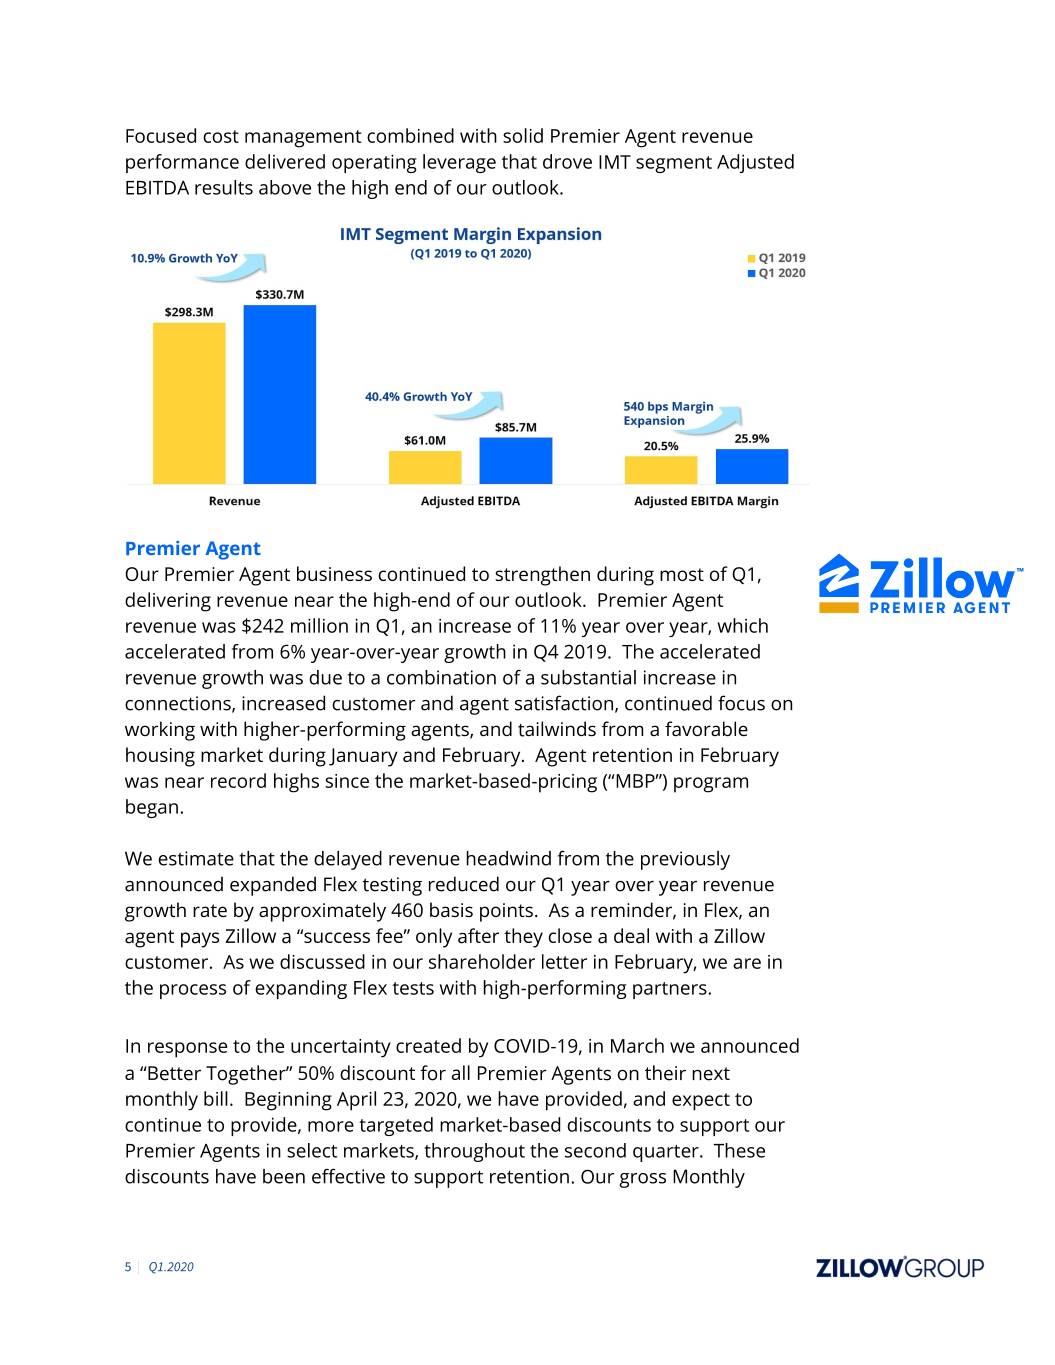
Focused cost management combined with solid Premier Agent revenue performance delivered operating leverage that drove IMT segment Adjusted EBITDA results above the high end of our outlook. Premier Agent Our Premier Agent business continued to strengthen during most of Q1, delivering revenue near the high-end of our outlook. Premier Agent revenue was $242 million in Q1, an increase of 11% year over year, which accelerated from 6% year-over-year growth in Q4 2019. The accelerated revenue growth was due to a combination of a substantial increase in connections, increased customer and agent satisfaction, continued focus on working with higher-performing agents, and tailwinds from a favorable housing market during January and February. Agent retention in February was near record highs since the market-based-pricing (“MBP”) program began. We estimate that the delayed revenue headwind from the previously announced expanded Flex testing reduced our Q1 year over year revenue growth rate by approximately 460 basis points. As a reminder, in Flex, an agent pays Zillow a “success fee” only after they close a deal with a Zillow customer. As we discussed in our shareholder letter in February, we are in the process of expanding Flex tests with high-performing partners. In response to the uncertainty created by COVID-19, in March we announced a “Better Together” 50% discount for all Premier Agents on their next monthly bill. Beginning April 23, 2020, we have provided, and expect to continue to provide, more targeted market-based discounts to support our Premier Agents in select markets, throughout the second quarter. These discounts have been effective to support retention. Our gross Monthly 5 | Q1.2020

Recurring Revenue (“MRR”)2 as of the end of April declined less than 5% since March 11th, the day before we started to see the impact of global events on our MRR. We have also been working to support our Premier Agent partners to better serve our shared customers as face-to-face interactions and open houses have become challenging in many locations. In March, we quickly launched appointment-based virtual tours and consultations and are providing resources and guides to support virtual real estate. This includes our proprietary 3D Home tour technology accessible through the Zillow 3D HomeⓇ app to easily capture panoramic photos and generate virtual tours and floor plans. This technology, which was developed over several years and launched last year, has seen adoption accelerate as the creation of 3D Home tours nearly tripled in March. On average, for sale listings with a 3D Home tour received 40% more visitors and were saved 60% more frequently in March than homes without a tour. Other IMT Revenue Other revenue, which includes rentals, new construction, display and other advertising, and business technology solutions for real estate professionals, grew 10% year over year to $89 million, up from 8% year-over-year growth in Q4. The increase in Other IMT revenue was primarily driven by a 16% increase in Rentals revenue, which accelerated from 12% year-over-year growth in Q4 2019, as we continue to innovate and build tools that move us closer to the rental transaction. We recently launched a new tool in our Zillow Rental Manager product suite, offering lease upload and electronic signature capabilities nationwide. Zillow Rentals now enables renters to shop, virtually tour, submit applications, leases and pay rent, all from the safety and comfort of their current home. HOMES SEGMENT RESULTS Our Homes business continued to show healthy progress on multiple fronts during Q1 despite the mid-March slowdown due to public health concerns. We substantially accelerated our sales velocity3 without sacrificing unit economics while continuing to operate well within our underwriting guardrails. In Q1 we set a sales velocity record, despite economic uncertainty and restrictions on people’s mobility in the month of March. We made improvements in applied machine learning techniques to our selling process that helped us hit the right price faster. 2 Please see “Use of Operating Metrics” below for additional information about how we calculate MRR. 3 M onthly sales velocity is calculated by dividing the number of homes sold in a given calendar month by the number of homes held in inventory as of the beginning of such calendar month. Quarterly sales velocity is calculated by averaging the monthly sales velocities during a given quarter. 6 | Q1.2020
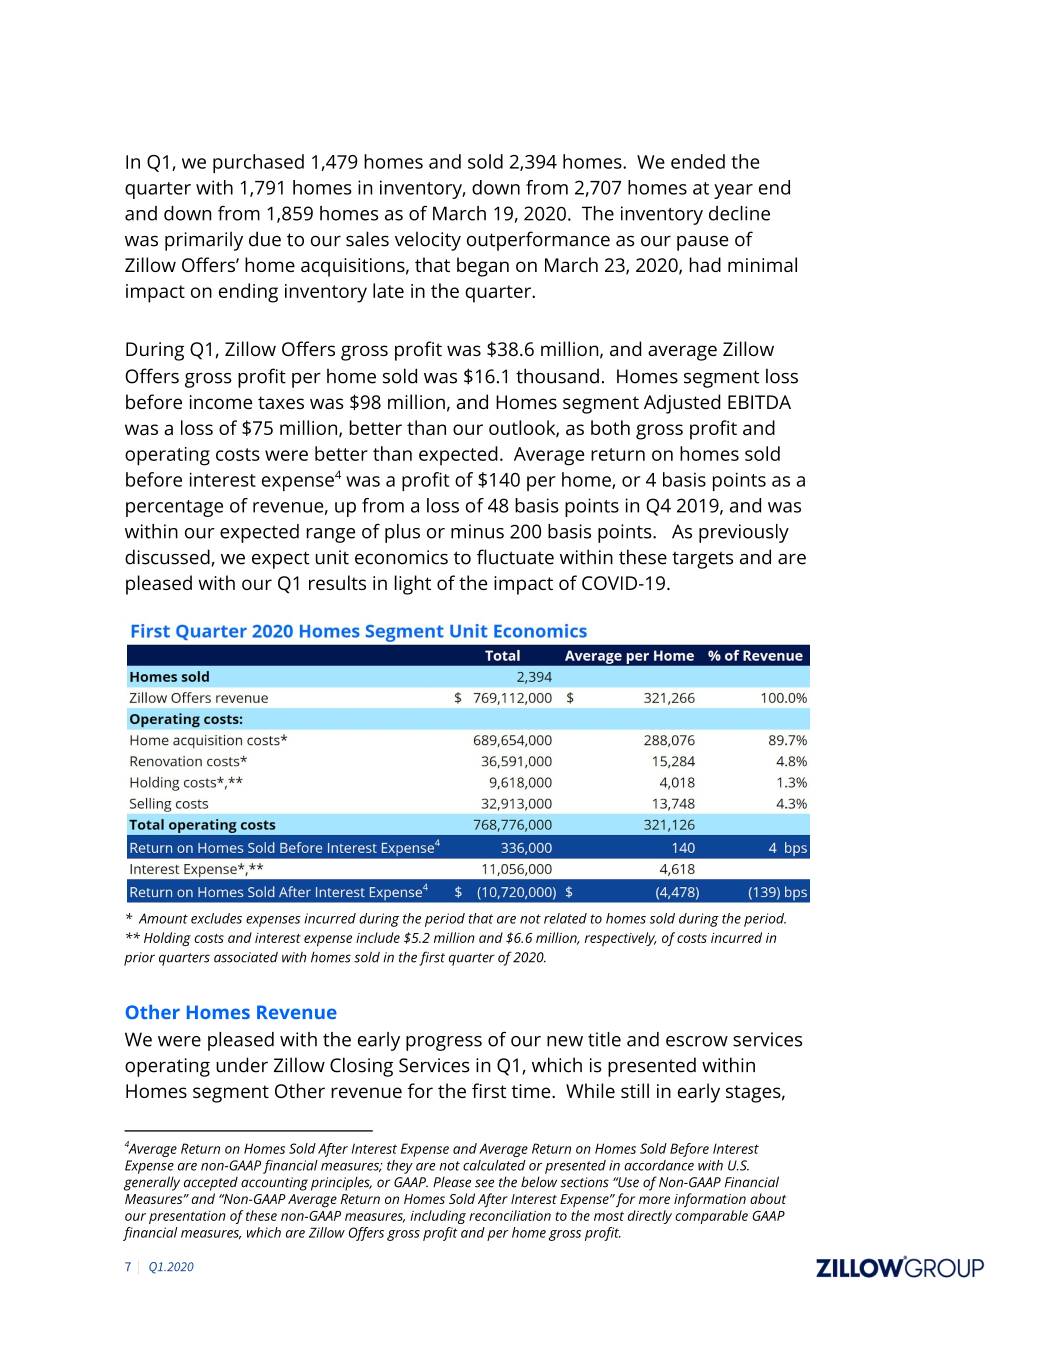
In Q1, we purchased 1,479 homes and sold 2,394 homes. We ended the quarter with 1,791 homes in inventory, down from 2,707 homes at year end and down from 1,859 homes as of March 19, 2020. The inventory decline was primarily due to our sales velocity outperformance as our pause of Zillow Offers’ home acquisitions, that began on March 23, 2020, had minimal impact on ending inventory late in the quarter. During Q1, Zillow Offers gross profit was $38.6 million, and average Zillow Offers gross profit per home sold was $16.1 thousand. Homes segment loss before income taxes was $98 million, and Homes segment Adjusted EBITDA was a loss of $75 million, better than our outlook, as both gross profit and operating costs were better than expected. Average return on homes sold before interest expense4 was a profit of $140 per home, or 4 basis points as a percentage of revenue, up from a loss of 48 basis points in Q4 2019, and was within our expected range of plus or minus 200 basis points. As previously discussed, we expect unit economics to fluctuate within these targets and are pleased with our Q1 results in light of the impact of COVID-19. * Amount excludes expenses incurred during the period that are not related to homes sold during the period. ** Holding costs and interest expense include $5.2 million and $6.6 million, respectively, of costs incurred in prior quarters associated with homes sold in the first quarter of 2020. Other Homes Revenue We were pleased with the early progress of our new title and escrow services operating under Zillow Closing Services in Q1, which is presented within Homes segment Other revenue for the first time. While still in early stages, 4Average Return on Homes Sold After Interest Expense and Average Return on Homes Sold Before Interest Expense are non-GAAP financial measures; they are not calculated or presented in accordance with U.S. generally accepted accounting principles, or GAAP. Please see the below sections “Use of Non-GAAP Financial Measures” and “Non-GAAP Average Return on Homes Sold After Interest Expense” for more information about our presentation of these non-GAAP measures, including reconciliation to the most directly comparable GAAP financial measures, which are Zillow Offers gross profit and per home gross profit. 7 | Q1.2020
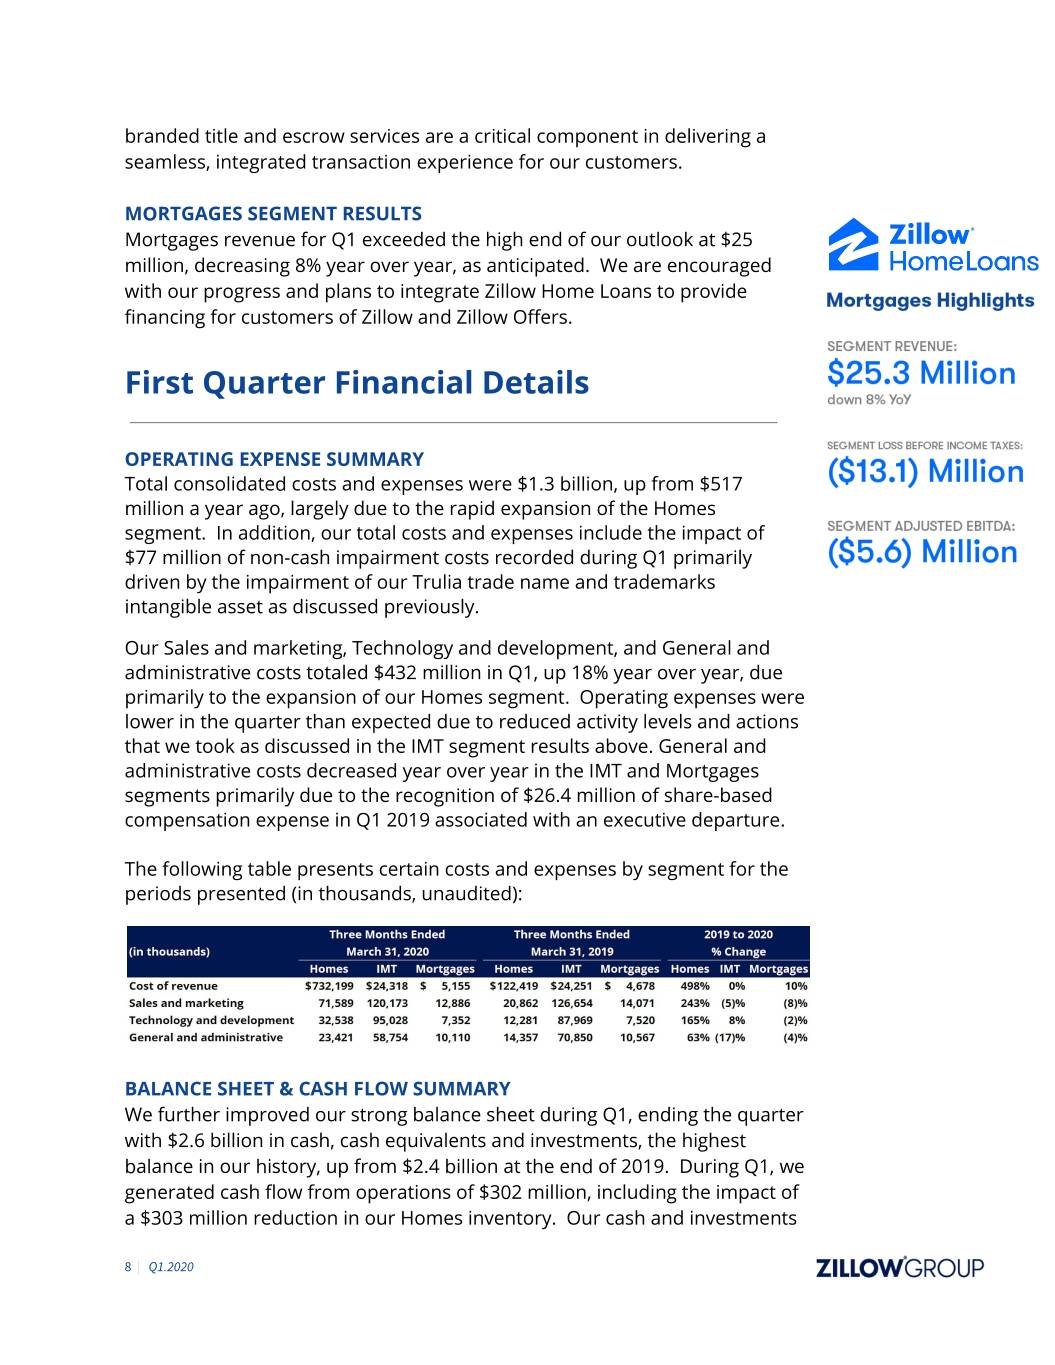
branded title and escrow services are a critical component in delivering a seamless, integrated transaction experience for our customers. MORTGAGES SEGMENT RESULTS Mortgages revenue for Q1 exceeded the high end of our outlook at $25 million, decreasing 8% year over year, as anticipated. We are encouraged with our progress and plans to integrate Zillow Home Loans to provide financing for customers of Zillow and Zillow Offers. First Quarter Financial Details OPERATING EXPENSE SUMMARY Total consolidated costs and expenses were $1.3 billion, up from $517 million a year ago, largely due to the rapid expansion of the Homes segment. In addition, our total costs and expenses include the impact of $77 million of non-cash impairment costs recorded during Q1 primarily driven by the impairment of our Trulia trade name and trademarks intangible asset as discussed previously. Our Sales and marketing, Technology and development, and General and administrative costs totaled $432 million in Q1, up 18% year over year, due primarily to the expansion of our Homes segment. Operating expenses were lower in the quarter than expected due to reduced activity levels and actions that we took as discussed in the IMT segment results above. General and administrative costs decreased year over year in the IMT and Mortgages segments primarily due to the recognition of $26.4 million of share-based compensation expense in Q1 2019 associated with an executive departure. The following table presents certain costs and expenses by segment for the periods presented (in thousands, unaudited): BALANCE SHEET & CASH FLOW SUMMARY We further improved our strong balance sheet during Q1, ending the quarter with $2.6 billion in cash, cash equivalents and investments, the highest balance in our history, up from $2.4 billion at the end of 2019. During Q1, we generated cash flow from operations of $302 million, including the impact of a $303 million reduction in our Homes inventory. Our cash and investments 8 | Q1.2020
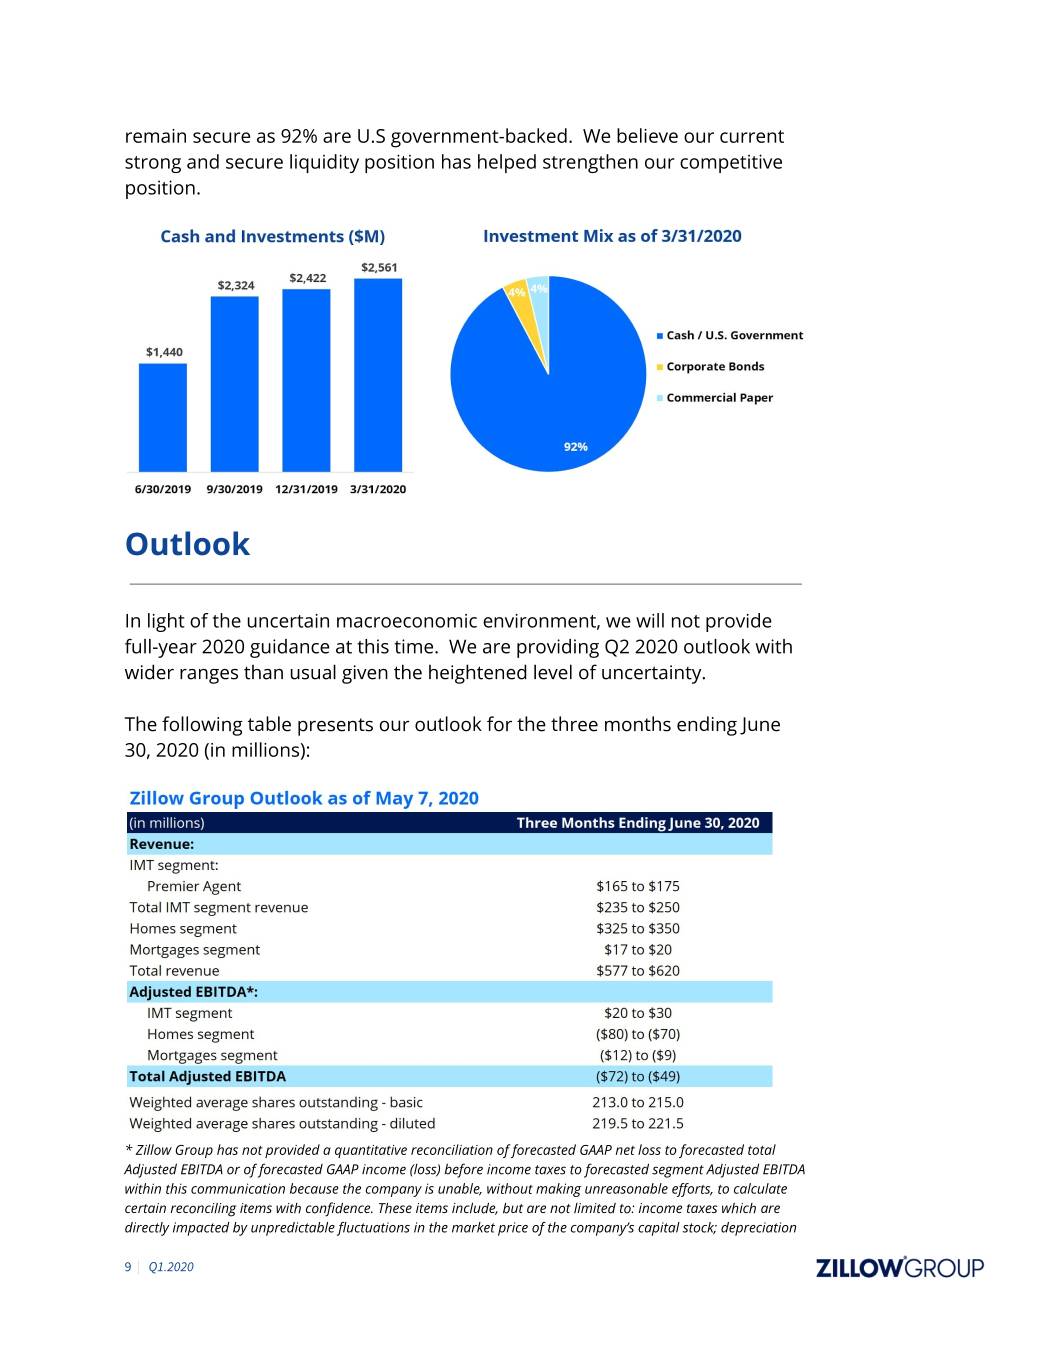
remain secure as 92% are U.S government-backed. We believe our current strong and secure liquidity position has helped strengthen our competitive position. Outlook In light of the uncertain macroeconomic environment, we will not provide full-year 2020 guidance at this time. We are providing Q2 2020 outlook with wider ranges than usual given the heightened level of uncertainty. The following table presents our outlook for the three months ending June 30, 2020 (in millions): * Zillow Group has not provided a quantitative reconciliation of forecasted GAAP net loss to forecasted total Adjusted EBITDA or of forecasted GAAP income (loss) before income taxes to forecasted segment Adjusted EBITDA within this communication because the company is unable, without making unreasonable efforts, to calculate certain reconciling items with confidence. These items include, but are not limited to: income taxes which are directly impacted by unpredictable fluctuations in the market price of the company’s capital stock; depreciation 9 | Q1.2020
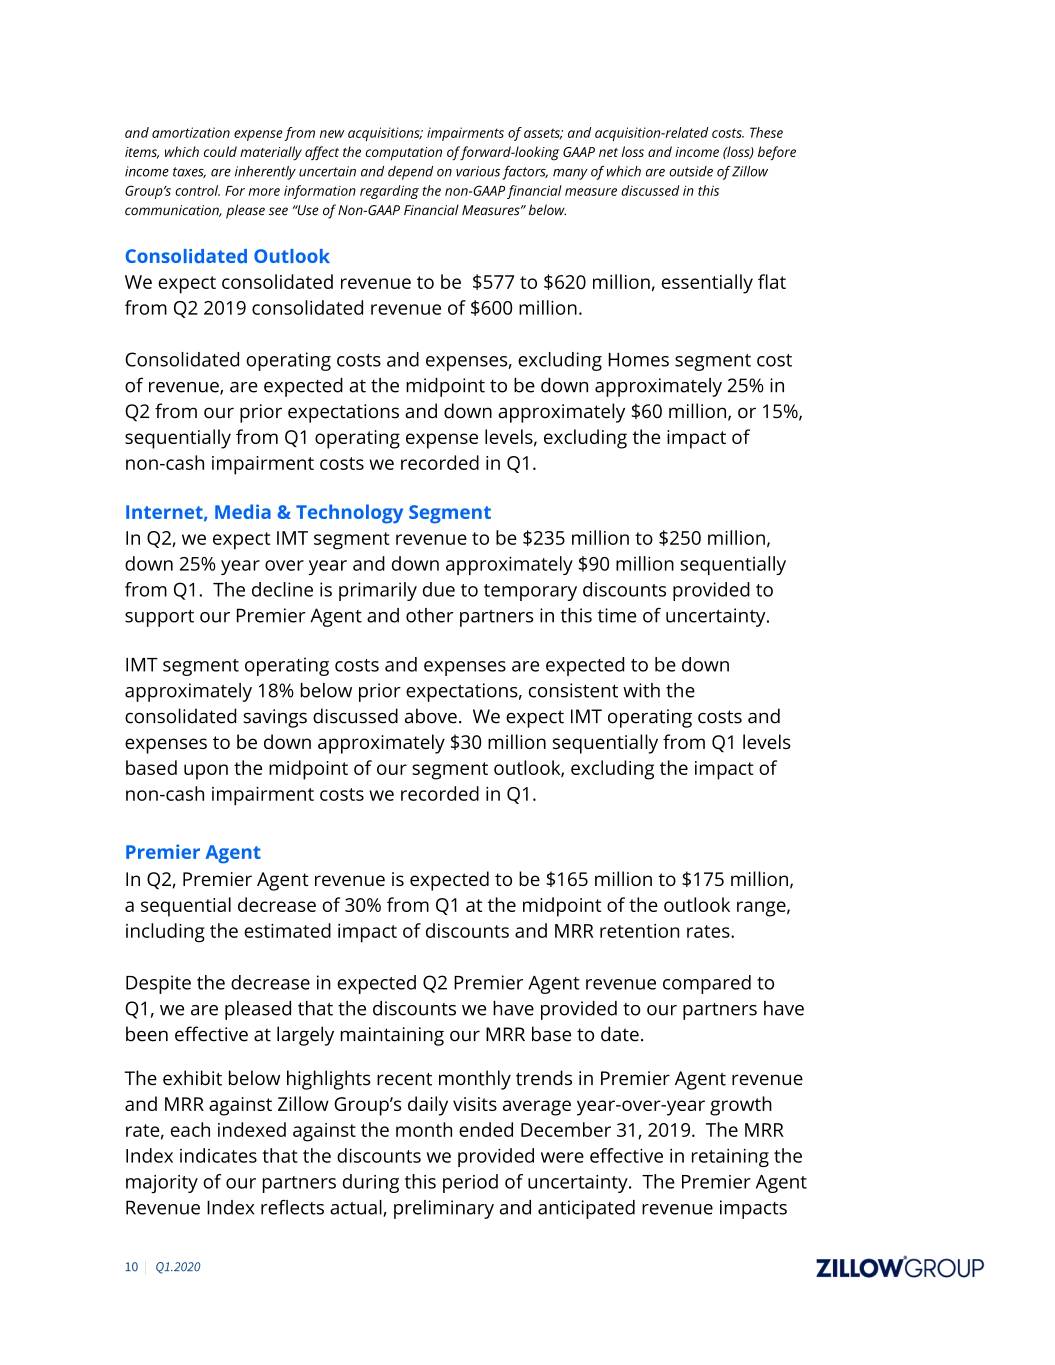
and amortization expense from new acquisitions; impairments of assets; and acquisition-related costs. These items, which could materially affect the computation of forward-looking GAAP net loss and income (loss) before income taxes, are inherently uncertain and depend on various factors, many of which are outside of Zillow Group’s control. For more information regarding the non-GAAP financial measure discussed in this communication, please see “Use of Non-GAAP Financial Measures” below. Consolidated Outlook We expect consolidated revenue to be $577 to $620 million, essentially flat from Q2 2019 consolidated revenue of $600 million. Consolidated operating costs and expenses, excluding Homes segment cost of revenue, are expected at the midpoint to be down approximately 25% in Q2 from our prior expectations and down approximately $60 million, or 15%, sequentially from Q1 operating expense levels, excluding the impact of non-cash impairment costs we recorded in Q1. Internet, Media & Technology Segment In Q2, we expect IMT segment revenue to be $235 million to $250 million, down 25% year over year and down approximately $90 million sequentially from Q1. The decline is primarily due to temporary discounts provided to support our Premier Agent and other partners in this time of uncertainty. IMT segment operating costs and expenses are expected to be down approximately 18% below prior expectations, consistent with the consolidated savings discussed above. We expect IMT operating costs and expenses to be down approximately $30 million sequentially from Q1 levels based upon the midpoint of our segment outlook, excluding the impact of non-cash impairment costs we recorded in Q1. Premier Agent In Q2, Premier Agent revenue is expected to be $165 million to $175 million, a sequential decrease of 30% from Q1 at the midpoint of the outlook range, including the estimated impact of discounts and MRR retention rates. Despite the decrease in expected Q2 Premier Agent revenue compared to Q1, we are pleased that the discounts we have provided to our partners have been effective at largely maintaining our MRR base to date. The exhibit below highlights recent monthly trends in Premier Agent revenue and MRR against Zillow Group’s daily visits average year-over-year growth rate, each indexed against the month ended December 31, 2019. The MRR Index indicates that the discounts we provided were effective in retaining the majority of our partners during this period of uncertainty. The Premier Agent Revenue Index reflects actual, preliminary and anticipated revenue impacts 10 | Q1.2020

from the Better Together discounts through Q2. We expect any discounts beyond Q2 will be market-based and temporary in nature due to the rise in traffic and customers seeking to be connected with an agent that is delivering increasing value to our Premier Agents. The above exhibit assumes that the values of MRR and Premier Agent revenue were 1.00 for the month ended December 31, 2019 and illustrates the actual, preliminary and expected rates of change for MRR and Premier Agent revenue for each subsequent monthly period through June 30, 2020. Each index ratio represents the MRR or Premier Agent revenue for the monthly period divided by the applicable amount for the month ended December 31, 2019. Preliminary and forecasted numbers are calculated based on the mid-point of our outlook as of the date of this communication. MRR does not include Flex or the Better Together billing discounts. Please see “Use of Operating Metrics” below for additional information about how we calculate MRR and Zillow Group Visits. We have assumed in our Q2 outlook the potential for lower MRR retention and additional discounts given the current economic uncertainty. While we are not providing second half 2020 guidance, we believe that if the trends continue as demonstrated in the exhibit, our Premier Agent revenue should improve subsequent to Q2. Homes Segment In Q2, we expect Homes segment revenue to be between $325 million and $350 million. Homes segment Adjusted EBITDA in Q2 is expected to be between ($80) million to ($70) million. Housing has remained resilient and customer demand has improved in early Q2 as stay-at-home orders have begun to be partially relaxed. We are actively planning to restart Zillow Offers home buying, likely within the next few weeks. There are a number of factors we are considering that will influence the timing of our restart, including 1) the health and safety of our employees, customers and partners, 11 | Q1.2020
2) local orders and public health concerns, 3) local housing market factors, and 4) confidence in our ability to consistently price and transact. Mortgages Segment We are continuing to innovate our mortgages technology platform while navigating the challenging mortgage rate market. We expect Q2 Mortgages revenue to be between $17 million and $20 million and Adjusted EBITDA to be between ($12) and ($9) million based upon capacity and current market conditions. Our new mortgage leadership continues to focus on building the technology, processes and operations to deliver an integrated lending experience for our customers. Summary The first quarter delivered incredible results despite being thrown a curve ball with COVID-19. The substantial improvements we made to our business in 2019 and early 2020 put us in a strong position - not only to weather current pressures, but to emerge from them in an even stronger competitive position. We are drawing upon decades of combined experience of our leadership in successfully navigating unexpected events and economic downturns to ensure we are well positioned to steer us through this pandemic. Our experience informs our disciplined approach to managing the business, including our rapid and deliberate responses to slow spending and preserve cash that have resulted in a stronger balance sheet and modified operations to give us the runway to push through the uncertainty with confidence and optimism. Last quarter, we put forth our key priorities for 2020 that focused on accelerating momentum in IMT and scaling our newer businesses. While we have not lost sight of these goals over the long term, our immediate priorities are: ● Protect the ZG enterprise, including protecting the health and safety of our people, customers, and partners ● Reduce costs ● Accelerate technology innovations to deliver seamless and, now, more virtual real estate shopping and transaction experiences ● Enhance our relative competitive position to lead the industry to Real Estate 2.0 12 | Q1.2020

We are more committed than ever to our mission t o give people the power to unlock life’s next chapter. In fact, it has even more meaning and relevance as it’s times like these we understand the r eal value of home. We encourage you to take a look at how this comes to life through quarantine in our new brand video and associated blog post that may be accessed in the right column link. 5 Click here to see the brand video Like you, we are learning as a team to virtually operate, manage and engage while still supporting our partners and serving our shared customers. Working from home has been enlightening and we are finding our teams to be highly productive. We recently announced the flexibility to allow the majority of our teams to work from home -- or anywhere -- through at least the end of 2020. We feel it is important to support our people with greater visibility and flexibility so they may adapt their home situation or location to better balance work with the uncertainties of life right now. While there are many unknowns, one thing is certain -- people will continue to move -- and dream. And, we will continue to innovate on behalf of our customers to deliver new tools, resources, services and opportunities to help buyers, sellers, renters and borrowers achieve their goals, even in a more virtual, socially distant world. Our leading brand and virtual innovations are providing solutions that are today’s necessities, and will soon be tomorrow’s expectations. We are working closely with our partners and industry leaders to move the industry forward and address antiquated processes and inefficiencies while enabling and accelerating innovation to ensure real estate is always on. We are better together. We appreciate your partnership in this journey. Stay safe. Sincerely, Rich Barton, Co-founder & CEO Allen Parker, CFO 5 h ttps://www.zillowgroup.com/covid-zillow-produces-new-ad-entirely-from-home/ 13 | Q1.2020
Forward-Looking Statements This communication contains forward-looking statements within the meaning of Section 27A of the Securities Act of 1933 and Section 21E of the Securities Exchange Act of 1934 that involve risks and uncertainties, including, without limitation, statements regarding our business outlook for 2020; the future performance and operation of the Homes, Mortgages and IMT segments in 2020 and beyond; and the current and future health and stability of the residential housing market and economy. Statements containing words such as “may,” “believe,” “anticipate,” “expect,” “intend,” “plan,” “project,” “predict,” “will,” “projections,” “continue,” “estimate,” “outlook,” “guidance,” or similar expressions, constitute forward- looking statements. Forward-looking statements are made based on assumptions as of May 7, 2020, and although we believe the expectations reflected in the forward-looking statements are reasonable, we cannot guarantee these results. Differences in Zillow Group’s actual results from those described in these forward-looking statements may result from actions taken by Zillow Group as well as from risks and uncertainties beyond Zillow Group’s control. Factors that may contribute to such differences include, but are not limited to, the impact of the novel coronavirus (“COVID-19”) pandemic and any associated economic downturn on Zillow Group’s future financial position, operations and financial performance; the magnitude, duration and severity of the COVID-19 pandemic; the current and future health and stability of the economy and residential housing market, including any extended slowdown in the real estate markets as a result of COVID-19; Zillow Group’s ability to execute on strategy; Zillow Group’s ability to maintain and effectively manage an adequate rate of growth; Zillow Group’s ability to innovate and provide products and services that are attractive to its users and advertisers; Zillow Group’s investment of resources to pursue strategies that may not prove effective; Zillow Group’s ability to compete successfully against existing or future competitors; the impact of pending legal proceedings described in Zillow Group’s filings with the Securities and Exchange Commission, or SEC; Zillow Group’s ability to successfully integrate and realize the benefits of its past or future strategic acquisitions or investments; Zillow Group’s ability to maintain or establish relationships with listings and data providers; the reliable performance of Zillow Group’s network infrastructure and content delivery processes; Zillow Group’s ability to obtain or maintain licenses and permits to support our current and future businesses; actual or anticipated changes to our products and services; and Zillow Group’s ability to protect its intellectual property. The foregoing list of risks and uncertainties is illustrative but not exhaustive. For more information about potential factors that could affect Zillow Group’s business and financial results, please review the “Risk Factors” described in Zillow Group’s Annual Report on Form 10-K for the year ended December 31, 2019 and in Zillow Group’s Quarterly Report on Form 10-Q for the quarterly period ended March 31, 2020 filed with the SEC and in other filings with the SEC. Except as may be required by law, Zillow Group does not intend, and undertakes no duty to update this information to reflect future events or circumstances. Use of Non-GAAP Financial Measures This communication includes references to Adjusted EBITDA (in total and for each segment, and including forecasted Adjusted EBITDA and EBITDA margin), Average Return on Homes Sold Before Interest Expense and Average Return on Homes Sold After Interest Expense, which are non-GAAP financial measures not prepared in conformity with accounting principles generally accepted in the United States (“GAAP”). These non-GAAP financial measures are not prepared under a comprehensive set of accounting rules and, therefore, should only be reviewed alongside results reported under GAAP. Adjusted EBITDA To provide investors with additional information regarding our financial results, this communication includes references to Adjusted EBITDA (in total and for each segment, and including forecasted Adjusted EBITDA and EBITDA margin), which is a non-GAAP financial measure. We have provided a reconciliation within this communication of Adjusted EBITDA in total to net loss and Adjusted EBITDA by segment to loss before income taxes for each segment, the most directly comparable GAAP financial measures.
Adjusted EBITDA is a key metric used by our management and board of directors to measure operating performance and trends, and to prepare and approve our annual budget. In particular, the exclusion of certain expenses in calculating Adjusted EBITDA facilitates operating performance comparisons on a period-to-period basis. Our use of Adjusted EBITDA in total and for each segment has limitations as an analytical tool, and you should not consider these measures in isolation or as a substitute for analysis of our results as reported under GAAP. Some of these limitations are: ▪ Adjusted EBITDA does not reflect our cash expenditures or future requirements for capital expenditures or contractual commitments; ▪ Adjusted EBITDA does not reflect changes in, or cash requirements for, our working capital needs; ▪ Adjusted EBITDA does not consider the potentially dilutive impact of share-based compensation; ▪ Although depreciation and amortization are non-cash charges, the assets being depreciated and amortized may have to be replaced in the future, and Adjusted EBITDA does not reflect cash capital expenditure requirements for such replacements or for new capital expenditure requirements; ▪ Adjusted EBITDA does not reflect impairment costs; ▪ Adjusted EBITDA does not reflect interest expense or other income; ▪ Adjusted EBITDA does not reflect income taxes; and ▪ Other companies, including companies in our own industry, may calculate Adjusted EBITDA differently than we do, limiting its usefulness as a comparative measure. Because of these limitations, you should consider Adjusted EBITDA in total and for each segment alongside other financial performance measures, including various cash flow metrics, net loss and loss before income taxes for each segment and our other GAAP results. The following tables present Adjusted EBITDA along with the most directly comparable GAAP financial measure, which is net loss on a consolidated basis and loss before income taxes for each segment along with the calculation of EBITDA margin and associated year over year growth rates and the most directly comparable GAAP financial measure and related year over growth rates, which is net loss margin on a consolidated basis and loss before income taxes margin for each segment, for the periods presented (in thousands, unaudited):
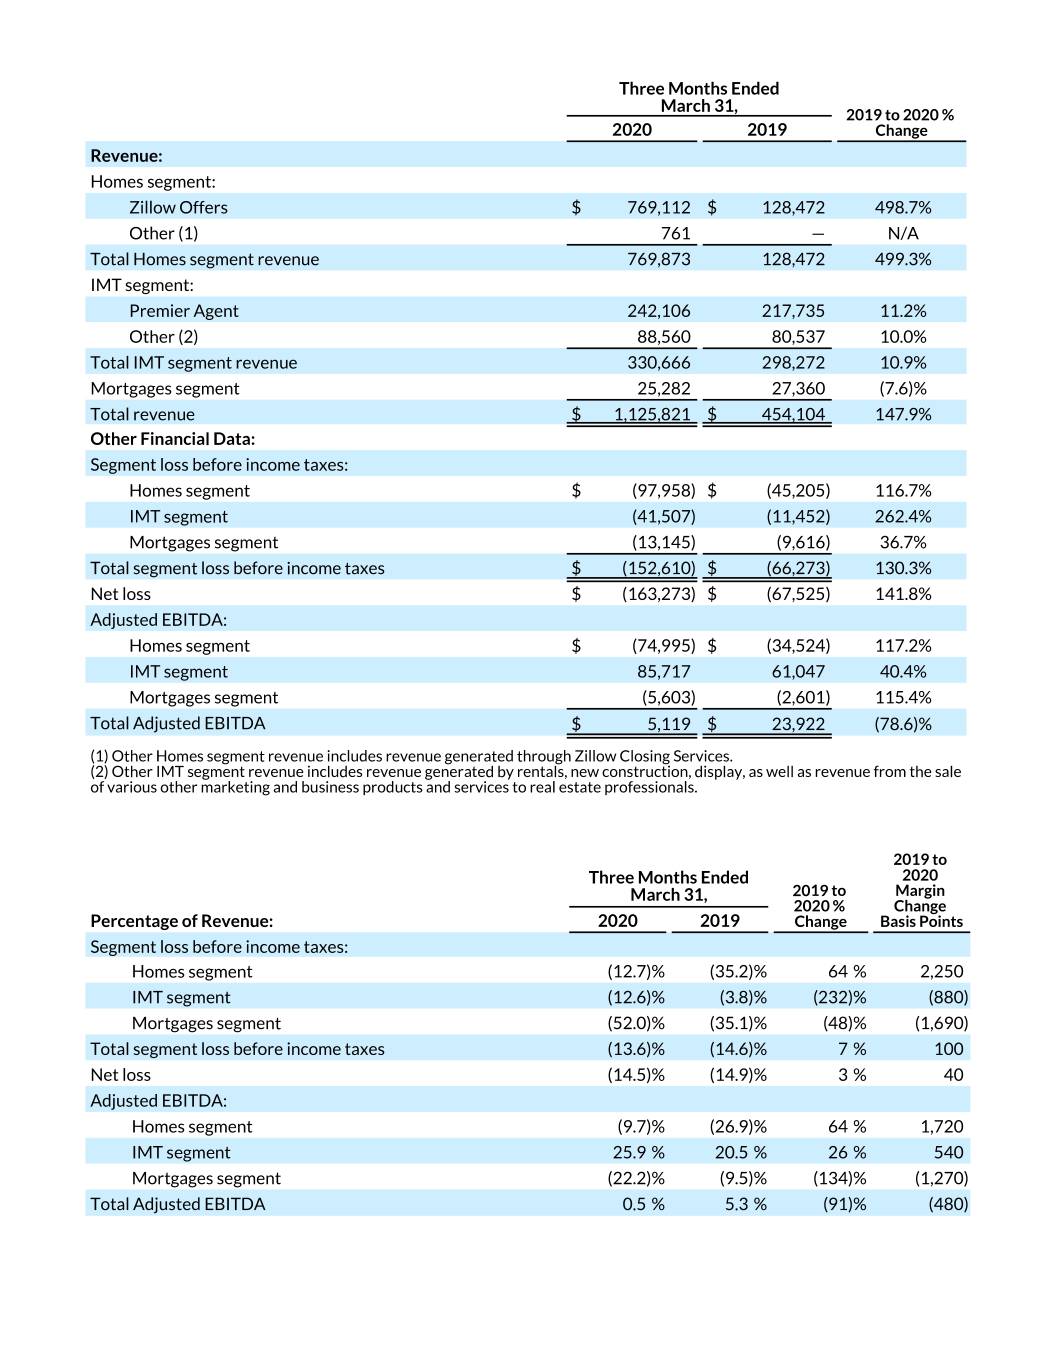
Three Months Ended March 31, 2019 to 2020 % 2020 2019 Change Revenue: Homes segment: Zillow Offers $ 769,112 $ 128,472 498.7% Other (1) 761 — N/A Total Homes segment revenue 769,873 128,472 499.3% IMT segment: Premier Agent 242,106 217,735 11.2% Other (2) 88,560 80,537 10.0% Total IMT segment revenue 330,666 298,272 10.9% Mortgages segment 25,282 27,360 (7.6)% Total revenue $ 1,125,821 $ 454,104 147.9% Other Financial Data: Segment loss before income taxes: Homes segment $ (97,958) $ (45,205) 116.7% IMT segment (41,507) (11,452) 262.4% Mortgages segment (13,145) (9,616) 36.7% Total segment loss before income taxes $ (152,610) $ (66,273) 130.3% Net loss $ (163,273) $ (67,525) 141.8% Adjusted EBITDA: Homes segment $ (74,995) $ (34,524) 117.2% IMT segment 85,717 61,047 40.4% Mortgages segment (5,603) (2,601) 115.4% Total Adjusted EBITDA $ 5,119 $ 23,922 (78.6)% (1) Other Homes segment revenue includes revenue generated through Zillow Closing Services. (2) Other IMT segment revenue includes revenue generated by rentals, new construction, display, as well as revenue from the sale of various other marketing and business products and services to real estate professionals. 2019 to Three Months Ended 2020 March 31, 2019 to Margin 2020 % Change Percentage of Revenue: 2020 2019 Change Basis Points Segment loss before income taxes: Homes segment (12.7)% (35.2)% 64 % 2,250 IMT segment (12.6)% (3.8)% (232)% (880) Mortgages segment (52.0)% (35.1)% (48)% (1,690) Total segment loss before income taxes (13.6)% (14.6)% 7 % 100 Net loss (14.5)% (14.9)% 3 % 40 Adjusted EBITDA: Homes segment (9.7)% (26.9)% 64 % 1,720 IMT segment 25.9 % 20.5 % 26 % 540 Mortgages segment (22.2)% (9.5)% (134)% (1,270) Total Adjusted EBITDA 0.5 % 5.3 % (91)% (480)
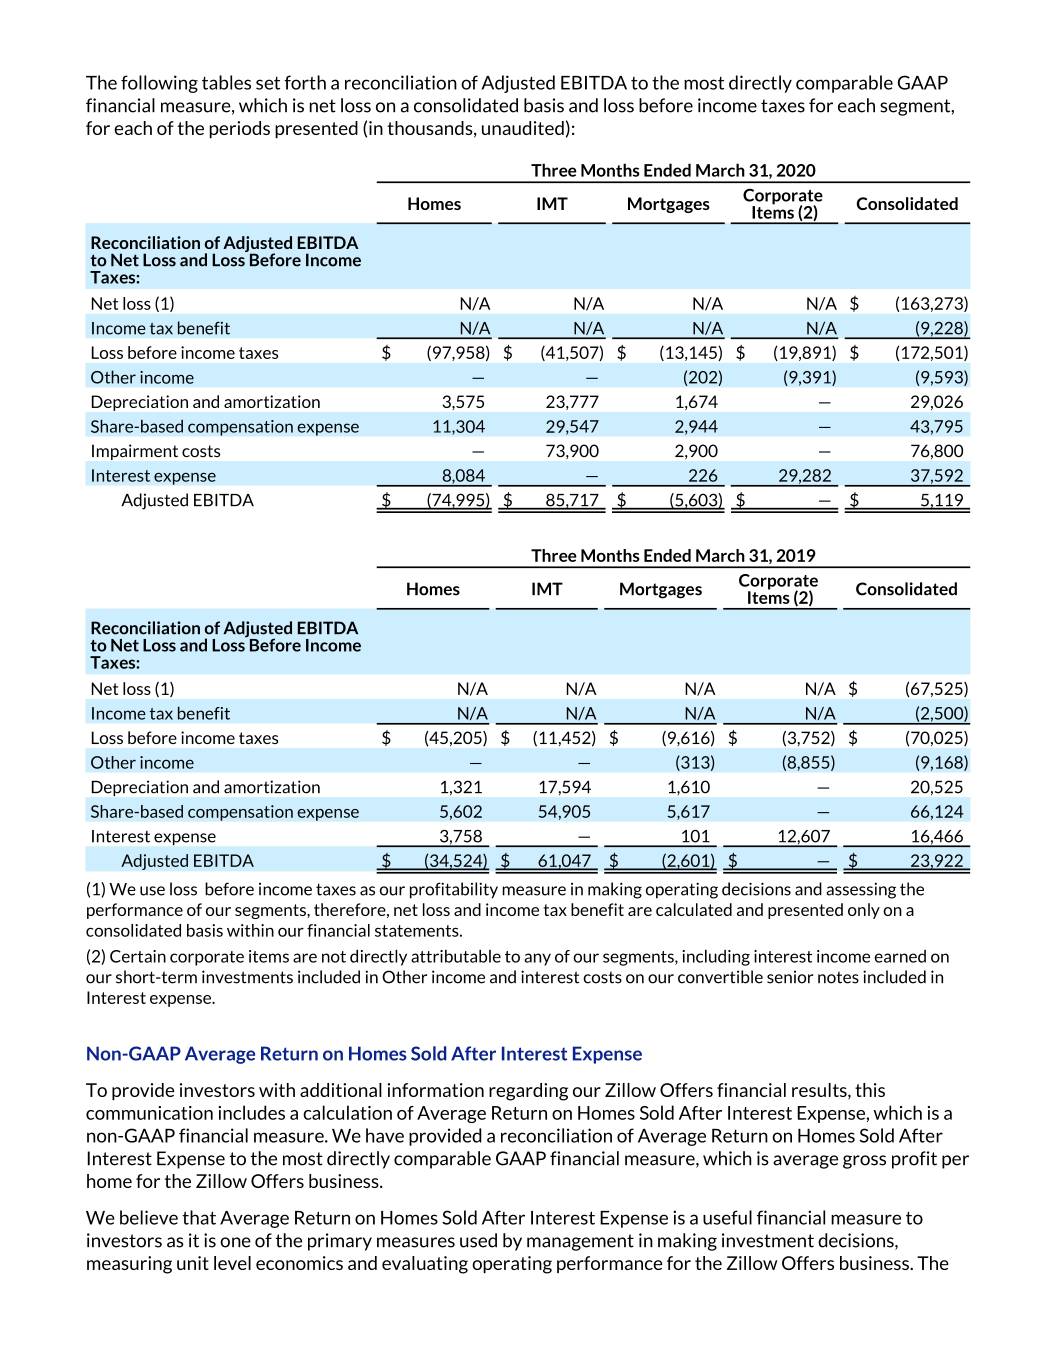
The following tables set forth a reconciliation of Adjusted EBITDA to the most directly comparable GAAP financial measure, which is net loss on a consolidated basis and loss before income taxes for each segment, for each of the periods presented (in thousands, unaudited): Three Months Ended March 31, 2020 Homes IMT Mortgages Corporate Consolidated Items (2) Reconciliation of Adjusted EBITDA to Net Loss and Loss Before Income Taxes: Net loss (1) N/A N/A N/A N/A $ (163,273) Income tax benefit N/A N/A N/A N/A (9,228) Loss before income taxes $ (97,958) $ (41,507) $ (13,145) $ (19,891) $ (172,501) Other income — — (202) (9,391) (9,593) Depreciation and amortization 3,575 23,777 1,674 — 29,026 Share-basedexpense compensation expense 11,304 29,547 2,944 — 43,795 Impairment costs — 73,900 2,900 — 76,800 Interest expense 8,084 — 226 29,282 37,592 Adjusted EBITDA $ (74,995) $ 85,717 $ (5,603) $ — $ 5,119 Three Months Ended March 31, 2019 Homes IMT Mortgages Corporate Consolidated Items (2) Reconciliation of Adjusted EBITDA to Net Loss and Loss Before Income Taxes: Net loss (1) N/A N/A N/A N/A $ (67,525) Income tax benefit N/A N/A N/A N/A (2,500) Loss before income taxes $ (45,205) $ (11,452) $ (9,616) $ (3,752) $ (70,025) Other income — — (313) (8,855) (9,168) Depreciation and amortization 1,321 17,594 1,610 — 20,525 Share-basedexpense compensation expense 5,602 54,905 5,617 — 66,124 Interest expense 3,758 — 101 12,607 16,466 Adjusted EBITDA $ (34,524) $ 61,047 $ (2,601) $ — $ 23,922 (1) We use loss before income taxes as our profitability measure in making operating decisions and assessing the performance of our segments, therefore, net loss and income tax benefit are calculated and presented only on a consolidated basis within our financial statements. (2) Certain corporate items are not directly attributable to any of our segments, including interest income earned on our short-term investments included in Other income and interest costs on our convertible senior notes included in Interest expense. Non-GAAP Average Return on Homes Sold After Interest Expense To provide investors with additional information regarding our Zillow Offers financial results, this communication includes a calculation of Average Return on Homes Sold After Interest Expense, which is a non-GAAP financial measure. We have provided a reconciliation of Average Return on Homes Sold After Interest Expense to the most directly comparable GAAP financial measure, which is average gross profit per home for the Zillow Offers business. We believe that Average Return on Homes Sold After Interest Expense is a useful financial measure to investors as it is one of the primary measures used by management in making investment decisions, measuring unit level economics and evaluating operating performance for the Zillow Offers business. The
measure is intended to convey the unit level economics of homes sold during the period by presenting the average revenue and associated expenses directly attributed to the homes sold. We believe this average per unit measure facilitates meaningful period over period comparisons notwithstanding variability in the number of homes sold during a period and indicates ability to generate average returns on assets sold after considering home purchase costs, renovation costs, holding costs and selling costs. We calculate the average return on homes sold after interest expense as revenue associated with homes sold during the period less direct costs attributable to those homes divided by the number of homes sold during the period. Specifically, direct costs include, with respect to each home sold during the period (1) home acquisition and renovation costs, which in turn include certain labor costs directly associated with these activities; (2) holding and selling costs; and (3) interest costs incurred. Included in direct holding and interest expense amounts for the periods presented are holding and interest costs recorded as period expenses in prior periods associated with homes sold in the presented period, which are not calculated in accordance with, or as an alternative for, GAAP and should not be considered in isolation or as a substitute for results reported under GAAP. Excluded from certain of these direct cost amounts are costs recorded in the presented period related to homes that remain in inventory at the end of the period, as shown in the tables below. We make these period adjustments because we believe presenting Average Return on Homes Sold After Interest Expense in this manner provides a focused view on a subset of our assets - homes sold during the period - and reflecting costs associated with those homes sold from the time we acquire to the time we sell the home, which may be useful to investors. Average Return on Homes Sold After Interest Expense is intended to illustrate the performance of homes sold during the period and is not intended to be a segment or company performance metric. Average Return on Homes Sold After Interest Expense is a supplemental measure of operating performance for a subset of assets and has limitations as an analytical tool, and you should not consider it in isolation or as a substitute for analysis of our results as reported under GAAP. Some of these limitations are: • Although depreciation and amortization are non-cash charges, the assets being depreciated and amortized may have to be replaced in the future, and Average Return on Homes Sold After Interest Expense does not reflect capital expenditure requirements for such replacements or for new capital expenditure requirements; • Average Return on Homes Sold After Interest Expense does not consider the potentially dilutive impact of share-based compensation; • Average Return on Homes Sold After Interest Expense does not include period costs that were not eligible for inventory capitalization associated with homes held in inventory at the end of the period; • Average Return on Homes Sold After Interest Expense does not reflect indirect expenses included in cost of revenue, sales and marketing, technology and development, or general and administrative expenses, some of which are recurring cash expenditures necessary to operate the business; and • Average Return on Homes Sold After Interest Expense does not reflect income taxes. The calculation of Average Return on Homes Sold After Interest Expense includes only those expenses directly attributed to the homes sold during the period. To arrive at return on homes sold after interest expense, the Company deducts from Zillow Offers gross profit (1) holding costs incurred in the presented period and prior periods for homes sold during the presented period that are included in sales and marketing expense, (2) selling costs incurred in the presented period for homes sold during the presented period that are included in sales and marketing expense and (3) interest expense incurred in the presented and prior periods for homes sold during the presented period. The Company adds to Zillow Offers gross profit (1) inventory valuation adjustments recorded during the period associated with homes that remain in inventory at period end, net of inventory valuation adjustments recorded in prior periods related to homes sold in the presented period, and indirect expenses included in cost of revenue and (2) share-based compensation expense and depreciation and amortization expense included in cost of revenue. The following table presents the calculation of Zillow Offers average gross profit per home and Average Return on Homes Sold After Interest Expense and a reconciliation of return on homes sold after interest expense to Zillow Offers gross profit for the periods presented (unaudited):
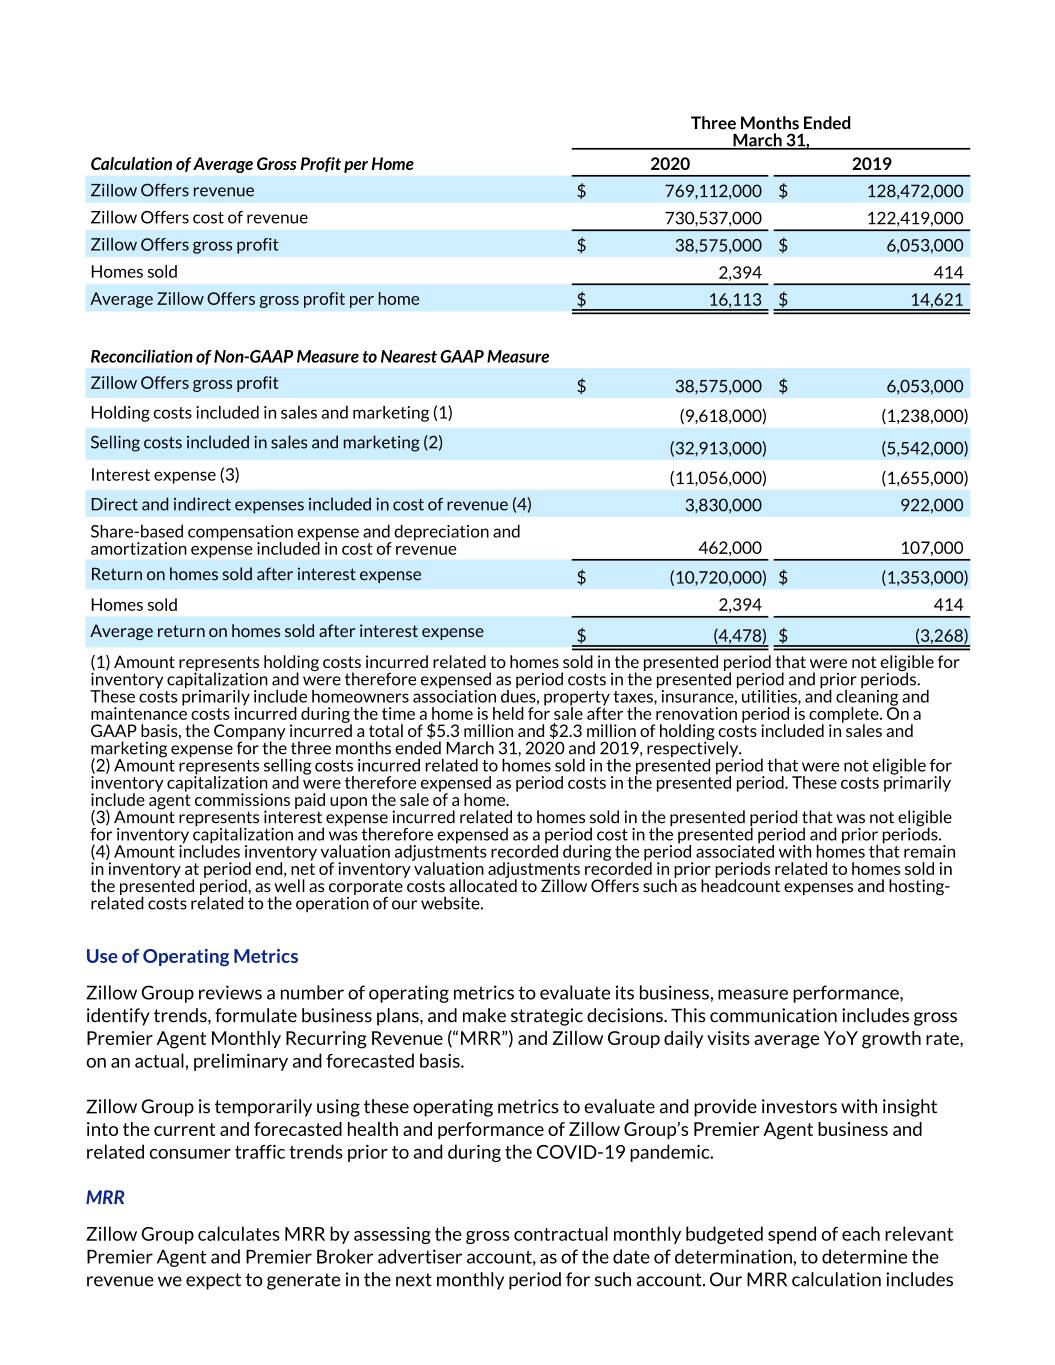
Three Months Ended March 31, Calculation of Average Gross Profit per Home 2020 2019 Zillow Offers revenue $ 769,112,000 $ 128,472,000 Zillow Offers cost of revenue 730,537,000 122,419,000 Zillow Offers gross profit $ 38,575,000 $ 6,053,000 Homes sold 2,394 414 Average Zillow Offers gross profit per home $ 16,113 $ 14,621 Reconciliation of Non-GAAP Measure to Nearest GAAP Measure Zillow Offers gross profit $ 38,575,000 $ 6,053,000 Holding costs included in sales and marketing (1) (9,618,000) (1,238,000) Selling costs included in sales and marketing (2) (32,913,000) (5,542,000) Interest expense (3) (11,056,000) (1,655,000) Direct and indirect expenses included in cost of revenue (4) 3,830,000 922,000 Share-based compensation expense and depreciation and amortization expense included in cost of revenue 462,000 107,000 Return on homes sold after interest expense $ (10,720,000) $ (1,353,000) Homes sold 2,394 414 Average return on homes sold after interest expense $ (4,478) $ (3,268) (1) Amount represents holding costs incurred related to homes sold in the presented period that were not eligible for inventory capitalization and were therefore expensed as period costs in the presented period and prior periods. These costs primarily include homeowners association dues, property taxes, insurance, utilities, and cleaning and maintenance costs incurred during the time a home is held for sale after the renovation period is complete. On a GAAP basis, the Company incurred a total of $5.3 million and $2.3 million of holding costs included in sales and marketing expense for the three months ended March 31, 2020 and 2019, respectively. (2) Amount represents selling costs incurred related to homes sold in the presented period that were not eligible for inventory capitalization and were therefore expensed as period costs in the presented period. These costs primarily include agent commissions paid upon the sale of a home. (3) Amount represents interest expense incurred related to homes sold in the presented period that was not eligible for inventory capitalization and was therefore expensed as a period cost in the presented period and prior periods. (4) Amount includes inventory valuation adjustments recorded during the period associated with homes that remain in inventory at period end, net of inventory valuation adjustments recorded in prior periods related to homes sold in the presented period, as well as corporate costs allocated to Zillow Offers such as headcount expenses and hosting- related costs related to the operation of our website. Use of Operating Metrics Zillow Group reviews a number of operating metrics to evaluate its business, measure performance, identify trends, formulate business plans, and make strategic decisions. This communication includes gross Premier Agent Monthly Recurring Revenue (“MRR”) and Zillow Group daily visits average YoY growth rate, on an actual, preliminary and forecasted basis. Zillow Group is temporarily using these operating metrics to evaluate and provide investors with insight into the current and forecasted health and performance of Zillow Group’s Premier Agent business and related consumer traffic trends prior to and during the COVID-19 pandemic. MRR Zillow Group calculates MRR by assessing the gross contractual monthly budgeted spend of each relevant Premier Agent and Premier Broker advertiser account, as of the date of determination, to determine the revenue we expect to generate in the next monthly period for such account. Our MRR calculation includes
all Premier Agent and Premier Broker revenue generating products and services (except for Flex) and assumes that there will not be changes to pricing or purchase or cancellation of any products or services that may be applicable to that account. Discounts do not impact MRR, as they do not change the contractual budgeted spend. Unless otherwise indicated in the communication, actual MRR is determined as of the end of each applicable period and preliminary and forecasted MRR is calculated based on the mid-point of our outlook as of the date of this communication. MRR is not determined by reference to historical revenue, deferred revenue, or any other GAAP financial measure over any period. It is forward-looking and contractually derived as of the date of determination. Zillow Group Visits We define a visit as a group of interactions by users with the Zillow, Trulia and StreetEasy mobile applications and websites. A single visit can contain multiple page views and actions, and a single user can open multiple visits across domains, web browsers, desktop or mobile devices. Visits can occur on the same day, or over several days, weeks or months. Zillow and StreetEasy measure visits with Google Analytics, and Trulia measures visits with Adobe Analytics. Visits to Trulia end after thirty minutes of user inactivity. Visits to Zillow and StreetEasy end either: (i) after thirty minutes of user inactivity or at midnight; or (ii) through a campaign change. A visit ends through a campaign change if a visitor arrives via one campaign or source (for example, via a search engine or referring link on a third-party website), leaves the mobile application or website, and then returns via another campaign or source. For purposes of this communication and in order to provide investors with greater insight into consumer traffic to Zillow, Trulia and StreetEasy prior to and during the COVID-19 pandemic as compared with the same period in 2019, Zillow Group calculates the daily visits average year-over-year growth rate by (i) calculating the percentage change in visits on each date during the applicable period compared to the visits for the same date in the prior year (“Daily Visits YoY Growth Rate”) and (ii) averaging the Daily Visits YoY Growth Rate using a 7-day trailing average for each day during the applicable period.