AMTB 8-K
Amerant Bancorp Inc. (AMTB)
8-K
2021-10-20
For: 2021-10-20
View Original
Added on
April 08, 2026
UNITED STATES
SECURITIES AND EXCHANGE COMMISSION
WASHINGTON, D.C. 20549
FORM 8-K
CURRENT REPORT
PURSUANT TO SECTION 13 OR 15(d) OF THE SECURITIES EXCHANGE ACT OF 1934
Date of Report (Date of earliest event reported): October 20, 2021

(Exact name of registrant as specified in its charter)
| (State or other jurisdiction of incorporation | (Commission file number) | (IRS Employer Identification Number) | ||||||||||||
(Address of principal executive offices)
(305 ) 460-8728
(Registrant's telephone number, including area code)
Check the appropriate box below if the Form 8-K filing is intended to simultaneously satisfy the filing obligation of the registrant under any of the following provisions:
| Written communications pursuant to Rule 425 under the Securities Act (17 CFR 230.425) | |||||
| Soliciting material pursuant to Rule 14a-12 under the Exchange Act (17 CFR 240.14a-12) | |||||
| Pre-commencement communications pursuant to Rule 14d-2(b) under the Exchange Act (17 CFR 240.14d-2(b)) | |||||
| Pre-commencement communications pursuant to Rule 13e-4(c) under the Exchange Act (17 CFR 240.13e-4(c)) | |||||
Securities registered pursuant to Section 12(b) of the Act:
| Title of each class | Trading Symbols | Name of exchange on which registered | ||||||
Indicate by check mark whether the registrant is an emerging growth company as defined in Rule 405 of the Securities Act of 1933 (17 CFR§230.405) or Rule 12b-2 of the Securities Exchange Act of 1934 (17 CFR §240.12b-2).
| Emerging growth company | ||||||||
If an emerging growth company, indicate by check mark if the registrant has elected not to use the extended transition period for complying with any new or revised financial accounting standards provided pursuant to Section 13(a) of the Exchange Act. ☐
Item 2.02 Results of Operations and Financial Condition
On October 20, 2021, Amerant Bancorp Inc. (the "Company") issued a press release to report the Company’s financial results for the fiscal quarter ended September 30, 2021. The release is attached as Exhibit 99.1 to this Current Report on Form 8-K and incorporated by reference to this Item 2.02.
In accordance with General Instruction B.2. of Form 8-K, the information in this Item 2.02 of this Current Report on Form 8-K, including Exhibit 99.1 attached hereto, is being “furnished” and shall not be deemed “filed” for the purposes of Section 18 of the Securities Exchange Act of 1934, as amended, or otherwise subject to the liabilities of that section, nor shall it be deemed incorporated by reference in any filing under the Securities Act of 1933, as amended, or the Securities Exchange Act of 1934, as amended, except as shall be expressly set forth by specific reference in such filing.
Item 7.01 Regulation FD Disclosure
On October 21, 2021, the Company will hold a live audio webcast to discuss its financial results for the fiscal quarter ended September 30, 2021. In connection with the webcast, the Company is furnishing to the U.S. Securities and Exchange Commission the earnings slide presentation attached as Exhibit 99.2 to this Current Report on Form 8-K and incorporated by reference to this Item 7.01.
In accordance with General Instruction B.2 of Form 8-K, the information in this Item 7.01 of this Current Report on Form 8-K, including Exhibit 99.2 attached hereto, is being “furnished” and shall not be deemed “filed” for the purposes of Section 18 of the Securities Exchange Act of 1934, as amended, or otherwise subject to the liabilities of that section, nor shall it be deemed incorporated by reference in any filing under the Securities Act of 1933, as amended, or the Securities Exchange Act of 1934, as amended, except as shall be expressly set forth by specific reference in such a filing.
Item 9.01 Financial Statements and Exhibits
Number | Exhibit | ||||
99.1 | |||||
99.2 | |||||
104 | Cover Page Interactive Data File (embedded within the Inline XBRL document) | ||||
SIGNATURES
Pursuant to the requirements of the Securities Exchange Act of 1934, the registrant has duly caused this report to be signed on its behalf by the undersigned hereunto duly authorized.
| Date: October 20, 2021 | Amerant Bancorp Inc. | |||||||||||||
| By: | /s/ Julio V. Pena | |||||||||||||
| Name: Julio V. Pena | ||||||||||||||
| Title: Senior Vice President, Securities Counsel and Assistant Corporate Secretary | ||||||||||||||
CONTACTS: | ||||||||
Investors | ||||||||
| Laura Rossi | ||||||||
(305) 460-8728 | ||||||||
| Media | ||||||||
| Silvia M. Larrieu | ||||||||
(305) 441-8414 | ||||||||
AMERANT REPORTS THIRD QUARTER 2021 NET INCOME OF $17.0 MILLION, DILUTED EARNINGS PER SHARE OF $0.45
Continued Improvement in All Key Performance Metrics Over Prior Quarters
CORAL GABLES, FLORIDA, October 21, 2021. Amerant Bancorp Inc. (NASDAQ: AMTB and AMTBB) (the “Company” or “Amerant”) today reported net income attributable to the Company of $17.0 million in the third quarter of 2021, or $0.45 per diluted share, an increase compared to net income attributable to the Company of $16.0 million, or $0.42 per diluted share, in the second quarter of 2021 and net income attributable to the Company of $1.7 million, or $0.04 per diluted share, in the third quarter of 2020. Pre-provision net revenue (“PPNR”)1 was $17.5 million in the third quarter of 2021, an increase from $15.4 million in the second quarter of 2021, and a decrease from $20.1 million in the third quarter of 2020. Core pre-provision net revenue (“Core PPNR”)1 was $18.3 million in the third quarter of 2021, an increase from $16.9 million in the second quarter of 2021, and an increase from $13.4 million in the third quarter of 2020.
Annualized return on assets (“ROA”) and return on equity (“ROE”) were 0.90% and 8.38%, respectively, in the third quarter of 2021, compared to 0.83% and 8.11%, respectively, in the second quarter of 2021, and 0.08% and 0.81%, respectively, in the third quarter of 2020.
Jerry Plush, vice chairman, president and CEO said, ”We are pleased to report continued improvement in our operating results, which reflects the focus our team has placed on achieving the key priorities we set out during our first quarter 2021 earnings call. We have more opportunities in process that, when implemented, will further improve future operating results. The positive momentum we have is evident and we will continue to strive to achieve the high-performance standards we believe we can attain.”
1
Summary Results
Results of the third quarter ended September 30, 2021 were as follows:
•Net income was $17.0 million in the third quarter of 2021, up 6.7% from $16.0 million in the second quarter of 2021, and up 900.7% from $1.7 million in the third quarter of 2020. Core net income1 was $17.7 million in the third quarter of 2021 compared to $17.2 million in the second quarter of 2021, and compared to core net loss1 of $3.6 million in the third quarter of 2020.
•Net Interest Income (“NII”) was $51.8 million, up 3.7% from $50.0 million in the second quarter of 2021, and up 14.3% from $45.3 million in the third quarter of 2020. Net interest margin (“NIM”) was 2.94% in the third quarter of 2021, up 13 basis points from 2.81% in the second quarter of 2021 and up 55 basis points from 2.39% in the third quarter of 2020.
•Released $5.0 million from the allowance for loan losses (“ALL”) during the third and second quarters of 2021, compared to a provision of $18.0 million recorded in the third quarter of 2020. The ratio of allowance for loan losses to total loans held for investment was 1.59% as of September 30, 2021, down from 1.86% as of June 30, 2021 and down from 1.97% as of September 30, 2020. The ratio of net charge-offs to average total loans in the third quarter of 2021 was 1.16% compared to 0.12% in the second quarter of 2021 and 1.41% in the third quarter of 2020.
•Noninterest income was $13.4 million in the third quarter of 2021, down 14.6% from $15.7 million in the second quarter of 2021, and down 33.8% from $20.3 million in the third quarter of 2020, as the third quarter of 2020 included higher net gains on sale of securities.
•Noninterest expense was $48.4 million, down 5.3% from $51.1 million in the second quarter of 2021, and up 6.4% from $45.5 million in the third quarter of 2020.
•The efficiency ratio was 74.2% in the third quarter of 2021, compared to 77.8% in the second quarter of 2021, and 69.3% for the third quarter of 2020. Core efficiency ratio1 was 72.95% in the third quarter of 2021, compared to 74.45% in the second quarter of 2021, and 76.53% for the third quarter of 2020.
•Total loans, which include loans held for sale, were $5.5 billion at the close of the third quarter of 2021, down $129.6 million, or 2.3%, compared to the close of the second quarter of 2021. Total deposits were $5.6 billion at the close of the third quarter of 2021, slightly down $48.5 million, or 0.9%, compared to the close of the second quarter of 2021.
•Stockholders’ book value per common share attributable to the Company increased to $21.68 at September 30, 2021, compared to $21.27 at June 30, 2021. Tangible book value per common share (“TBV”)1 increased to $21.08 as of September 30, 2021, compared to $20.67 at June 30, 2021.
2
Credit Quality
The ALL was $83.4 million at the close of the third quarter of 2021, compared to $104.2 million at the close of the second quarter of 2021, and $116.8 million at the close of the third quarter of 2020. The Company released $5.0 million from the ALL in both the third and second quarters of 2021, compared to a provision of $18.0 million recorded in the third quarter of 2020. The ALL release during the third quarter of 2021 was primarily attributed to (i) a release of approximately $2 million as a result of upgrades, payoffs and pay downs of non-performing loans and special mention loans, and (ii) a release of approximately $3 million due to lower loan volume and the decision to classify $219 million New York Commercial Real Estate (“CRE”) loans as available for sale at September 30, 2021. These loans are recorded at the lower of their carrying cost or fair value, which did not have an impact to earnings, but resulted in additional loan loss reserve release. The ALL associated with the COVID-19 pandemic remained flat at approximately $14.4 million in the third quarter compared to $14.8 million in the second quarter of 2021, and decreased compared to $26.2 million in the third quarter of 2020.
Net charge-offs during the third quarter of 2021 totaled $15.7 million, compared to $1.8 million in the second quarter of 2021 and $20.8 million in the third quarter of 2020. From the charge-offs in the third quarter of 2021, $5.7 million were in connection with the Coffee Trader relationship. There was no impact to earnings as $16.4 million out of the $17.1 million in charge-offs were reserved for in previous quarters as a result of impairment analysis performed on non-performing loans. The $39.8 million Coffee Trader relationship had an outstanding balance of $13.9 million as of the end of the third quarter of 2021. Charge-offs to date in connection with this relationship total $25.0 million, together with a $0.9 million partial payment received during the third quarter of 2020.
Classified and special mention loans decreased 31.3% and 16.4% compared to the second quarter of 2021, respectively, and 3.8% and 9.8% compared to the third quarter of 2020, respectively.
Non-performing assets totaled $92.5 million at the end of the third quarter of 2021, a decrease of $29.0 million or 23.8%, compared to the second quarter of 2021, and an increase of $6.0 million, or 7.0%, compared to the third quarter of 2020 due to the decrease in classified loans mentioned above. The ratio of non-performing assets to total assets at the end of the third quarter of 2021 was 124 basis points, down 37 basis points from the second quarter of 2021 and up 16 basis points from the third quarter of 2020. In the third quarter of 2021, the ratio of ALL to non-performing loans increased to 100.8%, from 86.0% at June 30, 2021 and decreased from 135.1% at the close of the third quarter of 2020. As previously disclosed, during 2021 the Company obtained independent third-party collateral valuations on over 80% of non-performing loans, which were over $1 million and had real estate as collateral, supporting current ALL levels. No additional loan loss reserves were deemed necessary as a result of these valuations.
3
Loans and Deposits
Total loans, including loans held for sale, as of September 30, 2021 were $5.5 billion, down $129.6 million, or 2.3%, compared to June 30, 2021. Total loans includes loans held for sale which totaled $224.9 million and $1.8 million as September 30, 2021 and June 30, 2021, respectively. The decrease in total loans was primarily due to loan production being offset by approximately $325 million in prepayments received in CRE and C&I loans and delays in expected closings at the end of the third quarter. During the third quarter of 2021, the Company continued to purchase higher yielding indirect consumer loans. Consumer loans as of September 30, 2021 were $358.5 million, an increase of $47.6 million, or 15.3%, quarter over quarter. The Company purchased approximately $80.3 million of higher-yielding indirect consumer loans during the third quarter of 2021.
Core deposits as of September 30, 2021 were $4.2 billion, an increase of $141.7 million or 3.5%, compared to June 30, 2021. This includes noninterest bearing deposits of $1.21 billion as of September 30, 2021 compared to $1.07 billion as of June 30, 2021. Total deposits as of September 30, 2021 totaled $5.6 billion, slightly down $48.5 million, or 0.9%, compared to June 30, 2021. Domestic deposits totaled $3.1 billion, down $50.0 million, or 1.6%, compared to June 30, 2021, while foreign deposits totaled $2.5 billion, up $1.4 million, or 0.06%, compared to June 30, 2021.
The quarter-over-quarter decline in total deposits was primarily attributable to a reduction of $190.3 million, or 11.7%, in time deposits. Customer CDs compared to the prior quarter decreased $135.5 million, or 10.9%, as the Company continued to lower CD rates and focus on increasing core deposits and emphasizing multi-product relationships versus single product higher-cost CDs. During the third quarter of 2021 customer transaction account balances increased $185.2 million, or 4.7%, compared to June 30, 2021, with noninterest bearing, savings and money market and interest bearing deposits contributing 79%, 6% and 16% to such growth, respectively. Brokered time deposits decreased $54.8 million, or 14.0%, compared to June 30, 2021, and brokered interest bearing and money market deposits during the third quarter of 2021 decreased $43.5 million, or 30.9%, as we continue to de-emphasize this funding source.
Net Interest Income and Net Interest Margin
Third quarter 2021 NII was $51.8 million, up $1.9 million, or 3.7%, from $50.0 million in the second quarter of 2021 and up $6.5 million, or 14.3%, from $45.3 million in the third quarter of 2020. The quarter-over-quarter increase was primarily driven by (i) lower overall deposit costs resulting from declines in average CD balances, downward repricing of time deposits and increased average balances in noninterest bearing deposits; (ii) higher average loan and investment yields, the first being due to an increase in higher-yielding consumer loans; (iii) higher investment portfolio average balances as the Company began redeploying its excess cash and cash equivalents during the period; and (iv) Lower cost and average balances on FHLB advances and borrowings, following the Company’s repayment and rate modification of FHLB advances in May 2021. Of note, cost of total deposits decreased 8 basis points during the third quarter of 2021 compared to the second quarter of 2021. Partially offsetting the increase in NII were lower average loan balances due to higher prepayment activity and delays in expected closings at the end of the third quarter.
4
The year-over-year increase in NII was primarily driven by higher average loan and investment yields and lower deposit costs as well as lower average balances on time deposits. Lower cost and average balances on FHLB advances and other borrowings also contributed to the increase. Partially offsetting the year-over-year NII increase were lower average balances on loans as well as available for sale securities and higher average balances on core deposits.
NIM was 2.94% in the third quarter of 2021, up 13 basis points from 2.81% in the second quarter of 2021 and up 55 basis points from 2.39% in the third quarter of 2020. In order to contain NIM pressure, during the third quarter of 2021, Amerant continued to focus on (i) decreasing cost of funds via strategic repricing of customer time and commercial relationship money market deposits and (ii) proactively seeking to increase spreads in loan origination.
As of September 30, 2021, Amerant had $290 million of time deposits maturing in the fourth quarter of 2021. This is expected to decrease the average cost of CDs by approximately 5 basis points and the overall cost of deposits by approximately 1bps. Year-to-date, Amerant has been able to retain approximately 60% of maturing CDs via renewals at lower rates or conversion into core deposits.
Noninterest income
In the third quarter of 2021, noninterest income was $13.4 million, down 14.6% from $15.7 million in the second quarter of 2021. The decrease was primarily driven by events that occurred during the second quarter that did not reoccur in the third quarter, including: (i) a net gain of $3.8 million in connection with the sale of $95.1 million of PPP loans in May 2021; (ii) a $2.5 million net loss on early extinguishment of FHLB advances recorded in the second quarter of 2021, as the company repaid $235 million of FHLB advances; and (iii) a $1.3 million in net gain on sale of securities recorded in the second quarter of 2021. Also, contributing to the lower noninterest income was a decrease of $0.8 million in customer derivative income in the third quarter of 2021. The quarter-over-quarter decrease in noninterest income was partially offset by mortgage banking income of $0.7 million and an increase of $0.2 million in fees from brokerage, advisory and fiduciary activities.
Noninterest income decreased $6.9 million, or 33.8%, in the third quarter of 2021 from $20.3 million in the third quarter of 2020. The year-over-year decrease in noninterest income was primarily driven by an $8.6 million decrease in net gains on sale of securities. Partially offsetting the decrease were $0.4 million higher derivative client income and mortgage banking income of $0.7 million. Higher total deposit and service fees as well as fee income from brokerage, advisory and fiduciary activities in the third quarter of 2021 compared to the third quarter of 2020 also contributed to the offset to the decrease in noninterest income year-over-year.
Amerant Mortgage, Inc. (“AMTM”) continues to execute on its growth strategy. In the third quarter of 2021, AMTM received 108 applications and funded 39 loans totaling $17.9 million.
The Company’s assets under management and custody (“AUM”) totaled $2.19 billion as of September 30, 2021, increasing $55.8 million, or 2.6%, from $2.13 billion as of June 30, 2021, and $425.5 million, or 24.1%, from $1.76 billion as of September 30, 2020. The quarter-over-quarter increase in AUMs was mainly driven by net new assets of $40.2 million. The year-over-year increase in AUMs was primarily driven by increased market value and net new assets of $124.2 million. Net new assets represent 72.0% and 29.2% of the quarter-over-quarter and
5
year-over-year increases, respectively, as the Company continues to build on its advisory client-focused and relationship-centric strategy.
Noninterest expense
Third quarter of 2021 noninterest expense was $48.4 million, down $2.7 million, or 5.3%, from $51.1 million in the second quarter of 2021. The decrease was primarily driven by lower salaries and employee benefits expenses due to the $3.3 million in severance expenses that the Company recorded in the second quarter of 2021 and did not reoccur in the third quarter of 2021. Additionally, the third quarter noninterest expense includes lower occupancy and equipment expenses, as the second quarter 2021 results included a non-recurring $0.8 million lease impairment charge in connection with the closing of the NYC Loan Production Office (“LPO”). There were also lower consulting, legal and other professional fees as well as various other noninterest expenses, which also contributed to the decrease quarter over quarter. Partially offsetting the decrease in noninterest expense were higher variable compensation expenses resulting from higher estimated payouts under the Company's variable compensation programs as well as higher salaries and employee benefits expenses in connection with new hires in the mortgage banking business. Higher depreciation and amortization costs related to the closure of the Wellington branch also contributed to the offset to the decrease in noninterest expense.
Noninterest expense in the third quarter of 2021, increased $2.9 million, or 6.4% compared to $45.5 million in the third quarter of 2020. This increase was primarily driven by higher salaries and employee benefits due to increased variable compensation resulting from (i) the new long term incentive program which was launched in February 2021, and (ii) adjustments to the Company’s non-equity variable compensation program in 2021, at expected performance levels, after having curtailed it in 2020 due to the COVID-19 pandemic. Higher salaries and employee benefits expenses in connection with new hires, primarily in the mortgage banking business, also contributed to the increase in noninterest expense. Additionally, there were higher professional and other services fees, primarily in connection with the onboarding of the new firm as a result of outsourcing of the Company’s internal audit function, as well as other professional fees, increased rent expense due to the leasing of the Beacon operation center (previously owned) in the third quarter of 2021 and higher telecommunication and data processing expenses compared to the third quarter of 2020. Partially offsetting the increase in noninterest expense were lower severance costs and consulting fees during the third quarter of 2021 compared to the third quarter of 2020. Year-to-date, the mortgage business has recorded $3.7 million in noninterest expenses, from which $3.1 million are related to salaries and employee benefits expenses, $0.3 million to professional fees, and the balance to other noninterest expenses.
Restructuring expenses totaled $0.8 million in the third quarter of 2021, compared to $4.2 million in the second quarter of 2021 and $1.8 million in the third quarter of 2020, primarily due to lower staff reduction costs compared to the second quarter of 2021, as well as the second quarter of 2021 including a nonrecurring lease impairment charge on the NYC LPO.
The efficiency ratio was 74.2% in the third quarter of 2021, compared to 77.8% in the second quarter of 2021, and 69.3% in the third quarter of 2020. The quarter-over-quarter improvement in the efficiency ratio was primarily driven by lower severance expenses incurred during the third quarter of 2021. Partially offsetting this improvement were higher salaries and employee benefits in connection with the investment in building the Amerant Mortgage team, as noted above. The year-over-year increase in the efficiency ratio was primarily attributable to higher salaries and employee benefits previously referenced above. Core efficiency ratio1 improved to
6
72.95% in the third quarter of 2021 compared to 74.45% in the second quarter of 2021 and 76.53% in the third quarter of 2020.
As part of Amerant’s efforts to make banking easier and provide an enhanced banking experience for customers, the Company signed agreements with leading technology platforms, Alloy and ClickSWITCH®, during the third quarter of 2021. Alloy's Application Programming Interface (“API) service will facilitate and automate the customer onboarding process, online and in branches, for both businesses and individuals, enhancing the protocols in place to capture and review customer data for a more efficient compliance process. ClickSWITCH’s platform is expected to improve share of wallet and customer experience by simplifying and radically reducing the time it takes for consumer and small business customers to switch their direct deposits and automatic payments to Amerant.
As part of Amerant’s keen focus on operating efficiency, during the third quarter of 2021 the Company signed a 10-year lease for a 56,494-square-foot office space in the Miramar Park of Commerce, in Miramar, Florida, where it will relocate its operations center by the end of 2022. The Company closed a banking center in Wellington, FL in October 2021. In addition, as Amerant continues to explore potential expansion opportunities within its core footprint, in the third quarter, after finding such an opportunity in downtown Miami, submitted its application to the OCC to open a new branch in this location.
Capital Resources and Liquidity
The Company’s capital continues to be strong and well in excess of the minimum regulatory requirements to be considered “well-capitalized” at September 30, 2021.
Stockholders’ equity attributable to the Company totaled $812.7 million as of September 30, 2021, up $13.6 million, or 1.7%, from $799.1 million as of June 30, 2021. This was primarily driven by net income in the third quarter of 2021, partially offset by the decline of $2.5 million in the fair value of debt securities available for sale, and $1.2 million in Class B shares repurchased by the Company during the third quarter of 2021. Stockholders’ equity attributable to the Company increased $29.2 million, or 3.7%, in the first nine months of 2021 from $783.4 million as of December 31, 2020.This was primarily driven by net income in the first nine months of 2021, partially offset by the decline of $10.2 million in the fair value of debt securities available for sale, and $9.6 million in Class B shares repurchased by the Company during the first nine months of 2021. Book value per common share increased to $21.68 at September 30, 2021 compared to $21.27 at June 30, 2021. TBV1 increased to $21.08 at September 30, 2021 compared to $20.67 at June 30, 2021.
During the third quarter of 2021, the Company continued to demonstrate its commitment to increasing total return to shareholders. As announced during the second quarter of 2021, the Company received a $40 million dividend giving the Company more capacity and flexibility for general corporate purposes, including share repurchases. On September 10, 2021 the board of directors authorized a new share repurchase program, under which the Company may purchase, from time to time, up to $50 million of Class A common stock (the “Class A Repurchase Program”). As of September 30, 2021, the Company had repurchased approximately $9.6 million of Class B shares since the launch of its Class B share repurchase program in March 2021, which was terminated by the Company in September 2021. Additionally, as previously announced on September 13, 2021, the Company intends to effect a clean-up merger (the “Merger”), subject to shareholder approval, providing for (i) each outstanding share of Class B common stock to be automatically converted to 0.95 of a share of Class A common stock and (ii)
7
a new class of non-voting Class A common stock to be created. The Company intends to hold a special shareholders meeting (the “Special Meeting”) on November 15, 2021, to seek approval of the Merger.
Amerant’s liquidity position continues to be strong and includes cash and cash equivalents of $166.2 million at the close of the third quarter of 2021, compared to $171.5 million as of June 30, 2021, and $214.4 million as of December 31, 2020. Additionally, as of September 30, 2021, the Company had $1.4 billion in available borrowing capacity with the FHLB, compared to $1.5 billion in the second quarter of 2021.
1 Non-GAAP measure, see “Non-GAAP Financial Measures” for more information and Exhibit 2 for a reconciliation to GAAP.
Third Quarter 2021 Earnings Conference Call
As previously announced, the Company will hold an earnings conference call on Thursday, October 21, 2021 at 9:00 a.m. (Eastern Time) to discuss its third quarter 2021 results. The conference call and presentation materials can be accessed via webcast by logging on from the Investor Relations section of the company’s website at https://investor.amerantbank.com. The online replay will remain available for approximately one month following the call through the above link.
About Amerant Bancorp Inc. (NASDAQ: AMTB and AMTBB)
Amerant Bancorp Inc. is a bank holding company headquartered in Coral Gables, Florida since 1979. The Company operates through its main subsidiary, Amerant Bank, N.A. (the “Bank”), as well as its other subsidiaries: Amerant Investments, Inc., Elant Bank and Trust Ltd., and Amerant Mortgage, LLC. The Company provides individuals and businesses in the U.S., as well as select international clients, with deposit, credit and wealth management services. The Bank, which has operated for over 40 years, is the second largest community bank headquartered in Florida. As of September 30, 2021, the Bank operated 25 banking centers – 18 in South Florida and 7 in Houston, Texas. For more information, visit investor.amerantbank.com.
Alloy is used with permission.
ClickSWITCH® is a registered trademark of ClickSWITCH, LLC. and is used with permission.
Cautionary Notice Regarding Forward-Looking Statements
This press release contains “forward-looking statements” within the meaning of the Securities Act of 1933 and the Securities Exchange Act of 1934, including statements regarding the proposed Merger, the Class A Repurchase Program and the Company’s ability to obtain shareholder approval for the Merger, as well as statements with respect to the Company’s objectives, expectations and intentions and other statements that are not historical facts. All statements other than statements of historical fact are statements that could be forward-looking statements. You can identify these forward-looking statements through our use of words such as “may,” “will,” “anticipate,” “assume,” “should,” “indicate,” “would,” “believe,” “contemplate,” “expect,” “estimate,” “continue,” “plan,” “point to,” “project,” “could,” “intend,” “target,” “goals,” “outlooks,” “modeled,” “dedicated,” “create,” and other similar words and expressions of the future.
8
Forward-looking statements, including those as to our beliefs, plans, objectives, goals, expectations, anticipations, estimates and intentions, involve known and unknown risks, uncertainties and other factors, which may be beyond our control, and which may cause the Company’s actual results, performance, achievements, or financial condition to be materially different from future results, performance, achievements, or financial condition expressed or implied by such forward-looking statements. You should not rely on any forward-looking statements as predictions of future events. You should not expect us to update any forward-looking statements, except as required by law. All written or oral forward-looking statements attributable to us are expressly qualified in their entirety by this cautionary notice, together with those risks and uncertainties described in “Risk factors” in our annual report on Form 10-K for the fiscal year ended December 31, 2020, in our quarterly report on Form 10-Q for the quarter ended June 30, 2021 and in our other filings with the U.S. Securities and Exchange Commission (the “SEC”), which are available at the SEC’s website www.sec.gov.
Interim Financial Information
Unaudited financial information as of and for interim periods, including as of and for the three and nine months ended September 30, 2021 and 2020, may not reflect our results of operations for our fiscal year ending, or financial condition as of December 31, 2021, or any other period of time or date.
Non-GAAP Financial Measures
The Company supplements its financial results that are determined in accordance with accounting principles generally accepted in the United States of America (“GAAP”) with non-GAAP financial measures, such as “pre-provision net revenue (PPNR)”, “core pre-provision net revenue (Core PPNR)”, “core net income (loss)”, “core net income (loss) per share (basic and diluted)”, “core return on assets (ROA)”, “core return on equity (ROE)”, and “core efficiency ratio”. This supplemental information is not required by, or are not presented in accordance with GAAP. The Company refers to these financial measures and ratios as “non-GAAP financial measures” and they should not be considered in isolation or as a substitute for the GAAP measures presented herein.
We use certain non-GAAP financial measures, including those mentioned above, both to explain our results to shareholders and the investment community and in the internal evaluation and management of our businesses. Our management believes that these non-GAAP financial measures and the information they provide are useful to investors since these measures permit investors to view our performance using the same tools that our management uses to evaluate our past performance and prospects for future performance, especially in light of the additional costs we have incurred in connection with the Company’s restructuring activities that began in 2018 and have continued into 2021, including the effect of non-core banking activities such as the sale of loans and securities, and other non-recurring actions intended to improve customer service and operating performance. While we believe that these non-GAAP financial measures are useful in evaluating our performance, this information should be considered as supplemental and not as a substitute for or superior to the related financial information prepared in accordance with GAAP. Additionally, these non-GAAP financial measures may differ from similar measures presented by other companies.
Exhibit 2 reconciles these non-GAAP financial measures to reported results.
9
10
Exhibit 1- Selected Financial Information
The following table sets forth selected financial information derived from our unaudited and audited consolidated financial statements.
(in thousands) | September 30, 2021 | June 30, 2021 | March 31, 2021 | December 31, 2020 | September 30, 2020 | ||||||||||||||||||||||||
| Consolidated Balance Sheets | |||||||||||||||||||||||||||||
| Total assets | $ | 7,489,305 | $ | 7,532,844 | $ | 7,751,098 | $ | 7,770,893 | $ | 7,977,047 | |||||||||||||||||||
| Total investments | 1,422,738 | 1,359,240 | 1,375,292 | 1,372,567 | 1,468,796 | ||||||||||||||||||||||||
| Total gross loans (1) | 5,478,924 | 5,608,548 | 5,754,838 | 5,842,337 | 5,924,617 | ||||||||||||||||||||||||
| Allowance for loan losses | 83,442 | 104,185 | 110,940 | 110,902 | 116,819 | ||||||||||||||||||||||||
| Total deposits | 5,626,377 | 5,674,908 | 5,678,079 | 5,731,643 | 5,877,546 | ||||||||||||||||||||||||
| Core deposits (2) | 4,183,587 | 4,041,867 | 3,795,949 | 3,690,081 | 3,623,647 | ||||||||||||||||||||||||
| Advances from the FHLB and other borrowings | 809,095 | 808,614 | 1,050,000 | 1,050,000 | 1,050,000 | ||||||||||||||||||||||||
| Senior notes | 58,815 | 58,736 | 58,656 | 58,577 | 58,498 | ||||||||||||||||||||||||
| Junior subordinated debentures | 64,178 | 64,178 | 64,178 | 64,178 | 64,178 | ||||||||||||||||||||||||
| Stockholders' equity (3) | 812,662 | 799,068 | 785,014 | 783,421 | 829,533 | ||||||||||||||||||||||||
Assets under management and custody (4) | 2,188,317 | 2,132,516 | 2,018,870 | 1,972,321 | 1,762,803 | ||||||||||||||||||||||||
Three Months Ended | Nine Months Ended September 30, | ||||||||||||||||||||||||||||||||||||||||
(in thousands, except percentages and per share amounts) | September 30, 2021 | June 30, 2021 | March 31, 2021 | December 31, 2020 | September 30, 2020 | 2021 | 2020 | ||||||||||||||||||||||||||||||||||
Consolidated Results of Operations | |||||||||||||||||||||||||||||||||||||||||
| Net interest income | $ | 51,821 | $ | 49,971 | $ | 47,569 | $ | 48,652 | $ | 45,348 | $ | 149,361 | $ | 140,900 | |||||||||||||||||||||||||||
| (Reversal of) provision for loan losses | (5,000) | (5,000) | — | — | 18,000 | (10,000) | 88,620 | ||||||||||||||||||||||||||||||||||
| Noninterest income | 13,434 | 15,734 | 14,163 | 11,515 | 20,292 | 43,331 | 61,955 | ||||||||||||||||||||||||||||||||||
| Noninterest expense | 48,404 | 51,125 | 43,625 | 51,629 | 45,500 | 143,154 | 127,107 | ||||||||||||||||||||||||||||||||||
| Net income (loss) attributable to Amerant Bancorp Inc. (5) | 17,031 | 15,962 | 14,459 | 8,473 | 1,702 | 47,452 | (10,195) | ||||||||||||||||||||||||||||||||||
| Effective income tax rate | 24.96 | % | 22.65 | % | 20.15 | % | 0.76 | % | 20.47 | % | 22.74 | % | 20.80 | % | |||||||||||||||||||||||||||
Common Share Data | |||||||||||||||||||||||||||||||||||||||||
| Stockholders' book value per common share | $ | 21.68 | $ | 21.27 | $ | 20.70 | $ | 20.70 | $ | 19.68 | $ | 21.68 | $ | 19.68 | |||||||||||||||||||||||||||
| Tangible stockholders' equity (book value) per common share (6) | $ | 21.08 | $ | 20.67 | $ | 20.13 | $ | 20.13 | $ | 19.17 | $ | 21.08 | $ | 19.17 | |||||||||||||||||||||||||||
| Basic earnings (loss) per common share | $ | 0.46 | $ | 0.43 | $ | 0.38 | $ | 0.21 | $ | 0.04 | $ | 1.27 | $ | (0.24) | |||||||||||||||||||||||||||
| Diluted earnings (loss) per common share (7) | $ | 0.45 | $ | 0.42 | $ | 0.38 | $ | 0.20 | $ | 0.04 | $ | 1.26 | $ | (0.24) | |||||||||||||||||||||||||||
| Basic weighted average shares outstanding | 37,134 | 37,330 | 37,618 | 41,326 | 41,722 | 37,359 | 41,875 | ||||||||||||||||||||||||||||||||||
| Diluted weighted average shares outstanding (7) | 37,518 | 37,693 | 37,846 | 41,688 | 42,065 | 37,684 | 41,875 | ||||||||||||||||||||||||||||||||||
11
| Three Months Ended | Nine Months Ended September 30, | ||||||||||||||||||||||||||||||||||||||||
| September 30, 2021 | June 30, 2021 | March 31, 2021 | December 31, 2020 | September 30, 2020 | 2021 | 2020 | |||||||||||||||||||||||||||||||||||
| Other Financial and Operating Data (8) | |||||||||||||||||||||||||||||||||||||||||
| Profitability Indicators (%) | |||||||||||||||||||||||||||||||||||||||||
| Net interest income / Average total interest earning assets (NIM) (9) | 2.94 | % | 2.81 | % | 2.66 | % | 2.61 | % | 2.39 | % | 2.81 | % | 2.49 | % | |||||||||||||||||||||||||||
| Net income (loss) / Average total assets (ROA) (10) | 0.90 | % | 0.83 | % | 0.76 | % | 0.42 | % | 0.08 | % | 0.83 | % | (0.17) | % | |||||||||||||||||||||||||||
| Net income (loss) / Average stockholders' equity (ROE) (11) | 8.38 | % | 8.11 | % | 7.47 | % | 4.09 | % | 0.81 | % | 8.01 | % | (1.62) | % | |||||||||||||||||||||||||||
| Noninterest income / Total revenue (12) | 20.59% | 23.95% | 22.94% | 19.14% | 30.91% | 22.49% | 30.54% | ||||||||||||||||||||||||||||||||||
| Capital Indicators (%) | |||||||||||||||||||||||||||||||||||||||||
| Total capital ratio (13) | 14.53 | % | 14.17 | % | 14.12 | % | 13.96 | % | 14.56 | % | 14.53 | % | 14.56 | % | |||||||||||||||||||||||||||
| Tier 1 capital ratio (14) | 13.28 | % | 12.92 | % | 12.87 | % | 12.71 | % | 13.30 | % | 13.28 | % | 13.30 | % | |||||||||||||||||||||||||||
| Tier 1 leverage ratio (15) | 11.18 | % | 10.75 % | 10.54 | % | 10.11 | % | 10.52 | % | 11.18 | % | 10.52 | % | ||||||||||||||||||||||||||||
| Common equity tier 1 capital ratio (CET1) (16) | 12.31 | % | 11.95 | % | 11.90 | % | 11.73 | % | 12.34 | % | 12.31 | % | 12.34 | % | |||||||||||||||||||||||||||
| Tangible common equity ratio (17) | 10.58 | % | 10.35 | % | 9.88 | % | 9.83 | % | 10.16 | % | 10.58 | % | 10.16 | % | |||||||||||||||||||||||||||
| Asset Quality Indicators (%) | |||||||||||||||||||||||||||||||||||||||||
| Non-performing assets / Total assets (18) | 1.24 | % | 1.61 | % | 1.16 | % | 1.13 | % | 1.08 | % | 1.24 | % | 1.08 | % | |||||||||||||||||||||||||||
| Non-performing loans / Total loans (1) (19) | 1.51 | % | 2.16 | % | 1.56 | % | 1.50 | % | 1.46 | % | 1.51 | % | 1.46 | % | |||||||||||||||||||||||||||
| Allowance for loan losses / Total non-performing loans | 100.84 | % | 86.02 | % | 123.92 | % | 126.46 | % | 135.09 | % | 100.84 | % | 135.09 | % | |||||||||||||||||||||||||||
| Allowance for loan losses / Total loans held for investment (1) | 1.59 | % | 1.86 | % | 1.93 | % | 1.90 | % | 1.97 | % | 1.59 | % | 1.97 | % | |||||||||||||||||||||||||||
| Net charge-offs / Average total loans held for investment (20) | 1.16 | % | 0.12 | % | — | % | 0.40 | % | 1.41 | % | 0.42 | % | 0.56 | % | |||||||||||||||||||||||||||
| Efficiency Indicators (% except FTE) | |||||||||||||||||||||||||||||||||||||||||
| Noninterest expense / Average total assets | 2.55 | % | 2.67 | % | 2.28 | % | 2.59 | % | 2.24 | % | 2.50 | % | 2.11 | % | |||||||||||||||||||||||||||
| Salaries and employee benefits / Average total assets | 1.53 | % | 1.61 | % | 1.38 | % | 1.62 | % | 1.39 | % | 1.51 | % | 1.31 | % | |||||||||||||||||||||||||||
| Other operating expenses/ Average total assets (21) | 1.02 | % | 1.06 | % | 0.90 | % | 0.97 | % | 0.85 | % | 0.99 | % | 0.79 | % | |||||||||||||||||||||||||||
| Efficiency ratio (22) | 74.18 | % | 77.80 | % | 70.67 | % | 85.81 | % | 69.32 | % | 74.29 | % | 62.66 | % | |||||||||||||||||||||||||||
| Full-Time-Equivalent Employees (FTEs) (23) | 733 | 719 | 731 | 713 | 807 | 733 | 807 | ||||||||||||||||||||||||||||||||||
12
| Three Months Ended | Nine Months Ended September 30, | ||||||||||||||||||||||||||||||||||||||||
(in thousands, except percentages and per share amounts) | September 30, 2021 | June 30, 2021 | March 31, 2021 | December 31, 2020 | September 30, 2020 | 2021 | 2020 | ||||||||||||||||||||||||||||||||||
| Core Selected Consolidated Results of Operations and Other Data (6) | |||||||||||||||||||||||||||||||||||||||||
| Pre-provision net revenue (PPNR) | $ | 17,485 | $ | 15,397 | $ | 18,107 | $ | 8,538 | $ | 20,140 | $ | 50,989 | $ | 75,748 | |||||||||||||||||||||||||||
| Core pre-provision net revenue (Core PPNR) | $ | 18,297 | $ | 16,934 | $ | 15,765 | $ | 17,641 | $ | 13,387 | $ | 50,996 | $ | 53,382 | |||||||||||||||||||||||||||
| Core net income (loss) | $ | 17,669 | $ | 17,199 | $ | 12,589 | $ | 20,917 | $ | (3,638) | $ | 47,457 | $ | (27,909) | |||||||||||||||||||||||||||
| Core basic earnings (loss) per common share | 0.48 | 0.46 | 0.33 | 0.50 | (0.09) | 1.27 | (0.67) | ||||||||||||||||||||||||||||||||||
| Core earnings (loss) per diluted common share (7) | 0.47 | 0.46 | 0.33 | 0.50 | (0.09) | 1.26 | (0.67) | ||||||||||||||||||||||||||||||||||
| Core net income (loss) / Average total assets (Core ROA) (10) | 0.93 | % | 0.90 | % | 0.66 | % | 1.05 | % | (0.18) | % | 0.83 | % | (0.46) | % | |||||||||||||||||||||||||||
| Core net income (loss) / Average stockholders' equity (Core ROE) (11) | 8.69 | % | 8.74 | % | 6.50 | % | 10.08 | % | (1.74) | % | 8.01 | % | (4.42) | % | |||||||||||||||||||||||||||
| Core efficiency ratio (24) | 72.95 | % | 74.45 | % | 73.35 | % | 71.02 | % | 76.53 | % | 73.58 | % | 69.84 | % | |||||||||||||||||||||||||||
__________________
(1) Total loans include loans held for investment net of unamortized deferred loan origination fees and costs. In addition, at September 30, 2021 and March 31, 2021, total loans include $219.1 million and $1.0 million, respectively, in loans held for sale carried at the lower of cost or estimated fair value. In addition, as of September 30, 2021 and June 30, 2021, total loans include $5.8 million and $1.8 million, respectively, in mortgage loans held for sale carried at fair value.
(2) Core deposits consist of total deposits excluding all time deposits.
(3) On March 10, 2021, the Company’s Board of Directors approved a stock repurchase program which provides for the potential repurchase of up to $40 million of shares of the Company’s Class B common stock (the “2021 Stock Repurchase Program”). In the third, second and first quarters of 2021, the Company repurchased an aggregate of 63,000, 386,195 and 116,037 shares of Class B common stock, respectively, at a weighted average price per share of $18.55, $16.62 and $15.98, respectively, under the 2021 Stock Repurchase Program. In the fourth quarter of 2020, the Company completed a modified “Dutch auction” tender offer to purchase, for cash, up to $50.0 million of shares of its Class B common stock, and accepted to purchase 4,249,785 shares of Class B common stock in the tender offer at a price of $12.55 per share. The purchase price for this transaction was approximately $54.1 million, including $0.8 million in related fees and other expenses.
(4) Assets held for clients in an agency or fiduciary capacity which are not assets of the Company and therefore are not included in the consolidated financial statements.
(5) In the three months ended September 30, 2021 and June 30, 2021, and in the nine months ended September 30, 2021, net income exclude losses of $0.6 million, $0.8 million and $1.5 million, respectively, attributable to a 49% minority interest of Amerant Mortgage LLC. We had no minority interest at any of the other periods shown.
(6) This presentation contains adjusted financial information determined by methods other than GAAP. This adjusted financial information is reconciled to GAAP in Exhibit 2 - Non-GAAP Financial Measures Reconciliation.
(7) In the three months ended September 30, 2021 and June 30, 2021 and in the nine months ended September 30, 2021, potential dilutive instruments consisted of unvested shares of restricted stock, restricted stock units and performance share units (restricted stock and restricted stock units for all of the other periods shown). For the nine months ended September 30, 2020, potential dilutive instruments were not included in the diluted earnings per share computation because the Company reported a net loss and their inclusion would have an antidilutive effect. For all other periods presented, potential dilutive instruments were included in the diluted earnings per share computation because, when the unamortized deferred compensation cost related to these shares was divided by the average market price per share in those periods, fewer shares would have been purchased than restricted shares assumed issued. Therefore, in those periods, such awards resulted in higher diluted weighted average shares outstanding than basic weighted average shares outstanding, and had a dilutive effect in per share earnings.
(8) Operating data for the periods presented have been annualized.
13
(9) NIM is defined as NII divided by average interest-earning assets, which are loans, securities, deposits with banks and other financial assets which yield interest or similar income.
(10)Calculated based upon the average daily balance of total assets.
(11) Calculated based upon the average daily balance of stockholders’ equity.
(12) Total revenue is the result of net interest income before provision for loan losses plus noninterest income.
(13) Total stockholders’ equity divided by total risk-weighted assets, calculated according to the standardized regulatory capital ratio calculations.
(14) Tier 1 capital divided by total risk-weighted assets. Tier 1 capital is composed of Common Equity Tier 1 (CET1) capital plus outstanding qualifying trust preferred securities of $62.3 million at each of all the dates presented.
(15) Tier 1 capital divided by quarter to date average assets.
(16)CET1 capital divided by total risk-weighted assets.
(17) Tangible common equity is calculated as the ratio of common equity less goodwill and other intangibles divided by total assets less goodwill and other intangible assets. Other intangibles assets consist of, among other things, mortgage servicing rights and are included in other assets in the Company’s consolidated balance sheets.
(18)Non-performing assets include all accruing loans past due by 90 days or more, all nonaccrual loans, restructured loans that are considered “troubled debt restructurings” or “TDRs”, and OREO properties acquired through or in lieu of foreclosure.
(19)Non-performing loans include all accruing loans past due by 90 days or more, all nonaccrual loans and restructured loans that are considered TDRs.
(20)Calculated based upon the average daily balance of outstanding loan principal balance net of unamortized deferred loan origination fees and costs, excluding the allowance for loan losses. During the third and second quarters of 2021, there were net charge offs of $15.7 million and $1.8 million, respectively. In the first quarter of 2021, there were zero net charge offs. During the third quarters of 2021 and 2020, the Company charged off $5.7 million and $19.3 million, respectively, against the allowance for loan losses as result of the deterioration of one commercial loan relationship.
(21)Other operating expenses is the result of total noninterest expense less salary and employee benefits.
(22)Efficiency ratio is the result of noninterest expense divided by the sum of noninterest income and NII.
(23)As of September 30, 2021 and June 30, 2021, includes 52 and 38 FTEs for Amerant Mortgage LLC, respectively.
(24)Core efficiency ratio is the efficiency ratio less the effect of restructuring costs and other adjustments, described in Exhibit 2 - Non-GAAP Financial Measures Reconciliation.
14
Exhibit 2- Non-GAAP Financial Measures Reconciliation
The following table sets forth selected financial information derived from the Company’s interim unaudited and annual audited consolidated financial statements, adjusted for certain costs incurred by the Company in the periods presented related to tax deductible restructuring costs, provision for (reversal of) loan losses, provision for income tax expense (benefit), the effect of non-core banking activities such as the sale of loans and securities, and other non-recurring actions intended to improve customer service and operating performance. The Company believes these adjusted numbers are useful to understand the Company’s performance absent these transactions and events.
| Three Months Ended, | Nine Months Ended September 30, | |||||||||||||||||||||||||
(in thousands) | September 30, 2021 | June 30, 2021 | March 31, 2021 | December 31, 2020 | September 30, 2020 | 2021 | 2020 | |||||||||||||||||||
| Net income (loss) attributable to Amerant Bancorp Inc. | $ | 17,031 | $ | 15,962 | $ | 14,459 | $ | 8,473 | $ | 1,702 | $ | 47,452 | $ | (10,195) | ||||||||||||
| Plus: (reversal of) provision for loan losses | (5,000) | (5,000) | — | — | 18,000 | (10,000) | 88,620 | |||||||||||||||||||
| Plus: provision for income tax expense (benefit) | 5,454 | 4,435 | 3,648 | 65 | 438 | 13,537 | (2,677) | |||||||||||||||||||
| Pre-provision net revenue (PPNR) | 17,485 | 15,397 | 18,107 | 8,538 | 20,140 | 50,989 | 75,748 | |||||||||||||||||||
| Plus: restructuring costs before income tax effect | 758 | 4,164 | 240 | 8,407 | 1,846 | 5,162 | 3,518 | |||||||||||||||||||
| Less: non-routine noninterest income items | 54 | (2,627) | (2,582) | 696 | (8,599) | (5,155) | (25,884) | |||||||||||||||||||
| Core pre-provision net revenue | $ | 18,297 | $ | 16,934 | $ | 15,765 | $ | 17,641 | $ | 13,387 | $ | 50,996 | $ | 53,382 | ||||||||||||
| Total noninterest income | $ | 13,434 | $ | 15,734 | $ | 14,163 | $ | 11,515 | $ | 20,292 | $ | 43,331 | $ | 61,955 | ||||||||||||
| Less: Non-routine noninterest income items: | ||||||||||||||||||||||||||
Loss on sale of the Beacon operations center (1) | — | — | — | (1,729) | — | — | — | |||||||||||||||||||
| Securities (loss) gains, net | (54) | 1,329 | 2,582 | 1,033 | 8,599 | 3,857 | 25,957 | |||||||||||||||||||
| Loss on early extinguishment of FHLB advances, net | — | (2,488) | — | — | — | (2,488) | (73) | |||||||||||||||||||
| Gain on sale of loans | — | 3,786 | — | — | — | 3,786 | — | |||||||||||||||||||
| Total non-routine noninterest income items | $ | (54) | $ | 2,627 | $ | 2,582 | $ | (696) | $ | 8,599 | $ | 5,155 | $ | 25,884 | ||||||||||||
| Core noninterest income | $ | 13,488 | $ | 13,107 | $ | 11,581 | $ | 12,211 | $ | 11,693 | $ | 38,176 | $ | 36,071 | ||||||||||||
| Total noninterest expenses | $ | 48,404 | $ | 51,125 | $ | 43,625 | $ | 51,629 | $ | 45,500 | $ | 143,154 | $ | 127,107 | ||||||||||||
| Less: restructuring costs (2): | ||||||||||||||||||||||||||
| Staff reduction costs (3) | 250 | 3,322 | 6 | 5,345 | 646 | 3,578 | 1,060 | |||||||||||||||||||
| Legal and Consulting fees | 412 | — | — | — | — | 412 | — | |||||||||||||||||||
| Digital transformation expenses | 96 | 32 | 234 | 658 | 1,200 | 362 | 2,458 | |||||||||||||||||||
| Lease impairment charge | — | 810 | — | — | — | 810 | — | |||||||||||||||||||
| Branch closure expenses | — | — | — | 2,404 | — | — | — | |||||||||||||||||||
| Total restructuring costs | $ | 758 | $ | 4,164 | $ | 240 | $ | 8,407 | $ | 1,846 | $ | 5,162 | $ | 3,518 | ||||||||||||
| Core noninterest expenses | $ | 47,646 | $ | 46,961 | $ | 43,385 | $ | 43,222 | $ | 43,654 | $ | 137,992 | $ | 123,589 | ||||||||||||
15
| Three Months Ended, | Nine Months Ended September 30, | |||||||||||||||||||||||||
(in thousands, except percentages and per share amounts) | September 30, 2021 | June 30, 2021 | March 31, 2021 | December 31, 2020 | September 30, 2020 | 2021 | 2020 | |||||||||||||||||||
| Net income (loss) attributable to Amerant Bancorp Inc. | $ | 17,031 | $ | 15,962 | $ | 14,459 | $ | 8,473 | $ | 1,702 | $ | 47,452 | $ | (10,195) | ||||||||||||
| Plus after-tax restructuring costs: | ||||||||||||||||||||||||||
| Restructuring costs before income tax effect | 758 | 4,164 | 240 | 8,407 | 1,846 | 5,162 | 3,518 | |||||||||||||||||||
| Income tax effect (4) | (229) | (897) | (48) | (6,455) | (385) | (1,174) | (732) | |||||||||||||||||||
| Total after-tax restructuring costs | 529 | 3,267 | 192 | 1,952 | 1,461 | 3,988 | 2,786 | |||||||||||||||||||
| Less before-tax non-routine items in noninterest income: | 54 | (2,627) | (2,582) | 696 | (8,599) | (5,155) | (25,884) | |||||||||||||||||||
| Income tax effect (4) | 55 | 597 | 520 | 9,796 | 1,798 | 1,172 | 5,384 | |||||||||||||||||||
| Total after-tax non-routine items in noninterest income | 109 | (2,030) | (2,062) | 10,492 | (6,801) | (3,983) | (20,500) | |||||||||||||||||||
| Core net income (loss) | $ | 17,669 | $ | 17,199 | $ | 12,589 | $ | 20,917 | $ | (3,638) | $ | 47,457 | $ | (27,909) | ||||||||||||
| Basic earnings (loss) per share | $ | 0.46 | $ | 0.43 | $ | 0.38 | $ | 0.21 | $ | 0.04 | $ | 1.27 | $ | (0.24) | ||||||||||||
| Plus: after tax impact of restructuring costs | 0.02 | 0.09 | 0.01 | 0.04 | 0.04 | 0.11 | 0.06 | |||||||||||||||||||
| Less: after tax impact of non-routine items in noninterest income | — | (0.06) | (0.06) | 0.25 | (0.17) | (0.11) | (0.49) | |||||||||||||||||||
| Total core basic earnings (loss) per common share | $ | 0.48 | $ | 0.46 | $ | 0.33 | $ | 0.50 | $ | (0.09) | $ | 1.27 | $ | (0.67) | ||||||||||||
| Diluted earnings (loss) per share (5) | $ | 0.45 | $ | 0.42 | $ | 0.38 | $ | 0.20 | $ | 0.04 | $ | 1.26 | $ | (0.24) | ||||||||||||
| Plus: after tax impact of restructuring costs | 0.02 | 0.09 | 0.01 | 0.05 | 0.04 | 0.11 | 0.06 | |||||||||||||||||||
| Less: after tax impact of non-routine items in noninterest income | — | (0.05) | (0.06) | 0.25 | (0.17) | (0.11) | (0.49) | |||||||||||||||||||
| Total core diluted earnings (loss) per common share | $ | 0.47 | $ | 0.46 | $ | 0.33 | $ | 0.50 | $ | (0.09) | $ | 1.26 | $ | (0.67) | ||||||||||||
| Net income (loss) / Average total assets (ROA) | 0.90 | % | 0.83 | % | 0.76 | % | 0.42 | % | 0.08 | % | 0.83 | % | (0.17) | % | ||||||||||||
| Plus: after tax impact of restructuring costs | 0.02 | % | 0.17 | % | 0.01 | % | 0.11 | % | 0.08 | % | 0.07 | % | 0.05 | % | ||||||||||||
| Less: after tax impact of non-routine items in noninterest income | 0.01 | % | (0.10) | % | (0.11) | % | 0.52 | % | (0.34) | % | (0.07) | % | (0.34) | % | ||||||||||||
| Core net income (loss) / Average total assets (Core ROA) | 0.93 | % | 0.90 | % | 0.66 | % | 1.05 | % | (0.18) | % | 0.83 | % | (0.46) | % | ||||||||||||
| Net income (loss) / Average stockholders' equity (ROE) | 8.38 | % | 8.11 | % | 7.47 | % | 4.09 | % | 0.81 | % | 8.01 | % | (1.62) | % | ||||||||||||
| Plus: after tax impact of restructuring costs | 0.26 | % | 1.66 | % | 0.10 | % | 0.94 | % | 0.70 | % | 0.67 | % | 0.45 | % | ||||||||||||
| Less: after tax impact of non-routine items in noninterest income | 0.05 | % | (1.03) | % | (1.07) | % | 5.05 | % | (3.25) | % | (0.67) | % | (3.25) | % | ||||||||||||
| Core net income (loss) / Average stockholders' equity (Core ROE) | 8.69 | % | 8.74 | % | 6.50 | % | 10.08 | % | (1.74) | % | 8.01 | % | (4.42) | % | ||||||||||||
| Efficiency ratio | 74.18 | % | 77.81 | % | 70.67 | % | 85.81 | % | 69.32 | % | 74.29 | % | 62.66 | % | ||||||||||||
| Less: impact of restructuring costs | (1.16) | % | (6.34) | % | (0.39) | % | (13.97) | % | (2.81) | % | (2.68) | % | (1.74) | % | ||||||||||||
| Plus: impact of non-routine items in noninterest income | (0.07) | % | 2.98 | % | 3.07 | % | (0.82) | % | 10.02 | % | 1.97 | % | 8.92 | % | ||||||||||||
| Core efficiency ratio | 72.95 | % | 74.45 | % | 73.35 | % | 71.02 | % | 76.53 | % | 73.58 | % | 69.84 | % | ||||||||||||
16
| Three Months Ended, | Nine Months Ended September 30, | |||||||||||||||||||||||||
(in thousands, except percentages and per share amounts) | September 30, 2021 | June 30, 2021 | March 31, 2021 | December 31, 2020 | September 30, 2020 | 2021 | 2020 | |||||||||||||||||||
| Stockholders' equity | $ | 812,662 | $ | 799,068 | $ | 785,014 | $ | 783,421 | $ | 829,533 | $ | 812,662 | $ | 829,533 | ||||||||||||
| Less: goodwill and other intangibles (6) | (22,529) | (22,505) | (21,515) | (21,561) | (21,607) | (22,529) | (21,607) | |||||||||||||||||||
| Tangible common stockholders' equity | $ | 790,133 | $ | 776,563 | $ | 763,499 | $ | 761,860 | $ | 807,926 | $ | 790,133 | $ | 807,926 | ||||||||||||
| Total assets | 7,489,305 | 7,532,844 | 7,751,098 | 7,770,893 | 7,977,047 | 7,489,305 | 7,977,047 | |||||||||||||||||||
| Less: goodwill and other intangibles (6) | (22,529) | (22,505) | (21,515) | (21,561) | (21,607) | (22,529) | (21,607) | |||||||||||||||||||
| Tangible assets | $ | 7,466,776 | $ | 7,510,339 | $ | 7,729,583 | $ | 7,749,332 | $ | 7,955,440 | $ | 7,466,776 | $ | 7,955,440 | ||||||||||||
| Common shares outstanding | 37,487 | 37,563 | 37,922 | 37,843 | 42,147 | 37,487 | 42,147 | |||||||||||||||||||
| Tangible common equity ratio | 10.58 | % | 10.34 | % | 9.88 | % | 9.83 | % | 10.16 | % | 10.58 | % | 10.16 | % | ||||||||||||
| Stockholders' book value per common share | $ | 21.68 | $ | 21.27 | $ | 20.70 | $ | 20.70 | $ | 19.68 | $ | 21.68 | $ | 19.68 | ||||||||||||
| Tangible stockholders' book value per common share | $ | 21.08 | $ | 20.67 | $ | 20.13 | $ | 20.13 | $ | 19.17 | $ | 21.08 | $ | 19.17 | ||||||||||||
____________
(1) The Company leased-back the property for a 2-year term.
(2) Expenses incurred for actions designed to implement the Company’s strategy as a new independent company. These actions include, but are not limited to reductions in workforce, streamlining operational processes, rolling out the Amerant brand, implementation of new technology system applications, enhanced sales tools and training, expanded product offerings and improved customer analytics to identify opportunities.
(3) In the second quarter of 2021, includes expenses in connection with the departure of the Company’s Chief Operating Officer and the elimination of various other support function positions, including the NYC LPO. In the fourth quarter of 2020, the Board of Directors of the Company adopted a voluntary early retirement plan for certain eligible long-term employees and an involuntary severance plan for certain other positions consistent with the Company’s effort to streamline operations and better align its operating structure with its business activities. 31 employees elected to participate in the voluntary plan, all of whom retired on or before December 31, 2020. The involuntary plan impacted 31 employees most of whom no longer worked for the Company and/or its subsidiaries by December 31, 2020. On December 28, 2020, the Company determined the termination costs and annual savings related to the voluntary and involuntary plans. The Company incurred approximately $3.5 million and $1.8 million in one-time termination costs in the fourth quarter of 2020 in connection with the voluntary and involuntary plans, respectively, the majority of which will be paid over time in the form of installment payments until December 2021. The Company estimates that the voluntary and involuntary plans will yield estimated annual savings of approximately $4.2 million and $5.5 million, respectively, for combined estimated annual savings of approximately $9.7 million beginning in 2021.
(4) In the nine months ended September 30,2021 and 2020, and in the three months ended March 31, 2021, amounts were calculated based upon the effective tax rate for the periods of 22.74%, 20.80% and 20.15%, respectively. For all of the other periods shown, amounts represent the difference between the prior and current period year-to-date tax effect.
(5) In the three months ended September 30, 2021 and June 30, 2021 and in the nine months ended September 30, 2021, potential dilutive instruments consisted of unvested shares of restricted stock, restricted stock units and performance share units (restricted stock and restricted stock units for all of the other periods shown). For the nine months ended September 30, 2020, potential dilutive instruments were not included in the diluted earnings per share computation because the Company reported a net loss and their inclusion would have an antidilutive effect. For all other periods presented, potential dilutive instruments were included in the diluted earnings per share computation because, when the unamortized deferred compensation cost related to these shares was divided by the average market price per share in those periods, fewer shares would have been purchased than restricted shares assumed issued. Therefore, in those periods, such awards resulted in higher diluted weighted average shares outstanding than basic weighted average shares outstanding, and had a dilutive effect in per share earnings.
(6) Other intangibles assets consist of, among other things, mortgage servicing rights of $0.6 million and $0.5 million at September 30, 2021 and June 30 2021, respectively, and are included in other assets in the Company’s consolidated balance sheets.
17
Exhibit 3 - Average Balance Sheet, Interest and Yield/Rate Analysis
The following tables present average balance sheet information, interest income, interest expense and the corresponding average yields earned and rates paid for the periods presented. The average balances for loans include both performing and nonperforming balances. Interest income on loans includes the effects of discount accretion and the amortization of non-refundable loan origination fees, net of direct loan origination costs, accounted for as yield adjustments. Average balances represent the daily average balances for the periods presented.
| Three Months Ended | |||||||||||||||||||||||||||||||||||
| September 30, 2021 | June 30, 2021 | September 30, 2020 | |||||||||||||||||||||||||||||||||
| (in thousands, except percentages) | Average Balances | Income/ Expense | Yield/ Rates | Average Balances | Income/ Expense | Yield/ Rates | Average Balances | Income/ Expense | Yield/ Rates | ||||||||||||||||||||||||||
| Interest-earning assets: | |||||||||||||||||||||||||||||||||||
| Loan portfolio, net (1)(2) | $ | 5,379,461 | $ | 53,193 | 3.92 | % | $ | 5,526,727 | $ | 53,612 | 3.89 | % | $ | 5,768,471 | $ | 52,736 | 3.64 | % | |||||||||||||||||
| Debt securities available for sale (3) | 1,221,569 | 7,055 | 2.29 | % | 1,180,766 | 6,393 | 2.17 | % | 1,409,768 | 8,096 | 2.28 | % | |||||||||||||||||||||||
| Debt securities held to maturity (4) | 102,574 | 508 | 1.96 | % | 97,208 | 481 | 1.98 | % | 63,844 | 324 | 2.02 | % | |||||||||||||||||||||||
| Debt securities held for trading | 153 | 1 | 2.59 | % | 258 | 2 | 3.11 | % | — | — | — | % | |||||||||||||||||||||||
| Equity securities with readily determinable fair value not held for trading | 24,017 | 66 | 1.09 | % | 24,010 | 75 | 1.25 | % | 24,447 | 103 | 1.68 | % | |||||||||||||||||||||||
| Federal Reserve Bank and FHLB stock | 47,682 | 514 | 4.28 | % | 51,764 | 548 | 4.25 | % | 64,998 | 597 | 3.65 | % | |||||||||||||||||||||||
| Deposits with banks | 207,504 | 76 | 0.15 | % | 239,951 | 62 | 0.10 | % | 225,320 | 61 | 0.11 | % | |||||||||||||||||||||||
| Total interest-earning assets | 6,982,960 | 61,413 | 3.49 | % | 7,120,684 | 61,173 | 3.45 | % | 7,556,848 | 61,917 | 3.26 | % | |||||||||||||||||||||||
| Total non-interest-earning assets less allowance for loan losses | 553,505 | 559,807 | 526,065 | ||||||||||||||||||||||||||||||||
| Total assets | $ | 7,536,465 | $ | 7,680,491 | $ | 8,082,913 | |||||||||||||||||||||||||||||
18
| Three Months Ended | |||||||||||||||||||||||||||||||||||
| September 30, 2021 | June 30, 2021 | September 30, 2020 | |||||||||||||||||||||||||||||||||
| (in thousands, except percentages) | Average Balances | Income/ Expense | Yield/ Rates | Average Balances | Income/ Expense | Yield/ Rates | Average Balances | Income/ Expense | Yield/ Rates | ||||||||||||||||||||||||||
| Interest-bearing liabilities: | |||||||||||||||||||||||||||||||||||
| Checking and saving accounts - | |||||||||||||||||||||||||||||||||||
| Interest bearing DDA | $ | 1,290,944 | $ | 147 | 0.05 | % | $ | 1,292,612 | $ | 123 | 0.04 | % | $ | 1,193,920 | $ | 97 | 0.03 | % | |||||||||||||||||
| Money market | 1,359,774 | 798 | 0.23 | % | 1,310,133 | 931 | 0.29 | % | 1,154,795 | 1,190 | 0.41 | % | |||||||||||||||||||||||
| Savings | 329,456 | 11 | 0.01 | % | 373,723 | 14 | 0.02 | % | 321,657 | 88 | 0.11 | % | |||||||||||||||||||||||
| Total checking and saving accounts | 2,980,174 | 956 | 0.13 | % | 2,976,468 | 1,068 | 0.14 | % | 2,670,372 | 1,375 | 0.20 | % | |||||||||||||||||||||||
| Time deposits | 1,555,001 | 5,302 | 1.35 | % | 1,789,517 | 6,327 | 1.42 | % | 2,367,534 | 10,874 | 1.83 | % | |||||||||||||||||||||||
| Total deposits | 4,535,175 | 6,258 | 0.55 | % | 4,765,985 | 7,395 | 0.62 | % | 5,037,906 | 12,249 | 0.97 | % | |||||||||||||||||||||||
| Securities sold under agreements to repurchase | — | — | — | % | 440 | 1 | 0.91 | % | — | — | — | % | |||||||||||||||||||||||
| Advances from the FHLB and other borrowings (5) | 808,860 | 1,777 | 0.87 | % | 922,050 | 2,255 | 0.98 | % | 1,050,000 | 2,820 | 1.07 | % | |||||||||||||||||||||||
| Senior notes | 58,776 | 942 | 6.36 | % | 58,697 | 942 | 6.44 | % | 58,460 | 942 | 6.41 | % | |||||||||||||||||||||||
| Junior subordinated debentures | 64,178 | 615 | 3.80 | % | 64,178 | 609 | 3.81 | % | 64,178 | 558 | 3.46 | % | |||||||||||||||||||||||
| Total interest-bearing liabilities | 5,466,989 | 9,592 | 0.70 | % | 5,811,350 | 11,202 | 0.77 | % | 6,210,544 | 16,569 | 1.06 | % | |||||||||||||||||||||||
| Non-interest-bearing liabilities: | |||||||||||||||||||||||||||||||||||
| Non-interest bearing demand deposits | 1,110,353 | 937,275 | 936,349 | ||||||||||||||||||||||||||||||||
| Accounts payable, accrued liabilities and other liabilities | 152,528 | 142,226 | 102,864 | ||||||||||||||||||||||||||||||||
| Total non-interest-bearing liabilities | 1,262,881 | 1,079,501 | 1,039,213 | ||||||||||||||||||||||||||||||||
| Total liabilities | 6,729,870 | 6,890,851 | 7,249,757 | ||||||||||||||||||||||||||||||||
| Stockholders’ equity | 806,595 | 789,640 | 833,156 | ||||||||||||||||||||||||||||||||
| Total liabilities and stockholders' equity | $ | 7,536,465 | $ | 7,680,491 | $ | 8,082,913 | |||||||||||||||||||||||||||||
| Excess of average interest-earning assets over average interest-bearing liabilities | $ | 1,515,971 | $ | 1,309,334 | $ | 1,346,304 | |||||||||||||||||||||||||||||
| Net interest income | $ | 51,821 | $ | 49,971 | $ | 45,348 | |||||||||||||||||||||||||||||
| Net interest rate spread | 2.79 | % | 2.68 | % | 2.20 | % | |||||||||||||||||||||||||||||
| Net interest margin (6) | 2.94 | % | 2.81 | % | 2.39 | % | |||||||||||||||||||||||||||||
| Cost of total deposits (7) | 0.44 | % | 0.52 | % | 0.82 | % | |||||||||||||||||||||||||||||
| Ratio of average interest-earning assets to average interest-bearing liabilities | 127.73 | % | 122.53 | % | 121.68 | % | |||||||||||||||||||||||||||||
| Average non-performing loans/ Average total loans | 1.94 | % | 1.84 | % | 1.43 | % | |||||||||||||||||||||||||||||
19
| Nine Months Ended | |||||||||||||||||||||||
| September 30, 2021 | September 30, 2020 | ||||||||||||||||||||||
| (in thousands, except percentages) | Average Balances | Income/ Expense | Yield/ Rates | Average Balances | Income/ Expense | Yield/ Rates | |||||||||||||||||
| Interest-earning assets: | |||||||||||||||||||||||
| Loan portfolio, net (1)(2) | $ | 5,527,228 | $ | 159,576 | 3.86 | % | $ | 5,685,187 | $ | 166,007 | 3.90 | % | |||||||||||
| Debt securities available for sale (3) | 1,202,191 | 19,943 | 2.22 | % | 1,501,200 | 26,876 | 2.39 | % | |||||||||||||||
| Debt securities held to maturity (4) | 89,298 | 1,291 | 1.93 | % | 68,169 | 1,032 | 2.02 | % | |||||||||||||||
| Debt securities held for trading | 172 | 4 | 3.11 | % | — | — | — | % | |||||||||||||||
| Equity securities with readily determinable fair value not held for trading | 24,084 | 225 | 1.25 | % | 24,268 | 355 | 1.95 | % | |||||||||||||||
| Federal Reserve Bank and FHLB stock | 54,291 | 1,687 | 4.15 | % | 68,650 | 2,550 | 4.96 | % | |||||||||||||||
| Deposits with banks | 217,611 | 189 | 0.12 | % | 204,269 | 579 | 0.38 | % | |||||||||||||||
| Total interest-earning assets | 7,114,875 | 182,915 | 3.44 | % | 7,551,743 | 197,399 | 3.49 | % | |||||||||||||||
| Total non-interest-earning assets less allowance for loan losses | 538,137 | 508,863 | |||||||||||||||||||||
| Total assets | $ | 7,653,012 | $ | 8,060,606 | |||||||||||||||||||
| Interest-bearing liabilities: | |||||||||||||||||||||||
| Checking and saving accounts - | |||||||||||||||||||||||
| Interest bearing DDA | $ | 1,298,674 | $ | 383 | 0.04 | % | $ | 1,132,553 | $ | 336 | 0.04 | % | |||||||||||
| Money market | 1,302,431 | 2,695 | 0.28 | % | 1,134,627 | 5,960 | 0.70 | % | |||||||||||||||
| Savings | 323,785 | 39 | 0.02 | % | 321,661 | 153 | 0.06 | % | |||||||||||||||
| Total checking and saving accounts | 2,924,890 | 3,117 | 0.14 | % | 2,588,841 | 6,449 | 0.33 | % | |||||||||||||||
| Time deposits | 1,765,555 | 18,989 | 1.44 | % | 2,437,353 | 36,764 | 2.01 | % | |||||||||||||||
| Total deposits | 4,690,445 | 22,106 | 0.63 | % | 5,026,194 | 43,213 | 1.15 | % | |||||||||||||||
| Securities sold under agreements to repurchase | 147 | 1 | 0.91 | % | 158 | — | — | % | |||||||||||||||
| Advances from the FHLB and other borrowings (5) | 926,087 | 6,790 | 0.98 | % | 1,135,931 | 10,342 | 1.22 | % | |||||||||||||||
| Junior subordinated debentures | 64,178 | 1,831 | 3.81 | % | 67,149 | 1,918 | 3.82 | % | |||||||||||||||
| Senior notes | 58,697 | 2,826 | 6.44 | % | 21,334 | 1,026 | 6.42 | % | |||||||||||||||
| Total interest-bearing liabilities | 5,739,554 | 33,554 | 0.78 | % | 6,250,766 | 56,499 | 1.21 | % | |||||||||||||||
| Non-interest-bearing liabilities: | |||||||||||||||||||||||
| Non-interest bearing demand deposits | 991,635 | 867,527 | |||||||||||||||||||||
| Accounts payable, accrued liabilities and other liabilities | 129,407 | 99,510 | |||||||||||||||||||||
| Total non-interest-bearing liabilities | 1,121,042 | 967,037 | |||||||||||||||||||||
| Total liabilities | 6,860,596 | 7,217,803 | |||||||||||||||||||||
| Stockholders’ equity | 792,416 | 842,803 | |||||||||||||||||||||
| Total liabilities and stockholders' equity | $ | 7,653,012 | $ | 8,060,606 | |||||||||||||||||||
| Excess of average interest-earning assets over average interest-bearing liabilities | $ | 1,375,321 | $ | 1,300,977 | |||||||||||||||||||
| Net interest income | $ | 149,361 | $ | 140,900 | |||||||||||||||||||
| Net interest rate spread | 2.66 | % | 2.28 | % | |||||||||||||||||||
| Net interest margin (6) | 2.81 | % | 2.49 | % | |||||||||||||||||||
| Cost of total deposits (7) | 0.52 | % | 0.98 | % | |||||||||||||||||||
| Ratio of average interest-earning assets to average interest-bearing liabilities | 123.96 | % | 120.81 | % | |||||||||||||||||||
| Average non-performing loans/ Average total loans | 1.77 | % | 0.97 | % | |||||||||||||||||||
20
_______________
(1) Includes loans held for investment net of the allowance for loan losses and loans held for sale.
(2) Average non-performing loans of $106.5 million, $103.6 million and $84.4 million for the three months ended September 30, 2021, June 30, 2021 and September 30, 2020, respectively, and $99.8 million and $55.9 million in the nine months ended September 30, 2021 and 2020, respectively, are included in the average loan portfolio, net. Interest income that would have been recognized on these non-performing loans totaled $2.3 million, $0.9 million and $1.0 million, in the three months ended September 30, 2021, June 30, 2021 and September 30, 2020, respectively, and $4.0 million and $2.0 million in the nine months ended September 30, 2021 and 2020, respectively.
(3) Includes nontaxable securities with average balances of $19.5 million, $27.3 million and $56.0 million for the three months ended September 30, 2021, June 30, 2021 and September 30, 2020, respectively, and $46.8 million and $55.9 million in the nine months ended September 30, 2021 and 2020, respectively. The tax equivalent yield for these nontaxable securities was 1.51%, 2.15% and 3.59% for the three months ended September 30, 2021, June 30, 2021 and September 30, 2020, respectively, and 2.09% and 3.74% for the nine months ended September 30, 2021 and 2020, respectively. In 2021 and 2020, the tax equivalent yields were calculated by assuming a 21% tax rate and dividing the actual yield by 0.79.
(4) Includes nontaxable securities with average balances of $65.1 million, $52.2 million and $63.8 million for the three months ended September 30, 2021, June 30, 2021 and September 30, 2020, respectively, and $58.0 million and $68.2 million in the nine months ended September 30, 2021 and 2020, respectively. The tax equivalent yield for these nontaxable securities was 2.37%, 2.19% and 2.55% for the three months ended September 30, 2021, June 30, 2021 and September 30, 2020, respectively, and 2.32% and 2.56% for the nine months ended September 30, 2021 and 2020, respectively. In 2021 and 2020, the tax equivalent yields were calculated assuming a 21% tax rate and dividing the actual yield by 0.79.
(5) The terms of the FHLB advance agreements require the Bank to maintain certain investment securities or loans as collateral for these advances.
(6) NIM is defined as net interest income divided by average interest-earning assets, which are loans, securities, deposits with banks and other financial assets which yield interest or similar income.
(7) Calculated based upon the average balance of total noninterest bearing and interest bearing deposits.
21
Exhibit 4 - Noninterest Income
This table shows the amounts of each of the categories of noninterest income for the periods presented.
| Three Months Ended | Nine Months Ended September 30, | |||||||||||||||||||||||||||||||||||||||||||
| September 30, 2021 | June 30, 2021 | September 30, 2020 | 2021 | 2020 | ||||||||||||||||||||||||||||||||||||||||
| (in thousands, except percentages) | Amount | % | Amount | % | Amount | % | Amount | % | Amount | % | ||||||||||||||||||||||||||||||||||
| Deposits and service fees | $ | 4,303 | 32.0 | % | $ | 4,284 | 27.2 | % | $ | 3,937 | 19.4 | % | $ | 12,693 | 29.3 | % | $ | 11,665 | 18.8 | % | ||||||||||||||||||||||||
| Brokerage, advisory and fiduciary activities | 4,595 | 34.2 | % | 4,431 | 28.2 | % | 4,272 | 21.1 | % | 13,629 | 31.5 | % | 12,730 | 20.6 | % | |||||||||||||||||||||||||||||
Change in cash surrender value of bank owned life insurance (“BOLI”)(1) | 1,369 | 10.2 | % | 1,368 | 8.7 | % | 1,437 | 7.1 | % | 4,093 | 9.5 | % | 4,278 | 6.9 | % | |||||||||||||||||||||||||||||
| Cards and trade finance servicing fees | 541 | 4.0 | % | 388 | 2.5 | % | 345 | 1.7 | % | 1,268 | 2.9 | % | 1,013 | 1.6 | % | |||||||||||||||||||||||||||||
| Loss on early extinguishment of FHLB advances, net | — | — | % | (2,488) | (15.8) | % | — | — | % | (2,488) | (5.7) | % | (73) | (0.1) | % | |||||||||||||||||||||||||||||
Securities (losses) gains, net (2) | (54) | (0.4) | % | 1,329 | 8.5 | % | 8,600 | 42.4 | % | 3,857 | 8.9 | % | 25,957 | 41.9 | % | |||||||||||||||||||||||||||||
Other noninterest income (3) | 2,680 | 20.0 | % | 6,422 | 40.7 | % | 1,701 | 8.3 | % | 10,279 | 23.6 | % | 6,385 | 10.3 | % | |||||||||||||||||||||||||||||
| Total noninterest income | $ | 13,434 | 100.0 | % | $ | 15,734 | 100.0 | % | $ | 20,292 | 100.0 | % | $ | 43,331 | 100.0 | % | $ | 61,955 | 100.0 | % | ||||||||||||||||||||||||
__________________
(1) Changes in cash surrender value of BOLI are not taxable.
(2) Includes net gain on sale of securities of $36 thousand, $1.3 million and $8.6 million during the three months ended September 30, 2021, June 30, 2021 and September 30, 2020, respectively, and unrealized losses of $0.1 million, unrealized gains of $22.0 thousand, and unrealized losses of $44 thousand during the three months ended September 30, 2021, June 30, 2021 and September 30, 2020, respectively, related to the change in market value of mutual funds.
(3) Includes: (i) mortgage banking revenue related to Amerant Mortgage of $0.7 million and $0.8 million in the three and nine months ended September 30, 2021, respectively; (ii) income from derivative transactions with customers of $0.5 million, $1.3 million and $27 thousand in the three months ended September 30, 2021, June 30, 2021 and September 30, 2020, respectively, and (iii) a gain of $3.8 million on the sale of PPP loans in the three months ended June 30, 2021. In addition, includes rental income, income from foreign currency exchange transactions with customers, and valuation income on the investment balances held in the non-qualified deferred compensation plan.
22
Exhibit 5 - Noninterest Expense
This table shows the amounts of each of the categories of noninterest expense for the periods presented.
| Three Months Ended | Nine Months Ended September 30, | |||||||||||||||||||||||||||||||||||||||||||
| September 30, 2021 | June 30, 2021 | September 30, 2020 | 2021 | 2020 | ||||||||||||||||||||||||||||||||||||||||
| (in thousands, except percentages) | Amount | % | Amount | % | Amount | % | Amount | % | Amount | % | ||||||||||||||||||||||||||||||||||
Salaries and employee benefits (1) | $ | 29,053 | 60.0 | % | $ | 30,796 | 60.2 | % | $ | 28,268 | 62.1 | % | $ | 86,276 | 60.3 | % | $ | 79,164 | 62.3 | % | ||||||||||||||||||||||||
Occupancy and equipment (2) | 4,769 | 9.9 | % | 5,342 | 10.4 | % | 4,281 | 9.4 | % | 14,599 | 10.2 | % | 12,304 | 9.7 | % | |||||||||||||||||||||||||||||
Professional and other services fees (3) | 4,184 | 8.6 | % | 4,693 | 9.2 | % | 3,403 | 7.5 | % | 12,661 | 8.8 | % | 10,322 | 8.1 | % | |||||||||||||||||||||||||||||
| Telecommunications and data processing | 3,810 | 7.9 | % | 3,515 | 6.9 | % | 3,228 | 7.1 | % | 11,052 | 7.7 | % | 9,849 | 7.8 | % | |||||||||||||||||||||||||||||
| Depreciation and amortization | 2,091 | 4.3 | % | 1,872 | 3.7 | % | 1,993 | 4.4 | % | 5,749 | 4.0 | % | 5,912 | 4.7 | % | |||||||||||||||||||||||||||||
| FDIC assessments and insurance | 1,626 | 3.4 | % | 1,702 | 3.3 | % | 1,898 | 4.2 | % | 5,083 | 3.6 | % | 4,256 | 3.4 | % | |||||||||||||||||||||||||||||
Other operating expenses (4) | 2,871 | 5.9 | % | 3,205 | 6.3 | % | 2,429 | 5.3 | % | 7,734 | 5.4 | % | 5,300 | 4.0 | % | |||||||||||||||||||||||||||||
Total noninterest expense (5) | $ | 48,404 | 100.0 | % | $ | 51,125 | 100.0 | % | $ | 45,500 | 100.0 | % | $ | 143,154 | 100.0 | % | $ | 127,107 | 100.0 | % | ||||||||||||||||||||||||
___________
(1) Includes severance expense of $0.3 million, $3.3 million, $0.6 million in three months ended September 30, 2021, June 30, 2021, and September 30, 2020, respectively, mainly related to the elimination of various support function positions in the three months ended September 30, 2021 and 2020, and in connection with the departure of the Company’s COO and other actions in the three months ended June 30, 2021. In addition, includes $0.8 million and $1.0 million in the three months ended September 30, 2021 and June 30, 2021, respectively, in connection with a Long Term Incentive Compensation Program adopted in the first quarter of 2021.
(2) Includes $0.8 million of ROU asset impairment associated with lease in NYC for loan production office in the three months ended June 30, 2021.
(3) Other services fees include expenses on derivative contracts.
(4) Includes advertising, marketing, charitable contributions, community engagement, postage and courier expenses, provisions for possible losses on contingent loans, and debits which mirror the valuation income on the investment balances held in the non-qualified deferred compensation plan in order to adjust the liability to participants of the deferred compensation plan.
(5) Includes $2.1 million and $3.5 million in the three and nine month periods ended September 30, 2021, respectively and $1.1 million in the three months ended June 30, 2021, respectively, related to Amerant Mortgage, mainly salaries and employee benefits and professional and other services fees.
23
Exhibit 6 - Consolidated Balance Sheets
| (in thousands, except share data) | September 30, 2021 | June 30, 2021 | March 31, 2021 | December 31, 2020 | September 30, 2020 | ||||||||||||||||||||||||
| Assets | |||||||||||||||||||||||||||||
| Cash and due from banks | $ | 27,501 | $ | 45,198 | $ | 37,744 | $ | 30,179 | $ | 34,091 | |||||||||||||||||||
| Interest earning deposits with banks | 138,732 | 126,314 | 195,755 | 184,207 | 193,069 | ||||||||||||||||||||||||
| Cash and cash equivalents | 166,233 | 171,512 | 233,499 | 214,386 | 227,160 | ||||||||||||||||||||||||
| Securities | |||||||||||||||||||||||||||||
| Debt securities available for sale | 1,220,391 | 1,194,068 | 1,190,201 | 1,225,083 | 1,317,724 | ||||||||||||||||||||||||
| Debt securities held to maturity | 130,543 | 93,311 | 104,657 | 58,127 | 61,676 | ||||||||||||||||||||||||
| Trading securities | 194 | 198 | — | — | — | ||||||||||||||||||||||||
| Equity securities with readily determinable fair value not held for trading | 23,870 | 23,988 | 23,965 | 24,342 | 24,381 | ||||||||||||||||||||||||
| Federal Reserve Bank and Federal Home Loan Bank stock | 47,740 | 47,675 | 56,469 | 65,015 | 65,015 | ||||||||||||||||||||||||
| Securities | 1,422,738 | 1,359,240 | 1,375,292 | 1,372,567 | 1,468,796 | ||||||||||||||||||||||||
| Loans held for sale, at lower of cost or fair value | 219,083 | — | — | — | — | ||||||||||||||||||||||||
| Mortgage loans held for sale, at fair value | 5,812 | 1,775 | 1,044 | — | — | ||||||||||||||||||||||||
| Loans held for investment, gross | 5,254,029 | 5,606,773 | 5,753,794 | 5,842,337 | 5,924,617 | ||||||||||||||||||||||||
| Less: Allowance for loan losses | 83,442 | 104,185 | 110,940 | 110,902 | 116,819 | ||||||||||||||||||||||||
| Loans held for investment, net | 5,170,587 | 5,502,588 | 5,642,854 | 5,731,435 | 5,807,798 | ||||||||||||||||||||||||
| Bank owned life insurance | 221,640 | 220,271 | 218,903 | 217,547 | 216,130 | ||||||||||||||||||||||||
| Premises and equipment, net | 108,885 | 108,708 | 109,071 | 109,990 | 126,895 | ||||||||||||||||||||||||
| Deferred tax assets, net | 9,861 | 13,516 | 15,607 | 11,691 | 16,206 | ||||||||||||||||||||||||
| Goodwill | 19,506 | 19,506 | 19,506 | 19,506 | 19,506 | ||||||||||||||||||||||||
| Accrued interest receivable and other assets (1) | 144,960 | 135,728 | 135,322 | 93,771 | 94,556 | ||||||||||||||||||||||||
| Total assets | $ | 7,489,305 | $ | 7,532,844 | $ | 7,751,098 | $ | 7,770,893 | $ | 7,977,047 | |||||||||||||||||||
| Liabilities and Stockholders' Equity | |||||||||||||||||||||||||||||
| Deposits | |||||||||||||||||||||||||||||
| Demand | |||||||||||||||||||||||||||||
| Noninterest bearing | $ | 1,210,154 | $ | 1,065,622 | $ | 977,595 | $ | 872,151 | $ | 916,889 | |||||||||||||||||||
| Interest bearing | 1,317,938 | 1,293,626 | 1,324,127 | 1,230,054 | 1,210,639 | ||||||||||||||||||||||||
| Savings and money market | 1,655,495 | 1,682,619 | 1,494,227 | 1,587,876 | 1,496,119 | ||||||||||||||||||||||||
| Time | 1,442,790 | 1,633,041 | 1,882,130 | 2,041,562 | 2,253,899 | ||||||||||||||||||||||||
| Total deposits | 5,626,377 | 5,674,908 | 5,678,079 | 5,731,643 | 5,877,546 | ||||||||||||||||||||||||
| Advances from the Federal Home Loan Bank | 809,095 | 808,614 | 1,050,000 | 1,050,000 | 1,050,000 | ||||||||||||||||||||||||
| Senior notes | 58,815 | 58,736 | 58,656 | 58,577 | 58,498 | ||||||||||||||||||||||||
| Junior subordinated debentures held by trust subsidiaries | 64,178 | 64,178 | 64,178 | 64,178 | 64,178 | ||||||||||||||||||||||||
| Accounts payable, accrued liabilities and other liabilities (1) | 118,178 | 127,340 | 115,171 | 83,074 | 97,292 | ||||||||||||||||||||||||
| Total liabilities | 6,676,643 | 6,733,776 | 6,966,084 | 6,987,472 | 7,147,514 | ||||||||||||||||||||||||
| Stockholders’ equity | |||||||||||||||||||||||||||||
| Class A common stock | 2,903 | 2,904 | 2,904 | 2,882 | 2,886 | ||||||||||||||||||||||||
| Class B common stock | 847 | 853 | 892 | 904 | 1,329 | ||||||||||||||||||||||||
| Additional paid in capital | 299,273 | 299,547 | 304,448 | 305,569 | 359,553 | ||||||||||||||||||||||||
| Retained earnings | 489,854 | 472,823 | 456,861 | 442,402 | 433,929 | ||||||||||||||||||||||||
| Accumulated other comprehensive income | 21,236 | 23,758 | 19,909 | 31,664 | 31,836 | ||||||||||||||||||||||||
| Total stockholders' equity before noncontrolling interest | 814,113 | 799,885 | 785,014 | 783,421 | 829,533 | ||||||||||||||||||||||||
| Noncontrolling interest | (1,451) | (817) | — | — | — | ||||||||||||||||||||||||
| Total stockholders' equity | 812,662 | 799,068 | 785,014 | 783,421 | 829,533 | ||||||||||||||||||||||||
| Total liabilities and stockholders' equity | $ | 7,489,305 | $ | 7,532,844 | $ | 7,751,098 | $ | 7,770,893 | $ | 7,977,047 | |||||||||||||||||||
__________
(1) As of September 30, 2021, June, 30 2021 and March 31, 2021, includes the effect of adopting ASU 2016-02 (Leases) in the first quarter of 2021.
24
Exhibit 7 - Loans
Loans by Type - Held For Investment
The loan portfolio held for investment consists of the following loan classes:
| (in thousands) | September 30, 2021 | June 30, 2021 | March 31, 2021 | December 31, 2020 | September 30, 2020 | ||||||||||||||||||||||||
| Real estate loans | |||||||||||||||||||||||||||||
| Commercial real estate | |||||||||||||||||||||||||||||
| Non-owner occupied | $ | 1,593,664 | $ | 1,699,876 | $ | 1,713,967 | $ | 1,749,839 | $ | 1,797,230 | |||||||||||||||||||
| Multi-family residential | 504,337 | 658,022 | 722,783 | 737,696 | 853,159 | ||||||||||||||||||||||||
| Land development and construction loans | 318,449 | 361,077 | 351,502 | 349,800 | 335,184 | ||||||||||||||||||||||||
| 2,416,450 | 2,718,975 | 2,788,252 | 2,837,335 | 2,985,573 | |||||||||||||||||||||||||
| Single-family residential | 618,139 | 616,545 | 625,298 | 639,569 | 597,280 | ||||||||||||||||||||||||
| Owner occupied | 936,590 | 943,342 | 940,126 | 947,127 | 937,946 | ||||||||||||||||||||||||
| 3,971,179 | 4,278,862 | 4,353,676 | 4,424,031 | 4,520,799 | |||||||||||||||||||||||||
| Commercial loans | 910,696 | 1,003,411 | 1,104,594 | 1,154,550 | 1,197,156 | ||||||||||||||||||||||||
| Loans to financial institutions and acceptances | 13,690 | 13,672 | 16,658 | 16,636 | 16,623 | ||||||||||||||||||||||||
| Consumer loans and overdrafts | 358,464 | 310,828 | 278,866 | 247,120 | 190,039 | ||||||||||||||||||||||||
| Total loans | $ | 5,254,029 | $ | 5,606,773 | $ | 5,753,794 | $ | 5,842,337 | $ | 5,924,617 | |||||||||||||||||||
Loans by Type - Held For Sale
The loan portfolio held for sale consists of the following loan classes:
| (in thousands) | September 30, 2021 | June 30, 2021 | March 31, 2021 | December 31, 2020 | September 30, 2021 | ||||||||||||||||||||||||
| Real estate loans | |||||||||||||||||||||||||||||
| Commercial real estate | |||||||||||||||||||||||||||||
| Non-owner occupied | $ | 160,034 | $ | — | $ | — | $ | — | $ | — | |||||||||||||||||||
| Multi-family residential | 57,725 | — | — | — | — | ||||||||||||||||||||||||
| 217,759 | — | — | — | — | |||||||||||||||||||||||||
| Single-family residential | 5,812 | 1,775 | 1,044 | — | — | ||||||||||||||||||||||||
| Owner occupied | 1,324 | — | — | — | — | ||||||||||||||||||||||||
| Total loans held for sale (1)(2) | $ | 224,895 | $ | 1,775 | $ | 1,044 | $ | — | $ | — | |||||||||||||||||||
__________________
(1) At September 30, 2021 and March 31, 2021, total loans include $219.1 million and $1.0 million, respectively, in loans held for sale carried at the lower of cost or estimated fair value. In addition, as of September 30, 2021 and June 30, 2021, total loans include $5.8 million and $1.8 million, respectively, in mortgage loans held for sale carried at fair value.
(2) Remained current and in accrual status at each of the periods shown.
25
Non-Performing Assets
This table shows a summary of our non-performing assets by loan class, which includes non-performing loans and other real estate owned, or OREO, at the dates presented. Non-performing loans consist of (i) nonaccrual loans; (ii) accruing loans 90 days or more contractually past due as to interest or principal; and (iii) restructured loans that are considered TDRs.
| (in thousands) | September 30, 2021 | June 30, 2021 | March 31, 2021 | December 31, 2020 | September 30, 2020 | ||||||||||||||||||||||||
Non-Accrual Loans(1) | |||||||||||||||||||||||||||||
| Real Estate Loans | |||||||||||||||||||||||||||||
| Commercial real estate (CRE) | |||||||||||||||||||||||||||||
| Non-owner occupied | $ | 28,507 | $ | 48,347 | $ | 8,515 | $ | 8,219 | $ | 8,289 | |||||||||||||||||||
| Multi-family residential | — | 9,928 | 11,369 | 11,340 | 1,484 | ||||||||||||||||||||||||
| 28,507 | 58,275 | 19,884 | 19,559 | 9,773 | |||||||||||||||||||||||||
| Single-family residential | 6,344 | 7,174 | 10,814 | 10,667 | 11,071 | ||||||||||||||||||||||||
| Owner occupied | 11,040 | 11,277 | 12,527 | 12,815 | 14,539 | ||||||||||||||||||||||||
| 45,891 | 76,726 | 43,225 | 43,041 | 35,383 | |||||||||||||||||||||||||
Commercial loans (2) | 36,500 | 43,876 | 45,282 | 44,205 | 50,991 | ||||||||||||||||||||||||
| Consumer loans and overdrafts | 353 | 198 | 270 | 233 | 104 | ||||||||||||||||||||||||
| Total Non-Accrual Loans | $ | 82,744 | $ | 120,800 | $ | 88,777 | $ | 87,479 | $ | 86,478 | |||||||||||||||||||
Past Due Accruing Loans(3) | |||||||||||||||||||||||||||||
| Real Estate Loans | |||||||||||||||||||||||||||||
| Commercial real estate (CRE) | |||||||||||||||||||||||||||||
| Non-owner occupied | $ | — | $ | — | $ | 743 | $ | — | $ | — | |||||||||||||||||||
| Single-family residential | 4 | 20 | — | — | 1 | ||||||||||||||||||||||||
| Owner occupied | — | — | — | 220 | — | ||||||||||||||||||||||||
| Commercial | — | 295 | — | — | — | ||||||||||||||||||||||||
| Consumer loans and overdrafts | 1 | 4 | 3 | 1 | 1 | ||||||||||||||||||||||||
| Total Past Due Accruing Loans | 5 | 319 | 746 | 221 | 2 | ||||||||||||||||||||||||
| Total Non-Performing Loans | 82,749 | 121,119 | 89,523 | 87,700 | 86,480 | ||||||||||||||||||||||||
| Other Real Estate Owned | 9,800 | 400 | 400 | 427 | 42 | ||||||||||||||||||||||||
| Total Non-Performing Assets | $ | 92,549 | $ | 121,519 | $ | 89,923 | $ | 88,127 | $ | 86,522 | |||||||||||||||||||
__________________
(1) Includes loan modifications that met the definition of TDRs which may be performing in accordance with their modified loan terms. As of September 30, 2021, June 30, 2021, March 31, 2021, December 31, 2020 and September 30, 2020, non-performing TDRs include $9.3 million, $9.6 million, $9.8 million, $8.4 million and $9.0 million, respectively, in a multiple loan relationship to a South Florida borrower.
(2) As of September 30, 2021,includes $13.9 million in a commercial relationship placed in nonaccrual status during the second quarter of 2020 ($19.6 million at each of the other periods shown). During the third quarters of 2021 and 2020, the Company charged off $5.7 million and $19.3 million, respectively, against the allowance for loan losses as result of the deterioration of this commercial relationship.
(3) Loans past due 90 days or more but still accruing.
26
Loans by Credit Quality Indicators
This table shows the Company’s loans by credit quality indicators. We have no purchased credit-impaired loans.
| September 30, 2021 | June 30, 2021 | September 30, 2020 | ||||||||||||||||||||||||||||||||||||||||||
| (in thousands) | Special Mention | Substandard | Doubtful | Total (1) | Special Mention | Substandard | Doubtful | Total (1) | Special Mention | Substandard | Doubtful | Total (1) | ||||||||||||||||||||||||||||||||
| Real Estate Loans | ||||||||||||||||||||||||||||||||||||||||||||
| Commercial Real Estate (CRE) | ||||||||||||||||||||||||||||||||||||||||||||
| Non-owner occupied | $ | 31,269 | $ | 25,332 | $ | 3,175 | $ | 59,776 | $ | 32,858 | $ | 36,040 | $ | 12,306 | $ | 81,204 | $ | 16,780 | $ | 7,236 | $ | 1,798 | $ | 25,814 | ||||||||||||||||||||
| Multi-family residential | — | — | — | — | — | 9,928 | — | 9,928 | — | 1,484 | — | 1,484 | ||||||||||||||||||||||||||||||||
| Land development and construction loans | — | — | — | — | — | — | — | — | 7,201 | — | — | 7,201 | ||||||||||||||||||||||||||||||||
| 31,269 | 25,332 | 3,175 | 59,776 | 32,858 | 45,968 | 12,306 | 91,132 | 23,981 | 8,720 | 1,798 | 34,499 | |||||||||||||||||||||||||||||||||
| Single-family residential | — | 6,368 | — | 6,368 | — | 7,194 | — | 7,194 | — | 11,072 | — | 11,072 | ||||||||||||||||||||||||||||||||
| Owner occupied | 7,473 | 11,136 | — | 18,609 | 19,456 | 11,375 | — | 30,831 | 34,556 | 14,643 | — | 49,199 | ||||||||||||||||||||||||||||||||
| 38,742 | 42,836 | 3,175 | 84,753 | 52,314 | 64,537 | 12,306 | 129,157 | 58,537 | 34,435 | 1,798 | 94,770 | |||||||||||||||||||||||||||||||||
| Commercial loans (2) | 38,522 | 22,471 | 15,404 | 76,397 | 40,151 | 23,055 | 22,546 | 85,752 | 27,111 | 37,338 | 13,856 | 78,305 | ||||||||||||||||||||||||||||||||
| Consumer loans and overdrafts | — | 356 | — | 356 | — | 201 | — | 201 | — | 111 | — | 111 | ||||||||||||||||||||||||||||||||
| $ | 77,264 | $ | 65,663 | $ | 18,579 | $ | 161,506 | $ | 92,465 | $ | 87,793 | $ | 34,852 | $ | 215,110 | $ | 85,648 | $ | 71,884 | $ | 15,654 | $ | 173,186 | |||||||||||||||||||||
__________
(1) There were no loans categorized as “Loss” as of the dates presented.
(2) Loan balances as of September 30, 2021 include $13.9 million in a commercial relationship placed in nonaccrual status and downgraded during the second quarter of 2020 ($19.6 million at each of the other periods shown). As of September 30, 2021, Substandard loans include $7.3 million and doubtful loans include $6.6 million, related to this commercial relationship (Substandard loans include $7.3 million and doubtful loans include $12.3 million at each of the other periods shown). During the third quarters of 2021 and 2020, the Company charged off $5.7 million and $19.3 million, respectively, against the allowance for loan losses as result of the deterioration of this commercial relationship.
Exhibit 8 - Deposits by Country of Domicile
This table shows the Company’s deposits by country of domicile of the depositor as of the dates presented.
| (in thousands) | September 30, 2021 | June 30, 2021 | March 31, 2021 | December 31, 2020 | September 30, 2020 | ||||||||||||||||||||||||
| Domestic | $ | 3,090,563 | $ | 3,140,541 | $ | 3,175,522 | $ | 3,202,936 | $ | 3,310,343 | |||||||||||||||||||
| Foreign: | |||||||||||||||||||||||||||||
| Venezuela | 2,054,149 | 2,075,658 | 2,088,519 | 2,119,412 | 2,169,621 | ||||||||||||||||||||||||
| Others | 481,665 | 458,709 | 414,038 | 409,295 | 397,582 | ||||||||||||||||||||||||
| Total foreign | 2,535,814 | 2,534,367 | 2,502,557 | 2,528,707 | 2,567,203 | ||||||||||||||||||||||||
| Total deposits | $ | 5,626,377 | $ | 5,674,908 | $ | 5,678,079 | $ | 5,731,643 | $ | 5,877,546 | |||||||||||||||||||
27
Earnings Call October 21, 2021 Third Quarter 2021 Financial Review
2 Forward-Looking Statements This press release contains “forward-looking statements” within the meaning of the Securities Act of 1933 and the Securities Exchange Act of 1934, including statements regarding the proposed clean-up merger (the "Merger"), the Class A Repurchase Program and the Company’s ability to obtain shareholder approval for the Merger, as well as statements with respect to the Company’s objectives, expectations and intentions and other statements that are not historical facts. All statements other than statements of historical fact are statements that could be forward-looking statements. You can identify these forward-looking statements through our use of words such as “may,” “will,” “anticipate,” “assume,” “should,” “indicate,” “would,” “believe,” “contemplate,” “expect,” “estimate,” “continue,” “plan,” “point to,” “project,” “could,” “intend,” “target,” “goals,” “outlooks,” “modeled,” “dedicated,” “create,” and other similar words and expressions of the future. Forward-looking statements, including those as to our beliefs, plans, objectives, goals, expectations, anticipations, estimates and intentions, involve known and unknown risks, uncertainties and other factors, which may be beyond our control, and which may cause the Company’s actual results, performance, achievements, or financial condition to be materially different from future results, performance, achievements, or financial condition expressed or implied by such forward-looking statements. You should not rely on any forward-looking statements as predictions of future events. You should not expect us to update any forward-looking statements, except as required by law. All written or oral forward-looking statements attributable to us are expressly qualified in their entirety by this cautionary notice, together with those risks and uncertainties described in “Risk factors” in our annual report on Form 10-K for the fiscal year ended December 31, 2020, in our quarterly report on Form 10-Q for the quarter ended June 30, 2021 and in our other filings with the U.S. Securities and Exchange Commission (the “SEC”), which are available at the SEC’s website www.sec.gov. Interim Financial Information Unaudited financial information as of and for interim periods, including as of and for the three and nine month periods ended September 30, 2021 and 2020, may not reflect our results of operations for our fiscal year ending, or financial condition as of December 31, 2021, or any other period of time or date. Non-GAAP Financial Measures The Company supplements its financial results that are determined in accordance with accounting principles generally accepted in the United States of America (“GAAP”) with non- GAAP financial measures, such as "pre-provision net revenue (PPNR)", “Core pre-provision net revenue (Core PPNR)”, “core net income (loss)”, “core net income (loss) per share (basic and diluted)”, “core return on assets (ROA)”, “core return on equity (ROE)”, and “core efficiency ratio”. This supplemental information is not required by, or are not presented in accordance with GAAP. The Company refers to these financial measures and ratios as “non-GAAP financial measures” and they should not be considered in isolation or as a substitute for the GAAP measures presented herein. We use certain non-GAAP financial measures, including those mentioned above, both to explain our results to shareholders and the investment community and in the internal evaluation and management of our businesses. Our management believes that these non-GAAP financial measures and the information they provide are useful to investors since these measures permit investors to view our performance using the same tools that our management uses to evaluate our past performance and prospects for future performance, especially in light of the additional costs we have incurred in connection with the Company’s restructuring activities that began in 2018 and have continued into 2021, including the effect of non-core banking activities such as the sale of loans and securities, and other non-recurring actions intended to improve customer service and operating performance. While we believe that these non-GAAP financial measures are useful in evaluating our performance, this information should be considered as supplemental and not as a substitute for or superior to the related financial information prepared in accordance with GAAP. Additionally, these non-GAAP financial measures may differ from similar measures presented by other companies. Important Notices and Disclaimers
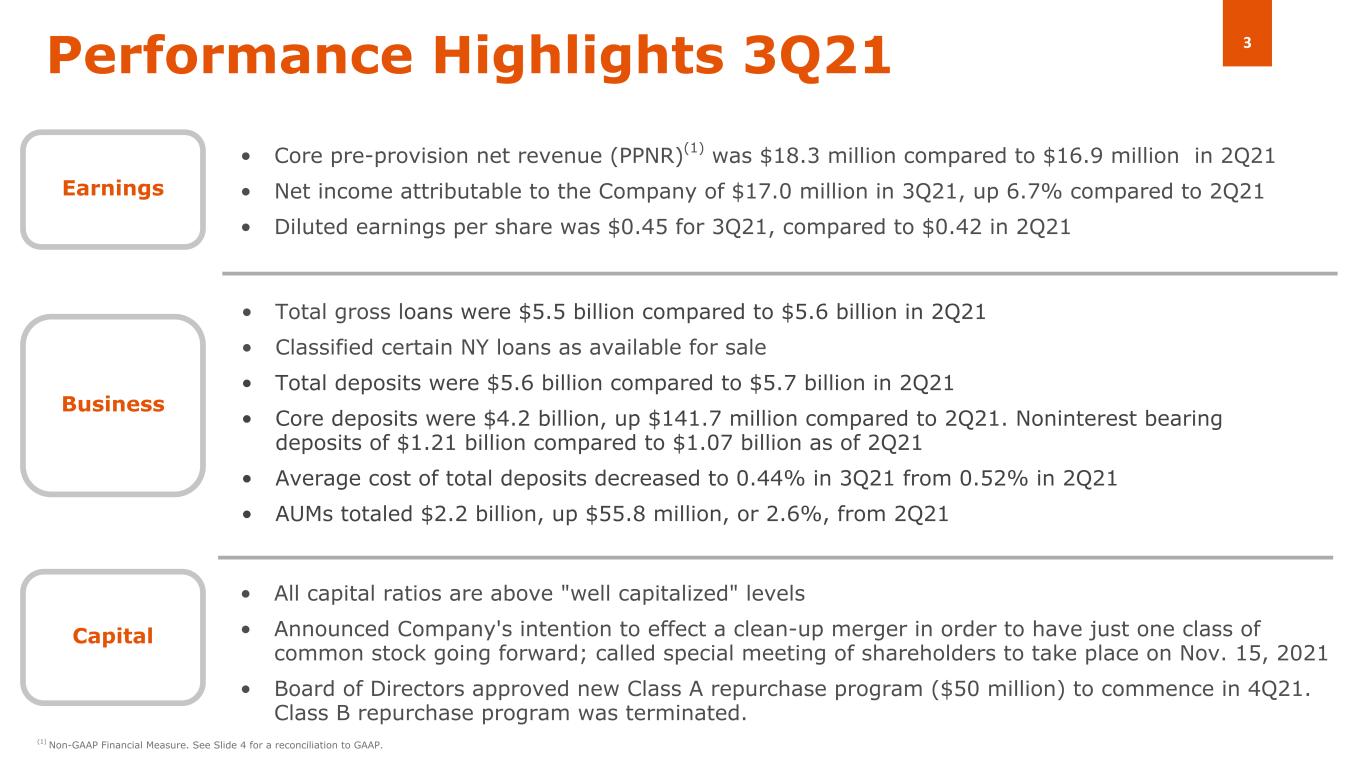
3 • All capital ratios are above "well capitalized" levels • Announced Company's intention to effect a clean-up merger in order to have just one class of common stock going forward; called special meeting of shareholders to take place on Nov. 15, 2021 • Board of Directors approved new Class A repurchase program ($50 million) to commence in 4Q21. Class B repurchase program was terminated. Performance Highlights 3Q21 Capital Business • Core pre-provision net revenue (PPNR)(1) was $18.3 million compared to $16.9 million in 2Q21 • Net income attributable to the Company of $17.0 million in 3Q21, up 6.7% compared to 2Q21 • Diluted earnings per share was $0.45 for 3Q21, compared to $0.42 in 2Q21 • Total gross loans were $5.5 billion compared to $5.6 billion in 2Q21 • Classified certain NY loans as available for sale • Total deposits were $5.6 billion compared to $5.7 billion in 2Q21 • Core deposits were $4.2 billion, up $141.7 million compared to 2Q21. Noninterest bearing deposits of $1.21 billion compared to $1.07 billion as of 2Q21 • Average cost of total deposits decreased to 0.44% in 3Q21 from 0.52% in 2Q21 • AUMs totaled $2.2 billion, up $55.8 million, or 2.6%, from 2Q21 Earnings (1) Non-GAAP Financial Measure. See Slide 4 for a reconciliation to GAAP.
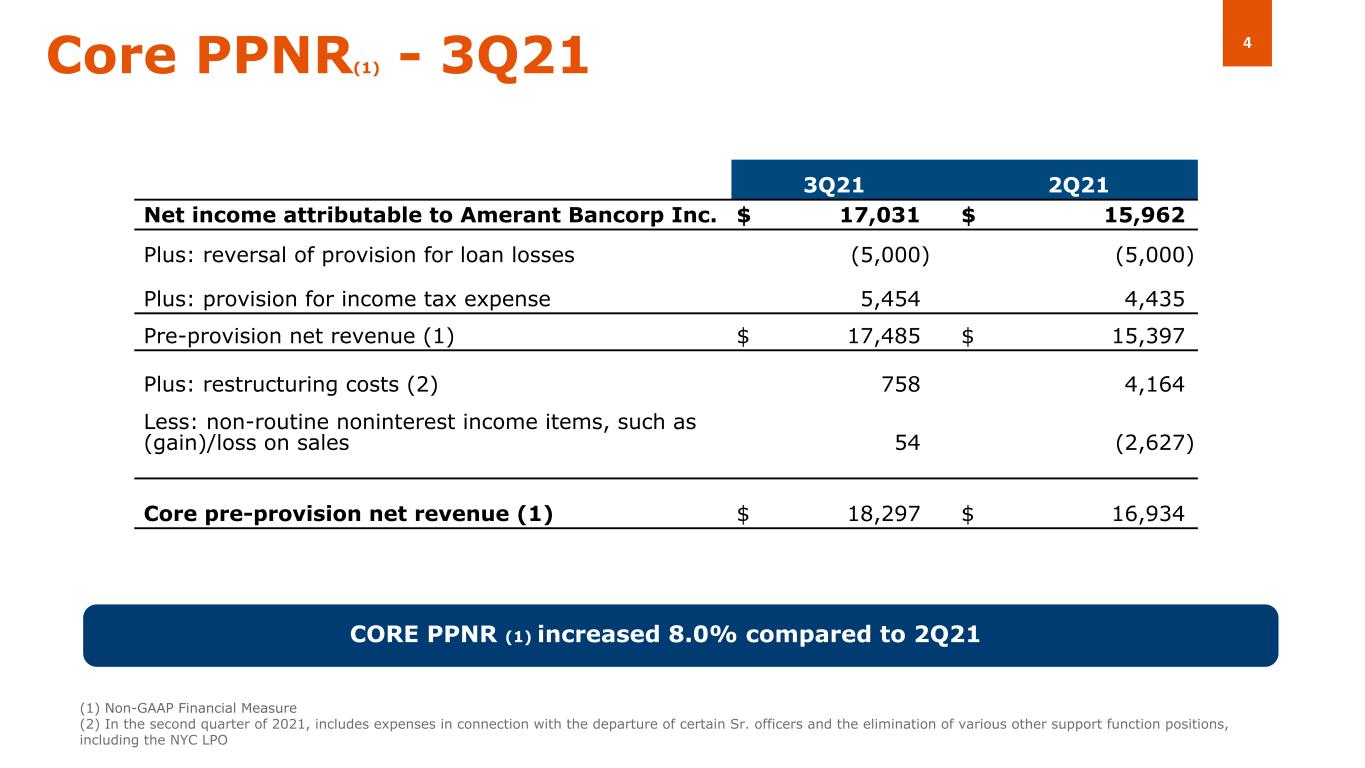
4Core PPNR(1) - 3Q21 CORE PPNR (1) increased 8.0% compared to 2Q21 (1) Non-GAAP Financial Measure (2) In the second quarter of 2021, includes expenses in connection with the departure of certain Sr. officers and the elimination of various other support function positions, including the NYC LPO (( 3Q21 2Q21 Net income attributable to Amerant Bancorp Inc. $ 17,031 $ 15,962 Plus: reversal of provision for loan losses (5,000) (5,000) Plus: provision for income tax expense 5,454 4,435 Pre-provision net revenue (1) $ 17,485 $ 15,397 Plus: restructuring costs (2) 758 4,164 Less: non-routine noninterest income items, such as (gain)/loss on sales 54 (2,627) Core pre-provision net revenue (1) $ 18,297 $ 16,934
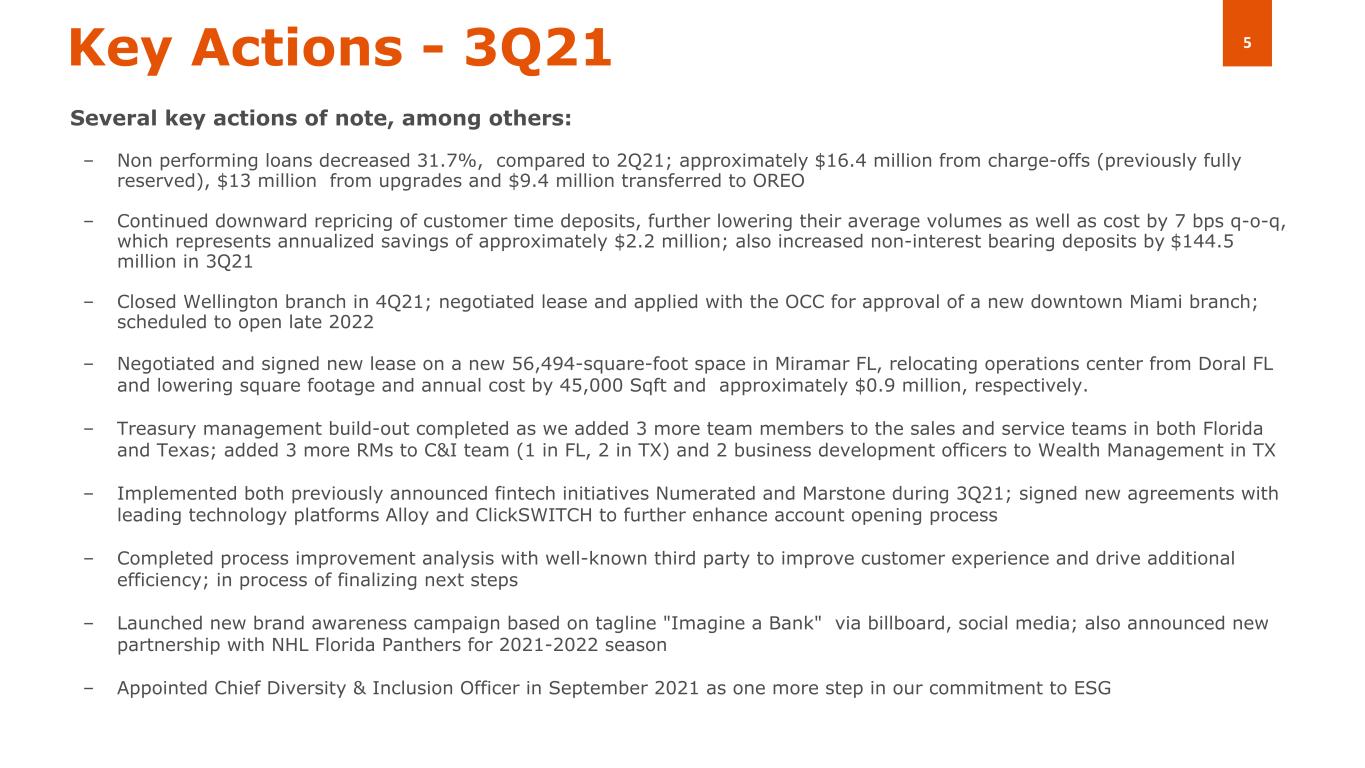
5Key Actions - 3Q21 Several key actions of note, among others: – Non performing loans decreased 31.7%, compared to 2Q21; approximately $16.4 million from charge-offs (previously fully reserved), $13 million from upgrades and $9.4 million transferred to OREO – Continued downward repricing of customer time deposits, further lowering their average volumes as well as cost by 7 bps q-o-q, which represents annualized savings of approximately $2.2 million; also increased non-interest bearing deposits by $144.5 million in 3Q21 – Closed Wellington branch in 4Q21; negotiated lease and applied with the OCC for approval of a new downtown Miami branch; scheduled to open late 2022 – Negotiated and signed new lease on a new 56,494-square-foot space in Miramar FL, relocating operations center from Doral FL and lowering square footage and annual cost by 45,000 Sqft and approximately $0.9 million, respectively. – Treasury management build-out completed as we added 3 more team members to the sales and service teams in both Florida and Texas; added 3 more RMs to C&I team (1 in FL, 2 in TX) and 2 business development officers to Wealth Management in TX – Implemented both previously announced fintech initiatives Numerated and Marstone during 3Q21; signed new agreements with leading technology platforms Alloy and ClickSWITCH to further enhance account opening process – Completed process improvement analysis with well-known third party to improve customer experience and drive additional efficiency; in process of finalizing next steps – Launched new brand awareness campaign based on tagline "Imagine a Bank" via billboard, social media; also announced new partnership with NHL Florida Panthers for 2021-2022 season – Appointed Chief Diversity & Inclusion Officer in September 2021 as one more step in our commitment to ESG
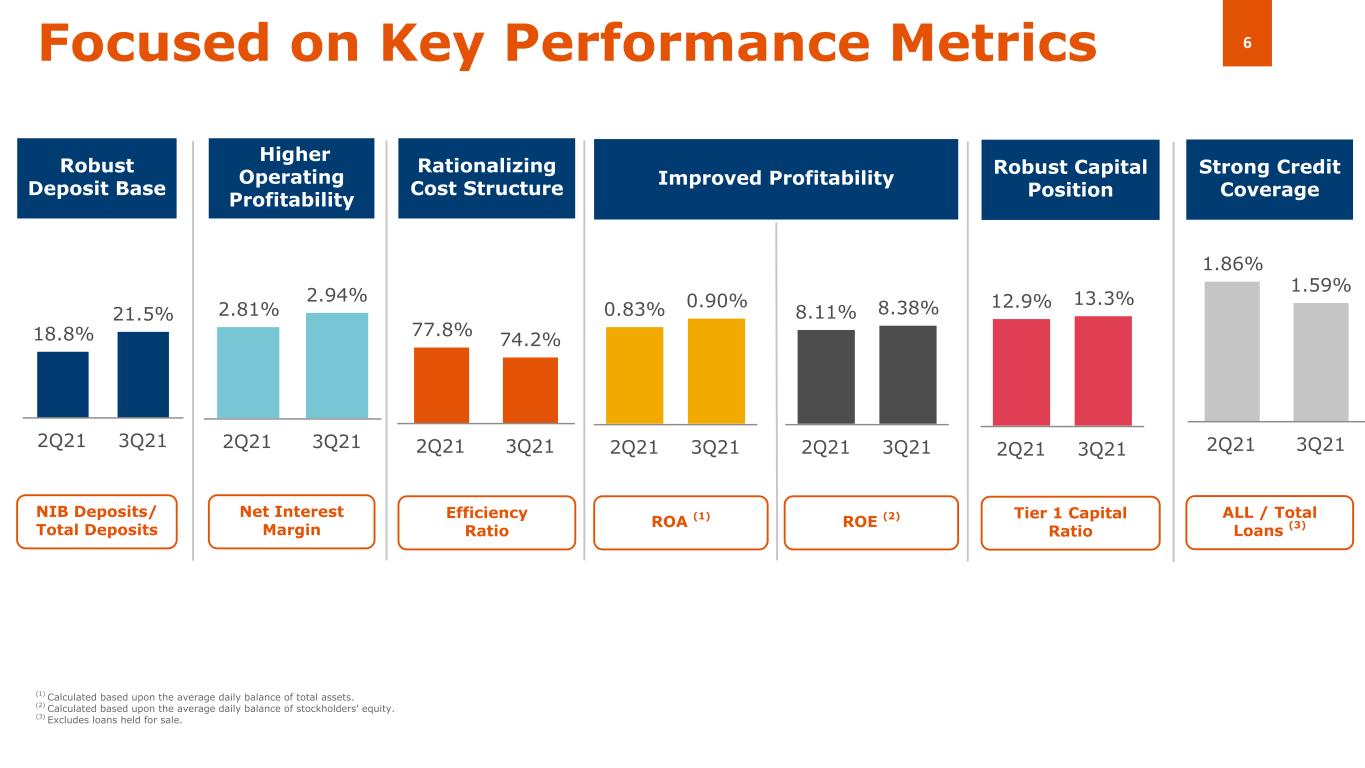
6 77.8% 74.2% 2Q21 3Q21 18.8% 21.5% 2Q21 3Q21 12.9% 13.3% 2Q21 3Q21 2.81% 2.94% 2Q21 3Q21 Focused on Key Performance Metrics Robust Deposit Base Robust Capital Position Higher Operating Profitability Rationalizing Cost Structure (1) Calculated based upon the average daily balance of total assets. (2) Calculated based upon the average daily balance of stockholders' equity. (3) Excludes loans held for sale. 1.86% 1.59% 2Q21 3Q21 Strong Credit Coverage 0.83% 0.90% 2Q21 3Q21 Improved Profitability 8.11% 8.38% 2Q21 3Q21 NIB Deposits/ Total Deposits Tier 1 Capital Ratio Net Interest Margin Efficiency Ratio ALL / Total Loans (3)ROA (1) ROE (2)
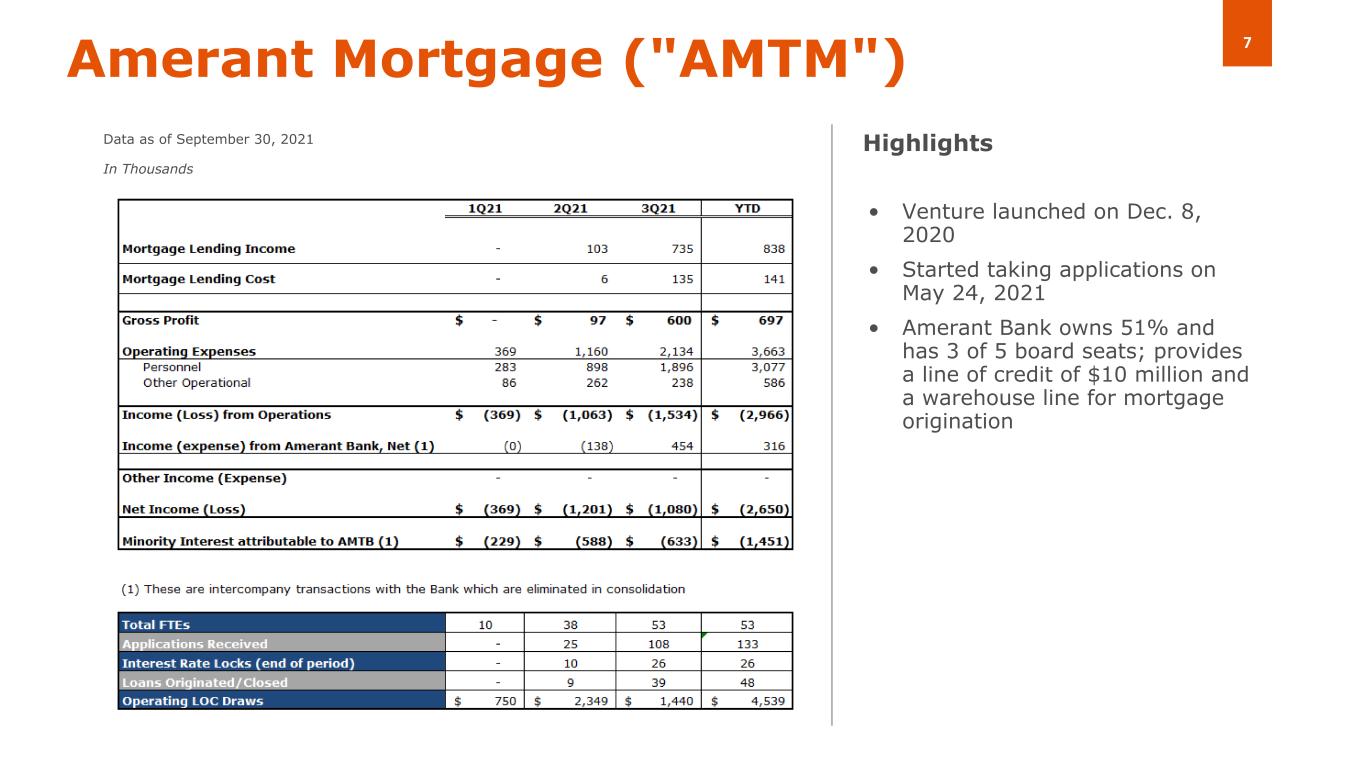
7Amerant Mortgage ("AMTM") • Venture launched on Dec. 8, 2020 • Started taking applications on May 24, 2021 • Amerant Bank owns 51% and has 3 of 5 board seats; provides a line of credit of $10 million and a warehouse line for mortgage origination Data as of September 30, 2021 In Thousands Highlights
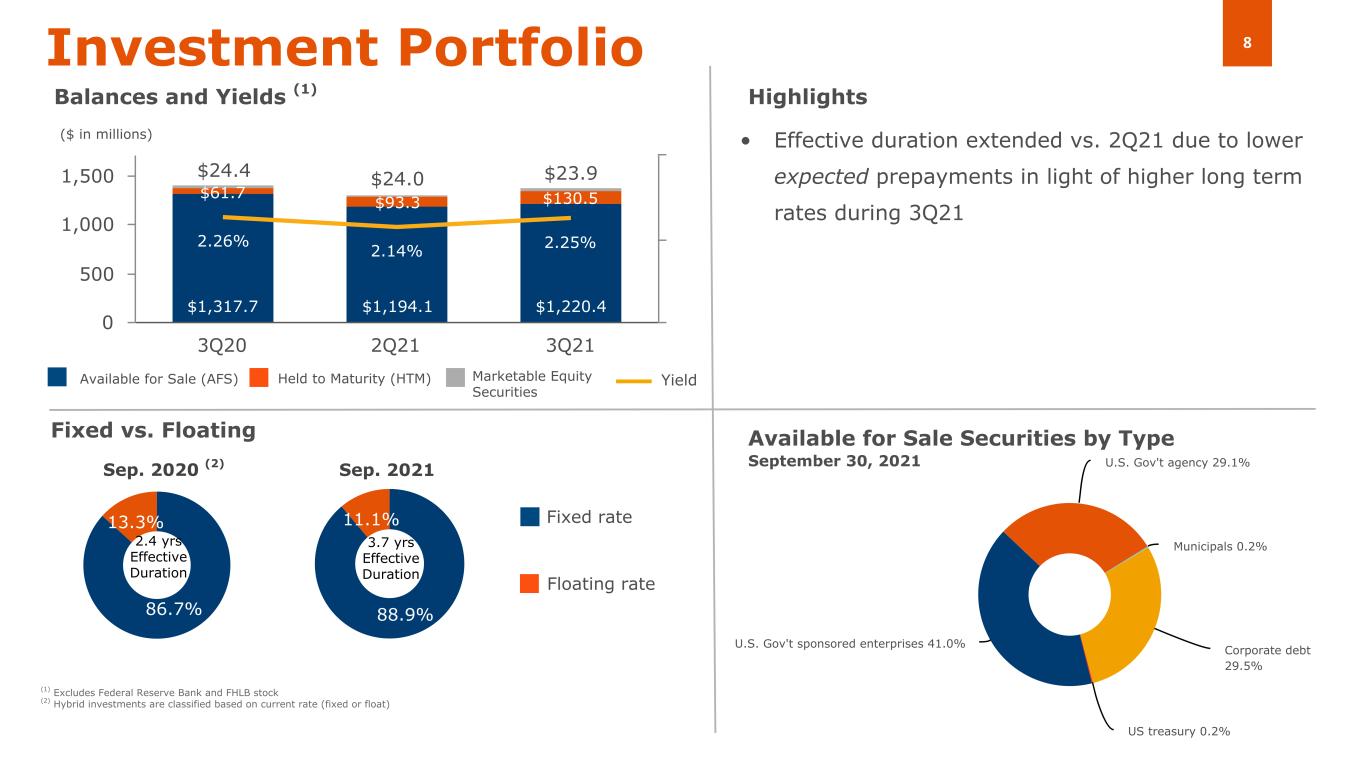
8 88.9% 11.1% U.S. Gov't sponsored enterprises 41.0% U.S. Gov't agency 29.1% Municipals 0.2% Corporate debt 29.5% US treasury 0.2% $1,317.7 $1,194.1 $1,220.4 $61.7 $93.3 $130.5 $24.4 $24.0 $23.9 2.26% 2.14% 2.25% 3Q20 2Q21 3Q21 0 500 1,000 1,500 86.7% 13.3% • Effective duration extended vs. 2Q21 due to lower expected prepayments in light of higher long term rates during 3Q21 Investment Portfolio Balances and Yields (1) Available for Sale (AFS) Held to Maturity (HTM) Highlights Fixed vs. Floating Sep. 2020 (2) Sep. 2021 Floating rate Fixed rate Available for Sale Securities by Type September 30, 2021 2.4 yrs Effective Duration ($ in millions) Marketable Equity Securities (1) Excludes Federal Reserve Bank and FHLB stock (2) Hybrid investments are classified based on current rate (fixed or float) Yield 3.7 yrs Effective Duration
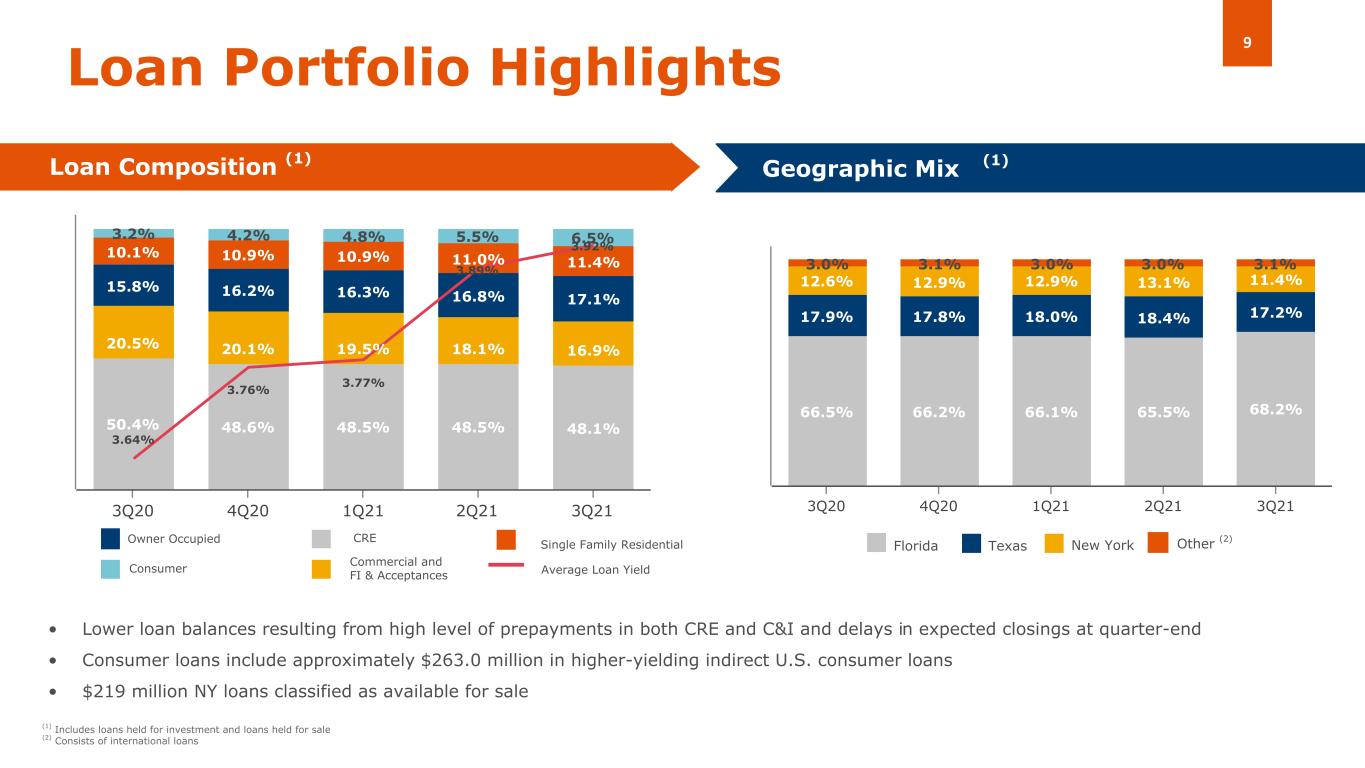
9 50.4% 48.6% 48.5% 48.5% 48.1% 20.5% 20.1% 19.5% 18.1% 16.9% 15.8% 16.2% 16.3% 16.8% 17.1% 10.1% 10.9% 10.9% 11.0% 11.4% 3.2% 4.2% 4.8% 5.5% 6.5% 3.64% 3.76% 3.77% 3.89% 3.92% 3Q20 4Q20 1Q21 2Q21 3Q21 66.5% 66.2% 66.1% 65.5% 68.2% 17.9% 17.8% 18.0% 18.4% 17.2% 12.6% 12.9% 12.9% 13.1% 11.4% 3.0% 3.1% 3.0% 3.0% 3.1% 3Q20 4Q20 1Q21 2Q21 3Q21 Consumer CRE Commercial and FI & Acceptances Owner Occupied Single Family Residential Loan Portfolio Highlights Loan Composition (1) Geographic Mix (Domestic) • Lower loan balances resulting from high level of prepayments in both CRE and C&I and delays in expected closings at quarter-end • Consumer loans include approximately $263.0 million in higher-yielding indirect U.S. consumer loans • $219 million NY loans classified as available for sale (1) Florida Texas New York Average Loan Yield Other (2) (1) Includes loans held for investment and loans held for sale (2) Consists of international loans
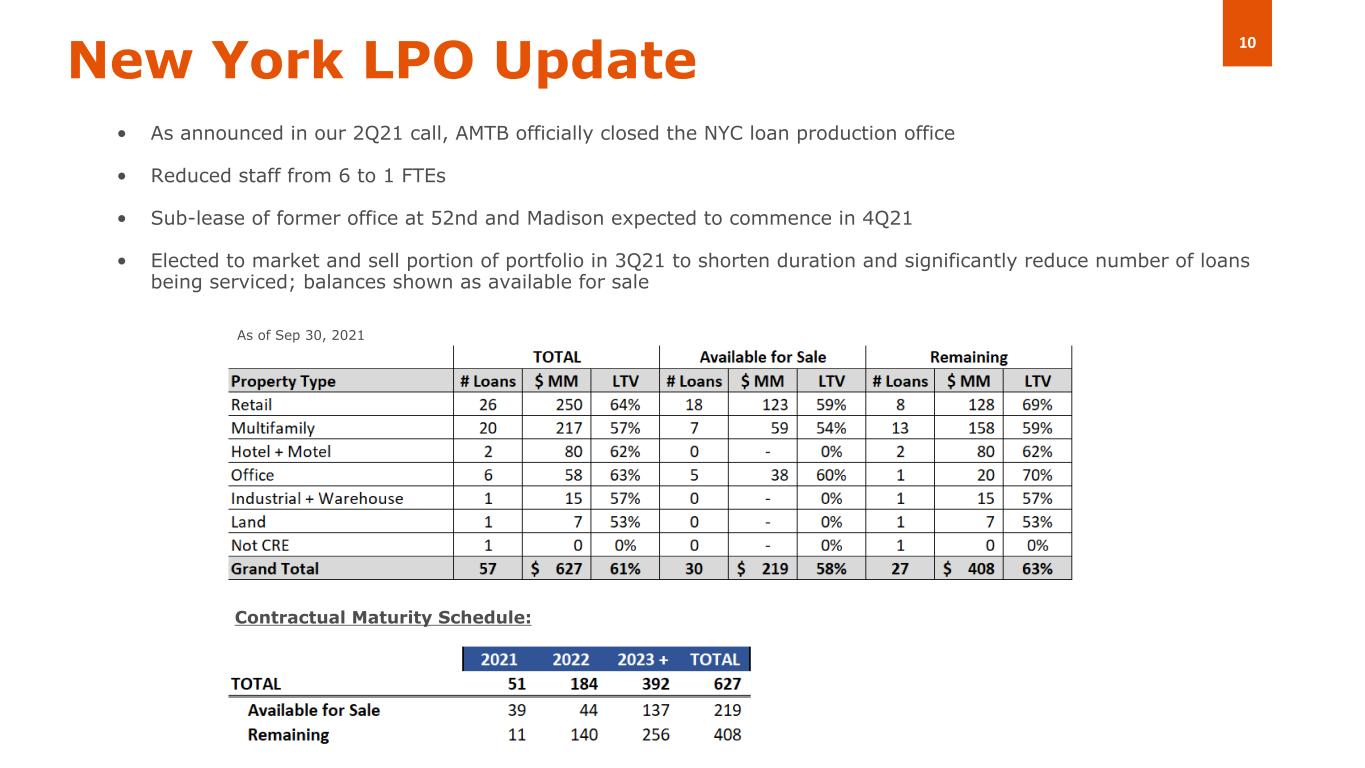
10New York LPO Update • As announced in our 2Q21 call, AMTB officially closed the NYC loan production office • Reduced staff from 6 to 1 FTEs • Sub-lease of former office at 52nd and Madison expected to commence in 4Q21 • Elected to market and sell portion of portfolio in 3Q21 to shorten duration and significantly reduce number of loans being serviced; balances shown as available for sale Contractual Maturity Schedule: As of Sep 30, 2021
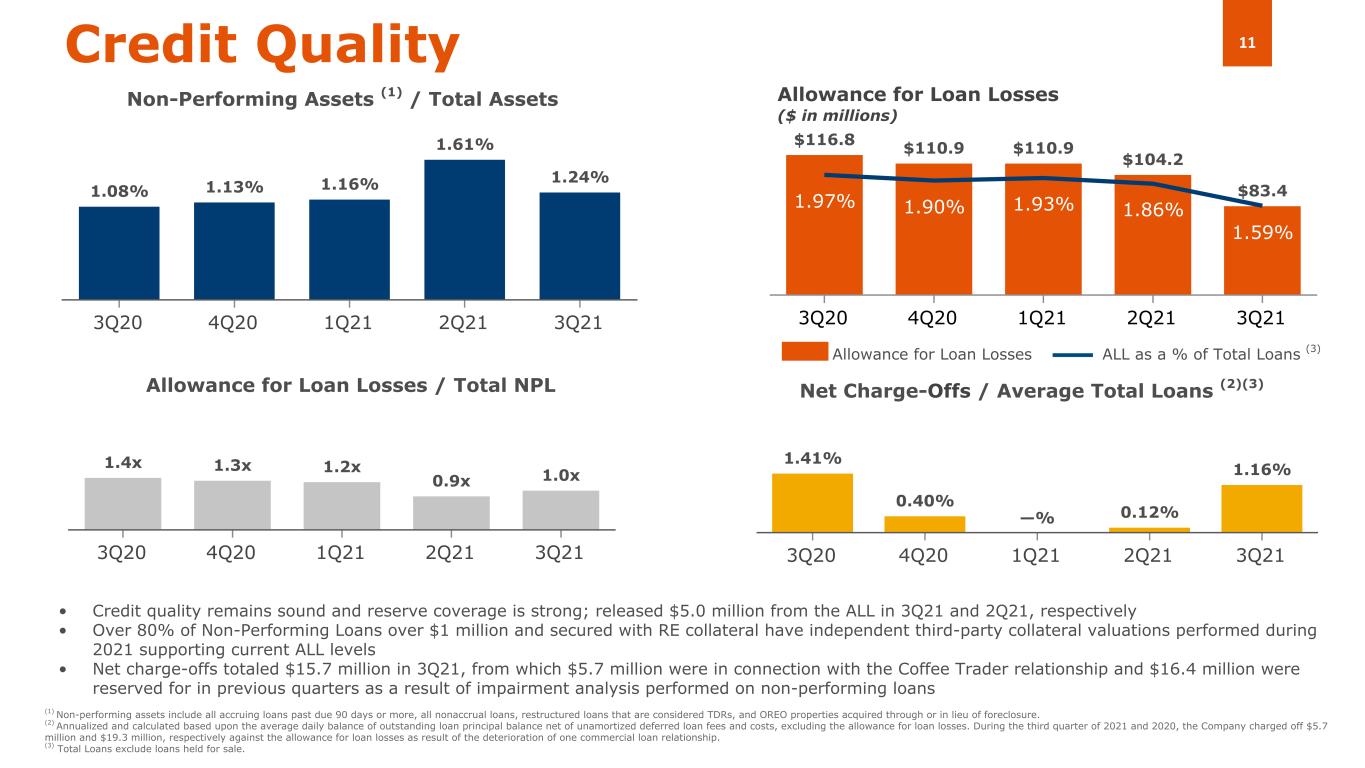
11 $116.8 $110.9 $110.9 $104.2 $83.41.97% 1.90% 1.93% 1.86% 1.59% 3Q20 4Q20 1Q21 2Q21 3Q21 1.41% 0.40% —% 0.12% 1.16% 3Q20 4Q20 1Q21 2Q21 3Q21 • Credit quality remains sound and reserve coverage is strong; released $5.0 million from the ALL in 3Q21 and 2Q21, respectively • Over 80% of Non-Performing Loans over $1 million and secured with RE collateral have independent third-party collateral valuations performed during 2021 supporting current ALL levels • Net charge-offs totaled $15.7 million in 3Q21, from which $5.7 million were in connection with the Coffee Trader relationship and $16.4 million were reserved for in previous quarters as a result of impairment analysis performed on non-performing loans Net Charge-Offs / Average Total Loans (2)(3) Credit Quality Allowance for Loan Losses ($ in millions) Non-Performing Assets (1) / Total Assets Allowance for Loan Losses / Total NPL Allowance for Loan Losses ALL as a % of Total Loans (3) (1) Non-performing assets include all accruing loans past due 90 days or more, all nonaccrual loans, restructured loans that are considered TDRs, and OREO properties acquired through or in lieu of foreclosure. (2) Annualized and calculated based upon the average daily balance of outstanding loan principal balance net of unamortized deferred loan fees and costs, excluding the allowance for loan losses. During the third quarter of 2021 and 2020, the Company charged off $5.7 million and $19.3 million, respectively against the allowance for loan losses as result of the deterioration of one commercial loan relationship. (3) Total Loans exclude loans held for sale. 1.08% 1.13% 1.16% 1.61% 1.24% 3Q20 4Q20 1Q21 2Q21 3Q21 1.4x 1.3x 1.2x 0.9x 1.0x 3Q20 4Q20 1Q21 2Q21 3Q21
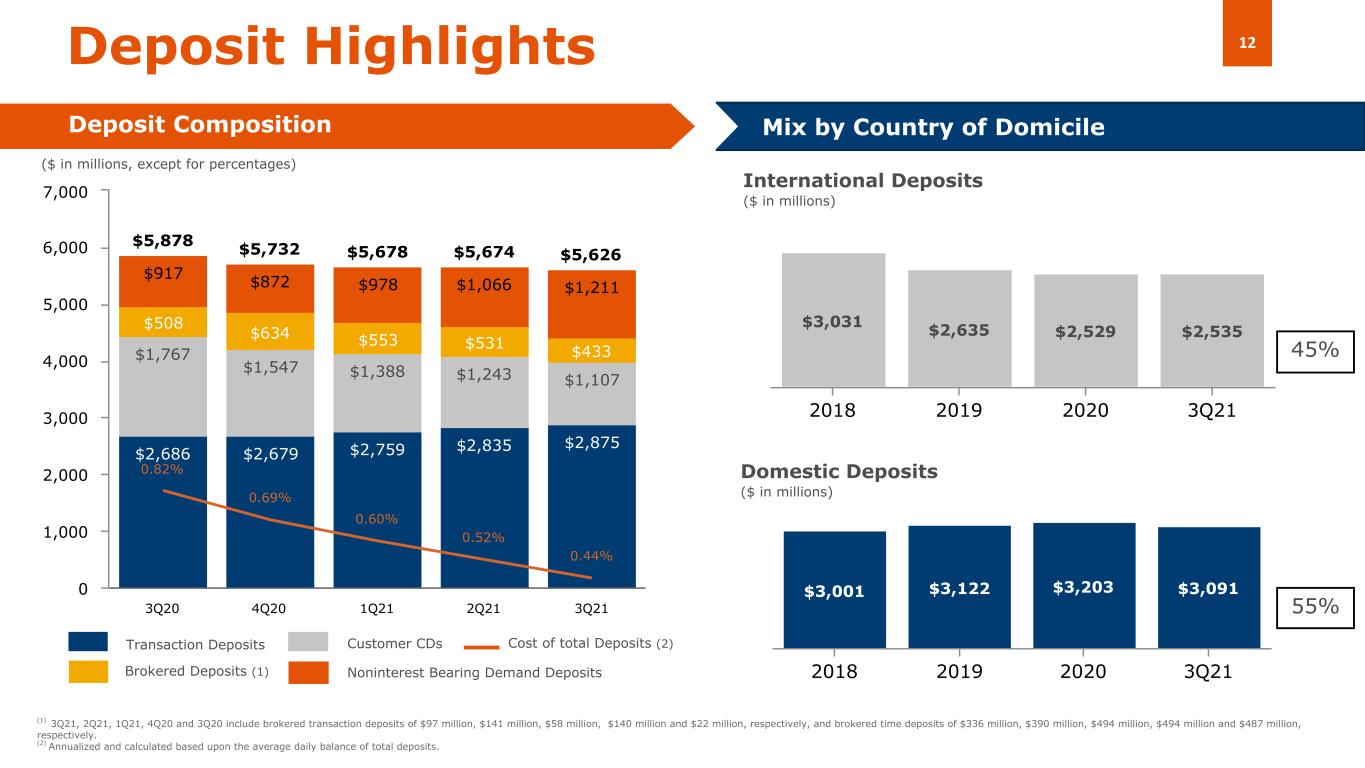
12 $5,878 $5,732 $5,678 $5,674 $5,626 $2,686 $2,679 $2,759 $2,835 $2,875 $1,767 $1,547 $1,388 $1,243 $1,107 $508 $634 $553 $531 $433 $917 $872 $978 $1,066 $1,211 0.82% 0.69% 0.60% 0.52% 0.44% 3Q20 4Q20 1Q21 2Q21 3Q21 0 1,000 2,000 3,000 4,000 5,000 6,000 7,000 $3,031 $2,635 $2,529 $2,535 2018 2019 2020 3Q21 $3,001 $3,122 $3,203 $3,091 2018 2019 2020 3Q21 Domestic Deposits ($ in millions) Deposit Highlights Deposit Composition 55% International Deposits ($ in millions) Mix by Country of Domicile Transaction Deposits Customer CDs Brokered Deposits (1) Cost of total Deposits (2) ($ in millions, except for percentages) 45% (1) 3Q21, 2Q21, 1Q21, 4Q20 and 3Q20 include brokered transaction deposits of $97 million, $141 million, $58 million, $140 million and $22 million, respectively, and brokered time deposits of $336 million, $390 million, $494 million, $494 million and $487 million, respectively. (2) Annualized and calculated based upon the average daily balance of total deposits. Noninterest Bearing Demand Deposits
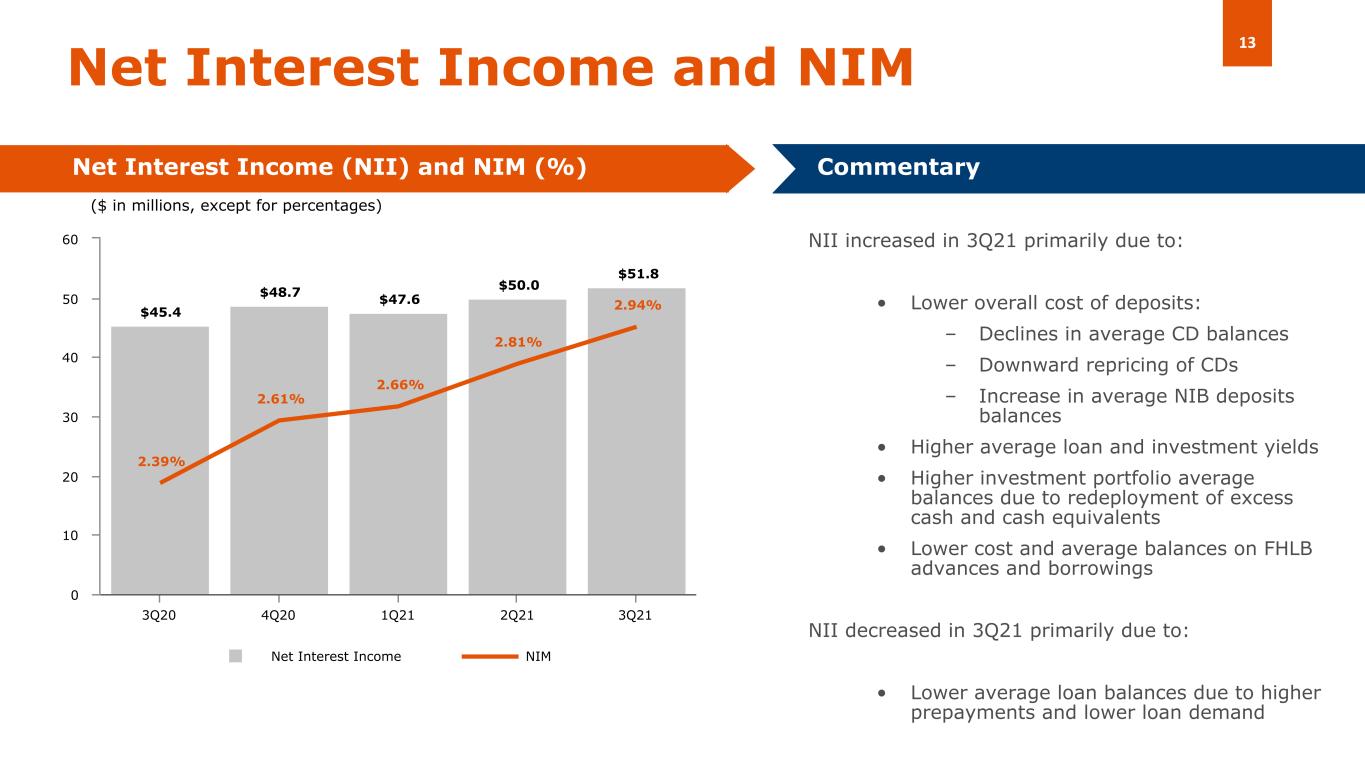
13 $45.4 $48.7 $47.6 $50.0 $51.8 2.39% 2.61% 2.66% 2.81% 2.94% Net Interest Income NIM 3Q20 4Q20 1Q21 2Q21 3Q21 0 10 20 30 40 50 60 NII increased in 3Q21 primarily due to: • Lower overall cost of deposits: – Declines in average CD balances – Downward repricing of CDs – Increase in average NIB deposits balances • Higher average loan and investment yields • Higher investment portfolio average balances due to redeployment of excess cash and cash equivalents • Lower cost and average balances on FHLB advances and borrowings NII decreased in 3Q21 primarily due to: • Lower average loan balances due to higher prepayments and lower loan demand Net Interest Income and NIM Net Interest Income (NII) and NIM (%) Commentary ($ in millions, except for percentages)
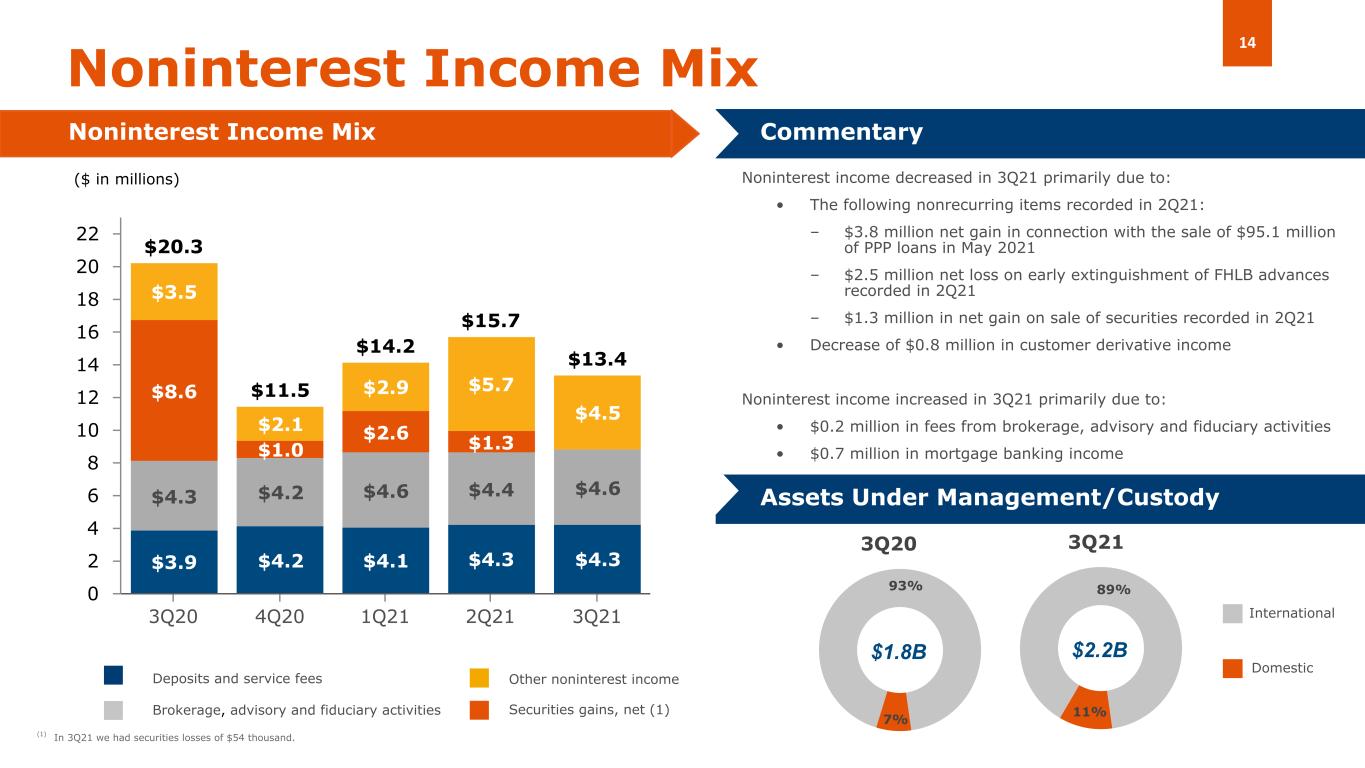
14 $20.3 $11.5 $14.2 $15.7 $13.4 $3.9 $4.2 $4.1 $4.3 $4.3 $4.3 $4.2 $4.6 $4.4 $4.6 $8.6 $1.0 $2.6 $1.3 $3.5 $2.1 $2.9 $5.7 $4.5 3Q20 4Q20 1Q21 2Q21 3Q21 0 2 4 6 8 10 12 14 16 18 20 22 7% 93% 11% 89% Noninterest Income Mix Noninterest Income Mix Commentary Noninterest income decreased in 3Q21 primarily due to: • The following nonrecurring items recorded in 2Q21: – $3.8 million net gain in connection with the sale of $95.1 million of PPP loans in May 2021 – $2.5 million net loss on early extinguishment of FHLB advances recorded in 2Q21 – $1.3 million in net gain on sale of securities recorded in 2Q21 • Decrease of $0.8 million in customer derivative income Noninterest income increased in 3Q21 primarily due to: • $0.2 million in fees from brokerage, advisory and fiduciary activities • $0.7 million in mortgage banking income Assets Under Management/Custody Deposits and service fees Brokerage, advisory and fiduciary activities Other noninterest income $2.2B Domestic International 3Q213Q20 $1.8B ($ in millions) Securities gains, net (1) (1) In 3Q21 we had securities losses of $54 thousand.
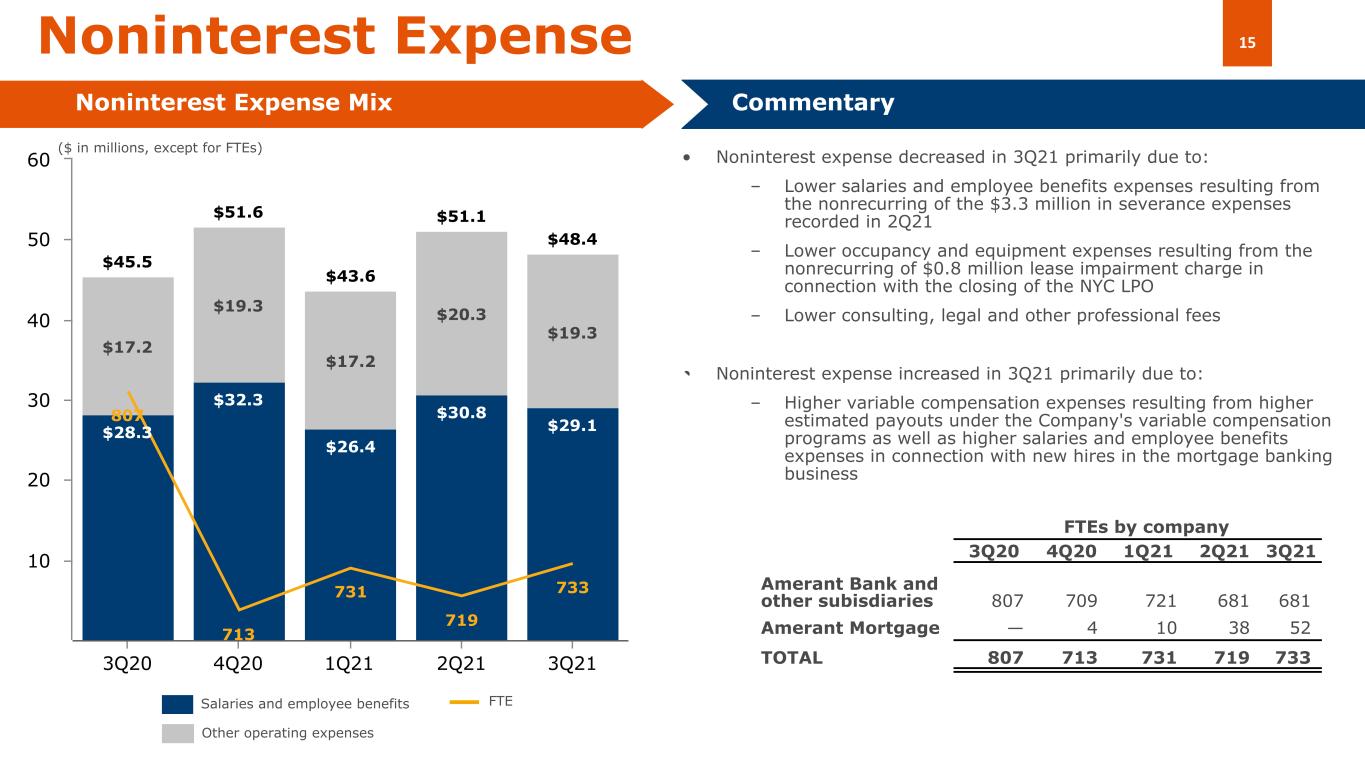
15 • Noninterest expense decreased in 3Q21 primarily due to: – Lower salaries and employee benefits expenses resulting from the nonrecurring of the $3.3 million in severance expenses recorded in 2Q21 – Lower occupancy and equipment expenses resulting from the nonrecurring of $0.8 million lease impairment charge in connection with the closing of the NYC LPO – Lower consulting, legal and other professional fees • Noninterest expense increased in 3Q21 primarily due to: – Higher variable compensation expenses resulting from higher estimated payouts under the Company's variable compensation programs as well as higher salaries and employee benefits expenses in connection with new hires in the mortgage banking business $45.5 $51.6 $43.6 $51.1 $48.4 $28.3 $32.3 $26.4 $30.8 $29.1 $17.2 $19.3 $17.2 $20.3 $19.3 807 713 731 719 733 3Q20 4Q20 1Q21 2Q21 3Q21 10 20 30 40 50 60 Noninterest Expense Noninterest Expense Mix Commentary Other operating expenses Salaries and employee benefits FTE ($ in millions, except for FTEs) FTEs by company 3Q20 4Q20 1Q21 2Q21 3Q21 Amerant Bank and other subisdiaries 807 709 721 681 681 Amerant Mortgage — 4 10 38 52 TOTAL 807 713 731 719 733
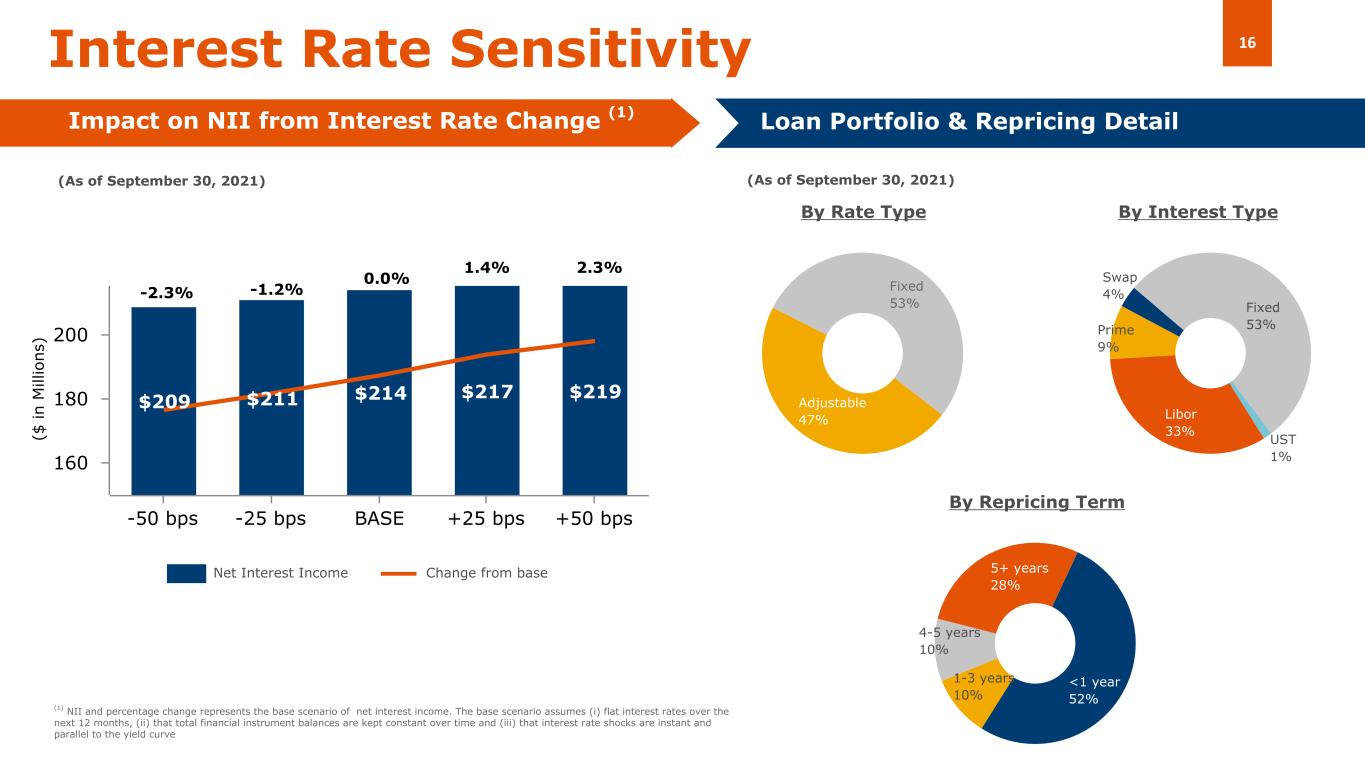
16 $209 $211 $214 $217 $219 -50 bps -25 bps BASE +25 bps +50 bps 160 180 200 (As of September 30, 2021) Fixed 53% Adjustable 47% Interest Rate Sensitivity By Interest TypeBy Rate Type By Repricing Term (1) NII and percentage change represents the base scenario of net interest income. The base scenario assumes (i) flat interest rates over the next 12 months, (ii) that total financial instrument balances are kept constant over time and (iii) that interest rate shocks are instant and parallel to the yield curve Loan Portfolio & Repricing Detail Impact on NII from Interest Rate Change (1) Net Interest Income Change from base <1 year 52% 1-3 years 10% 4-5 years 10% 5+ years 28% -2.3% -1.2% 0.0% 2.3%1.4% ($ in M ill io ns ) (As of September 30, 2021) Swap 4% Fixed 53% UST 1% Libor 33% Prime 9%
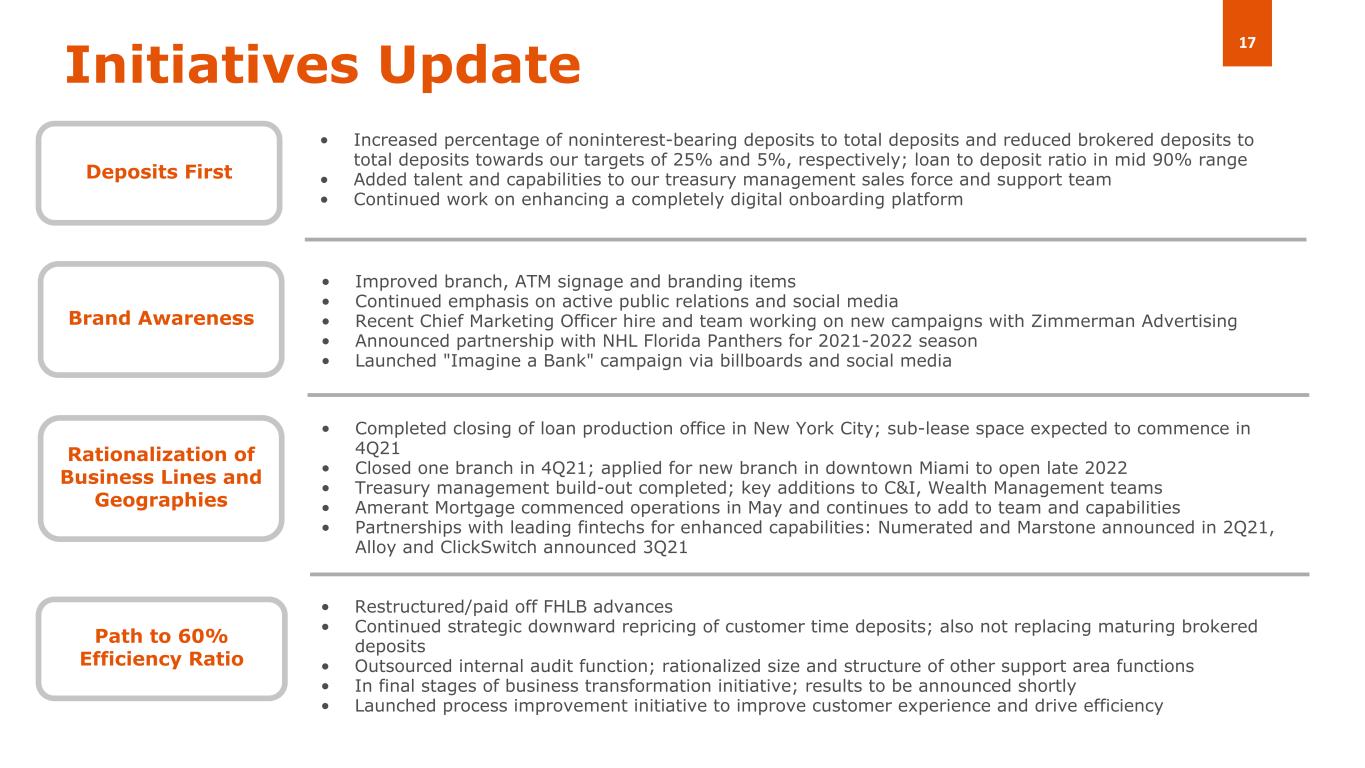
17Initiatives Update • Increased percentage of noninterest-bearing deposits to total deposits and reduced brokered deposits to total deposits towards our targets of 25% and 5%, respectively; loan to deposit ratio in mid 90% range • Added talent and capabilities to our treasury management sales force and support team • Continued work on enhancing a completely digital onboarding platform Deposits First • Improved branch, ATM signage and branding items • Continued emphasis on active public relations and social media • Recent Chief Marketing Officer hire and team working on new campaigns with Zimmerman Advertising • Announced partnership with NHL Florida Panthers for 2021-2022 season • Launched "Imagine a Bank" campaign via billboards and social media Brand Awareness • Completed closing of loan production office in New York City; sub-lease space expected to commence in 4Q21 • Closed one branch in 4Q21; applied for new branch in downtown Miami to open late 2022 • Treasury management build-out completed; key additions to C&I, Wealth Management teams • Amerant Mortgage commenced operations in May and continues to add to team and capabilities • Partnerships with leading fintechs for enhanced capabilities: Numerated and Marstone announced in 2Q21, Alloy and ClickSwitch announced 3Q21 Rationalization of Business Lines and Geographies • Restructured/paid off FHLB advances • Continued strategic downward repricing of customer time deposits; also not replacing maturing brokered deposits • Outsourced internal audit function; rationalized size and structure of other support area functions • In final stages of business transformation initiative; results to be announced shortly • Launched process improvement initiative to improve customer experience and drive efficiency Path to 60% Efficiency Ratio
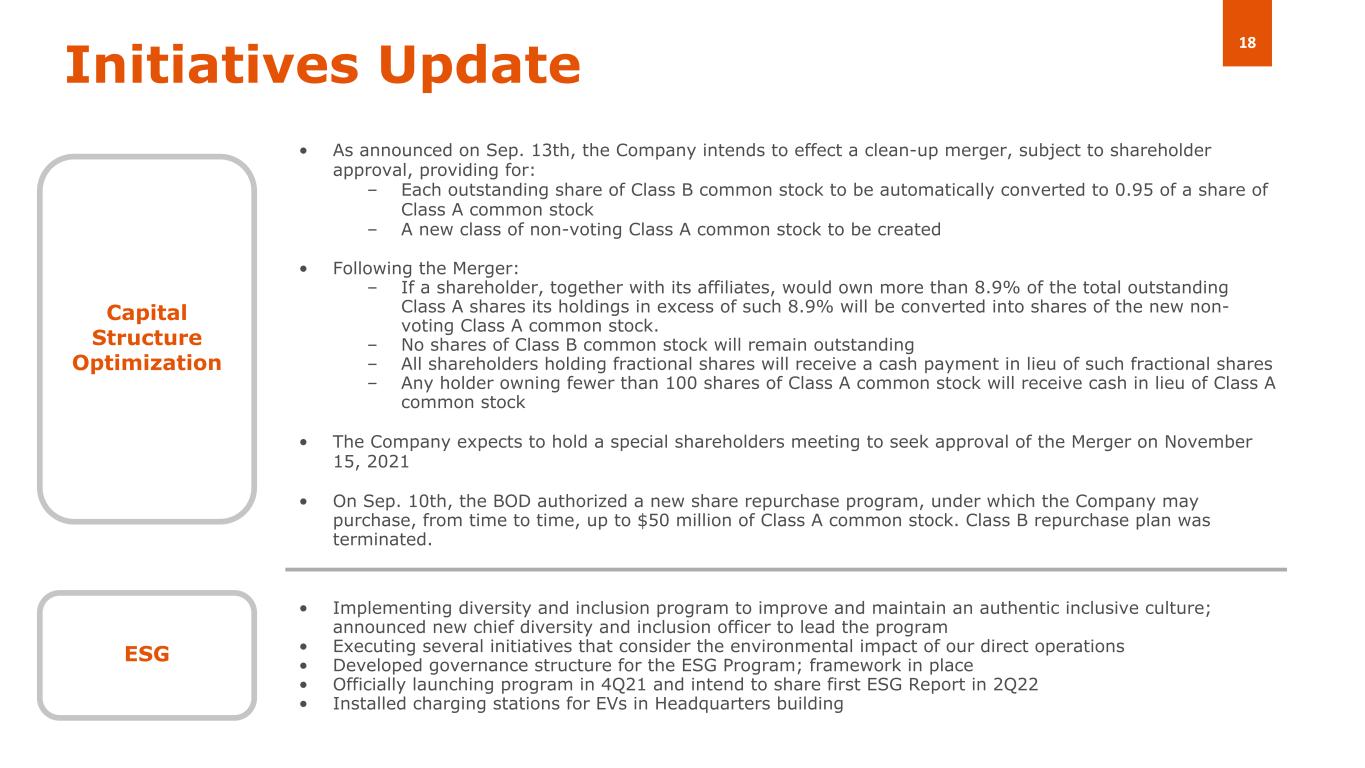
18Initiatives Update Focused on increasing profitability and shareholder value • As announced on Sep. 13th, the Company intends to effect a clean-up merger, subject to shareholder approval, providing for: – Each outstanding share of Class B common stock to be automatically converted to 0.95 of a share of Class A common stock – A new class of non-voting Class A common stock to be created • Following the Merger: – If a shareholder, together with its affiliates, would own more than 8.9% of the total outstanding Class A shares its holdings in excess of such 8.9% will be converted into shares of the new non- voting Class A common stock. – No shares of Class B common stock will remain outstanding – All shareholders holding fractional shares will receive a cash payment in lieu of such fractional shares – Any holder owning fewer than 100 shares of Class A common stock will receive cash in lieu of Class A common stock • The Company expects to hold a special shareholders meeting to seek approval of the Merger on November 15, 2021 • On Sep. 10th, the BOD authorized a new share repurchase program, under which the Company may purchase, from time to time, up to $50 million of Class A common stock. Class B repurchase plan was terminated. Capital Structure Optimization • Implementing diversity and inclusion program to improve and maintain an authentic inclusive culture; announced new chief diversity and inclusion officer to lead the program • Executing several initiatives that consider the environmental impact of our direct operations • Developed governance structure for the ESG Program; framework in place • Officially launching program in 4Q21 and intend to share first ESG Report in 2Q22 • Installed charging stations for EVs in Headquarters building ESG

Supplemental Loan Portfolio Information
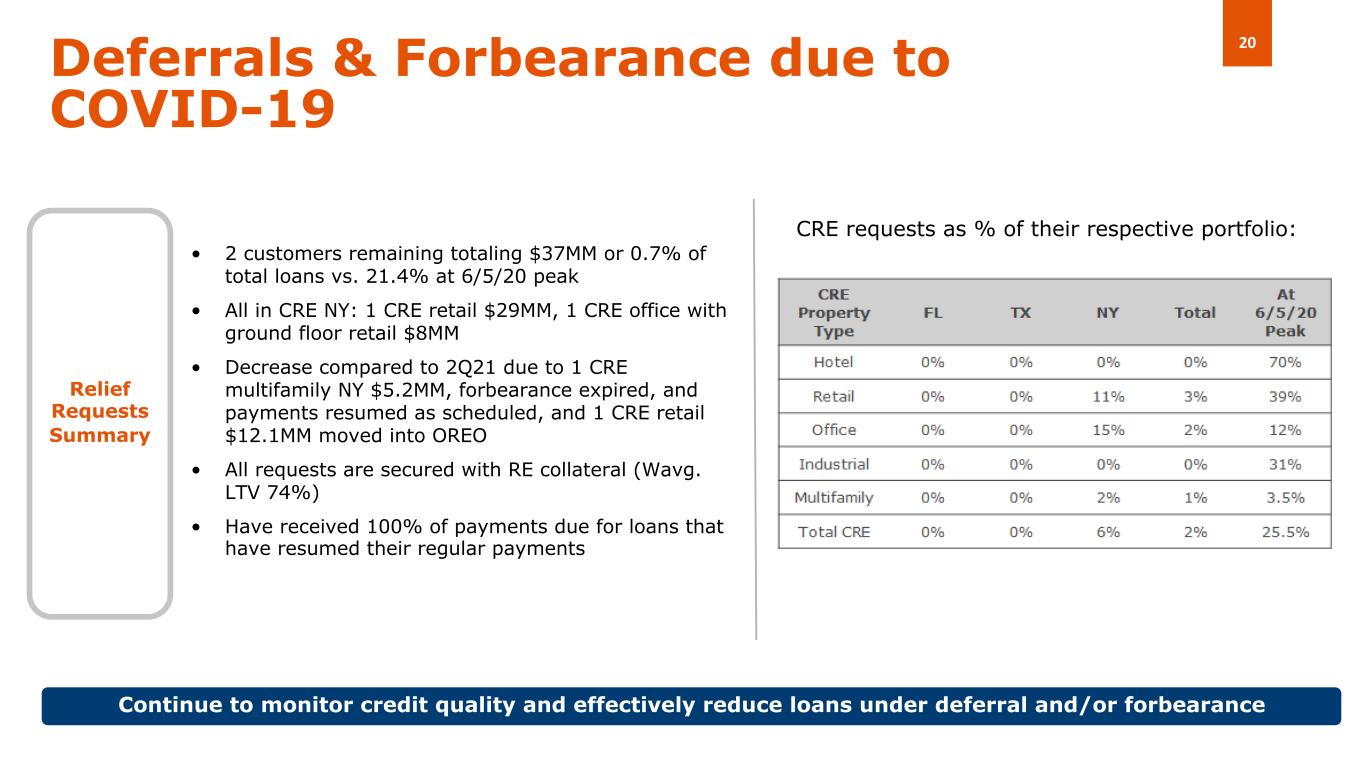
20Deferrals & Forbearance due to COVID-19 • 2 customers remaining totaling $37MM or 0.7% of total loans vs. 21.4% at 6/5/20 peak • All in CRE NY: 1 CRE retail $29MM, 1 CRE office with ground floor retail $8MM • Decrease compared to 2Q21 due to 1 CRE multifamily NY $5.2MM, forbearance expired, and payments resumed as scheduled, and 1 CRE retail $12.1MM moved into OREO • All requests are secured with RE collateral (Wavg. LTV 74%) • Have received 100% of payments due for loans that have resumed their regular payments Relief Requests Summary Continue to monitor credit quality and effectively reduce loans under deferral and/or forbearance CRE requests as % of their respective portfolio:
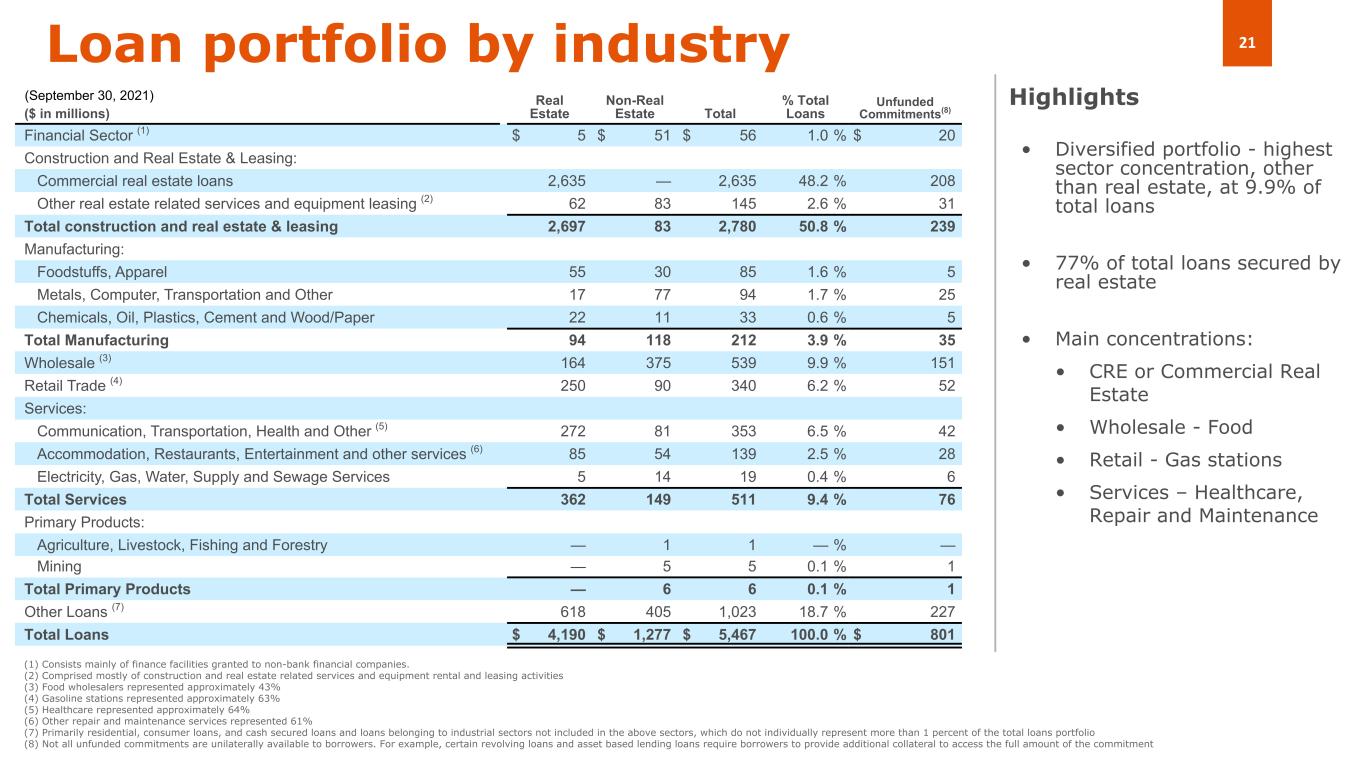
21Loan portfolio by industry • Diversified portfolio - highest sector concentration, other than real estate, at 9.9% of total loans • 77% of total loans secured by real estate • Main concentrations: • CRE or Commercial Real Estate • Wholesale - Food • Retail - Gas stations • Services – Healthcare, Repair and Maintenance Highlights (1) Consists mainly of finance facilities granted to non-bank financial companies. (2) Comprised mostly of construction and real estate related services and equipment rental and leasing activities (3) Food wholesalers represented approximately 43% (4) Gasoline stations represented approximately 63% (5) Healthcare represented approximately 64% (6) Other repair and maintenance services represented 61% (7) Primarily residential, consumer loans, and cash secured loans and loans belonging to industrial sectors not included in the above sectors, which do not individually represent more than 1 percent of the total loans portfolio (8) Not all unfunded commitments are unilaterally available to borrowers. For example, certain revolving loans and asset based lending loans require borrowers to provide additional collateral to access the full amount of the commitment ($ in millions) Real Estate Non-Real Estate Total % Total Loans Unfunded Commitments(8) Financial Sector (1) $ 5 $ 51 $ 56 1.0 % $ 20 Construction and Real Estate & Leasing: Commercial real estate loans 2,635 — 2,635 48.2 % 208 Other real estate related services and equipment leasing (2) 62 83 145 2.6 % 31 Total construction and real estate & leasing 2,697 83 2,780 50.8 % 239 Manufacturing: Foodstuffs, Apparel 55 30 85 1.6 % 5 Metals, Computer, Transportation and Other 17 77 94 1.7 % 25 Chemicals, Oil, Plastics, Cement and Wood/Paper 22 11 33 0.6 % 5 Total Manufacturing 94 118 212 3.9 % 35 Wholesale (3) 164 375 539 9.9 % 151 Retail Trade (4) 250 90 340 6.2 % 52 Services: Communication, Transportation, Health and Other (5) 272 81 353 6.5 % 42 Accommodation, Restaurants, Entertainment and other services (6) 85 54 139 2.5 % 28 Electricity, Gas, Water, Supply and Sewage Services 5 14 19 0.4 % 6 Total Services 362 149 511 9.4 % 76 Primary Products: Agriculture, Livestock, Fishing and Forestry — 1 1 — % — Mining — 5 5 0.1 % 1 Total Primary Products — 6 6 0.1 % 1 Other Loans (7) 618 405 1,023 18.7 % 227 Total Loans $ 4,190 $ 1,277 $ 5,467 100.0 % $ 801 (September 30, 2021)
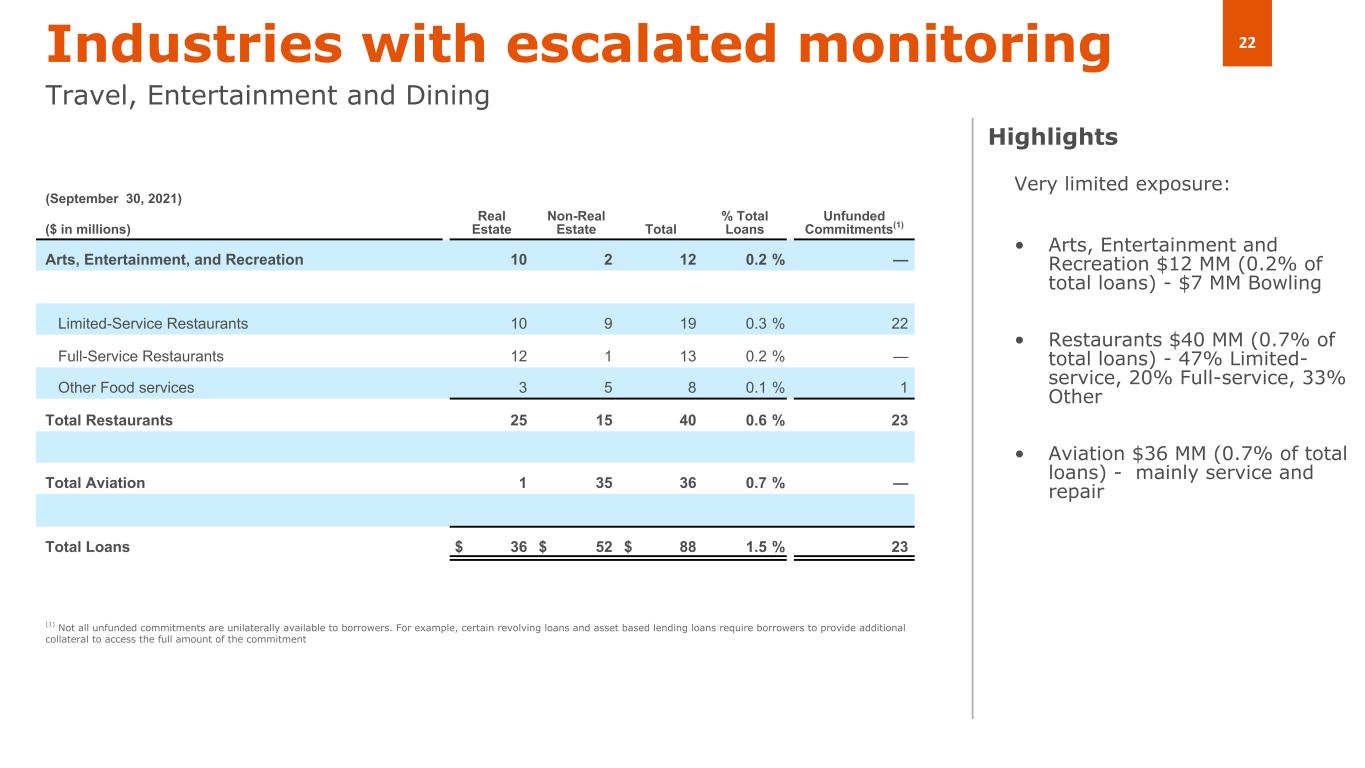
22Industries with escalated monitoring Travel, Entertainment and Dining Very limited exposure: • Arts, Entertainment and Recreation $12 MM (0.2% of total loans) - $7 MM Bowling • Restaurants $40 MM (0.7% of total loans) - 47% Limited- service, 20% Full-service, 33% Other • Aviation $36 MM (0.7% of total loans) - mainly service and repair Highlights (1) Not all unfunded commitments are unilaterally available to borrowers. For example, certain revolving loans and asset based lending loans require borrowers to provide additional collateral to access the full amount of the commitment ($ in millions) Real Estate Non-Real Estate Total % Total Loans Unfunded Commitments(1) Arts, Entertainment, and Recreation 10 2 12 0.2 % — Limited-Service Restaurants 10 9 19 0.3 % 22 Full-Service Restaurants 12 1 13 0.2 % — Other Food services 3 5 8 0.1 % 1 Total Restaurants 25 15 40 0.6 % 23 Total Aviation 1 35 36 0.7 % — Total Loans $ 36 $ 52 $ 88 1.5 % 23 (September 30, 2021)
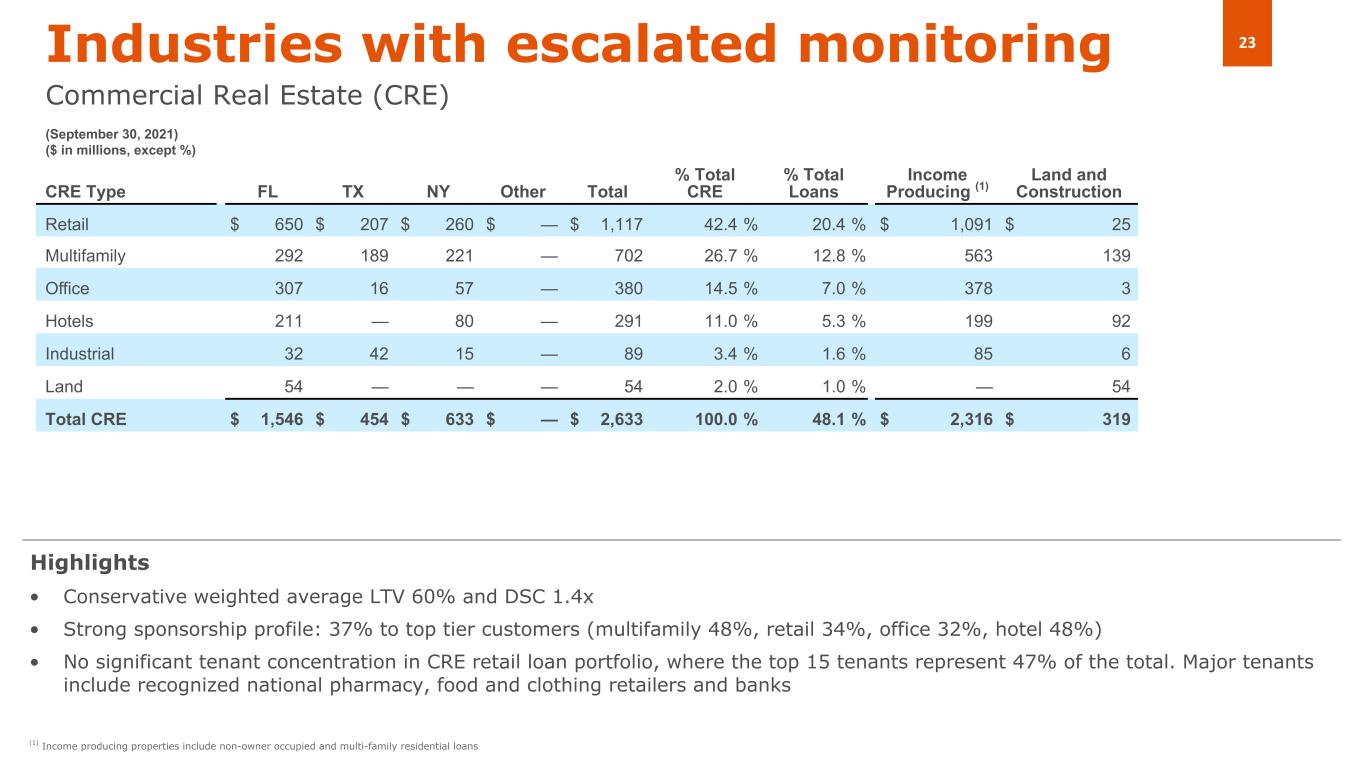
23Industries with escalated monitoring Commercial Real Estate (CRE) CRE Type FL TX NY Other Total % Total CRE % Total Loans Income Producing (1) Land and Construction Retail $ 650 $ 207 $ 260 $ — $ 1,117 42.4 % 20.4 % $ 1,091 $ 25 Multifamily 292 189 221 — 702 26.7 % 12.8 % 563 139 Office 307 16 57 — 380 14.5 % 7.0 % 378 3 Hotels 211 — 80 — 291 11.0 % 5.3 % 199 92 Industrial 32 42 15 — 89 3.4 % 1.6 % 85 6 Land 54 — — — 54 2.0 % 1.0 % — 54 Total CRE $ 1,546 $ 454 $ 633 $ — $ 2,633 100.0 % 48.1 % $ 2,316 $ 319 • Conservative weighted average LTV 60% and DSC 1.4x • Strong sponsorship profile: 37% to top tier customers (multifamily 48%, retail 34%, office 32%, hotel 48%) • No significant tenant concentration in CRE retail loan portfolio, where the top 15 tenants represent 47% of the total. Major tenants include recognized national pharmacy, food and clothing retailers and banks (1) Income producing properties include non-owner occupied and multi-family residential loans Highlights (September 30, 2021) ($ in millions, except %)
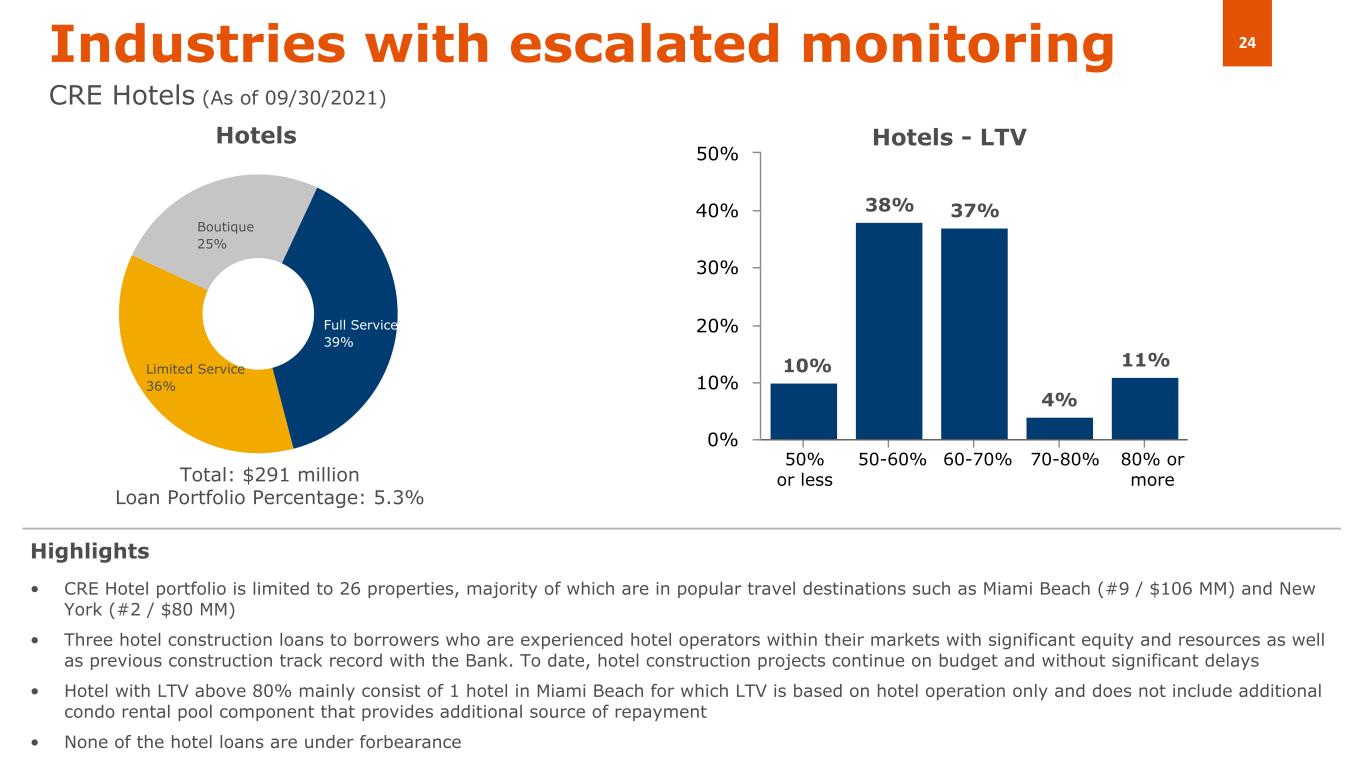
24Industries with escalated monitoring CRE Hotels (As of 09/30/2021) • CRE Hotel portfolio is limited to 26 properties, majority of which are in popular travel destinations such as Miami Beach (#9 / $106 MM) and New York (#2 / $80 MM) • Three hotel construction loans to borrowers who are experienced hotel operators within their markets with significant equity and resources as well as previous construction track record with the Bank. To date, hotel construction projects continue on budget and without significant delays • Hotel with LTV above 80% mainly consist of 1 hotel in Miami Beach for which LTV is based on hotel operation only and does not include additional condo rental pool component that provides additional source of repayment • None of the hotel loans are under forbearance Highlights Full Service 39% Limited Service 36% Boutique 25% Hotels 10% 38% 37% 4% 11% 0% 10% 20% 30% 40% 50% 50% or less 50-60% 60-70% 70-80% 80% or more Hotels - LTV Total: $291 million Loan Portfolio Percentage: 5.3%
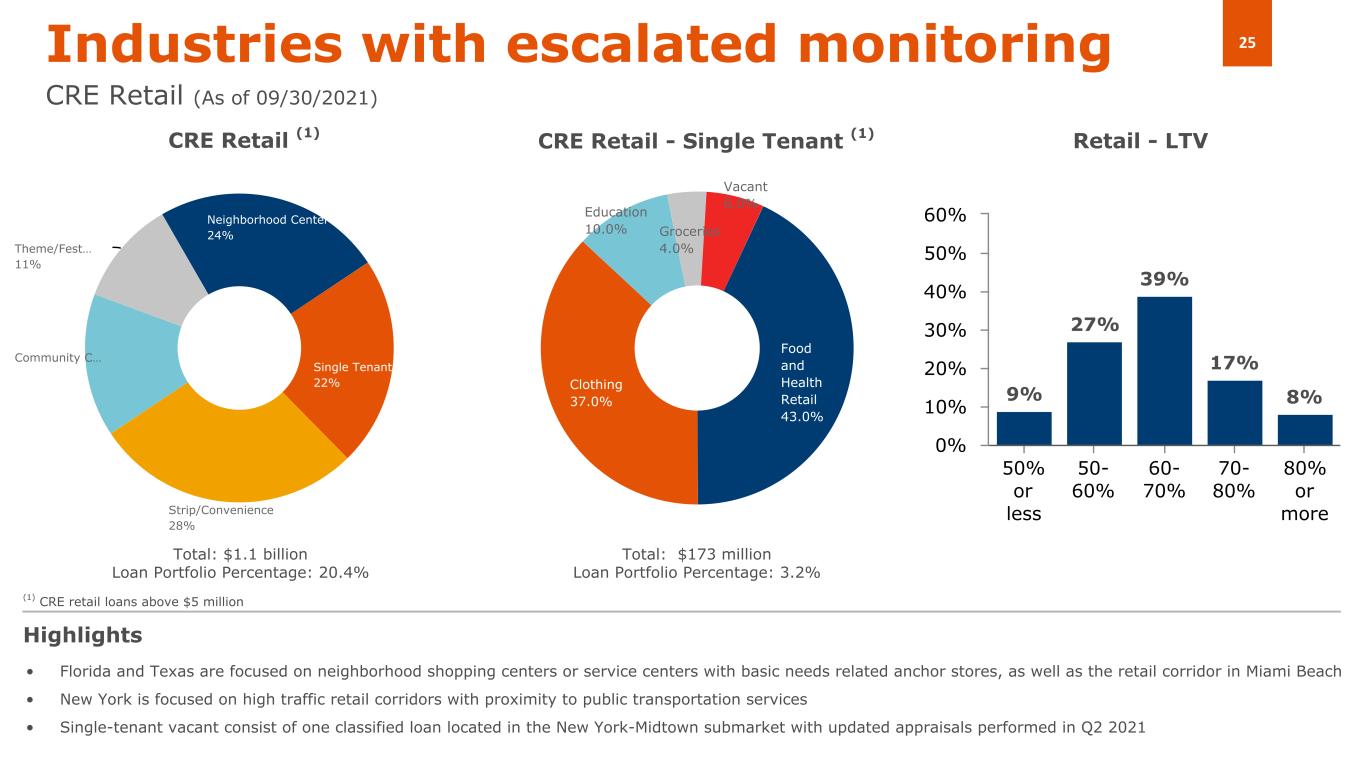
25 9% 27% 39% 17% 8% 50% or less 50- 60% 60- 70% 70- 80% 80% or more 0% 10% 20% 30% 40% 50% 60% Industries with escalated monitoring CRE Retail (As of 09/30/2021) • Florida and Texas are focused on neighborhood shopping centers or service centers with basic needs related anchor stores, as well as the retail corridor in Miami Beach • New York is focused on high traffic retail corridors with proximity to public transportation services • Single-tenant vacant consist of one classified loan located in the New York-Midtown submarket with updated appraisals performed in Q2 2021 Highlights CRE Retail (1) Retail - LTV Food and Health Retail 43.0% Clothing 37.0% Education 10.0% Groceries 4.0% Vacant 6.0% CRE Retail - Single Tenant (1) (1) CRE retail loans above $5 million Total: $1.1 billion Loan Portfolio Percentage: 20.4% Total: $173 million Loan Portfolio Percentage: 3.2% Neighborhood Center 24% Single Tenant 22% Strip/Convenience 28% Community C… Theme/Fest… 11%

Appendices
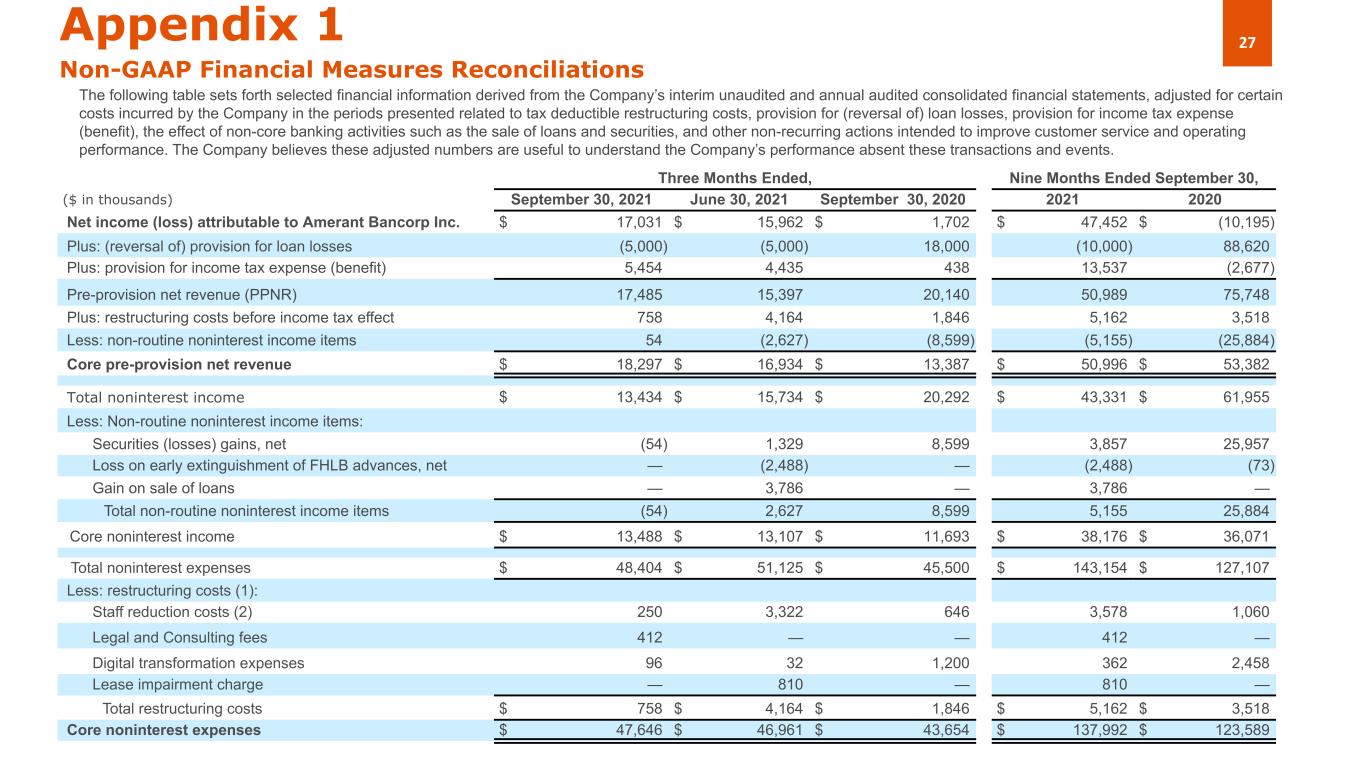
27Appendix 1 Non-GAAP Financial Measures Reconciliations The following table sets forth selected financial information derived from the Company’s interim unaudited and annual audited consolidated financial statements, adjusted for certain costs incurred by the Company in the periods presented related to tax deductible restructuring costs, provision for (reversal of) loan losses, provision for income tax expense (benefit), the effect of non-core banking activities such as the sale of loans and securities, and other non-recurring actions intended to improve customer service and operating performance. The Company believes these adjusted numbers are useful to understand the Company’s performance absent these transactions and events. Three Months Ended, Nine Months Ended September 30, ($ in thousands) September 30, 2021 June 30, 2021 September 30, 2020 2021 2020 Net income (loss) attributable to Amerant Bancorp Inc. $ 17,031 $ 15,962 $ 1,702 $ 47,452 $ (10,195) Plus: (reversal of) provision for loan losses (5,000) (5,000) 18,000 (10,000) 88,620 Plus: provision for income tax expense (benefit) 5,454 4,435 438 13,537 (2,677) Pre-provision net revenue (PPNR) 17,485 15,397 20,140 50,989 75,748 Plus: restructuring costs before income tax effect 758 4,164 1,846 5,162 3,518 Less: non-routine noninterest income items 54 (2,627) (8,599) (5,155) (25,884) Core pre-provision net revenue $ 18,297 $ 16,934 $ 13,387 $ 50,996 $ 53,382 Total noninterest income $ 13,434 $ 15,734 $ 20,292 $ 43,331 $ 61,955 Less: Non-routine noninterest income items: Securities (losses) gains, net (54) 1,329 8,599 3,857 25,957 Loss on early extinguishment of FHLB advances, net — (2,488) — (2,488) (73) Gain on sale of loans — 3,786 — 3,786 — Total non-routine noninterest income items (54) 2,627 8,599 5,155 25,884 Core noninterest income $ 13,488 $ 13,107 $ 11,693 $ 38,176 $ 36,071 Total noninterest expenses $ 48,404 $ 51,125 $ 45,500 $ 143,154 $ 127,107 Less: restructuring costs (1): Staff reduction costs (2) 250 3,322 646 3,578 1,060 Legal and Consulting fees 412 — — 412 — Digital transformation expenses 96 32 1,200 362 2,458 Lease impairment charge — 810 — 810 — Total restructuring costs $ 758 $ 4,164 $ 1,846 $ 5,162 $ 3,518 Core noninterest expenses $ 47,646 $ 46,961 $ 43,654 $ 137,992 $ 123,589
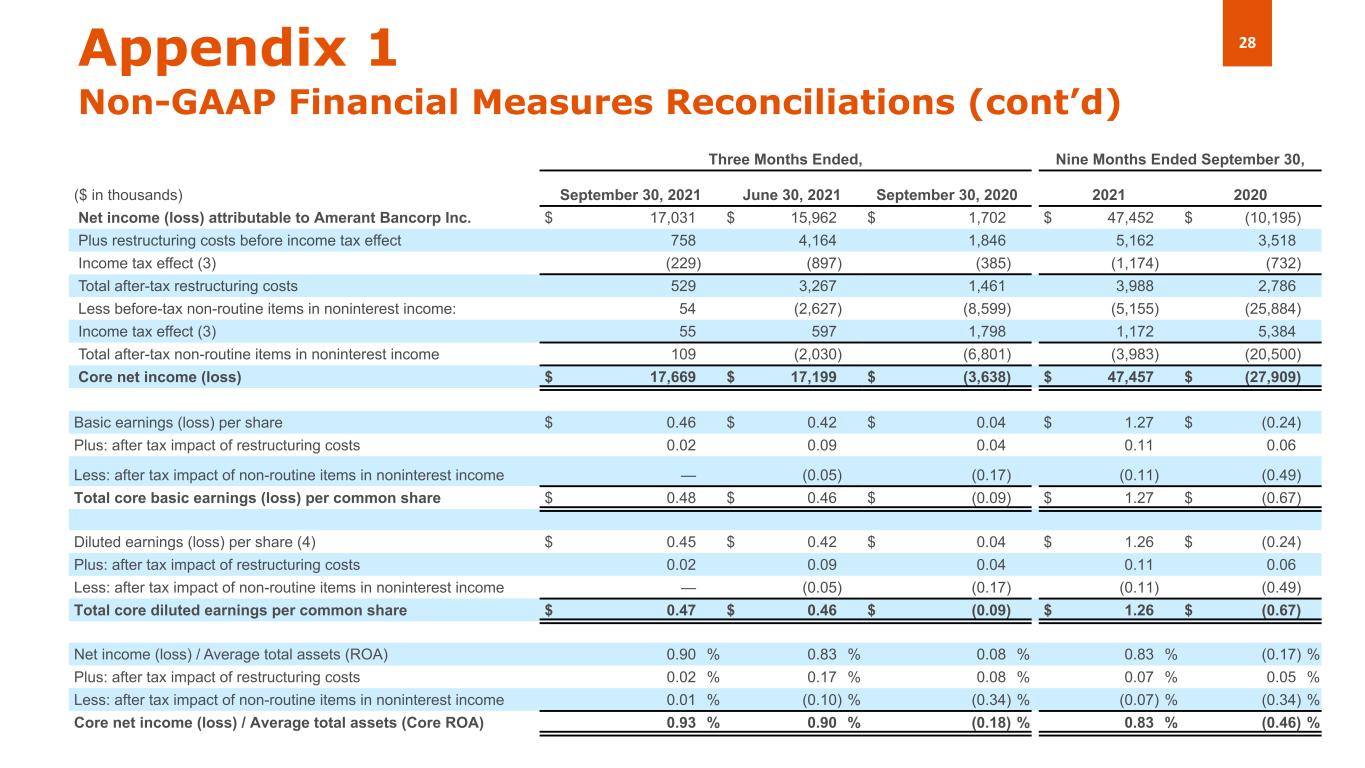
28Appendix 1 Non-GAAP Financial Measures Reconciliations (cont’d) Three Months Ended, Nine Months Ended September 30, ($ in thousands) September 30, 2021 June 30, 2021 September 30, 2020 2021 2020 Net income (loss) attributable to Amerant Bancorp Inc. $ 17,031 $ 15,962 $ 1,702 $ 47,452 $ (10,195) Plus restructuring costs before income tax effect 758 4,164 1,846 5,162 3,518 Income tax effect (3) (229) (897) (385) (1,174) (732) Total after-tax restructuring costs 529 3,267 1,461 3,988 2,786 Less before-tax non-routine items in noninterest income: 54 (2,627) (8,599) (5,155) (25,884) Income tax effect (3) 55 597 1,798 1,172 5,384 Total after-tax non-routine items in noninterest income 109 (2,030) (6,801) (3,983) (20,500) Core net income (loss) $ 17,669 $ 17,199 $ (3,638) $ 47,457 $ (27,909) Basic earnings (loss) per share $ 0.46 $ 0.42 $ 0.04 $ 1.27 $ (0.24) Plus: after tax impact of restructuring costs 0.02 0.09 0.04 0.11 0.06 Less: after tax impact of non-routine items in noninterest income — (0.05) (0.17) (0.11) (0.49) Total core basic earnings (loss) per common share $ 0.48 $ 0.46 $ (0.09) $ 1.27 $ (0.67) Diluted earnings (loss) per share (4) $ 0.45 $ 0.42 $ 0.04 $ 1.26 $ (0.24) Plus: after tax impact of restructuring costs 0.02 0.09 0.04 0.11 0.06 Less: after tax impact of non-routine items in noninterest income — (0.05) (0.17) (0.11) (0.49) Total core diluted earnings per common share $ 0.47 $ 0.46 $ (0.09) $ 1.26 $ (0.67) Net income (loss) / Average total assets (ROA) 0.90 % 0.83 % 0.08 % 0.83 % (0.17) % Plus: after tax impact of restructuring costs 0.02 % 0.17 % 0.08 % 0.07 % 0.05 % Less: after tax impact of non-routine items in noninterest income 0.01 % (0.10) % (0.34) % (0.07) % (0.34) % Core net income (loss) / Average total assets (Core ROA) 0.93 % 0.90 % (0.18) % 0.83 % (0.46) %
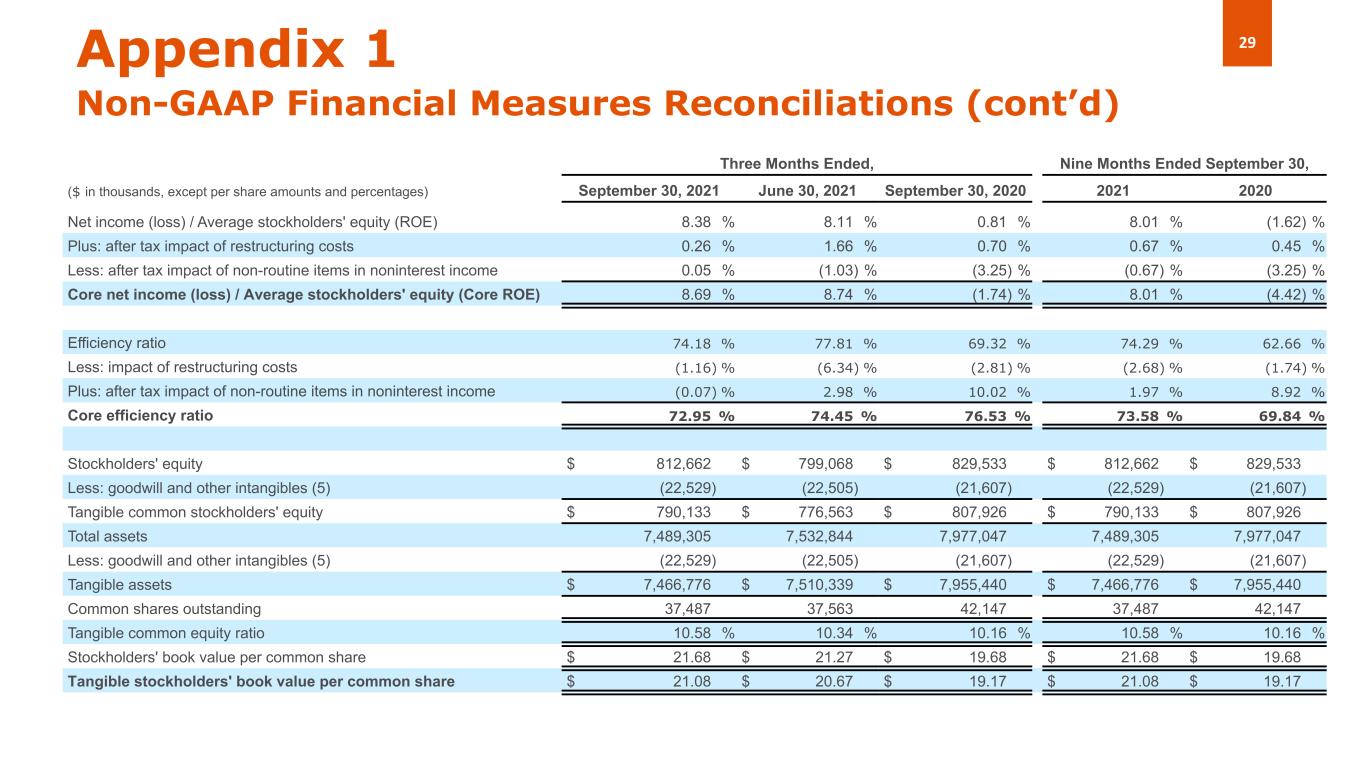
29Appendix 1 Non-GAAP Financial Measures Reconciliations (cont’d) Three Months Ended, Nine Months Ended September 30, ($ in thousands, except per share amounts and percentages) September 30, 2021 June 30, 2021 September 30, 2020 2021 2020 Net income (loss) / Average stockholders' equity (ROE) 8.38 % 8.11 % 0.81 % 8.01 % (1.62) % Plus: after tax impact of restructuring costs 0.26 % 1.66 % 0.70 % 0.67 % 0.45 % Less: after tax impact of non-routine items in noninterest income 0.05 % (1.03) % (3.25) % (0.67) % (3.25) % Core net income (loss) / Average stockholders' equity (Core ROE) 8.69 % 8.74 % (1.74) % 8.01 % (4.42) % Efficiency ratio 74.18 % 77.81 % 69.32 % 74.29 % 62.66 % Less: impact of restructuring costs (1.16) % (6.34) % (2.81) % (2.68) % (1.74) % Plus: after tax impact of non-routine items in noninterest income (0.07) % 2.98 % 10.02 % 1.97 % 8.92 % Core efficiency ratio 72.95 % 74.45 % 76.53 % 73.58 % 69.84 % Stockholders' equity $ 812,662 $ 799,068 $ 829,533 $ 812,662 $ 829,533 Less: goodwill and other intangibles (5) (22,529) (22,505) (21,607) (22,529) (21,607) Tangible common stockholders' equity $ 790,133 $ 776,563 $ 807,926 $ 790,133 $ 807,926 Total assets 7,489,305 7,532,844 7,977,047 7,489,305 7,977,047 Less: goodwill and other intangibles (5) (22,529) (22,505) (21,607) (22,529) (21,607) Tangible assets $ 7,466,776 $ 7,510,339 $ 7,955,440 $ 7,466,776 $ 7,955,440 Common shares outstanding 37,487 37,563 42,147 37,487 42,147 Tangible common equity ratio 10.58 % 10.34 % 10.16 % 10.58 % 10.16 % Stockholders' book value per common share $ 21.68 $ 21.27 $ 19.68 $ 21.68 $ 19.68 Tangible stockholders' book value per common share $ 21.08 $ 20.67 $ 19.17 $ 21.08 $ 19.17
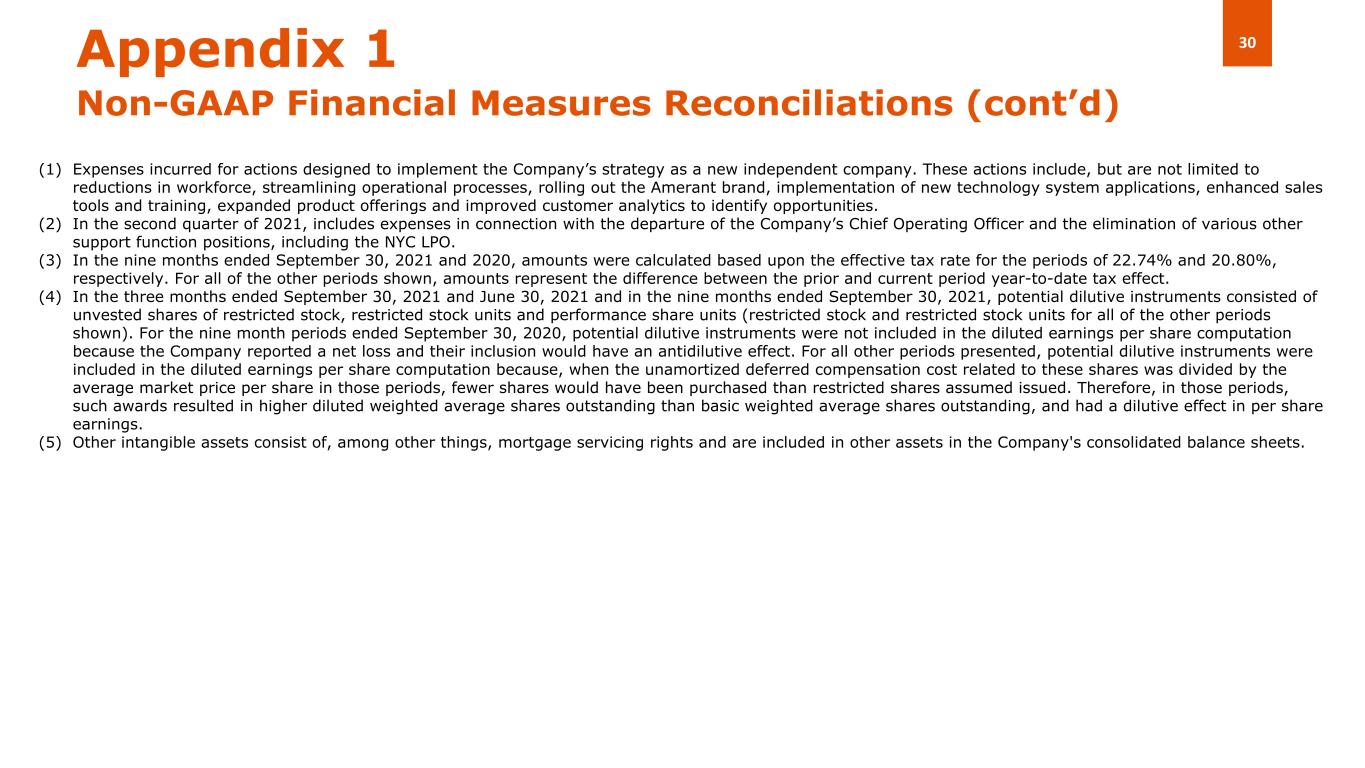
30Appendix 1 Non-GAAP Financial Measures Reconciliations (cont’d) (1) Expenses incurred for actions designed to implement the Company’s strategy as a new independent company. These actions include, but are not limited to reductions in workforce, streamlining operational processes, rolling out the Amerant brand, implementation of new technology system applications, enhanced sales tools and training, expanded product offerings and improved customer analytics to identify opportunities. (2) In the second quarter of 2021, includes expenses in connection with the departure of the Company’s Chief Operating Officer and the elimination of various other support function positions, including the NYC LPO. (3) In the nine months ended September 30, 2021 and 2020, amounts were calculated based upon the effective tax rate for the periods of 22.74% and 20.80%, respectively. For all of the other periods shown, amounts represent the difference between the prior and current period year-to-date tax effect. (4) In the three months ended September 30, 2021 and June 30, 2021 and in the nine months ended September 30, 2021, potential dilutive instruments consisted of unvested shares of restricted stock, restricted stock units and performance share units (restricted stock and restricted stock units for all of the other periods shown). For the nine month periods ended September 30, 2020, potential dilutive instruments were not included in the diluted earnings per share computation because the Company reported a net loss and their inclusion would have an antidilutive effect. For all other periods presented, potential dilutive instruments were included in the diluted earnings per share computation because, when the unamortized deferred compensation cost related to these shares was divided by the average market price per share in those periods, fewer shares would have been purchased than restricted shares assumed issued. Therefore, in those periods, such awards resulted in higher diluted weighted average shares outstanding than basic weighted average shares outstanding, and had a dilutive effect in per share earnings. (5) Other intangible assets consist of, among other things, mortgage servicing rights and are included in other assets in the Company's consolidated balance sheets.