AMTB 8-K
Amerant Bancorp Inc. (AMTB)
8-K
2020-04-28
For: 2020-04-28
View Original
Added on
April 08, 2026
UNITED STATES
SECURITIES AND EXCHANGE COMMISSION
WASHINGTON, D.C. 20549
FORM 8-K
CURRENT REPORT
PURSUANT TO SECTION 13 OR 15(d) OF THE SECURITIES EXCHANGE ACT OF 1934
Date of Report (Date of earliest event reported): April 28, 2020
Amerant Bancorp Inc.
(Exact name of registrant as specified in its charter)
Florida | 001-38534 | 65-0032379 | ||
(State or other jurisdiction of incorporation | (Commission file number) | (IRS Employer Identification Number) | ||
220 Alhambra Circle
Coral Gables, Florida 33134
(Address of principal executive offices)
(305) 460-8728
(Registrant's telephone number, including area code)
Check the appropriate box below if the Form 8-K filing is intended to simultaneously satisfy the filing obligation of the registrant under any of the following provisions:
o | Written communications pursuant to Rule 425 under the Securities Act (17 CFR 230.425) |
o | Soliciting material pursuant to Rule 14a-12 under the Exchange Act (17 CFR 240.14a-12) |
o | Pre-commencement communications pursuant to Rule 14d-2(b) under the Exchange Act (17 CFR 240.14d-2(b)) |
o | Pre-commencement communications pursuant to Rule 13e-4(c) under the Exchange Act (17 CFR 240.13e-4(c)) |
Securities registered pursuant to Section 12(b) of the Act:
Title of each class | Trading Symbols | Name of exchange on which registered |
Class A Common Stock | AMTB | NASDAQ |
Class B Common Stock | AMTBB | NASDAQ |
Indicate by check mark whether the registrant is an emerging growth company as defined in Rule 405 of the Securities Act of 1933 (17 CFR§230.405) or Rule 12b-2 of the Securities Exchange Act of 1934 (17 CFR §240.12b-2).
Emerging growth company | ý | |
If an emerging growth company, indicate by check mark if the registrant has elected not to use the extended transition period for complying with any new or revised financial accounting standards provided pursuant to Section 13(a) of the Exchange Act. o
Item 2.02 Results of Operations and Financial Condition
On April 28, 2020, Amerant Bancorp Inc. (the "Company") issued a press release to report the Company’s financial results for the fiscal quarter ended March 31, 2020 and to provide a business update related to the COVID-19 pandemic. The release is attached as Exhibit 99.1 to this Current Report on Form 8-K and incorporated by reference to this Item 2.02.
In accordance with General Instructions B.2. of Form 8-K, the information in this Item 2.02 of this Current Report on Form 8-K, including Exhibit 99.1 attached hereto, is being “furnished” and shall not be deemed “filed” for the purposes of Section 18 of the Securities Exchange Act of 1934, as amended, or otherwise subject to the liabilities of that section, nor shall it be deemed incorporated by reference in any filing under the Securities Act of 1933, as amended, or the Securities Exchange Act of 1934, as amended, except as shall be expressly set forth by specific reference in such filing.
Item 7.01 Regulation FD Disclosure
On April 28, 2020, the Company will hold a live audio webcast to discuss its financial results for the fiscal quarter ended March 31, 2020 and its business update related to the COVID-19 pandemic. In connection with the webcast, the Company is furnishing to the U.S. Securities and Exchange Commission the earnings slide presentation attached as Exhibit 99.2 to this Current Report on Form 8-K and incorporated by reference to this Item 7.01.
In accordance with General Instruction B.2 of Form 8-K, the information in this Item 7.01 of this Current Report on Form 8-K, including Exhibit 99.2 attached hereto, is being “furnished” and shall not be deemed “filed” for the purposes of Section 18 of the Securities Exchange Act of 1934, as amended, or otherwise subject to the liabilities of that section, nor shall it be deemed incorporated by reference in any filing under the Securities Act of 1933, as amended, or the Securities Exchange Act of 1934, as amended, except as shall be expressly set forth by specific reference in such a filing.
Item 9.01 Financial Statements and Exhibits
SIGNATURES
Pursuant to the requirements of the Securities Exchange Act of 1934, the registrant has duly caused this report to be signed on its behalf by the undersigned hereunto duly authorized.
Date: April 28, 2020 | Amerant Bancorp Inc. | |||
By: | /s/ Julio V. Pena | |||
Name: Julio V. Pena | ||||
Title: Senior Vice President and Assistant Corporate Secretary | ||||

CONTACTS: | ||
Investors | ||
(305) 460-8728 | ||
Media | ||
(305) 441-8414 | ||
AMERANT BANCORP INC. REPORTS FIRST QUARTER RESULTS AND
PROVIDES BUSINESS UPDATE IMPACT FROM COVID-19 PANDEMIC
CORAL GABLES, FLORIDA, April 28, 2020. Amerant Bancorp Inc. (NASDAQ: AMTB and AMTBB) (the “Company” or “Amerant”) today reported first quarter 2020 net income of $3.4 million, 74.9% lower than the $13.5 million reported in the three months ended December 31, 2019. Net income in the first quarter of 2020 was 74.1% lower than in the first quarter of 2019. Net income per diluted share was $0.08 in the first quarter of 2020, down 74.2% from $0.31 per diluted share in the fourth quarter of 2019, and down 73.3% from $0.30 per diluted share in the first quarter of 2019. Operating income was $16.7 million in the first quarter of 2020, up 12.5% from $14.8 million in the fourth quarter of 2019, and flat from $16.6 million in the same period of 2019.
Annualized return on assets (“ROA”) and return on equity (“ROE”) were 0.17% and 1.61%, respectively, in the first quarter of 2020, compared to 0.68% and 6.44%, respectively, in the fourth quarter of 2019, and 0.65% and 6.87%, respectively, in the first quarter of 2019.
Millar Wilson, Vice Chairman and Chief Executive Officer, commented, “Amerant began the year benefiting from strong macro-economic trends while navigating a low interest rate environment. Despite the challenges and uncertainties caused by the COVID-19 pandemic, we finished the quarter in a strong financial position demonstrating the resilience of our operations and the entire Amerant community, underscored by solid operating income growth.”
Mr. Wilson continued, “During these unprecedented times, Amerant quickly rose to the challenge. We successfully activated our Business Continuity Plan to ensure seamless and uninterrupted operations and services, while keeping our employees, customers and communities safe. This remains our top priority. We have now transitioned over 80% of employees to working remotely. Our relationship-centric model enabled us to respond in real time to the rapidly evolving needs of our customers and communities. In addition, Amerant began implementing the Small Business Administration’s assistance programs included in the CARES Act, temporarily eliminated ATM fees, waived late payment fees on business and consumer loans as well as deposit account fees and refrained from reporting negative information to credit bureaus, among other individualized account measures during these extraordinary times. We will continue to put our people and customers first, while also improving operational efficiency, effectively managing credit quality, and maximizing shareholder value.”
1
Summary Results
The summary results of the first quarter ended March 31, 2020 include:
• | Net income of $3.4 million, down 74.9% from $13.5 million in the fourth quarter of 2019; down 74.1% from $13.1 million in the same period of 2019. This decrease was primarily due to a meaningful increase in Amerant’s provision for loan losses in the first quarter of 2020. Operating income, which excludes provision for income tax, provisions for loan losses or reversals and net gains on securities, was $16.7 million, up 12.5% from $14.8 million in the fourth quarter of 2019, and flat from $16.6 million in the same period of 2019. |
• | Net interest income (“NII”) was $49.2 million, down 4.0% from $51.3 million in the fourth quarter of 2019, and down 11.2% from $55.4 million in the same period of 2019. Lower NII versus the fourth quarter of 2019 is mainly due to lower prepayment penalties in the current quarter as the pace of early loan payoffs slowed, higher average time deposit volume, and lower average loan balances. Amerant’s proactive management of funding costs largely muted the NII impact of emergency rate cuts implemented by the Federal Reserve during the first quarter of 2020. Compared to first quarter 2019, this quarter’s lower NII is attributed to a decline in average yields on interest-earning assets, lower average loan balances, and the replacement of lower-cost international deposits with higher-cost domestic time deposits, partially offset by lower professional funding costs, primarily Federal Home Loan Bank (“FHLB”) advances, Trust Preferred expenses as well as transactional deposit costs. Net interest margin (“NIM”) was 2.65% in the first quarter of 2020, down from 2.74% and 2.96% in the fourth quarter 2019 and the first quarter 2019, respectively. |
• | Credit quality indicators remained strong despite market dislocations associated with the COVID-19 pandemic. As a result of these dislocations, the Company increased its allowance for loan losses (“ALL”) by $22.0 million, compared to a release of $0.3 million in the fourth quarter of 2019, and no provision recorded in the first quarter of 2019, mainly due to the estimated deterioration of our loan portfolio caused by COVID-19. The ratio of the ALL to total loans was 1.29% as of March 31, 2020, up from 0.91% in the fourth quarter of 2019 and up from 1.05% in the same period last year. The ratio of loan charge-offs to average total loans in first quarter 2020 was 0.09%, up from 0.08% and down from the 0.10% in the fourth quarter of 2019 and the first quarter of 2019, respectively. The Company did not experience any unanticipated losses in the first quarter of 2020 from exiting its former credit card programs. |
• | Noninterest income was $21.9 million, up 37.2% from $16.0 million in the fourth quarter of 2019, and up 66.5% from $13.2 million in the same period last year. The increase was primarily driven by $9.2 million of net gains on the sale of securities recognized in the first quarter of 2020. |
2
• | Noninterest expense was $44.9 million, down 13.3% from $51.7 million in the fourth quarter of 2019, and down 13.6% from $51.9 million in the first quarter of 2019. The quarter-over-quarter decline in noninterest expense was mainly driven by lower salaries and employee benefit expenses as well as lower professional and other services fees in the first quarter of 2020. The year-over-year decline also resulted mainly from lower salaries and employee benefit expenses, and the absence of rebranding costs incurred last year related to Amerant’s transformation efforts. Adjusted noninterest expense was $44.5 million in the first quarter of 2020, down 13.8% from $51.6 million in the fourth quarter of 2019, and down 12.7% from $51.0 million in the first quarter of 2019. Adjusted noninterest expense in the first quarter of 2020 excludes $0.4 million in restructuring expenses. |
• | The efficiency ratio was 63.1% (62.6% adjusted for staff reduction and digital transformation expenses), compared to 76.9% (80.1% adjusted for staff reduction costs and a one-time gain on sale of land) during the fourth quarter of 2019, and 75.7% (74.4% adjusted for rebranding costs) for the corresponding period of 2019. |
• | Stockholders’ book value per common share increased to $19.95, up 3.1% from $19.35 at December 31, 2019, and up 10.7% from $18.02 a year ago. Tangible book value per common share rose to $19.43, up 3.1% from $18.84 at December 31, 2019, and up 10.8% from $17.54 a year ago. |
Business Update Related to COVID-19
The health and well-being of the Company’s employees, customers, and local communities remains paramount, while Amerant continues to provide the necessary services and products to customers with minimal disruption. Amerant continues to monitor and respond accordingly to the ever-changing COVID-19 environment.
Business Continuity Plan (“BCP”) Activated
Amerant activated the Company's well-established BCP Plan on March 16, 2020. The Plan has effectively driven Amerant's resiliency during these extraordinary times and allowed the Company to continue to provide the quality of products and services its customers have come to expect. It is supported and complemented by a robust business continuity governance framework, life safety program, and annual enterprise-wide exercise and training program. The BCP Plan is framed within industry best practices and regulatory guidelines, and subject to periodic testing and independent audits.
3
As a result of the COVID-19 pandemic, Amerant has taken the following measures:
Operations, Technology & Facilities | Implemented remote-work arrangements and reduced banking center hours |
Focused on minimizing impact on operations or customers | |
Surveyed critical vendor/supplier readiness | |
Ensured systems stability and bandwidth capacity to accommodate (i) any increase in volume of digital banking transactions; and (ii) remote work connectivity | |
Continuous monitoring to detect and prevent suspicious activity, including any potential COVID-19 related incidents | |
Human Resources & Communications | Communicated with customers regarding electronic banking channels, branch information, and assistance programs |
Communicated with employees regarding health and safety, technology, remote working tools and practices, and security guidelines | |
Refined business travel, vendor on-site visits, remote work, and employee benefits policies | |
Executive Management Committee Involvement
In light of the unprecedented nature of events and circumstances surrounding the COVID-19 pandemic, the Company’s Executive Management Committee (“EMC”) implemented periodic briefings with subject-matter experts across the Company’s Business, Operations, Technology, Human Resources, Finance and Legal practices. These briefings focus on protecting the health of Amerant’s employees, customers, and communities, while continuing to provide customers with the services they need and expect during these challenging times. The EMC also increased its oversight and monitoring of credit and liquidity risks and engaged with other market participants to enhance its understanding of the potential magnitude, reach, and ramifications of the pandemic. The EMC has reported on a regular basis to the Board of Directors on the COVID-19 pandemic and the measures Amerant has implemented to address the evolving situation.
Credit Risk Monitoring and Mitigation Measures
The Company performed a comprehensive review of its loan exposures by industry to identify those most susceptible to increased credit risk as a result of the COVID-19 pandemic. The review estimated that approximately 30% of the outstanding loan portfolio as of March 31, 2020 is represented by loans to borrowers in industries, or with collateral values, that are potentially more vulnerable to the financial impact of the pandemic and approximately 50% of which are secured with real estate collateral.
The loan portfolio is well diversified with no industry concentration, except for real estate, representing 12.0% of total loans. This includes limited exposure to the energy sector (0.7% of total loans) as well as the travel, entertainment and restaurant (2.0% of total loans) industries.
At the close of March 31, 2020, the Company had a $2.9 billion CRE portfolio, representing 51.8% of total loans, with an estimated weighted average Loan to Value (LTV) of 60% and an estimated weighted average Debt Service Coverage Ratio (DSCR) of 1.6x.
4
CRE loans to top tier customers, which are those considered to have the greatest strength and credit quality, represent approximately 42% of the CRE loan portfolio.
In the CRE retail loan portfolio, the Company determined that there is no significant tenant concentration as the top 15 tenants combined represent 41.6% of the total CRE retail loan portfolio, and no individual tenant represents more than 5.9% of the total CRE retail loan portfolio. Major tenants include recognized national food and health retailers.
At the close of March 31, 2020, the hotels portfolio consists of 27 properties mainly located in popular travel destinations such as Miami Beach ($98.0 million or 37.4% of total hotel loans) and New York ($52.0 million or 19.8% of total hotel loans).
Amerant has increased the provision for loan losses for estimated portfolio deterioration due to the COVID-19 pandemic. The Company is closely monitoring its loan portfolio for any potential deterioration and proactively working with customers to address any potential impact.
Credit Approval Process and Monitoring
Amerant consistently reviews its existing credit approval practices to ensure that sound and prudent underwriting standards continue to drive the Company’s business relationships. As a result, the Company enhanced the monitoring of its entire loan portfolio and has proactively increased the frequency of periodic reviews and conversations with loan customers in anticipation of their future needs, which aligns with Amerant’s relationship-centric banking model.
Participation in the U.S. Small Business Administration’s (“SBA”) Paycheck Protection Program (“PPP”)
On March 27, 2020, Congress passed the CARES Act (“Coronavirus Aid, Relief, and Economic Security Act”), an approximately $2.0 trillion COVID-19 response bill, to provide emergency economic relief to individuals, small businesses, mid-size companies, large corporations, hospitals and other public health facilities, and state and local governments. The CARES Act allocated the SBA $350.0 billion to provide loans of up to $10.0 million per small business (defined as businesses with 500 or fewer employees). On April 2, 2020, Amerant began participating in the SBA’s Paycheck Protection Program, or “PPP”, by providing small business loans to cover payroll, rent, mortgage, healthcare, and utilities costs, among other essential expenses. The Company received approval for 485 loan applications totaling $130.0 million in PPP Loans as of April 24, 2020.
Supporting Amerant’s Customers and Communities
Amerant continues to demonstrate its unwavering commitment to customers and the community by providing an array of tangible and meaningful support measures during these unprecedented times.
5
Beginning on March 26th, these measures include waiving Amerant’s ATM fees for customers and non-customers, late payment fees on all consumer and business loans, and deposit account fees on a case-by-case basis. Amerant is also refraining from reporting negative information such as past due balances to credit bureaus, and, importantly, offering individualized loan payment assistance such as interest payment deferral and forbearance options. Additionally, in April 2020, the Company increased its mobile check deposit limits. All of these efforts align with regulatory guidance aimed at helping customers and communities, while remaining prudent and manageable, and will continue until further notice.
In April 2020, the Company granted loan payment relief options to customers impacted by the COVID-19 pandemic, including interest-only and/or forbearance options. In accordance with accounting and regulatory guidance, loans benefiting from these measures are not considered Troubled Debt Restructurings (“TDR”). As of April 24 2020, loans under these programs totaled $1,120 million. The Company is closely monitoring the performance of these loans under the terms of the temporary relief granted.
Loans and Deposits
In the first quarter of 2020, the Company remained focused on building stronger customer relationships, enhancing customer service capabilities, and protecting the profitability of the loan portfolio given the challenging market environment. As the COVID-19 situation progressed and evolved throughout the quarter, Amerant began focusing on deploying resources aimed at providing adequate funding to customers and actively working under the CARES Act, while mitigating the potential negative impact on borrowers and depositors.
Total loans on March 31, 2020 were $5.7 billion, down 1.3% from December 31, 2019. The decline was driven by seasonally lower loan activity in the first quarter of 2020, as well as a slowdown in loan production towards the end of the quarter as a result of the COVID-19 pandemic. Total deposits on March 31, 2020 were $5.8 billion, up 1.5% from December 31, 2019. This increase was driven by strong domestic deposit growth enabled by higher capture of online CDs and relationship money market deposits as a result of the Company’s successful cross-selling efforts. Amerant continues to invest in training its sales teams to build stronger customer relationships in order to capture market share of customers' deposits, credit, and wealth management.
6
Online deposits increased $69.0 million, or 50.2%, compared to December 31, 2019. Total domestic deposits, excluding online deposit growth, increased $63.1 million or 2.1%, compared to December 31, 2019. Brokered deposits declined $35.5 million, or 5.2%, compared to December 31, 2019. Foreign deposits declined $47.1 million, or 1.8%, with respect to the previous quarter, representing an annualized decline rate of 7.1%, compared to an annualized decline rate of 8.6% during the fourth quarter of 2019, due to Amerant’s Venezuelan customers continuing to utilize deposits to fund everyday expenses as challenging conditions in their country persist. It is encouraging that while the decline in foreign deposits continued this quarter, the pace of decline has slowed. This improvement is attributed to the Company’s increased engagement with customers and sales efforts which continued to strengthen existing relationships and the expansion of Amerant’s banking products and services, including Zelle® which was launched in the last quarter of 2019.
Amerant remains dedicated to improving the Company’s core products and services, as well as enhancing the customer experience by leveraging new digital channels and technologies. The Company’s digital transformation efforts, including the adoption of the best-in-class Salesforce® Customer Relationship Management (“CRM”) platform and industry-leading nCino® loan origination platform, along with other strategic initiatives aimed at improving Amerant’s customer service experience and operational efficiency, are well underway. Finally, Amerant opened a new state-of-the-art banking center of the future in the affluent coastal city of Delray Beach in South Florida and enhanced the Company’s online account opening platform for domestic customers in the first quarter of 2020.
Net Interest Income and Net Interest Margin
First quarter 2020 NII was $49.2 million, down 4.0% from $51.3 million in the fourth quarter of 2019 and down 11.2% from $55.4 million in the first quarter of 2019. The decrease from the prior quarter was primarily due to lower prepayment penalties in the current quarter as the pace of early loan payoffs slowed, higher average time deposit volumes, and lower average loan balances. Additionally, the Company’s variable-rate loans repriced in line with lower market rates following the Federal Reserve’s emergency rate cuts on March 3rd and 15th, which contributed to lower interest income. Amerant offset this decline by proactively repricing customer deposits, replacing FHLB advances at lower cost via maturities and prepayments, and partially replacing higher-rate maturing brokered deposits at lower market interest rates.
The decline in NII compared to the first quarter of 2019 was primarily due to (i) the strategic run-off of foreign financial institutions and non-relationship Syndicated National Credit loans throughout the first three quarters of 2019; (ii) the decline in yields of interest-earning assets resulting from the Federal Reserve decreasing the benchmark interest rate three times in 2019 plus the previously mentioned emergency cuts in March 2020; and (iii) higher rates on CDs. This decline was partially offset by lower costs of transactional deposits and borrowings as well as lower interest expense due to redemptions of trust preferred securities. NIM for the first quarter of 2020 was 2.65%, a decrease of 9 basis points from the prior quarter and 31 basis points compared to the first quarter of 2019.
7
NII and NIM are expected to remain pressured as Amerant's interest-earning assets price lower in a depressed interest rate environment due to the COVID-19 pandemic and as the Company’s low-cost international deposits continue to run off. Against this backdrop, Amerant is proactively repricing deposits, leveraging opportunities for higher-yield investments and lower-cost wholesale funding, and seeking to reduce asset sensitivity, while working diligently to meet the banking needs of the Company’s domestic and international clients. In early April, the Company modified maturities on $420.0 million fixed-rate FHLB advances, resulting in 26 bps of annual savings for this portfolio and $2.4 million of cost savings for the remainder of 2020. Amerant expects new funding costs and loan income to track market rates closely in the coming months as the impacts from the COVID-19 pandemic continue.
Noninterest income
In the first quarter of 2020, noninterest income was $21.9 million, up 37.2% from $16.0 million in the fourth quarter of 2019. The improvement was mainly driven by a $9.2 million net gain on the sale of investments, particularly on the sale of 20-year Treasury securities replaced with longer-duration bonds to mitigate higher expected prepayments on mortgage-related securities in a low interest rate market. In addition, there were lower early termination costs associated with FHLB advances in the first quarter of 2020 as opposed to the fourth quarter of 2019. Deposit and other services fees in the first quarter of 2020 included $0.5 million of new credit card program annual referral fees. The increase in quarter-over-quarter noninterest income was partially offset by lower wire transfer fees attributable to the implementation of Zelle®, lower derivative income due to a decline in customer activity, and a meaningful one-time gain on the sale of land in the fourth quarter of 2019 absent in the current quarter.
The year-over-year increase in noninterest income of $8.8 million, or 66.5%, in the first quarter of 2020 was mainly driven by the aforementioned gains on the sale of securities. Additionally, compared to the previous year’s first quarter, brokerage and advisory fees increased 12.1% due to an improved allocation of assets under management (“AUM”) into our advisory services and higher volume of customer trading activity as a result of increased market volatility. These increases were partially offset by the absence of a $0.6 million gain on an early termination of FHLB advances recognized in the first quarter of 2019, lower credit card fee income this quarter due to the previously-announced closing of Amerant's credit card products, absence of fees associated with services previously provided to the Company’s former parent and its affiliates, and lower wire transfer fees.
The Company’s assets under management and custody totaled $1.57 billion on March 31, 2020, decreasing $243.5 million from $1.82 billion on December 31, 2019 and decreasing $121.6 million from $1.69 billion on March 31, 2019. These changes are mainly attributable to lower valuations resulting from the global financial impact of the COVID-19 pandemic, partially offset by account growth due to Amerant’s increasingly successful sales efforts. Additionally, the decline in AUM compared to the first quarter of 2019 was partially offset by new customer relationship balances brought in by the Company’s acquisition of Elant Bank and Trust Ltd. in the fourth quarter of 2019.
8
Noninterest expense
First quarter 2020 noninterest expense was $44.9 million, down $6.9 million or 13.3%, from $51.7 million in the fourth quarter of 2019, largely due to lower salaries and employee benefits of $6.7 million in the current quarter. This decrease was mainly the result of variable compensation program changes and the lack of long-term incentive program expenses as Amerant continues to comprehensively review its total employee compensation practices. The decrease was also attributed to a decline in amortization expense related to the 2018 IPO restricted stock grant, including the effect of a large forfeiture during the first quarter of 2020. Additionally, Amerant benefited from lower legal and other professional fees, mainly due to a decline in amortization expense related to the directors' stock-based compensation.
Partially offsetting these decreases were: (i) an increase in marketing expenses as the Company resumed promotional activities after a break in the fourth quarter following the completion of the Company’s rebranding activities; and (ii) higher depreciation and amortization due to the absence of a $0.7 million favorable adjustment of depreciation expense in the fourth quarter of 2019 related to the Company’s operations center.
Noninterest expense for the quarter ended March 31, 2020, decreased 13.6% compared to $51.9 million in the same period of 2019, mostly due to (i) lower salaries and employee benefits expense due to staff reductions completed in 2018 and 2019 and the decline in stock-based compensation expense this quarter and (ii) the absence of rebranding costs incurred last year related to Amerant’s transformation efforts. These declines were partially offset by higher telecommunications and data processing expenses this quarter.
Restructuring expenses in the quarter ended March 31, 2020 consisted of $0.4 million, which represents an increase of 210.5% from the prior quarter due to staff reduction and previously-discussed digital transformation expenses. Amerant did not implement any staffing changes related to the COVID-19 pandemic. Restructuring expenses in the first quarter of 2020 decreased 62.1% from the same quarter last year due to the absence of rebranding costs related to the prior year’s transformation efforts.
Credit Quality
The ratio of non-performing assets to total assets remained unchanged at 0.41% at the end of the first quarter of 2020, and at the end of the fourth quarter 2019, up from 0.26% reported at the end of first quarter of 2019. Non-performing loans had a net increase of $0.5 million, mainly due to increases of three commercial loans totaling $2.3 million and two single-family loans totaling $0.6 million. This increase was offset primarily by the charge-offs of four commercial loans totaling $1.1 million, the paydown of one commercial loan of $0.4 million and three single-family residential loans totaling $0.6 million. Additionally, special mention loans decreased $13.4 million, mainly due to the upgrade of three CRE loans totaling $9.3 million to pass, the upgrade of one owner occupied loan for $0.9 million to pass, the paydown of three commercial loans totaling $1.2 million, the downgrade of two commercial loans totaling $1.7 million to substandard, and the upgrade of one commercial loan of $0.4 million to pass. The decrease was offset by the downgrade of one commercial loan of $0.2 million to special mention during the period. All special mention loans remain current.
9
The Company recorded a provision of $22.0 million during the first quarter of 2020, compared to a release of provision of $0.3 million recorded in the fourth quarter of 2019 and no provision recorded in the first quarter of 2019. The increase is mainly due to a provision of $19.8 million in the first quarter of 2020 driven by estimated losses reflecting deterioration in the macro-economic environment as a result of the impact of COVID-19 across multiple impacted sectors. In addition, the increase in the provision included $1.2 million in additional specific reserves allocated to the multi-loan relationship with a South Florida food wholesale borrower disclosed in previous quarters, and $1.0 million in additional reserves to cover the charge-offs of four commercial loans.
As discussed during previous quarters, at the end of October, Amerant curtailed charge privileges to the remaining credit cardholders in its international credit card products and required repayment of all outstanding balances by January 2020. Due to the sunset of this product, credit card charge-offs this quarter totaled $0.4 million, all of which had already been reserved. Amerant did not experience any unanticipated losses during the quarter ended March 31, 2020 as a result of the discontinuation of its credit card products.
On March 26, 2020, the Company began offering customized loan payment relief options as a result of the impact of COVID-19, including interest-only payments and forbearance options. Consistent with accounting and regulatory guidance, temporary modifications granted under these programs are not considered TDRs. Amerant is actively monitoring these loans in order to proactively identify negative patterns by industry and/or region and pursue remediation efforts in a timely manner. While the economic disruption caused by the COVID-19 pandemic is expected to impact the Company's credit quality, it is difficult to estimate the potential outcome due to the uncertain duration and magnitude of the slowdown in U.S. and global economic activity. The Company will continue to closely monitor the performance of loans to borrowers in impacted sectors, and will reassess its provisions as conditions evolve.
Capital
Stockholders’ equity was $841.1 million on March 31, 2020, up 0.8% from $834.7 million on December 31, 2019, and up 8.0% from $778.7 million on March 31, 2019. The increase in stockholders’ equity is mainly the result of the appreciation in value of the Company’s debt securities available for sale attributable to the decline in market interest rates as well as the Company’s net income. Book value per common share was $19.95 on March 31, 2020 compared to $19.35 on December 31, 2019 and $18.02 a year ago. Tangible book value per common share was $19.43 on March 31, 2020 compared to $18.84 on December 31, 2019 and $17.54 a year ago.
As previously reported, the Company redeemed its remaining fixed-rate, high-cost, Trust Preferred Securities and related subordinated debentures with available cash in the first quarter of 2020. Following this redemption, the Company’s capital continued to be strong and well in excess of the minimum regulatory requirements to be considered “well-capitalized” at March 31, 2020. As of March 31, 2020, the Company has determined to opt out of adopting the new “community bank leverage ratio” given that the perceived benefits provided by the new regulation did not exceed the potential costs considering the Company’s current and projected size and operations.
10
First Quarter 2020 Earnings Conference Call
As previously announced, the Company will hold an earnings conference call on Tuesday, April 28th, 2020 at 9:30 a.m. (Eastern Time) to discuss its first quarter 2020 results. The conference call and presentation materials can be accessed via webcast by logging on from the Investor Relations section of the company’s website at https://investor.amerantbank.com. The online replay will remain available for approximately one month following the call through the above link.
About Amerant Bancorp Inc.
The Company is a bank holding company headquartered in Coral Gables, Florida. The Company operates through its subsidiaries, Amerant Bank, N.A. (the “Bank”), Amerant Investments, Inc., Amerant Trust, N.A. and Elant Bank and Trust Ltd. The Company provides individuals and businesses in the U.S., as well as select international clients, with deposit, credit and wealth management services. The Bank, which has operated for over 40 years, is the largest community bank headquartered in Florida. The Bank operates 27 banking centers—19 in South Florida and 8 in the Houston, Texas area—and loan production offices in Dallas, Texas and New York, New York.
Zelle®, Salesforce® and nCino® are registered trademarks of Early Warning Services LLC, Salesforce.com, inc., and nCino, Inc, respectively, used in accordance with contractual terms.
Visit our investor relations page at https://investor.amerantbank.com for additional information.
Cautionary Notice Regarding Forward-Looking Statements
This press release contains “forward-looking statements” within the meaning of the Securities Act of 1933 and the Securities Exchange Act of 1934, including, without limitation, future financial and operating results; costs and revenues; economic conditions generally and in our markets and among our customer base; the challenges and uncertainties caused by the COVID-19 pandemic; the measures we have taken in response to the COVID-19 pandemic; our participation in the PPP Loan program; loan demand; changes in the mix of our earning assets and our deposit and wholesale liabilities; net interest margin; yields on earning assets; interest rates and yield curves (generally and those applicable to our assets and liabilities); credit quality, including loan performance, non-performing assets, provisions for loan losses, charge-offs, other-than-temporary impairments and collateral values; market trends; rebranding and staff realignment costs and expected savings; and customer preferences, as well as statements with respect to our objectives, expectations and intentions and other statements that are not historical facts. All statements other than statements of historical fact are statements that could be forward-looking statements. You can identify these forward-looking statements through our use of words such as “may,” “will,” “anticipate,” “assume,” “should,” “indicate,” “would,” “believe,” “contemplate,” “expect,” “estimate,” “continue,” “plan,” “point to,” “project,” “could,” “intend,” “target,” “goals,” “outlooks,” “modeled,” and other similar words and expressions of the future.
11
Forward-looking statements, including those as to our beliefs, plans, objectives, goals, expectations, anticipations, estimates and intentions, involve known and unknown risks, uncertainties and other factors, which may be beyond our control, and which may cause the Company’s actual results, performance, achievements, or financial condition to be materially different from future results, performance, achievements, or financial condition expressed or implied by such forward-looking statements. You should not rely on any forward-looking statements as predictions of future events. You should not expect us to update any forward-looking statements. All written or oral forward-looking statements attributable to us are expressly qualified in their entirety by this cautionary notice, together with those risks and uncertainties described in “Risk factors” in our annual report on Form 10-K for the fiscal year ended December 31, 2019 and in our other filings with the U.S. Securities and Exchange Commission (the “SEC”), which are available at the SEC’s website www.sec.gov.
Interim Financial Information
Unaudited financial information as of and for interim periods, including as of and for the three month periods ended March 31, 2020 and 2019, may not reflect our results of operations for our fiscal year ending, or financial condition as of December 31, 2020, or any other period of time or date.
Explanation of Certain Non-GAAP Financial Measures
Certain financial measures and ratios contained in this press release including “adjusted noninterest income”, “adjusted noninterest expense”, “adjusted net income”, “operating income”, “adjusted net income per share (basic and diluted)”, “adjusted return on assets (ROA)”, “adjusted return on equity (ROE)”, and other ratios appearing in Exhibits 1 and 2 are supplemental measures that are not required by, or are not presented in accordance with, U.S. generally accepted accounting principles (“GAAP”). The Company refers to these financial measures and ratios as “non-GAAP financial measures.”
We use certain non-GAAP financial measures, including those mentioned above, both to explain our results to shareholders and the investment community and in the internal evaluation and management of our businesses. Our management believes that these non-GAAP financial measures and the information they provide are useful to investors since these measures permit investors to view our performance using the same tools that our management uses to evaluate our past performance and prospects for future performance, especially in light of the additional costs we have incurred in connection with the Company’s restructuring activities that began in 2018 and continued into 2020, the one-time gain on sale of the vacant Beacon land in the fourth quarter of 2019, and the Company’s increase of its allowance for loan losses in 2020. While we believe that these non-GAAP financial measures are useful in evaluating our performance, this information should be considered as supplemental and not as a substitute for or superior to the related financial information prepared in accordance with GAAP. Additionally, these non-GAAP financial measures may differ from similar measures presented by other companies.
Exhibit 2 reconciles these non-GAAP financial measures to reported results.
12
Exhibit 1- Selected Financial Information
The following table sets forth selected financial information derived from our unaudited and audited consolidated financial statements.
(in thousands) | March 31, 2020 | December 31, 2019 | September 30, 2019 | June 30, 2019 | March 31, 2019 | ||||||||||||||
Consolidated Balance Sheets | |||||||||||||||||||
Total assets | $ | 8,098,810 | $ | 7,985,399 | $ | 7,864,260 | $ | 7,926,826 | $ | 7,902,355 | |||||||||
Total investments | 1,769,987 | 1,739,410 | 1,632,985 | 1,650,632 | 1,701,328 | ||||||||||||||
Total gross loans (1) | 5,668,327 | 5,744,339 | 5,753,709 | 5,812,755 | 5,744,406 | ||||||||||||||
Allowance for loan losses | 72,948 | 52,223 | 53,640 | 57,404 | 60,322 | ||||||||||||||
Total deposits | 5,842,212 | 5,757,143 | 5,692,848 | 5,819,381 | 5,888,188 | ||||||||||||||
Junior subordinated debentures (2) | 64,178 | 92,246 | 92,246 | 118,110 | 118,110 | ||||||||||||||
Advances from the FHLB and other borrowings | 1,265,000 | 1,235,000 | 1,170,000 | 1,125,000 | 1,070,000 | ||||||||||||||
Stockholders' equity | 841,117 | 834,701 | 825,751 | 806,368 | 778,749 | ||||||||||||||
Assets under management and custody (3) | 1,572,322 | 1,815,848 | 1,713,012 | 1,787,257 | 1,693,895 | ||||||||||||||
Three Months Ended | |||||||||||||||||||
(in thousands, except percentages and per share amounts) | March 31, 2020 | December 31, 2019 | September 30, 2019 | June 30, 2019 | March 31, 2019 | ||||||||||||||
Consolidated Results of Operations | |||||||||||||||||||
Net interest income | $ | 49,229 | $ | 51,262 | $ | 52,600 | $ | 53,789 | $ | 55,437 | |||||||||
Provision for (reversal of) loan losses | 22,000 | (300 | ) | (1,500 | ) | (1,350 | ) | — | |||||||||||
Noninterest income | 21,910 | 15,971 | 13,836 | 14,147 | 13,156 | ||||||||||||||
Noninterest expense | 44,867 | 51,730 | 52,737 | 52,905 | 51,945 | ||||||||||||||
Net income | 3,382 | 13,475 | 11,931 | 12,857 | 13,071 | ||||||||||||||
Effective income tax rate | 20.83 | % | 14.73 | % | 21.50 | % | 21.51 | % | 21.49 | % | |||||||||
Common Share Data | |||||||||||||||||||
Stockholders' book value per common share | $ | 19.95 | $ | 19.35 | $ | 19.11 | $ | 18.66 | $ | 18.02 | |||||||||
Tangible stockholders' equity (book value) per common share (4) | $ | 19.43 | $ | 18.84 | $ | 18.63 | $ | 18.18 | $ | 17.54 | |||||||||
Basic earnings per common share | $ | 0.08 | $ | 0.32 | $ | 0.28 | $ | 0.30 | $ | 0.31 | |||||||||
Diluted earnings per common share | $ | 0.08 | $ | 0.31 | $ | 0.28 | $ | 0.30 | $ | 0.30 | |||||||||
Basic weighted average shares outstanding | 42,185 | 42,489 | 42,466 | 42,466 | 42,755 | ||||||||||||||
Diluted weighted average shares outstanding (5) | 42,533 | 43,050 | 42,915 | 42,819 | 42,914 | ||||||||||||||
13
Three Months Ended | ||||||||||||||
March 31, 2020 | December 31, 2019 | September 30, 2019 | June 30, 2019 | March 31, 2019 | ||||||||||
Other Financial and Operating Data (6) | ||||||||||||||
Profitability Indicators (%) | ||||||||||||||
Net interest income / Average total interest earning assets (NIM) (7) | 2.65 | % | 2.74 | % | 2.80 | % | 2.92 | % | 2.96 | % | ||||
Net income / Average total assets (ROA) (8) | 0.17 | % | 0.68 | % | 0.60 | % | 0.66 | % | 0.65 | % | ||||
Net income / Average stockholders' equity (ROE) (9) | 1.61 | % | 6.44 | % | 5.81 | % | 6.56 | % | 6.87 | % | ||||
Capital Indicators (%) | ||||||||||||||
Total capital ratio (10) | 14.54 | % | 14.78 | % | 14.77 | % | 14.70 | % | 14.35 | % | ||||
Tier 1 capital ratio (11) | 13.38 | % | 13.94 | % | 13.93 | % | 13.85 | % | 13.48 | % | ||||
Tier 1 leverage ratio (12) | 10.82 | % | 11.32 | % | 11.15 | % | 11.32 | % | 10.83 | % | ||||
Common equity tier 1 capital ratio (CET1) (13) | 12.42 | % | 12.60 | % | 12.57 | % | 12.14 | % | 11.79 | % | ||||
Tangible common equity ratio (14) | 10.14 | % | 10.21 | % | 10.26 | % | 9.93 | % | 9.61 | % | ||||
Asset Quality Indicators (%) | ||||||||||||||
Non-performing assets / Total assets (15) | 0.41 | % | 0.41 | % | 0.42 | % | 0.41 | % | 0.26 | % | ||||
Non-performing loans / Total loans (1) (16) | 0.59 | % | 0.57 | % | 0.57 | % | 0.56 | % | 0.36 | % | ||||
Allowance for loan losses / Total non-performing loans (17) | 218.49 | % | 158.60 | % | 163.42 | % | 175.28 | % | 294.01 | % | ||||
Allowance for loan losses / Total loans (1) (17) | 1.29 | % | 0.91 | % | 0.93 | % | 0.99 | % | 1.05 | % | ||||
Net charge-offs / Average total loans (18) | 0.09 | % | 0.08 | % | 0.16 | % | 0.11 | % | 0.10 | % | ||||
Efficiency Indicators (% except FTE) | ||||||||||||||
Noninterest expense / Average total assets | 2.27 | % | 2.60 | % | 2.64 | % | 2.70 | % | 2.58 | % | ||||
Salaries and employee benefits / Average total assets | 1.48 | % | 1.81 | % | 1.70 | % | 1.74 | % | 1.66 | % | ||||
Other operating expenses/ Average total assets (19) | 0.79 | % | 0.79 | % | 0.95 | % | 0.96 | % | 0.92 | % | ||||
Efficiency ratio (20) | 63.07 | % | 76.94 | % | 79.38 | % | 77.87 | % | 75.73 | % | ||||
Full-Time-Equivalent Employees (FTEs) | 825 | 829 | 838 | 839 | 889 | |||||||||
14
Three Months Ended | |||||||||||||||||||
(in thousands, except per share amounts and percentages) | March 31, 2020 | December 31, 2019 | September 30, 2019 | June 30, 2019 | March 31, 2019 | ||||||||||||||
Adjusted Selected Consolidated Results of Operations and Other Data (4) | |||||||||||||||||||
Adjusted noninterest income | $ | 21,910 | $ | 13,176 | $ | 13,836 | $ | 14,147 | $ | 13,156 | |||||||||
Adjusted noninterest expense | 44,513 | 51,616 | 51,474 | 50,169 | 51,012 | ||||||||||||||
Adjusted net income | 3,662 | 11,407 | 12,923 | 15,005 | 13,803 | ||||||||||||||
Operating income | 16,652 | 14,800 | 12,793 | 14,039 | 16,644 | ||||||||||||||
Adjusted earnings per common share | 0.09 | 0.27 | 0.30 | 0.35 | 0.33 | ||||||||||||||
Adjusted earnings per diluted common share (5) | 0.09 | 0.26 | 0.30 | 0.35 | 0.32 | ||||||||||||||
Adjusted net income / Average total assets (Adjusted ROA) (8) | 0.19 | % | 0.57 | % | 0.65 | % | 0.77 | % | 0.69 | % | |||||||||
Adjusted net income / Average stockholders' equity (Adjusted ROE) (9) | 1.74 | % | 5.45 | % | 6.30 | % | 7.66 | % | 7.25 | % | |||||||||
Adjusted noninterest expense / Average total assets | 2.25 | % | 2.59 | % | 2.58 | % | 2.56 | % | 2.53 | % | |||||||||
Adjusted salaries and employee benefits / Average total assets | 1.48 | % | 1.80 | % | 1.67 | % | 1.69 | % | 1.66 | % | |||||||||
Adjusted other operating expenses/ Average total assets (19) | 0.77 | % | 0.79 | % | 0.91 | % | 0.87 | % | 0.87 | % | |||||||||
Adjusted efficiency ratio (21) | 62.57 | % | 80.1 | % | 77.48 | % | 73.84 | % | 74.37 | % | |||||||||
__________________
(1) | Total gross loans are net of deferred loan fees and costs. At September 30, 2019 and March 31, 2019, total loans include $1.9 million and $10.0 million in loans held for sale, respectively. There were no loans held for sale at any of the other dates presented. |
(2) | During the three months ended March 31, 2020 and September 30, 2019, the Company redeemed $26.8 million of its 8.90% trust preferred securities and $25.0 million of its 10.60% and 10.18% trust preferred securities, respectively. The Company simultaneously redeemed the junior subordinated debentures associated with these trust preferred securities. |
(3) Assets held for clients in an agency or fiduciary capacity which are not assets of the Company and therefore are not included in the consolidated financial statements.
(4) This presentation contains adjusted financial information determined by methods other than GAAP. This adjusted financial information is reconciled to GAAP in Exhibit 2 - Non-GAAP Financial Measures Reconciliation.
(5) As of March 31, 2020, December 31, 2019, September 30, 2019, June 30, 2019 and March 31, 2019 potential dilutive instruments consisted of unvested shares of restricted stock and restricted stock units mainly related to the Company’s IPO in 2018 totaling 482,316, 530,620, 789,652, 789,652, and 786,213, respectively. These potential dilutive instruments were included in the diluted earnings per share computation because, when the unamortized deferred compensation cost related to these shares was divided by the average market price per share at those dates, fewer shares would have been purchased than restricted shares assumed issued. Therefore, at those dates, such awards resulted in higher diluted weighted average shares outstanding than basic weighted average shares outstanding, and had a dilutive effect in per share earnings.
(6) | Operating data for the periods presented have been annualized. |
(7) | NIM is defined as NII divided by average interest-earning assets, which are loans, securities, deposits with banks and other financial assets which yield interest or similar income. |
15
(8) | Calculated based upon the average daily balance of total assets. |
(9) | Calculated based upon the average daily balance of stockholders’ equity. |
(10) | Total stockholders’ equity divided by total risk-weighted assets, calculated according to the standardized regulatory capital ratio calculations. |
(11) | Tier 1 capital divided by total risk-weighted assets. |
(12) | Tier 1 capital divided by quarter to date average assets. Tier 1 capital is composed of Common Equity Tier 1 (CET 1) capital plus outstanding qualifying trust preferred securities of $62.3 million at March 31, 2020, $89.1 million as of December 31, 2019 and September 30, 2019, and $114.1 million at each of the other dates shown. See footnote 2 for more information about trust preferred securities redemption transactions in the first quarter of 2020 and third quarter of 2019. |
(13)Common Equity Tier 1 (CET 1) capital divided by total risk-weighted assets.
(14) | Tangible common equity is calculated as the ratio of common equity less goodwill and other intangibles divided by total assets less goodwill and other intangible assets. Other intangibles assets are included in other assets in the Company’s consolidated balance sheets. |
(15)Non-performing assets include all accruing loans past due by 90 days or more, all nonaccrual loans, restructured loans that are considered “troubled debt restructurings” or “TDRs”, and OREO properties acquired through or in lieu of foreclosure. Non-performing assets were $33.4 million, $33.0 million, $32.8 million, $32.8 million and $20.5 million as of March 31, 2020, December 31, 2019, September 30, 2019, June 30, 2019 and March 31, 2019, respectively.
(16)Non-performing loans include all accruing loans past due by 90 days or more, all nonaccrual loans and restructured loans that are considered TDRs. Non-performing loans were $33.4 million, $32.9 million, $32.8 million, $32.8 million and $20.5 million as of March 31, 2020, December 31, 2019, September 30, 2019, June 30, 2019 and March 31, 2019, respectively.
(17)Allowance for loan losses was $72.9 million, $52.2 million, $53.6 million, $57.4 million and $60.3 million as of March 31, 2020, December 31, 2019, September 30, 2019, June 30, 2019 and March 31, 2019, respectively.
(18)Calculated based upon the average daily balance of outstanding loan principal balance net of deferred loan fees and costs, excluding the allowance for loan losses.
(19)Other operating expenses is the result of total noninterest expense less salary and employee benefits.
(20)Efficiency ratio is the result of noninterest expense divided by the sum of noninterest income and NII.
(21)Adjusted efficiency ratio is the efficiency ratio less the effect of restructuring costs, described in Exhibit 2 - Non-GAAP Financial Measures Reconciliation.
16
Exhibit 2- Non-GAAP Financial Measures Reconciliation
The following table sets forth selected financial information derived from the Company’s interim unaudited and annual audited consolidated financial statements, adjusted for certain costs incurred by the Company in the periods presented related to tax deductible restructuring costs, the after-tax gain of $2.2 million on the sale of vacant Beacon land in the fourth quarter of 2019, and the Company’s increase of its allowance for loan losses in 2020. The Company believes these adjusted numbers are useful to understand the Company’s performance absent these transactions and events.
Three Months Ended, | |||||||||||||||
(in thousands) | March 31, 2020 | December 31, 2019 | September 30, 2019 | June 30, 2019 | March 31, 2019 | ||||||||||
Total noninterest income | $ | 21,910 | $ | 15,971 | $ | 13,836 | $ | 14,147 | $ | 13,156 | |||||
Less: gain on sale of vacant Beacon land | — | (2,795 | ) | — | — | — | |||||||||
Adjusted noninterest income | $ | 21,910 | $ | 13,176 | $ | 13,836 | $ | 14,147 | $ | 13,156 | |||||
Total noninterest expenses | $ | 44,867 | $ | 51,730 | $ | 52,737 | $ | 52,905 | $ | 51,945 | |||||
Less: restructuring costs (1): | |||||||||||||||
Staff reduction costs | 54 | 114 | 450 | 907 | — | ||||||||||
Digital transformation expenses | 300 | — | — | — | — | ||||||||||
Rebranding costs | — | — | 813 | 1,829 | 933 | ||||||||||
Other costs | — | — | — | — | — | ||||||||||
Total restructuring costs | $ | 354 | $ | 114 | $ | 1,263 | $ | 2,736 | $ | 933 | |||||
Adjusted noninterest expenses | $ | 44,513 | $ | 51,616 | $ | 51,474 | $ | 50,169 | $ | 51,012 | |||||
Net income | $ | 3,382 | $ | 13,475 | $ | 11,931 | $ | 12,857 | $ | 13,071 | |||||
Plus after-tax restructuring costs: | |||||||||||||||
Restructuring costs before income tax effect | 354 | 114 | 1,263 | 2,736 | 933 | ||||||||||
Income tax effect | (74 | ) | 59 | (271 | ) | (588 | ) | (201 | ) | ||||||
Total after-tax restructuring costs | 280 | 173 | 992 | 2,148 | 732 | ||||||||||
Less after-tax gain on sale of vacant Beacon land: | |||||||||||||||
Gain on sale of vacant Beacon land before income tax effect | — | (2,795 | ) | — | — | — | |||||||||
Income tax effect | — | 554 | — | — | — | ||||||||||
Total after-tax gain on sale of vacant Beacon land | — | (2,241 | ) | — | — | — | |||||||||
Adjusted net income | $ | 3,662 | $ | 11,407 | $ | 12,923 | $ | 15,005 | $ | 13,803 | |||||
Net Income | $ | 3,382 | $ | 13,475 | $ | 11,931 | $ | 12,857 | $ | 13,071 | |||||
Plus: provision for income tax expense | 890 | 2,328 | 3,268 | 3,524 | 3,577 | ||||||||||
Plus: provision for (reversal of) loan losses | 22,000 | (300 | ) | (1,500 | ) | (1,350 | ) | — | |||||||
Less: securities gains, net | 9,620 | 703 | 906 | 992 | 4 | ||||||||||
Operating income | $ | 16,652 | $ | 14,800 | $ | 12,793 | $ | 14,039 | $ | 16,644 | |||||
17
Three Months Ended, | |||||||||||||||
(in thousands, except percentages and per share amounts) | March 31, 2020 | December 31, 2019 | September 30, 2019 | June 30, 2019 | March 31, 2019 | ||||||||||
Basic earnings per share | $ | 0.08 | $ | 0.32 | $ | 0.28 | $ | 0.30 | $ | 0.31 | |||||
Plus: after tax impact of restructuring costs | 0.01 | — | 0.02 | 0.05 | 0.02 | ||||||||||
Less: after tax gain on sale of vacant Beacon land | — | (0.05 | ) | — | — | — | |||||||||
Total adjusted basic earnings per common share | $ | 0.09 | $ | 0.27 | $ | 0.30 | $ | 0.35 | $ | 0.33 | |||||
Diluted earnings per share (2) | $ | 0.08 | $ | 0.31 | $ | 0.28 | $ | 0.30 | $ | 0.30 | |||||
Plus: after tax impact of restructuring costs | 0.01 | — | 0.02 | 0.05 | 0.02 | ||||||||||
Less: after tax gain on sale of vacant Beacon land | — | (0.05 | ) | — | — | — | |||||||||
Total adjusted diluted earnings per common share | $ | 0.09 | $ | 0.26 | $ | 0.30 | $ | 0.35 | $ | 0.32 | |||||
Net income / Average total assets (ROA) | 0.17 | % | 0.68 | % | 0.60 | % | 0.66 | % | 0.65 | % | |||||
Plus: after tax impact of restructuring costs | 0.02 | % | 0.01 | % | 0.05 | % | 0.11 | % | 0.04 | % | |||||
Less: after tax gain on sale of vacant Beacon land | — | % | (0.12 | )% | — | % | — | % | — | % | |||||
Adjusted net income / Average total assets (Adjusted ROA) | 0.19 | % | 0.57 | % | 0.65 | % | 0.77 | % | 0.69 | % | |||||
Net income / Average stockholders' equity (ROE) | 1.61 | % | 6.44 | % | 5.81 | % | 6.56 | % | 6.87 | % | |||||
Plus: after tax impact of restructuring costs | 0.13 | % | 0.08 | % | 0.49 | % | 1.10 | % | 0.38 | % | |||||
Less: after tax gain on sale of vacant Beacon land | — | % | (1.07 | )% | — | % | — | % | — | % | |||||
Adjusted net income / Average stockholders' equity (Adjusted ROE) | 1.74 | % | 5.45 | % | 6.30 | % | 7.66 | % | 7.25 | % | |||||
Noninterest expense / Average total assets | 2.27 | % | 2.60 | % | 2.64 | % | 2.70 | % | 2.58 | % | |||||
Less: impact of restructuring costs | (0.02 | )% | (0.01 | )% | (0.06 | )% | (0.14 | )% | (0.05 | )% | |||||
Adjusted Noninterest expense / Average total assets | 2.25 | % | 2.59 | % | 2.58 | % | 2.56 | % | 2.53 | % | |||||
Salaries and employee benefits / Average total assets | 1.48 | % | 1.81 | % | 1.70 | % | 1.74 | % | 1.66 | % | |||||
Less: impact of restructuring costs | — | % | (0.01 | )% | (0.03 | )% | (0.05 | )% | — | % | |||||
Adjusted salaries and employee benefits / Average total assets | 1.48 | % | 1.80 | % | 1.67 | % | 1.69 | % | 1.66 | % | |||||
Other operating expenses / Average total assets | 0.79 | % | 0.79 | % | 0.95 | % | 0.96 | % | 0.92 | % | |||||
Less: impact of restructuring costs | (0.02 | )% | — | % | (0.04 | )% | (0.09 | )% | (0.05 | )% | |||||
Adjusted other operating expenses / Average total assets | 0.77 | % | 0.79 | % | 0.91 | % | 0.87 | % | 0.87 | % | |||||
Efficiency ratio | 63.07 | % | 76.94 | % | 79.38 | % | 77.87 | % | 75.73 | % | |||||
Less: impact of restructuring costs | (0.50 | )% | (0.17 | )% | (1.90 | )% | (4.03 | )% | (1.36 | )% | |||||
Adjusted efficiency ratio | 62.57 | % | 80.10 | % | 77.48 | % | 73.84 | % | 74.37 | % | |||||
18
Three Months Ended, | |||||||||||||||
(in thousands, except per share amounts and percentages) | March 31, 2020 | December 31, 2019 | September 30, 2019 | June 30, 2019 | March 31, 2019 | ||||||||||
Stockholders' equity | $ | 841,117 | $ | 834,701 | $ | 825,751 | $ | 806,368 | $ | 778,749 | |||||
Less: goodwill and other intangibles | (21,698 | ) | (21,744 | ) | (20,933 | ) | (20,969 | ) | (21,005 | ) | |||||
Tangible common stockholders' equity | $ | 819,419 | $ | 812,957 | $ | 804,818 | $ | 785,399 | $ | 757,744 | |||||
Total assets | 8,098,810 | 7,985,399 | 7,864,260 | 7,926,826 | 7,902,355 | ||||||||||
Less: goodwill and other intangibles | (21,698 | ) | (21,744 | ) | (20,933 | ) | (20,969 | ) | (21,005 | ) | |||||
Tangible assets | $ | 8,077,112 | $ | 7,963,655 | $ | 7,843,327 | $ | 7,905,857 | $ | 7,881,350 | |||||
Common shares outstanding | 42,166 | 43,146 | 43,205 | 43,205 | 43,205 | ||||||||||
Tangible common equity ratio | 10.14 | % | 10.21 | % | 10.26 | % | 9.93 | % | 9.61 | % | |||||
Stockholders' book value per common share | $ | 19.95 | $ | 19.35 | $ | 19.11 | $ | 18.66 | $ | 18.02 | |||||
Tangible stockholders' book value per common share | $ | 19.43 | $ | 18.84 | $ | 18.63 | $ | 18.18 | $ | 17.54 | |||||
____________
(1) | Expenses incurred for actions designed to implement the Company’s strategy as a new independent company. These actions include, but are not limited to reductions in workforce, streamlining operational processes, rolling out the Amerant brand, implementation of new technology system applications, enhanced sales tools and training, expanded product offerings and improved customer analytics to identify opportunities. |
(2) As of March 31, 2020, December 31, 2019, September 30, 2019, June 30, 2019 and March 31, 2019 potential dilutive instruments consisted of unvested shares of restricted stock and restricted stock units mainly related to the Company’s IPO in 2018 totaling 482,316, 530,620, 789,652, 789,652 and 786,213, respectively. These potential dilutive instruments were included in the diluted earnings per share computation because, when the unamortized deferred compensation cost related to these shares was divided by the average market price per share at those dates, fewer shares would have been purchased than restricted shares assumed issued. Therefore, at those dates, such awards resulted in higher diluted weighted average shares outstanding than basic weighted average shares outstanding, and had a dilutive effect in per share earnings.
19
Exhibit 3 - Average Balance Sheet, Interest and Yield/Rate Analysis
The following tables present average balance sheet information, interest income, interest expense and the corresponding average yields earned and rates paid for the periods presented. The average balances for loans include both performing and nonperforming balances. Interest income on loans includes the effects of discount accretion and the amortization of net deferred loan origination costs accounted for as yield adjustments. Average balances represent the daily average balances for the periods presented.
Three Months Ended | ||||||||||||||||||||||||||
March 31, 2020 | December 31, 2019 | March 31, 2019 | ||||||||||||||||||||||||
(in thousands, except percentages) | Average Balances | Income/ Expense | Yield/ Rates | Average Balances | Income/ Expense | Yield/ Rates | Average Balances | Income/ Expense | Yield/ Rates | |||||||||||||||||
Interest-earning assets: | ||||||||||||||||||||||||||
Loan portfolio, net (1) | $ | 5,573,627 | $ | 59,788 | 4.31 | % | $ | 5,627,641 | $ | 63,370 | 4.47 | % | $ | 5,707,891 | $ | 66,722 | 4.74 | % | ||||||||
Debt securities available for sale (2) | 1,549,502 | 9,497 | 2.47 | % | 1,528,916 | 9,814 | 2.55 | % | 1,532,649 | 10,750 | 2.84 | % | ||||||||||||||
Debt securities held to maturity (3) | 72,472 | 400 | 2.22 | % | 75,989 | 419 | 2.19 | % | 84,613 | 586 | 2.81 | % | ||||||||||||||
Equity securities with readily determinable fair value not held for trading | 24,052 | 131 | 2.19 | % | 23,912 | 141 | 2.34 | % | 23,179 | 139 | 2.43 | % | ||||||||||||||
Federal Reserve Bank and FHLB stock | 71,192 | 1,037 | 5.86 | % | 71,902 | 1,044 | 5.76 | % | 67,461 | 1,106 | 6.65 | % | ||||||||||||||
Deposits with banks | 171,848 | 462 | 1.08 | % | 105,060 | 449 | 1.70 | % | 169,811 | 1,004 | 2.40 | % | ||||||||||||||
Total interest-earning assets | 7,462,693 | 71,315 | 3.84 | % | 7,433,420 | 75,237 | 4.02 | % | 7,585,604 | 80,307 | 4.29 | % | ||||||||||||||
Total non-interest-earning assets less allowance for loan losses | 488,651 | 472,556 | 477,714 | |||||||||||||||||||||||
Total assets | $ | 7,951,344 | $ | 7,905,976 | $ | 8,063,318 | ||||||||||||||||||||
Interest-bearing liabilities: | ||||||||||||||||||||||||||
Checking and saving accounts - | ||||||||||||||||||||||||||
Interest bearing DDA | $ | 1,071,558 | $ | 135 | 0.05 | % | $ | 1,098,532 | $ | 159 | 0.06 | % | $ | 1,262,603 | $ | 274 | 0.09 | % | ||||||||
Money market | 1,136,501 | 3,249 | 1.15 | % | 1,147,539 | 3,802 | 1.31 | % | 1,158,623 | 3,717 | 1.30 | % | ||||||||||||||
Savings | 322,682 | 17 | 0.02 | % | 337,338 | 16 | 0.02 | % | 383,425 | 16 | 0.02 | % | ||||||||||||||
Total checking and saving accounts | 2,530,741 | 3,401 | 0.54 | % | 2,583,409 | 3,977 | 0.61 | % | 2,804,651 | 4,007 | 0.58 | % | ||||||||||||||
Time deposits | 2,461,073 | 13,484 | 2.20 | % | 2,317,052 | 13,180 | 2.26 | % | 2,422,351 | 12,553 | 2.10 | % | ||||||||||||||
Total deposits | 4,991,814 | 16,885 | 1.36 | % | 4,900,461 | 17,157 | 1.39 | % | 5,227,002 | 16,560 | 1.28 | % | ||||||||||||||
Securities sold under agreements to repurchase | — | — | — | % | 497 | 2 | 1.60 | % | — | — | — | % | ||||||||||||||
Advances from the FHLB and other borrowings (4) | 1,195,714 | 4,412 | 1.48 | % | 1,214,728 | 5,575 | 1.82 | % | 1,101,356 | 6,205 | 2.28 | % | ||||||||||||||
Junior subordinated debentures | 73,123 | 789 | 4.34 | % | 92,246 | 1,241 | 5.34 | % | 118,110 | 2,105 | 7.23 | % | ||||||||||||||
Total interest-bearing liabilities | 6,260,651 | 22,086 | 1.42 | % | 6,207,932 | 23,975 | 1.53 | % | 6,446,468 | 24,870 | 1.56 | % | ||||||||||||||
Total non-interest-bearing liabilities | 846,493 | 868,470 | 856,211 | |||||||||||||||||||||||
Total liabilities | 7,107,144 | 7,076,402 | 7,302,679 | |||||||||||||||||||||||
Stockholders’ equity | 844,200 | 829,574 | 760,639 | |||||||||||||||||||||||
Total liabilities and stockholders' equity | $ | 7,951,344 | $ | 7,905,976 | $ | 8,063,318 | ||||||||||||||||||||
Excess of average interest-earning assets over average interest-bearing liabilities | $ | 1,202,042 | $ | 1,225,488 | $ | 1,139,136 | ||||||||||||||||||||
Net interest income | $ | 49,229 | $ | 51,262 | $ | 55,437 | ||||||||||||||||||||
Net interest rate spread | 2.42 | % | 2.49 | % | 2.73 | % | ||||||||||||||||||||
Net interest margin (5) | 2.65 | % | 2.74 | % | 2.96 | % | ||||||||||||||||||||
20
Ratio of average interest-earning assets to average interest-bearing liabilities | 119.20 | % | 119.74 | % | 117.67 | % | ||||||||||||||||||||
___________
(1) Average non-performing loans of $32.8 million, $33.0 million and $19.8 million for the three months ended March 31, 2020, December 31, 2019 and March 31, 2019, respectively, are included in the average loan portfolio, net.
(2) | Includes nontaxable securities with average balances of $49.4 million, $46.7 million and $158.0 million for the three months ended March 31, 2020, December 31, 2019 and March 31, 2019, respectively. The tax equivalent yield for these nontaxable securities was 3.88%, 3.97% and 4.02% for the three months ended March 31, 2020, December 31, 2019 and March 31, 2019, respectively. In 2020 and 2019, the tax equivalent yields were calculated by assuming a 21% tax rate and dividing the actual yield by 0.79. |
(3) | Includes nontaxable securities with average balances of $72.5 million, $76.0 million and $84.6 million for the three months ended March 31, 2020, December 31, 2019 and March 31, 2019, respectively. The tax equivalent yield for these nontaxable securities was 2.81%, 2.77% and 3.55% for the three months ended March 31, 2020, December 31, 2019 and March 31, 2019, respectively. In 2020 and 2019, the tax equivalent yields were calculated assuming a 21% tax rate and dividing the actual yield by 0.79. |
(4) | The terms of the FHLB advance agreements require the Bank to maintain certain investment securities or loans as collateral for these advances. |
(5) | NIM is defined as NII divided by average interest-earning assets, which are loans, securities available for sale and held to maturity, deposits with banks and other financial assets which yield interest or similar income. |
Exhibit 4 - Noninterest Income
This table shows the amounts of each of the categories of noninterest income for the periods presented.
Three Months Ended | |||||||||||||||||
March 31, 2020 | December 31, 2019 | March 31, 2019 | |||||||||||||||
(in thousands, except percentages) | Amount | % | Amount | % | Amount | % | |||||||||||
Deposits and service fees | $ | 4,290 | 19.6 | % | $ | 4,274 | 26.8 | % | $ | 4,086 | 31.1 | % | |||||
Brokerage, advisory and fiduciary activities | 4,133 | 18.9 | % | 3,865 | 24.2 | % | 3,688 | 28.0 | % | ||||||||
Change in cash surrender value of bank owned life insurance (“BOLI”)(1) | 1,414 | 6.5 | % | 1,438 | 9.0 | % | 1,404 | 10.7 | % | ||||||||
Cards and trade finance servicing fees | 395 | 1.8 | % | 557 | 3.5 | % | 915 | 7.0 | % | ||||||||
Gain on early extinguishment of FHLB advances | (7 | ) | — | % | (1,443 | ) | (9.0 | )% | 557 | 4.2 | % | ||||||
Data processing and fees for other services | — | — | % | — | — | % | 520 | 4.0 | % | ||||||||
Securities gains, net (2) | 9,620 | 43.9 | % | 703 | 4.4 | % | 4 | — | % | ||||||||
Other noninterest income (3) | 2,065 | 9.3 | % | 6,577 | 41.1 | % | 1,982 | 15.0 | % | ||||||||
Total noninterest income | $ | 21,910 | 100.0 | % | $ | 15,971 | 100.0 | % | $ | 13,156 | 100.0 | % | |||||
__________________
(1) | Changes in cash surrender value of BOLI are not taxable. |
(2) Includes net gain on sale of securities of $9.2 million during the three months ended 2020 and unrealized gain on change in market value of mutual fund of $0.4 million and $0.7 million during the three months ended March 31, 2020 and December 31, 2019, respectively.
(3) | Includes rental income, income from derivative and foreign currency exchange transactions with customers, and valuation income on the investment balances held in the non-qualified deferred compensation plan. |
21
Exhibit 5 - Noninterest Expense
This table shows the amounts of each of the categories of noninterest expense for the periods presented.
Three Months Ended | |||||||||||||||||
March 31, 2020 | December 31, 2019 | March 31, 2019 | |||||||||||||||
(in thousands, except percentages) | Amount | % | Amount | % | Amount | % | |||||||||||
Salaries and employee benefits | $ | 29,326 | 65.4 | % | $ | 36,024 | 69.6 | % | $ | 33,437 | 64.4 | % | |||||
Occupancy and equipment | 3,803 | 8.5 | % | 4,042 | 7.8 | % | 4,042 | 7.8 | % | ||||||||
Professional and other services fees | 2,954 | 6.6 | % | 4,430 | 8.6 | % | 3,444 | 6.6 | % | ||||||||
Telecommunications and data processing | 3,464 | 7.7 | % | 3,396 | 6.6 | % | 3,026 | 5.8 | % | ||||||||
Depreciation and amortization | 1,959 | 4.4 | % | 1,214 | 2.3 | % | 1,942 | 3.7 | % | ||||||||
FDIC assessments and insurance | 1,118 | 2.5 | % | 876 | 1.7 | % | 1,393 | 2.7 | % | ||||||||
Other operating expenses (1) | 2,243 | 4.9 | % | 1,748 | 3.4 | % | 4,661 | 9.0 | % | ||||||||
Total noninterest expense | $ | 44,867 | 100.0 | % | $ | 51,730 | 100.0 | % | $ | 51,945 | 100.0 | % | |||||
___________
(1) Includes advertising, marketing, charitable contributions, community engagement, postage and courier expenses, provisions for possible losses on contingent loans, and debits which mirror the valuation income on the investment balances held in the non-qualified deferred compensation plan in order to adjust the liability to participants of the deferred compensation plan.
Exhibit 6 - Loans
Loans by Type
The loan portfolio consists of the following loan classes:
(in thousands) | March 31, 2020 | December 31, 2019 | September 30, 2019 | June 30, 2019 | March 31, 2019 | ||||||||||||||
Real estate loans | |||||||||||||||||||
Commercial real estate | |||||||||||||||||||
Non-owner occupied | $ | 1,875,293 | $ | 1,891,802 | $ | 1,933,662 | $ | 1,872,493 | $ | 1,852,903 | |||||||||
Multi-family residential | 834,016 | 801,626 | 942,851 | 968,080 | 878,239 | ||||||||||||||
Land development and construction loans | 225,179 | 278,688 | 268,312 | 291,304 | 291,416 | ||||||||||||||
2,934,488 | 2,972,116 | 3,144,825 | 3,131,877 | 3,022,558 | |||||||||||||||
Single-family residential | 569,340 | 539,102 | 527,468 | 535,563 | 535,306 | ||||||||||||||
Owner occupied | 923,260 | 894,060 | 825,601 | 836,334 | 801,856 | ||||||||||||||
4,427,088 | 4,405,278 | 4,497,894 | 4,503,774 | 4,359,720 | |||||||||||||||
Commercial loans | 1,084,751 | 1,234,043 | 1,127,484 | 1,180,736 | 1,239,525 | ||||||||||||||
Loans to financial institutions and acceptances | 16,576 | 16,552 | 24,815 | 25,006 | 27,985 | ||||||||||||||
Consumer loans and overdrafts | 139,912 | 88,466 | 101,598 | 103,239 | 107,208 | ||||||||||||||
Total loans | $ | 5,668,327 | $ | 5,744,339 | $ | 5,751,791 | $ | 5,812,755 | $ | 5,734,438 | |||||||||
22
Non-Performing Assets
This table shows a summary of our non-performing assets by loan class, which includes non-performing loans and other real estate owned, or OREO, at the dates presented. Non-performing loans consist of (i) nonaccrual loans; (ii) accruing loans 90 days or more contractually past due as to interest or principal; and (iii) restructured loans that are considered TDRs.
(in thousands) | March 31, 2020 | December 31, 2019 | September 30, 2019 | June 30, 2019 | March 31, 2019 | ||||||||||||||
Non-Accrual Loans(1) | |||||||||||||||||||
Real Estate Loans | |||||||||||||||||||
Commercial real estate (CRE) | |||||||||||||||||||
Non-owner occupied | $ | 1,936 | $ | 1,936 | $ | 1,936 | $ | 1,964 | $ | — | |||||||||
Multi-family residential | — | — | — | 657 | 665 | ||||||||||||||
1,936 | 1,936 | 1,936 | 2,621 | 665 | |||||||||||||||
Single-family residential | 7,077 | 7,291 | 9,033 | 9,432 | 6,514 | ||||||||||||||
Owner occupied | 13,897 | 14,130 | 11,921 | 10,528 | 5,192 | ||||||||||||||
22,910 | 23,357 | 22,890 | 22,581 | 12,371 | |||||||||||||||
Commercial loans | 9,993 | 9,149 | 9,605 | 10,032 | 7,361 | ||||||||||||||
Consumer loans and overdrafts | 467 | 416 | 116 | 114 | 37 | ||||||||||||||
Total Non-Accrual Loans | $ | 33,370 | $ | 32,922 | $ | 32,611 | $ | 32,727 | $ | 19,769 | |||||||||
Past Due Accruing Loans(2) | |||||||||||||||||||
Real Estate Loans | |||||||||||||||||||
Single-family residential | $ | 5 | $ | — | $ | — | $ | — | $ | — | |||||||||
Commercial | — | — | — | — | — | ||||||||||||||
Consumer loans and overdrafts | 12 | 5 | 213 | 23 | 749 | ||||||||||||||
Total Past Due Accruing Loans | 17 | 5 | 213 | 23 | 749 | ||||||||||||||
Total Non-Performing Loans | 33,387 | 32,927 | 32,824 | 32,750 | 20,518 | ||||||||||||||
Other Real Estate Owned | 42 | 42 | — | — | — | ||||||||||||||
Total Non-Performing Assets | $ | 33,429 | $ | 32,969 | $ | 32,824 | $ | 32,750 | $ | 20,518 | |||||||||
__________________
(1) | Includes loan modifications that met the definition of TDRs which may be performing in accordance with their modified loan terms. As of March 31, 2020 and December 31, 2019, non-performing TDRs include $9.7 million and $9.8 million, respectively, in a multiple loan relationship to a South Florida borrower. |
(2) | Loans past due 90 days or more but still accruing. |
23
Loans by Credit Quality Indicators
This tables shows the Company’s loans by credit quality indicators. We have no purchased credit-impaired loans.
March 31, 2020 | December 31, 2019 | March 31, 2019 | ||||||||||||||||||||||||||||||||||||
(in thousands) | Special Mention | Substandard | Doubtful | Total (1) | Special Mention | Substandard | Doubtful | Total (1) | Special Mention | Substandard | Doubtful | Total (1) | ||||||||||||||||||||||||||
Real Estate Loans | ||||||||||||||||||||||||||||||||||||||
Commercial Real Estate (CRE) | ||||||||||||||||||||||||||||||||||||||
Non-owner occupied | $ | — | $ | 757 | $ | 1,936 | $ | 2,693 | $ | 9,324 | $ | 762 | $ | 1,936 | $ | 12,022 | $ | 8,285 | $ | — | $ | — | $ | 8,285 | ||||||||||||||
Multi-family residential | — | — | — | — | — | — | — | — | — | 665 | — | 665 | ||||||||||||||||||||||||||
Land development and construction loans | 9,852 | — | — | 9,852 | 9,955 | — | — | 9,955 | — | — | — | — | ||||||||||||||||||||||||||
9,852 | 757 | 1,936 | 12,545 | 19,279 | 762 | 1,936 | 21,977 | 8,285 | 665 | — | 8,950 | |||||||||||||||||||||||||||
Single-family residential | — | 7,082 | — | 7,082 | — | 7,291 | — | 7,291 | — | 6,514 | — | 6,514 | ||||||||||||||||||||||||||
Owner occupied | 7,190 | 14,005 | — | 21,195 | 8,138 | 14,240 | — | 22,378 | 12,767 | 8,632 | — | 21,399 | ||||||||||||||||||||||||||
17,042 | 21,844 | 1,936 | 40,822 | 27,417 | 22,293 | 1,936 | 51,646 | 21,052 | 15,811 | — | 36,863 | |||||||||||||||||||||||||||
Commercial loans | 2,587 | 9,459 | 2,643 | 14,689 | 5,569 | 8,406 | 2,669 | 16,644 | 3,992 | 9,073 | 559 | 13,624 | ||||||||||||||||||||||||||
Consumer loans and overdrafts | — | 41 | 434 | 475 | — | 67 | 357 | 424 | — | 5,944 | — | 5,944 | ||||||||||||||||||||||||||
$ | 19,629 | $ | 31,344 | $ | 5,013 | $ | 55,986 | $ | 32,986 | $ | 30,766 | $ | 4,962 | $ | 68,714 | $ | 25,044 | $ | 30,828 | $ | 559 | $ | 56,431 | |||||||||||||||
__________
(1) There were no loans categorized as “Loss” as of the dates presented.
Exhibit 7 - Deposits by Country of Domicile
This tables shows the Company’s deposits by country of domicile of the depositor as of the dates presented.
(in thousands) | March 31, 2020 | December 31, 2019 | September 30, 2019 | June 30, 2019 | March 31, 2019 | ||||||||||||||
Domestic | $ | 3,253,972 | $ | 3,121,827 | $ | 2,999,687 | $ | 3,014,269 | $ | 2,963,098 | |||||||||
Foreign: | |||||||||||||||||||
Venezuela | 2,224,353 | 2,270,970 | 2,345,938 | 2,465,718 | 2,587,879 | ||||||||||||||
Others | 363,887 | 364,346 | 347,223 | 339,394 | 337,211 | ||||||||||||||
Total foreign | 2,588,240 | 2,635,316 | 2,693,161 | 2,805,112 | 2,925,090 | ||||||||||||||
Total deposits | $ | 5,842,212 | $ | 5,757,143 | $ | 5,692,848 | $ | 5,819,381 | $ | 5,888,188 | |||||||||
24
First Quarter 2020 Financial Review Earnings Call April 28, 2020
2 Important Notices and Disclaimers Forward-Looking Statements This presentation contains “forward-looking statements” within the meaning of the Securities Act of 1933 and the Securities Exchange Act of 1934, including, without limitation, future financial and operating results; costs and revenues; economic conditions generally and in our markets and among our customer base; the challenges and uncertainties caused by the COVID-19 pandemic; the measures we have taken in response to the COVID-19 pandemic; our participation in the PPP Loan program; loan demand; changes in the mix of our earning assets and our deposit and wholesale liabilities; net interest margin; yields on earning assets; interest rates and yield curves (generally and those applicable to our assets and liabilities); credit quality, including loan performance, non-performing assets, provisions for loan losses, charge-offs, other-than-temporary impairments and collateral values; market trends; rebranding and staff realignment costs and expected savings; and customer preferences, as well as statements with respect to our objectives, expectations and intentions and other statements that are not historical facts. All statements other than statements of historical fact are statements that could be forward-looking statements. You can identify these forward- looking statements through our use of words such as “may,” “will,” “anticipate,” “assume,” “should,” “indicate,” “would,” “believe,” “contemplate,” “expect,” “estimate,” “continue,” “plan,” “point to,” “project,” “could,” “intend,” “target,” “goals,” “outlooks,” “modeled,” and other similar words and expressions of the future. Forward-looking statements, including those as to our beliefs, plans, objectives, goals, expectations, anticipations, estimates and intentions, involve known and unknown risks, uncertainties and other factors, which may be beyond our control, and which may cause the Company’s actual results, performance, achievements, or financial condition to be materially different from future results, performance, achievements, or financial condition expressed or implied by such forward-looking statements. You should not rely on any forward-looking statements as predictions of future events. You should not expect us to update any forward-looking statements. All written or oral forward-looking statements attributable to us are expressly qualified in their entirety by this cautionary notice, together with those risks and uncertainties described in “Risk factors” in our annual report on Form 10-K for the fiscal year ended December 31, 2019 and in our other filings with the U.S. Securities and Exchange Commission (the “SEC”), which are available at the SEC’s website www.sec.gov. Interim Financial Information Unaudited financial information as of and for interim periods, including as of and for the three month periods ended March 31, 2020 and 2019, may not reflect our results of operations for our fiscal year ending, or financial condition as of December 31, 2020, or any other period of time or date. Non-GAAP Financial Measures The Company supplements its financial results that are determined in accordance with accounting principles generally accepted in the United States of America (“GAAP”) with non- GAAP financial measures, such as “adjusted noninterest income”, “adjusted noninterest expense”, “adjusted net income”, “operating income”, “adjusted net income per share (basic and diluted)”, “adjusted return on assets (ROA)”, “adjusted return on equity (ROE)”, and other ratios. This supplemental information should not be considered in isolation or as a substitute for the GAAP measures presented herein. We use certain non-GAAP financial measures, including those mentioned above, both to explain our results to shareholders and the investment community and in the internal evaluation and management of our businesses. Our management believes that these non-GAAP financial measures and the information they provide are useful to investors since these measures permit investors to view our performance using the same tools that our management uses to evaluate our past performance and prospects for future performance, especially in light of the additional costs we have incurred in connection with the Company’s restructuring activities that began in 2018 and continued into 2020, the one-time gain on sale of the vacant Beacon land in the fourth quarter of 2019 and the Company’s increase of its allowance for loan losses in 2020. While we believe that these non-GAAP financial measures are useful in evaluating our performance, this information should be considered as supplemental and not as a substitute for or superior to the related financial information prepared in accordance with GAAP. Additionally, these non-GAAP financial measures may differ from similar measures presented by other companies.
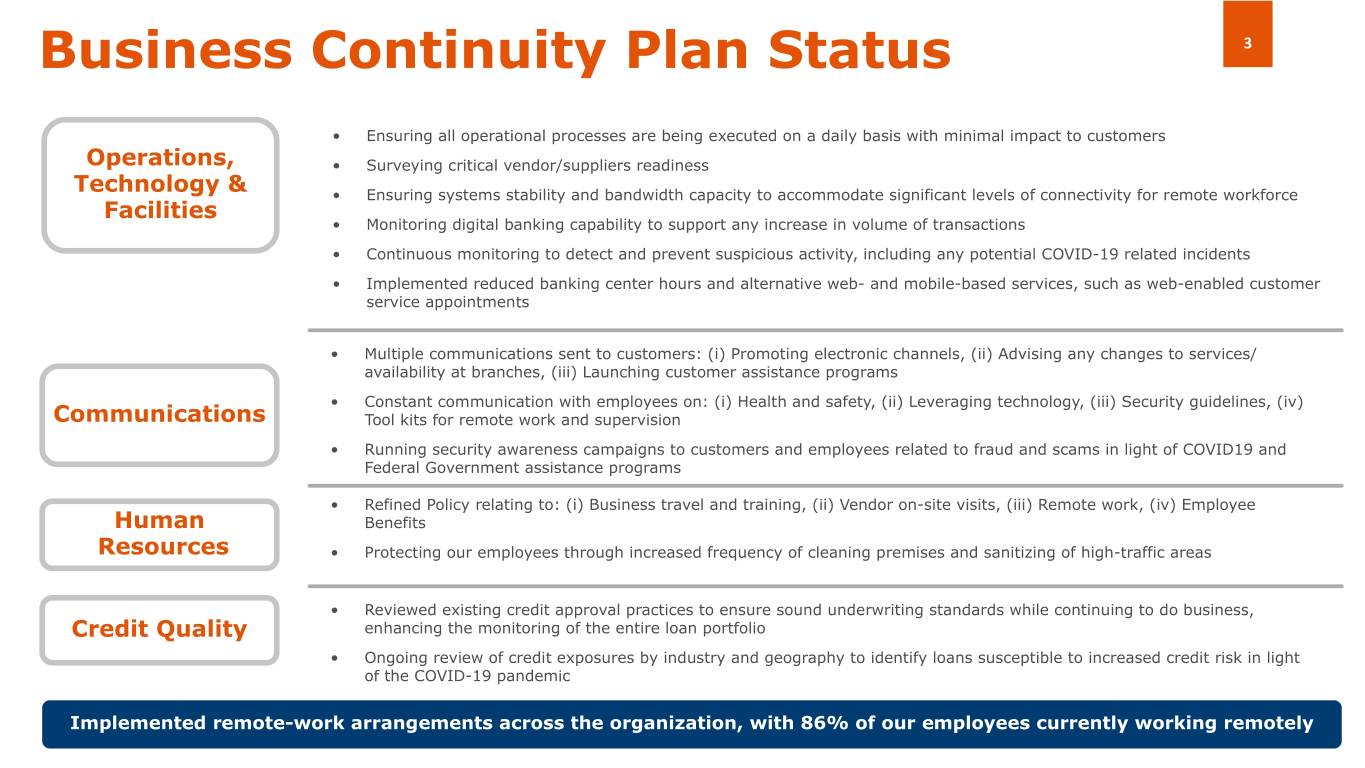
Business Continuity Plan Status 3 • Ensuring all operational processes are being executed on a daily basis with minimal impact to customers Operations, • Surveying critical vendor/suppliers readiness Technology & • Ensuring systems stability and bandwidth capacity to accommodate significant levels of connectivity for remote workforce Facilities • Monitoring digital banking capability to support any increase in volume of transactions • Continuous monitoring to detect and prevent suspicious activity, including any potential COVID-19 related incidents • Implemented reduced banking center hours and alternative web- and mobile-based services, such as web-enabled customer service appointments • Multiple communications sent to customers: (i) Promoting electronic channels, (ii) Advising any changes to services/ availability at branches, (iii) Launching customer assistance programs • Constant communication with employees on: (i) Health and safety, (ii) Leveraging technology, (iii) Security guidelines, (iv) Communications Tool kits for remote work and supervision • Running security awareness campaigns to customers and employees related to fraud and scams in light of COVID19 and Federal Government assistance programs • Refined Policy relating to: (i) Business travel and training, (ii) Vendor on-site visits, (iii) Remote work, (iv) Employee Human Benefits Resources • Protecting our employees through increased frequency of cleaning premises and sanitizing of high-traffic areas • Reviewed existing credit approval practices to ensure sound underwriting standards while continuing to do business, Credit Quality enhancing the monitoring of the entire loan portfolio • Ongoing review of credit exposures by industry and geography to identify loans susceptible to increased credit risk in light of the COVID-19 pandemic Implemented remote-work arrangements across the organization, with 86% of our employees currently working remotely
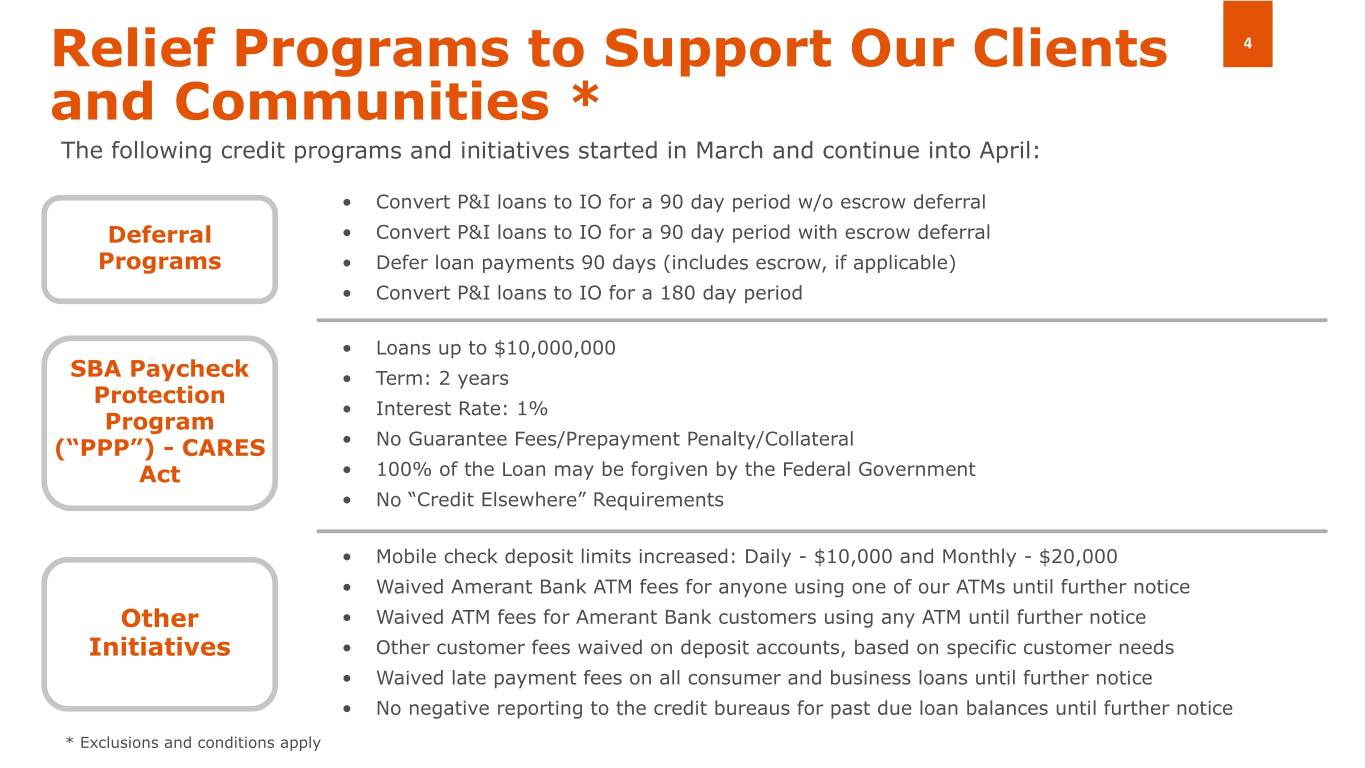
4 Relief Programs to Support Our Clients 2 and Communities * The following credit programs and initiatives started in March and continue into April: • Convert P&I loans to IO for a 90 day period w/o escrow deferral Deferral • Convert P&I loans to IO for a 90 day period with escrow deferral Programs • Defer loan payments 90 days (includes escrow, if applicable) • Convert P&I loans to IO for a 180 day period • Loans up to $10,000,000 SBA Paycheck • Term: 2 years Protection • Interest Rate: 1% Program (“PPP”) - CARES • No Guarantee Fees/Prepayment Penalty/Collateral Act • 100% of the Loan may be forgiven by the Federal Government • No “Credit Elsewhere” Requirements • Mobile check deposit limits increased: Daily - $10,000 and Monthly - $20,000 • Waived Amerant Bank ATM fees for anyone using one of our ATMs until further notice Other • Waived ATM fees for Amerant Bank customers using any ATM until further notice Initiatives • Other customer fees waived on deposit accounts, based on specific customer needs • Waived late payment fees on all consumer and business loans until further notice • No negative reporting to the credit bureaus for past due loan balances until further notice * Exclusions and conditions apply * Exclusions and conditions apply
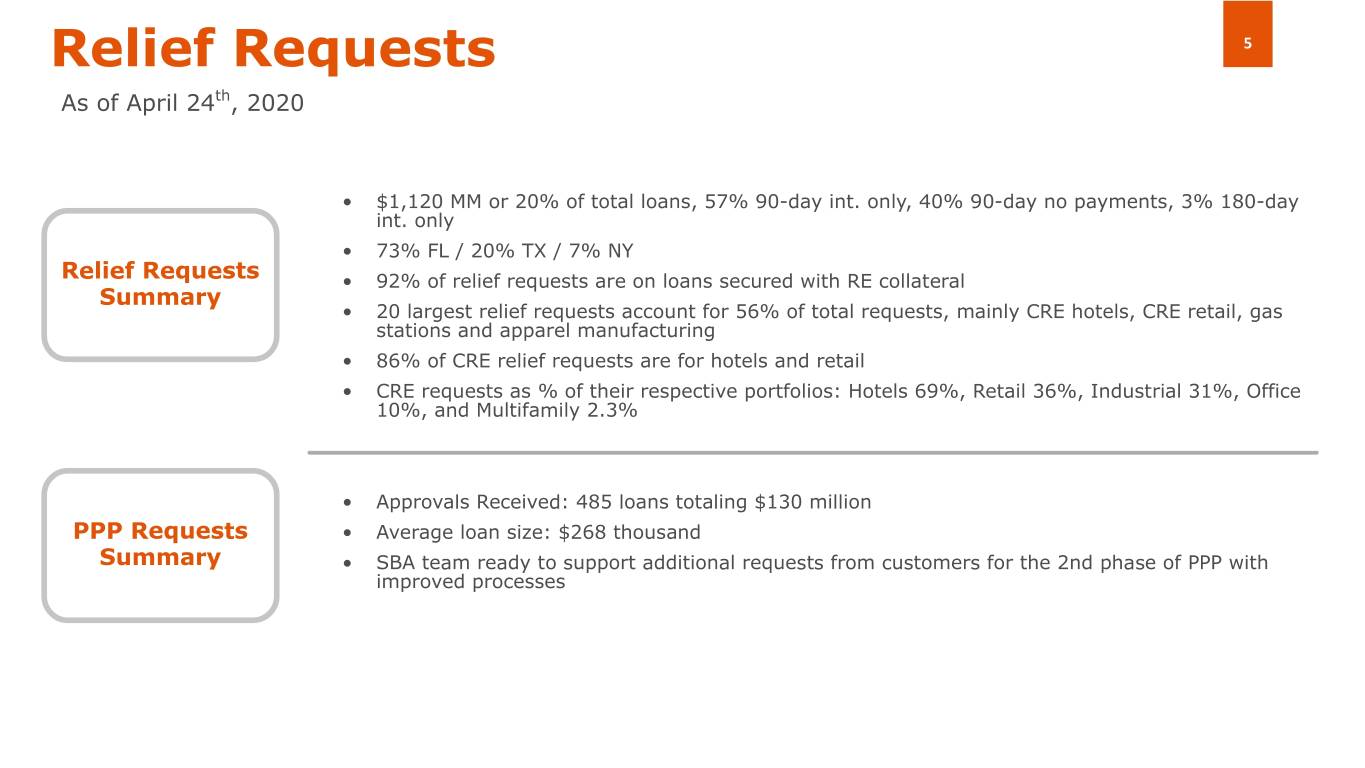
5 Relief Requests 25 As of April 24th, 2020 • $1,120 MM or 20% of total loans, 57% 90-day int. only, 40% 90-day no payments, 3% 180-day int. only • 73% FL / 20% TX / 7% NY Relief Requests • 92% of relief requests are on loans secured with RE collateral Summary • 20 largest relief requests account for 56% of total requests, mainly CRE hotels, CRE retail, gas stations and apparel manufacturing • 86% of CRE relief requests are for hotels and retail • CRE requests as % of their respective portfolios: Hotels 69%, Retail 36%, Industrial 31%, Office 10%, and Multifamily 2.3% • Approvals Received: 485 loans totaling $130 million PPP Requests • Average loan size: $268 thousand Summary • SBA team ready to support additional requests from customers for the 2nd phase of PPP with improved processes
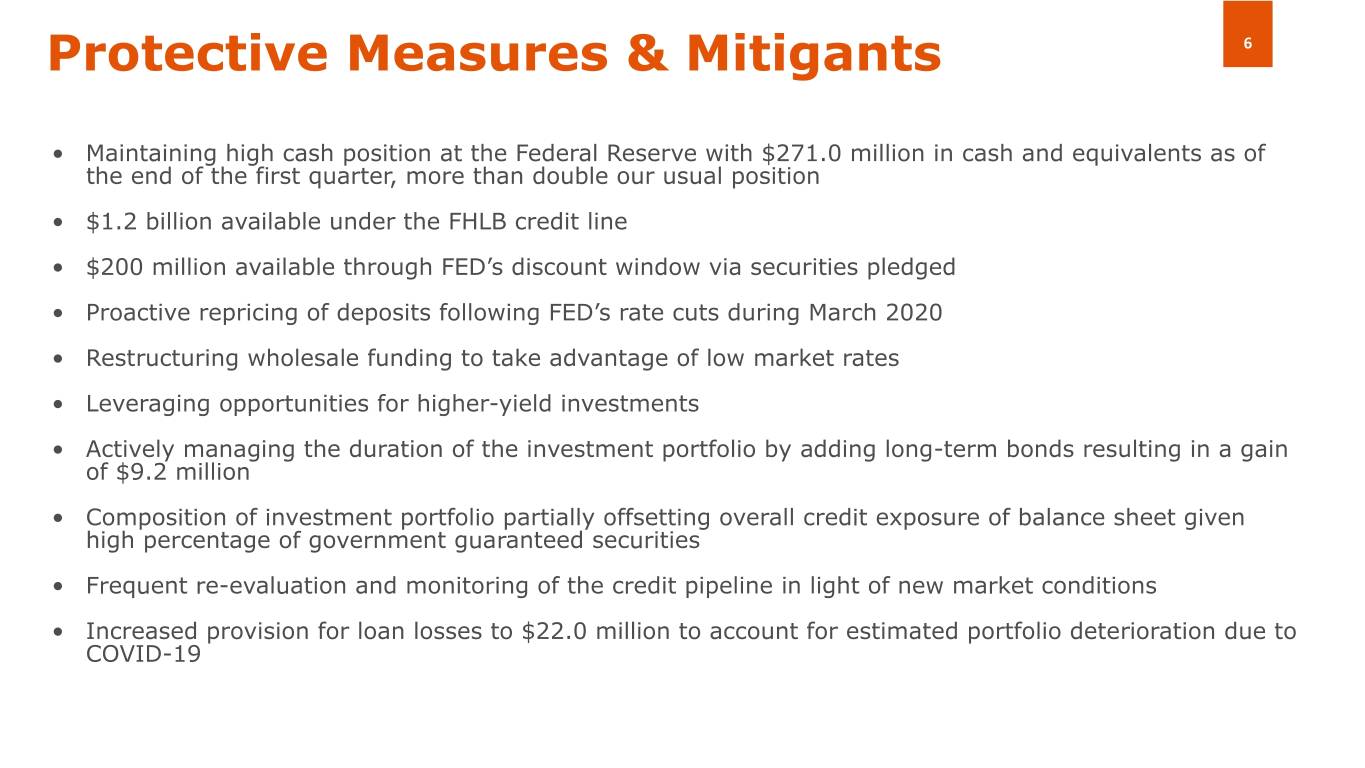
6 26 Protective Measures & Mitigants 6 • Maintaining high cash position at the Federal Reserve with $271.0 million in cash and equivalents as of the end of the first quarter, more than double our usual position • $1.2 billion available under the FHLB credit line • $200 million available through FED’s discount window via securities pledged • Proactive repricing of deposits following FED’s rate cuts during March 2020 • Restructuring wholesale funding to take advantage of low market rates • Leveraging opportunities for higher-yield investments • Actively managing the duration of the investment portfolio by adding long-term bonds resulting in a gain of $9.2 million • Composition of investment portfolio partially offsetting overall credit exposure of balance sheet given high percentage of government guaranteed securities • Frequent re-evaluation and monitoring of the credit pipeline in light of new market conditions • Increased provision for loan losses to $22.0 million to account for estimated portfolio deterioration due to COVID-19
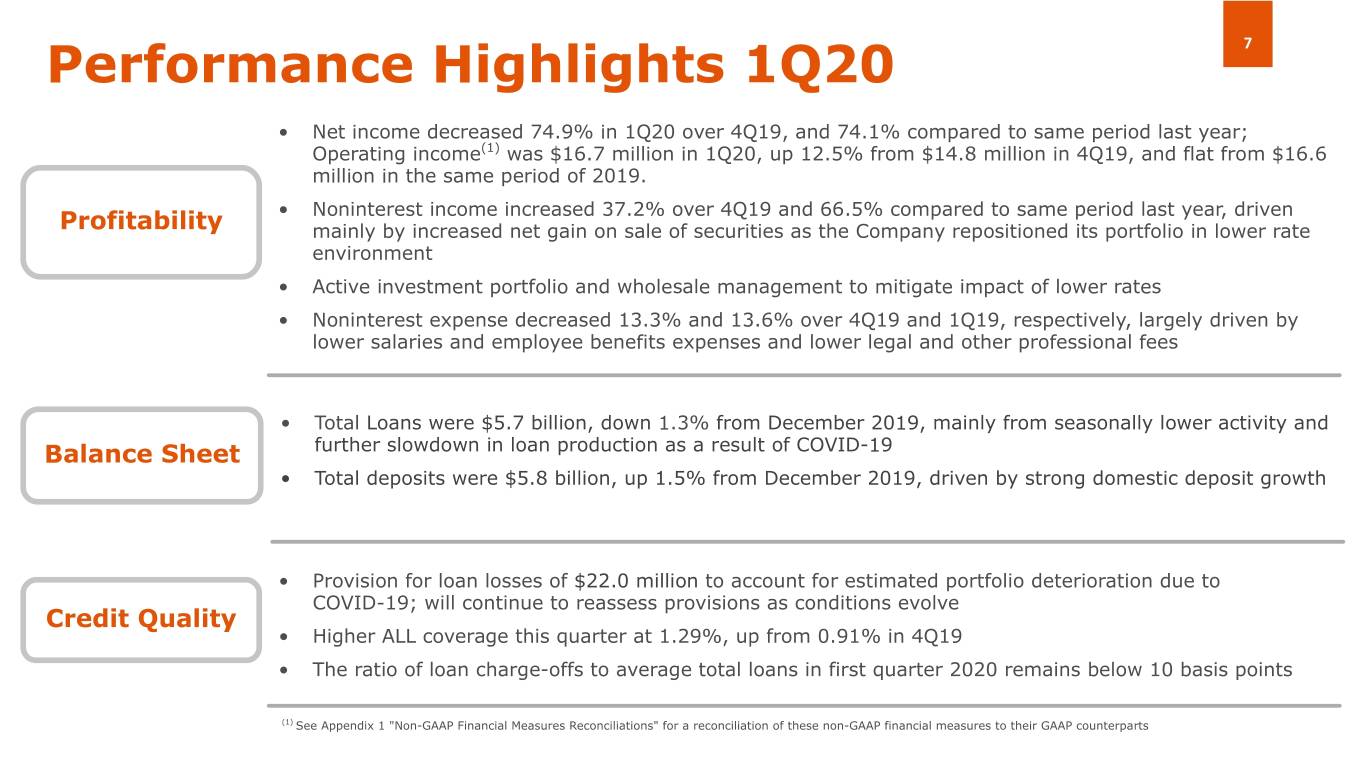
Performance Highlights 1Q20 7 • Net income decreased 74.9% in 1Q20 over 4Q19, and 74.1% compared to same period last year; Operating income(1) was $16.7 million in 1Q20, up 12.5% from $14.8 million in 4Q19, and flat from $16.6 million in the same period of 2019. • Noninterest income increased 37.2% over 4Q19 and 66.5% compared to same period last year, driven Profitability mainly by increased net gain on sale of securities as the Company repositioned its portfolio in lower rate environment • Active investment portfolio and wholesale management to mitigate impact of lower rates • Noninterest expense decreased 13.3% and 13.6% over 4Q19 and 1Q19, respectively, largely driven by lower salaries and employee benefits expenses and lower legal and other professional fees • Total Loans were $5.7 billion, down 1.3% from December 2019, mainly from seasonally lower activity and Balance Sheet further slowdown in loan production as a result of COVID-19 • Total deposits were $5.8 billion, up 1.5% from December 2019, driven by strong domestic deposit growth • Provision for loan losses of $22.0 million to account for estimated portfolio deterioration due to COVID-19; will continue to reassess provisions as conditions evolve Credit Quality • Higher ALL coverage this quarter at 1.29%, up from 0.91% in 4Q19 • The ratio of loan charge-offs to average total loans in first quarter 2020 remains below 10 basis points (1) See Appendix 1 "Non-GAAP Financial Measures Reconciliations" for a reconciliation of these non-GAAP financial measures to their GAAP counterparts
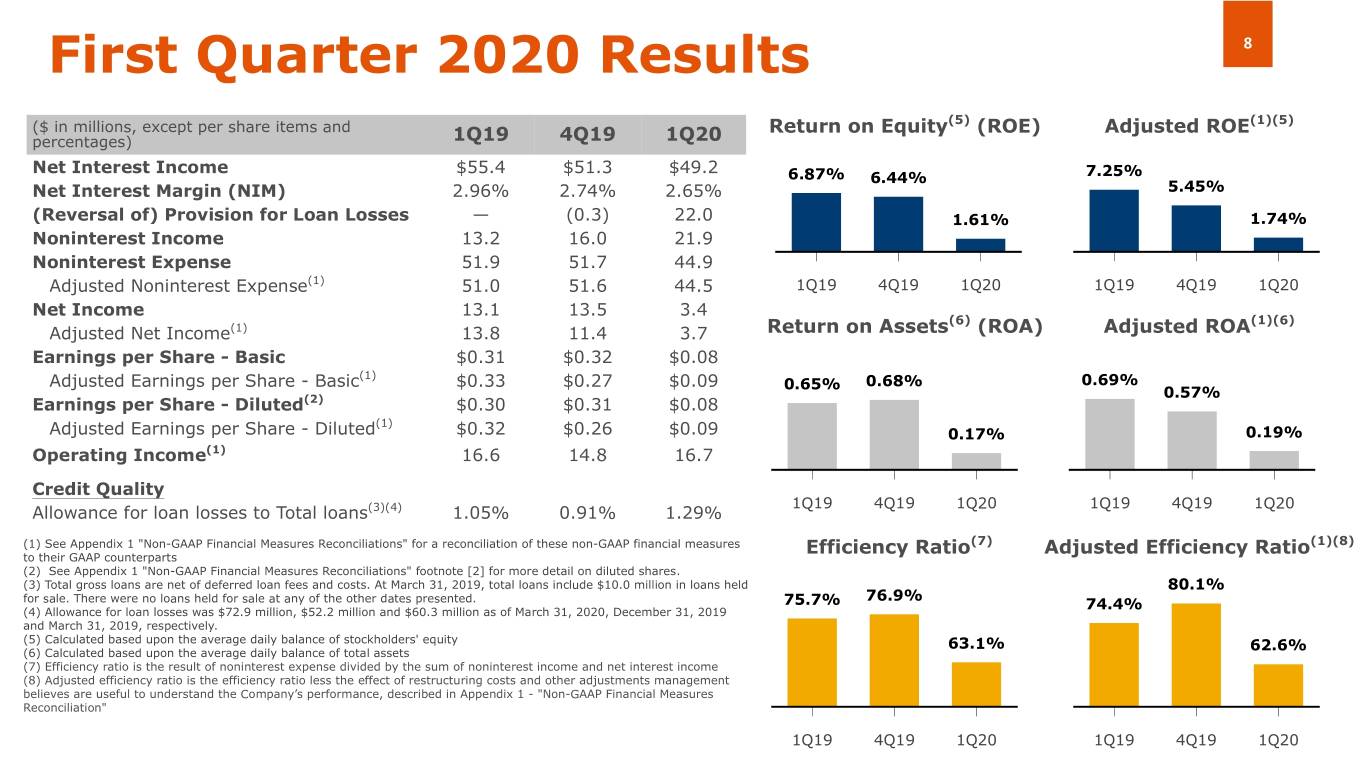
First Quarter 2020 Results 8 ($ in millions, except per share items and Return on Equity(5) (ROE) Adjusted ROE(1)(5) percentages) 1Q19 4Q19 1Q20 Net Interest Income $55.4 $51.3 $49.2 6.87% 6.44% 7.25% Net Interest Margin (NIM) 2.96% 2.74% 2.65% 5.45% (Reversal of) Provision for Loan Losses — (0.3) 22.0 1.61% 1.74% Noninterest Income 13.2 16.0 21.9 Noninterest Expense 51.9 51.7 44.9 Adjusted Noninterest Expense(1) 51.0 51.6 44.5 1Q19 4Q19 1Q20 1Q19 4Q19 1Q20 Net Income 13.1 13.5 3.4 (6) (1)(6) Adjusted Net Income(1) 13.8 11.4 3.7 Return on Assets (ROA) Adjusted ROA Earnings per Share - Basic $0.31 $0.32 $0.08 (1) Adjusted Earnings per Share - Basic $0.33 $0.27 $0.09 0.65% 0.68% 0.69% 0.57% Earnings per Share - Diluted(2) $0.30 $0.31 $0.08 (1) Adjusted Earnings per Share - Diluted $0.32 $0.26 $0.09 0.17% 0.19% Operating Income(1) 16.6 14.8 16.7 Credit Quality 1Q19 4Q19 1Q20 1Q19 4Q19 1Q20 Allowance for loan losses to Total loans(3)(4) 1.05% 0.91% 1.29% (1) See Appendix 1 "Non-GAAP Financial Measures Reconciliations" for a reconciliation of these non-GAAP financial measures Efficiency Ratio(7) Adjusted Efficiency Ratio(1)(8) to their GAAP counterparts (2) See Appendix 1 "Non-GAAP Financial Measures Reconciliations" footnote [2] for more detail on diluted shares. (3) Total gross loans are net of deferred loan fees and costs. At March 31, 2019, total loans include $10.0 million in loans held 80.1% 76.9% for sale. There were no loans held for sale at any of the other dates presented. 75.7% 74.4% (4) Allowance for loan losses was $72.9 million, $52.2 million and $60.3 million as of March 31, 2020, December 31, 2019 and March 31, 2019, respectively. (5) Calculated based upon the average daily balance of stockholders' equity 63.1% 62.6% (6) Calculated based upon the average daily balance of total assets (7) Efficiency ratio is the result of noninterest expense divided by the sum of noninterest income and net interest income (8) Adjusted efficiency ratio is the efficiency ratio less the effect of restructuring costs and other adjustments management believes are useful to understand the Company’s performance, described in Appendix 1 - "Non-GAAP Financial Measures Reconciliation" 1Q19 4Q19 1Q20 1Q19 4Q19 1Q20
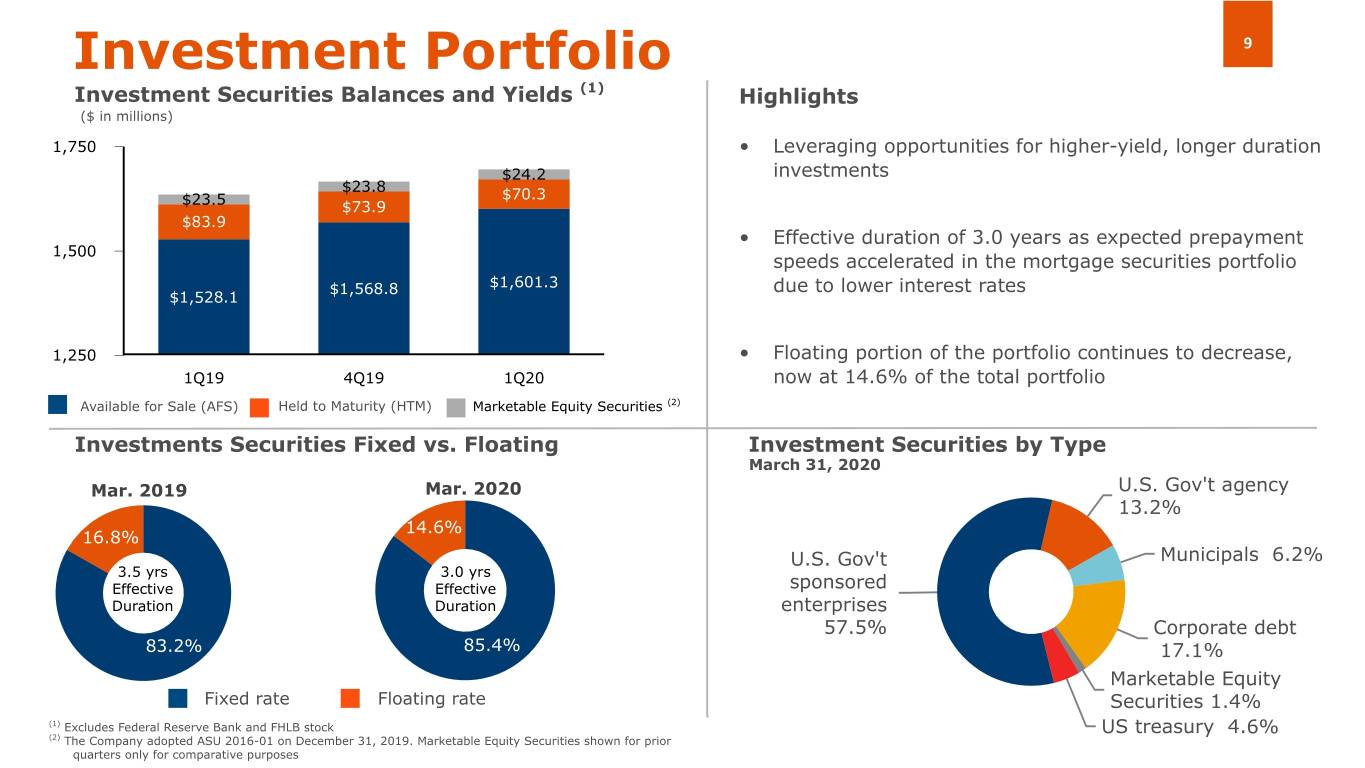
Investment Portfolio 9 Investment Securities Balances and Yields (1) Highlights ($ in millions) 1,750 • Leveraging opportunities for higher-yield, longer duration $24.2 investments $23.8 $70.3 $23.5 $73.9 $83.9 • Effective duration of 3.0 years as expected prepayment 1,500 speeds accelerated in the mortgage securities portfolio $1,568.8 $1,601.3 due to lower interest rates $1,528.1 1,250 • Floating portion of the portfolio continues to decrease, 1Q19 4Q19 1Q20 now at 14.6% of the total portfolio Available for Sale (AFS) Held to Maturity (HTM) Marketable Equity Securities (2) Investments Securities Fixed vs. Floating Investment Securities by Type March 31, 2020 Mar. 2019 Mar. 2020 U.S. Gov't agency 13.2% 14.6% 16.8% U.S. Gov't Municipals 6.2% 3.5 yrs 3.0 yrs Effective Effective sponsored Duration Duration enterprises 57.5% Corporate debt 83.2% 85.4% 17.1% Marketable Equity Fixed rate Floating rate Securities 1.4% (1) Excludes Federal Reserve Bank and FHLB stock US treasury 4.6% (2) The Company adopted ASU 2016-01 on December 31, 2019. Marketable Equity Securities shown for prior quarters only for comparative purposes
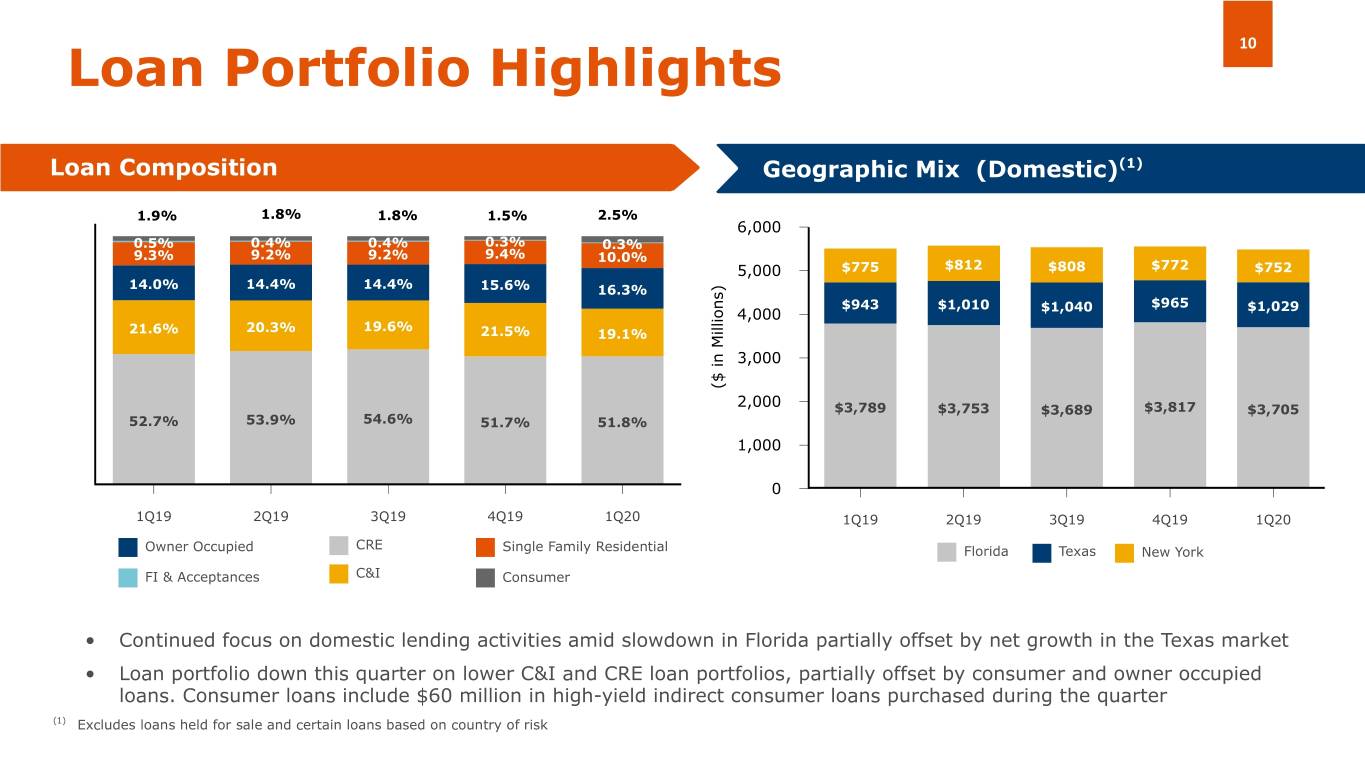
10 Loan Portfolio Highlights (1) Loan Composition Geographic Mix (Domestic) (Domestic) 1.9% 1.8% 1.8% 1.5% 2.5% 6,000 0.5% 0.4% 0.4% 0.3% 0.3% 9.3% 9.2% 9.2% 9.4% 10.0% 5,000 $775 $812 $808 $772 $752 14.0% 14.4% 14.4% 15.6% 16.3% $943 $1,010 $965 $1,029 4,000 $1,040 20.3% 19.6% 21.6% 21.5% 19.1% 3,000 ($ in Millions) 2,000 $3,789 $3,753 $3,689 $3,817 $3,705 52.7% 53.9% 54.6% 51.7% 51.8% 1,000 0 1Q19 2Q19 3Q19 4Q19 1Q20 1Q19 2Q19 3Q19 4Q19 1Q20 CRE Owner Occupied Single Family Residential Florida Texas New York FI & Acceptances C&I Consumer • Continued focus on domestic lending activities amid slowdown in Florida partially offset by net growth in the Texas market • Loan portfolio down this quarter on lower C&I and CRE loan portfolios, partially offset by consumer and owner occupied loans. Consumer loans include $60 million in high-yield indirect consumer loans purchased during the quarter (1) Excludes loans held for sale and certain loans based on country of risk
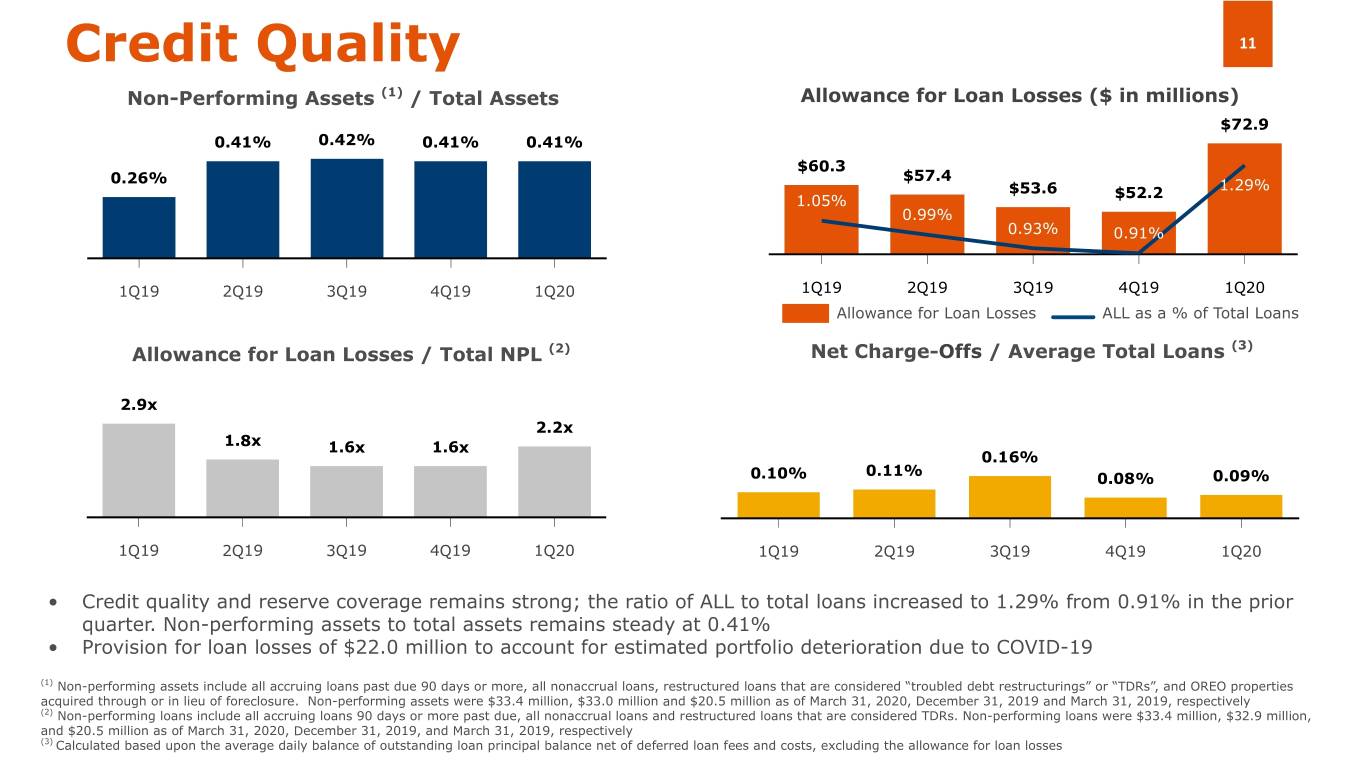
Credit Quality 11 Non-Performing Assets (1) / Total Assets Allowance for Loan Losses ($ in millions) $72.9 0.41% 0.42% 0.41% 0.41% $60.3 $57.4 0.26% 1.29% $53.6 $52.2 1.05% 0.99% 0.93% 0.91% 1Q19 2Q19 3Q19 4Q19 1Q20 1Q19 2Q19 3Q19 4Q19 1Q20 Allowance for Loan Losses ALL as a % of Total Loans (3) Allowance for Loan Losses / Total NPL (2) Net Charge-Offs / Average Total Loans 2.9x 2.2x 1.8x 1.6x 1.6x 0.16% 0.11% 0.10% 0.08% 0.09% 1Q19 2Q19 3Q19 4Q19 1Q20 1Q19 2Q19 3Q19 4Q19 1Q20 • Credit quality and reserve coverage remains strong; the ratio of ALL to total loans increased to 1.29% from 0.91% in the prior quarter. Non-performing assets to total assets remains steady at 0.41% • Provision for loan losses of $22.0 million to account for estimated portfolio deterioration due to COVID-19 (1) Non-performing assets include all accruing loans past due 90 days or more, all nonaccrual loans, restructured loans that are considered “troubled debt restructurings” or “TDRs”, and OREO properties acquired through or in lieu of foreclosure. Non-performing assets were $33.4 million, $33.0 million and $20.5 million as of March 31, 2020, December 31, 2019 and March 31, 2019, respectively (2) Non-performing loans include all accruing loans 90 days or more past due, all nonaccrual loans and restructured loans that are considered TDRs. Non-performing loans were $33.4 million, $32.9 million, and $20.5 million as of March 31, 2020, December 31, 2019, and March 31, 2019, respectively (3) Calculated based upon the average daily balance of outstanding loan principal balance net of deferred loan fees and costs, excluding the allowance for loan losses
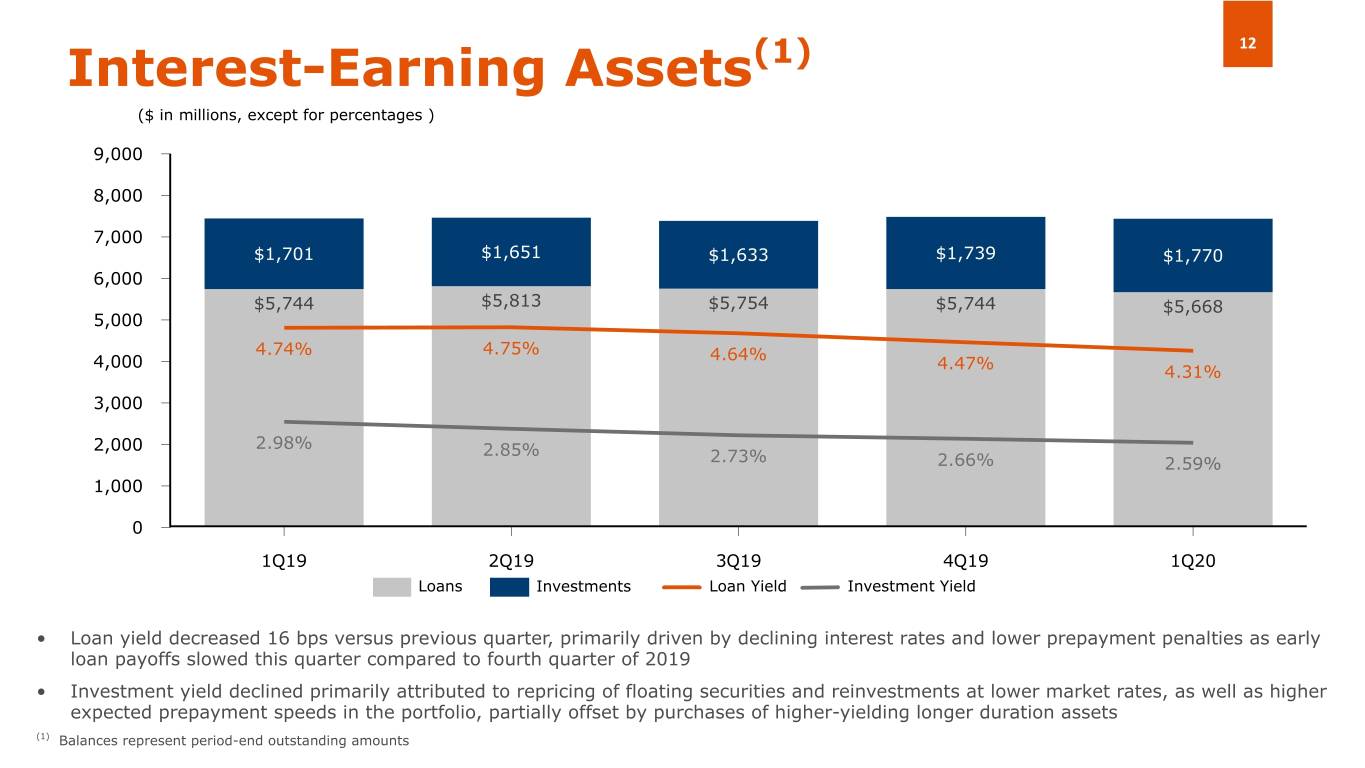
12 Interest-Earning Assets(1) ($ in millions, except for percentages ) 9,000 8,000 7,000 $1,701 $1,651 $1,633 $1,739 $1,770 6,000 $5,744 $5,813 $5,754 $5,744 $5,668 5,000 4.74% 4.75% 4.64% 4,000 4.47% 4.31% 3,000 2,000 2.98% 2.85% 2.73% 2.66% 2.59% 1,000 0 1Q19 2Q19 3Q19 4Q19 1Q20 Loans Investments Loan Yield Investment Yield • Loan yield decreased 16 bps versus previous quarter, primarily driven by declining interest rates and lower prepayment penalties as early loan payoffs slowed this quarter compared to fourth quarter of 2019 • Investment yield declined primarily attributed to repricing of floating securities and reinvestments at lower market rates, as well as higher expected prepayment speeds in the portfolio, partially offset by purchases of higher-yielding longer duration assets (1) Balances represent period-end outstanding amounts
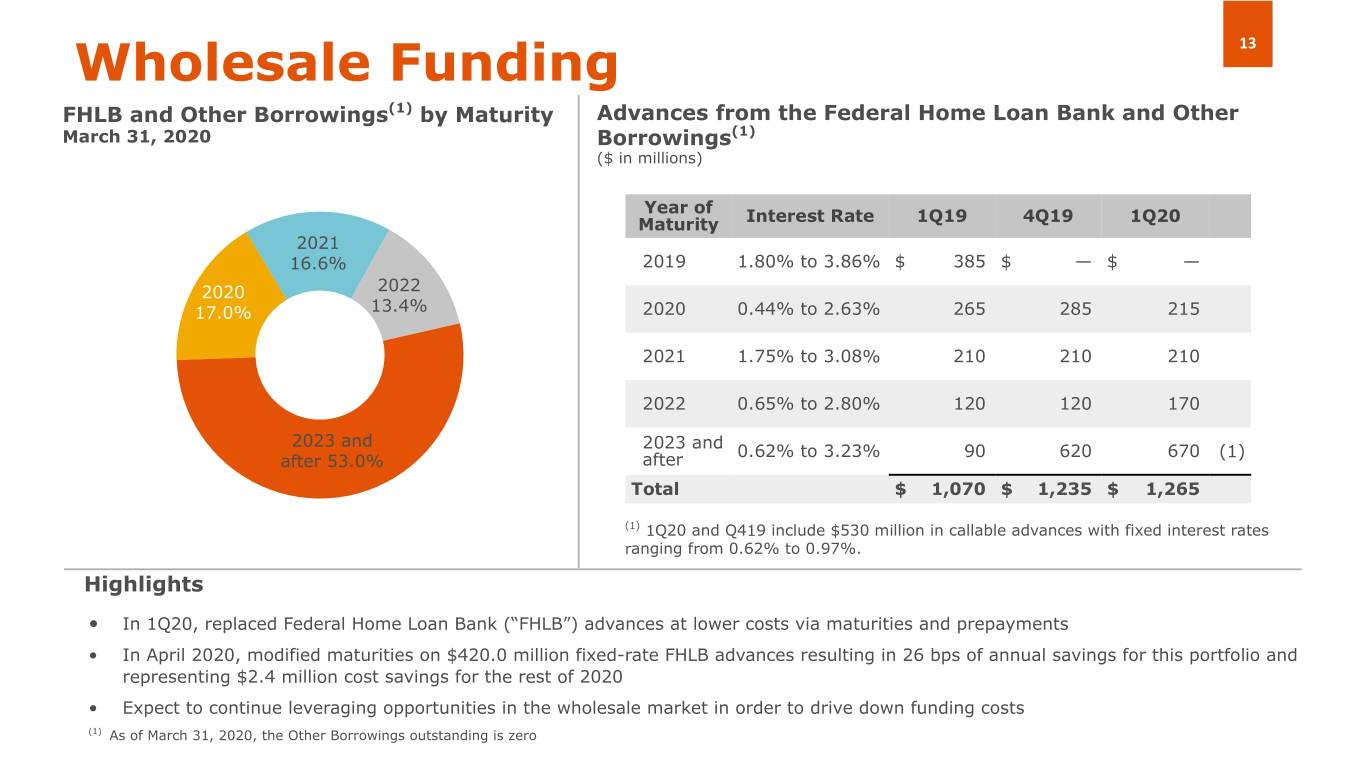
Wholesale Funding 13 FHLB and Other Borrowings(1) by Maturity Advances from the Federal Home Loan Bank and Other March 31, 2020 Borrowings(1) ($ in millions) Year of Maturity Interest Rate 1Q19 4Q19 1Q20 2021 16.6% 2019 1.80% to 3.86% $ 385 $ — $ — 2020 2022 17.0% 13.4% 2020 0.44% to 2.63% 265 285 215 2021 1.75% to 3.08% 210 210 210 2022 0.65% to 2.80% 120 120 170 2023 and 2023 and 0.62% to 3.23% 90 620 670 (1) after 53.0% after Total $ 1,070 $ 1,235 $ 1,265 (1) 1Q20 and Q419 include $530 million in callable advances with fixed interest rates ranging from 0.62% to 0.97%. Highlights • In 1Q20, replaced Federal Home Loan Bank (“FHLB”) advances at lower costs via maturities and prepayments • In April 2020, modified maturities on $420.0 million fixed-rate FHLB advances resulting in 26 bps of annual savings for this portfolio and representing $2.4 million cost savings for the rest of 2020 • Expect to continue leveraging opportunities in the wholesale market in order to drive down funding costs (1) As of March 31, 2020, the Other Borrowings outstanding is zero
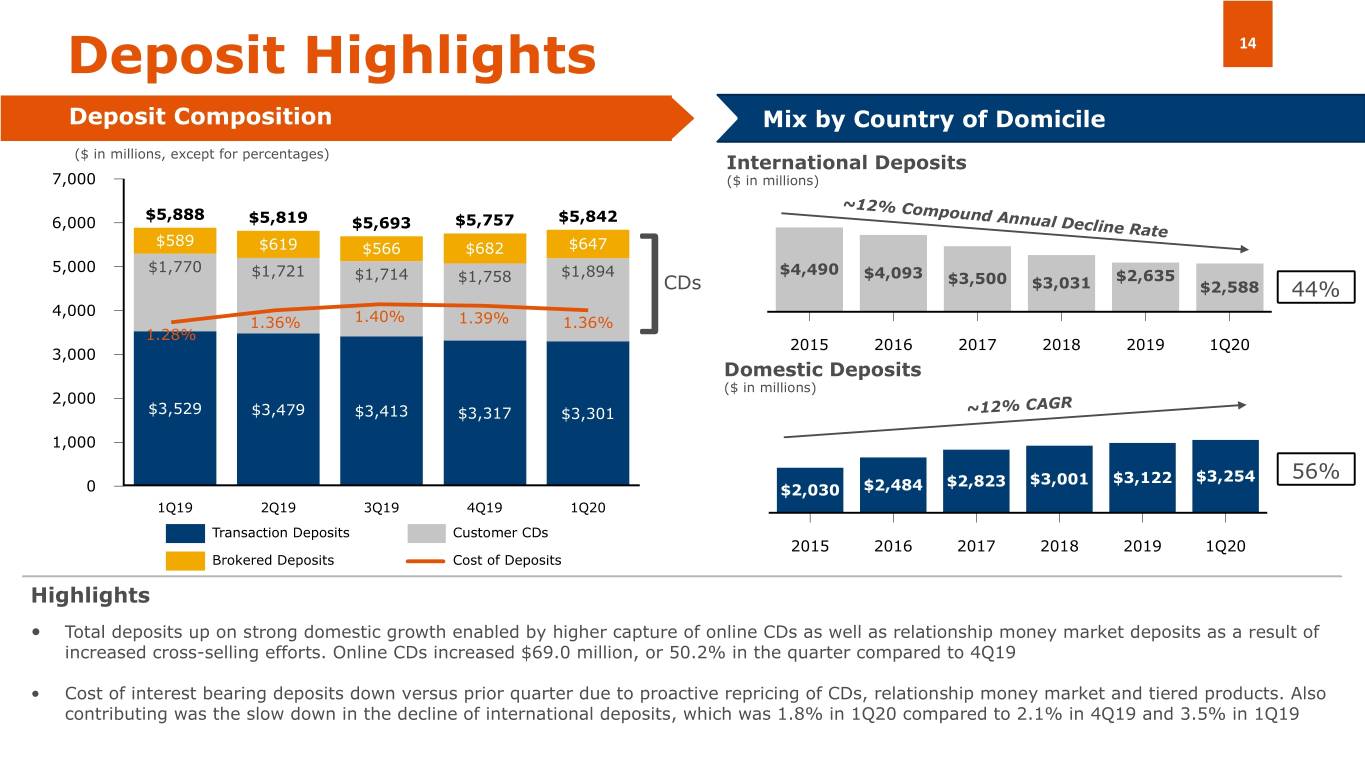
Deposit Highlights 14 Deposit Composition Mix by Country of Domicile ($ in millions, except for percentages) International Deposits 7,000 ($ in millions) ~12% Compound Annual Decline Rate $5,888 6,000 $5,819 $5,693 $5,757 $5,842 $589 $619 $566 $682 $647 5,000 $1,770 $4,490 $1,721 $1,714 $1,758 $1,894 $4,093 $3,500 $2,635 CDs $3,031 $2,588 44% 4,000 1.36% 1.40% 1.39% 1.36% 1.28% ] 2015 2016 2017 2018 2019 1Q20 3,000 Domestic Deposits ($ in millions) 2,000 $3,529 $3,479 $3,413 $3,317 $3,301 ~12% CAGR 1,000 $2,823 $3,001 $3,122 $3,254 56% 0 $2,030 $2,484 1Q19 2Q19 3Q19 4Q19 1Q20 Transaction Deposits Customer CDs 2015 2016 2017 2018 2019 1Q20 Brokered Deposits Cost of Deposits Highlights • Total deposits up on strong domestic growth enabled by higher capture of online CDs as well as relationship money market deposits as a result of increased cross-selling efforts. Online CDs increased $69.0 million, or 50.2% in the quarter compared to 4Q19 • Cost of interest bearing deposits down versus prior quarter due to proactive repricing of CDs, relationship money market and tiered products. Also contributing was the slow down in the decline of international deposits, which was 1.8% in 1Q20 compared to 2.1% in 4Q19 and 3.5% in 1Q19
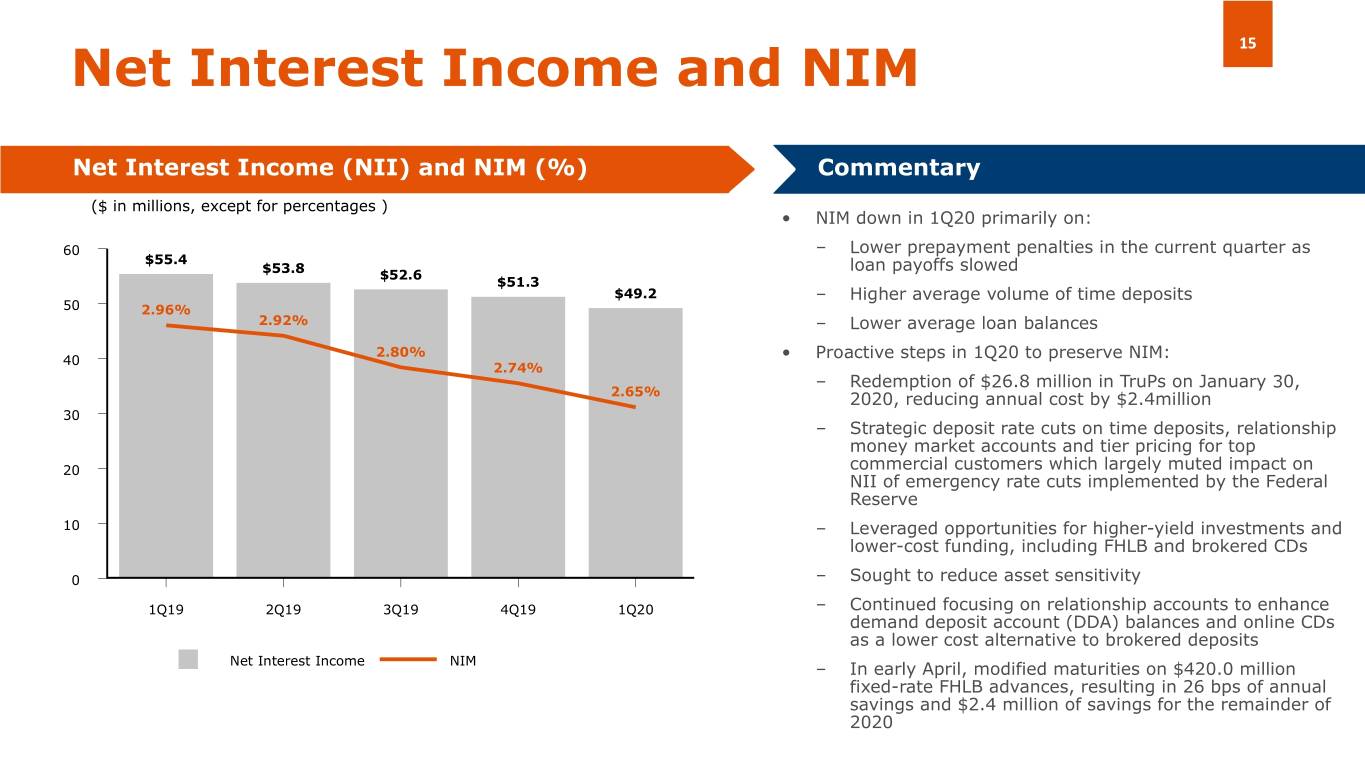
15 Net Interest Income and NIM Net Interest Income (NII) and NIM (%) Commentary ($ in millions, except for percentages ) • NIM down in 1Q20 primarily on: 60 – Lower prepayment penalties in the current quarter as $55.4 loan payoffs slowed $53.8 $52.6 $51.3 $49.2 – Higher average volume of time deposits 50 2.96% 2.92% – Lower average loan balances 2.80% 40 • Proactive steps in 1Q20 to preserve NIM: 2.74% – Redemption of $26.8 million in TruPs on January 30, 2.65% 2020, reducing annual cost by $2.4million 30 – Strategic deposit rate cuts on time deposits, relationship money market accounts and tier pricing for top 20 commercial customers which largely muted impact on NII of emergency rate cuts implemented by the Federal Reserve 10 – Leveraged opportunities for higher-yield investments and lower-cost funding, including FHLB and brokered CDs 0 – Sought to reduce asset sensitivity 1Q19 2Q19 3Q19 4Q19 1Q20 – Continued focusing on relationship accounts to enhance demand deposit account (DDA) balances and online CDs as a lower cost alternative to brokered deposits Net Interest Income NIM – In early April, modified maturities on $420.0 million fixed-rate FHLB advances, resulting in 26 bps of annual savings and $2.4 million of savings for the remainder of 2020
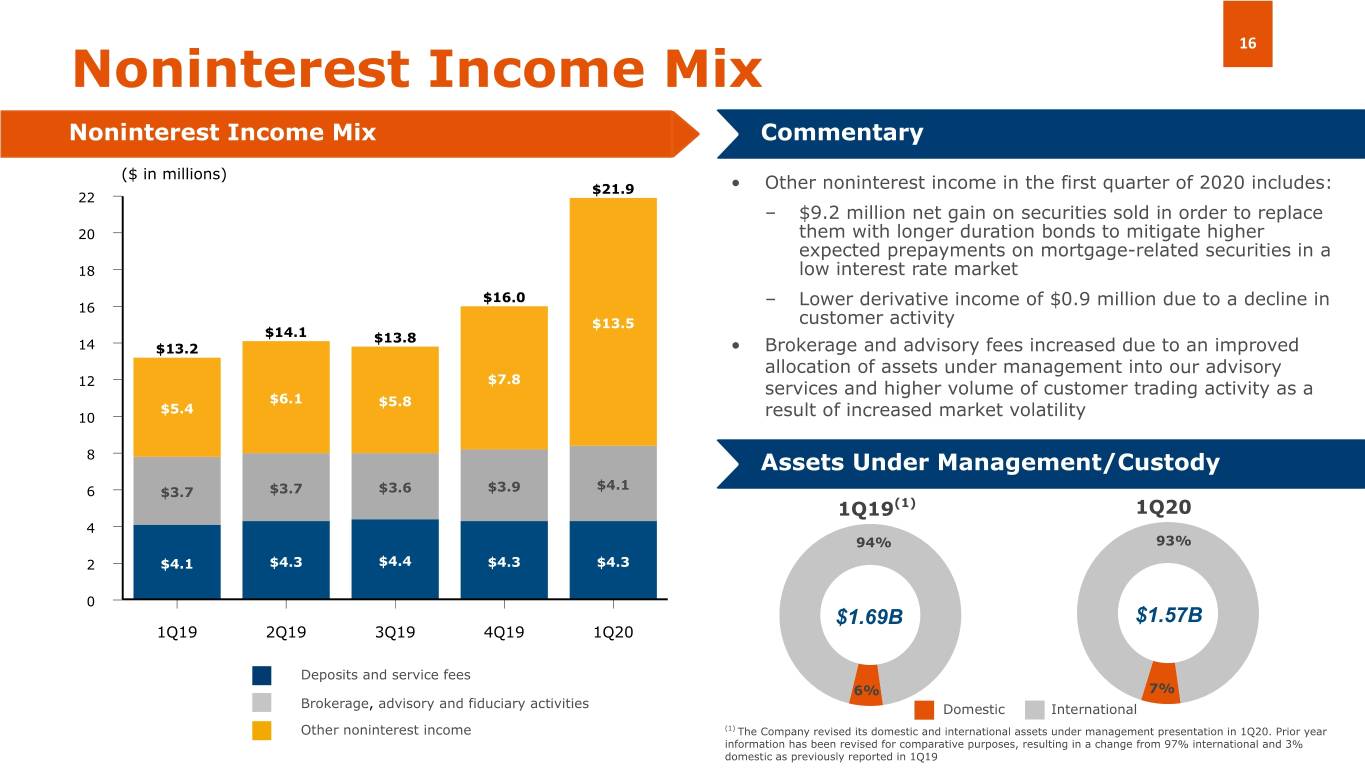
16 Noninterest Income Mix Noninterest Income Mix Commentary ($ in millions) $21.9 • Other noninterest income in the first quarter of 2020 includes: 22 – $9.2 million net gain on securities sold in order to replace 20 them with longer duration bonds to mitigate higher expected prepayments on mortgage-related securities in a 18 low interest rate market $16.0 16 – Lower derivative income of $0.9 million due to a decline in $13.5 customer activity $14.1 $13.8 14 $13.2 • Brokerage and advisory fees increased due to an improved allocation of assets under management into our advisory 12 $7.8 services and higher volume of customer trading activity as a $6.1 $5.8 $5.4 10 result of increased market volatility 8 Assets Under Management/Custody $4.1 6 $3.7 $3.7 $3.6 $3.9 1Q19(1) 1Q20 4 94% 93% 2 $4.1 $4.3 $4.4 $4.3 $4.3 0 $1.69B $1.57B 1Q19 2Q19 3Q19 4Q19 1Q20 Deposits and service fees 6% 7% Brokerage, advisory and fiduciary activities Domestic International Other noninterest income (1) The Company revised its domestic and international assets under management presentation in 1Q20. Prior year information has been revised for comparative purposes, resulting in a change from 97% international and 3% domestic as previously reported in 1Q19
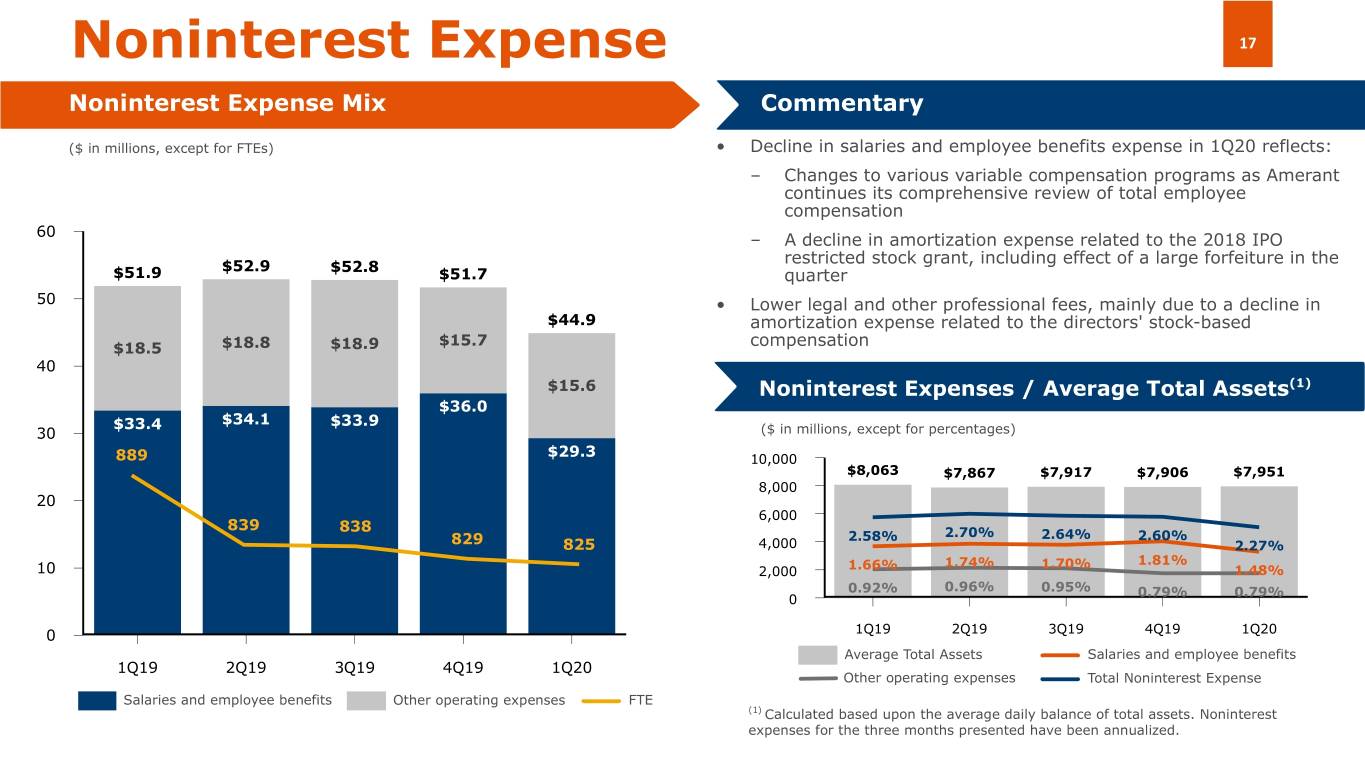
Noninterest Expense 17 Noninterest Expense Mix Commentary ($ in millions, except for FTEs) • Decline in salaries and employee benefits expense in 1Q20 reflects: – Changes to various variable compensation programs as Amerant continues its comprehensive review of total employee compensation 60 – A decline in amortization expense related to the 2018 IPO restricted stock grant, including effect of a large forfeiture in the $52.9 $52.8 $51.9 $51.7 quarter 50 • Lower legal and other professional fees, mainly due to a decline in $44.9 amortization expense related to the directors' stock-based $15.7 $18.5 $18.8 $18.9 compensation 40 $15.6 Noninterest Expenses / Average Total Assets(1) $36.0 $33.4 $34.1 $33.9 30 ($ in millions, except for percentages) $29.3 889 10,000 $8,063 $7,867 $7,917 $7,906 $7,951 8,000 20 6,000 839 838 2.58% 2.70% 2.64% 2.60% 829 825 4,000 2.27% 1.74% 1.70% 1.81% 10 2,000 1.66% 1.48% 0.92% 0.96% 0.95% 0.79% 0.79% 0 0 1Q19 2Q19 3Q19 4Q19 1Q20 Average Total Assets Salaries and employee benefits 1Q19 2Q19 3Q19 4Q19 1Q20 Other operating expenses Total Noninterest Expense Salaries and employee benefits Other operating expenses FTE (1) Calculated based upon the average daily balance of total assets. Noninterest expenses for the three months presented have been annualized.
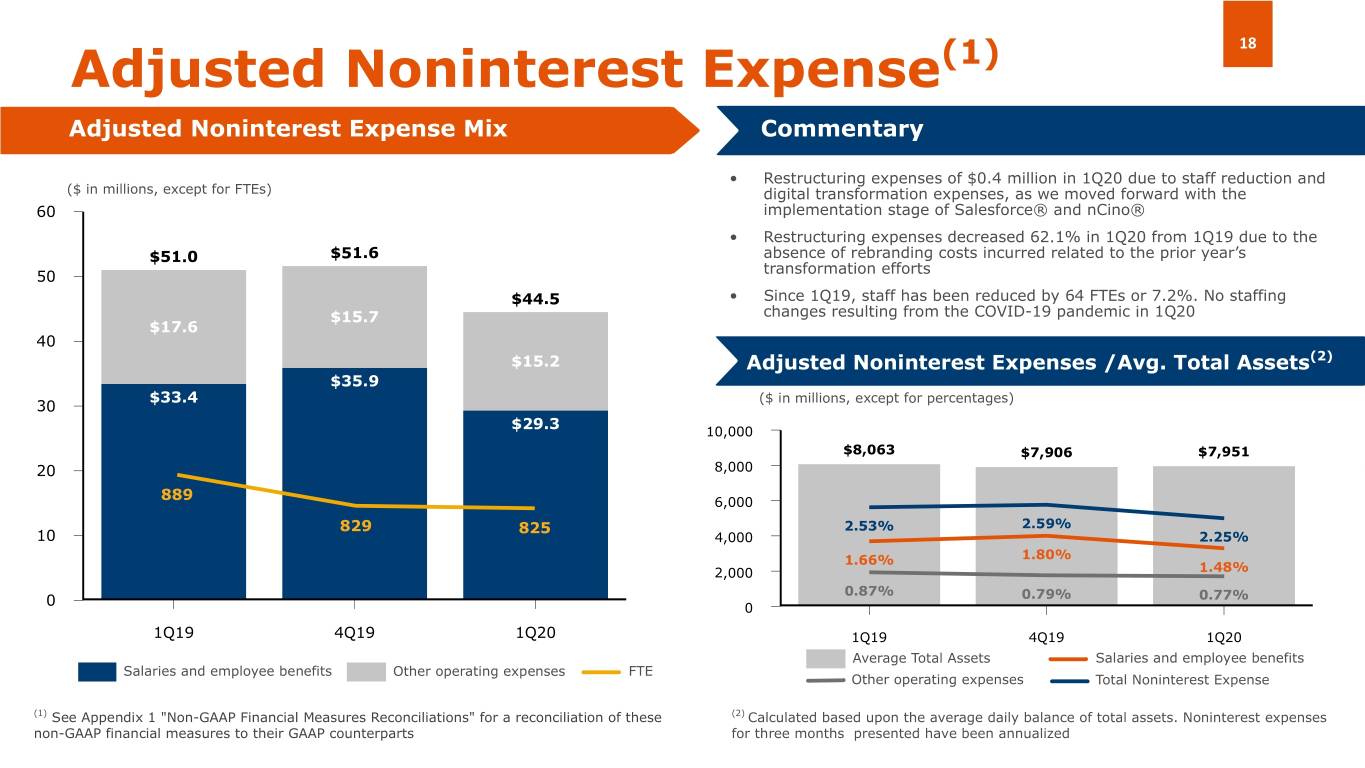
18 Adjusted Noninterest Expense(1) Adjusted Noninterest Expense Mix Commentary • Restructuring expenses of $0.4 million in 1Q20 due to staff reduction and ($ in millions, except for FTEs) digital transformation expenses, as we moved forward with the 60 implementation stage of Salesforce® and nCino® • Restructuring expenses decreased 62.1% in 1Q20 from 1Q19 due to the $51.0 $51.6 absence of rebranding costs incurred related to the prior year’s transformation efforts 50 $44.5 • Since 1Q19, staff has been reduced by 64 FTEs or 7.2%. No staffing $15.7 changes resulting from the COVID-19 pandemic in 1Q20 $17.6 40 $15.2 Adjusted Noninterest Expenses /Avg. Total Assets(2) $35.9 $33.4 ($ in millions, except for percentages) 30 $29.3 10,000 $8,063 $7,906 $7,951 20 8,000 889 6,000 829 825 2.53% 2.59% 10 4,000 2.25% 1.66% 1.80% 2,000 1.48% 0.87% 0.79% 0.77% 0 0 1Q19 4Q19 1Q20 1Q19 4Q19 1Q20 Average Total Assets Salaries and employee benefits Salaries and employee benefits Other operating expenses FTE Other operating expenses Total Noninterest Expense (1) See Appendix 1 "Non-GAAP Financial Measures Reconciliations" for a reconciliation of these (2) Calculated based upon the average daily balance of total assets. Noninterest expenses non-GAAP financial measures to their GAAP counterparts for three months presented have been annualized
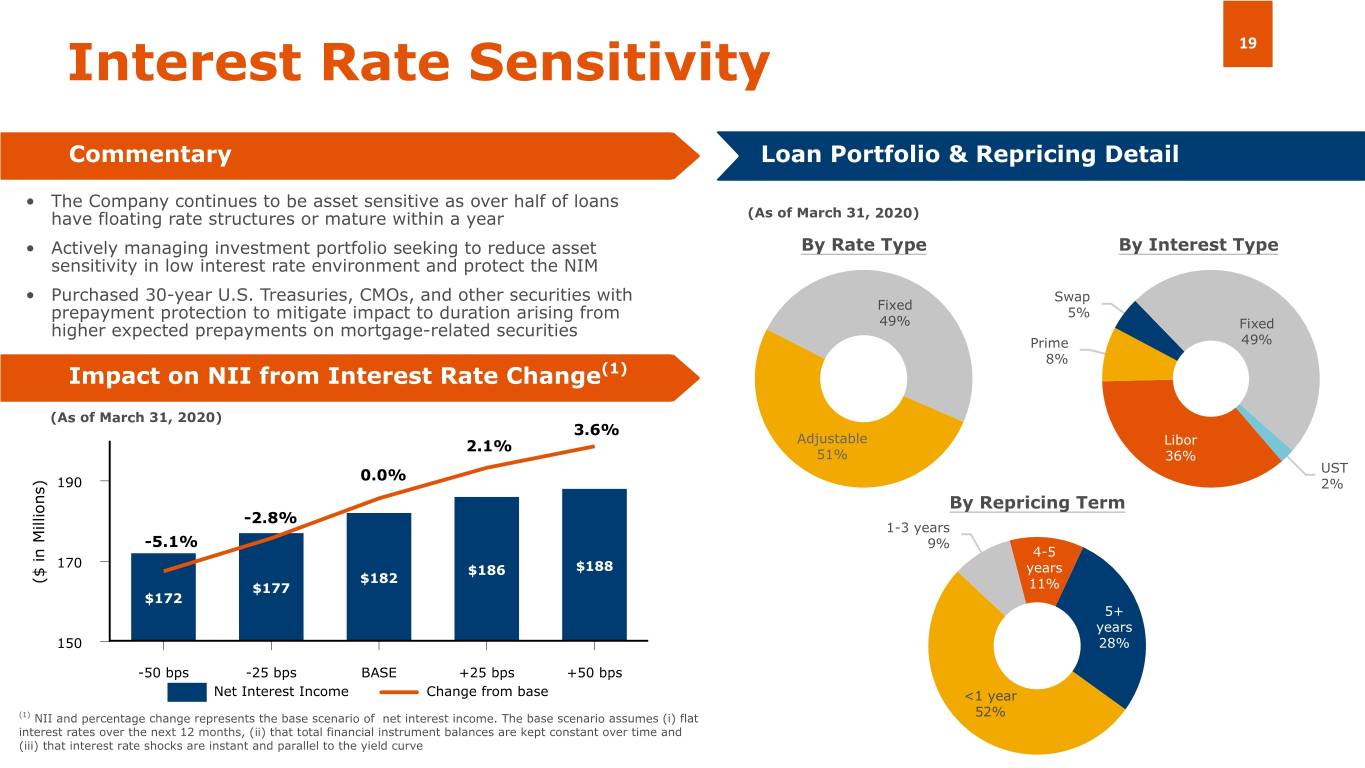
Interest Rate Sensitivity 19 Commentary Loan Portfolio & Repricing Detail • The Company continues to be asset sensitive as over half of loans have floating rate structures or mature within a year (As of March 31, 2020) • Actively managing investment portfolio seeking to reduce asset By Rate Type By Interest Type sensitivity in low interest rate environment and protect the NIM • Purchased 30-year U.S. Treasuries, CMOs, and other securities with Swap Fixed 5% prepayment protection to mitigate impact to duration arising from 49% higher expected prepayments on mortgage-related securities Fixed Prime 49% 8% Impact on NII from Interest Rate Change(1) (As of March 31, 2020) 3.6% 2.1% Adjustable Libor 51% 36% 0.0% UST 190 2% By Repricing Term -2.8% 1-3 years -5.1% 9% 4-5 170 $186 $188 years ($ in Millions) $182 $177 11% $172 5+ years 150 28% -50 bps -25 bps BASE +25 bps +50 bps Net Interest Income Change from base <1 year (1) NII and percentage change represents the base scenario of net interest income. The base scenario assumes (i) flat 52% interest rates over the next 12 months, (ii) that total financial instrument balances are kept constant over time and (iii) that interest rate shocks are instant and parallel to the yield curve
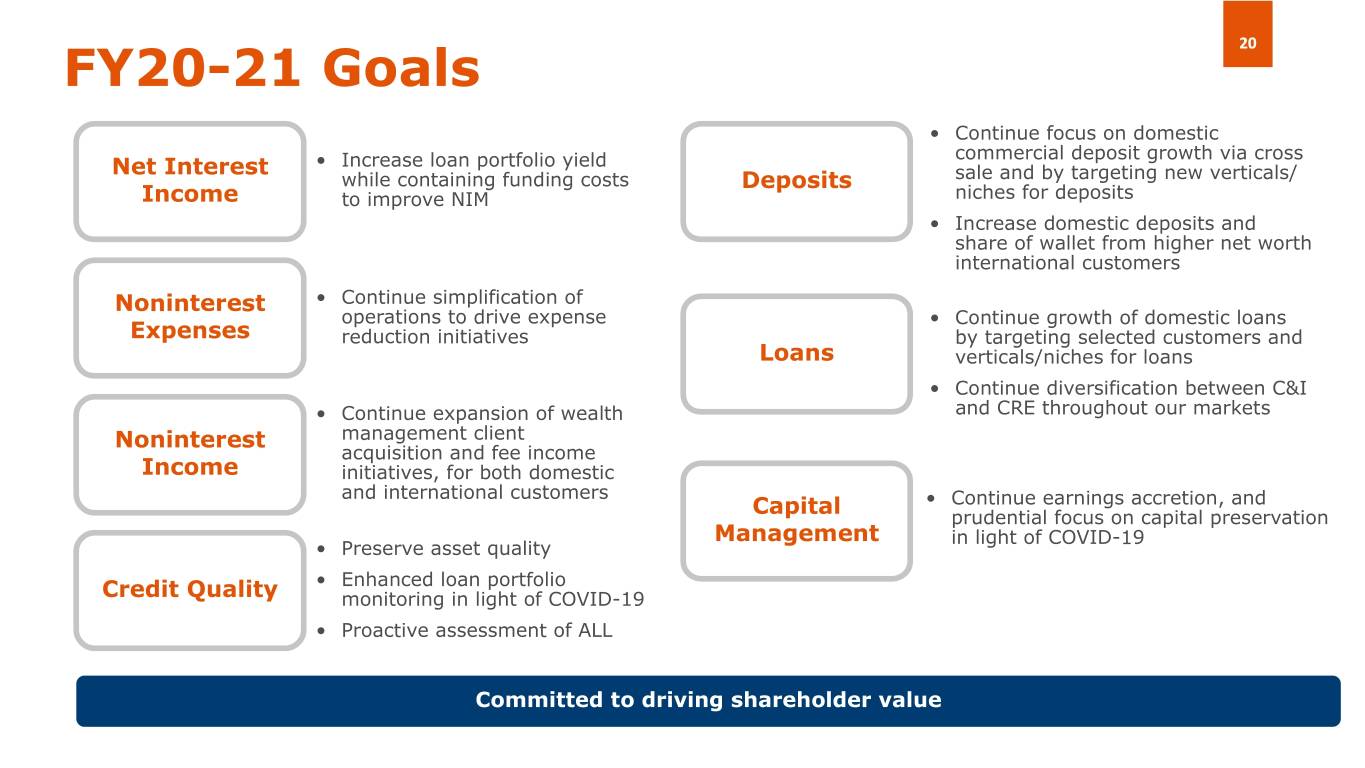
20 FY20-21 Goals • Continue focus on domestic commercial deposit growth via cross Net Interest • Increase loan portfolio yield while containing funding costs Deposits sale and by targeting new verticals/ Income to improve NIM niches for deposits • Increase domestic deposits and share of wallet from higher net worth international customers Noninterest • Continue simplification of operations to drive expense • Continue growth of domestic loans Expenses reduction initiatives by targeting selected customers and Loans verticals/niches for loans • Continue diversification between C&I • Continue expansion of wealth and CRE throughout our markets Noninterest management client acquisition and fee income Income initiatives, for both domestic and international customers Capital • Continue earnings accretion, and prudential focus on capital preservation Management in light of COVID-19 • Preserve asset quality • Enhanced loan portfolio Credit Quality monitoring in light of COVID-19 • Proactive assessment of ALL Committed to driving shareholder value

Supplemental Loan Portfolio Information
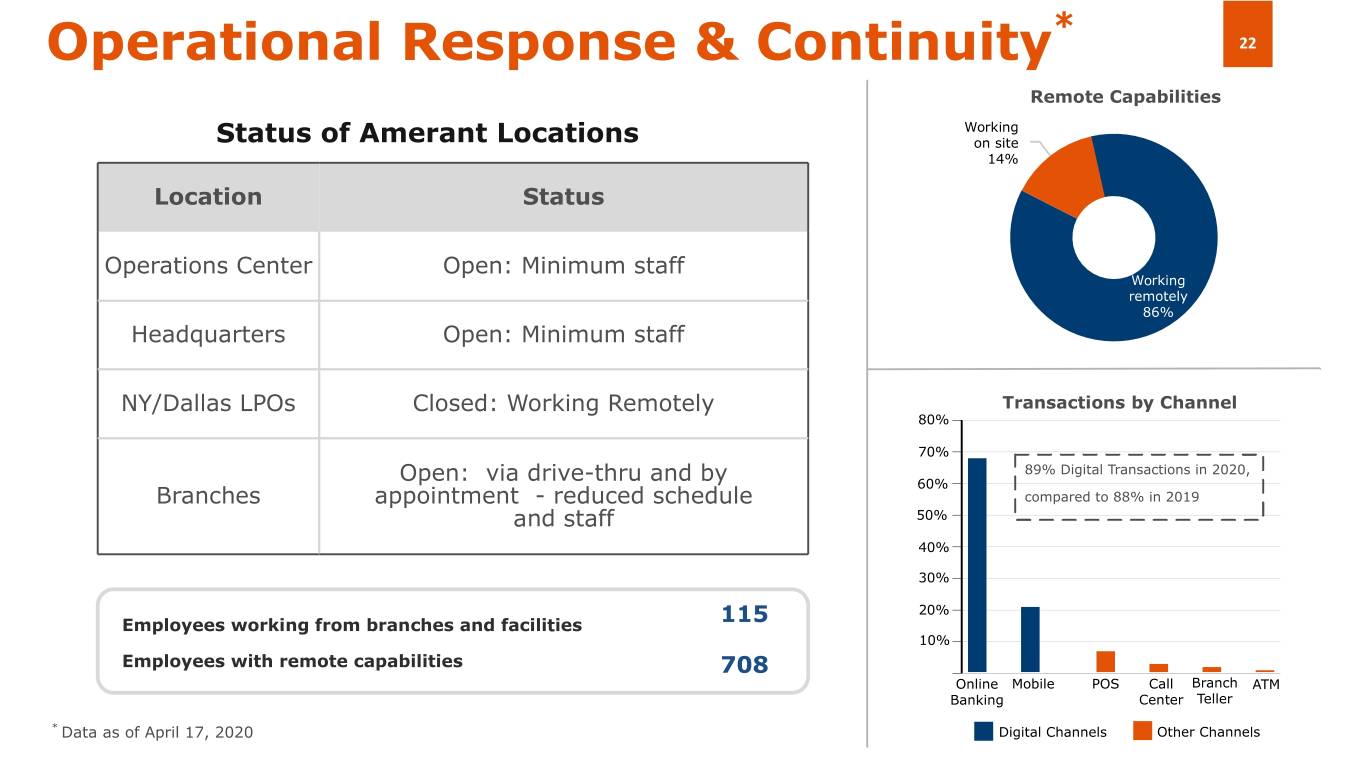
* Operational Response & Continuity 22 Remote Capabilities Working Status of Amerant Locations on site 14% Location Status Operations Center Open: Minimum staff Working remotely 86% Headquarters Open: Minimum staff NY/Dallas LPOs Closed: Working Remotely Transactions by Channel 80% 70% 89% Digital Transactions in 2020, Open: via drive-thru and by 60% Branches appointment - reduced schedule compared to 88% in 2019 and staff 50% 40% 30% 20% Employees working from branches and facilities 115 10% Employees with remote capabilities 708 Online Mobile POS Call Branch ATM Banking Center Teller * Data as of April 17, 2020 Digital Channels Other Channels
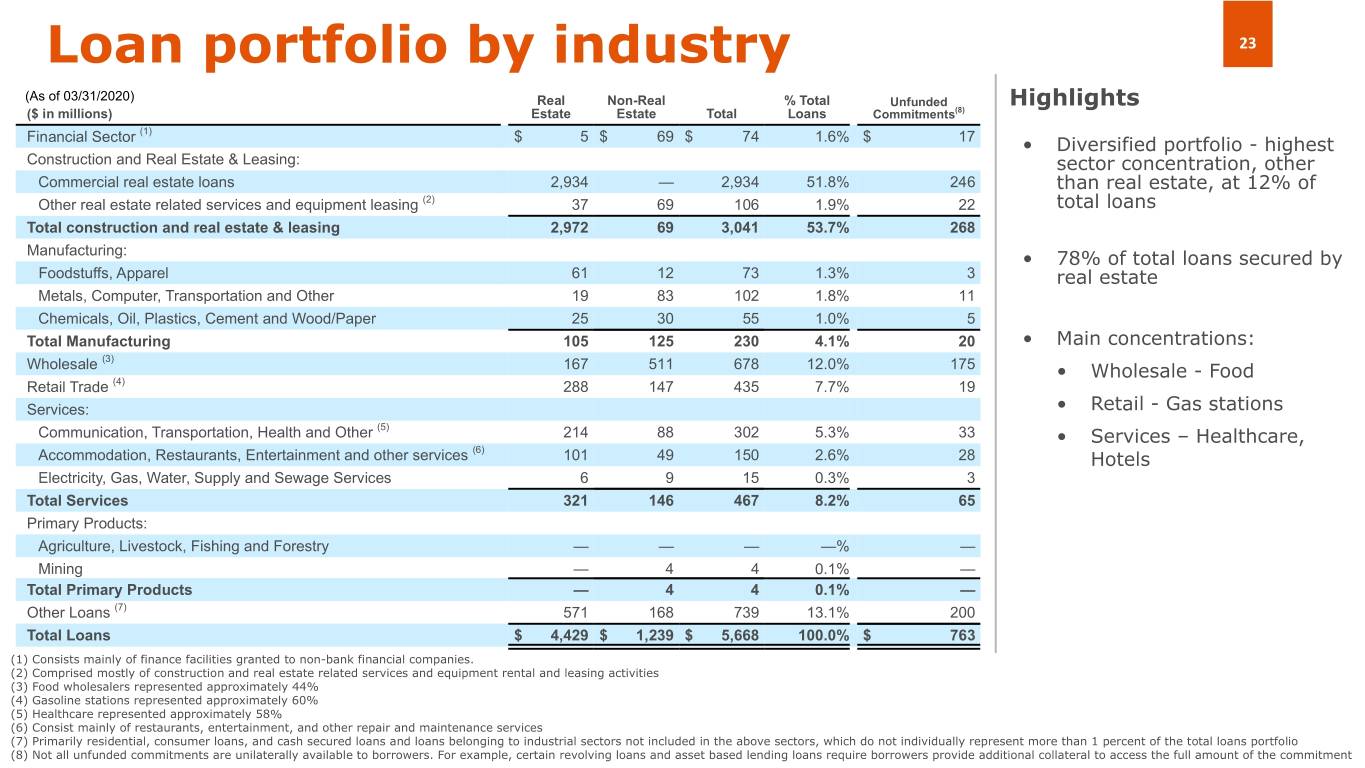
Loan portfolio by industry 23 (As of 03/31/2020) Real Non-Real % Total Unfunded Highlights ($ in millions) Estate Estate Total Loans Commitments(8) (1) Financial Sector $ 5 $ 69 $ 74 1.6% $ 17 • Diversified portfolio - highest Construction and Real Estate & Leasing: sector concentration, other Commercial real estate loans 2,934 — 2,934 51.8% 246 than real estate, at 12% of Other real estate related services and equipment leasing (2) 37 69 106 1.9% 22 total loans Total construction and real estate & leasing 2,972 69 3,041 53.7% 268 Manufacturing: • 78% of total loans secured by Foodstuffs, Apparel 61 12 73 1.3% 3 real estate Metals, Computer, Transportation and Other 19 83 102 1.8% 11 Chemicals, Oil, Plastics, Cement and Wood/Paper 25 30 55 1.0% 5 Total Manufacturing 105 125 230 4.1% 20 • Main concentrations: (3) Wholesale 167 511 678 12.0% 175 • Wholesale - Food Retail Trade (4) 288 147 435 7.7% 19 Services: • Retail - Gas stations (5) Communication, Transportation, Health and Other 214 88 302 5.3% 33 • Services – Healthcare, (6) Accommodation, Restaurants, Entertainment and other services 101 49 150 2.6% 28 Hotels Electricity, Gas, Water, Supply and Sewage Services 6 9 15 0.3% 3 Total Services 321 146 467 8.2% 65 Primary Products: Agriculture, Livestock, Fishing and Forestry — — — —% — Mining — 4 4 0.1% — Total Primary Products — 4 4 0.1% — Other Loans (7) 571 168 739 13.1% 200 Total Loans $ 4,429 $ 1,239 $ 5,668 100.0% $ 763 (1) Consists mainly of finance facilities granted to non-bank financial companies. (2) Comprised mostly of construction and real estate related services and equipment rental and leasing activities (3) Food wholesalers represented approximately 44% (4) Gasoline stations represented approximately 60% (5) Healthcare represented approximately 58% (6) Consist mainly of restaurants, entertainment, and other repair and maintenance services (7) Primarily residential, consumer loans, and cash secured loans and loans belonging to industrial sectors not included in the above sectors, which do not individually represent more than 1 percent of the total loans portfolio (8) Not all unfunded commitments are unilaterally available to borrowers. For example, certain revolving loans and asset based lending loans require borrowers provide additional collateral to access the full amount of the commitment
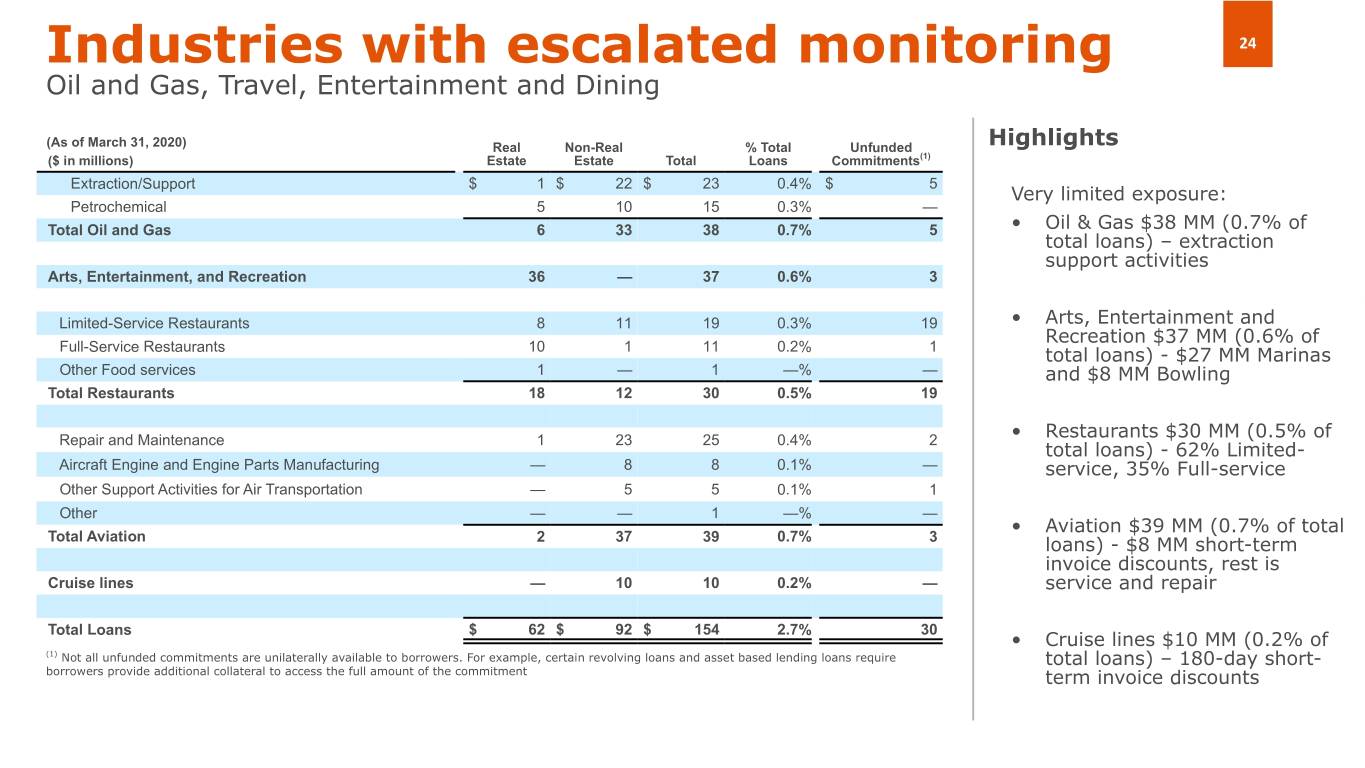
Industries with escalated monitoring 24 Oil and Gas, Travel, Entertainment and Dining (As of March 31, 2020) Real Non-Real % Total Unfunded Highlights ($ in millions) Estate Estate Total Loans Commitments(1) Extraction/Support $ 1 $ 22 $ 23 0.4% $ 5 Very limited exposure: Petrochemical 5 10 15 0.3% — Total Oil and Gas 6 33 38 0.7% 5 • Oil & Gas $38 MM (0.7% of total loans) – extraction support activities Arts, Entertainment, and Recreation 36 — 37 0.6% 3 Limited-Service Restaurants 8 11 19 0.3% 19 • Arts, Entertainment and Recreation $37 MM (0.6% of Full-Service Restaurants 10 1 11 0.2% 1 total loans) - $27 MM Marinas Other Food services 1 — 1 —% — and $8 MM Bowling Total Restaurants 18 12 30 0.5% 19 Repair and Maintenance 1 23 25 0.4% 2 • Restaurants $30 MM (0.5% of total loans) - 62% Limited- Aircraft Engine and Engine Parts Manufacturing — 8 8 0.1% — service, 35% Full-service Other Support Activities for Air Transportation — 5 5 0.1% 1 Other — — 1 —% — • Aviation $39 MM (0.7% of total Total Aviation 2 37 39 0.7% 3 loans) - $8 MM short-term invoice discounts, rest is Cruise lines — 10 10 0.2% — service and repair Total Loans $ 62 $ 92 $ 154 2.7% 30 • Cruise lines $10 MM (0.2% of (1) Not all unfunded commitments are unilaterally available to borrowers. For example, certain revolving loans and asset based lending loans require total loans) – 180-day short- borrowers provide additional collateral to access the full amount of the commitment term invoice discounts
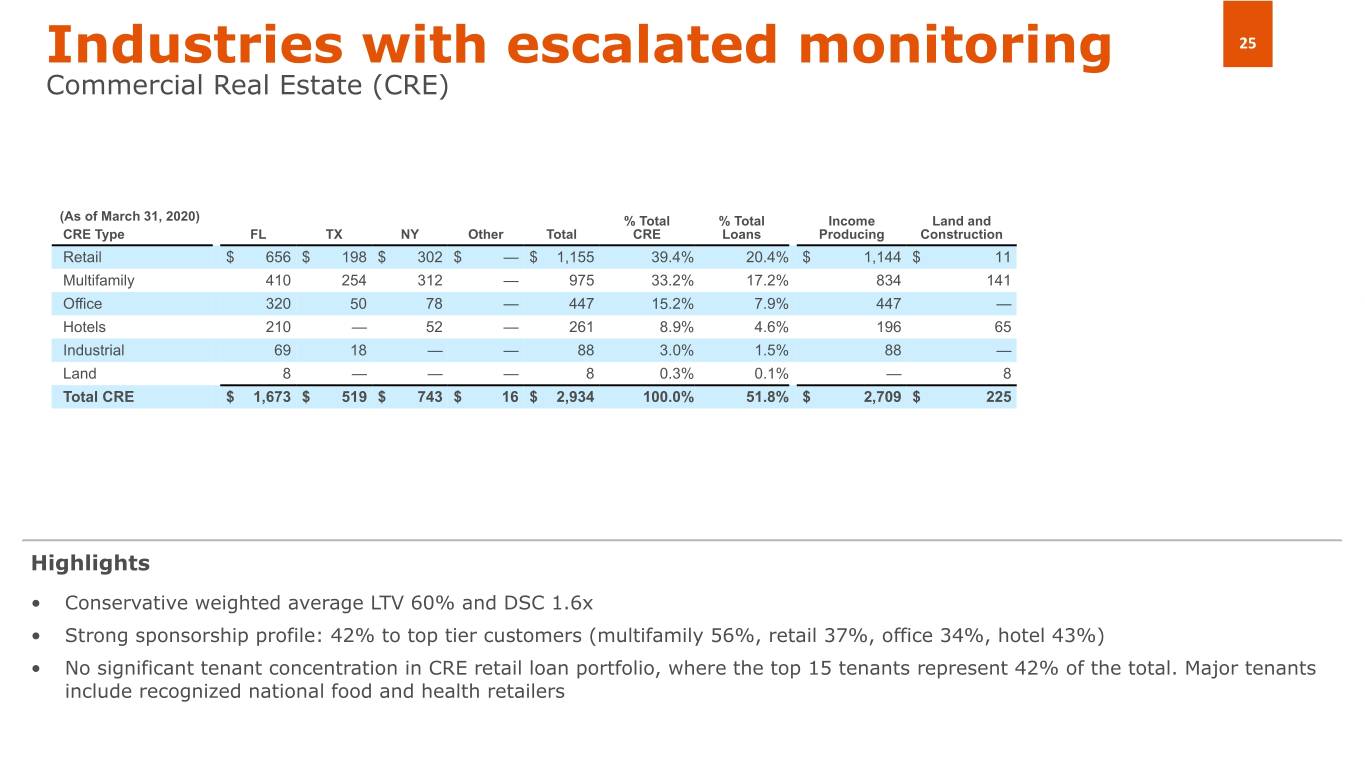
Industries with escalated monitoring 25 Commercial Real Estate (CRE) (As of March 31, 2020) % Total % Total Income Land and CRE Type FL TX NY Other Total CRE Loans Producing Construction Retail $ 656 $ 198 $ 302 $ — $ 1,155 39.4% 20.4% $ 1,144 $ 11 Multifamily 410 254 312 — 975 33.2% 17.2% 834 141 Office 320 50 78 — 447 15.2% 7.9% 447 — Hotels 210 — 52 — 261 8.9% 4.6% 196 65 Industrial 69 18 — — 88 3.0% 1.5% 88 — Land 8 — — — 8 0.3% 0.1% — 8 Total CRE $ 1,673 $ 519 $ 743 $ 16 $ 2,934 100.0% 51.8% $ 2,709 $ 225 Highlights • Conservative weighted average LTV 60% and DSC 1.6x • Strong sponsorship profile: 42% to top tier customers (multifamily 56%, retail 37%, office 34%, hotel 43%) • No significant tenant concentration in CRE retail loan portfolio, where the top 15 tenants represent 42% of the total. Major tenants include recognized national food and health retailers
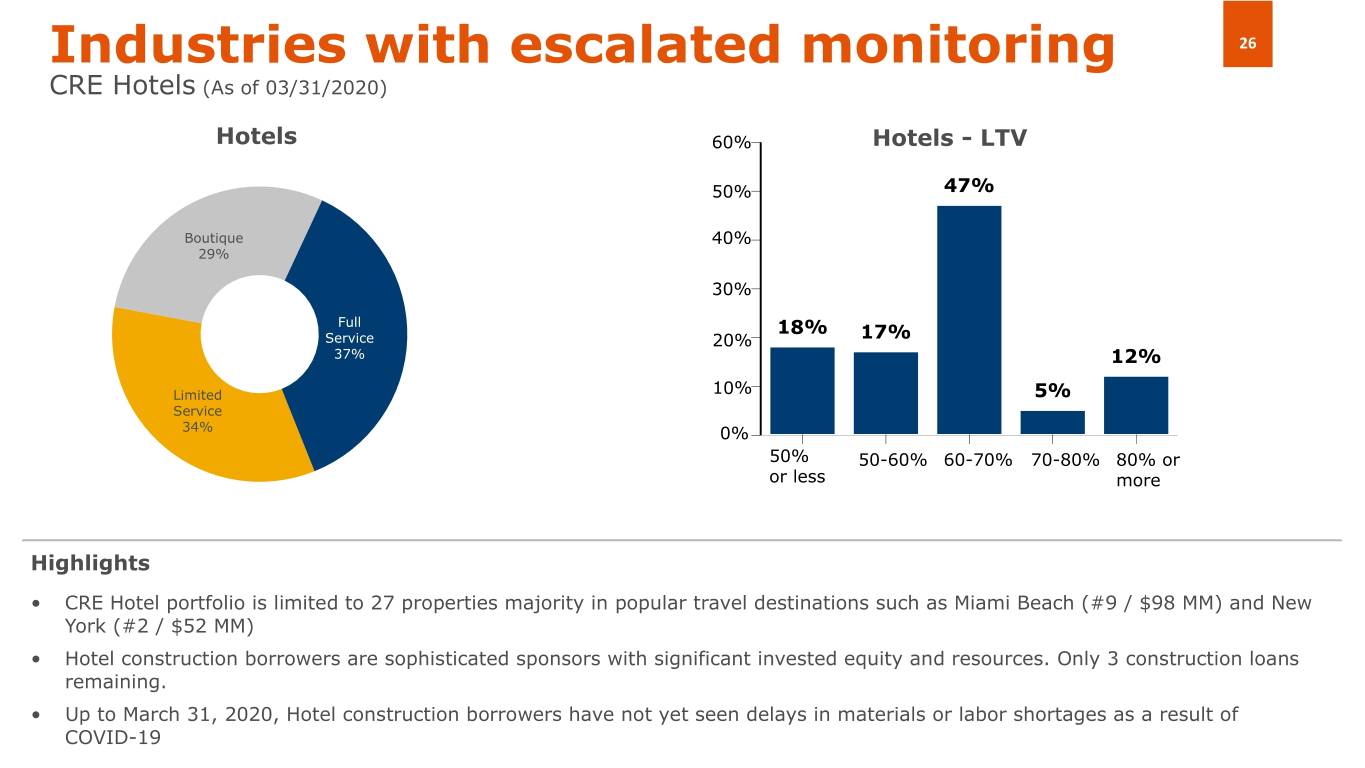
Industries with escalated monitoring 26 CRE Hotels (As of 03/31/2020) Hotels 60% Hotels - LTV 50% 47% Boutique 40% 29% 30% Full 18% Service 20% 17% 37% 12% Limited 10% 5% Service 34% 0% 50% 50-60% 60-70% 70-80% 80% or or less more Highlights • CRE Hotel portfolio is limited to 27 properties majority in popular travel destinations such as Miami Beach (#9 / $98 MM) and New York (#2 / $52 MM) • Hotel construction borrowers are sophisticated sponsors with significant invested equity and resources. Only 3 construction loans remaining. • Up to March 31, 2020, Hotel construction borrowers have not yet seen delays in materials or labor shortages as a result of COVID-19
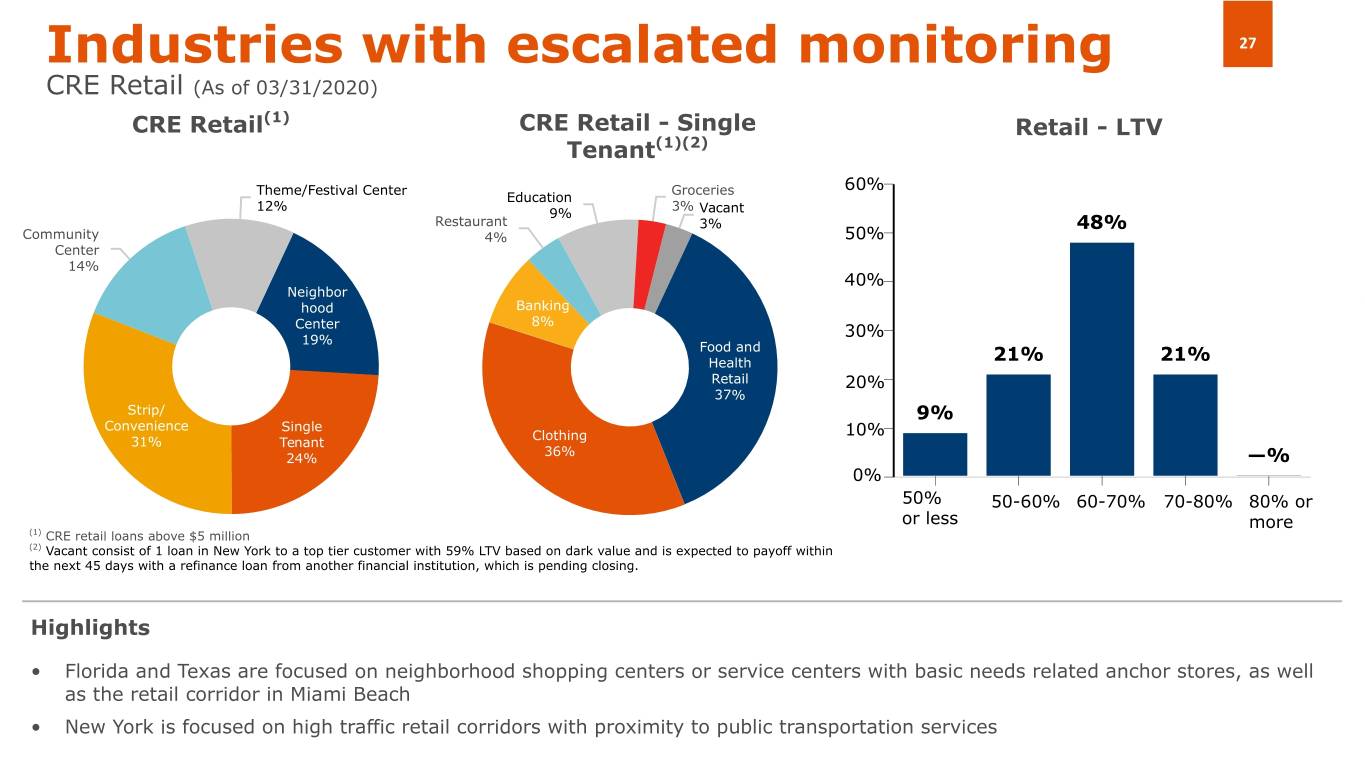
Industries with escalated monitoring 27 CRE Retail (As of 03/31/2020) CRE Retail(1) CRE Retail - Single Retail - LTV Tenant(1)(2) Theme/Festival Center Groceries 60% Education 12% 3% 9% Vacant Restaurant 3% 48% Community 4% 50% Center 14% 40% Neighbor hood Banking 8% Center 30% 19% Food and Health 21% 21% Retail 20% 37% Strip/ 9% Convenience Single Clothing 10% 31% Tenant 36% 24% —% 0% 50% 50-60% 60-70% 70-80% 80% or or less more (1) CRE retail loans above $5 million (2) Vacant consist of 1 loan in New York to a top tier customer with 59% LTV based on dark value and is expected to payoff within the next 45 days with a refinance loan from another financial institution, which is pending closing. Highlights • Florida and Texas are focused on neighborhood shopping centers or service centers with basic needs related anchor stores, as well as the retail corridor in Miami Beach • New York is focused on high traffic retail corridors with proximity to public transportation services

Appendices
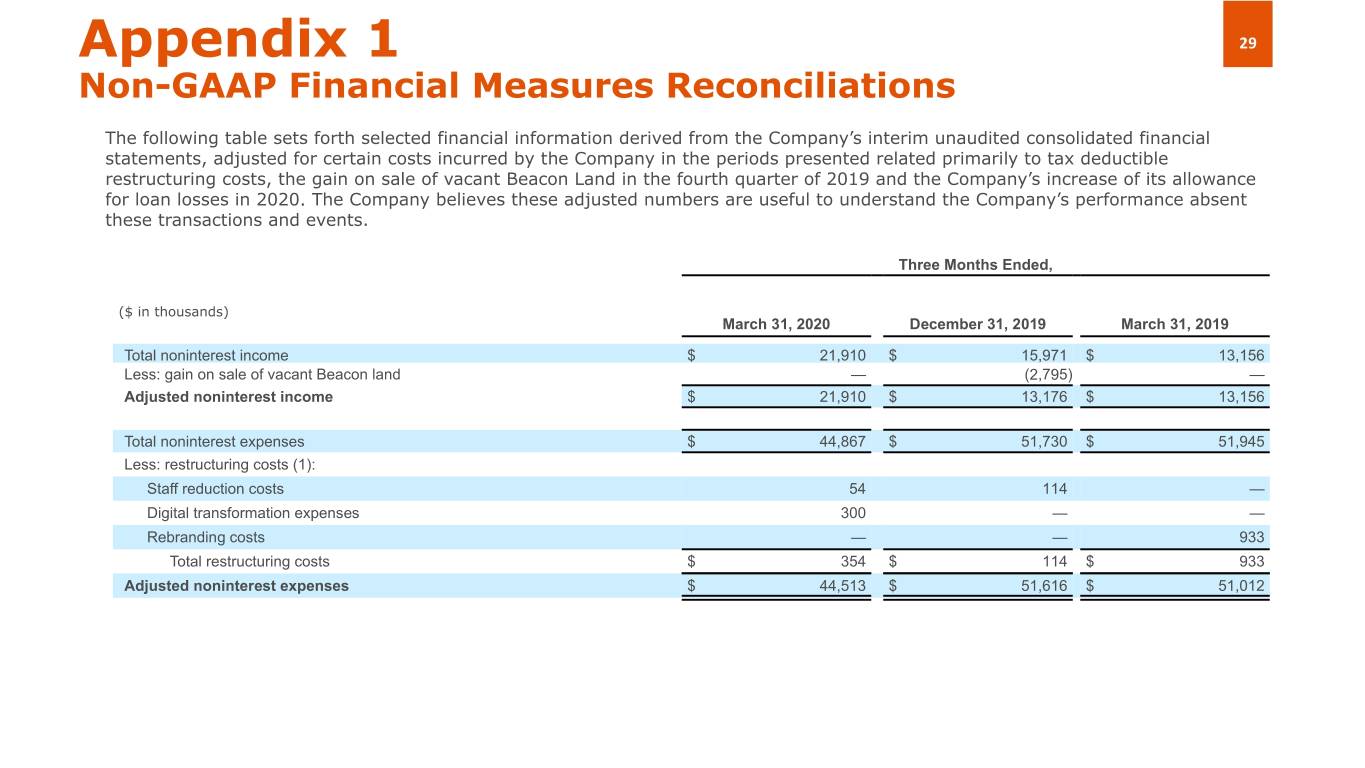
Appendix 1 29 Non-GAAP Financial Measures Reconciliations The following table sets forth selected financial information derived from the Company’s interim unaudited consolidated financial statements, adjusted for certain costs incurred by the Company in the periods presented related primarily to tax deductible restructuring costs, the gain on sale of vacant Beacon Land in the fourth quarter of 2019 and the Company’s increase of its allowance for loan losses in 2020. The Company believes these adjusted numbers are useful to understand the Company’s performance absent these transactions and events. Three Months Ended, ($ in thousands) March 31, 2020 December 31, 2019 March 31, 2019 Total noninterest income $ 21,910 $ 15,971 $ 13,156 Less: gain on sale of vacant Beacon land — (2,795) — Adjusted noninterest income $ 21,910 $ 13,176 $ 13,156 Total noninterest expenses $ 44,867 $ 51,730 $ 51,945 Less: restructuring costs (1): Staff reduction costs 54 114 — Digital transformation expenses 300 — — Rebranding costs — — 933 Total restructuring costs $ 354 $ 114 $ 933 Adjusted noninterest expenses $ 44,513 $ 51,616 $ 51,012
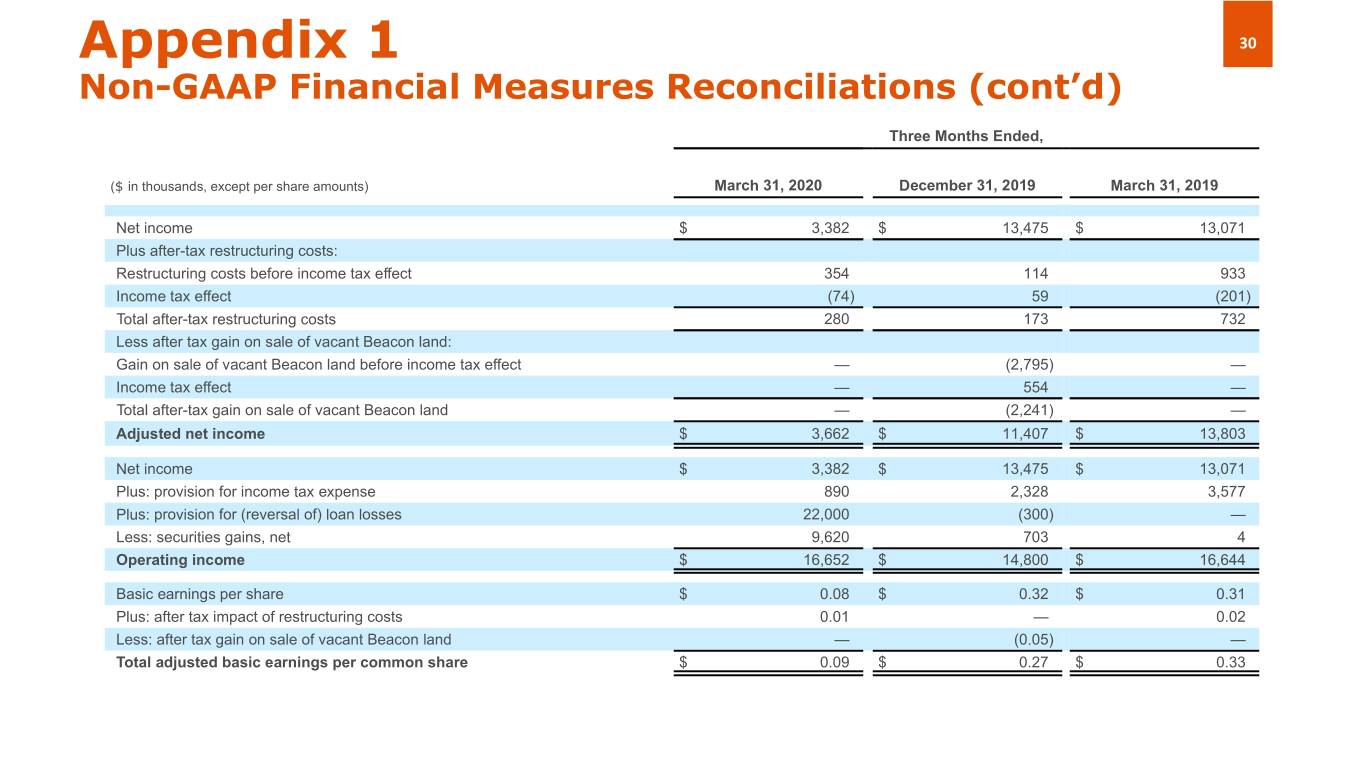
Appendix 1 30 Non-GAAP Financial Measures Reconciliations (cont’d) Three Months Ended, ($ in thousands, except per share amounts) March 31, 2020 December 31, 2019 March 31, 2019 Net income $ 3,382 $ 13,475 $ 13,071 Plus after-tax restructuring costs: Restructuring costs before income tax effect 354 114 933 Income tax effect (74) 59 (201) Total after-tax restructuring costs 280 173 732 Less after tax gain on sale of vacant Beacon land: Gain on sale of vacant Beacon land before income tax effect — (2,795) — Income tax effect — 554 — Total after-tax gain on sale of vacant Beacon land — (2,241) — Adjusted net income $ 3,662 $ 11,407 $ 13,803 Net income $ 3,382 $ 13,475 $ 13,071 Plus: provision for income tax expense 890 2,328 3,577 Plus: provision for (reversal of) loan losses 22,000 (300) — Less: securities gains, net 9,620 703 4 Operating income $ 16,652 $ 14,800 $ 16,644 Basic earnings per share $ 0.08 $ 0.32 $ 0.31 Plus: after tax impact of restructuring costs 0.01 — 0.02 Less: after tax gain on sale of vacant Beacon land — (0.05) — Total adjusted basic earnings per common share $ 0.09 $ 0.27 $ 0.33
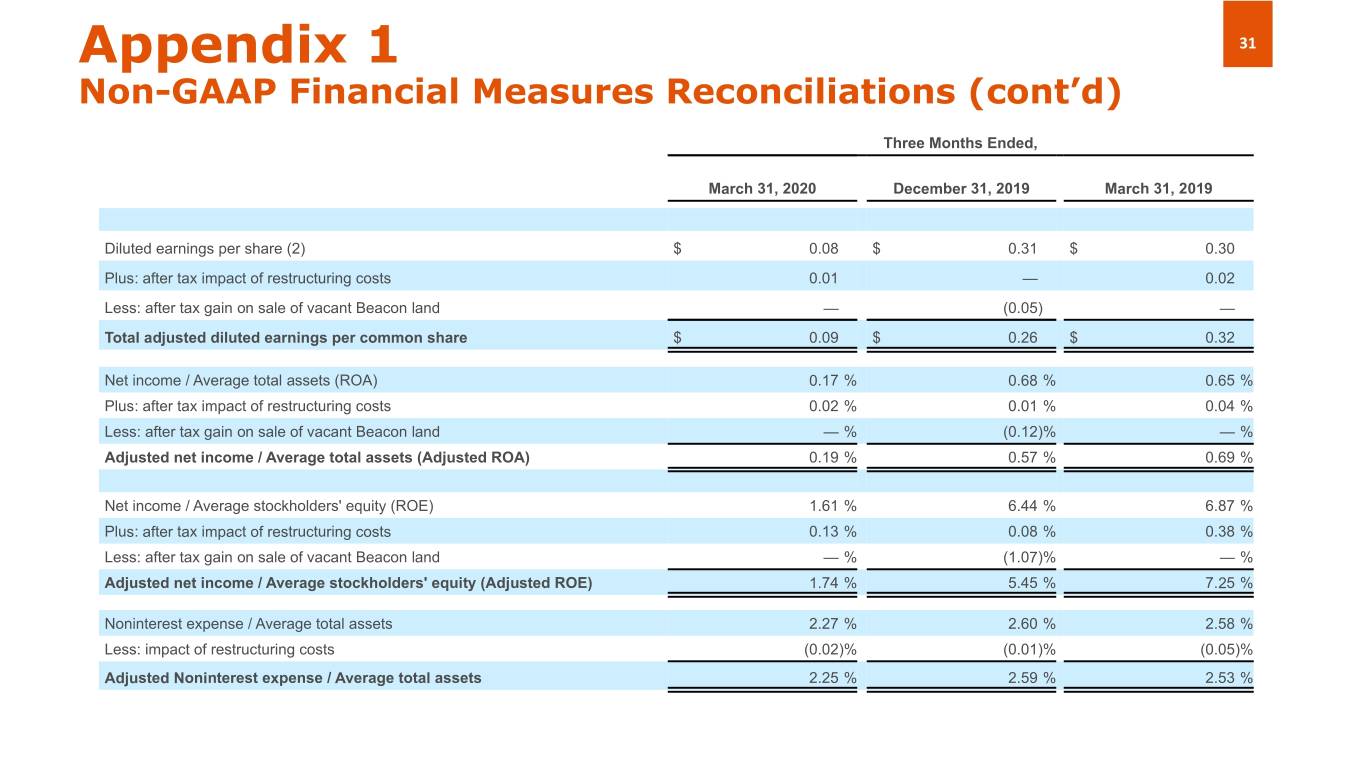
Appendix 1 31 Non-GAAP Financial Measures Reconciliations (cont’d) Three Months Ended, March 31, 2020 December 31, 2019 March 31, 2019 Diluted earnings per share (2) $ 0.08 $ 0.31 $ 0.30 Plus: after tax impact of restructuring costs 0.01 — 0.02 Less: after tax gain on sale of vacant Beacon land — (0.05) — Total adjusted diluted earnings per common share $ 0.09 $ 0.26 $ 0.32 Net income / Average total assets (ROA) 0.17 % 0.68 % 0.65 % Plus: after tax impact of restructuring costs 0.02 % 0.01 % 0.04 % Less: after tax gain on sale of vacant Beacon land — % (0.12)% — % Adjusted net income / Average total assets (Adjusted ROA) 0.19 % 0.57 % 0.69 % Net income / Average stockholders' equity (ROE) 1.61 % 6.44 % 6.87 % Plus: after tax impact of restructuring costs 0.13 % 0.08 % 0.38 % Less: after tax gain on sale of vacant Beacon land — % (1.07)% — % Adjusted net income / Average stockholders' equity (Adjusted ROE) 1.74 % 5.45 % 7.25 % Noninterest expense / Average total assets 2.27 % 2.60 % 2.58 % Less: impact of restructuring costs (0.02)% (0.01)% (0.05)% Adjusted Noninterest expense / Average total assets 2.25 % 2.59 % 2.53 %
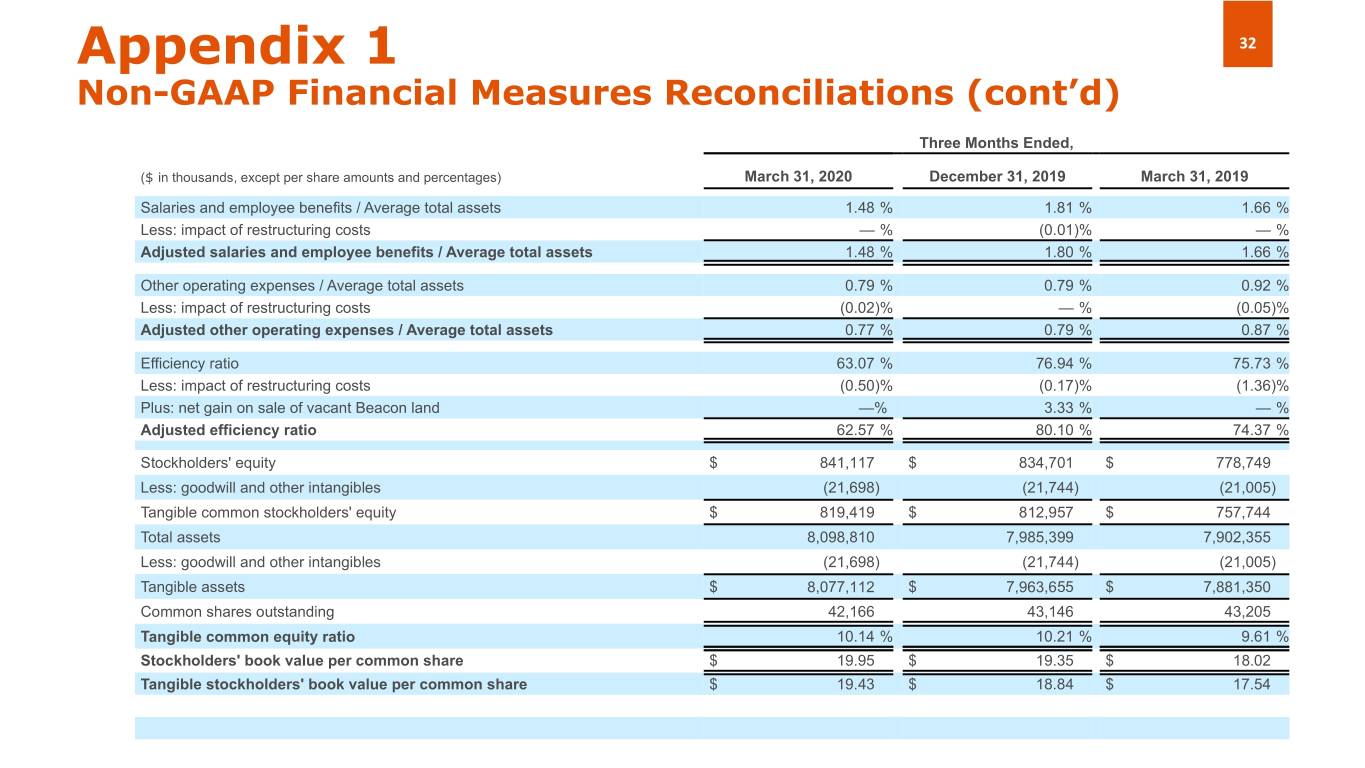
Appendix 1 32 Non-GAAP Financial Measures Reconciliations (cont’d) Three Months Ended, ($ in thousands, except per share amounts and percentages) March 31, 2020 December 31, 2019 March 31, 2019 Salaries and employee benefits / Average total assets 1.48 % 1.81 % 1.66 % Less: impact of restructuring costs — % (0.01)% — % Adjusted salaries and employee benefits / Average total assets 1.48 % 1.80 % 1.66 % Other operating expenses / Average total assets 0.79 % 0.79 % 0.92 % Less: impact of restructuring costs (0.02)% — % (0.05)% Adjusted other operating expenses / Average total assets 0.77 % 0.79 % 0.87 % Efficiency ratio 63.07 % 76.94 % 75.73 % Less: impact of restructuring costs (0.50)% (0.17)% (1.36)% Plus: net gain on sale of vacant Beacon land —% 3.33 % — % Adjusted efficiency ratio 62.57 % 80.10 % 74.37 % Stockholders' equity $ 841,117 $ 834,701 $ 778,749 Less: goodwill and other intangibles (21,698) (21,744) (21,005) Tangible common stockholders' equity $ 819,419 $ 812,957 $ 757,744 Total assets 8,098,810 7,985,399 7,902,355 Less: goodwill and other intangibles (21,698) (21,744) (21,005) Tangible assets $ 8,077,112 $ 7,963,655 $ 7,881,350 Common shares outstanding 42,166 43,146 43,205 Tangible common equity ratio 10.14 % 10.21 % 9.61 % Stockholders' book value per common share $ 19.95 $ 19.35 $ 18.02 Tangible stockholders' book value per common share $ 19.43 $ 18.84 $ 17.54
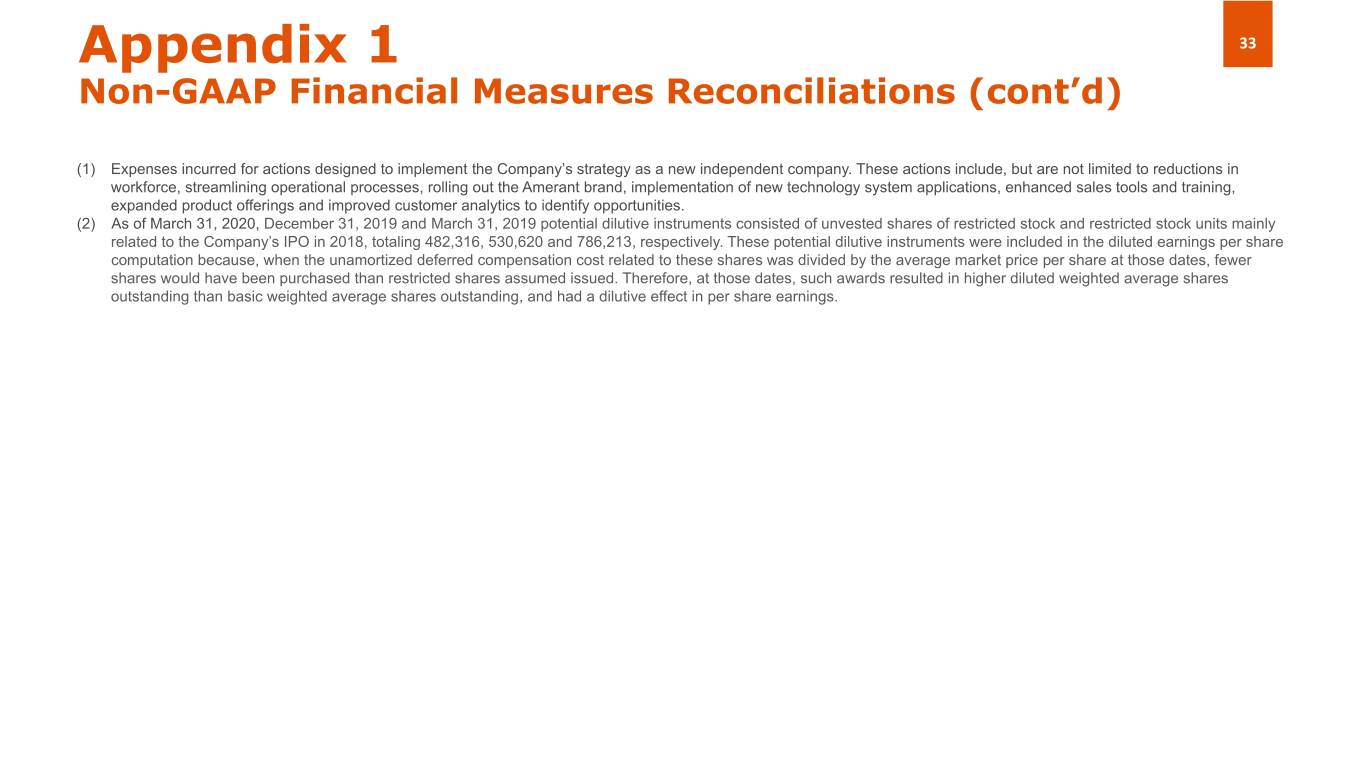
Appendix 1 33 Non-GAAP Financial Measures Reconciliations (cont’d) (1) Expenses incurred for actions designed to implement the Company’s strategy as a new independent company. These actions include, but are not limited to reductions in workforce, streamlining operational processes, rolling out the Amerant brand, implementation of new technology system applications, enhanced sales tools and training, expanded product offerings and improved customer analytics to identify opportunities. (2) As of March 31, 2020, December 31, 2019 and March 31, 2019 potential dilutive instruments consisted of unvested shares of restricted stock and restricted stock units mainly related to the Company’s IPO in 2018, totaling 482,316, 530,620 and 786,213, respectively. These potential dilutive instruments were included in the diluted earnings per share computation because, when the unamortized deferred compensation cost related to these shares was divided by the average market price per share at those dates, fewer shares would have been purchased than restricted shares assumed issued. Therefore, at those dates, such awards resulted in higher diluted weighted average shares outstanding than basic weighted average shares outstanding, and had a dilutive effect in per share earnings.