
BFH 8-K
Bread Financial Holdings, Inc. (BFH)
8-K
2022-04-28
For: 2022-04-28
View Original
Added on
July 04, 2026
SECURITIES AND EXCHANGE COMMISSION
WASHINGTON, D.C. 20549
FORM 8-K
CURRENT REPORT
PURSUANT TO SECTION 13 OR 15(d) OF THE
SECURITIES EXCHANGE ACT OF 1934
Date of report (Date of earliest event reported):

(Exact Name of Registrant as Specified in Charter)
|
|
|
|
|
|
|
(State or Other Jurisdiction
|
|
(Commission
|
|
(IRS Employer
|
|
of Incorporation)
|
|
File Number)
|
|
Identification No.)
|
(Address and Zip Code of Principal Executive Offices)
(614 ) 729-4000
(Registrant’s Telephone Number, including Area Code)
NOT APPLICABLE
(Former name or former address, if changed since last report)
Check the appropriate box below if the Form 8-K is intended to simultaneously satisfy the filing obligation of the Registrant under any of the following
provisions:
|
|
Written communications pursuant to Rule 425 under the Securities Act
|
|
|
|
Soliciting material pursuant to Rule 14a-12 under the Exchange Act
|
|
|
|
Pre-commencement communications pursuant to Rule 14d-2(b) under the Exchange Act
|
|
|
|
Pre-commencement communications pursuant to Rule 13e-4(c) under the Exchange Act
|
Securities registered pursuant to Section 12(b) of the Act:
|
Title of each class
|
Trading symbol
|
Name of each exchange on which registered
|
||
|
|
|
|
Indicate by check mark whether the registrant is an emerging growth company as defined in Rule 405 of the Securities Act of 1933 (§230.405 of this chapter)
or Rule 12b-2 of the Securities Exchange Act of 1934 (§240.12b-2 of this chapter).
Emerging growth company ☐
If an emerging growth company, indicate by check mark if the registrant has elected not to use the extended transition period for complying with any new or
revised financial accounting standards provided pursuant to Section 13(a) of the Exchange Act. [ ]
Item 2.02 Results of Operations and Financial Condition.
On April 28, 2022, Bread Financial Holdings, Inc. (the "Company") issued a press release regarding its results of operations for the first
quarter ended March 31, 2022. A copy of this press release is furnished as Exhibit 99.1.
Item 7.01 Regulation FD Disclosure.
On April 28, 2022, the Company issued a press release regarding its results of operations for the first quarter ended March 31, 2022. A
copy of this press release is furnished as Exhibit 99.1.
Attached as Exhibit 99.2 is a presentation to be given to investors and others by senior officers of the Company.
Item 9.01 Financial Statements and Exhibits.
(d) Exhibits
|
Exhibit No.
|
Document Description
|
|
|
Press Release dated April 28, 2022 announcing the results of operations for the first quarter ended March 31, 2022.
|
||
|
Investor Presentation Materials.
|
||
|
104
|
Cover Page Interactive Data File (embedded within the Inline XBRL document).
|
Note: The information contained in
this report (including Exhibits 99.1 and 99.2) shall not be deemed “filed” for purposes of Section 18 of the Securities Exchange Act of 1934, as amended, or otherwise subject to the liabilities of that section, nor shall it be deemed incorporated by
reference in any filing under the Securities Act of 1933, as amended, except as expressly set forth by specific reference in such a filing.
SIGNATURES
Pursuant to the requirements of the Securities Exchange Act of 1934, as amended, the Registrant has duly caused this report to be signed on its behalf by the
undersigned hereunto duly authorized.
|
Bread Financial Holdings, Inc.
|
|||
|
Date: April 28, 2022
|
By:
|
/s/ Joseph L. Motes III
|
|
|
Joseph L. Motes III
|
|||
|
Executive Vice President, Chief
Administrative Officer, General
Counsel and Secretary
|
|||
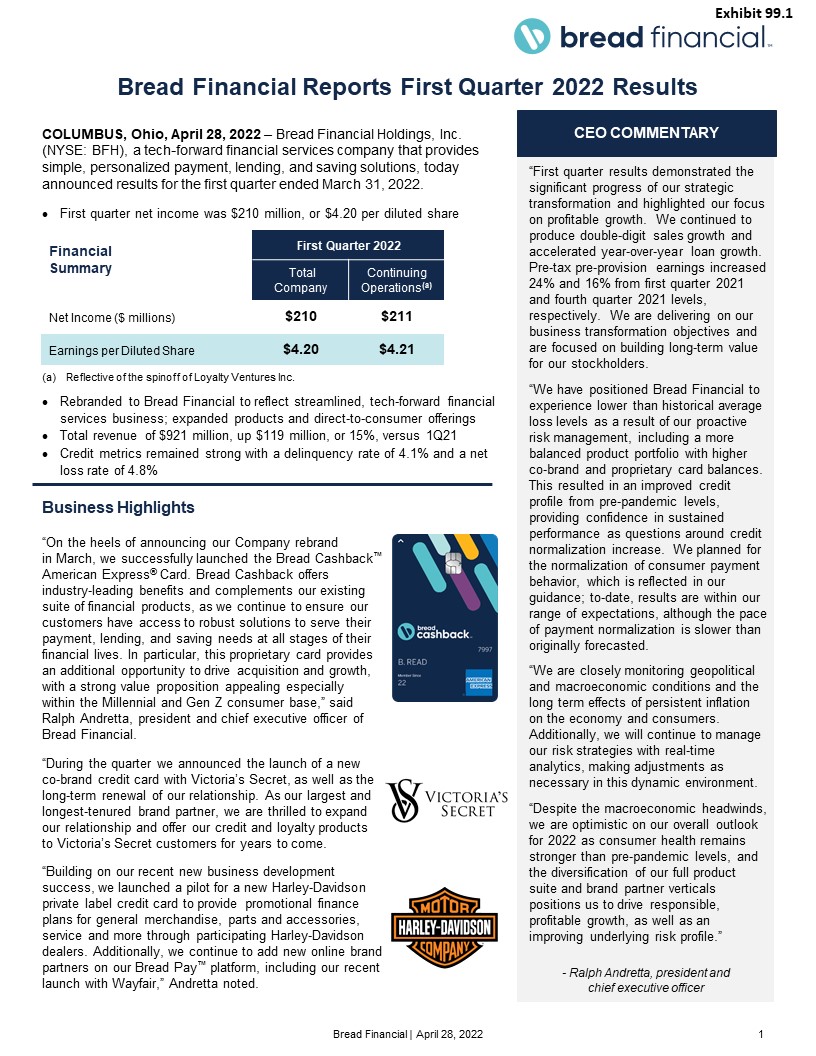
Financial First Quarter 2022 Full Year 2021 Summary Total Company Continuing Operations(a)
Total Company Continuing Operations(a) Net Income ($ millions) $210 $211 $801 $797 Earnings per Diluted Share $4.20 $4.21 $16.02 $15.95 Business Highlights “On the heels of announcing our Company rebrand in March, we successfully
launched the Bread Cashback™ American Express® Card. Bread Cashback offers industry-leading benefits and complements our existing suite of financial products, as we continue to ensure our customers have access to robust solutions to serve their
payment, lending, and saving needs at all stages of their financial lives. In particular, this proprietary card provides an additional opportunity to drive acquisition and growth, with a strong value proposition appealing especially within the
Millennial and Gen Z consumer base,” said Ralph Andretta, president and chief executive officer of Bread Financial.“During the quarter we announced the launch of a new co-brand credit card with Victoria’s Secret, as well as the long-term
renewal of our relationship. As our largest and longest-tenured brand partner, we are thrilled to expand our relationship and offer our credit and loyalty products to Victoria’s Secret customers for years to come. “Building on our recent new
business development success, we launched a pilot for a new Harley-Davidson private label credit card to provide promotional finance plans for general merchandise, parts and accessories, service and more through participating Harley-Davidson
dealers. Additionally, we continue to add new online brand partners on our Bread Pay™ platform, including our recent launch with Wayfair,” Andretta noted. 1 Bread Financial | April 28, 2022 Bread Financial Reports First Quarter 2022
Results CEO Commentary “First quarter results demonstrated the significant progress of our strategic transformation and highlighted our focus on profitable growth. We continued to produce double-digit sales growth and accelerated
year-over-year loan growth. Pre-tax pre-provision earnings increased 24% and 16% from first quarter 2021 and fourth quarter 2021 levels, respectively. We are delivering on our business transformation objectives and are focused on building
long-term value for our stockholders.“We have positioned Bread Financial to experience lower than historical average loss levels as a result of our proactive risk management, including a more balanced product portfolio with higher co-brand and
proprietary card balances. This resulted in an improved credit profile from pre-pandemic levels, providing confidence in sustained performance as questions around credit normalization increase. We planned for the normalization of consumer
payment behavior, which is reflected in our guidance; to-date, results are within our range of expectations, although the pace of payment normalization is slower than originally forecasted. “We are closely monitoring geopolitical and
macroeconomic conditions and the long term effects of persistent inflation on the economy and consumers. Additionally, we will continue to manage our risk strategies with real-time analytics, making adjustments as necessary in this dynamic
environment.“Despite the macroeconomic headwinds, we are optimistic on our overall outlook for 2022 as consumer health remains stronger than pre-pandemic levels, and the diversification of our full product suite and brand partner verticals
positions us to drive responsible, profitable growth, as well as an improving underlying risk profile.” - Ralph Andretta, president and chief executive officer COLUMBUS, Ohio, April 28, 2022 – Bread Financial Holdings, Inc. (NYSE: BFH), a
tech-forward financial services company that provides simple, personalized payment, lending, and saving solutions, today announced results for the first quarter ended March 31, 2022.First quarter net income was $210 million, or $4.20 per
diluted share Reflective of the spinoff of Loyalty Ventures Inc.Rebranded to Bread Financial to reflect streamlined, tech-forward financial services business; expanded products and direct-to-consumer offeringsTotal revenue of $921 million, up
$119 million, or 15%, versus 1Q21Credit metrics remained strong with a delinquency rate of 4.1% and a net loss rate of 4.8% Exhibit 99.1
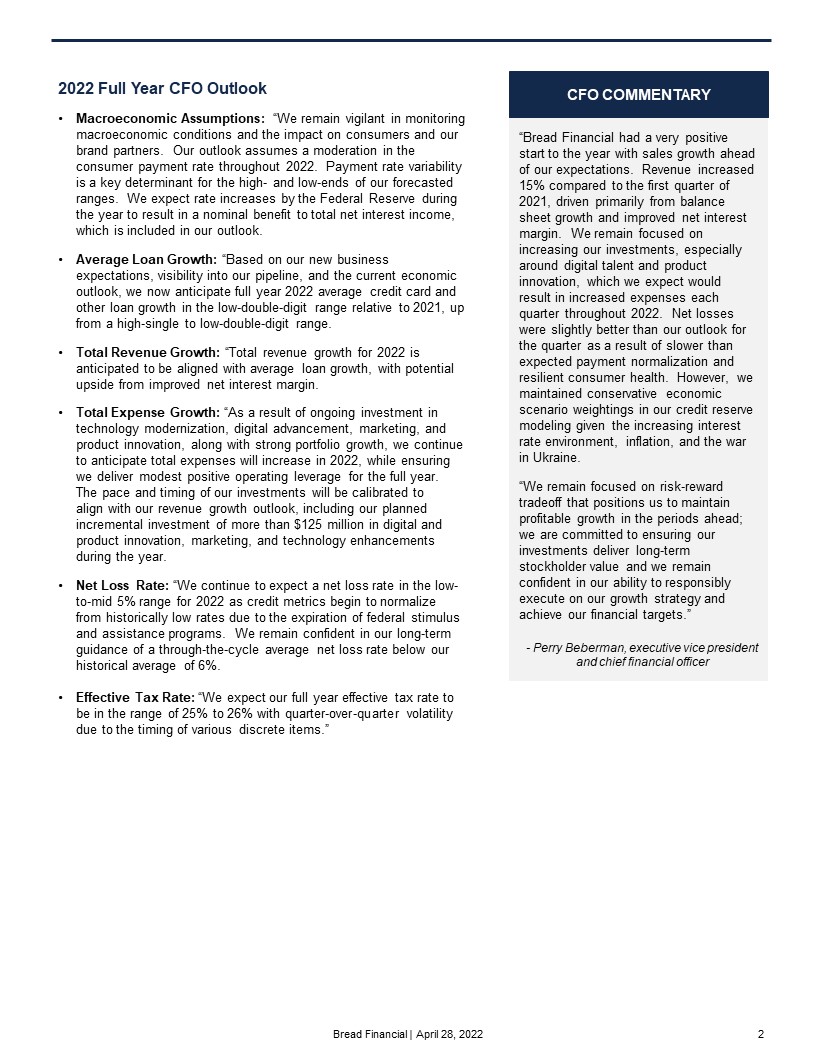
“Bread Financial had a very positive start to the year with sales growth ahead of our expectations.
Revenue increased 15% compared to the first quarter of 2021, driven primarily from balance sheet growth and improved net interest margin. We remain focused on increasing our investments, especially around digital talent and product innovation,
which we expect would result in increased expenses each quarter throughout 2022. Net losses were slightly better than our outlook for the quarter as a result of slower than expected payment normalization and resilient consumer health. However,
we maintained conservative economic scenario weightings in our credit reserve modeling given the increasing interest rate environment, inflation, and the war in Ukraine.“We remain focused on risk-reward tradeoff that positions us to maintain
profitable growth in the periods ahead; we are committed to ensuring our investments deliver long-term stockholder value and we remain confident in our ability to responsibly execute on our growth strategy and achieve our financial
targets.” CFO Commentary - Perry Beberman, executive vice president and chief financial officer 2022 Full Year CFO OutlookMacroeconomic Assumptions: “We remain vigilant in monitoring macroeconomic conditions and the impact on consumers and
our brand partners. Our outlook assumes a moderation in the consumer payment rate throughout 2022. Payment rate variability is a key determinant for the high- and low-ends of our forecasted ranges. We expect rate increases by the Federal
Reserve during the year to result in a nominal benefit to total net interest income, which is included in our outlook.Average Loan Growth: “Based on our new business expectations, visibility into our pipeline, and the current economic outlook,
we now anticipate full year 2022 average credit card and other loan growth in the low-double-digit range relative to 2021, up from a high-single to low-double-digit range. Total Revenue Growth: “Total revenue growth for 2022 is anticipated to
be aligned with average loan growth, with potential upside from improved net interest margin.Total Expense Growth: “As a result of ongoing investment in technology modernization, digital advancement, marketing, and product innovation, along
with strong portfolio growth, we continue to anticipate total expenses will increase in 2022, while ensuring we deliver modest positive operating leverage for the full year. The pace and timing of our investments will be calibrated to align
with our revenue growth outlook, including our planned incremental investment of more than $125 million in digital and product innovation, marketing, and technology enhancements during the year. Net Loss Rate: “We continue to expect a net loss
rate in the low-to-mid 5% range for 2022 as credit metrics begin to normalize from historically low rates due to the expiration of federal stimulus and assistance programs. We remain confident in our long-term guidance of a through-the-cycle
average net loss rate below our historical average of 6%.Effective Tax Rate: “We expect our full year effective tax rate to be in the range of 25% to 26% with quarter-over-quarter volatility due to the timing of various discrete
items.” 2 Bread Financial | April 28, 2022

+14% +15% +24% -27% -22% +0.3% -0.2% Key Operating and Financial Metrics(a) Credit
Metrics Continuing Operations(a) Quarter Ended Year Ended March 31, December 31, ($ in millions, except per share amounts) 2022 2021 Change 2021 2020 Change Total net interest and non-interest income
(“Revenue”) $921 $802 15% $3,272 $3,298 (1)% Net principal losses $199 $198 1% $720 $1,083 (34)% Reserve build (release) $(6) $(165) nm ($176) $183 nm Provision for credit losses $193 $33 nm $544
$1,266 (57)% Total non-interest expenses $426 $402 6% $1,684 $1,731 (3)% Income from continuing operations before income taxes $302 $367 (18)% $1,044 $301 247% Income from continuing operations $211 $268
(21)% $797 $208 283% Income from continuing operations per diluted share $4.21 $5.38 (22)% $15.95 $4.35 267% Weighted average shares outstanding –
diluted 50.0 49.8 50.0 47.9 ********************************** Pre-tax pre-provision earnings (“PPNR”)* $495 $400 24% $1,588 $1,567 1% (a) Reflective of the spinoff of Loyalty Ventures Inc. for all periods
presented.nm – not meaningful* Pre-tax pre-provision earnings is a non-GAAP financial measure. 3 Bread Financial | April 28, 2022 Diluted EPS

First Quarter 2022 Compared to First Quarter 2021 – Continuing OperationsCredit sales increased 14% to
$6.9 billion as consumer spending continued to remain strong. Average and end-of-period credit card and other loans increased 5% and 8% to $16.7 and $16.8 billion, respectively, driven by strong credit sales and the recovering economy. Revenue
increased 15%, or $119 million, resulting from higher average loan balances, improved loan yields, and improvement in our cost of funds.Total non-interest expenses increased 6%, or $24 million, as employee compensation and benefit costs
increased 13%, or $20 million, primarily driven by increased salaries, continued digital and technology modernization-related hiring, and higher volume-related staffing levels.PPNR, a non-GAAP measure (as defined and reconciled below), improved
by $95 million, or 24%, reflecting profitable loan growth and improved funding costs.Net income from continuing operations decreased $57 million, as the PPNR improvement described above was more than offset by a $165 million net reserve release
in provision for credit losses in the prior year period.Delinquency rate of 4.1% increased from 3.8% in 1Q21 as a result of gradual consumer payment rate normalization.Net loss rate of 4.8% improved from 5.0% in 1Q21 and remains well-below our
historical average net loss rate primarily due to improved economic conditions and proactive risk management.Repurchased 200,000 shares in the first quarter of 2022. ContactsInvestor Relations: Brian Vereb ([email protected]),
614-528-4516 Media Relations: Shelley Whiddon ([email protected]), 214-494-3811 Rachel Stultz ([email protected]), 614-729-4890 4 Bread Financial | April 28, 2022

Forward-Looking StatementsThis release contains forward-looking statements within the meaning of Section
27A of the Securities Act of 1933 and Section 21E of the Securities Exchange Act of 1934. Forward-looking statements give our expectations or forecasts of future events and can generally be identified by the use of words such as "believe,"
"expect," "anticipate," "estimate," "intend," "project," "plan," "likely," "may," "should" or other words or phrases of similar import. Similarly, statements that describe our business strategy, outlook, objectives, plans, intentions or goals
also are forward-looking statements. Examples of forward-looking statements include, but are not limited to, statements we make regarding, and the guidance we give with respect to, our anticipated operating or financial results, future
financial performance and outlook, initiation or completion of strategic initiatives, including our ability to realize the intended benefits of the spinoff of the LoyaltyOne® segment, future dividend declarations, and future economic
conditions, including, but not limited to, market conditions, inflation, developments in the geopolitical environment, including the war in Ukraine, and the ongoing effects of the global COVID-19 pandemic, which remain difficult to predict.We
believe that our expectations are based on reasonable assumptions. Forward-looking statements, however, are subject to a number of risks and uncertainties that could cause actual results to differ materially from the projections, anticipated
results or other expectations expressed in this release, and no assurances can be given that our expectations will prove to have been correct. These risks and uncertainties include, but are not limited to, factors set forth in the Risk Factors
section in our Annual Report on Form 10-K for the most recently ended fiscal year, which may be updated in Item 1A of, or elsewhere in, our Quarterly Reports on Form 10-Q filed for periods subsequent to such Form 10-K. Our forward-looking
statements speak only as of the date made, and we undertake no obligation, other than as required by applicable law, to update or revise any forward-looking statements, whether as a result of new information, subsequent events, anticipated or
unanticipated circumstances or otherwise.Non-GAAP Financial MeasuresWe prepare our Consolidated Financial Statements in accordance with accounting principles generally accepted in the United States of America (“GAAP”). However, certain
information included within this release, including the supplemental schedules and related investor presentation, constitutes non-GAAP financial measures. Our calculations of non-GAAP financial measures may differ from the calculations of
similarly titled measures by other companies. In particular, Pre-tax pre-provision earnings (PPNR) is calculated by increasing Income from continuing operations before income taxes by Provision for credit losses. We use PPNR internally as a
metric to evaluate our results of operations before income taxes, excluding the volatility that can occur within Provision for credit losses; we believe the use of this non-GAAP financial measure provides additional clarity in understanding our
results of operations and trends. For a reconciliation of this non-GAAP financial measure to the most directly comparable GAAP measure, please see the financial tables and information that follows.Conference Call / Webcast InformationBread
Financial will host a conference call on Thursday, April 28, 2022 at 8:30 a.m. (Eastern Time) to discuss the Company’s first quarter 2022 results. The conference call will be available via the Internet at www.breadfinancial.com. There will be
several slides accompanying the webcast. Please go to the website at least 15 minutes prior to the call to register, download and install any necessary software. The recorded webcast will also be available on the Company’s website.A replay of
the conference call will be available two hours after the end of the call until 11:59 p.m. ET on Thursday, May 12, 2022. To access the replay, please dial (866) 813-9403 or (929) 458-6194 and reference conference ID number “990394”. 5 Bread
Financial | April 28, 2022

About Bread Financial™ Bread FinancialTM (NYSE: BFH) is a tech-forward financial services company
providing simple, personalized payment, lending and saving solutions. The company creates opportunities for its customers and partners through digitally enabled choices that offer ease, empowerment, financial flexibility and exceptional
customer experiences. Driven by a digital-first approach, data insights and white-label technology, Bread Financial delivers growth for its partners through a comprehensive product suite, including private label and co-brand credit cards,
installment lending, and buy now, pay later (BNPL). Bread Financial also offers direct-to-consumer solutions that give customers more access, choice and freedom through its branded Bread CashbackTM American Express® Credit Card and Bread
SavingsTM products. Formerly Alliance Data, Bread Financial is an S&P MidCap 400 company headquartered in Columbus, Ohio, and committed to sustainable business practices powered by its 6,000+ global associates. To learn more about Bread
Financial, visit BreadFinancial.com or follow us on Facebook, LinkedIn, Twitter and Instagram. 6 Bread Financial | April 28, 2022

Three Months Ended March 31, Year EndedMarch 31,
2022 2021 2022 2021 Interest income: Interest and fees on loans $ 1,066 $ 941 $ 3,861 $ 3,931 Interest on cash and
investment securities 2 1 7 21 Total interest income 1,068 942 3,868 3,952 Interest expense: Interest on
deposits 34 47 167 238 Interest on borrowings 45 60 216 261 Total interest expense 79 107 383 499 Net interest
income 989 835 3,485 3,453 Non-interest income: Interchange revenue, net of retailer share
arrangements (96 ) (68 ) (369 ) (332 ) Other 28 35 156 177 Total non-interest income (68 ) (33 ) (213 ) (155 ) Total net interest and
non-interest income 921 802 3,272 3,298 Provision for credit losses 193 33 544 1,266 Total net interest and non-interest income, after provision for credit
losses 728 769 2,728 2,032 Non-interest expenses: Employee compensation and benefits 179 159 671 609 Card and
processing expenses 82 78 323 396 Information processing and communication 56 51 216 191 Marketing
expense 31 42 160 143 Depreciation and amortization 21 25 92 106 Other 57 47 222 286 Total non-interest
expenses 426 402 1,684 1,731 Income from continuing operations before income taxes 302 367 1,044 301 Provision for income
taxes 91 99 247 93 Income from continuing operations 211 268 797 208 (Loss) income from discontinued operations, net of taxes
(1 ) 18 4 6 Net income $ 210 $ 286 $ 801 $ 214 Basic earnings per
share: Income from continuing operations $ 4.23 $ 5.39 $ 16.02 $ 4.36 (Loss) income from discontinued
operations (0.01 ) 0.37 0.07 0.11 Net income per share $ 4.22 $ 5.76 $ 16.09 $ 4.47 Diluted earnings per
share: Income from continuing operations $ 4.21 $ 5.38 $ 15.95 $ 4.35 (Loss) income from discontinued
operations (0.01 ) 0.36 0.07 0.11 Net income per diluted share $ 4.20 $ 5.74 $ 16.02 $ 4.46 Weighted average
shares: Basic 49.9 49.7 49.7 47.8 Diluted 50.0 49.8 50.0 47.9 Pre-tax
pre-provision earnings*: Income from continuing operations before income taxes $ 302 $ 367 $ 1,044 $ 301 Provision for credit
losses 193 33 544 1,266 Pre-tax pre-provision earnings $ 495 $ 400 $ 1,588 $ 1,567 BREAD FINANCIAL HOLDINGSUNAUDITED CONDENSED CONSOLIDATED STATEMENTS OF INCOME(In
millions, except per share amounts) * Pre-tax pre-provision earnings (“PPNR”) is a non-GAAP financial measure. 7 Bread Financial | April 28, 2022

March 31, 2022 December 31, 2021 Assets Cash and cash equivalents
$ 2,930 $ 3,046 Credit card and other loans: Total credit card and other loans 16,843 17,399 Allowance for credit losses (1,826 ) (1,832 ) Credit card and other loans, net
15,017 15,567 Investment securities 233 239 Property and equipment, net 220 215 Goodwill and intangible assets, net 682 687 Other assets 1,856 1,992 Total assets
$ 20,938 $ 21,746 Liabilities and Stockholders’ Equity Deposits $ 10,646 $ 11,027 Debt issued by consolidated variable interest entities 4,816 5,453 Long-term and
other debt 1,962 1,986 Other liabilities 1,246 1,194 Total liabilities 18,670 19,660 Stockholders’ equity 2,268 2,086 Total liabilities and stockholders’ equity
$ 20,938 $ 21,746 Shares of common stock outstanding 49.8 49.8 BREAD FINANCIAL HOLDINGSUNAUDITED CONDENSED CONSOLIDATED BALANCE SHEETS(In millions) 8 Bread Financial | April 28, 2022
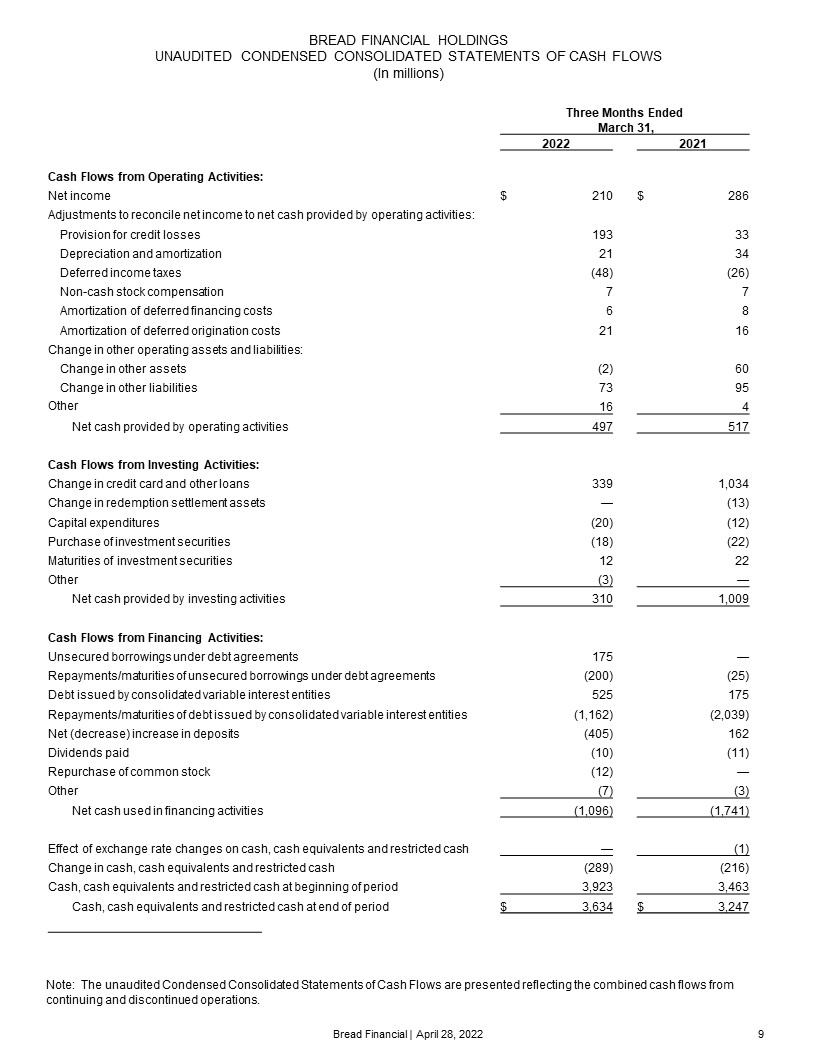
Note: The unaudited Condensed Consolidated Statements of Cash Flows are presented reflecting the combined
cash flows from continuing and discontinued operations. BREAD FINANCIAL HOLDINGSUNAUDITED CONDENSED CONSOLIDATED STATEMENTS OF CASH FLOWS(In millions) 9 Bread Financial | April 28, 2022 Three Months Ended March
31, 2022 2021 Cash Flows from Operating Activities: Net income $ 210 $ 286 Adjustments to reconcile net income to net
cash provided by operating activities: Provision for credit losses 193 33 Depreciation and amortization 21 34 Deferred income
taxes (48) (26) Non-cash stock compensation 7 7 Amortization of deferred financing costs 6 8 Amortization of deferred origination
costs 21 16 Change in other operating assets and liabilities: Change in other assets (2) 60 Change in other
liabilities 73 95 Other 16 4 Net cash provided by operating activities 497 517 Cash Flows from Investing
Activities: Change in credit card and other loans 339 1,034 Change in redemption settlement assets — (13) Capital
expenditures (20) (12) Purchase of investment securities (18) (22) Maturities of investment securities 12 22 Other (3) — Net
cash provided by investing activities 310 1,009 Cash Flows from Financing Activities: Unsecured borrowings under debt
agreements 175 — Repayments/maturities of unsecured borrowings under debt agreements (200) (25) Debt issued by consolidated variable interest
entities 525 175 Repayments/maturities of debt issued by consolidated variable interest entities (1,162) (2,039) Net (decrease) increase in
deposits (405) 162 Dividends paid (10) (11) Repurchase of common stock (12) — Other (7) (3) Net cash used in financing
activities (1,096) (1,741) Effect of exchange rate changes on cash, cash equivalents and restricted cash — (1) Change in cash, cash equivalents and restricted
cash (289) (216) Cash, cash equivalents and restricted cash at beginning of period 3,923 3,463 Cash, cash equivalents and restricted cash at end of
period $ 3,634 $ 3,247
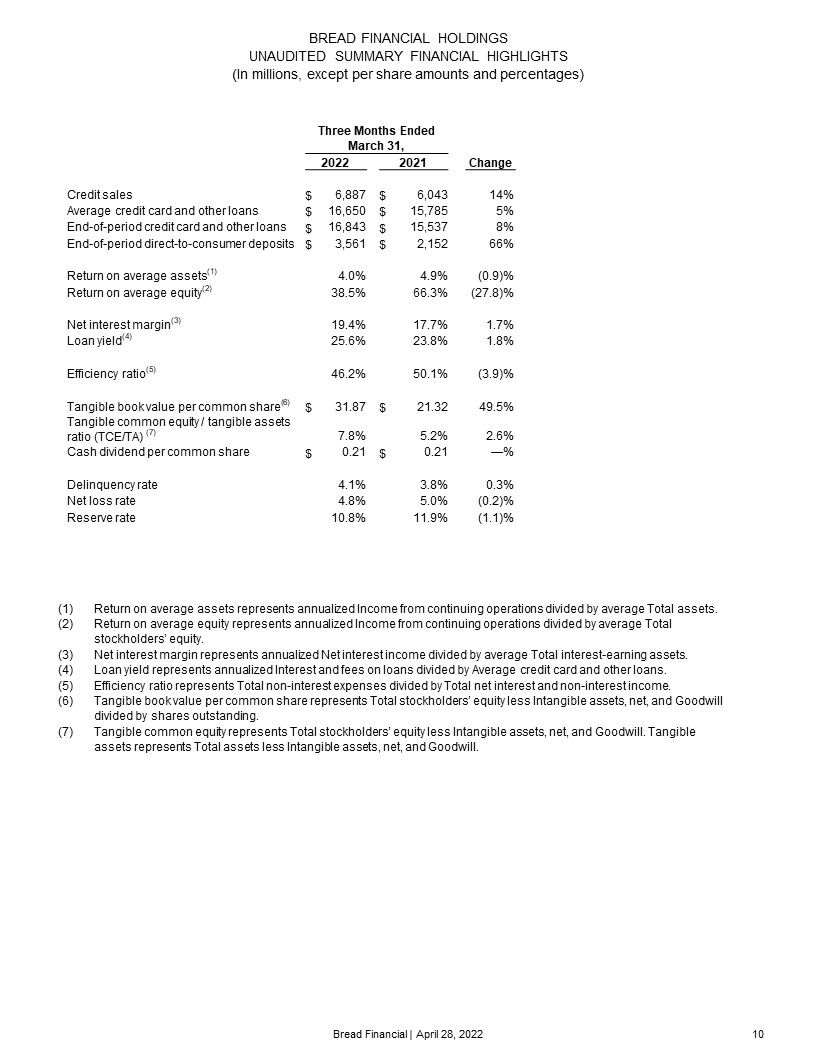
BREAD FINANCIAL HOLDINGSUNAUDITED SUMMARY FINANCIAL HIGHLIGHTS(In millions, except per share amounts and
percentages) 10 Bread Financial | April 28, 2022 Three Months Ended March 31, Year EndedMarch
31, 2022 2021 Change 2021 2020 Change Credit
sales $ 6,887 $ 6,043 14% $ 29,603 $ 24,707 20% Average credit card and other
loans $ 16,650 $ 15,785 5% $ 15,656 $ 16,367 (4)% End-of-period credit card and other
loans $ 16,843 $ 15,537 8% $ 17,399 $ 16,784 4% End-of-period direct-to-consumer
deposits $ 3,561 $ 2,152 66% $ 3,180 $ 1,700 87% Return on average
assets(1) 4.0% 4.9% (0.9)% 3.6% 0.9% 2.7% Return on average
equity(2) 38.5% 66.3% (27.8)% 40.7% 16.7% 24.0% Net interest
margin(3) 19.4% 17.7% 1.7% 18.2% 16.8% 1.4% Loan
yield(4) 25.6% 23.8% 1.8% 24.7% 24.0% 0.7% Efficiency
ratio(5) 46.2% 50.1% (3.9)% 51.5% 52.5% (1.0)% Tangible book value per common
share(6) $ 31.87 $ 21.32 49.5% $ 28.09 $ 16.34 71.9% Tangible common equity / tangible assets ratio (TCE/TA)
(7) 7.8% 5.2% 2.6% 6.6% 3.7% 2.9% Cash dividend per common
share $ 0.21 $ 0.21 —% $ 0.84 $ 1.26 (33.3)% Delinquency
rate 4.1% 3.8% 0.3% 4.6% 6.6% (2.0)% Net loss rate 4.8% 5.0% (0.2)% 3.9% 4.4% (0.5)% Reserve
rate 10.8% 11.9% (1.1)% 10.5% 12.0% (1.5)% Return on average assets represents annualized Income from continuing operations divided by average Total assets.Return on average equity
represents annualized Income from continuing operations divided by average Total stockholders’ equity.Net interest margin represents annualized Net interest income divided by average Total interest-earning assets.Loan yield represents
annualized Interest and fees on loans divided by Average credit card and other loans.Efficiency ratio represents Total non-interest expenses divided by Total net interest and non-interest income.Tangible book value per common share represents
Total stockholders’ equity less Intangible assets, net, and Goodwill divided by shares outstanding.Tangible common equity represents Total stockholders’ equity less Intangible assets, net, and Goodwill. Tangible assets represents Total assets
less Intangible assets, net, and Goodwill.
Bread FinancialFirst Quarter 2022 Results ©2022 Bread Financial | Confidential & Proprietary 1 Ralph
AndrettaPresident & CEOPerry BebermanEVP & CFO April 28, 2022 Exhibit 99.2
Forward-Looking Statements This presentation contains forward-looking statements within the meaning of
Section 27A of the Securities Act of 1933 and Section 21E of the Securities Exchange Act of 1934. Forward-looking statements give our expectations or forecasts of future events and can generally be identified by the use of words such as
"believe," "expect," "anticipate," "estimate," "intend," "project," "plan," "likely," "may," "should" or other words or phrases of similar import. Similarly, statements that describe our business strategy, outlook, objectives, plans, intentions
or goals also are forward-looking statements. Examples of forward-looking statements include, but are not limited to, statements we make regarding, and the guidance we give with respect to, our anticipated operating or financial results, future
financial performance and outlook, initiation or completion of strategic initiatives, including our ability to realize the intended benefits of the spinoff of the LoyaltyOne® segment, future dividend declarations, and future economic conditions,
including, but not limited to, market conditions, inflation, developments in the geopolitical environment, including the war in Ukraine, and the ongoing effects of the global COVID-19 pandemic, which remain difficult to predict.We believe that
our expectations are based on reasonable assumptions. Forward-looking statements, however, are subject to a number of risks and uncertainties that could cause actual results to differ materially from the projections, anticipated results or other
expectations expressed in this presentation, and no assurances can be given that our expectations will prove to have been correct. These risks and uncertainties include, but are not limited to, factors set forth in the Risk Factors section in our
Annual Report on Form 10-K for the most recently ended fiscal year, which may be updated in Item 1A of, or elsewhere in, our Quarterly Reports on Form 10-Q filed for periods subsequent to such Form 10-K. Our forward-looking statements speak only
as of the date made, and we undertake no obligation, other than as required by applicable law, to update or revise any forward-looking statements, whether as a result of new information, subsequent events, anticipated or unanticipated
circumstances or otherwise. Non-GAAP Financial Measures We prepare our Consolidated Financial Statements in accordance with accounting principles generally accepted in the United States of America (“GAAP”). However, certain information included
within this presentation, constitutes non-GAAP financial measures. Our calculations of non-GAAP financial measures may differ from the calculations of similarly titled measures by other companies. In particular, Pre-tax pre-provision earnings
(“PPNR”) is calculated by increasing Income from continuing operations before income taxes by Provision for credit losses. We use PPNR internally as a metric to evaluate our results of operations before income taxes, excluding the volatility that
can occur within Provision for credit losses; we believe the use of this non-GAAP financial measure provides additional clarity in understanding our results of operations and trends. For a reconciliation of this non-GAAP financial measure to the
most directly comparable GAAP measure, please see the financial tables and information that follows. For a reconciliation of these non-GAAP financial measures to the most directly comparable GAAP measures, please see the financial tables and
information that follows. ©2022 Bread Financial 2
3 A tech-forward financial services company providing simple, personalized payment, lending, and saving
solutions ©2022 Bread Financial
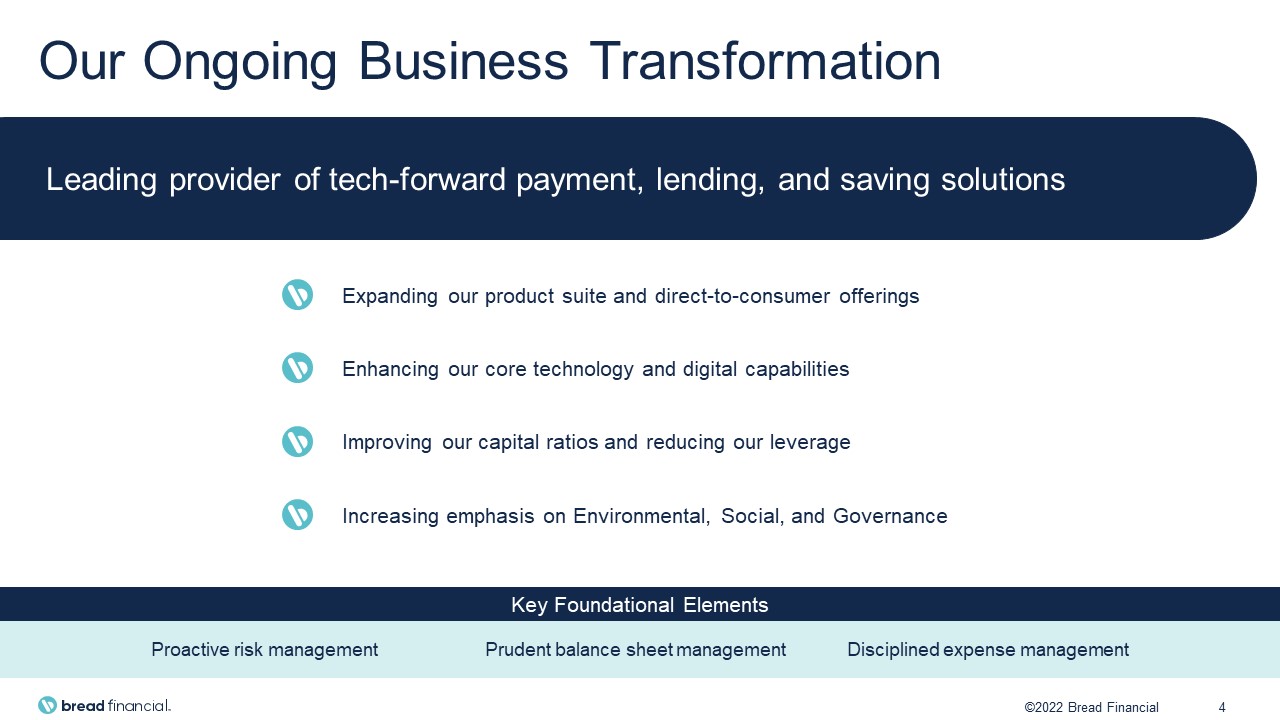
Proactive risk management Prudent balance sheet management Disciplined expense management Our Ongoing
Business Transformation Leading provider of tech-forward payment, lending, and saving solutions 4 Key Foundational Elements Expanding our product suite and direct-to-consumer offerings Enhancing our core technology and digital
capabilities Improving our capital ratios and reducing our leverage Increasing emphasis on Environmental, Social, and Governance ©2022 Bread Financial
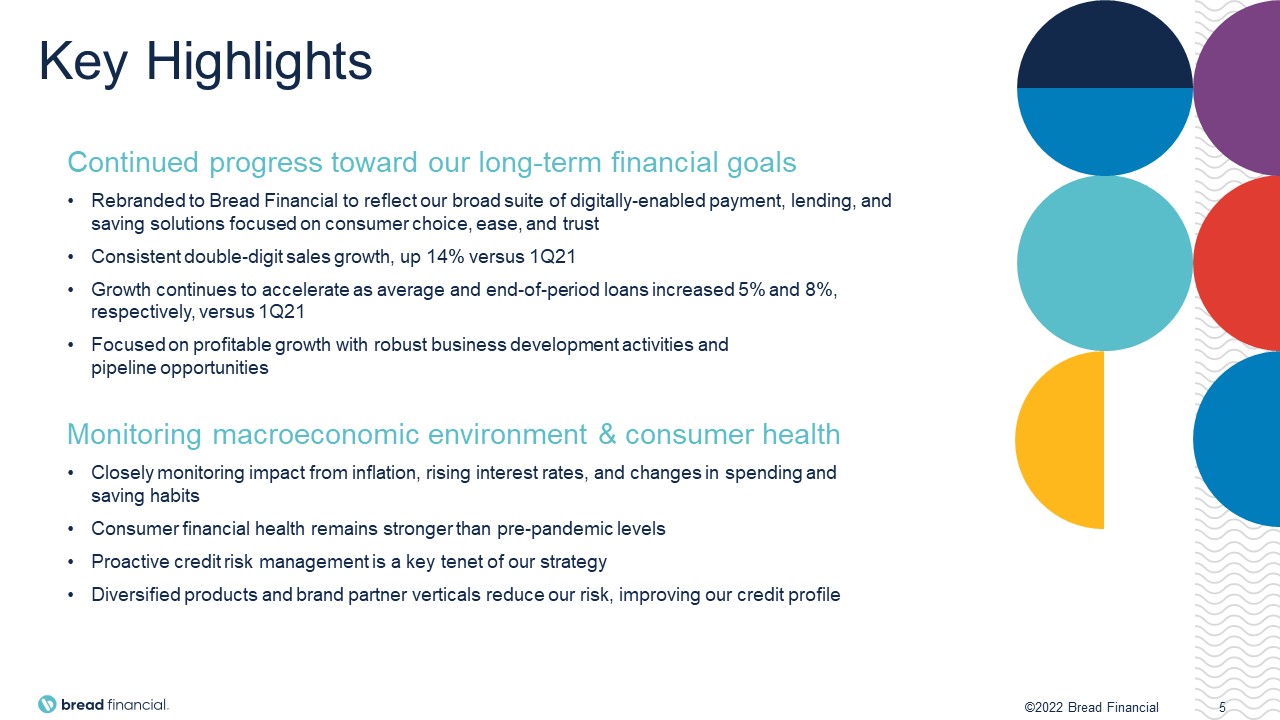
Continued progress toward our long-term financial goalsRebranded to Bread Financial to reflect our broad
suite of digitally-enabled payment, lending, and saving solutions focused on consumer choice, ease, and trustConsistent double-digit sales growth, up 14% versus 1Q21Growth continues to accelerate as average and end-of-period loans increased 5%
and 8%, respectively, versus 1Q21Focused on profitable growth with robust business development activities and pipeline opportunities Monitoring macroeconomic environment & consumer healthClosely monitoring impact from inflation, rising
interest rates, and changes in spending and saving habitsConsumer financial health remains stronger than pre-pandemic levelsProactive credit risk management is a key tenet of our strategyDiversified products and brand partner verticals reduce our
risk, improving our credit profile ©2022 Bread Financial | Confidential & Proprietary 5 Key Highlights ©2022 Bread Financial 5
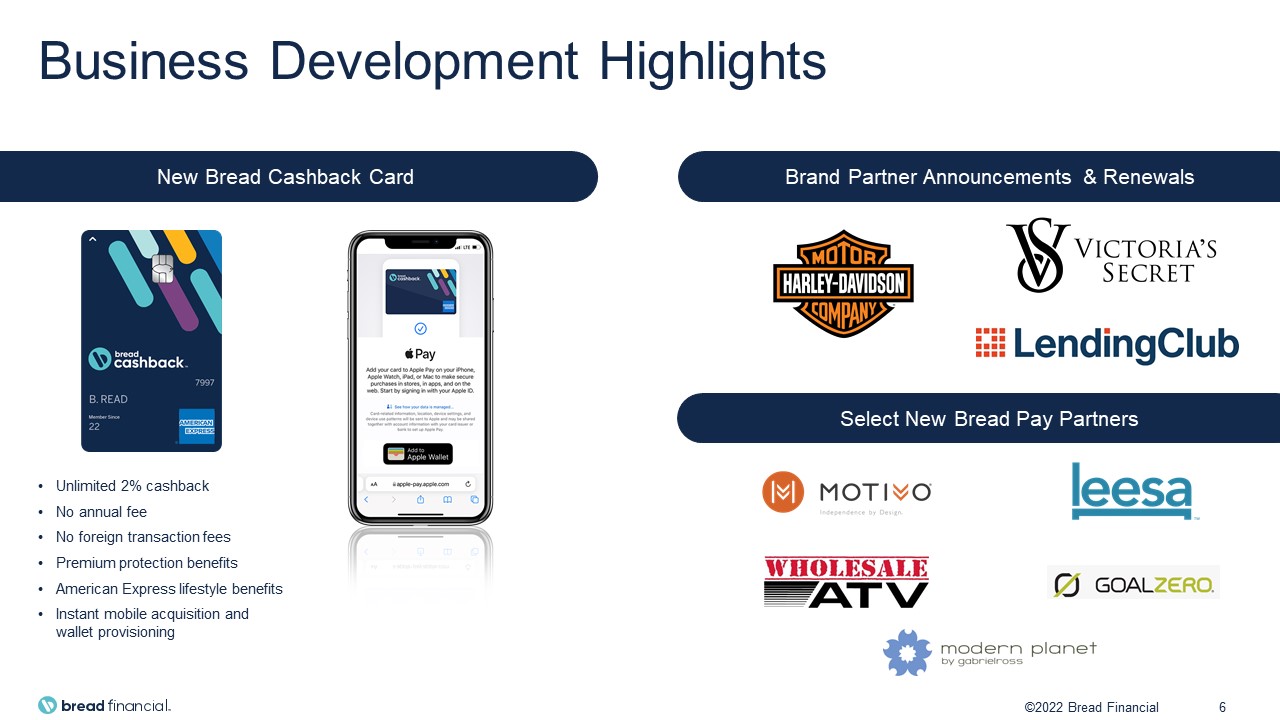
Unlimited 2% cashbackNo annual feeNo foreign transaction feesPremium protection benefitsAmerican Express
lifestyle benefitsInstant mobile acquisition and wallet provisioning Business Development Highlights Brand Partner Announcements & Renewals New Bread Cashback Card Select New Bread Pay Partners 6 ©2022 Bread Financial
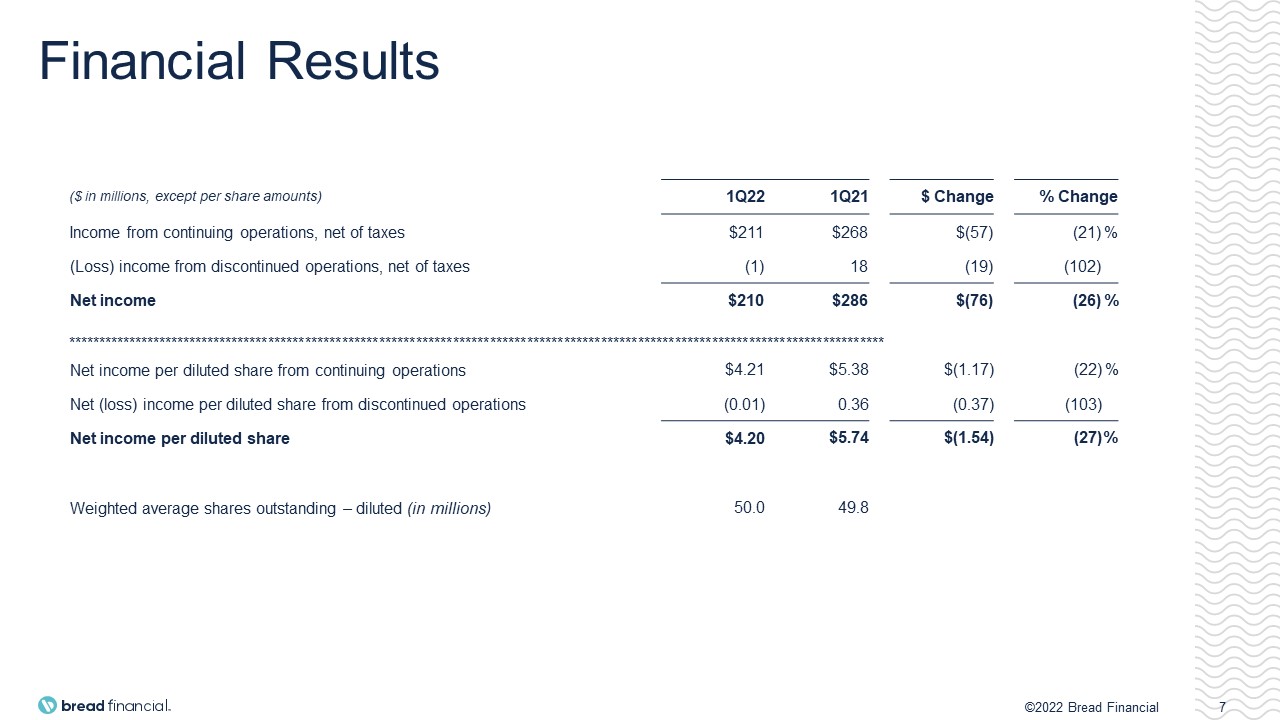
Financial Results ($ in millions, except per share amounts) 1Q22 1Q21 $ Change %
Change Income from continuing operations, net of taxes $211 $268 $(57) (21) % (Loss) income from discontinued operations, net of taxes (1) 18 (19) (102) Net
income $210 $286 $(76) (26) % ************************************************************************************************************************************* Net income per diluted share from continuing
operations $4.21 $5.38 $(1.17) (22) % Net (loss) income per diluted share from discontinued operations (0.01) 0.36 (0.37) (103) Net income per diluted share $4.20 $5.74 $(1.54) (27) % Weighted
average shares outstanding – diluted (in millions) 50.0 49.8 7 ©2022 Bread Financial
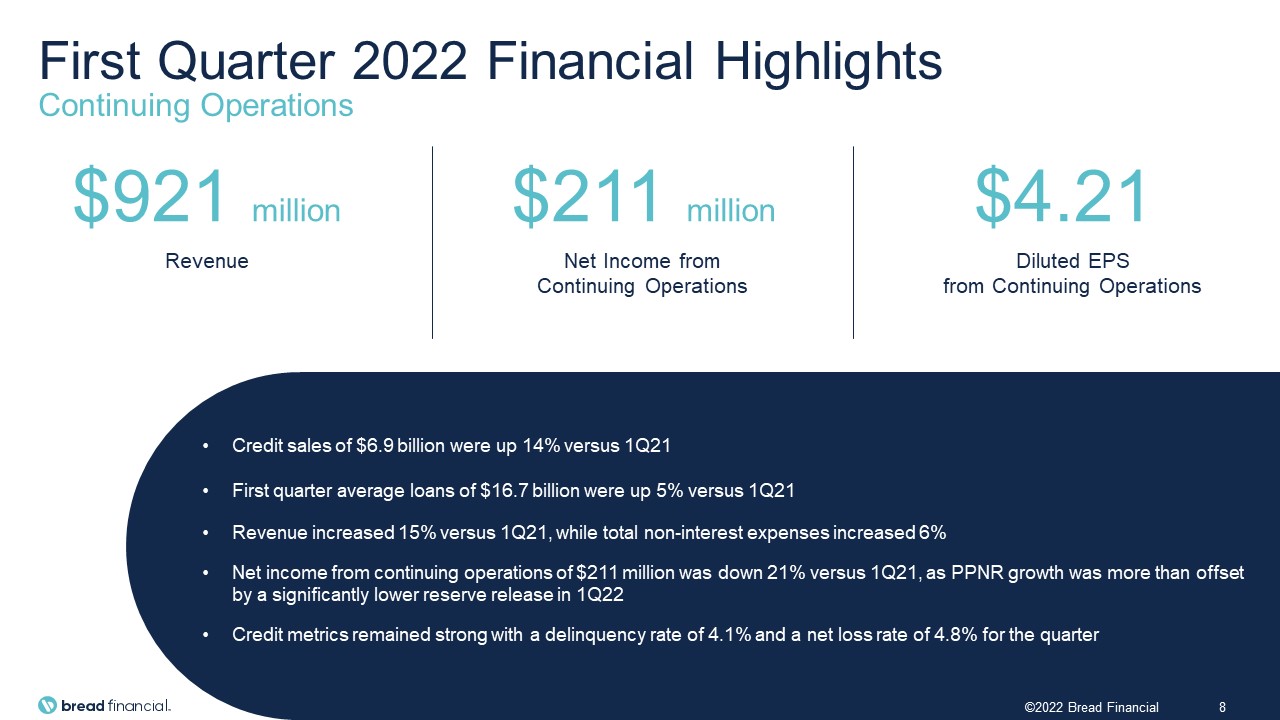
First Quarter 2022 Financial HighlightsContinuing Operations 8 Credit sales of $6.9 billion were up 14%
versus 1Q21First quarter average loans of $16.7 billion were up 5% versus 1Q21Revenue increased 15% versus 1Q21, while total non-interest expenses increased 6%Net income from continuing operations of $211 million was down 21% versus 1Q21, as PPNR
growth was more than offset by a significantly lower reserve release in 1Q22Credit metrics remained strong with a delinquency rate of 4.1% and a net loss rate of 4.8% for the quarter $921 million Revenue $211 million Net Income from
Continuing Operations $4.21 Diluted EPSfrom Continuing Operations 8 ©2022 Bread Financial
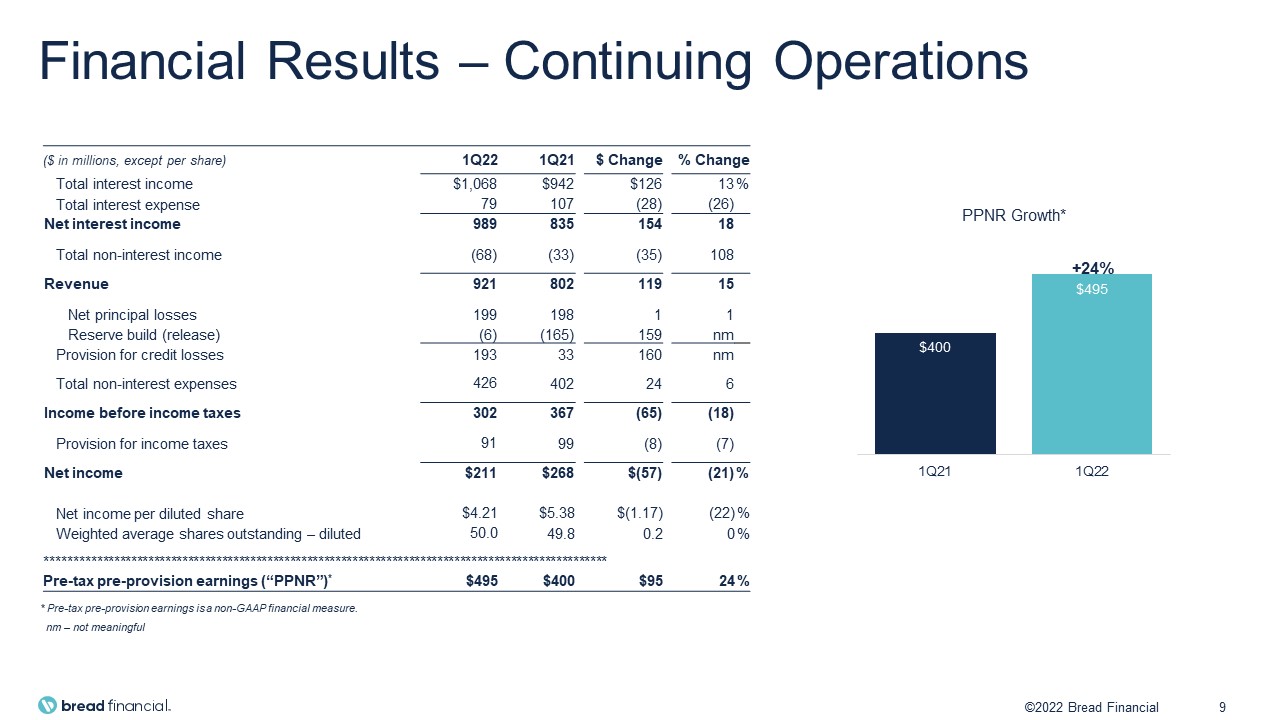
Financial Results – Continuing Operations ($ in millions, except per share) 1Q22 1Q21 $ Change %
Change 2022 YTD FY21 % Change Total interest income $1,068 $942 $126 13 % $3,868 (2) % Total interest expense 79 107 (28) (26) 383 (23) Net interest
income 989 835 154 18 3,485 1 Total non-interest
income (68) (33) (35) 108 (213) 38 Revenue 921 802 119 15 3,272 (1) Net principal losses 199 198 1 1 720 (34) Reserve build
(release) (6) (165) 159 nm (176) nm Provision for credit losses 193 33 160 nm 544 (57) Total non-interest
expenses 426 402 24 6 1,684 (3) Income before income taxes 302 367 (65) (18) 1,044 247 Provision for income
taxes 91 99 (8) (7) 247 168 Net income $211 $268 $(57) (21) % $797 283 % Net income per diluted
share $4.21 $5.38 $(1.17) (22) % $15.95 267 % Weighted average shares outstanding –
diluted 50.0 49.8 0.2 0 % 50.0 4 % ************************************************************************************************************************ Pre-tax pre-provision earnings
(“PPNR”)* $495 $400 $95 24 % $1,588 1 % * Pre-tax pre-provision earnings is a non-GAAP financial measure. nm – not meaningful 9 +24% ©2022 Bread Financial

Net Interest Margin Average interest-bearing liabilities ($ in billions) Loan yield Avg. earning
asset yield Net interest margin Cost of total int.-bearing liab. Cost of deposits Average interest-earning assets ($ in billions) 10 ©2022 Bread Financial
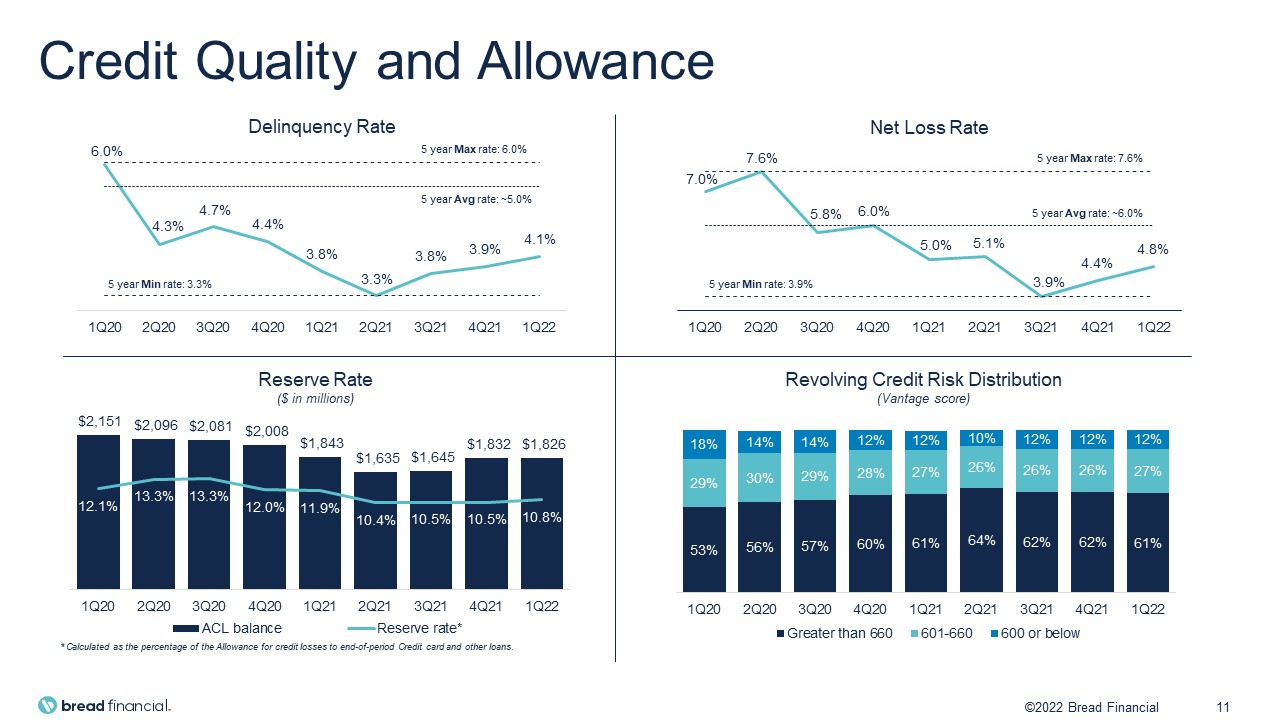
Credit Quality and Allowance Reserve Rate ($ in millions) Net Loss Rate Delinquency Rate 5 year Max
rate: 7.6% 5 year Min rate: 3.9% 5 year Avg rate: ~6.0% * Calculated as the percentage of the Allowance for credit losses to end-of-period Credit card and other loans. Revolving Credit Risk Distribution(Vantage score) 5 year Max rate:
6.0% 5 year Avg rate: ~5.0% 5 year Min rate: 3.3% 11 ©2022 Bread Financial
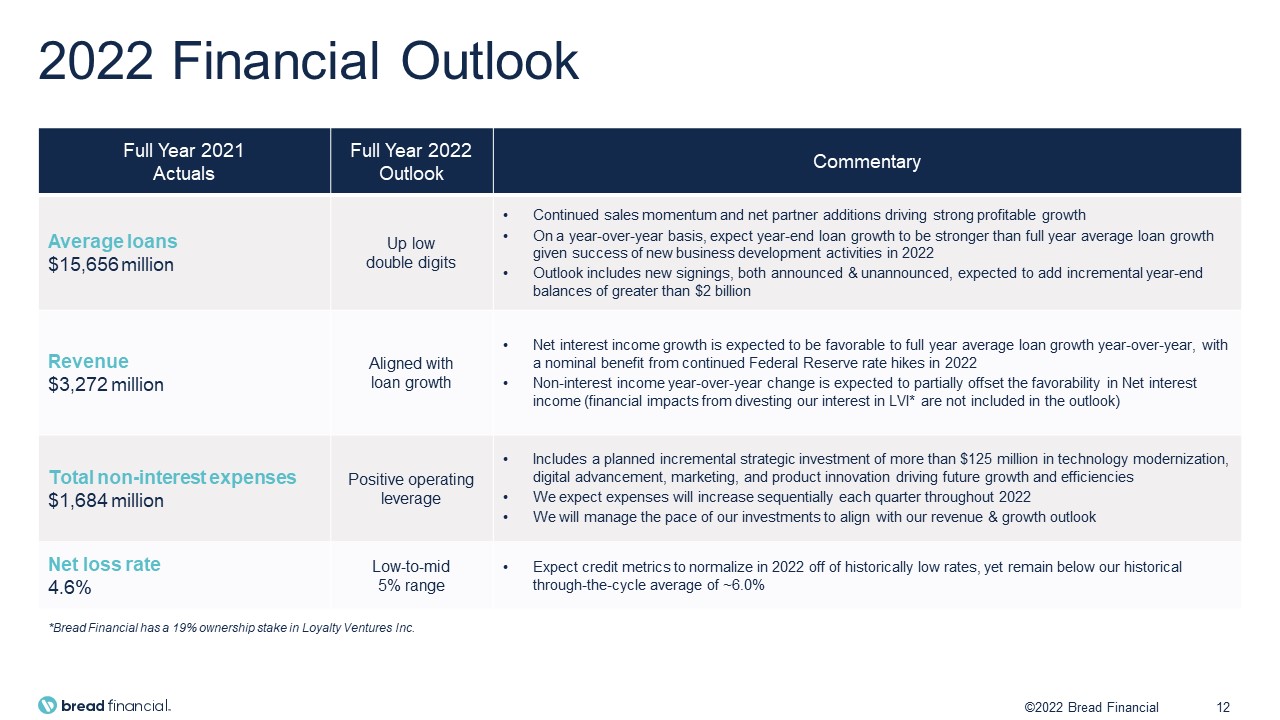
2022 Financial Outlook Full Year 2021Actuals Full Year 2022Outlook Commentary Average loans $15,656
million Up low double digits Continued sales momentum and net partner additions driving strong profitable growthOn a year-over-year basis, expect year-end loan growth to be stronger than full year average loan growth given success of new
business development activities in 2022Outlook includes new signings, both announced & unannounced, expected to add incremental year-end balances of greater than $2 billion Revenue$3,272 million Aligned with loan growth Net interest income
growth is expected to be favorable to full year average loan growth year-over-year, with a nominal benefit from continued Federal Reserve rate hikes in 2022Non-interest income year-over-year change is expected to partially offset the favorability
in Net interest income (financial impacts from divesting our interest in LVI* are not included in the outlook) Total non-interest expenses$1,684 million Positive operating leverage Includes a planned incremental strategic investment of more
than $125 million in technology modernization, digital advancement, marketing, and product innovation driving future growth and efficienciesWe expect expenses will increase sequentially each quarter throughout 2022We will manage the pace of our
investments to align with our revenue & growth outlook Net loss rate4.6% Low-to-mid 5% range Expect credit metrics to normalize in 2022 off of historically low rates, yet remain below our historical through-the-cycle average of
~6.0% *Bread Financial has a 19% ownership stake in Loyalty Ventures Inc. 12 ©2022 Bread Financial

Appendix ©2022 Bread Financial | Confidential & Proprietary 13

Average Loans and Credit Sales ($ in billions) Loans continue to inflect higher with strong
year-over-year credit sales growth providing momentum 14 ©2022 Bread Financial

Total Non-Interest Expenses $ in millions +6% Total non-interest expenses were up 6% versus 1Q21Employee
compensation and benefit costs increased 13%, primarily driven by increased salaries, continued digital and technology modernization-related hiring, and higher volume-related staffing levels.Marketing expenses decreased primarily due to timing of
marketing spend in the current year and higher marketing costs related to card program enhancements in 1Q21.Other expenses increased primarily due to legal and other business activity costs. -4% 5% 13% 8% (27)% (16)% 20% 15 ©2022 Bread
Financial
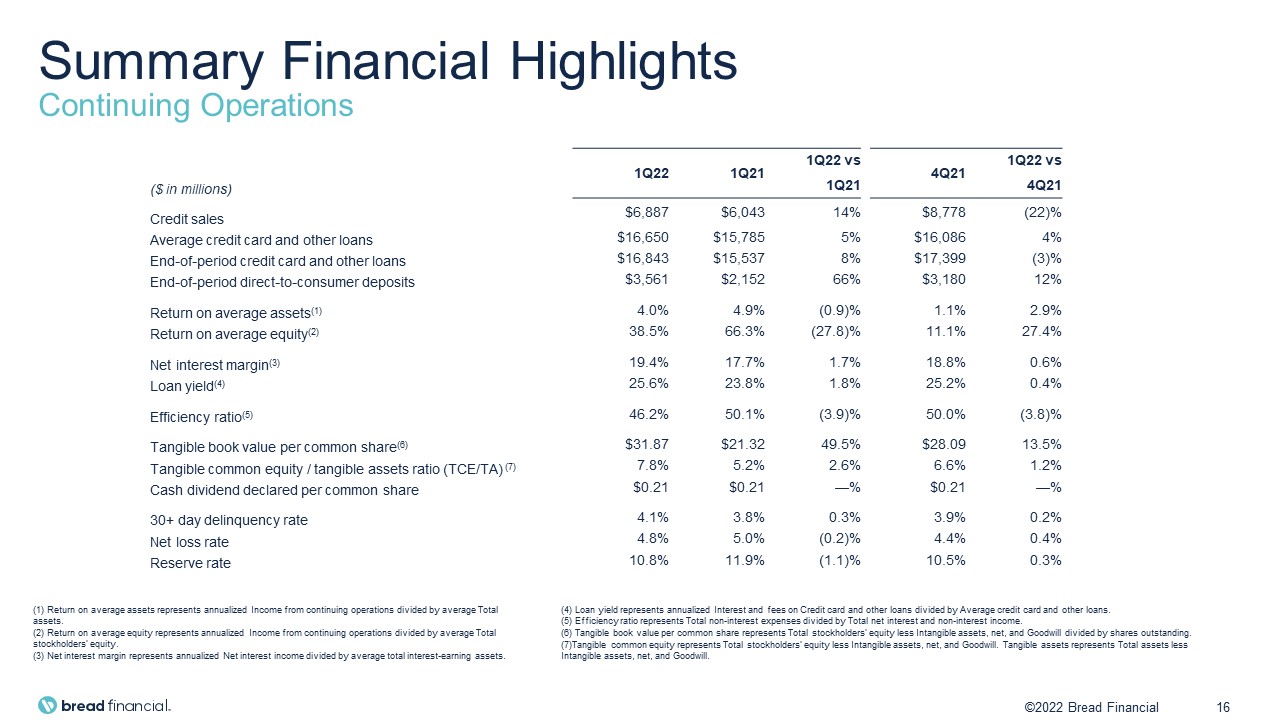
Summary Financial HighlightsContinuing Operations ($ in millions) 1Q22 1Q21 1Q22 vs 4Q21 1Q22
vs 2022 YTD FY21 2022 YTD vs 1Q21 4Q21 FY21 Credit sales $6,887 $6,043 14% $8,778 (22)% $29,603 20% Average credit card and other loans $16,650 $15,785 5% $16,086 4% $15,656 (4)% End-of-period
credit card and other loans $16,843 $15,537 8% $17,399 (3)% $17,399 4% End-of-period direct-to-consumer deposits $3,561 $2,152 66% $3,180 12% $3,180 87% Return on average
assets(1) 4.0% 4.9% (0.9)% 1.1% 2.9% 3.6% 2.7% Return on average equity(2) 38.5% 66.3% (27.8)% 11.1% 27.4% 40.7% 24.0% Net interest
margin(3) 19.4% 17.7% 1.7% 18.8% 0.6% 18.2% 1.4% Loan yield(4) 25.6% 23.8% 1.8% 25.2% 0.4% 24.7% 0.7% Efficiency
ratio(5) 46.2% 50.1% (3.9)% 50.0% (3.8)% 51.5% (1.0)% Tangible book value per common share(6) $31.87 $21.32 49.5% $28.09 13.5% $28.09 71.9% Tangible common equity / tangible assets ratio (TCE/TA)
(7) 7.8% 5.2% 2.6% 6.6% 1.2% 6.6% 2.9% Cash dividend declared per common share $0.21 $0.21 —% $0.21 —% $0.84 (33.3)% 30+ day delinquency rate 4.1% 3.8% 0.3% 3.9% 0.2% 3.9% (0.5)% Net
loss rate 4.8% 5.0% (0.2)% 4.4% 0.4% 4.6% (2.0)% Reserve rate 10.8% 11.9% (1.1)% 10.5% 0.3% 10.5% (1.5)% (1) Return on average assets represents annualized Income from continuing operations divided by average Total
assets. (2) Return on average equity represents annualized Income from continuing operations divided by average Total stockholders’ equity. (3) Net interest margin represents annualized Net interest income divided by average total
interest-earning assets. (4) Loan yield represents annualized Interest and fees on Credit card and other loans divided by Average credit card and other loans.(5) Efficiency ratio represents Total non-interest expenses divided by Total net
interest and non-interest income. (6) Tangible book value per common share represents Total stockholders’ equity less Intangible assets, net, and Goodwill divided by shares outstanding. (7)Tangible common equity represents Total stockholders’
equity less Intangible assets, net, and Goodwill. Tangible assets represents Total assets less Intangible assets, net, and Goodwill. 16 ©2022 Bread Financial
(1) Return on average assets represents annualized Income from continuing operations divided by average
Total assets. (2) Return on average equity represents annualized Income from continuing operations divided by average Total stockholders’ equity. (3) Net interest margin represents annualized Net interest income divided by average total
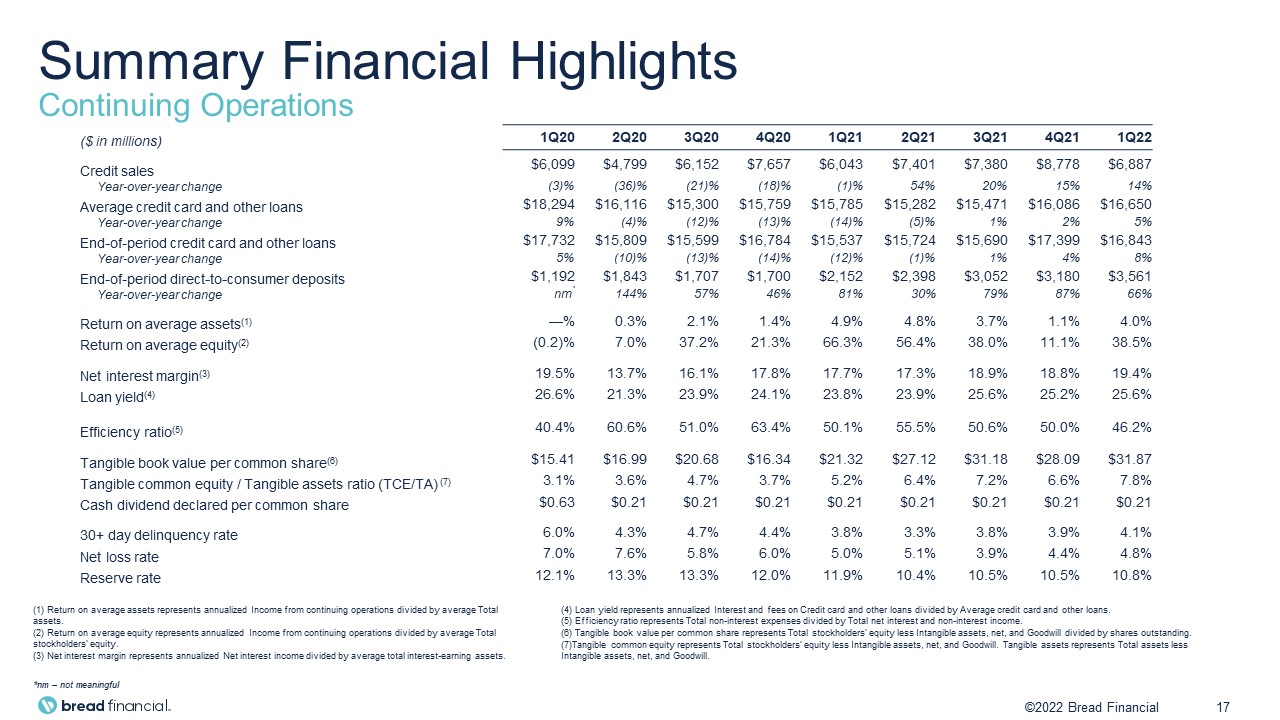
interest-earning assets. Summary Financial HighlightsContinuing Operations ($ in millions) 1Q20 2Q20 3Q20 4Q20 1Q21 2Q21 3Q21 4Q21 1Q22 2022 YTD FY21 Credit
sales $6,099 $4,799 $6,152 $7,657 $6,043 $7,401 $7,380 $8,778 $6,887 $29,603 Year-over-year change (3)% (36)% (21)% (18)% (1)% 54% 20% 15% 14% 20% Average credit card and other
loans $18,294 $16,116 $15,300 $15,759 $15,785 $15,282 $15,471 $16,086 $16,650 $15,656 Year-over-year change 9% (4)% (12)% (13)% (14)% (5)% 1% 2% 5% (4)% End-of-period credit card and other
loans $17,732 $15,809 $15,599 $16,784 $15,537 $15,724 $15,690 $17,399 $16,843 $17,399 Year-over-year change 5% (10)% (13)% (14)% (12)% (1)% 1% 4% 8% 4% End-of-period direct-to-consumer
deposits $1,192 $1,843 $1,707 $1,700 $2,152 $2,398 $3,052 $3,180 $3,561 $3,180 Year-over-year change nm* 144% 57% 46% 81% 30% 79% 87% 66% 87% Return on average
assets(1) —% 0.3% 2.1% 1.4% 4.9% 4.8% 3.7% 1.1% 4.0% 3.6% Return on average equity(2) (0.2)% 7.0% 37.2% 21.3% 66.3% 56.4% 38.0% 11.1% 38.5% 40.7% Net interest
margin(3) 19.5% 13.7% 16.1% 17.8% 17.7% 17.3% 18.9% 18.8% 19.4% 18.2% Loan yield(4) 26.6% 21.3% 23.9% 24.1% 23.8% 23.9% 25.6% 25.2% 25.6% 24.7% Efficiency
ratio(5) 40.4% 60.6% 51.0% 63.4% 50.1% 55.5% 50.6% 50.0% 46.2% 51.5% Tangible book value per common share(6) $15.41 $16.99 $20.68 $16.34 $21.32 $27.12 $31.18 $28.09 $31.87 $28.09 Tangible
common equity / Tangible assets ratio (TCE/TA) (7) 3.1% 3.6% 4.7% 3.7% 5.2% 6.4% 7.2% 6.6% 7.8% 6.6% Cash dividend declared per common
share $0.63 $0.21 $0.21 $0.21 $0.21 $0.21 $0.21 $0.21 $0.21 $0.84 30+ day delinquency rate 6.0% 4.3% 4.7% 4.4% 3.8% 3.3% 3.8% 3.9% 4.1% 3.9% Net loss
rate 7.0% 7.6% 5.8% 6.0% 5.0% 5.1% 3.9% 4.4% 4.8% 4.6% Reserve rate 12.1% 13.3% 13.3% 12.0% 11.9% 10.4% 10.5% 10.5% 10.8% 10.5% *nm – not meaningful 17 ©2022 Bread Financial (4) Loan yield represents annualized
Interest and fees on Credit card and other loans divided by Average credit card and other loans.(5) Efficiency ratio represents Total non-interest expenses divided by Total net interest and non-interest income. (6) Tangible book value per common
share represents Total stockholders’ equity less Intangible assets, net, and Goodwill divided by shares outstanding. (7)Tangible common equity represents Total stockholders’ equity less Intangible assets, net, and Goodwill. Tangible assets
represents Total assets less Intangible assets, net, and Goodwill.
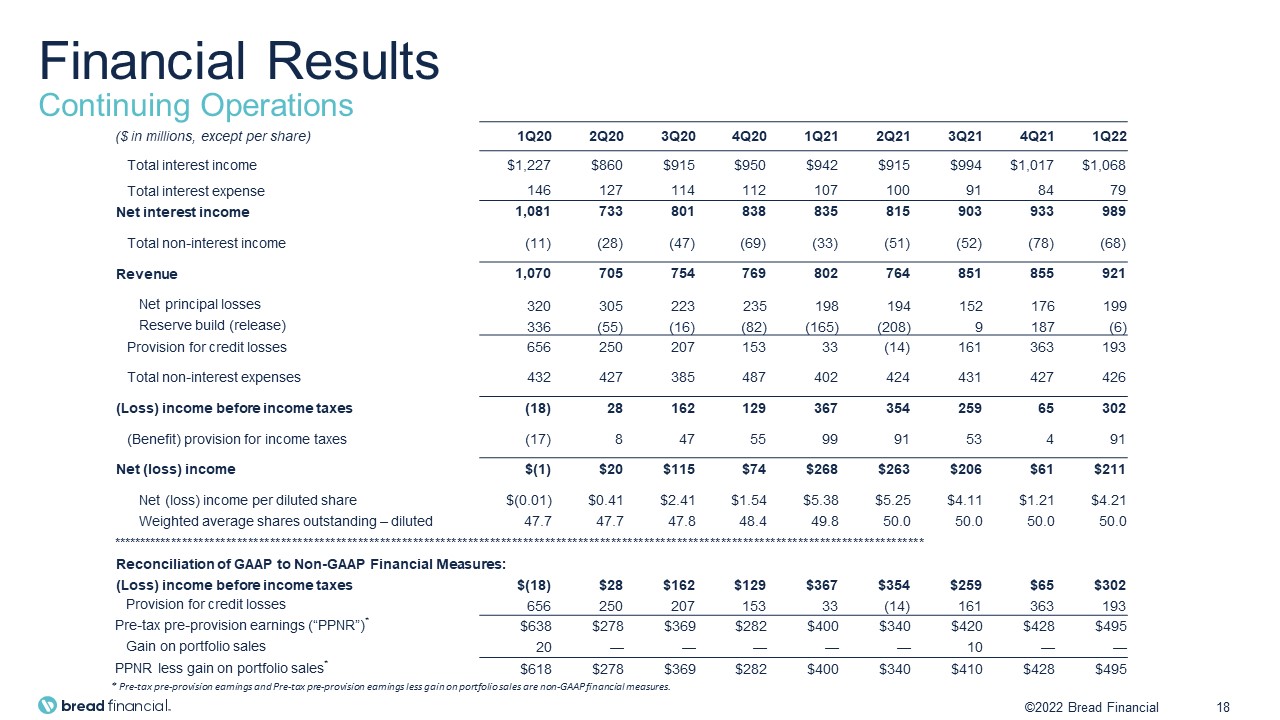
Financial ResultsContinuing Operations ($ in millions, except per
share) 1Q20 2Q20 3Q20 4Q20 1Q21 2Q21 3Q21 4Q21 1Q22 2022 YTD FY21 Total interest income $1,227 $860 $915 $950 $942 $915 $994 $1,017 $1,068 $3,868 Total interest
expense 146 127 114 112 107 100 91 84 79 383 Net interest income 1,081 733 801 838 835 815 903 933 989 3,485 Total non-interest
income (11) (28) (47) (69) (33) (51) (52) (78) (68) (213) Revenue 1,070 705 754 769 802 764 851 855 921 3,272 Net principal losses 320 305 223 235
198 194 152 176 199 720 Reserve build (release) 336 (55) (16) (82) (165) (208) 9 187 (6) Provision for credit losses 656 250 207 153 33 (14) 161 363 193 544 Total
non-interest expenses 432 427 385 487 402 424 431 427 426 1,684 (Loss) income before income taxes (18) 28 162 129 367 354 259 65 302 1,044 (Benefit) provision for
income taxes (17) 8 47 55 99 91 53 4 91 247 Net (loss) income $(1) $20 $115 $74 $268 $263 $206 $61 $211 $797 Net (loss) income per diluted
share $(0.01) $0.41 $2.41 $1.54 $5.38 $5.25 $4.11 $1.21 $4.21 $15.95 Weighted average shares outstanding – diluted
47.7 47.7 47.8 48.4 49.8 50.0 50.0 50.0 50.0 50.0 ************************************************************************************************************************************************************************** Reconciliation
of GAAP to Non-GAAP Financial Measures: (Loss) income before income taxes $(18) $28 $162 $129 $367 $354 $259 $65 $302 $1,044 Provision for credit
losses 656 250 207 153 33 (14) 161 363 193 544 Pre-tax pre-provision earnings (“PPNR”)* $638 $278 $369 $282 $400 $340 $420 $428 $495 $1,588 Gain on portfolio sales 20 — — — — — 10 — — 10 PPNR less
gain on portfolio sales* $618 $278 $369 $282 $400 $340 $410 $428 $495 $1,578 * Pre-tax pre-provision earnings and Pre-tax pre-provision earnings less gain on portfolio sales are non-GAAP financial measures. 18 ©2022 Bread
Financial
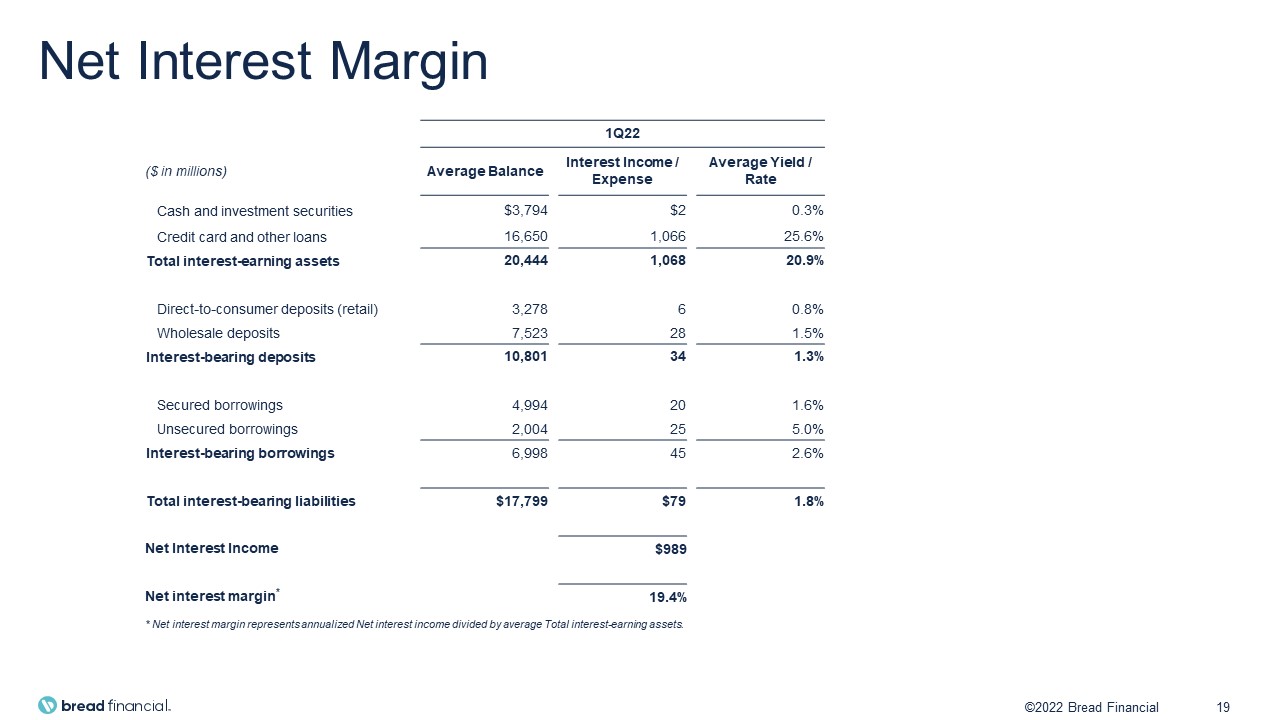
Net Interest Margin 1Q22 YTD 2022 ($ in millions) Average Balance Interest
Income / Expense Average Yield / Rate Average Balance Interest Income / Expense Average Yield / Rate Cash and investment securities $3,794 $2 0.3% $3,480 $7 0.21% Credit card and other
loans 16,650 1,066 25.6% 15,656 3,861 24.66% Total interest-earning assets 20,444 1,068 20.9% 19,136 3,868 20.21% Direct-to-consumer deposits
(retail) 3,278 6 0.8% 2,490 23 0.91% Wholesale deposits 7,523 28 1.5% 7,509 144 1.92% Interest-bearing deposits 10,801 34 1.3% 9,999 167 1.67% Secured
borrowings 4,994 20 1.6% 4,596 112 2.43% Unsecured borrowings 2,004 25 5.0% 2,699 104 3.84% Interest-bearing borrowings 6,998 45 2.6% Total interest-bearing
liabilities $17,799 $79 1.8% $17,294 $383 2.21% Net Interest Income $989 $3,485 Net interest margin* 19.4% 18.21% * Net interest margin
represents annualized Net interest income divided by average Total interest-earning assets. 19 ©2022 Bread Financial
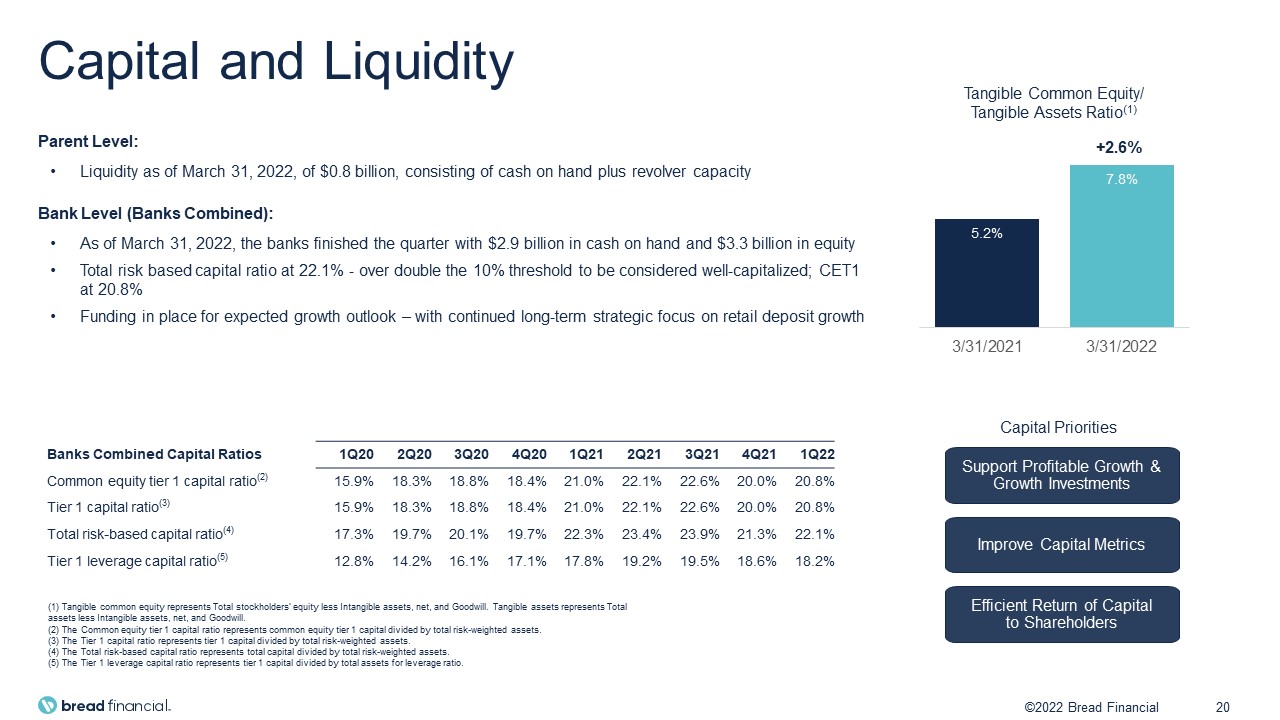
Capital and Liquidity Banks Combined Capital
Ratios 1Q20 2Q20 3Q20 4Q20 1Q21 2Q21 3Q21 4Q21 1Q22 Common equity tier 1 capital ratio(2) 15.9% 18.3% 18.8% 18.4% 21.0% 22.1% 22.6% 20.0% 20.8% Tier 1 capital
ratio(3) 15.9% 18.3% 18.8% 18.4% 21.0% 22.1% 22.6% 20.0% 20.8% Total risk-based capital ratio(4) 17.3% 19.7% 20.1% 19.7% 22.3% 23.4% 23.9% 21.3% 22.1% Tier 1 leverage capital
ratio(5) 12.8% 14.2% 16.1% 17.1% 17.8% 19.2% 19.5% 18.6% 18.2% Parent Level:Liquidity as of March 31, 2022, of $0.8 billion, consisting of cash on hand plus revolver capacityBank Level (Banks Combined):As of March 31, 2022, the banks
finished the quarter with $2.9 billion in cash on hand and $3.3 billion in equityTotal risk based capital ratio at 22.1% - over double the 10% threshold to be considered well-capitalized; CET1 at 20.8%Funding in place for expected growth outlook
– with continued long-term strategic focus on retail deposit growth (1) Tangible common equity represents Total stockholders’ equity less Intangible assets, net, and Goodwill. Tangible assets represents Total assets less Intangible assets, net,
and Goodwill.(2) The Common equity tier 1 capital ratio represents common equity tier 1 capital divided by total risk-weighted assets.(3) The Tier 1 capital ratio represents tier 1 capital divided by total risk-weighted assets.(4) The Total
risk-based capital ratio represents total capital divided by total risk-weighted assets. (5) The Tier 1 leverage capital ratio represents tier 1 capital divided by total assets for leverage ratio. 20 Tangible Common Equity/Tangible Assets
Ratio(1) Support Profitable Growth & Growth Investments Efficient Return of Capital to Shareholders Improve Capital Metrics Capital Priorities ©2022 Bread Financial
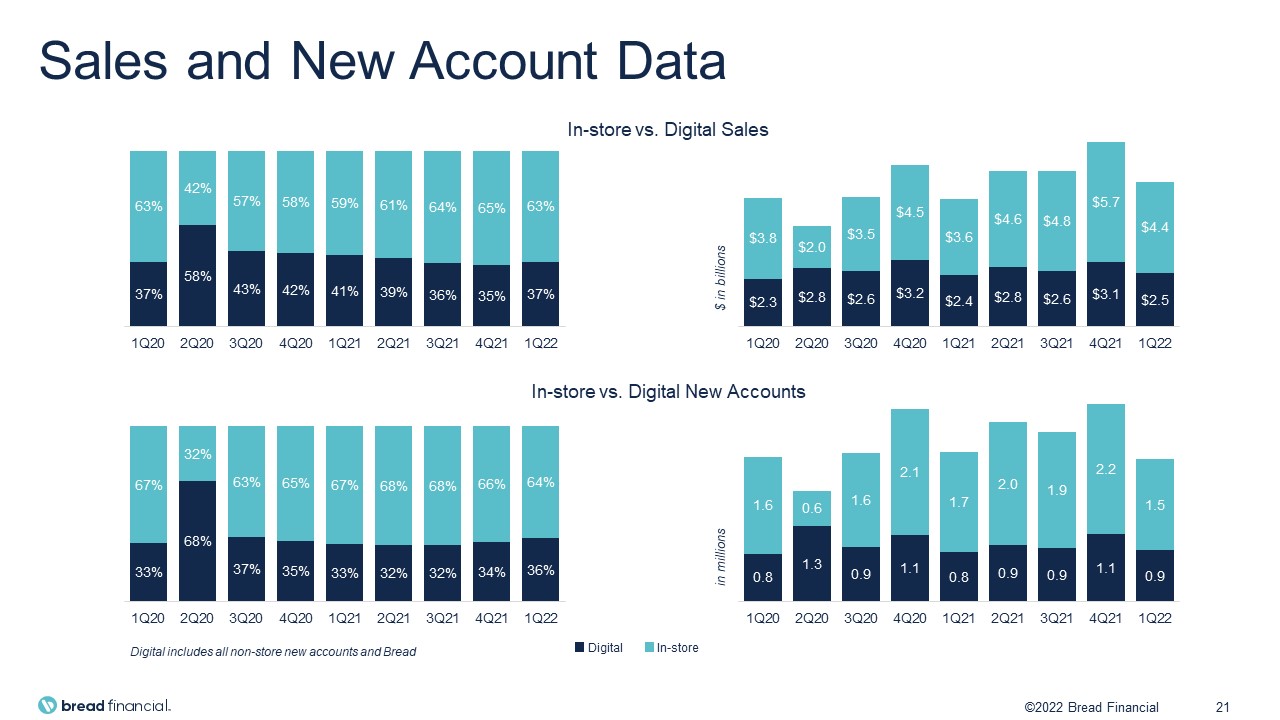
Sales and New Account Data In-store vs. Digital Sales Digital includes all non-store new accounts and
Bread $ in billions In-store vs. Digital New Accounts in millions 21 ©2022 Bread Financial Digital In-store