
CAC 8-K
Camden National Corp (CAC)
8-K
2020-10-27
For: 2020-10-27
View Original
Added on
April 04, 2026
UNITED STATES
SECURITIES AND EXCHANGE COMMISSION
Washington, D.C. 20549
FORM 8-K
CURRENT REPORT
Pursuant to Section 13 OR 15(d) of The Securities Exchange Act of 1934
Date of Report (date of earliest event reported): October 27, 2020
(Exact name of registrant as specified in its charter)
(State or other jurisdiction of incorporation) | (Commission File Number) | (IRS Employer Identification No.) | |||||||||
(Address of principal executive offices) | (Zip Code) | ||||||||||
Registrant's telephone number, including area code: (207 ) 236-8821
Check the appropriate box below if the Form 8-K filing is intended to simultaneously satisfy the filing obligation of the registrant under any of the following provisions:
Indicate by check mark whether the registrant is an emerging growth company as defined in Rule 405 of the Securities Act of 1933 (§230.405 of this chapter) or Rule 12b-2 of the Securities Exchange Act of 1934 (§240.12b-2 of this chapter). Emerging Growth Company ☐
If an emerging growth company, indicate by check mark if the registrant has elected not to use the extended transition period for complying with any new or revised financial accounting standards provided pursuant to Section 13(a) of the Exchange Act. o
Securities registered pursuant to Section 12(b) of the Act:
| Title of each class | Trading Symbol(s) | Name of each exchange on which registered | ||||||
| Item 2.02 | Results of Operations and Financial Condition. | ||||
Camden National Corporation (the “Company”) issued a press release on October 27, 2020 announcing earnings for the fiscal quarter ended September 30, 2020. A copy of the press release is attached hereto as Exhibit 99.1. A supplemental presentation is attached as Exhibit 99.2 and a quarterly letter from the Company's Chief Executive Officer to stockholders is attached as Exhibit 99.3. This information is being furnished pursuant to Item 2.02, and the information contained therein shall not be deemed “filed” for purposes of Section 18 of the Securities Exchange Act of 1934, or otherwise subject to the liabilities under that Section, and shall not be deemed to be incorporated by reference into the filings of the Company under the Securities Act of 1933.
| Item 9.01 | Financial Statements and Exhibits. | ||||
(d) The following exhibits are filed with this Report:
| Exhibit No. | Description | ||||
| 101 | Cover Page Interactive Data - the cover page XBRL tags are embedded within the Inline XBRL document. | ||||
| 104 | Cover Page Interactive Data File - Included in Exhibit 101. | ||||
SIGNATURES
Pursuant to the requirements of the Securities Exchange Act of 1934, the registrant has duly caused this report to be signed on its behalf by the undersigned hereunto duly authorized.
Dated: October 27, 2020
| CAMDEN NATIONAL CORPORATION (Registrant) | ||||||||
| By: | /s/ GREGORY A. WHITE | |||||||
| Gregory A. White Chief Financial Officer and Principal Financial & Accounting Officer | ||||||||

CONTACT:
Michael Archer
Senior Vice President
Corporate Controller
Camden National Corporation
(800) 860-8821
FOR IMMEDIATE RELEASE
CAMDEN NATIONAL CORPORATION REPORTS
THIRD QUARTER 2020 FINANCIAL RESULTS
Third Quarter 2020 Net Income Increased 16% over Third Quarter 2019
CAMDEN, Maine, October 27, 2020/PRNewswire/--Camden National Corporation (NASDAQ: CAC; “Camden National” or the “Company”), a $5.2 billion bank holding company headquartered in Camden, Maine, reported net income for the third quarter of 2020 of $16.8 million, an increase of $2.3 million, or 16%, compared to the third quarter of 2019. Diluted earnings per share ("EPS") for the third quarter of 2020 was $1.11, an increase of $0.17, or 18%, over the third quarter of 2019.
"This quarter's results demonstrate that our core business is solid and resilient. Our strong earnings for the quarter reflect the collective efforts and tireless work across our Company as we continue to focus on our customers' needs while maintaining our strategic focus," said Gregory A. Dufour, President and Chief Executive Officer of the Company. "Although the last six months have presented unprecedented economic conditions, we took the necessary actions early to preserve the strength of our balance sheet by increasing loan loss reserves over $11 million year-to-date. At the end of the third quarter, our allowance for losses was 1.11% of total loans and 1.19% of total loans when excluding SBA PPP loans1 originated this year, up from 0.81% at the beginning of the year."
Dufour added, "At September 30, 2020, COVID-19-related short-term loan deferrals were 5.5% of total loans, which included nearly $68 million of consumer loans that we automatically deferred for another 90 days after the initial 90-day deferral period matured. This is a significant decrease from June 30, 2020, where our total short-term loan deferrals were 16.4% of total loans at June 30, 2020. Through September 30, 2020, our asset quality continues to be very strong, highlighted by non-performing loans totaling 0.34% and past due loans of 0.18% of total loans at quarter-end, as well as annualized net charge-offs year-to-date of 0.04% of average loans.”
1 This is a non-GAAP measure. Please refer to "Reconciliation of non-GAAP to GAAP Financial Measures" for further details.
THIRD QUARTER 2020 HIGHLIGHTS
•Net income increased by $2.3 million, or 16%, over the third quarter of 2019 and by $5.8 million, or 53%, over the second quarter of 2020.
•Pre-tax, pre-provision earnings1 increased $3.0 million, or 16%, over the third quarter of 2019 and decreased $1.1 million, or 5%, from the second quarter of 2020.
•Net interest margin on a fully-taxable equivalent basis (“net interest margin”) for the third quarter of 2020 was 3.00%, compared to 3.09% for the third quarter of 2019 and 3.11% for the second quarter of 2020.
•5.5% of total loans were operating under a short-term deferral due to COVID-19 at September 30, 2020, compared to 16.4% at June 30, 2020.
•Allowance for loan losses was 1.11% of total loans at September 30, 2020, up from 1.07% at June 30, 2020 and 0.81% at December 31, 2019.
•Non-performing assets were 0.22% of total assets as of September 30, 2020, and annualized net charge-offs were 0.01% and 0.04% of average loans for the three and nine months ended September 30, 2020, respectively.
•Capital remains a source of strength, highlighted by regulatory capital ratios well in excess of requirements, including a Total risk-based capital ratio of 15.15% and Tier 1 leverage ratio of 8.96% at September 30, 2020.
FINANCIAL CONDITION
Assets. Total assets increased 16% since December 31, 2019, to $5.2 billion at September 30, 2020. Asset growth for the nine months ended September 30, 2020, was driven by increases in cash, investments and loans.
Cash and Investments. Deposit growth for the nine months ended September 30, 2020, of $686.3 million, or 19%, led to elevated cash and investment balances. Federal stimulus provided to businesses and consumers in response to the COVID-19 pandemic has driven deposit growth and resulted in excess liquidity. At September 30, 2020, cash and investment balances totaled $346.4 million and $1.1 billion, respectively, compared to $75.6 million and $933.1 million at December 31, 2019. At September 30, 2020, the Company's investments designated as available-for-sale (“AFS”) were in an unrealized gain position of $28.7 million, net of tax, compared to $3.3 million, net of tax, at December 31, 2019.
Loans. At September 30, 2020, the Company’s loan portfolio totaled $3.3 billion, compared to $3.1 billion at December 31, 2019. Loan growth for the nine months ended September 30, 2020, was $179.8 million, or 6%, led by (1) Small Business Administration Paycheck Protection Program (“SBA PPP”) loans, which had outstanding loan balances of $223.8 million at September 30, 2020, and (2) commercial real estate loan growth of $90.3 million, or 7%, over this period.
Since the commencement of the SBA PPP in early April 2020, the Company has proudly originated 3,034 loans totaling $244.8 million through September 30, 2020, to businesses across our markets that are in need of support due to the COVID-19 pandemic.
For the nine months ended September 30, 2020, consumer and home equity loans decreased 12% to $297.6 million at September 30, 2020, while residential mortgage loans decreased 2% over the same period to $1.0 billion at September 30, 2020.
For the nine months ended September 30, 2020, the Company originated $727.9 million of residential mortgages and sold 62% of its production to the secondary market. In comparison, for the same period last year, the Company originated $387.8 million and sold 48% of its production. Residential mortgage refinance activity was 59% of originations for the nine months ended September 30, 2020, compared to 31% for the same period last year.
The increase in residential mortgage originations and refinance activity between periods was driven by historically low interest rates for the nine months ended September 30, 2020, highlighted by an average 10-year U.S. Treasury rate of 0.90% over this period.
Deposits and Borrowings. Deposits increased 19% since December 31, 2019, to $4.2 billion at September 30, 2020. The increase in deposits was driven by federal stimulus to businesses and consumers in response to the COVID-19 pandemic, as well as a shift in consumer habits in response to the COVID-19 pandemic, highlighted by the national personal savings rate nearly doubling to 14.1% in August 2020 compared to December 2019. For the nine months ended September 30, 2020, checking account balances grew $514.3 million, or 30%, savings and money market balances grew $187.7 million, or 17%, and brokered deposits grew $100.6 million, or 53%. Over this same period, certificates of deposit (“CDs”) decreased $116.3 million, or 22%.
The Company's loan-to-deposit ratio was 78% at September 30, 2020, compared to 87% at December 31, 2019.
Total borrowings decreased 13% since December 31, 2019 to $294.4 million at September 30, 2020. At September 30, 2020, short-term borrowings of $210.1 million are entirely made up of repurchase agreements.
Shareholders' Equity. At September 30, 2020, the Company's capital position remained well in excess of regulatory requirements, including a Total risk-based capital ratio of 15.15% and a Tier 1 leverage ratio of 8.96%. Additionally, at September 30, 2020, the Company's common equity ratio was 10.04% and tangible common equity ratio1 was 8.30%.
In September 2020, the Company announced a cash dividend to shareholders of $0.33 per share, consistent with that issued for the second quarter of 2020. The cash dividend is payable on October 30, 2020, to shareholders of record as of October 15, 2020. As of September 30, 2020, the Company's annualized dividend yield was 4.37% based on Camden National's closing share price of $30.23, as reported by NASDAQ.
The Company temporarily suspended its share repurchase program during the first quarter of 2020 in response to the COVID-19 pandemic. In September 2020, the Company lifted its suspension and repurchased 47,915 shares. For the nine months ended September 30, 2020, the Company has repurchased 264,946 shares of its common stock. The Company will continue to evaluate its use of the share repurchase program as the impact and our response to the COVID-19 pandemic develops.
ASSET QUALITY
As of September 30, 2020, the Company's asset quality metrics continue to be stable and consistent with past quarters.
•Non-performing assets were 0.22% of total assets at September 30, 2020, compared to 0.23% and 0.25% at June 30, 2020 and December 31, 2019, respectively.
•Past due loans were 0.18% of total loans at September 30, 2020, compared to 0.19% and 0.17% at June 30, 2020 and December 31, 2019, respectively.
•Net charge-offs (annualized) for the third quarter of 2020 were 0.01% of average loans, compared to 0.05% for the second quarter of 2020 and 0.16% for the third quarter of 2019.
COVID-19 Short-Term Deferment Program. In March 2020, the Company began offering temporary debt relief to business and retail customers impacted by the COVID-19 pandemic. All loan modifications made by the Company complied with the terms of the Coronavirus Aid, Relief, and Economic Security Act ("CARES Act") or bank regulator guidance, and, thus, were not individually assessed, designated or accounted for as troubled-debt restructurings.
Short-term debt payment relief was provided to commercial and retail customers for periods up to 180 days, including full and partial principal and/or interest payment relief. At September 30, 2020, loans operating under a short-term deferral arrangement totaled $181.2 million, or 5.5% of total loans at September 30, 2020, of which $67.7 million were retail loans that were provided an automatic 90-day deferment extension upon maturity of the initial 90-day deferment period. In comparison, at June 30, 2020, loan operating under a short-term deferral arrangement totaled $546.7 million, or 16.4% of total loans.
Allowance for Credit Losses and Provision Expense. The provision for credit losses for the three and nine months ended September 30, 2020 was $987,000 and $12.2 million, respectively, compared to $730,000 and $2.6 million for the three and nine months ended September 30, 2019. At September 30, 2020, the Company's allowance for loan losses was $36.4 million, or 1.11% of total loans (1.19% of total loans, excluding SBA PPP loans1), and 3.3 times non-performing loans, compared to $25.2 million, or 0.81% of total loans and 2.3 times non-performing loans, at December 31, 2019. Although asset quality at September 30, 2020 remains strong and COVID-19 deferments have steadily decreased, there continues to be an elevated credit risk throughout the industry given current market conditions, as well as the level of economic, political, and medical uncertainty that remains.
CECL. In the first quarter of 2020, the Company chose to delay its implementation of the current expected credit losses model, commonly referred to as "CECL," in accordance with the provisions of the CARES Act. As such, the reported allowance for credit losses and related provision expense for the three and nine months ended September 30, 2020 was accounted for under the incurred loss model. In accordance with the CARES Act, the Company will effectively adopt CECL on December 31, 2020, retroactively effective as of January 1, 2020.
While the Company has not yet adopted CECL, it estimates that as of September 30, 2020, the allowance for credit losses under CECL, which is comprised of allowance for loan losses and unfunded commitments, would have been $39.0 million to $43.0 million, or 1.19% to 1.31% of total loans, at September 30, 2020.
FINANCIAL OPERATING RESULTS (Q3 2020 vs. Q3 2019)
Net income for the third quarter of 2020 was $16.8 million, an increase of $2.3 million, or 16%, over the third quarter of 2019. Diluted EPS for the third quarter of 2020 was $1.11, an increase of $0.17, or 18%, over the same period last year.
Net Interest Income. Net interest income for the third quarter of 2020 was $34.5 million, an increase of $2.6 million, or 8%, over the third quarter of 2019 due to an increase in average interest-earning assets of 11%, partially offset by a compressed net interest margin of 9 basis points between periods to 3.00% for the third quarter of 2020.
Average interest-earning assets for the third quarter of 2020 were $4.6 billion, an increase of $465.8 million over the third quarter of 2019. Average loans grew 7% between periods to $3.3 billion for the third quarter of 2020, primarily driven by average SBA PPP loans of $221.7 million for the third quarter of 2020, while average cash and investment balances grew 25% to $1.2 billion for the third quarter of 2020.
Net interest margin for the third quarter of 2020 was 3.00%, a decrease of 9 basis points from the third quarter of 2019. The decrease in net interest margin was driven by the current low interest rate environment and change in the mix of interest-earning assets driving down the yield on interest-earning assets by 74 basis points between periods to 3.37% for the third quarter of 2020, whereas the cost of funds decreased 70 basis points between periods to 0.38% for the third quarter of 2020.
Provision for Credit Losses. The provision for credit losses for the third quarter of 2020 was $987,000, an increase of $257,000 compared to the third quarter of 2019.
Non-Interest Income. Non-interest income for the third quarter of 2020 was $12.7 million, an increase of $2.0 million, or 18%, over the third quarter of 2019. The increase was primarily driven by an increase in mortgage
banking income between periods of $2.0 million as the Company’s sold loan production grew by 110% between periods. This increase was partially offset by a decrease in service charges on deposit accounts between periods of $364,000, or 18%. Service charges on deposit accounts primarily decreased between periods due to lower overdraft fees because of elevated deposits across our customers.
Non-Interest Expense. Non-interest expense for the third quarter of 2020 was $25.2 million, an increase of $1.5 million, or 6%, compared to the third quarter of 2019. In the third quarter of 2020, the Company accrued $1.2 million within other expenses for a legal settlement to avoid the burden and expense of litigation. The Company’s efficiency ratio calculated in accordance with generally accepted accounting principles in the United States (“GAAP”) was 53.46% for the third quarter of 2020 and 50.60%1 for the third quarter of 2020 on a non-GAAP basis.
FINANCIAL OPERATING RESULTS (Q3 2020 vs. Q2 2020)
Net income for the third quarter 2020 increased $5.8 million, or 53%, and diluted EPS increased $0.38, or 52%, over the second quarter 2020. The increase between quarters was driven by a decrease in provision expense of $8.4 million.
Net Interest Income. Net interest income for the third quarter 2020 decreased $58,000, compared to the second quarter 2020. The decrease between periods was driven by net interest margin compression of 11 basis points as average cash balances increased $47.8 million, or 28%, to $216.0 million for the third quarter of 2020.
Provision for Credit Losses. Provision for credit losses for the third quarter 2020 decreased $8.4 million, compared to the second quarter 2020. In the second quarter 2020, higher provisions were provided for as reserve levels increased due to the economic environment created by the COVID-19 pandemic, and the Company worked through its COVID-19 loan modifications.
Non-Interest Income. Non-interest income for the third quarter 2020 increased $636,000, or 5%, over the second quarter 2020. The increase between periods was primarily attributable to an increase in service charges on deposit accounts of $269,000 and debit card income of $236,000.
Non-Interest Expense. Non-interest expense for the third quarter 2020 increased $1.7 million, or 7%, over the second quarter 2020. Included in the third quarter 2020, the Company accrued $1.2 million for a legal settlement to avoid the burden and expense of litigation. This was presented within other expenses on the consolidated statements of income.
CONFERENCE CALL
Camden National will host a conference call and webcast at 3:00 p.m., Eastern Time, on Tuesday, October 27, 2020 to discuss its third quarter 2020 financial results and outlook. Participants should dial in to the call 10 - 15 minutes before it begins. Information about the conference call is as follows:
Live dial-in (domestic): (888) 349-0139
Live dial-in (international): (412) 542-4154
Live webcast: https://services.choruscall.com/links/cac201027.html
A link to the live webcast will be available on Camden National's website under "Investor Relations" at www.CamdenNational.com prior to the meeting, and a replay of the webcast will be available on Camden National's website following the conference call. The transcript of the conference call will also be available on Camden National's website approximately two days after the conference call.
ABOUT CAMDEN NATIONAL CORPORATION
Camden National Corporation (NASDAQ:CAC) is the largest publicly traded bank holding company in Northern New England with $5.2 billion in assets and approximately 650 employees. Camden National Bank, its subsidiary, is a full-service community bank founded in 1875 in Camden, Maine. Dedicated to customers at every stage of their financial journey, the bank offers the latest in digital banking, complemented by personalized service with 58 banking centers, 24/7 live phone support, 68 ATMs, and additional lending offices in New Hampshire and Massachusetts. For the past two years, Camden National Bank was named "Customer Experience Leader in U.S. Retail Banking" by Greenwich Associates, and in 2019, it was the only New England based organization included in Sandler O'Neill's "Bank and Thrift Sm-All Star" list of high-performing financial institutions. The Finance Authority of Maine has awarded Camden National Bank as "Lender at Work for Maine" for ten years. Comprehensive wealth management, investment and financial planning services are delivered by Camden National Wealth Management. To learn more, visit CamdenNational.com. Member FDIC.
FORWARD-LOOKING STATEMENTS
Certain statements contained in this press release that are not statements of historical fact constitute forward-looking statements within the meaning of the Private Securities Litigation Reform Act of 1995, as amended, including certain plans, expectations, goals, projections and other statements, which are subject to numerous risks, assumptions and uncertainties. Forward-looking statements can be identified by the fact that they do not relate strictly to historical or current facts. They often include words like “believe,” “expect,” “anticipate,” “estimate,” and “intend” or future or conditional verbs such as “will,” “would,” “should,” “could” or “may.” Certain factors that could cause actual results to differ materially from expected results include increased competitive pressures; changes in the interest rate environment; changes in general economic conditions; operational risks including, but not limited to, cybersecurity, fraud and natural disasters; legislative and regulatory changes that adversely affect the business in which Camden National is engaged; changes in the securities markets and other risks and uncertainties disclosed from time to time in Camden National’s Annual Report on Form 10-K for the year ended December 31, 2019, as updated by other filings with the Securities and Exchange Commission ("SEC"). Further, statements about the potential effects of the COVID-19 pandemic on our business, results of operations and financial condition may constitute forward-looking statements and are subject to the risk that the actual effects may differ, possibly materially, from what is reflected in those forward-looking statements due to factors and future developments that are uncertain, unpredictable and in many cases beyond our control, including the scope and duration of the pandemic, action taken by government authorities in response to the pandemic, and the direct and indirect impact of the pandemic on our customers, service providers and on economies and markets more generally. Camden National does not have any obligation to update forward-looking statements.
USE OF NON-GAAP MEASURES
In addition to evaluating the Company's results of operations in accordance with GAAP, management supplements this evaluation with certain non-GAAP financial measures, such as pre-tax, pre-provision earnings; return on average tangible equity; the efficiency and tangible common equity ratios; tangible book value per share; core deposits and average core deposits; and allowance for loan losses to total loans, excluding SBA PPP loans. Management utilizes these non-GAAP financial measures for purposes of measuring our performance against our peer group and other financial institutions and analyzing our internal performance. We also believe these non-GAAP financial measure help investors better understand the Company's operating performance and trends and allow for better performance comparisons to other financial institutions. In addition, these non-GAAP financial measures remove the impact of unusual items that may obscure trends in the Company's underlying performance. These disclosures should not be viewed as a substitute for GAAP operating results, nor are they necessarily comparable to non-GAAP performance measures that may be presented by other financial institutions. Reconciliation to the comparable GAAP financial measure can be found in this document.
ANNUALIZED DATA
Certain returns, yields and performance ratios are presented on an “annualized” basis. This is done for analytical and decision-making purposes to better discern underlying performance trends when compared to full-year or year-over-year amounts. Annualized data may not be indicative of any four-quarter period, and are presented for illustrative purposes only.
Selected Financial Data
(unaudited)
| At or For The Three Months Ended | At or For The Nine Months Ended | |||||||||||||||||||||||||||||||
(In thousands, except number of shares and per share data) | September 30, 2020 | June 30, 2020 | September 30, 2019 | September 30, 2020 | September 30, 2019 | |||||||||||||||||||||||||||
| Financial Condition Data | ||||||||||||||||||||||||||||||||
| Investments | $ | 1,121,712 | $ | 1,064,089 | $ | 926,444 | $ | 1,121,712 | $ | 926,444 | ||||||||||||||||||||||
| Loans and loans held for sale | 3,312,777 | 3,362,631 | 3,127,083 | 3,312,777 | 3,127,083 | |||||||||||||||||||||||||||
| Allowance for loan losses | 36,414 | 35,539 | 25,688 | 36,414 | 25,688 | |||||||||||||||||||||||||||
| Total assets | 5,153,793 | 4,959,016 | 4,520,315 | 5,153,793 | 4,520,315 | |||||||||||||||||||||||||||
| Deposits | 4,224,044 | 3,996,358 | 3,617,963 | 4,224,044 | 3,617,963 | |||||||||||||||||||||||||||
| Borrowings | 294,361 | 330,229 | 342,459 | 294,361 | 342,459 | |||||||||||||||||||||||||||
| Shareholders' equity | 517,522 | 506,467 | 471,672 | 517,522 | 471,672 | |||||||||||||||||||||||||||
| Operating Data | ||||||||||||||||||||||||||||||||
| Net interest income | $ | 34,481 | $ | 34,539 | $ | 31,923 | $ | 100,846 | $ | 95,391 | ||||||||||||||||||||||
| Provision for credit losses | 987 | 9,398 | 730 | 12,160 | 2,647 | |||||||||||||||||||||||||||
| Non-interest income | 12,696 | 12,060 | 10,739 | 36,159 | 30,165 | |||||||||||||||||||||||||||
| Non-interest expense | 25,221 | 23,509 | 23,748 | 73,291 | 70,489 | |||||||||||||||||||||||||||
| Income before income tax expense | 20,969 | 13,692 | 18,184 | 51,554 | 52,420 | |||||||||||||||||||||||||||
| Income tax expense | 4,194 | 2,752 | 3,696 | 10,346 | 10,455 | |||||||||||||||||||||||||||
| Net income | $ | 16,775 | $ | 10,940 | $ | 14,488 | $ | 41,208 | $ | 41,965 | ||||||||||||||||||||||
| Key Ratios | ||||||||||||||||||||||||||||||||
| Return on average assets | 1.34 | % | 0.90 | % | 1.29 | % | 1.15 | % | 1.28 | % | ||||||||||||||||||||||
| Return on average equity | 13.01 | % | 8.81 | % | 12.26 | % | 11.06 | % | 12.32 | % | ||||||||||||||||||||||
| GAAP efficiency ratio | 53.46 | % | 50.45 | % | 55.67 | % | 53.50 | % | 56.14 | % | ||||||||||||||||||||||
| Net interest margin (fully-taxable equivalent) | 3.00 | % | 3.11 | % | 3.09 | % | 3.06 | % | 3.13 | % | ||||||||||||||||||||||
| Non-performing assets to total assets | 0.22 | % | 0.23 | % | 0.30 | % | 0.22 | % | 0.30 | % | ||||||||||||||||||||||
| Common equity ratio | 10.04 | % | 10.21 | % | 10.43 | % | 10.04 | % | 10.43 | % | ||||||||||||||||||||||
| Tier 1 leverage capital ratio | 8.96 | % | 8.95 | % | 9.39 | % | 8.96 | % | 9.39 | % | ||||||||||||||||||||||
| Common equity tier 1 risk-based capital ratio | 12.21 | % | 11.69 | % | 11.36 | % | 12.21 | % | 11.36 | % | ||||||||||||||||||||||
| Tier 1 risk-based capital ratio | 13.55 | % | 13.01 | % | 12.70 | % | 13.55 | % | 12.70 | % | ||||||||||||||||||||||
| Total risk-based capital ratio | 15.15 | % | 14.56 | % | 13.97 | % | 15.15 | % | 13.97 | % | ||||||||||||||||||||||
| Per Share Data | ||||||||||||||||||||||||||||||||
| Basic earnings per share | $ | 1.12 | $ | 0.73 | $ | 0.94 | $ | 2.74 | $ | 2.70 | ||||||||||||||||||||||
| Diluted earnings per share | $ | 1.11 | $ | 0.73 | $ | 0.94 | $ | 2.73 | $ | 2.70 | ||||||||||||||||||||||
| Cash dividends declared per share | $ | 0.33 | $ | 0.33 | $ | 0.30 | $ | 0.99 | $ | 0.90 | ||||||||||||||||||||||
| Book value per share | $ | 34.69 | $ | 33.85 | $ | 30.98 | $ | 34.69 | $ | 30.98 | ||||||||||||||||||||||
Non-GAAP Measures(1) | ||||||||||||||||||||||||||||||||
| Return on average tangible equity | 16.21 | % | 11.09 | % | 15.67 | % | 13.91 | % | 15.89 | % | ||||||||||||||||||||||
| Efficiency ratio | 50.60 | % | 50.13 | % | 55.32 | % | 52.29 | % | 55.82 | % | ||||||||||||||||||||||
| Pre-tax, pre-provision earnings | $ | 21,956 | $ | 23,090 | $ | 18,914 | $ | 63,714 | $ | 55,067 | ||||||||||||||||||||||
| Allowance for loan losses to total loans, excluding SBA PPP loans | 1.19 | % | 1.14 | % | 0.83 | % | 1.19 | % | 0.83 | % | ||||||||||||||||||||||
| Tangible common equity ratio | 8.30 | % | 8.41 | % | 8.44 | % | 8.30 | % | 8.44 | % | ||||||||||||||||||||||
| Tangible book value per share | $ | 28.14 | $ | 27.31 | $ | 24.52 | $ | 28.14 | $ | 24.52 | ||||||||||||||||||||||
(1) Please see "Reconciliation of non-GAAP to GAAP Financial Measures (unaudited)."
Consolidated Statements of Condition Data
(unaudited)
| (In thousands) | September 30, 2020 | December 31, 2019 | September 30, 2019 | |||||||||||||||||
| ASSETS | ||||||||||||||||||||
| Cash and due from banks | $ | 42,119 | $ | 39,586 | $ | 63,620 | ||||||||||||||
| Interest-bearing deposits in other banks (including restricted cash) | 304,270 | 36,050 | 73,912 | |||||||||||||||||
| Total cash, cash equivalents and restricted cash | 346,389 | 75,636 | 137,532 | |||||||||||||||||
| Investments: | ||||||||||||||||||||
| Available-for-sale securities, at fair value (book value of $1,070,479, $913,978 and $903,988, respectively) | 1,107,069 | 918,118 | 913,523 | |||||||||||||||||
| Held-to-maturity securities, at amortized cost (fair value of $1,403, $1,359 and $1,352, respectively) | 1,298 | 1,302 | 1,303 | |||||||||||||||||
| Other investments | 13,345 | 13,649 | 11,618 | |||||||||||||||||
| Total investments | 1,121,712 | 933,069 | 926,444 | |||||||||||||||||
| Loans held for sale, at fair value (book value of $37,301, $11,915 and $16,630, respectively) | 37,935 | 11,854 | 16,449 | |||||||||||||||||
| Loans: | ||||||||||||||||||||
| Commercial real estate | 1,333,733 | 1,243,397 | 1,255,519 | |||||||||||||||||
Commercial(1) | 375,548 | 442,701 | 445,466 | |||||||||||||||||
| SBA PPP | 223,838 | — | — | |||||||||||||||||
| Residential real estate | 1,044,103 | 1,070,374 | 1,061,898 | |||||||||||||||||
| Consumer and home equity | 297,620 | 338,551 | 347,751 | |||||||||||||||||
| Total loans | 3,274,842 | 3,095,023 | 3,110,634 | |||||||||||||||||
| Less: allowance for loan losses | (36,414) | (25,171) | (25,688) | |||||||||||||||||
| Net loans | 3,238,428 | 3,069,852 | 3,084,946 | |||||||||||||||||
| Goodwill | 94,697 | 94,697 | 94,697 | |||||||||||||||||
| Core deposit intangible assets | 3,014 | 3,525 | 3,701 | |||||||||||||||||
| Bank-owned life insurance | 94,262 | 92,344 | 91,729 | |||||||||||||||||
| Premises and equipment, net | 40,517 | 41,836 | 40,930 | |||||||||||||||||
| Deferred tax assets | 11,195 | 16,823 | 15,656 | |||||||||||||||||
| Other assets | 165,644 | 89,885 | 108,231 | |||||||||||||||||
| Total assets | $ | 5,153,793 | $ | 4,429,521 | $ | 4,520,315 | ||||||||||||||
| LIABILITIES AND SHAREHOLDERS’ EQUITY | ||||||||||||||||||||
| Liabilities | ||||||||||||||||||||
| Deposits: | ||||||||||||||||||||
| Non-interest checking | $ | 800,582 | $ | 552,590 | $ | 573,621 | ||||||||||||||
| Interest checking | 1,419,544 | 1,153,203 | 1,147,627 | |||||||||||||||||
| Savings and money market | 1,306,868 | 1,119,193 | 1,105,290 | |||||||||||||||||
| Certificates of deposit | 405,434 | 521,752 | 541,199 | |||||||||||||||||
| Brokered deposits | 291,616 | 191,005 | 250,226 | |||||||||||||||||
| Total deposits | 4,224,044 | 3,537,743 | 3,617,963 | |||||||||||||||||
| Short-term borrowings | 210,055 | 268,809 | 273,454 | |||||||||||||||||
| Long-term borrowings | 25,000 | 10,000 | 10,000 | |||||||||||||||||
| Subordinated debentures | 59,306 | 59,080 | 59,005 | |||||||||||||||||
| Accrued interest and other liabilities | 117,866 | 80,474 | 88,221 | |||||||||||||||||
| Total liabilities | 4,636,271 | 3,956,106 | 4,048,643 | |||||||||||||||||
| Shareholders’ equity | 517,522 | 473,415 | 471,672 | |||||||||||||||||
| Total liabilities and shareholders’ equity | $ | 5,153,793 | $ | 4,429,521 | $ | 4,520,315 | ||||||||||||||
(1) Includes the HPFC loan portfolio.
Consolidated Statements of Income Data
(unaudited)
| For The Three Months Ended | For The Nine Months Ended | |||||||||||||||||||||||||||||||
| (In thousands, except per share data) | September 30, 2020 | June 30, 2020 | September 30, 2019 | September 30, 2020 | September 30, 2019 | |||||||||||||||||||||||||||
| Interest Income | ||||||||||||||||||||||||||||||||
| Interest and fees on loans | $ | 33,025 | $ | 33,120 | $ | 36,207 | $ | 100,190 | $ | 108,020 | ||||||||||||||||||||||
| Taxable interest on investments | 4,480 | 4,883 | 4,794 | 14,241 | 14,729 | |||||||||||||||||||||||||||
| Nontaxable interest on investments | 823 | 828 | 675 | 2,438 | 1,943 | |||||||||||||||||||||||||||
| Dividend income | 163 | 167 | 158 | 498 | 562 | |||||||||||||||||||||||||||
| Other interest income | 176 | 180 | 686 | 691 | 1,712 | |||||||||||||||||||||||||||
| Total interest income | 38,667 | 39,178 | 42,520 | 118,058 | 126,966 | |||||||||||||||||||||||||||
| Interest Expense | ||||||||||||||||||||||||||||||||
| Interest on deposits | 2,899 | 3,392 | 8,963 | 12,953 | 26,542 | |||||||||||||||||||||||||||
| Interest on borrowings | 394 | 359 | 801 | 1,591 | 2,660 | |||||||||||||||||||||||||||
| Interest on subordinated debentures | 893 | 888 | 833 | 2,668 | 2,373 | |||||||||||||||||||||||||||
| Total interest expense | 4,186 | 4,639 | 10,597 | 17,212 | 31,575 | |||||||||||||||||||||||||||
| Net interest income | 34,481 | 34,539 | 31,923 | 100,846 | 95,391 | |||||||||||||||||||||||||||
| Provision for credit losses | 987 | 9,398 | 730 | 12,160 | 2,647 | |||||||||||||||||||||||||||
| Net interest income after provision for credit losses | 33,494 | 25,141 | 31,193 | 88,686 | 92,744 | |||||||||||||||||||||||||||
| Non-Interest Income | ||||||||||||||||||||||||||||||||
| Mortgage banking income, net | 4,664 | 4,691 | 2,668 | 12,889 | 5,662 | |||||||||||||||||||||||||||
| Debit card income | 2,627 | 2,391 | 2,432 | 7,159 | 6,723 | |||||||||||||||||||||||||||
| Service charges on deposit accounts | 1,606 | 1,337 | 1,970 | 4,955 | 6,202 | |||||||||||||||||||||||||||
| Income from fiduciary services | 1,504 | 1,603 | 1,444 | 4,609 | 4,381 | |||||||||||||||||||||||||||
| Brokerage and insurance commissions | 755 | 622 | 625 | 2,034 | 1,942 | |||||||||||||||||||||||||||
| Bank-owned life insurance | 615 | 614 | 613 | 1,918 | 1,810 | |||||||||||||||||||||||||||
| Customer loan swap fees | 51 | 57 | 109 | 222 | 919 | |||||||||||||||||||||||||||
| Net gain on sale of securities | — | — | 1 | — | 28 | |||||||||||||||||||||||||||
| Other income | 874 | 745 | 877 | 2,373 | 2,498 | |||||||||||||||||||||||||||
| Total non-interest income | 12,696 | 12,060 | 10,739 | 36,159 | 30,165 | |||||||||||||||||||||||||||
| Non-Interest Expense | ||||||||||||||||||||||||||||||||
| Salaries and employee benefits | 13,739 | 13,627 | 13,604 | 41,693 | 40,043 | |||||||||||||||||||||||||||
| Furniture, equipment and data processing | 3,076 | 2,710 | 2,708 | 8,576 | 8,111 | |||||||||||||||||||||||||||
| Net occupancy costs | 1,785 | 1,997 | 1,710 | 5,785 | 5,263 | |||||||||||||||||||||||||||
| Consulting and professional fees | 913 | 1,181 | 892 | 2,877 | 2,679 | |||||||||||||||||||||||||||
| Debit card expense | 972 | 878 | 960 | 2,784 | 2,666 | |||||||||||||||||||||||||||
| Regulatory assessments | 510 | 299 | 182 | 971 | 1,091 | |||||||||||||||||||||||||||
| Amortization of core deposit intangible assets | 170 | 171 | 177 | 511 | 529 | |||||||||||||||||||||||||||
| Other real estate owned and collection costs, net | 71 | 98 | 251 | 270 | 353 | |||||||||||||||||||||||||||
| Other expenses | 3,985 | 2,548 | 3,264 | 9,824 | 9,754 | |||||||||||||||||||||||||||
| Total non-interest expense | 25,221 | 23,509 | 23,748 | 73,291 | 70,489 | |||||||||||||||||||||||||||
| Income before income tax expense | 20,969 | 13,692 | 18,184 | 51,554 | 52,420 | |||||||||||||||||||||||||||
| Income Tax Expense | 4,194 | 2,752 | 3,696 | 10,346 | 10,455 | |||||||||||||||||||||||||||
| Net Income | $ | 16,775 | $ | 10,940 | $ | 14,488 | $ | 41,208 | $ | 41,965 | ||||||||||||||||||||||
| Per Share Data | ||||||||||||||||||||||||||||||||
| Basic earnings per share | $ | 1.12 | $ | 0.73 | $ | 0.94 | $ | 2.74 | $ | 2.70 | ||||||||||||||||||||||
| Diluted earnings per share | $ | 1.11 | $ | 0.73 | $ | 0.94 | $ | 2.73 | $ | 2.70 | ||||||||||||||||||||||
Quarterly Average Balance and Yield/Rate Analysis
(unaudited)
| Average Balance | Yield/Rate | |||||||||||||||||||||||||||||||||||||
| For The Three Months Ended | For The Three Months Ended | |||||||||||||||||||||||||||||||||||||
| (Dollars in thousands) | September 30, 2020 | June 30, 2020 | September 30, 2019 | September 30, 2020 | June 30, 2020 | September 30, 2019 | ||||||||||||||||||||||||||||||||
| Assets | ||||||||||||||||||||||||||||||||||||||
| Interest-earning assets: | ||||||||||||||||||||||||||||||||||||||
Interest-bearing deposits in other banks and other interest-earning assets | $ | 216,027 | $ | 168,221 | $ | 92,352 | 0.09 | % | 0.06 | % | 2.24 | % | ||||||||||||||||||||||||||
| Investments - taxable | 906,374 | 836,885 | 807,591 | 2.11 | % | 2.49 | % | 2.53 | % | |||||||||||||||||||||||||||||
Investments - nontaxable(1) | 122,204 | 124,101 | 98,378 | 3.41 | % | 3.38 | % | 3.47 | % | |||||||||||||||||||||||||||||
Loans(2): | ||||||||||||||||||||||||||||||||||||||
| Commercial real estate | 1,315,958 | 1,302,393 | 1,255,417 | 3.74 | % | 3.83 | % | 4.56 | % | |||||||||||||||||||||||||||||
Commercial(1) | 372,416 | 404,545 | 399,689 | 3.73 | % | 3.78 | % | 4.65 | % | |||||||||||||||||||||||||||||
| SBA PPP | 221,672 | 178,119 | — | 4.16 | % | 3.79 | % | — | % | |||||||||||||||||||||||||||||
Municipal(1) | 19,072 | 19,567 | 22,730 | 3.52 | % | 3.62 | % | 3.60 | % | |||||||||||||||||||||||||||||
| HPFC | 16,104 | 17,659 | 25,973 | 8.09 | % | 9.28 | % | 8.40 | % | |||||||||||||||||||||||||||||
| Residential real estate | 1,083,052 | 1,084,931 | 1,062,728 | 4.00 | % | 4.06 | % | 4.31 | % | |||||||||||||||||||||||||||||
| Consumer and home equity | 305,194 | 321,019 | 347,405 | 4.31 | % | 4.29 | % | 5.38 | % | |||||||||||||||||||||||||||||
| Total loans | 3,333,468 | 3,328,233 | 3,113,942 | 3.92 | % | 3.97 | % | 4.60 | % | |||||||||||||||||||||||||||||
| Total interest-earning assets | 4,578,073 | 4,457,440 | 4,112,263 | 3.37 | % | 3.53 | % | 4.11 | % | |||||||||||||||||||||||||||||
| Other assets | 417,956 | 414,225 | 345,618 | |||||||||||||||||||||||||||||||||||
| Total assets | $ | 4,996,029 | $ | 4,871,665 | $ | 4,457,881 | ||||||||||||||||||||||||||||||||
Liabilities & Shareholders' Equity | ||||||||||||||||||||||||||||||||||||||
| Deposits: | ||||||||||||||||||||||||||||||||||||||
| Non-interest checking | $ | 741,757 | $ | 664,605 | $ | 540,542 | — | % | — | % | — | % | ||||||||||||||||||||||||||
| Interest checking | 1,339,389 | 1,298,468 | 1,130,632 | 0.26 | % | 0.28 | % | 0.96 | % | |||||||||||||||||||||||||||||
| Savings | 557,718 | 518,803 | 474,096 | 0.06 | % | 0.06 | % | 0.08 | % | |||||||||||||||||||||||||||||
| Money market | 737,782 | 717,056 | 622,219 | 0.35 | % | 0.37 | % | 1.32 | % | |||||||||||||||||||||||||||||
| Certificates of deposit | 417,788 | 477,068 | 533,110 | 1.07 | % | 1.34 | % | 1.64 | % | |||||||||||||||||||||||||||||
| Total deposits | 3,794,434 | 3,676,000 | 3,300,599 | 0.29 | % | 0.35 | % | 0.85 | % | |||||||||||||||||||||||||||||
| Borrowings: | ||||||||||||||||||||||||||||||||||||||
| Brokered deposits | 242,390 | 234,823 | 305,019 | 0.26 | % | 0.28 | % | 2.42 | % | |||||||||||||||||||||||||||||
Customer repurchase agreements | 194,937 | 209,302 | 234,362 | 0.42 | % | 0.56 | % | 1.26 | % | |||||||||||||||||||||||||||||
| Subordinated debentures | 59,269 | 59,194 | 58,998 | 6.00 | % | 6.03 | % | 5.60 | % | |||||||||||||||||||||||||||||
| Other borrowings | 73,370 | 76,983 | 11,273 | 1.02 | % | 0.35 | % | 1.96 | % | |||||||||||||||||||||||||||||
| Total borrowings | 569,966 | 580,302 | 609,652 | 1.01 | % | 0.98 | % | 2.27 | % | |||||||||||||||||||||||||||||
| Total funding liabilities | 4,364,400 | 4,256,302 | 3,910,251 | 0.38 | % | 0.44 | % | 1.08 | % | |||||||||||||||||||||||||||||
| Other liabilities | 118,727 | 115,914 | 78,710 | |||||||||||||||||||||||||||||||||||
| Shareholders' equity | 512,902 | 499,449 | 468,920 | |||||||||||||||||||||||||||||||||||
Total liabilities & shareholders' equity | $ | 4,996,029 | $ | 4,871,665 | $ | 4,457,881 | ||||||||||||||||||||||||||||||||
| Net interest rate spread (fully-taxable equivalent) | 2.99 | % | 3.09 | % | 3.03 | % | ||||||||||||||||||||||||||||||||
| Net interest margin (fully-taxable equivalent) | 3.00 | % | 3.11 | % | 3.09 | % | ||||||||||||||||||||||||||||||||
Net interest margin (fully-taxable equivalent), excluding fair value mark accretion and collection of previously charged-off acquired loans(3) | 2.96 | % | 3.07 | % | 3.05 | % | ||||||||||||||||||||||||||||||||
(1) Reported on a tax-equivalent basis calculated using the federal corporate income tax rate of 21%, including certain commercial loans.
(2) Non-accrual loans and loans held for sale are included in total average loans.
(3) Excludes the impact of the fair value mark accretion on loans and certificates of deposit generated in purchase accounting and collection of previously charged-off acquired loans for the three months ended September 30, 2020, June 30, 2020 and September 30, 2019 totaling $453,000, $403,000 and $409,000, respectively.
Year-to-Date Average Balance and Yield/Rate Analysis
(unaudited)
| Average Balance | Yield/Rate | |||||||||||||||||||||||||
| For The Nine Months Ended | For The Nine Months Ended | |||||||||||||||||||||||||
| (Dollars in thousands) | September 30, 2020 | September 30, 2019 | September 30, 2020 | September 30, 2019 | ||||||||||||||||||||||
| Assets | ||||||||||||||||||||||||||
| Interest-earning assets: | ||||||||||||||||||||||||||
Interest-bearing deposits in other banks and other interest-earning assets | $ | 150,383 | $ | 63,146 | 0.25 | % | 2.26 | % | ||||||||||||||||||
| Investments - taxable | 850,970 | 832,780 | 2.37 | % | 2.55 | % | ||||||||||||||||||||
Investments - nontaxable(1) | 121,284 | 94,405 | 3.39 | % | 3.47 | % | ||||||||||||||||||||
Loans(2): | ||||||||||||||||||||||||||
| Commercial real estate | 1,297,364 | 1,263,934 | 3.93 | % | 4.66 | % | ||||||||||||||||||||
Commercial(1) | 397,754 | 386,338 | 3.91 | % | 4.69 | % | ||||||||||||||||||||
| SBA PPP | 133,569 | — | 4.00 | % | — | % | ||||||||||||||||||||
Municipal(1) | 18,545 | 19,421 | 3.60 | % | 3.56 | % | ||||||||||||||||||||
| HPFC | 18,026 | 29,183 | 8.38 | % | 8.03 | % | ||||||||||||||||||||
| Residential real estate | 1,082,276 | 1,034,609 | 4.08 | % | 4.31 | % | ||||||||||||||||||||
| Consumer and home equity | 320,273 | 347,201 | 4.55 | % | 5.43 | % | ||||||||||||||||||||
| Total loans | 3,267,807 | 3,080,686 | 4.06 | % | 4.66 | % | ||||||||||||||||||||
| Total interest-earning assets | 4,390,444 | 4,071,017 | 3.59 | % | 4.16 | % | ||||||||||||||||||||
| Other assets | 395,621 | 321,060 | ||||||||||||||||||||||||
| Total assets | $ | 4,786,065 | $ | 4,392,077 | ||||||||||||||||||||||
| Liabilities & Shareholders' Equity | ||||||||||||||||||||||||||
| Deposits: | ||||||||||||||||||||||||||
| Non-interest checking | $ | 645,640 | $ | 505,733 | — | % | — | % | ||||||||||||||||||
| Interest checking | 1,261,831 | 1,108,999 | 0.40 | % | 0.98 | % | ||||||||||||||||||||
| Savings | 517,936 | 478,573 | 0.06 | % | 0.08 | % | ||||||||||||||||||||
| Money market | 701,872 | 595,659 | 0.55 | % | 1.27 | % | ||||||||||||||||||||
| Certificates of deposit | 482,076 | 498,059 | 1.36 | % | 1.54 | % | ||||||||||||||||||||
| Total deposits | 3,609,355 | 3,187,023 | 0.44 | % | 0.83 | % | ||||||||||||||||||||
| Borrowings: | ||||||||||||||||||||||||||
| Brokered deposits | 228,483 | 360,066 | 0.65 | % | 2.49 | % | ||||||||||||||||||||
| Customer repurchase agreements | 213,463 | 239,917 | 0.71 | % | 1.27 | % | ||||||||||||||||||||
| Subordinated debentures | 59,195 | 58,997 | 6.02 | % | 5.38 | % | ||||||||||||||||||||
| Other borrowings | 69,883 | 23,847 | 0.88 | % | 2.17 | % | ||||||||||||||||||||
| Total borrowings | 571,024 | 682,827 | 1.26 | % | 2.30 | % | ||||||||||||||||||||
| Total funding liabilities | 4,180,379 | 3,869,850 | 0.55 | % | 1.09 | % | ||||||||||||||||||||
| Other liabilities | 108,122 | 66,966 | ||||||||||||||||||||||||
| Shareholders' equity | 497,564 | 455,261 | ||||||||||||||||||||||||
| Total liabilities & shareholders' equity | $ | 4,786,065 | $ | 4,392,077 | ||||||||||||||||||||||
| Net interest rate spread (fully-taxable equivalent) | 3.04 | % | 3.07 | % | ||||||||||||||||||||||
| Net interest margin (fully-taxable equivalent) | 3.06 | % | 3.13 | % | ||||||||||||||||||||||
Net interest margin (fully-taxable equivalent), excluding fair value mark accretion and collection of previously charged-off acquired loans(3) | 3.03 | % | 3.09 | % | ||||||||||||||||||||||
(1) Reported on a tax-equivalent basis calculated using the federal corporate income tax rate of 21%, including certain commercial loans.
(2) Non-accrual loans and loans held for sale are included in total average loans.
(3) Excludes the impact of the fair value mark accretion on loans and certificates of deposit generated in purchase accounting and collection of previously charged-off acquired loans for the nine months ended September 30, 2020 and September 30, 2019 totaling $1.1 million and $1.2 million, respectively.
Asset Quality Data | ||||||||||||||||||||||||||||||||
(unaudited) | ||||||||||||||||||||||||||||||||
| (In thousands) | At or For The Nine Months Ended September 30, 2020 | At or For The Six Months Ended June 30, 2020 | At or For The Three Months Ended March 31, 2020 | At or For The Year Ended December 31, 2019 | At or For The Nine Months Ended September 30, 2019 | |||||||||||||||||||||||||||
| Non-accrual loans: | ||||||||||||||||||||||||||||||||
| Residential real estate | $ | 4,017 | $ | 4,664 | $ | 3,499 | $ | 4,096 | $ | 5,152 | ||||||||||||||||||||||
| Commercial real estate | 565 | 432 | 646 | 1,122 | 1,156 | |||||||||||||||||||||||||||
| Commercial | 605 | 699 | 748 | 420 | 751 | |||||||||||||||||||||||||||
| Consumer and home equity | 2,503 | 2,371 | 2,102 | 2,154 | 2,616 | |||||||||||||||||||||||||||
| HPFC | 509 | 392 | 322 | 364 | 450 | |||||||||||||||||||||||||||
| Total non-accrual loans | 8,199 | 8,558 | 7,317 | 8,156 | 10,125 | |||||||||||||||||||||||||||
Accruing troubled-debt restructured loans not included above | 2,952 | 2,874 | 3,008 | 2,993 | 3,259 | |||||||||||||||||||||||||||
| Total non-performing loans | 11,151 | 11,432 | 10,325 | 11,149 | 13,384 | |||||||||||||||||||||||||||
| Other real estate owned | — | 118 | 94 | 94 | 94 | |||||||||||||||||||||||||||
| Total non-performing assets | $ | 11,151 | $ | 11,550 | $ | 10,419 | $ | 11,243 | $ | 13,478 | ||||||||||||||||||||||
| Loans 30-89 days past due: | ||||||||||||||||||||||||||||||||
| Residential real estate | $ | 1,784 | $ | 4,016 | $ | 1,781 | $ | 2,227 | $ | 1,447 | ||||||||||||||||||||||
| Commercial real estate | 2,056 | 1,625 | 2,641 | 1,582 | 2,242 | |||||||||||||||||||||||||||
| Commercial | 1,315 | 95 | 1,560 | 548 | 1,135 | |||||||||||||||||||||||||||
| Consumer and home equity | 434 | 388 | 1,379 | 750 | 822 | |||||||||||||||||||||||||||
| HPFC | 323 | 128 | 165 | 243 | 193 | |||||||||||||||||||||||||||
Total loans 30-89 days past due | $ | 5,912 | $ | 6,252 | $ | 7,526 | $ | 5,350 | $ | 5,839 | ||||||||||||||||||||||
Allowance for loan losses at the beginning of the period | $ | 25,171 | $ | 25,171 | $ | 25,171 | $ | 24,712 | $ | 24,712 | ||||||||||||||||||||||
| Provision for loan losses | 12,172 | 11,172 | 1,772 | 2,862 | 2,658 | |||||||||||||||||||||||||||
| Charge-offs: | ||||||||||||||||||||||||||||||||
| Residential real estate | 121 | 96 | 96 | 462 | 436 | |||||||||||||||||||||||||||
| Commercial real estate | 104 | 71 | 50 | 300 | 157 | |||||||||||||||||||||||||||
| Commercial | 857 | 673 | 253 | 1,167 | 636 | |||||||||||||||||||||||||||
| Consumer and home equity | 199 | 134 | 91 | 713 | 670 | |||||||||||||||||||||||||||
| HPFC | — | — | — | 71 | 11 | |||||||||||||||||||||||||||
| Total charge-offs | 1,281 | 974 | 490 | 2,713 | 1,910 | |||||||||||||||||||||||||||
| Total recoveries | (352) | (170) | (68) | (310) | (228) | |||||||||||||||||||||||||||
| Net charge-offs | 929 | 804 | 422 | 2,403 | 1,682 | |||||||||||||||||||||||||||
Allowance for loan losses at the end of the period | $ | 36,414 | $ | 35,539 | $ | 26,521 | $ | 25,171 | $ | 25,688 | ||||||||||||||||||||||
Components of allowance for credit losses: | ||||||||||||||||||||||||||||||||
Allowance for loan losses | $ | 36,414 | $ | 35,539 | $ | 26,521 | $ | 25,171 | $ | 25,688 | ||||||||||||||||||||||
Liability for unfunded credit commitments | 9 | 22 | 24 | 21 | 11 | |||||||||||||||||||||||||||
| Allowance for credit losses | $ | 36,423 | $ | 35,561 | $ | 26,545 | $ | 25,192 | $ | 25,699 | ||||||||||||||||||||||
| Ratios: | ||||||||||||||||||||||||||||||||
Non-performing loans to total loans | 0.34 | % | 0.34 | % | 0.33 | % | 0.36 | % | 0.43 | % | ||||||||||||||||||||||
Non-performing assets to total assets | 0.22 | % | 0.23 | % | 0.23 | % | 0.25 | % | 0.30 | % | ||||||||||||||||||||||
Allowance for loan losses to total loans | 1.11 | % | 1.07 | % | 0.84 | % | 0.81 | % | 0.83 | % | ||||||||||||||||||||||
Allowance for loan losses to total loans, excluding SBA PPP loans(1) | 1.19 | % | 1.14 | % | 0.84 | % | 0.81 | % | 0.83 | % | ||||||||||||||||||||||
Net charge-offs to average loans (annualized): | ||||||||||||||||||||||||||||||||
Quarter-to-date | 0.01 | % | 0.05 | % | 0.05 | % | 0.09 | % | 0.16 | % | ||||||||||||||||||||||
Year-to-date | 0.04 | % | 0.05 | % | 0.05 | % | 0.08 | % | 0.07 | % | ||||||||||||||||||||||
Allowance for loan losses to non-performing loans | 326.55 | % | 310.87 | % | 256.86 | % | 225.77 | % | 191.93 | % | ||||||||||||||||||||||
Loans 30-89 days past due to total loans | 0.18 | % | 0.19 | % | 0.24 | % | 0.17 | % | 0.19 | % | ||||||||||||||||||||||
(1) This is a non-GAAP measure. Please refer to "Reconciliation of non-GAAP to GAAP Financial Measures (unaudited)" for further details.
Reconciliation of non-GAAP to GAAP Financial Measures (unaudited)
Return on Average Tangible Equity: | ||||||||||||||||||||||||||||||||
| For the Three Months Ended | For the Nine Months Ended | |||||||||||||||||||||||||||||||
| (Dollars in thousands) | September 30, 2020 | June 30, 2020 | September 30, 2019 | September 30, 2020 | September 30, 2019 | |||||||||||||||||||||||||||
| Net income, as presented | $ | 16,775 | $ | 10,940 | $ | 14,488 | $ | 41,208 | $ | 41,965 | ||||||||||||||||||||||
Add: amortization of core deposit intangible assets, net of tax(1) | 134 | 135 | 140 | 404 | 418 | |||||||||||||||||||||||||||
| Net income, adjusted for amortization of core deposit intangible assets | $ | 16,909 | $ | 11,075 | $ | 14,628 | $ | 41,612 | $ | 42,383 | ||||||||||||||||||||||
| Average equity, as presented | $ | 512,902 | $ | 499,449 | $ | 468,920 | $ | 497,564 | $ | 455,261 | ||||||||||||||||||||||
| Less: average goodwill and core deposit intangible assets | (97,794) | (97,965) | (98,484) | (97,967) | (98,659) | |||||||||||||||||||||||||||
Average tangible equity | $ | 415,108 | $ | 401,484 | $ | 370,436 | $ | 399,597 | $ | 356,602 | ||||||||||||||||||||||
| Return on average equity | 13.01 | % | 8.81 | % | 12.26 | % | 11.06 | % | 12.32 | % | ||||||||||||||||||||||
| Return on average tangible equity | 16.21 | % | 11.09 | % | 15.67 | % | 13.91 | % | 15.89 | % | ||||||||||||||||||||||
(1) Assumed a 21% tax rate.
| Efficiency Ratio: | ||||||||||||||||||||||||||||||||
| For the Three Months Ended | For the Nine Months Ended | |||||||||||||||||||||||||||||||
| (Dollars in thousands) | September 30, 2020 | June 30, 2020 | September 30, 2019 | September 30, 2020 | September 30, 2019 | |||||||||||||||||||||||||||
| Non-interest expense, as presented | $ | 25,221 | $ | 23,509 | $ | 23,748 | $ | 73,291 | $ | 70,489 | ||||||||||||||||||||||
| Less: legal settlement | (1,200) | — | — | (1,200) | — | |||||||||||||||||||||||||||
| Adjusted non-interest expense | $ | 24,021 | $ | 23,509 | $ | 23,748 | $ | 72,091 | $ | 70,489 | ||||||||||||||||||||||
| Net interest income, as presented | $ | 34,481 | $ | 34,539 | $ | 31,923 | $ | 100,846 | $ | 95,391 | ||||||||||||||||||||||
Add: effect of tax-exempt income(1) | 292 | 295 | 264 | 865 | 752 | |||||||||||||||||||||||||||
| Non-interest income, as presented | 12,696 | 12,060 | 10,739 | 36,159 | 30,165 | |||||||||||||||||||||||||||
| Less: net gain on sale of securities | — | — | (1) | — | (28) | |||||||||||||||||||||||||||
Adjusted net interest income plus non-interest income | $ | 47,469 | $ | 46,894 | $ | 42,925 | $ | 137,870 | $ | 126,280 | ||||||||||||||||||||||
| GAAP efficiency ratio | 53.46 | % | 50.45 | % | 55.67 | % | 53.50 | % | 56.14 | % | ||||||||||||||||||||||
| Non-GAAP efficiency ratio | 50.60 | % | 50.13 | % | 55.32 | % | 52.29 | % | 55.82 | % | ||||||||||||||||||||||
(1) Assumed a 21% tax rate.
| Pre-tax, Pre-provision Earnings: | ||||||||||||||||||||||||||||||||
| For the Three Months Ended | For the Nine Months Ended | |||||||||||||||||||||||||||||||
| (In thousands) | September 30, 2020 | June 30, 2020 | September 30, 2019 | September 30, 2020 | September 30, 2019 | |||||||||||||||||||||||||||
| Net income, as presented | $ | 16,775 | $ | 10,940 | $ | 14,488 | $ | 41,208 | $ | 41,965 | ||||||||||||||||||||||
| Add: provision for credit losses | 987 | 9,398 | 730 | 12,160 | 2,647 | |||||||||||||||||||||||||||
| Add: income tax expense | 4,194 | 2,752 | 3,696 | 10,346 | 10,455 | |||||||||||||||||||||||||||
| Pre-tax, pre-provision earnings | $ | 21,956 | $ | 23,090 | $ | 18,914 | $ | 63,714 | $ | 55,067 | ||||||||||||||||||||||
| Allowance for loan losses to total loans, excluding SBA PPP loans: | ||||||||||||||||||||
| (In thousands) | September 30, 2020 | June 30, 2020 | September 30, 2019 | |||||||||||||||||
| Allowance for loan losses, as presented | $ | 36,414 | $ | 35,539 | $ | 25,688 | ||||||||||||||
| Less: allowance for loan losses on SBA PPP loans | (115) | (113) | — | |||||||||||||||||
| Adjusted allowance for loan losses | $ | 36,299 | $ | 35,426 | $ | 25,688 | ||||||||||||||
| Total loans, as presented | $ | 3,274,842 | $ | 3,326,041 | $ | 3,110,634 | ||||||||||||||
| Less: SBA PPP loans | (223,838) | (218,803) | — | |||||||||||||||||
| Adjusted total loans | $ | 3,051,004 | $ | 3,107,238 | $ | 3,110,634 | ||||||||||||||
| Allowance for loan losses to total loans | 1.11 | % | 1.07 | % | 0.83 | % | ||||||||||||||
| Allowance for loan losses to total loans, excluding SBA PPP loans | 1.19 | % | 1.14 | % | 0.83 | % | ||||||||||||||
| Tangible Book Value Per Share and Tangible Common Equity Ratio: | ||||||||||||||||||||
| September 30, 2020 | June 30, 2020 | September 30, 2019 | ||||||||||||||||||
| (In thousands, except number of shares, per share data and ratios) | ||||||||||||||||||||
| Tangible Book Value Per Share: | ||||||||||||||||||||
| Shareholders' equity, as presented | $ | 517,522 | $ | 506,467 | $ | 471,672 | ||||||||||||||
| Less: goodwill and other intangible assets | (97,711) | (97,881) | (98,398) | |||||||||||||||||
| Tangible shareholders' equity | $ | 419,811 | $ | 408,586 | $ | 373,274 | ||||||||||||||
| Shares outstanding at period end | 14,917,344 | 14,963,041 | 15,224,903 | |||||||||||||||||
| Book value per share | $ | 34.69 | $ | 33.85 | $ | 30.98 | ||||||||||||||
| Tangible book value per share | $ | 28.14 | $ | 27.31 | $ | 24.52 | ||||||||||||||
| Tangible Common Equity Ratio: | ||||||||||||||||||||
| Total assets | $ | 5,153,793 | $ | 4,959,016 | $ | 4,520,315 | ||||||||||||||
| Less: goodwill and other intangible assets | (97,711) | (97,881) | (98,398) | |||||||||||||||||
| Tangible assets | $ | 5,056,082 | $ | 4,861,135 | $ | 4,421,917 | ||||||||||||||
| Common equity ratio | 10.04 | % | 10.21 | % | 10.43 | % | ||||||||||||||
| Tangible common equity ratio | 8.30 | % | 8.41 | % | 8.44 | % | ||||||||||||||
| Core Deposits: | ||||||||||||||||||||
| (In thousands) | September 30, 2020 | June 30, 2020 | September 30, 2019 | |||||||||||||||||
| Total deposits | $ | 4,224,044 | $ | 3,996,358 | $ | 3,617,963 | ||||||||||||||
| Less: certificates of deposit | (405,434) | (431,376) | (541,199) | |||||||||||||||||
| Less: brokered deposits | (291,616) | (224,777) | (250,226) | |||||||||||||||||
| Core deposits | $ | 3,526,994 | $ | 3,340,205 | $ | 2,826,538 | ||||||||||||||
| Average Core Deposits: | ||||||||||||||||||||||||||||||||
| For the Three Months Ended | For the Nine Months Ended | |||||||||||||||||||||||||||||||
| (In thousands) | September 30, 2020 | June 30, 2020 | September 30, 2019 | September 30, 2020 | September 30, 2019 | |||||||||||||||||||||||||||
| Total average deposits | $ | 3,794,434 | $ | 3,676,000 | $ | 3,300,599 | $ | 3,609,355 | $ | 3,187,023 | ||||||||||||||||||||||
| Less: average certificates of deposit | (417,788) | (477,068) | (533,110) | (482,076) | (498,059) | |||||||||||||||||||||||||||
| Average core deposits | $ | 3,376,646 | $ | 3,198,932 | $ | 2,767,489 | $ | 3,127,279 | $ | 2,688,964 | ||||||||||||||||||||||

Third Quarter 2020 Earnings Conference Call October 27, 2020 1

Forward Looking Statements and Non- GAAP Financial Measures FORWARD LOOKING STATEMENTS This presentation contains certain statements that may be considered forward-looking statements under the Private Securities Litigation Reform Act of 1995 and other federal securities laws, including certain plans, exceptions, goals, projections, and statements, which are subject to numerous risks, assumptions, and uncertainties. Forward-looking statements can be identified by the use of the words “believe,” “expect,” “anticipate,” “intend,” “estimate,” “assume,” “plan,” “target,” or “goal” or future or conditional verbs such as “will,” “may,” “might,” “should,” “could” and other expressions which predict or indicate future events or trends and which do not relate to historical matters. Forward-looking statements should not be relied on, because they involve known and unknown risks, uncertainties and other factors, some of which are beyond the control of Camden National Corporation (the “Company”). These risks, uncertainties and other factors may cause the actual results, performance or achievements of the Company to be materially different from the anticipated future results, performance or achievements expressed or implied by the forward-looking statements. The following factors, among others, could cause the Company’s financial performance to differ materially from the Company’s goals, plans, objectives, intentions, expectations and other forward-looking statements: weakness in the United States economy in general and the regional and local economies within the New England region and Maine, which could result in a deterioration of credit quality, an increase in the allowance for loan losses or a reduced demand for the Company’s credit or fee-based products and services; changes in trade, monetary, and fiscal policies and laws, including interest rate policies of the Board of Governors of the Federal Reserve System; inflation, interest rate, market, and monetary fluctuations; competitive pressures, including continued industry consolidation and the increased financial services provided by non-banks; volatility in the securities markets that could adversely affect the value or credit quality of the Company’s assets, impairment of goodwill, the availability and terms of funding necessary to meet the Company’s liquidity needs, and could lead to impairment in the value of securities in the Company's investment portfolio; changes in information technology that require increased capital spending; changes in consumer spending and savings habits; changes in tax, banking, securities and insurance laws and regulations; and changes in accounting policies, practices and standards, as may be adopted by the regulatory agencies as well as the Financial Accounting Standards Board ("FASB"), and other accounting standard setters. Further, statements about the potential effects of the COVID-19 pandemic on the Company’s businesses and results of operations and financial conditions may constitute forward-looking statements and are subject to the risk that the actual effects may differ, possibly materially, from what is reflected in those forward-looking statements due to factors and future developments that are uncertain, unpredictable and in many cases beyond our control, including the scope and duration of the pandemic, action taken by government authorities in response to the pandemic, and the direct and indirect impact of the pandemic on our customers, third parties and the Company. You should carefully review all of these factors, and be aware that there may be other factors that could cause differences, including the risk factors listed in the Company’s filings with the SEC, including our Annual Report on Form 10-K for the year ended December 31, 2019, as updated by the Company's quarterly reports on Form 10-Q and other filings with the Securities and Exchange Commission. You should carefully review the risk factors described therein and should not place undue reliance on our forward-looking statements. These forward-looking statements were based on information, plans and estimates at the date of this report, and we undertake no obligation to update any forward-looking statements to reflect changes in underlying assumptions or factors, new information, future events or other changes, except to the extent required by applicable law or regulation. NOTE REGARDING PRESENTATION OF NON-GAAP FINANCIAL MEASURES This presentation includes certain non-GAAP financial measures. Management uses these non-GAAP financial measures for purposes of measuring our performance against our peer group and other financial institutions and analyzing our internal performance. These non-GAAP financial measures also help investors better understand the Company’s operating performance and trends and allow for better performance comparisons to other financial institutions. These measures are not a substitute for GAAP operating results and may not be comparable to non-GAAP measures used by other financial institutions. Schedules that reconcile the non-GAAP financial measures to GAAP financial information are included in our Annual Report on Form 10-K and earnings releases filed with the SEC. 2

Third Quarter 2020 Highlights Net Income • Net income up 53% over last quarter $16.8 million driven by lower loan loss provision Diluted Earnings Per Share • Loan deferrals declined to 5.5% of loans, down from 16.4% last quarter $1.11 • Asset quality remains strong Return on Average Assets 1.34% • Maintained a strong capital and liquidity position Efficiency Ratio (non-GAAP) 50.60% • Repurchased 47,915 shares at an average price of $29.26 during Q3 Total Risk-Based Capital Ratio 15.15% 3

Income Statement Increase/(Decrease) $ thousands 3Q20 2Q20 3Q19 Highlights • SBA PPP loans added $2.4mm to 3Q20 interest Net interest income $34,481 ($58) $2,558 income • Year-over-year increase driven by strong mortgage Non-interest income $12,696 $636 $1,957 banking income Total revenue $47,177 $578 $4,515 • 1% linked quarter; 11% year-over-year growth • Linked quarter increase driven by one-time $1.2 million Non-interest expense $25,221 $1,712 $1,473 litigation expense accrual Pre-tax, pre-provision earnings(1) $21,956 ($1,134) $3,042 • (5%) linked quarter; 16% year-over-year growth Provision for credit losses $987 ($8,411) $257 Income tax expense $4,194 $1,442 $498 • Linked quarter increase driven by lower provision Net income $16,774 $5,834 $2,286 expense; Year-over-year increase driven by higher mortgage banking income 3Q20 2Q20 3Q19 Efficiency Ratio(1) 50.60% 50.13% 55.32 Net Interest Margin (FTE) 3.00% 3.11% 3.09% Diluted EPS $1.11 $0.73 $0.94 (1) Non-GAAP measure. 4
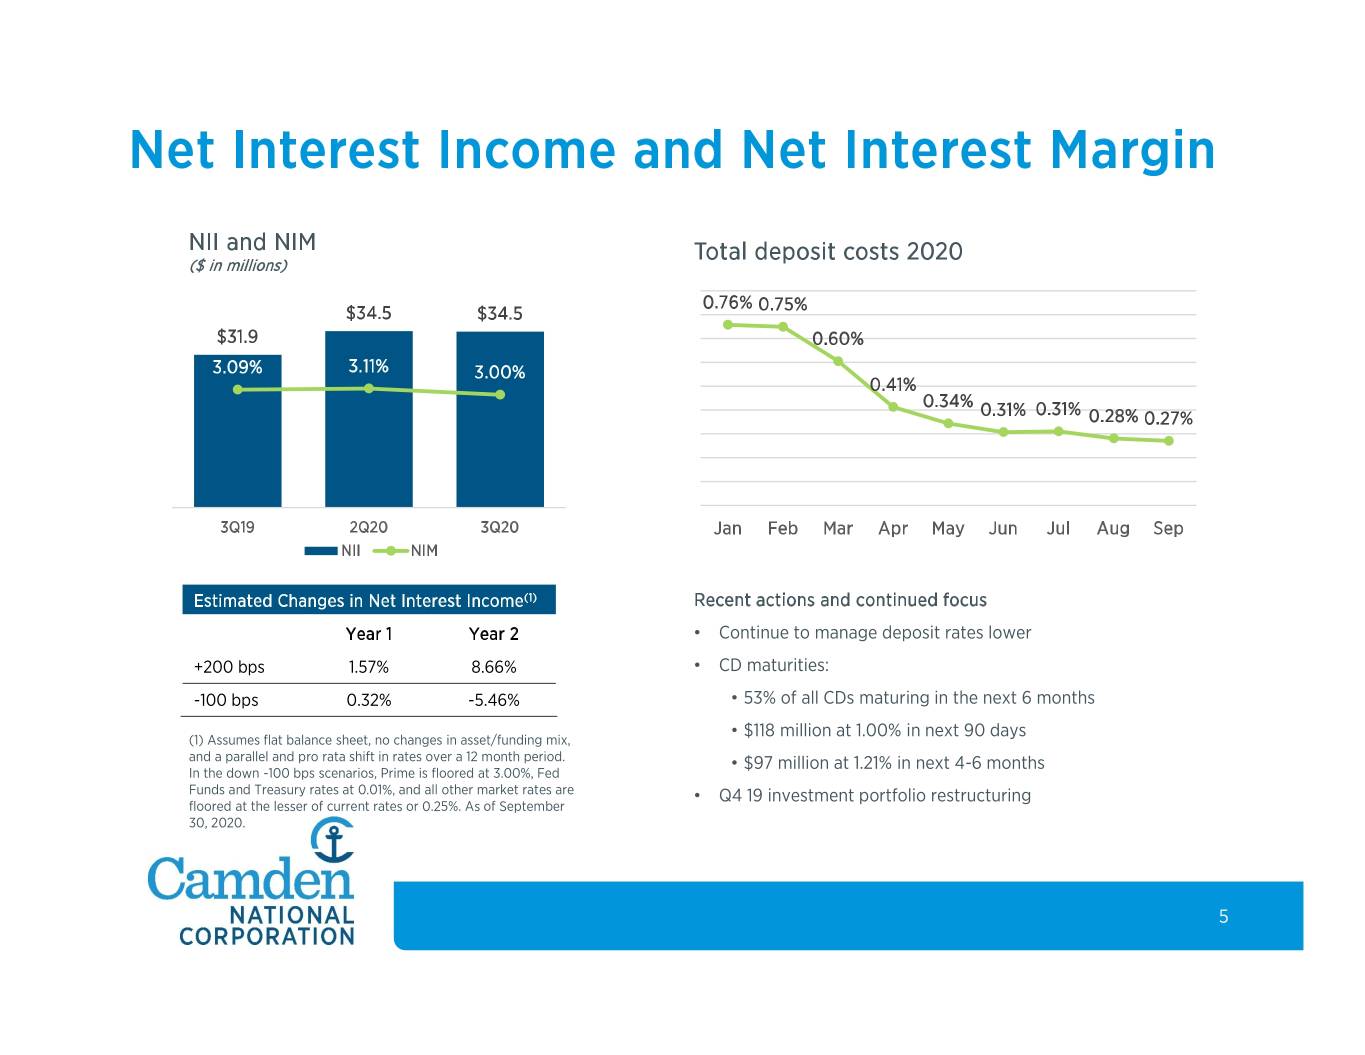
Net Interest Income and Net Interest Margin NII and NIM Total deposit costs 2020 ($ in millions) $40.0 5.00% 0.76% 0.75% $34.5 $34.5 4.50% $35.0 $31.9 4.00% 0.60% $30.0 3.09% 3.11% 3.00% 3.50% 0.41% 3.00% 0.34% 0.31% 0.31% $25.0 2.50% 0.28% 0.27% 2.00% $20.0 1.50% $15.0 1.00% 3Q19 2Q20 3Q20 Jan Feb Mar Apr May Jun Jul Aug Sep NII NIM Estimated Changes in Net Interest Income(1) Recent actions and continued focus Year 1 Year 2 • Continue to manage deposit rates lower +200 bps 1.57% 8.66% • CD maturities: -100 bps 0.32% -5.46% • 53% of all CDs maturing in the next 6 months $118 million at 1.00% in next 90 days (1) Assumes flat balance sheet, no changes in asset/funding mix, • and a parallel and pro rata shift in rates over a 12 month period. • $97 million at 1.21% in next 4-6 months In the down -100 bps scenarios, Prime is floored at 3.00%, Fed Funds and Treasury rates at 0.01%, and all other market rates are • Q4 19 investment portfolio restructuring floored at the lesser of current rates or 0.25%. As of September 30, 2020. 5

Loan Portfolio Residential Real Estate Balances of $3.3 Billion (as of 9/30/20) • 71% located in Maine and 24% in Massachusetts Home Equity 64% are primary residences, 26% second homes and 10% • and Consumer investment property 9% Commercial 11% • 97% of balances at </= 80% LTV(1) (or supplemented with private mortgage insurance) SBA PPP 7% Commercial Real Estate • 71% of real estate located in Maine, 15% in New Hampshire, and 10% in Massachusetts • 91% of balances at </= 80% LTV(1) Residential Real Estate Commercial 32% • SBA PPP production of $244.8 million added $221.7 million to average loans for Q3 with an average yield of 4.16% Loan Repricing Commercial Real Estate • $1.0 billion repricing in the next 12 months (average yield 41% 2.96%) • Floating rate: $917.2 million, 20% with in-the-money floors, and 74% without floors • Adjustable rate: $99.3 million, 2% with in-the-money floors, and 51% without floors All data is presented as of September 30, 2020. (1) At origination date 6

Commercial Diversification CRE and Commercial Loans by Industry Real Estate Investment Breakdown (as of 9/30/20) (as of 9/30/20) Other Nonresidential Other (14 Industries Buildings <3%) 8% 20% 1-4 Family 8% Office Buildings 28% Real Estate Investment Industrial / 39% Warehouse Restaurants 10% 3% $1.9 $750 million Construction 4% billion Manufacturing 5% Retail Store 19% Multi-Family / Retail Trade Apartments 7% 27% Exposure to COVID-19 impacted industries Health Care / Social Lodging 14% Asst. • $401.8 million, or 12% of total loan portfolio, is within Lodging, Sr. 8% Living & Care Facilities, Restaurants, and Travel & Recreation • Approximately 53% of Lodging are nationally branded franchises. 56% of Lodging located in Maine, 22% in Massachusetts, and 13% in New Hampshire 7

SBA PPP Loans Total Total • Funded 11% of Maine’s SBA PPP Balance Tier Units Production Outstanding(1) ($ in millions) ($ in millions) loans by dollar amount $0 - $50,000 2,200 $35.1 $34.9 • SBA PPP loans yielded 4.16% and $50,001 - $250,000 650 $68.9 $67.1 3.79% during Q3 and Q2, $250,001 - $500,000 105 $35.7 $34.5 respectively $500,000 - $1,000,000 48 $33.6 $32.9 • $5.4 million of origination fees > $1,000,000 31 $71.5 $59.9 were yet to be recognized at Total 3,034 $244.8 $229.2 9/30/20 Origination Fees Interest Total Income ($ in ($ in millions) ($ in millions) millions) Quarter 2 $1.2 $0.5 $1.7 Quarter 3 $1.8 $0.6 $2.4 YTD 2020 $3.0 $1.1 $4.1 All data is presented as of September 30, 2020. (1) Excludes unamortized origination fees 8

Loan Deferral Details 6/30/2020 9/30/2020 Category Deferred % of Category Deferred % of Category ($ in millions) Volume Deferred Volume Deferred Lodging $174.8 66.2% $50.2 19.0% Real Estate Investment $102.0 14.0% $12.8 1.7% Health Care/Social Asst. $29.9 19.8% $9.1 6.1% Retail Trade $28.1 19.4% $4.4 3.2% Restaurants $19.3 28.8% $1.1 1.8% Other Business $61.5 10.2% $28.3 5.0% Business $415.6 21.2% $105.9 5.5% Consumer $131.1 9.6% $75.3 5.6% Total $546.7 16.4% $181.2 5.5% • Short term deferrals for 180 days or less • Continued to accrue and record interest income throughout deferral period • Weekly deferment requests have decreased 99.5% compared to April’s peak • We continue to work with our customer to address payment concerns on a case by case basis 9

Solid Credit Quality NPAs / Total Assets ALL / NPLs 326.55% 12/31/2009 1.07% 225.77% 0.67% 171.17% 0.50% 118.92% 0.34% 92.28% 12/31/2009 0.25% 0.22% 109.31% 2016 2017 2018 2019 3Q20 2016 2017 2018 2019 3Q20 NCOs / Average Loans ALL / Total Loans 12/31/2009 12/31/2009 0.37% 1.11% 1.33% 0.89% 0.87% 0.82% 0.81% 0.13% 0.07% 0.08% 0.04% 0.01% 2016 2017 2018 2019 3Q20(1) 2016 2017 2018 2019 3Q20 Data presented does not reflect the impact of CECL, as the Company has elected to delay implementation of CECL pursuant to the CARES Act. (1) Annualized 10

Securities Portfolio Securities Portfolio Mix • Book value was $1.1 billion, up $58 million, or 6%, (Book Value at 9/30/20) linked-quarter U.S. Agencies and Other 5% • Average yield of 2.26%, down 34 bps linked-quarter Municipal 11% CMO - • Unrealized net gain of $37.7 million on AFS compared Agency to $38.5 million at 6/30/20 36% • 99.9% AFS, 0.1% HTM • Duration 3.91 years compared to 4.12 years at 6/30/20 MBS - • 99% of municipal holdings are rated A or better by at Agency least one rating agency (50% carry additional credit 48% support) ($ in millions) 3Q19 4Q19 1Q20 2Q20 3Q20 Average Book Value $906 $917 $927 $961 $1,029 Book Yield 2.63% 2.63% 2.67% 2.60% 2.26% Modified Duration 4.08 4.65 4.37 4.12 3.91 All data is presented as of September 30, 2020. 11

Incurred Loss vs CECL Allowance for Credit Losses (includes the allowance for loan losses and off-balance sheet credit exposures) ($ in millions) 1/1/2020 9/30/2020 ACL $25.2 $36.4 ACL as % of Loans 0.81% 1.11% Incurred Loss YTD Provision for Credit Losses $12.2 YTD Provision for Credit Losses as 0.50% % of Average Loans (annualized) ACL $27.0 - $31.0 $39.0 - $43.0 ACL as % of Loans 0.87% - 1.00% 1.19% - 1.31% CECL (Estimates) YTD Provision for Credit Losses $9.0 - $17.0 YTD Provision for Credit Losses as 0.37% - 0.69% % of Average Loans (annualized) • Continue to run parallel calculations under incurred loss and CECL • Will adopt CECL on December 31, 2020, effective retrospectively as of January 1, 2020 12

Strong Liquidity Position Well Positioned to Support Liquidity Needs Liquidity Sources (9/30/20) Amount ($ in millions) Excess Cash $297.8 Unpledged Investment Securities $354.3 Lines of Credit Exposure Unpledged Municipal Securities $102.1 6% Increase in Utilization YoY Over Collateralized Securities Pledging Position $109.6 $1,295.6 FHLB Borrowing Capacity $513.2 $1,269.1 $1,225.1 Current Fed Discount Window Availability $58.5 Unsecured Borrowing Lines $69.9 54% 50% 48% Total $1,505.4 Brokered Deposit Access of $734.5 million • Planned construction funding represents the entire increase in outstanding balance at 9/30/2020 over the 46% 50% 52% year-ago balance • Daily credit line monitoring shows declining utilization in non-construction lines since 3/31/2020 9/30/2019 6/30/2020 9/30/2020 Outstanding Unfunded 13
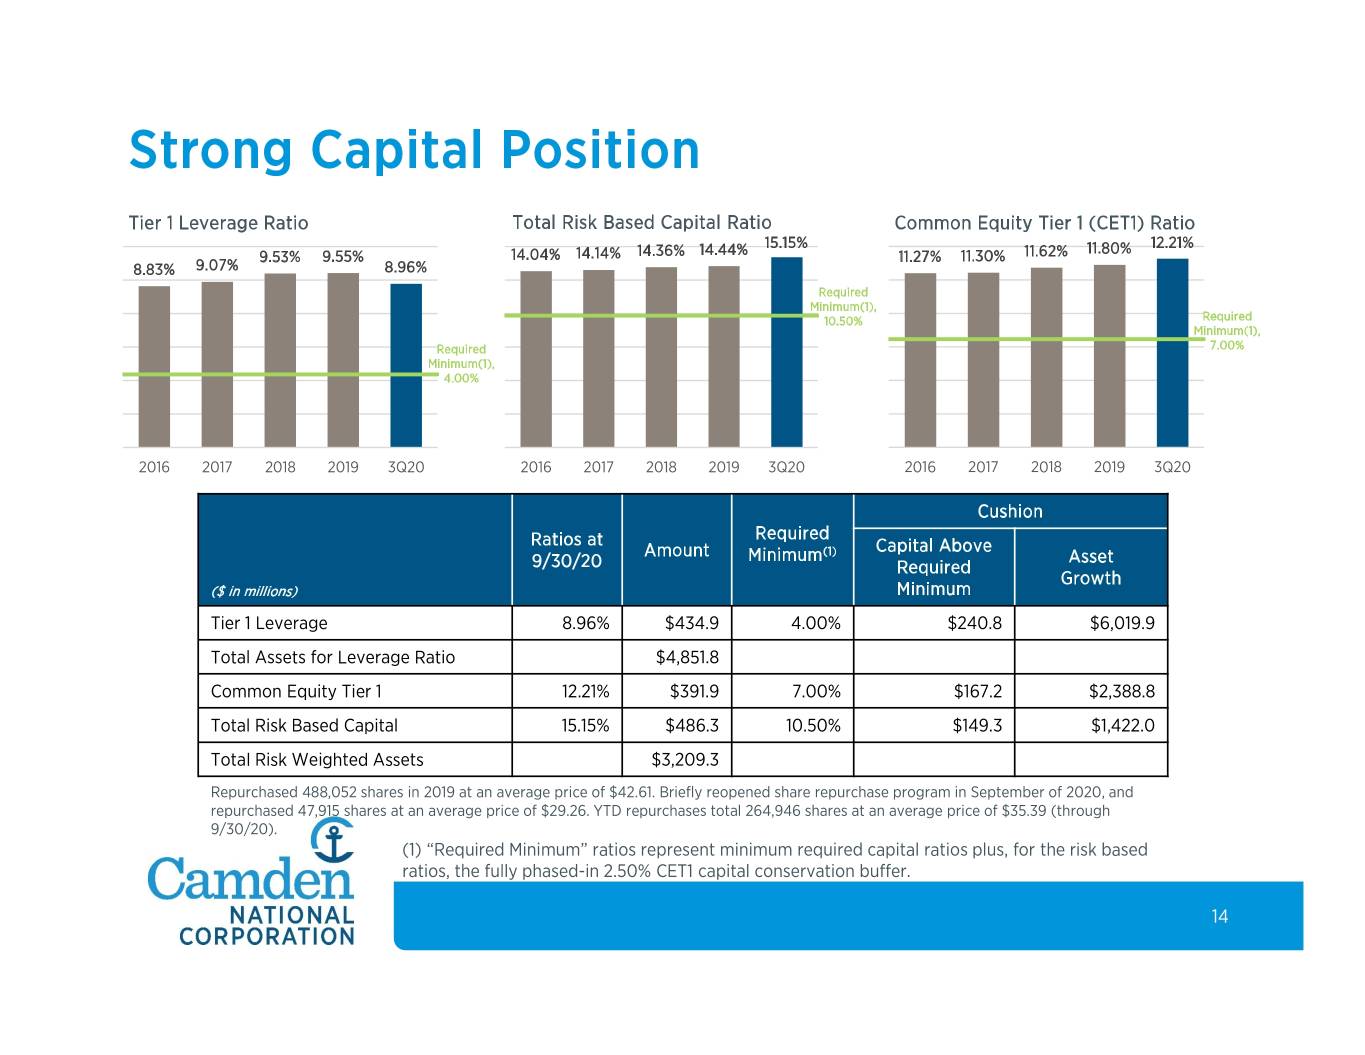
Strong Capital Position Tier 1 Leverage Ratio Total Risk Based Capital Ratio Common Equity Tier 1 (CET1) Ratio 15.15% 11.80% 12.21% 9.53% 9.55% 14.04% 14.14% 14.36% 14.44% 11.27% 11.30% 11.62% 8.83% 9.07% 8.96% Required Minimum(1), 10.50% Required Minimum(1), Required 7.00% Minimum(1), 4.00% 2016 2017 2018 2019 3Q20 2016 2017 2018 2019 3Q20 2016 2017 2018 2019 3Q20 Cushion Required Ratios at Capital Above Amount Minimum(1) Asset 9/30/20 Required Growth ($ in millions) Minimum Tier 1 Leverage 8.96% $434.9 4.00% $240.8 $6,019.9 Total Assets for Leverage Ratio $4,851.8 Common Equity Tier 1 12.21% $391.9 7.00% $167.2 $2,388.8 Total Risk Based Capital 15.15% $486.3 10.50% $149.3 $1,422.0 Total Risk Weighted Assets $3,209.3 Repurchased 488,052 shares in 2019 at an average price of $42.61. Briefly reopened share repurchase program in September of 2020, and repurchased 47,915 shares at an average price of $29.26. YTD repurchases total 264,946 shares at an average price of $35.39 (through 9/30/20). (1) “Required Minimum” ratios represent minimum required capital ratios plus, for the risk based ratios, the fully phased-in 2.50% CET1 capital conservation buffer. 14
 Third Quarter Report - 2020
Dear Fellow Shareholders:
On behalf of all of us at Camden National Corporation, I wish you and your loved ones safety and good health.
I’m pleased to share that our operating and financial performance during the third quarter of 2020 demonstrates the strength and resiliency of Camden National Corporation. Over the past several years, we have made significant investments in expanding our products and services, strengthening our balance sheet, enhancing our technology platforms, and developing our employees. The COVID-19 pandemic has tested those strategies—as well as many other aspects of our company—and I continue to be incredibly proud of our team’s performance.
Engaged Employees. Our employees are the critical element in our response to COVID-19, a tumultuous economy, and evolving customer needs. By June 29, 2020, our banking centers returned to full operation while adhering to health guidelines. Currently, approximately 28% of our non-banking center employees work at an office at least once a week. Strategic, ongoing investments in technology and corporate real estate have enabled us to remain flexible and connected—whether employees are working remotely or onsite.
Throughout the pandemic, we have continued investing in employee development—and many of these activities have shifted to a virtual environment. For example, we reimagined our annual in-person Employee Appreciation Night, and this year instead held a successful, weeklong virtual celebration. We have rapidly redesigned other people-related programs, such as employee orientation and Horizons, our internal leadership development program, to take place virtually. We believe these events are vital to our unique culture and ongoing development together.
Our approach during this challenging time has been candid and deliberate, guided by our core belief that feedback is vital to our success. During August, we conducted our annual Gallup Employee Engagement survey, and it is with great pride that I share that our engagement score has increased over our 2019 results. This is a true testament to the positive attitude and resiliency of our employees and management teams over the last year.
Solid Asset Quality. Driven by our diligent credit culture and quick response to help customers, our asset quality remains strong. As of September 30, 2020, 5.5% of total loans were operating under payment deferral arrangements for a period of 180 days or less due to COVID-19, down from 16.4% of total loans at June 30, 2020.
Non-performing assets were 0.22% of total loans at September 30, 2020, down slightly from 0.23% reported at June 30, 2020 and 0.30% reported a year ago. Annualized net charge-offs were 0.01% for the third quarter of 2020, down from 0.05% last quarter and 0.16% for the third quarter of 2019.
We continue to review our allowance for loan losses, adding nearly $1.0 million of provision expense in the third quarter of 2020, down significantly from the $9.4 million added in the second quarter of 2020. As a result, our
allowance for loan losses to total loans ratio was 1.11% at September 30, 2020, up from 1.07% as of June 30, 2020 and 0.83% a year ago. We are very cautious regarding current economic conditions and continue taking prudent steps we believe will contribute to the long-term strength of our balance sheet.
Strong Operating Results. Net income for the nine months ending September 30, 2020 of $41.2 million was 2% below earnings for the prior year period. Pre-tax, pre-provision earnings for the nine month period ending September 30, 2020 of $63.7 million were 16% above pre-tax, pre-provision earnings for the comparable period a year ago, demonstrating the strength of our organization’s core operating capabilities. Net interest income of $100.8 million for the year-to-date period in 2020 was $5.5 million above the same period last year, reflecting the $4.1 million benefit from the PPP program, partially offset by a 7 basis points decrease in net interest margin to 3.06% for the year-to-date period in 2020.
Non-interest income totaled $36.2 million for the nine months ended September 30, 2020, up 20.0% over the same period last year. The increase over this period was driven by mortgage banking revenues, which has benefited from the historically low mortgage rates. We are seeing strong volumes from both purchase and refinance activity. Lower service charge income from deposit-related products reflecting higher customer balances and lower activity due to the pandemic partially offset mortgage revenue.
Non-interest expenses were $73.3 million for the nine months ended September 30, 2020, 4% higher than the same period last year. In the third quarter of 2020, we recorded a $1.2 million reserve for a litigation matter, which has been settled and limits the risk to the company. Excluding the settlement reserve, our efficiency ratio was 52.29% for the nine months ended September 30, 2020, compared to 55.82% recorded the same period last year.
During the third quarter, we declared a dividend of $0.33, which provided a 4.37% annualized dividend yield as of September 30, 2020. We also resumed our common stock repurchase efforts in the third quarter of 2020 and purchased 47,915 shares.
Deepening Management Capabilities. Tim Nightingale, who previously served as Executive Vice President of Commercial Banking for Camden National, was recently named Executive Vice President and Chief Credit Officer. In his new role, Tim is responsible for overseeing our asset quality and credit efforts, including oversight of our special asset and collection groups, commercial loan administration activities, and oversight of our COVID-19 loan deferral and PPP programs. Ryan Smith, who previously served as Senior Vice President of Credit Administration, was promoted to Executive Vice President of Commercial Banking, leading our commercial lending and treasury management activities. This realignment will enhance our oversight of asset quality and leverage Ryan’s strong commercial lending skills.
Exploring New Opportunities. Despite the need to focus on specific, immediate issues throughout the pandemic, our strong team continues looking for future opportunities. In
Third Quarter Report - 20202020, we introduced a Robotic Process Automation (“RPA”) pilot project that leverages technology to automate various tasks with the goal of streamlining workflows while increasing quality. To date, we have introduced 12 “bots” and will continue to rollout new efforts aimed at various high volume activities. RPA is part of our larger effort to leverage technology and business intelligence to drive our future success. In July, we furthered our commitment by becoming a founding member of the Roux Institute, which was created through a joint venture between the Roux family and Northeastern University to foster innovation in technology, building a pipeline of talent in Maine.
Charting our future. The pandemic has certainly brought on challenges and many changes, but we believe it has also accelerated three important trends facing banks: (1) Our customers have proven they are willing to adapt to digital
services faster than expected; (2) People are even more hyper-connected, impacting the way we interact and communicate; and (3) People are more aware of their financial well-being. Leveraging our strengths and resiliency, as well as adopting new capabilities such as bots and business intelligence, we believe Camden National is well positioned for the future.
Be well, be safe, and be healthy,

Gregory A. Dufour
President and Chief Executive Officer
Financial Highlights (unaudited)
| Three Months Ended September 30, | Nine Months Ended September 30, | |||||||||||||||||||||||||
| (Dollars in thousands, except per share data) | 2020 | 2019 | 2020 | 2019 | ||||||||||||||||||||||
| Earnings and Dividends | ||||||||||||||||||||||||||
| Net interest income | $ | 34,481 | $ | 31,923 | $ | 100,846 | $ | 95,391 | ||||||||||||||||||
| Non-interest income | 12,696 | 10,739 | 36,159 | 30,165 | ||||||||||||||||||||||
| Non-interest expense | (25,221) | (23,748) | (73,291) | (70,489) | ||||||||||||||||||||||
Pre-tax, pre-provision earnings(1) | 21,956 | 18,914 | 63,714 | 55,067 | ||||||||||||||||||||||
| Provision for credit losses | (987) | (730) | (12,160) | (2,647) | ||||||||||||||||||||||
| Income before taxes | 20,969 | 18,184 | 51,554 | 52,420 | ||||||||||||||||||||||
| Income taxes | (4,194) | (3,696) | (10,346) | (10,455) | ||||||||||||||||||||||
| Net income | $ | 16,775 | $ | 14,488 | $ | 41,208 | $ | 41,965 | ||||||||||||||||||
| Diluted earnings per share | $ | 1.12 | $ | 0.94 | $ | 2.74 | $ | 2.70 | ||||||||||||||||||
| Cash dividends declared per share | 0.33 | 0.30 | 0.99 | 0.90 | ||||||||||||||||||||||
| Performance Ratios | ||||||||||||||||||||||||||
| Return on average assets | 1.34 | % | 1.29 | % | 1.15 | % | 1.28 | % | ||||||||||||||||||
| Return on average equity | 13.01 | % | 12.26 | % | 11.06 | % | 12.32 | % | ||||||||||||||||||
| Net interest margin (fully-taxable equivalent) | 3.00 | % | 3.09 | % | 3.06 | % | 3.13 | % | ||||||||||||||||||
Efficiency ratio1 | 50.60 | % | 55.32 | % | 52.29 | % | 55.82 | % | ||||||||||||||||||
| Balance sheet (end of period) | ||||||||||||||||||||||||||
| Investments | $ | 1,121,712 | $ | 926,444 | ||||||||||||||||||||||
| Loans and loans held for sale | 3,312,777 | 3,127,083 | ||||||||||||||||||||||||
| Allowance for loan losses | 36,414 | 25,688 | ||||||||||||||||||||||||
| Total assets | 5,153,793 | 4,520,315 | ||||||||||||||||||||||||
| Deposits | 4,224,044 | 3,617,963 | ||||||||||||||||||||||||
| Borrowings | 294,361 | 342,459 | ||||||||||||||||||||||||
| Shareholders' equity | 517,522 | 471,672 | ||||||||||||||||||||||||
| Book Value per Share and Capital Ratios | ||||||||||||||||||||||||||
| Book value per share | $ | 34.69 | $ | 30.98 | ||||||||||||||||||||||
Tangible book value per share1 | 28.14 | 24.52 | ||||||||||||||||||||||||
Tangible common equity ratio1 | 8.30 | % | 8.44 | % | ||||||||||||||||||||||
| Tier I leverage capital ratio | 8.96 | % | 9.39 | % | ||||||||||||||||||||||
| Common equity tier 1 risk-based capital ratio | 12.21 | % | 11.36 | % | ||||||||||||||||||||||
| Total risk-based capital ratio | 15.15 | % | 13.97 | % | ||||||||||||||||||||||
| Asset Quality | ||||||||||||||||||||||||||
| Allowance for loan losses to total loans | 1.11 | % | 0.83 | % | ||||||||||||||||||||||
| Net charge-offs to average loans (annualized) | 0.04 | % | 0.07 | % | ||||||||||||||||||||||
| Non-performing loans to total loans | 0.34 | % | 0.43 | % | ||||||||||||||||||||||
| Non-performing assets to total assets | 0.22 | % | 0.30 | % | ||||||||||||||||||||||
1 This is a non-GAAP measure. A reconciliation of non-GAAP to GAAP financial measures can be found in the Company's earnings release dated and filed with the SEC on October 27, 2020.