
CALX 8-K
Calix, Inc (CALX)
8-K
2021-01-27
For: 2021-01-26
View Original
Added on
April 10, 2026
UNITED STATES
SECURITIES AND EXCHANGE COMMISSION
WASHINGTON, D.C. 20549
FORM 8-K
CURRENT REPORT
Pursuant to Section 13 or 15(d) of the
Securities Exchange Act of 1934
Date of Report (Date of earliest event reported): January 26, 2021
(Exact name of Registrant as specified in its charter)
| (State or other jurisdiction of incorporation) | (Commission File No.) | (I.R.S. Employer Identification No.) | ||||||||||||
| (Address of principal executive offices) | (Zip Code) | |||||||||||||
( | ||
| (Registrant’s telephone number, including area code) | ||
| Not Applicable | ||
| (Former name or former address if changed since last report) | ||
Check the appropriate box below if the Form 8-K filing is intended to simultaneously satisfy the filing obligation of the registrant under any of the following provisions:
| Written communications pursuant to Rule 425 under the Securities Act (17 CFR 230.425) | |||||
| Soliciting material pursuant to Rule 14a-12 under the Exchange Act (17 CFR 240.14a-12) | |||||
| Pre-commencement communications pursuant to Rule 14d-2(b) under the Exchange Act (17 CFR 240.14d-2(b)) | |||||
| Pre-commencement communications pursuant to Rule 13e-4(c) under the Exchange Act (17 CFR 240.13e-4(c)) | |||||
Securities registered pursuant to Section 12(b) of the Act:
Title of Each Class | Trading Symbol | Name of Each Exchange on Which Registered | ||||||||||||
Indicate by check mark whether the registrant is an emerging growth company as defined in Rule 405 of the Securities Act of 1933 (§ 230.405 of this chapter) or Rule 12b-2 of the Securities Exchange Act of 1934 (§ 240.12b-2 of this chapter).
| Emerging Growth Company | |||||||||||
If an emerging growth company, indicate by check mark if the registrant has elected not to use the extended transition period for complying with any new or revised financial accounting standards provided pursuant to Section 13(a) of the Exchange Act). o
2
Item 2.02 Results of Operations and Financial Condition.
On January 27, 2021, the Company issued a press release announcing it has publicly disseminated a stockholder letter with its financial results for the fourth quarter ended December 31, 2020. The press release is attached hereto as Exhibit 99.1. The stockholder letter, a copy of which is attached hereto as Exhibit 99.2 and incorporated herein by reference, includes reference to the non-GAAP measures of non-GAAP gross margin, non-GAAP operating expenses, non-GAAP net income (loss), non-GAAP net income per diluted common share and non-GAAP free cash flow. These non-GAAP measures are provided to enhance the reader’s understanding of the Company’s operating performance as they primarily exclude restructuring charges, non-cash charges for stock-based compensation, component inventory accrual associated with our reduction and consolidation of legacy product lines, intangible asset amortization, U.S. tariff and tariff-related costs and loss on asset retirement, which the Company believes are not indicative of its core operating results. Management believes that the non-GAAP measures used in this stockholder letter provide investors with important perspectives into the Company’s ongoing business performance and management uses these non-GAAP measures to evaluate financial results and to establish operational goals. The presentation of these non-GAAP measures is not meant to be a substitute for results presented in accordance with U.S. GAAP, but rather should be evaluated in conjunction with those GAAP results. A reconciliation of the non-GAAP results to the most directly comparable U.S. GAAP results is contained in tabular form in Exhibit 99.2. The non-GAAP financial measures used by the Company may be calculated differently from, and therefore may not be comparable to, similarly titled measures used by other companies.
Such information shall not be deemed “filed” for purposes of Section 18 of the Securities Exchange Act of 1934, as amended, and is not incorporated by reference into any filing of the Company, whether made before or after the date hereof, regardless of any general incorporation language in such filing.
Item 5.02 Departure of Directors or Certain Officers; Election of Directors; Appointment of Certain Officers; Compensatory Arrangements of Certain Officers
(b), (c) Resignation and Appointment of Officers
On January 26, 2021, the Company promoted and appointed Michael Weening, age 52, to the position of President and Chief Operating Officer of the Company effective January 27, 2021. In connection with Mr. Weening’s appointment, Carl Russo, age 64, resigned his role as President effective January 27, 2021 and will continue to serve as Chief Executive Officer of the Company.
Mr. Weening joined Calix in June 2016 and previously served in executive roles as the Company’s Executive Vice President, Chief Operating Officer since August 2020; as Executive Vice President, Global Operations from January 2019 until August 2020; as Executive Vice President, Field Operations from July 2018 until January 2019; as Executive Vice President, Sales and Marketing from November 2016 until June 2018; and as Executive Vice President, Sales from June 2016 until November 2016. Prior to joining Calix, Mr. Weening served as Senior Vice President, Global Customer Success and Services, Commercial Business of salesforce.com, inc.
There is no arrangement or understanding between Mr. Weening and any other persons pursuant to which Mr. Weening was selected as an officer, and there are no related party transactions involving Mr. Weening that are reportable under Item 404(a) of Regulation S-K.
Item 7.01 Regulation FD Disclosure.
A copy of the Company’s press release, dated January 27, 2021, announcing the promotion and appointment of Mr. Weening is furnished as Exhibit 99.3 hereto and is incorporated by reference herein.
The information contained in Item 7.01 and the exhibit attached hereto, shall not be deemed “filed” for purposes of Section 18 of the Securities Exchange Act of 1934, as amended (the “Exchange Act”), or otherwise subject to the liabilities of that section, nor shall it be deemed incorporated by reference in any filing under the Securities Act of 1933, as amended or the Exchange Act, except as shall be expressly set forth by specific reference in such a filing.
3
Item 9.01 Financial Statements and Exhibits.
(d) Exhibits
| Exhibit No. | Description | |||||||
| 99.1 | ||||||||
| 99.2 | ||||||||
| 99.3 | ||||||||
4
SIGNATURES
Pursuant to the requirements of the Securities Exchange Act of 1934, the Registrant has duly caused this report to be signed on its behalf by the undersigned hereunto duly authorized.
| Date: | January 27, 2021 | CALIX, INC. | ||||||||||||||||||||||||
| By: | /s/ Cory Sindelar | |||||||||||||||||||||||||
| Cory Sindelar | ||||||||||||||||||||||||||
| Chief Financial Officer | ||||||||||||||||||||||||||
5
EXHIBIT INDEX
| Exhibit No. | Description | |||||||
| 99.1 | ||||||||
| 99.2 | ||||||||
| 99.3 | ||||||||
6
Calix Press Release | Page 1 | |||||||
Exhibit 99.1

Calix Releases Fourth Quarter 2020 Financial Results
SAN JOSE, CA – January 27, 2021 – Calix, Inc. (NYSE: CALX) today announced unaudited financial results for its fourth quarter 2020 have been posted as a letter to stockholders to the investor relations section of its website. Please visit the Calix investor relations website at https://investor-relations.calix.com to view the fourth quarter 2020 financial results in our letter to stockholders, along with accompanying supplemental financial information.
A conference call to discuss these results with CEO, Carl Russo, CFO, Cory Sindelar, President and COO, Michael Weening and Director of Investor Relations, Tom Dinges, will be held tomorrow, January 28, 2021 at 5:30 a.m. Pacific Time (8:30 a.m. Eastern Time).
Interested parties can listen to a live webcast of the conference call by visiting the Calix Investor Relations website at http://investor-relations.calix.com/. The conference call is also available via teleconference by dialing (877) 407-4019 or international (201) 689-8337 with conference ID# 13713752 or participants can also click this link for instant telephone access to the event. The link will become active approximately 15 minutes prior to the start of the conference call. The conference call and webcast will include forward-looking information.
A replay of the conference call will also be available at http://investor-relations.calix.com/ following the completion of the call. The call will be archived at http://investor-relations.calix.com/.
About Calix
Calix, Inc. (NYSE: CALX) – Calix cloud and software platforms enable service providers of all types and sizes to innovate and transform. Our customers utilize the real-time data and insights from Calix platforms to simplify their businesses and deliver experiences that excite their subscribers. The resulting growth in subscriber acquisition, loyalty and revenue creates more value for their businesses and communities. This is the Calix mission; to enable communications service providers of all sizes to simplify, excite and grow.
Investor Inquiries:
Thomas J. Dinges, CFA
Investor Relations Director
408-474-0080
Exhibit 99.2

January 27, 2021
Fellow Calix stockholders:
The profound changes we have all experienced in 2020 remained in full effect in the fourth quarter. The coronavirus pandemic continues to rage and evolve around the globe. While we are encouraged by the new administration’s focus on ending the pandemic, even the best plan with the best execution will take time to show results. We believe it is time for all of us to come together, fight this pandemic and heal our economy. Until we do so, significant uncertainty will remain.
As we have discussed, the two secular disruptions moving through the communications industry have been accelerated by the pandemic. In 2020 we saw a realignment of work, education and entertainment, and we expect these trends will continue. Furthermore, we expect a significant portion of these new behaviors will remain, albeit in a hybrid form, after the pandemic has abated. This simply means for Calix, the future is sooner!
As a company, we remain focused on the health and welfare of our employees and their families. We are doing all we can to support them as they work through these challenging times. In our view, only by remaining healthy and strong can we continue to serve the needs of our customers. We believe focusing on our culture yields results, and in the fourth quarter we actually received awards for our diversity, culture and leadership. While Carl Russo will continue as our CEO, today we announced that Michael Weening has been promoted to President and Chief Operating Officer. Since joining four years ago, Michael has played a significant role in transforming Calix into the All Platform leader. It is clear our team is core and central to achieving our mission, and we are committed to strengthening it each and every day.
With service providers of all types responding to the increased demand for their services, the value of our All Platform offerings continue to resonate, and demand for our Revenue Edge and Intelligent Access Edge solutions continues to grow. In the fourth quarter of 2020, we set new records for many metrics beginning with record quarterly revenue driven by strong demand and overperformance by our supply chain team. This record revenue performance was driven by the diversity of our products, services and customers as we saw growth across customers of all sizes. For the first time in our history, no customer accounted for greater than 10% of revenue in the quarter, a fact that makes clear the difference between our old company and our new All Platform one. As our All Platform offerings continued their growth, we delivered record corporate gross margins. We maintained our disciplined operating expense investments as operating expenses increased at less than half the rate of our revenue growth compared to the year ago quarter. The combination of higher revenue, increased gross margin and disciplined operating expense investments led to record GAAP and non-GAAP net income per diluted common share and operating cash flow. We enter 2021 in the strongest financial position in our history and believe we are perfectly placed to execute on the opportunity ahead.
1
Our relentless focus on the transformation of Calix into a communications cloud and software platform business yielded further progress in the fourth quarter of 2020. As we stated in our prior letters to stockholders, we continue to believe this transformation will manifest in improved financial performance across four measurable metrics over the long term:
•Deliberate revenue growth
•Gross margin expansion
•Disciplined operating expense investment
•Increased predictability
Examples of our progress made in the quarter were:
•Added 30 new service provider customers in the quarter from all segments of the market.
•Calix Cloud customer count increased more than 90% compared to the year ago quarter driven by new as well as existing customers embracing the value of real-time behavioral analytics and insights to simplify and grow their business.
•Record quarter for the EXOS platform with total license and systems revenue up more than 400% compared to the year ago quarter as we added new customers and existing customers accelerated deployments of the Revenue EDGE solution.
•AXOS platform and systems revenue increased more than 150% compared to the year ago quarter driven by both new and existing customers adopting the platform.
•We announced Calix Operations Cloud, the next major product offering in the Calix Cloud product line, enabling network operators to simplify workflows while applying analytics and automation from the access network edge to the subscriber premises.
Our near-term focus is on serving the needs of our service provider customers, while our long-term focus remains on finding like-minded customers regardless of their type, size or location. Furthermore, we remain committed to aligning our investments to our mission, vision and strategy, and maintaining strong discipline over our operating expenses. Over the long term, we believe this focus will drive improvement in our financial performance.
2
Fourth Quarter 2020 Financial Results
| Actual GAAP | Actual Non-GAAP | Guidance Non-GAAP | |||||||||
| Revenue | $170.0M | $170.0M | $157.0M – $161.0M | ||||||||
| Gross margin | 52.4% | 53.2%(1) | 49.0% – 51.0%(1) | ||||||||
| Operating expenses | $64.2M | $60.4M(1) | $56.5M – $58.5M(1) | ||||||||
| Net income per diluted common share | $0.37 | $0.45(1) | $0.30 – $0.34(1) | ||||||||
Free cash flow(2) | $28.3M | Positive | |||||||||
(1)Non-GAAP excludes items such as stock-based compensation, U.S. tariff and tariff-related costs and intangible asset amortization. See GAAP to non-GAAP reconciliations beginning on page 15.
(2)Free cash flow defined as operating cash flow minus purchases of property and equipment.
Results for the fourth quarter of 2020 broke a number of quarterly records and were well above our financial guidance. Overall demand was robust, and our supply chain outperformed despite the continued challenging global environment for component sourcing and supply chain logistics. Total revenue was above the high end of our guidance range, increasing 41% compared to the year-ago quarter. This strong performance was driven by demand for our platforms, the continued ramp of new offerings along with an increase in our legacy product purchases. Revenue growth was again led by our small customers. Non-GAAP gross margin was above the high-end of our guidance owing to favorable product and customer mix. Meanwhile, our non-GAAP operating expenses undergrew revenue, but were above the high-end of our guidance due to incentive compensation program achievement and incremental investments in sales and marketing. All of this resulted in record quarterly earnings on both a GAAP and non-GAAP basis. Finally, our continuing focus on balance sheet discipline combined with record net income resulted in positive free cash flow.
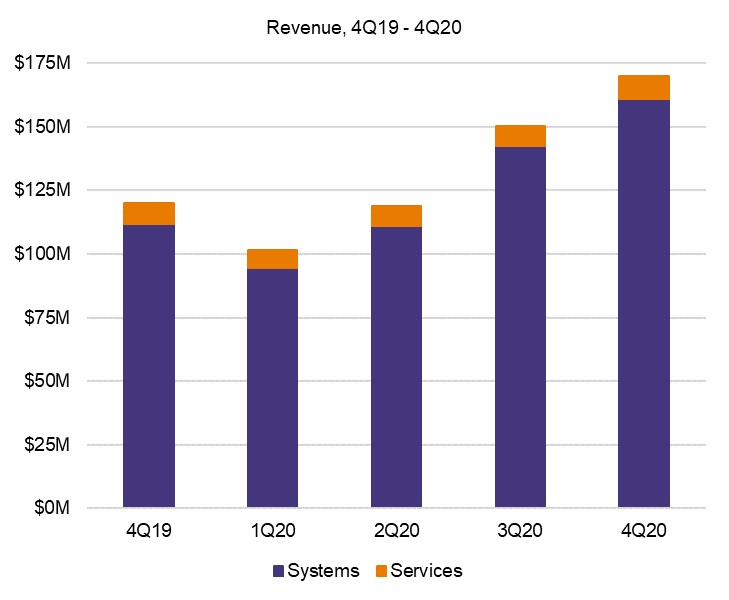
Systems revenue for the fourth quarter of 2020 increased 44% compared to the year-ago quarter on strong demand for our Calix Cloud, EXOS and AXOS platforms along with near-term demand for our legacy systems as service providers respond to increased demand on their networks. Compared to the prior quarter, systems revenue increased 13%, which was well above normal seasonality as service providers continue to accelerate some deployments to relieve network capacity constraints. Services revenue increased 11% compared to the year ago quarter as the continued ramp in our next generation service offerings more than offset lower professional services related to CAF deployments. Compared to the prior quarter, services revenue increased 11% due to increased project management work. We continue to align our services business with our All Platform model through the introduction of higher differentiated-value services.
3
Domestic revenue was 85% of total revenue in the fourth quarter and increased 41% compared to the year ago quarter due to strong demand for our platforms and increased shipments of legacy systems. International revenue was 15% of total revenue in the fourth quarter and increased 43% compared to the year ago quarter due to customer program ramps in several geographies.
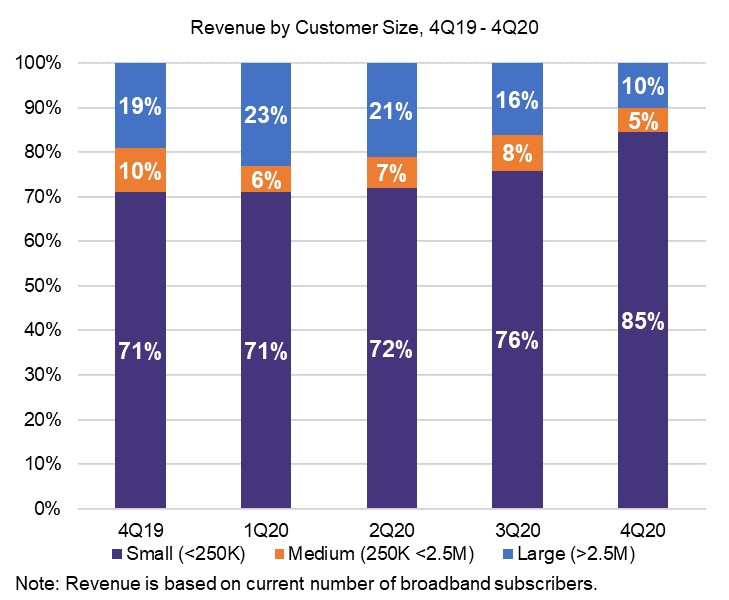
Revenue from large customers was 10% of total revenue in the fourth quarter of 2020 and down from 19%, or a decrease of 27%, compared to the year ago quarter primarily due to lower shipments to Lumen Technologies. Revenue from medium-sized customers was 5% of total revenue in the fourth quarter of 2020 and down from 10%, or a decrease of 18%, compared to the year ago quarter, reflecting decreased demand among a subset of customers. Revenue from small customers was 85% of total revenue in the fourth quarter of 2020 and up from 71%, or an increase of 68%, as compared to the year ago quarter due to strength in demand for Calix Cloud, EXOS and AXOS platforms along with increased demand for our legacy systems. No single customer was greater than 10% of revenue in the quarter. We will continue to focus on finding strategically aligned customers of all types and sizes for our All Platform business.
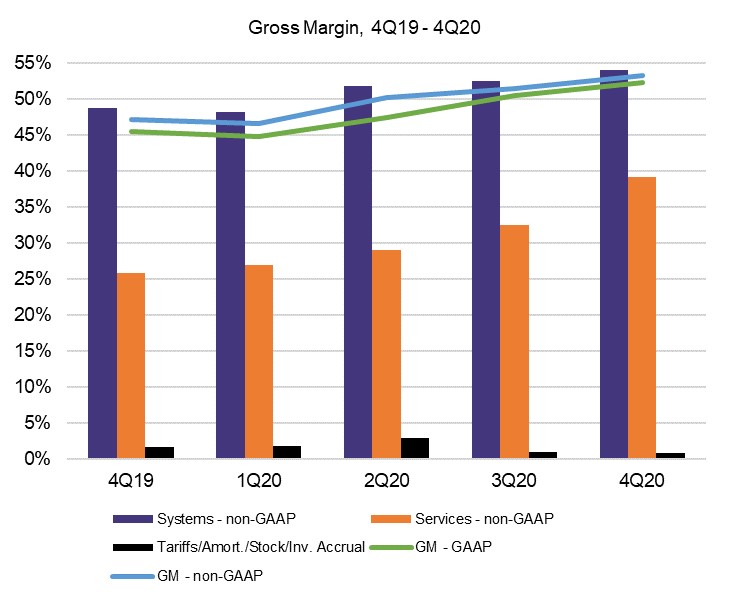
Driven by favorable product and customer mix, both GAAP and non-GAAP gross margin set quarterly records. Specifically, GAAP gross margin increased 690 basis points year over year, and non-GAAP gross margin increased 600 basis points year over year. On a GAAP basis, systems gross margin increased 610 basis points compared to the year ago quarter due to favorable product and customer mix along with lower U.S. tariff and tariff-related costs. In the fourth quarter of 2020, U.S. tariff and tariff-related costs and intangible asset amortization costs were 73 basis points of systems gross margin compared to 160 basis points in the year ago quarter. On a non-GAAP basis, systems gross margin of 54.0% reached a quarterly record and reflects increases of approximately 530 basis points year-over-year and 140 basis points sequentially. The principal drivers of both the year-over-year and sequential increase in non-GAAP systems gross margin were continued growth in our All Platform
4
offerings along with favorable product and customer mix. Services gross margin on a GAAP and non-GAAP basis increased 13 percentage points compared to the year ago quarter primarily due to improved mix towards our higher gross margin support services versus lower gross margin deployment services along with higher revenue. Sequentially, services gross margin on a GAAP and non-GAAP basis increased by more than 6 percentage points again due to a higher mix of support services as compared to deployment services along with higher revenue.
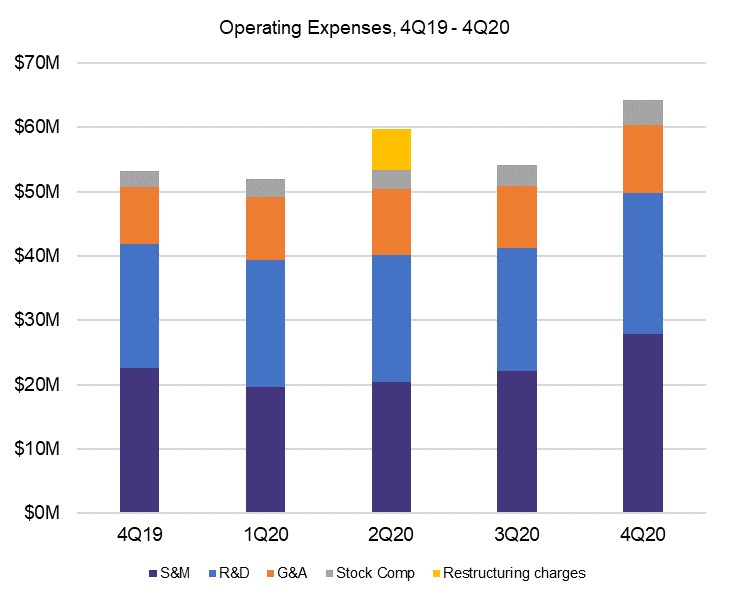
Operating expenses increased 21% compared to the year-ago quarter primarily due to higher incentive compensation on strong revenue growth and profitability and investments in sales and marketing partially offset by short-term savings from lower travel expenses. Compared to the prior quarter, operating expenses increased 18% due to higher incentive compensation as well as investments in sales and marketing. While we expect to maintain our operating expense leverage, we intend to align our investments with our target financial model in 2021 to capitalize on the opportunity ahead of us.
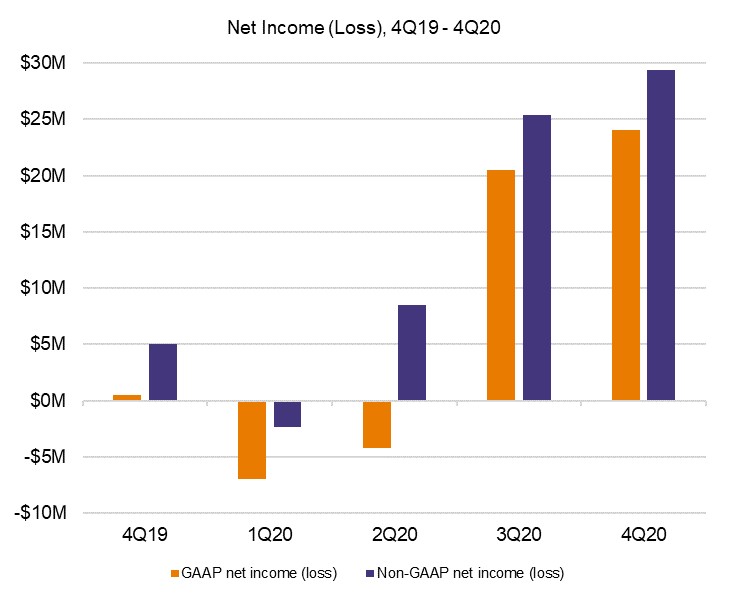
We reported a record quarterly net profit on both a GAAP and a non-GAAP basis in the fourth quarter of 2020. On a GAAP basis, our net income increased $23.6 million year-over-year from $0.5 million to $24.1 million. Our GAAP net income for the fourth quarter of 2020 included stock-based compensation of $4.2 million, intangible asset amortization of $0.7 million and U.S. tariff and tariff-related costs of $0.5 million. With the increased revenue and higher gross margin compared with the year ago quarter, our non-GAAP net income for the fourth quarter of 2020 increased $24.4 million from $5.0 million to $29.4 million.
5
Balance Sheet and Cash Flow
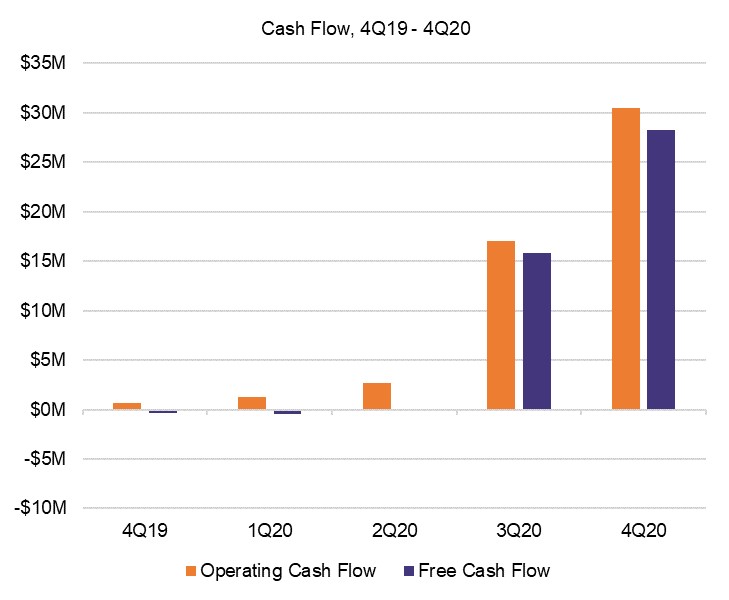
We ended 2020 with cash, cash equivalents and marketable securities of $133.8 million, a sequential increase of $30.0 million. The sequential increase was primarily the result of positive operating cash flow of $30.5 million. We generated positive operating cash flow for the sixth consecutive quarter and again generated positive free cash flow this quarter. Operating and free cash flow increased sequentially due to higher net income and improved account receivable collections partially offset by higher inventory levels compared to the prior quarter. We invested just under $11.0 million sequentially in additional inventory in the fourth quarter of 2020 to improve our responsiveness to customer needs and reduce supply chain risks, and we expect to further increase our inventory investment in the first quarter of 2021. Our goal is for inventory turns to be between 3 and 4. Compared to last year, our cash, cash equivalents and marketable securities increased $86.3 million primarily due to proceeds from our follow-on equity offering of $60.1 million, positive operating cash flow of $51.4 million and proceeds from equity-based employee benefit plans of $18.1 million partially offset by repayments of borrowings under our line of credit of $30.0 million, capital expenditures of $7.8 million and payments under financing arrangements of $5.8 million. As of the end of 2020, our $35 million line of credit remains undrawn and fully available to us, thereby increasing our liquidity to support our growth if needed.
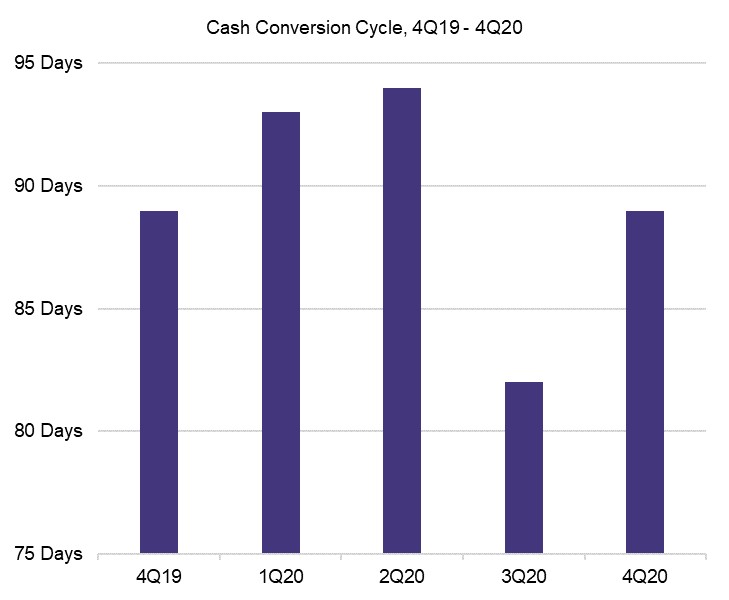
Our team remains focused on operational excellence and customer satisfaction. During the fourth quarter of 2020, our supply chain team performed well to meet customer needs despite continued component supply and logistic challenges caused by the coronavirus pandemic as we continue to qualify new suppliers, incur expediting costs and adjust to extended component delivery lead times. Our days sales outstanding (DSO) at quarter end improved to 39 days, down 3 days from the prior quarter and up 3 days from the prior year. Inventory turns were 5.8 at quarter end, compared to 6.6 turns in the prior quarter and 4.7
6
turns in the year ago quarter. The sequential decrease in inventory turns in the quarter were the result of a higher level of inventory. Days payable outstanding at quarter end was 13 days, down 2 days from the prior quarter and down 12 days from the year ago quarter. Our cash conversion cycle increased to 89 days compared to 82 days in the prior quarter as we saw improvement in DSO and days payable outstanding was more than offset by the decrease in inventory turns. Compared to the year ago quarter, our cash conversion cycle was flat at 89 days.
We continue to believe our existing cash and investments, expected positive free cash flow and the full availability of our line of credit will provide us with sufficient liquidity for our business operations while navigating the uncertainty created by the coronavirus pandemic.
7
First Quarter 2021 Guidance
Guidance Non-GAAP | Guidance Reconciled to GAAP | |||||||
| Revenue | $146M – $152M | $146M – $152M | ||||||
| Gross margin | 48.5% – 50.5%(1) | 47.8% – 49.8% | ||||||
| Operating expenses | $60.0M – $63.0M(1) | $63.8M – $66.8M | ||||||
Net income per diluted common share(2) | $0.16 – $0.20(1) | $0.09 – $0.13 | ||||||
Free cash flow(3) | Positive | |||||||
(1)Non-GAAP excludes items such as stock-based compensation and intangible asset amortization. See GAAP to non-GAAP reconciliation on page 16.
(2)Based on 66.8 million weighted-average diluted common shares outstanding.
(3)Free cash flow defined as operating cash flow minus purchases of property and equipment.
Our guidance for the first quarter of 2021 reflects our expectations as of the date of this letter. These expectations reflect the normal seasonality in our business as well as our current estimate of the global impacts from the coronavirus pandemic on our business and assessment of supply chain and logistical challenges.
Our revenue guidance for the first quarter of 2021 is for an increase of between 44% and 49% compared to the year ago quarter reflecting another strong quarter of shipments of our All Platform offerings along with higher shipments of our legacy products. First quarter 2021 revenue is also positively impacted by systems shipments shifted from the fourth quarter of 2020 due to logistical challenges and component supply limitations.
Our non-GAAP gross margin guidance for the first quarter of 2021 represents an increase of 180 to 380 basis points relative to the year ago quarter and reflects the positive benefit from the continued growth of our All Platform offerings. Compared to the prior quarter, gross margin is unfavorably impacted by customer, product and regional mix along with higher costs due to component supply limitations and logistical challenges.
Our non-GAAP operating expense guidance for the first quarter of 2021 reflects alignment with our Target Financial Model as we remain focused on operating expense investment discipline. Our guidance reflects investments in sales and marketing at the high end of our target 16 to18% of revenue range due to hiring and increased incentive compensation, research and development investments at 30% of product gross profit, and general and administrative investments at 9% of revenue.
Finally, we expect positive free cash flow next quarter reflecting expected GAAP profitability and continued focus on working capital velocity.
8
Summary
We will all remember 2020 and sadly, because of the pandemic mostly, not in a good way. For Calix it marked the end of an era and the beginning of a new one. Our journey has required imagination and steadfast pursuit all the while balancing the forces of old and new. We have now arrived.
Today, Calix cloud and software platforms enable service providers of all types and sizes to innovate and transform. Our CSP customers utilize real-time data and insights to simplify their businesses and deliver experiences that excite their subscribers. The resulting growth in subscriber acquisition, loyalty and revenue creates more value for their businesses and communities. We are resolute in our belief that if we help our customers build more valuable businesses, they will in turn enable us to increase the value of ours.
Our mission is clear, help our customers simplify, excite and grow … and we are just getting started.
We have the right platforms, solutions and services to achieve our mission. We have a solid financial foundation on which to build. We have a fantastic set of customers to expand. And, most importantly, an incredibly talented team solely focused on executing on our vision.
We sincerely thank our employees, customers and stockholders for their continued support as we pursue our future.
Sincerely,
 Carl Russo President & CEO |  Cory Sindelar CFO | ||||
9
Conference Call
In conjunction with this announcement, Calix will host a conference call tomorrow, January 28, 2021, at 5:30 a.m. Pacific Time (8:30 a.m. Eastern Time) to answer questions regarding our fourth quarter 2020 financial results. A live audio webcast and replay of the call will be available in the Investor Relations section of the Calix website at http://investor-relations.calix.com.
Live call access information: Dial-in number: (877) 407-4019 (U.S.) or (201) 689-8337 (outside the U.S.)
The conference call and webcast will include forward-looking information.
Investor Inquiries
Thomas J. Dinges, CFA
Director of Investor Relations
408-474-0080
About Calix
Calix cloud and software platforms enable service providers of all types and sizes to innovate and transform. Our customers utilize the real-time data and insights from Calix platforms to simplify their businesses and deliver experiences that excite their subscribers. The resulting growth in subscriber acquisition, loyalty and revenue creates more value for their businesses and communities. This is the Calix mission; to enable communications service providers of all sizes to simplify, excite and grow.
Forward-Looking Statements
Statements made in this stockholder letter and the earnings call referencing the stockholder letter that are not statements of historical fact are forward-looking statements. Forward-looking statements are subject to the “safe harbor” provisions of the Private Securities Litigation Reform Act of 1995. Forward-looking statements relate to, but are not limited to, statements about the impact of the coronavirus pandemic, potential customer or market opportunities, growth and pipeline opportunities, statements about anticipated customer purchase trends, expected customer and product mix or anticipated adoption of our platforms, systems or services offerings, industry, market and customer trends, opportunities with existing and prospective customers, the ongoing management of our global supply chain and logistics, free cash flow and liquidity and future financial performance (including the outlook for the first quarter of 2021). Forward-looking statements are subject to risks and uncertainties that could cause actual results to differ materially from expectations, including but not limited to fluctuations in our financial and operating results, the capital spending decisions of our customers, changes and disruptions in the market and industry, availability of capital in the market, changes in and impacts of regulations and/or government sponsored programs, competition, our ability to achieve market acceptance of our platforms, systems and solutions, our ability to grow our customer base, fluctuations in costs associated with our systems and services including higher costs due to project delays and changes, third-party dependencies for production and resource management associated with our global supply chain that may cause delays in production and unavailability of systems to meet customer orders, which may be substantial, cost overruns, disruptions in global trade and relations, sustained or additional economic disruptions due to the COVID-19 pandemic, social unrest and political uncertainties and other unanticipated factors, as well as the risks and uncertainties described in our annual reports on Form 10-K and our quarterly reports on Form 10-Q, each as filed with the SEC and available at www.sec.gov, particularly in the sections titled “Risk Factors.” Forward-looking statements speak only as of the date the statements are made and are based on information available to us at the time those statements are made and/or management’s good faith belief as of that time with respect to future events. Calix assumes no obligation to update forward-looking statements to reflect actual performance or results, changes in assumptions or changes in other factors affecting forward-looking information, except to the extent required by applicable securities laws. Accordingly, investors should not place undue reliance on any forward-looking statements.
Use of Non-GAAP Financial Information
The Company uses certain non-GAAP financial measures in this stockholder letter to supplement its consolidated financial statements, which are presented in accordance with U.S. GAAP. These non-GAAP measures include non-GAAP gross margin, non-GAAP operating expenses, non-GAAP net income (loss), non-GAAP net income per diluted common share and non-GAAP free cash flow. These non-GAAP measures are provided to enhance the reader’s understanding of the Company’s operating performance as they primarily exclude restructuring charges, non-cash charges for stock-based compensation, component inventory accrual associated with our reduction and consolidation of legacy product lines, intangible asset amortization, U.S. tariff and tariff-related costs and loss on asset retirement, which the Company believes are not indicative of its core operating results. Management believes that the non-GAAP measures used in this stockholder letter provide investors
10
with important perspectives into the Company’s ongoing business performance and management uses these non-GAAP measures to evaluate financial results and to establish operational goals. The presentation of these non-GAAP measures is not meant to be a substitute for results presented in accordance with GAAP, but rather should be evaluated in conjunction with those GAAP results. A reconciliation of the non-GAAP results to the most directly comparable GAAP results is provided in this stockholder letter. The non-GAAP financial measures used by the Company may be calculated differently from, and therefore may not be comparable to, similarly titled measures used by other companies.
11
| Calix, Inc. | ||||||||||||||||||||||||||||||||
| Condensed Consolidated Statements of Operations | ||||||||||||||||||||||||||||||||
| (Unaudited, in thousands, except per share data) | ||||||||||||||||||||||||||||||||
| Three Months Ended December 31, | Year Ended December 31, | |||||||||||||||||||||||||||||||
| 2020 | 2019 | 2020 | 2019 | |||||||||||||||||||||||||||||
| Revenue: | ||||||||||||||||||||||||||||||||
| Systems | $ | 160,908 | $ | 111,978 | $ | 508,552 | $ | 393,231 | ||||||||||||||||||||||||
| Services | 9,118 | 8,213 | 32,687 | 31,099 | ||||||||||||||||||||||||||||
| Total revenue | 170,026 | 120,191 | 541,239 | 424,330 | ||||||||||||||||||||||||||||
| Cost of revenue: | ||||||||||||||||||||||||||||||||
| Systems | 75,320 | 59,289 | 251,638 | 211,309 | ||||||||||||||||||||||||||||
| Services | 5,691 | 6,190 | 22,582 | 25,096 | ||||||||||||||||||||||||||||
| Total cost of revenue | 81,011 | 65,479 | 274,220 | 236,405 | ||||||||||||||||||||||||||||
| Gross profit | 89,015 | 54,712 | 267,019 | 187,925 | ||||||||||||||||||||||||||||
| Operating expenses: | ||||||||||||||||||||||||||||||||
| Sales and marketing | 29,139 | 23,357 | 94,185 | 82,553 | ||||||||||||||||||||||||||||
| Research and development | 23,288 | 20,264 | 85,258 | 81,184 | ||||||||||||||||||||||||||||
| General and administrative | 11,814 | 9,597 | 44,444 | 37,115 | ||||||||||||||||||||||||||||
| Restructuring charges | — | — | 6,286 | — | ||||||||||||||||||||||||||||
| Loss on asset retirement | — | — | — | 2,474 | ||||||||||||||||||||||||||||
| Total operating expenses | 64,241 | 53,218 | 230,173 | 203,326 | ||||||||||||||||||||||||||||
| Income (loss) from operations | 24,774 | 1,494 | 36,846 | (15,401) | ||||||||||||||||||||||||||||
| Interest and other expense, net: | ||||||||||||||||||||||||||||||||
| Interest expense, net | (322) | (437) | (1,585) | (958) | ||||||||||||||||||||||||||||
| Other expense, net | (176) | (258) | (977) | (173) | ||||||||||||||||||||||||||||
| Total interest and other expense, net | (498) | (695) | (2,562) | (1,131) | ||||||||||||||||||||||||||||
| Income (loss) before provision for income taxes | 24,276 | 799 | 34,284 | (16,532) | ||||||||||||||||||||||||||||
| Provision for income taxes | 174 | 302 | 800 | 1,162 | ||||||||||||||||||||||||||||
| Net income (loss) | $ | 24,102 | $ | 497 | $ | 33,484 | $ | (17,694) | ||||||||||||||||||||||||
| Net income (loss) per common share: | ||||||||||||||||||||||||||||||||
| Basic | $ | 0.39 | $ | 0.01 | $ | 0.57 | $ | (0.32) | ||||||||||||||||||||||||
| Diluted | $ | 0.37 | $ | 0.01 | $ | 0.54 | $ | (0.32) | ||||||||||||||||||||||||
| Weighted average number of shares used to compute net income (loss) per common share: | ||||||||||||||||||||||||||||||||
| Basic | 61,945 | 55,787 | 59,074 | 54,993 | ||||||||||||||||||||||||||||
| Diluted | 65,825 | 56,257 | 61,998 | 54,993 | ||||||||||||||||||||||||||||
12
| Calix, Inc. | ||||||||||||||
| Condensed Consolidated Balance Sheets | ||||||||||||||
| (Unaudited, in thousands) | ||||||||||||||
| December 31, | ||||||||||||||
| 2020 | 2019 | |||||||||||||
| ASSETS | ||||||||||||||
| Current assets: | ||||||||||||||
| Cash and cash equivalents | $ | 80,807 | $ | 46,829 | ||||||||||
| Restricted cash | — | 628 | ||||||||||||
| Marketable securities | 52,982 | — | ||||||||||||
| Accounts receivable, net | 69,419 | 46,509 | ||||||||||||
| Inventory | 52,268 | 40,153 | ||||||||||||
| Prepaid expenses and other current assets | 11,414 | 9,698 | ||||||||||||
| Total current assets | 266,890 | 143,817 | ||||||||||||
| Property and equipment, net | 20,381 | 21,527 | ||||||||||||
| Right-of-use operating leases | 11,741 | 15,864 | ||||||||||||
| Goodwill | 116,175 | 116,175 | ||||||||||||
| Other assets | 12,165 | 19,440 | ||||||||||||
| $ | 427,352 | $ | 316,823 | |||||||||||
LIABILITIES AND STOCKHOLDERS’ EQUITY | ||||||||||||||
| Current liabilities: | ||||||||||||||
| Accounts payable | $ | 13,115 | $ | 10,789 | ||||||||||
| Accrued liabilities | 68,736 | 57,546 | ||||||||||||
| Deferred revenue | 19,189 | 17,158 | ||||||||||||
| Line of credit | — | 30,000 | ||||||||||||
| Total current liabilities | 101,040 | 115,493 | ||||||||||||
| Long-term portion of deferred revenue | 19,904 | 18,340 | ||||||||||||
| Operating leases | 12,946 | 14,337 | ||||||||||||
| Other long-term liabilities | 13,137 | 14,625 | ||||||||||||
| Total liabilities | 147,027 | 162,795 | ||||||||||||
| Stockholders’ equity: | ||||||||||||||
| Common stock | 1,553 | 1,545 | ||||||||||||
| Additional paid-in capital | 948,055 | 895,899 | ||||||||||||
| Accumulated other comprehensive loss | (191) | (854) | ||||||||||||
| Accumulated deficit | (669,092) | (702,576) | ||||||||||||
| Treasury stock | — | (39,986) | ||||||||||||
| Total stockholders’ equity | 280,325 | 154,028 | ||||||||||||
| $ | 427,352 | $ | 316,823 | |||||||||||
13
| Calix, Inc. | ||||||||||||||
| Condensed Consolidated Statements of Cash Flows | ||||||||||||||
| (Unaudited, in thousands) | ||||||||||||||
| Year Ended December 31, | ||||||||||||||
| 2020 | 2019 | |||||||||||||
| Operating activities: | ||||||||||||||
| Net income (loss) | $ | 33,484 | $ | (17,694) | ||||||||||
| Adjustments to reconcile net income (loss) to net cash provided by operating activities: | ||||||||||||||
| Stock-based compensation | 13,960 | 11,181 | ||||||||||||
| Depreciation and amortization | 13,718 | 10,316 | ||||||||||||
| Asset retirements and write-downs | 3,914 | 2,636 | ||||||||||||
| Changes in operating assets and liabilities: | ||||||||||||||
| Accounts receivable, net | (22,910) | 20,517 | ||||||||||||
| Inventory | (12,116) | 9,998 | ||||||||||||
| Prepaid expenses and other assets | 773 | (63) | ||||||||||||
| Accounts payable | 2,190 | (29,440) | ||||||||||||
| Accrued liabilities | 11,922 | (1,836) | ||||||||||||
| Deferred revenue | 3,596 | 2,401 | ||||||||||||
| Other long-term liabilities | 2,878 | (3,362) | ||||||||||||
| Net cash provided by operating activities | 51,409 | 4,654 | ||||||||||||
Investing activities: | ||||||||||||||
| Purchases of property and equipment | (7,819) | (13,353) | ||||||||||||
| Purchases of marketable securities | (72,982) | — | ||||||||||||
| Maturities of marketable securities | 20,000 | — | ||||||||||||
| Net cash used in investing activities | (60,801) | (13,353) | ||||||||||||
| Financing activities: | ||||||||||||||
| Proceeds from exercise of stock options | 8,984 | 442 | ||||||||||||
| Proceeds from employee stock purchase plans | 9,143 | 8,433 | ||||||||||||
| Taxes paid for awards vested under equity incentive plan | — | (167) | ||||||||||||
| Proceeds from the sale of common stock in connection with public offering, net of expenses | 60,063 | — | ||||||||||||
| Payments related to financing arrangements | (5,758) | (2,737) | ||||||||||||
| Proceeds from line of credit | 30,000 | 143,300 | ||||||||||||
| Repayments of line of credit | (60,000) | (143,300) | ||||||||||||
| Payments to originate the line of credit | (285) | — | ||||||||||||
| Net cash provided by financing activities | 42,147 | 5,971 | ||||||||||||
| Effect of exchange rate changes on cash and cash equivalents | 595 | (89) | ||||||||||||
| Net increase (decrease) in cash, cash equivalents and restricted cash | 33,350 | (2,817) | ||||||||||||
| Cash, cash equivalents and restricted cash at beginning of year | 47,457 | 50,274 | ||||||||||||
| Cash and cash equivalents at end of year | $ | 80,807 | $ | 47,457 | ||||||||||
14
| Calix, Inc. | ||||||||||||||||||||||||||||||||||||||||||||||||||||||||||||||
| Reconciliation of GAAP to Non-GAAP Systems Gross Margin and Gross Margin | ||||||||||||||||||||||||||||||||||||||||||||||||||||||||||||||
| (Unaudited) | ||||||||||||||||||||||||||||||||||||||||||||||||||||||||||||||
| Three Months Ended | ||||||||||||||||||||||||||||||||||||||||||||||||||||||||||||||
| December 31, 2020 | September 26, 2020 | June 27, 2020 | March 28, 2020 | December 31, 2019 | ||||||||||||||||||||||||||||||||||||||||||||||||||||||||||
| Systems Gross Margin | Gross Margin | Systems Gross Margin | Gross Margin | Systems Gross Margin | Gross Margin | Systems Gross Margin | Gross Margin | Systems Gross Margin | Gross Margin | |||||||||||||||||||||||||||||||||||||||||||||||||||||
| GAAP amount | 53.2 | % | 52.4 | % | 51.6 | % | 50.5 | % | 48.8 | % | 47.4 | % | 46.3 | % | 44.9 | % | 47.1 | % | 45.5 | % | ||||||||||||||||||||||||||||||||||||||||||
| Adjustments to GAAP amount: | ||||||||||||||||||||||||||||||||||||||||||||||||||||||||||||||
| Stock-based compensation | 0.1 | 0.2 | 0.1 | 0.2 | 0.1 | 0.1 | 0.2 | 0.2 | 0.1 | 0.2 | ||||||||||||||||||||||||||||||||||||||||||||||||||||
| Intangible asset amortization | 0.4 | 0.3 | 0.5 | 0.4 | 0.6 | 0.6 | 0.7 | 0.6 | 0.5 | 0.5 | ||||||||||||||||||||||||||||||||||||||||||||||||||||
| U.S. tariff and tariff-related costs | 0.3 | 0.3 | 0.4 | 0.4 | 0.7 | 0.6 | 1.0 | 1.0 | 1.0 | 1.0 | ||||||||||||||||||||||||||||||||||||||||||||||||||||
| Component inventory accrual | — | — | — | — | 1.6 | 1.5 | — | — | — | — | ||||||||||||||||||||||||||||||||||||||||||||||||||||
| Non-GAAP amount | 54.0 | % | 53.2 | % | 52.6 | % | 51.5 | % | 51.8 | % | 50.2 | % | 48.2 | % | 46.7 | % | 48.7 | % | 47.2 | % | ||||||||||||||||||||||||||||||||||||||||||
| Calix, Inc. | ||||||||||||||||||||||||||||||||
| Reconciliation of GAAP to Non-GAAP Operating Expenses | ||||||||||||||||||||||||||||||||
| (Unaudited, in thousands) | ||||||||||||||||||||||||||||||||
| Three Months Ended | ||||||||||||||||||||||||||||||||
| December 31, | September 26, | June 27, | March 28, | December 31, | ||||||||||||||||||||||||||||
| 2020 | 2020 | 2020 | 2020 | 2019 | ||||||||||||||||||||||||||||
| GAAP operating expenses | $ | 64,241 | $ | 54,225 | $ | 59,743 | $ | 51,964 | $ | 53,218 | ||||||||||||||||||||||
| Adjustments to GAAP amount: | ||||||||||||||||||||||||||||||||
| Stock-based compensation | (3,835) | (3,312) | (3,025) | (2,762) | (2,502) | |||||||||||||||||||||||||||
| Restructuring charges | — | — | (6,286) | — | — | |||||||||||||||||||||||||||
| Non-GAAP operating expenses | $ | 60,406 | $ | 50,913 | $ | 50,432 | $ | 49,202 | $ | 50,716 | ||||||||||||||||||||||
| Calix, Inc. | ||||||||||||||||||||||||||||||||
| Non-GAAP Free Cash Flow Reconciliation | ||||||||||||||||||||||||||||||||
| (Unaudited, in thousands) | ||||||||||||||||||||||||||||||||
| Three Months Ended | ||||||||||||||||||||||||||||||||
| December 31, | September 26, | June 27, | March 28, | December 31, | ||||||||||||||||||||||||||||
| 2020 | 2020 | 2020 | 2020 | 2019 | ||||||||||||||||||||||||||||
| Net cash provided by operating activities | $ | 30,473 | $ | 17,000 | $ | 2,687 | $ | 1,249 | $ | 621 | ||||||||||||||||||||||
| Purchases of property and equipment | (2,202) | (1,138) | (2,750) | (1,729) | (970) | |||||||||||||||||||||||||||
| Non-GAAP free cash flow | $ | 28,271 | $ | 15,862 | $ | (63) | $ | (480) | $ | (349) | ||||||||||||||||||||||
15
| Calix, Inc. | |||||||||||||||||||||||||||||||||||
| Reconciliation of GAAP to Non-GAAP Net Income (Loss) | |||||||||||||||||||||||||||||||||||
| (Unaudited, in thousands) | |||||||||||||||||||||||||||||||||||
| Three Months Ended | |||||||||||||||||||||||||||||||||||
| December 31, | September 26, | June 27, | March 28, | December 31, | |||||||||||||||||||||||||||||||
| 2020 | 2020 | 2020 | 2020 | 2019 | |||||||||||||||||||||||||||||||
| GAAP net income (loss) | $ | 24,102 | $ | 20,538 | $ | (4,212) | $ | (6,944) | $ | 497 | |||||||||||||||||||||||||
| Adjustments to GAAP amount: | |||||||||||||||||||||||||||||||||||
| Stock-based compensation | 4,160 | 3,574 | 3,241 | 2,984 | 2,705 | ||||||||||||||||||||||||||||||
| Intangible asset amortization | 658 | 658 | 658 | 658 | 658 | ||||||||||||||||||||||||||||||
| U.S. tariff and tariff-related costs | 520 | 621 | 723 | 959 | 1,138 | ||||||||||||||||||||||||||||||
| Restructuring charges | — | — | 6,286 | — | — | ||||||||||||||||||||||||||||||
Component inventory accrual | — | — | 1,793 | — | — | ||||||||||||||||||||||||||||||
| Non-GAAP net income (loss) | $ | 29,440 | $ | 25,391 | $ | 8,489 | $ | (2,343) | $ | 4,998 | |||||||||||||||||||||||||
| Calix, Inc. | ||||||||
| Reconciliation of GAAP to Non-GAAP Net Income Per Diluted Common Share | ||||||||
| (Unaudited) | ||||||||
| Three Months Ended December 31, 2020 | ||||||||
| GAAP net income per diluted common share | $ | 0.37 | ||||||
| Adjustments to GAAP amount: | ||||||||
| Stock-based compensation | 0.06 | |||||||
| Intangible asset amortization | 0.01 | |||||||
| U.S. tariff and tariff-related costs | 0.01 | |||||||
Non-GAAP net income per diluted common share (1) | $ | 0.45 | ||||||
(1) Based on 65.8 million weighted-average diluted common shares outstanding.
| Calix, Inc. | ||||||||||||||||||||||||||
| Reconciliation of GAAP to Non-GAAP Guidance | ||||||||||||||||||||||||||
| (Unaudited, dollars in thousands, except per share data) | ||||||||||||||||||||||||||
| Three Months Ending April 3, 2021 | ||||||||||||||||||||||||||
| GAAP | Stock-Based Compensation | Intangible Asset Amortization | Non-GAAP | |||||||||||||||||||||||
| Gross margin | 47.8% - 49.8% | 0.2% | 0.5% | 48.5% - 50.5% | ||||||||||||||||||||||
| Operating expenses | $ 63,795 - $ 66,795 | $ (3,795) | $ - | $ 60,000 - $ 63,000 | ||||||||||||||||||||||
Net income per diluted common share(1) | $ 0.09 - $ 0.13 | $ 0.06 | $ 0.01 | $ 0.16 - $ 0.20 | ||||||||||||||||||||||
(1) Based on 66.8 million weighted-average diluted common shares outstanding.
16
Exhibit 99.3

Calix Announces Michael Weening as President and Chief Operating Officer
Strong team executing on strategically aligned growth
SAN JOSE, CA – January 27, 2021 – Calix, Inc. (NYSE: CALX) today announced Michael Weening’s promotion to President and COO. In his new role, Michael adds Intelligent Access EDGE solutions to his existing responsibilities and now has leadership responsibility for all operational aspects of Calix.
“Michael joined in 2016 and has been instrumental in our transformation to an All Platform company,” said Carl Russo, CEO of Calix. “As demonstrated by our results, Michael, partnering with Cory Sindelar, our CFO, and Suzanne Tom, our General Counsel, has formed a strong operating team. This promotion allows me, as CEO, to focus on our vision, strategy and culture.”
“It is a great privilege to lead the talented and award-winning Calix team on the mission of helping Communications Service Providers (CSPs) of all types and sizes simplify their businesses, excite their subscribers and grow their value,” said Michael Weening, President and COO of Calix. “For over a decade, we have invested in building our industry leading cloud and software platforms to make that mission a reality. I look forward to supporting the team as we accelerate CSP and partner success.”
Michael joined Calix from Salesforce where he was senior vice president of Global Customer Success and Services, Commercial Business, holding roles in Asia and North America. Previously, Michael held senior leadership roles at Bell Mobility and Microsoft in Europe and North America. Michael holds a BA from Brock University.
About Calix
Calix, Inc. (NYSE: CALX) – Calix cloud and software platforms enable service providers of all types and sizes to innovate and transform. Our customers utilize the real-time data and insights from Calix platforms to simplify their businesses and deliver experiences that excite their subscribers. The resulting growth in subscriber acquisition, loyalty and revenue creates more value for their businesses and communities. This is the Calix mission; to enable communications service providers of all sizes to simplify, excite and grow.
Calix Press Release Page 2
This press release may contain forward-looking statements that are based upon management's current expectations and are inherently uncertain. Forward-looking statements are based upon information available to us as of the date of this release, and we assume no obligation to revise or update any such forward-looking statement to reflect any event or circumstance after the date of this release, except as required by law. Actual results and the timing of events could differ materially from current expectations based on risks and uncertainties affecting Calix’s business. The reader is cautioned not to rely on the forward-looking statements contained in this press release. Additional information on potential factors that could affect Calix's results and other risks and uncertainties are detailed in its quarterly reports on Form 10-Q and Annual Report on Form 10-K filed with the SEC and available at www.sec.gov.
Press Inquiries:
Dale Legaspi
408-474-0056
Investor Inquiries:
Tom Dinges
408-474-0080