
CASH 8-K
Pathward Financial, Inc. (CASH)
8-K
2020-07-22
For: 2020-07-22
View Original
Added on
April 07, 2026
UNITED STATES
SECURITIES AND EXCHANGE COMMISSION
Washington, D.C. 20549
FORM 8-K
CURRENT REPORT
Pursuant to Section 13 OR 15(d) of the
Securities Exchange Act of 1934
Date of Report (Date of earliest event reported): July 22, 2020
(Exact name of registrant as specified in its charter)
| (State or other jurisdiction of incorporation) | (Commission File Number) | (IRS Employer Identification No.) | ||||||
(Address of principal executive offices) (Zip Code)
Registrant’s telephone number, including area code: (605 ) 782-1767
| Check the appropriate box below if the Form 8-K filing is intended to simultaneously satisfy the filing obligation of the registrant under any of the following provisions: | |||||
| Written communications pursuant to Rule 425 under the Securities Act (17 CFR 230.425) | |||||
| Soliciting material pursuant to Rule 14a-12 under the Exchange Act (17 CFR 240.14a-12) | |||||
| Pre-commencement communications pursuant to Rule 14d-2(b) under the Exchange Act (17 CFR 240.14d- 2(b)) | |||||
| Pre-commencement communications pursuant to Rule 13e-4(c) under the Exchange Act (17 CFR 240.13e-4 (c)) | |||||
Securities registered pursuant to Section 12(b) of the Act:
| Title of each class | Trading Symbol(s) | Name of each exchange on which registered | ||||||
Indicate by check mark whether the registrant is an emerging growth company as defined in Rule 405 of the Securities Act of 1933 (§230.405 of this chapter) or Rule 12b-2 of the Securities Exchange Act of 1934 (§240.12b-2 of this chapter).
Emerging growth company ☐
If an emerging growth company, indicate by check mark if the registrant has elected not to use the extended transition period for complying with any new or revised financial accounting standards provided pursuant to Section 13(a) of the Exchange Act. ☐
Item 2.02 Results of Operations and Financial Condition.
On July 22, 2020, the Registrant issued a press release announcing its results of operations and financial condition as of and for the three and nine months ended June 30, 2020. A copy of the press release is attached as Exhibit 99.1 to this report and is incorporated into this Item 2.02 by reference.
The information in this Item 2.02, including Exhibit 99.1, shall not be deemed to be “filed” for purposes of Section 18 of the Securities Exchange Act of 1934, as amended (the “Exchange Act”), or otherwise subject to the liabilities thereof, nor shall it be deemed to be incorporated by reference in any filing under the Exchange Act or under the Securities Act of 1933, as amended (the "Securities Act"), except to the extent specifically provided in any such filing.
Item 7.01 Regulation FD Disclosure.
Information is being furnished herein in Exhibit 99.2 with respect to the Investor Update slide presentation prepared for use with the press release. While most of the selected financial information furnished herein is derived from the Company’s consolidated financial statements and related notes prepared in accordance with generally accepted accounting principles ("GAAP") and management’s discussion and analysis of financial condition and results of operations included, or to be included, in the Company’s reports on Forms 10-K and 10-Q, this information includes selected financial and operational information through the third quarter of fiscal year 2020 and does not represent a complete set of financial statement and related notes prepared in conformity with GAAP. The Company’s annual financial statements are subject to independent audit. The Investor Update slide presentation is dated July 22, 2020 and the Company does not undertake to update the materials after that date.
The information in this Item 7.01, including Exhibit 99.2, shall not be deemed to be “filed” for purposes of Section 18 of the Exchange Act, or otherwise subject to the liabilities thereof, nor shall it be deemed to be incorporated by reference in any filing under the Exchange Act or under the Securities Act, except to the extent specifically provided in any such filing.
Item 9.01 Financial Statements and Exhibits.
(d) Exhibits
| Exhibit Number | Description of Exhibit | |||||||
| Press Release of Meta Financial Group, Inc., dated July 22, 2020 regarding the results of operations and financial condition. | ||||||||
| Investor Update slide presentation for the Third Quarter of Fiscal Year 2020, dated July 22, 2020, prepared for use with the Press Release. | ||||||||
SIGNATURE
Pursuant to the requirements of the Securities Exchange Act of 1934, the Registrant has duly caused this report to be signed on its behalf by the undersigned hereunto duly authorized.
META FINANCIAL GROUP, INC. | ||||||||
| Date: July 22, 2020 | By: | /s/ Glen W. Herrick | ||||||
| Glen W. Herrick | ||||||||
| Executive Vice President and Chief Financial Officer | ||||||||
Exhibit 99.1

META FINANCIAL GROUP, INC.® ANNOUNCES RESULTS FOR 2020 FISCAL THIRD QUARTER
- 2020 Fiscal Third Quarter Net Income of $18.2 Million, or $0.53 Per Diluted Share -
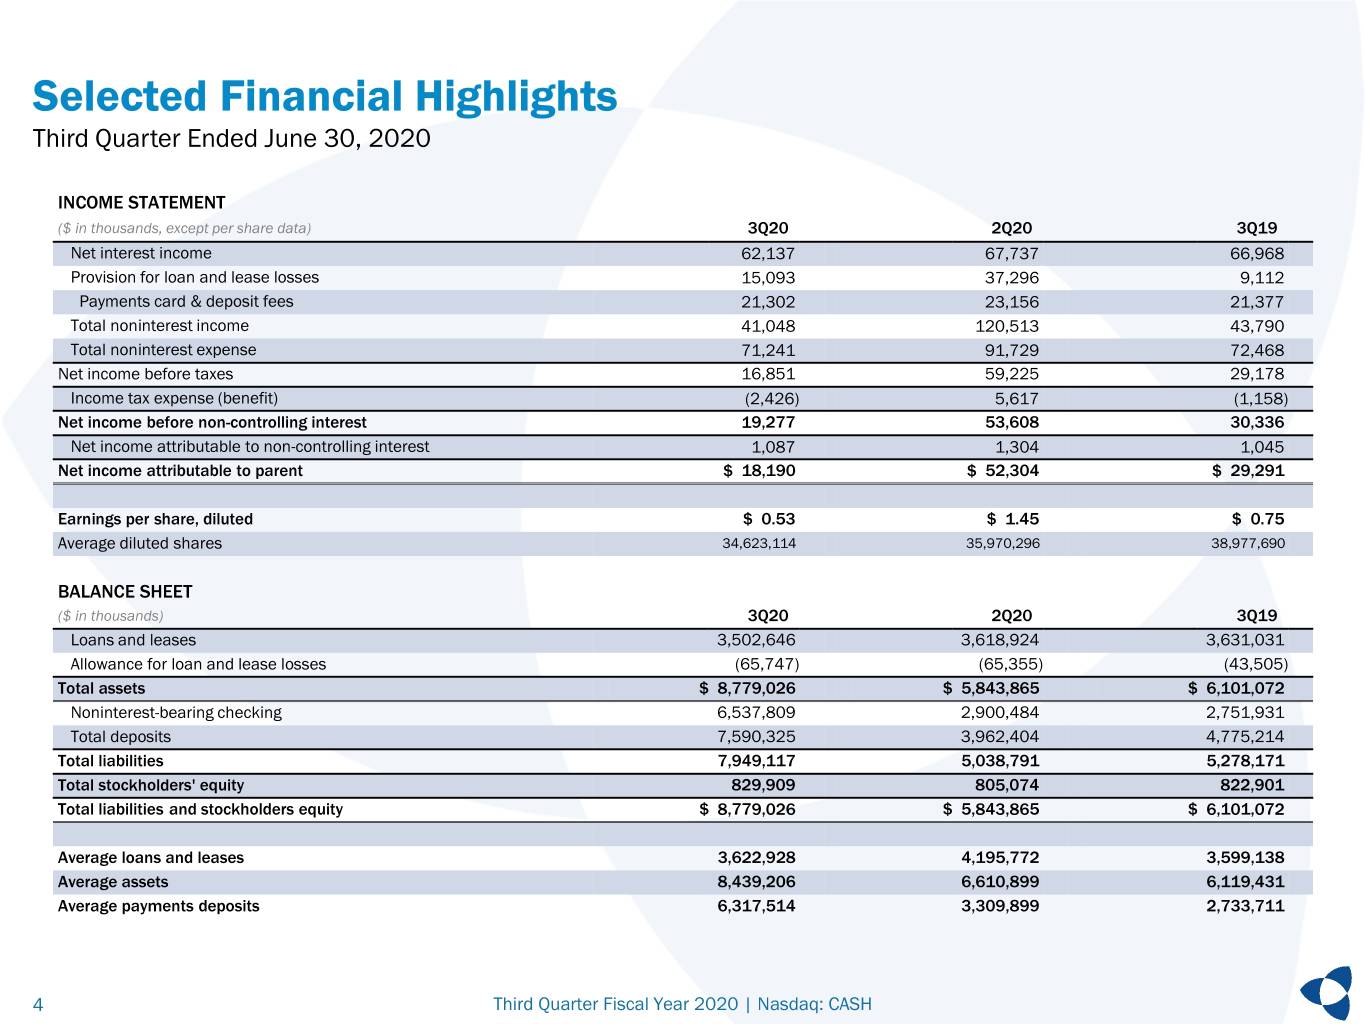
Sioux Falls, S.D., July 22, 2020 (GLOBE NEWSWIRE) -- Meta Financial Group, Inc.® (Nasdaq: CASH) (“Meta” or the “Company”) reported net income of $18.2 million, or $0.53 per diluted share, for the three months ended June 30, 2020, compared to net income of $29.3 million, or $0.75 per diluted share, for the three months ended June 30, 2019.
“I am proud of our performance to date during these unique and volatile times, both operationally and financially. While credit metrics remain sound, we have taken additional provision related to the uncertainty of the COVID-19 pandemic allowing us to build our allowance and strengthen our capital position,” said President and CEO Brad Hanson. “We are keeping the health and safety of our employees at the forefront as we continue serving customers, aligning for growth, and keeping our eyes on the long game, bringing sustainable value to shareholders."
Business Developments
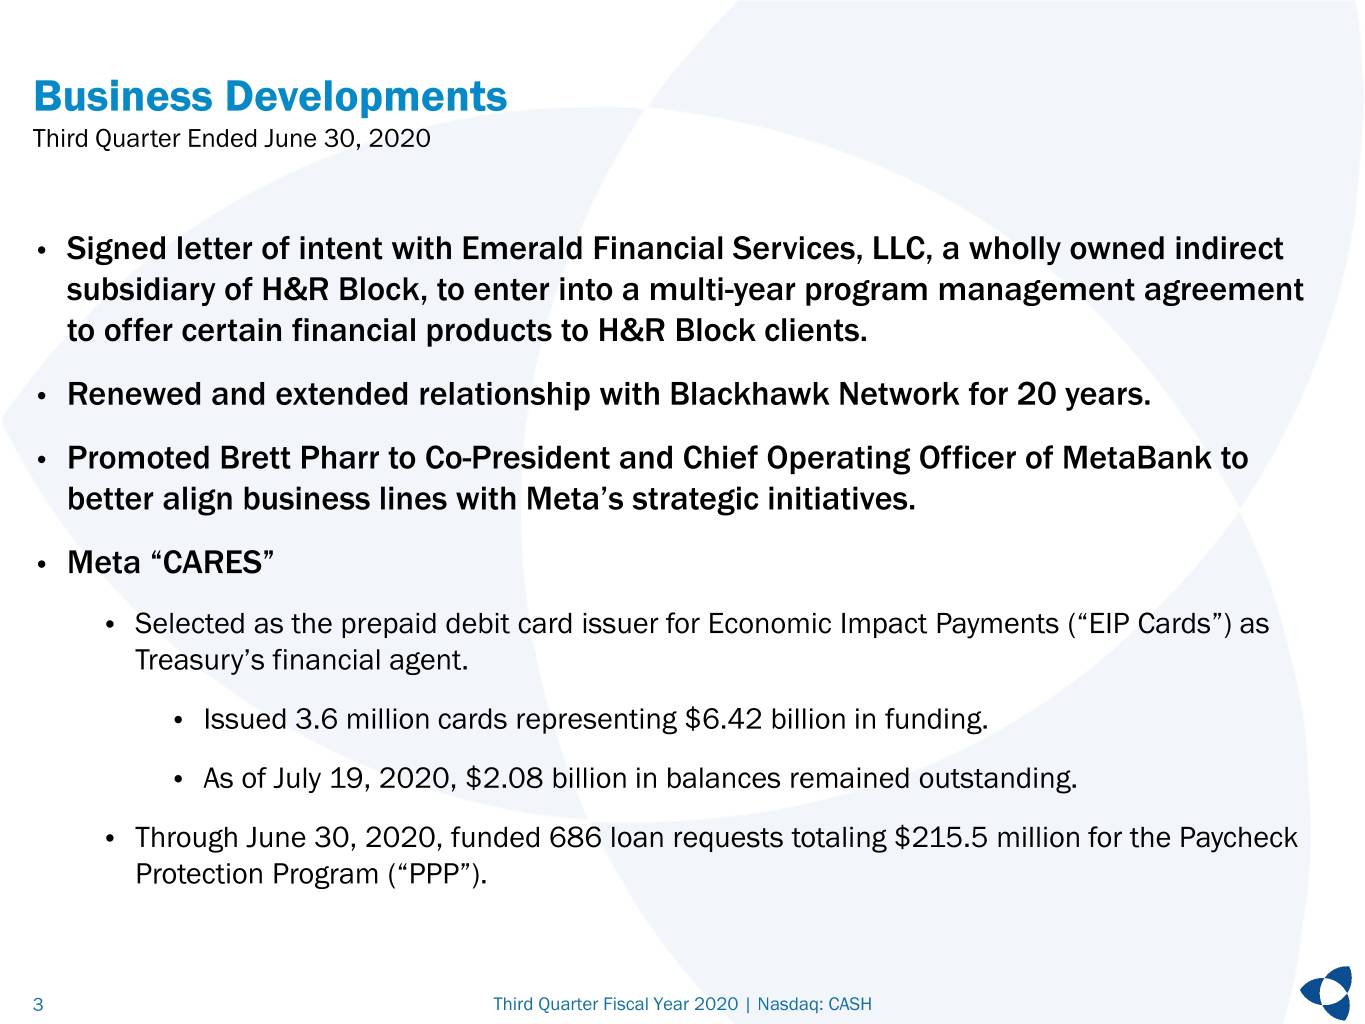
•On May 15, 2020, MetaBank, National Association (the “Bank”), a wholly owned subsidiary of the Company entered into a letter of intent ("LOI") with Emerald Financial Services, LLC (“EFS”), a wholly owned indirect subsidiary of H&R Block, Inc. (“H&R Block”). Under the LOI and subject to the negotiation and execution of a multi-year program management agreement (“PMA”), Meta will offer selected financial products to H&R Block clients, and negotiate the transition of certain financial products under an existing program manager agreement between H&R Block and a third party.
•On June 23, 2020, Brett Pharr was promoted to Co-President and Chief Operating Officer of MetaBank to better align business lines with Meta’s strategic initiatives. Brad Hanson remains Co-President and Chief Executive Officer of MetaBank and President and Chief Executive Officer of the Company.
•During the fiscal 2020 third quarter, the Company extended its agreement with Blackhawk Network, Inc. ("BlackHawk") through 2040. Blackhawk is a leading prepaid and payments company, which supports the program management and distribution of gift cards, prepaid telecom products and financial service products in a number of different retail, digital and incentive channels.
•The Company supported various COVID-19 relief efforts to include the Economic Impact Payment ("EIP") program and the Paycheck Protection Program ("PPP"), which are further described below.
Financial Highlights for the 2020 Fiscal Third Quarter Ended June 30, 2020
•Total gross loans and leases at June 30, 2020 decreased $129.3 million, or 4%, to $3.50 billion, compared to June 30, 2019 and decreased $114.1 million, or 3% when compared to March 31, 2020.
•Average deposits from the payments divisions for the fiscal 2020 third quarter increased nearly 131% to $6.32 billion when compared to the same quarter in fiscal 2019. A significant portion of the year-over-year increase reflected the Company's participation in the EIP program, as described further below. Excluding the balances on the EIP cards, average payments deposits for the fiscal 2020 third quarter were approximately $3.99 billion, representing an increase of 46% compared to the same quarter in fiscal 2019.
•Total revenue for the fiscal 2020 third quarter was $103.2 million, compared to $110.8 million for the same quarter in fiscal 2019.
•Net interest income for the fiscal 2020 third quarter was $62.1 million, compared to $67.0 million in the comparable quarter in fiscal 2019.
1
•Net interest margin ("NIM") decreased to 3.28% for the fiscal 2020 third quarter from 5.07% over the same period of the prior fiscal year, while the tax-equivalent net interest margin ("NIM, TE") decreased to 3.31% from 5.15% for that same period in fiscal 2019. The decrease in NIM during the fiscal 2020 third quarter was primarily driven by excess cash associated with the Company's participation in the Economic Impact Payment program, as described further below.
COVID-19 Business Update
The Company continues to focus on the well-being of its employees, partners and customers. Preventative health measures remain in place to protect employees and customers including mandating remote work options and social distancing measures where possible, restricting non-essential business travel and enhancing preventative cleaning services at all office locations. The Company's COVID-19 Crisis Command Center consisting of leadership and business continuity planning resources throughout the organization continues to effectively monitor possible interruptions related to the pandemic and to ensure business continuity.
The Company is participating in the PPP which is being administered by the Small Business Administration ("SBA"). As of June 30, 2020, the Company had 686 loans outstanding with a total of $215.5 million in loan balances that were originated as part of the program.
From a credit perspective, the Company continues to monitor each of its lending portfolios through these unprecedented times. Significant focus has been placed on the Company's hospitality loans and its small ticket equipment finance relationships. The credit management team has increased the monitoring of these relationships and has been in regular contact with these borrowers.
The Company's community bank hospitality loan balances increased to $169.0 million as of June 30, 2020 from $160.1 million as of March 31, 2020 and the average loan-to-value ratio on those loans improved to 60% at June 30, 2020 from 61% at March 31, 2020. 67% of the loan balances for these hotel relationships received PPP loans and 51% received some form of payment deferral modifications.
As of June 30, 2020, the Company had $245.9 million in small ticket equipment finance balances, of which $217.3 million were categorized within term lending and $28.6 million were categorized within lease financing. 27% of the balances on these small ticket equipment finance relationships received some form of payment deferral or other modifications.
The Company has granted deferral payments on a total of $352.1 million of loan and lease balances through June 30, 2020 as a result of interagency guidance issued on March 22, 2020 encouraging companies to work with customers impacted by COVID-19. As of June 30, 2020, loans and lease totaling $292.2 million were still in their deferment period. In addition, the Company has made other COVID-19 related modifications on a total of $52.9 million, of which $34.6 million are still active as of June 30, 2020. The majority of the other modifications were related to adjusting the type or amount of the customer's payments.
The Company increased its allowance for loan and lease losses during the fiscal third quarter primarily as a result of the ongoing economic uncertainty related to COVID-19 pandemic. The Company will continue to diligently monitor the allowance for loan and lease losses and adjust as necessary in future periods to maintain an appropriate and supportable level.
The Company's capital position remained strong as of June 30, 2020, even while absorbing the temporary impact from the EIP program, as described further below. As of June 30, 2020, the Bank's capital leverage ratio based on average assets was 6.89%. In addition, the Company has options available that can be used to effectively manage capital levels through these turbulent times, including a very strong and flexible balance sheet. The Company's capital leverage ratio was impacted by approximately 278 basis points due to the increase in total asset balances as a result of the EIP program.
2
Economic Impact Payment Program ("EIP") Update
On April 29, 2020, the Bank entered into an amendment of its existing agreement with the U.S. Department of the Treasury’s Bureau of the Fiscal Service (“Fiscal Service”) to provide debit card services to support the distribution of a segment of the Economic Impact Payments payable by the Internal Revenue Service under the Coronavirus Aid, Relief, and Economic Security Act ("CARES Act").
Under the EIP program, 3.6 million cards were delivered with total loads of $6.42 billion. As a result of the program, the Company saw a quick influx of deposits to its balance sheet in mid-May 2020 with limited visibility into the duration of those deposits. While this program's impact to earnings was negligible, it did have a significant impact on cash and deposit balances, leading to a net drag on the net interest margin along with pressuring the Company's leverage capital ratios.
The total balances remaining on the EIP cards as of June 30, 2020 were $2.68 billion and $2.08 billion as of July 19, 2020. The funds on these cards increased the Company's quarterly average noninterest deposit balances by $2.32 billion, leading to an overall improvement in cost of deposits. This short term influx of deposits also led to excess cash balances held at the Federal Reserve during the current period, which yielded approximately 10 basis points in interest income, and increased the quarterly average of interest-earning assets compared to previous periods. This increase of lower yielding cash balances resulted in a drag to the overall yield on total interest-earning assets during the current period. The net impact to NIM was approximately 140 basis points.
Net Interest Income
Net interest income for the fiscal 2020 third quarter was $62.1 million, a decrease of 7%, from the same quarter in fiscal 2019. The decrease was primarily driven by lower overall balances and yields realized on the loan and lease portfolios along with a decrease in investment securities balances, partially offset by a reduction in total interest expense.
During the third quarter of fiscal year 2020, loan and lease interest income decreased $9.8 million and investment securities interest income decreased $4.4 million, when compared to the same quarter in fiscal 2019, while interest expense decreased $9.4 million over that same period. The quarterly average outstanding balance of loans and leases as a percentage of interest-earning assets for the quarter ended June 30, 2020 decreased to 48%, from 68% for the quarter ended June 30, 2019, while the quarterly average balance of total investments as a percentage of interest-earning assets decreased to 17% from 31% over that same period. These decreases were primarily due to the increase in interest-earning cash balances related to the EIP program. The Company’s average interest-earning assets for the fiscal 2020 third quarter increased by $2.31 billion, to $7.61 billion from the comparable quarter in fiscal 2019, primarily due to the effects of the EIP program.
NIM decreased to 3.28% for the fiscal 2020 third quarter from 5.07% for the comparable quarter in fiscal 2019, primarily due to the effects of the EIP program. The net effect of purchase accounting accretion contributed two basis points to NIM for the fiscal 2020 third quarter as compared to three basis points and 25 basis points for the quarters ended March 31, 2020 and June 30, 2019, respectively.
The overall reported tax-equivalent yield (“TEY”) on average earning asset yields decreased by 267 basis points to 3.59% for the fiscal 2020 third quarter compared to the fiscal 2019 third quarter, driven primarily by excess low-yielding cash held at the Federal Reserve, along with a lower interest rate environment. The fiscal 2020 third quarter TEY on the securities portfolio was 2.22% compared to 3.09% for the same period of the prior fiscal year.
The Company's cost of funds for all deposits and borrowings averaged 0.28% during the fiscal 2020 third quarter, compared to 1.14% for the fiscal 2019 third quarter. This decrease was primarily due to a decrease in overnight borrowings rates as well as an increase in the average balance of the Company's noninterest-bearing deposits, mainly due to the EIP program noted above. The Company's overall cost of deposits was 0.17% in the fiscal third quarter of 2020, compared to 0.90% in the same quarter of fiscal 2019.
Noninterest Income
Fiscal 2020 third quarter noninterest income was $41.0 million, compared to $43.8 million for the same period of the prior year. This year-over-year decrease was primarily due to lower total tax product fee income and a reduction in gains on loan sales, partially offset by an increase in rental income.
3
Noninterest Expense
Noninterest expense decreased 2% to $71.2 million for the fiscal 2020 third quarter, from $72.5 million for the same quarter of fiscal 2019, primarily driven by lower compensation and benefits, intangible amortization, total tax product expense, and occupancy and equipment expenses, partially offset by higher card processing expenses and operating lease equipment depreciation.
Income Tax Expense
The Company recorded an income tax benefit of $2.4 million, representing an effective tax rate of (14.4%), for the fiscal 2020 third quarter, compared to an income tax benefit of $1.2 million, representing an effective tax rate of (4.0)%, for the fiscal 2019 third quarter. The recorded income tax benefit during the current quarter was primarily due to ratably recognized investment tax credits and lower forecast earnings due to COVID-19.
The Company originated $1.3 million in solar leases during the fiscal 2020 third quarter, compared to $49.1 million during the fiscal 2019 third quarter. Investment tax credits related to solar leases are recognized ratably based on income throughout each fiscal year. The timing and impact of future solar tax credits are expected to vary from period to period, and Meta intends to undertake only those tax credit opportunities that meet the Company's underwriting and return criteria.
Investments, Loans and Leases
| June 30, 2020 | March 31, 2020 | December 31, 2019 | September 30, 2019 | June 30, 2019 | |||||||||||||||||||||||||
| Total investments | $ | 1,268,416 | $ | 1,310,476 | $ | 1,337,840 | $ | 1,407,257 | $ | 1,502,640 | |||||||||||||||||||
| Loans held for sale | |||||||||||||||||||||||||||||
| Consumer credit products | 391 | — | — | 122,299 | 45,582 | ||||||||||||||||||||||||
| SBA/USDA | 31,438 | 13,610 | 13,883 | 26,478 | 17,257 | ||||||||||||||||||||||||
Community Bank(1) | 48,076 | — | 250,383 | — | — | ||||||||||||||||||||||||
| Total loans held for sale | 79,905 | 13,610 | 264,266 | 148,777 | 62,839 | ||||||||||||||||||||||||
| National Lending | |||||||||||||||||||||||||||||
Term lending(2) | 738,454 | 725,581 | 695,347 | 641,742 | 562,557 | ||||||||||||||||||||||||
Asset based lending(2) | 181,130 | 250,211 | 250,633 | 250,465 | 229,573 | ||||||||||||||||||||||||
| Factoring | 206,361 | 285,495 | 285,776 | 296,507 | 320,344 | ||||||||||||||||||||||||
Lease financing(2) | 264,988 | 238,788 | 223,715 | 177,915 | 165,136 | ||||||||||||||||||||||||
| Insurance premium finance | 359,147 | 332,800 | 349,299 | 361,105 | 358,772 | ||||||||||||||||||||||||
| SBA/USDA | 308,611 | 92,000 | 90,269 | 88,831 | 99,791 | ||||||||||||||||||||||||
| Other commercial finance | 100,214 | 101,472 | 99,617 | 99,665 | 99,677 | ||||||||||||||||||||||||
| Commercial Finance | 2,158,905 | 2,026,347 | 1,994,656 | 1,916,230 | 1,835,850 | ||||||||||||||||||||||||
| Consumer credit products | 102,808 | 113,544 | 115,843 | 106,794 | 155,539 | ||||||||||||||||||||||||
| Other consumer finance | 138,777 | 144,895 | 154,772 | 161,404 | 164,727 | ||||||||||||||||||||||||
| Consumer Finance | 241,585 | 258,439 | 270,615 | 268,198 | 320,266 | ||||||||||||||||||||||||
| Tax Services | 19,168 | 95,936 | 101,739 | 2,240 | 24,410 | ||||||||||||||||||||||||
| Warehouse Finance | 277,614 | 333,829 | 272,522 | 262,924 | 250,003 | ||||||||||||||||||||||||
| Total National Lending loans and leases | 2,697,272 | 2,714,551 | 2,639,532 | 2,449,592 | 2,430,529 | ||||||||||||||||||||||||
| Community Banking | |||||||||||||||||||||||||||||
| Commercial real estate and operating | 608,303 | 654,429 | 682,399 | 883,932 | 877,412 | ||||||||||||||||||||||||
| Consumer one-to-four family real estate and other | 166,479 | 205,046 | 220,588 | 259,425 | 256,853 | ||||||||||||||||||||||||
| Agricultural real estate and operating | 24,655 | 36,759 | 40,778 | 58,464 | 61,169 | ||||||||||||||||||||||||
| Total Community Banking loans | 799,437 | 896,234 | 943,765 | 1,201,821 | 1,195,434 | ||||||||||||||||||||||||
| Total gross loans and leases | 3,496,709 | 3,610,785 | 3,583,297 | 3,651,413 | 3,625,963 | ||||||||||||||||||||||||
| Allowance for loan and lease losses | (65,747) | (65,355) | (30,176) | (29,149) | (43,505) | ||||||||||||||||||||||||
| Net deferred loan and lease origination fees | 5,937 | 8,139 | 7,177 | 7,434 | 5,068 | ||||||||||||||||||||||||
Total loans and leases, net of allowance(3) | $ | 3,436,899 | $ | 3,553,569 | $ | 3,560,298 | $ | 3,629,698 | $ | 3,587,526 | |||||||||||||||||||
4
(1) The June 30, 2020 balance included approximately $28.7 million of commercial real estate and operating loans, $11.3 million of consumer one-to-four family real estate and other loans, and $8.1 million of agricultural real estate and operating loans. The December 31, 2019 balance included approximately $197.5 million of commercial real estate and operating loans, $40.4 million of consumer one-to-four family real estate and other loans, and $12.7 million of agricultural real estate and operating loans.
(2) The Company updated the presentation of its loan and lease table beginning in the fiscal 2020 first quarter. The new presentation includes a new category called term lending. Certain balances previously included in the asset based lending and lease financing categories were reclassified into the new term lending category during the fiscal 2020 first quarter. Prior period balances have been conformed to the new presentation.
(3) As of June 30, 2020, the remaining balance of acquired loans and leases from the acquisition of Crestmark Bancorp, Inc. ("Crestmark") and its bank subsidiary, Crestmark Bank (the "Crestmark Acquisition") was $188.3 million and the remaining balances of the credit and interest rate mark discounts related to the acquired loans and leases held for investment were $3.4 million and $2.9 million, respectively. On August 1, 2018, the Company acquired loans and leases from the Crestmark Acquisition totaling $1.06 billion and recorded related credit and interest rate mark discounts of $12.3 million and $6.0 million, respectively.
The Company's investment security balances continued to decline at June 30, 2020 to a total of $1.27 billion, as compared to $1.50 billion at June 30, 2019.
Total gross loans and leases decreased $129.3 million, or 4%, to $3.50 billion at June 30, 2020, from $3.63 billion at June 30, 2019, with most of the decline attributable to the sale of community bank loan balances during the second quarter of fiscal 2020 along with a decrease in the consumer finance portfolio, partially offset by growth in the commercial finance portfolio.
At June 30, 2020, commercial finance loans, which comprised 62% of the Company's gross loan and lease portfolio, totaled $2.16 billion, reflecting growth of $132.6 million, or 7%, from March 31, 2020. SBA/USDA loans at June 30, 2020 increased by $216.6 million compared to March 31, 2020, with $215.5 million of the sequential increase related to PPP loans. Warehouse finance loans totaled $277.6 million at June 30, 2020, a 17% decrease from March 31, 2020.
Community bank loans totaled $799.4 million as of June 30, 2020, as compared to $896.2 million at March 31, 2020 and $1.20 billion at June 30, 2019. As of June 30, 2020, the Company had $48.1 million of community bank loans classified as held for sale and expects to sell those loans during the fourth quarter of fiscal 2020.
Asset Quality
The Company’s allowance for loan and lease losses was $65.7 million at June 30, 2020, compared to $43.5 million at June 30, 2019, driven primarily by increases in the allowance of $17.1 million in commercial finance and $12.0 million in the community banking portfolio, partially offset by decreases in the tax services and consumer lending portfolios of $4.0 million and $2.9 million, respectively.
The following table presents the Company's allowance for loan and lease losses as a percentage of its total loans and leases.
| As of the Period Ended | ||||||||||||||
| (Unaudited) | June 30, 2020 | March 31, 2020 | June 30, 2019 | |||||||||||
| Commercial finance | 1.36 | % | 1.28 | % | 0.67 | % | ||||||||
| Consumer finance | 1.75 | % | 1.74 | % | 2.22 | % | ||||||||
| Tax services | 59.67 | % | 22.22 | % | 63.19 | % | ||||||||
| Warehouse finance | 0.10 | % | 0.10 | % | 0.10 | % | ||||||||
| National Lending | 1.68 | % | 1.92 | % | 1.44 | % | ||||||||
| Community Bank | 2.55 | % | 1.49 | % | 0.70 | % | ||||||||
| Total loans and leases | 1.88 | % | 1.81 | % | 1.20 | % | ||||||||
5
The Company continued to assess each of its loan and lease portfolios during the fiscal third quarter and increased its allowance for loan and lease losses as a percentage of total loans and leases in the community bank and commercial finance portfolios primarily as a result of the on-going COVID-19 pandemic. Tax services coverage rates were driven by typical seasonal activity and have not been materially impacted by COVID-19 as the tax-lending season is now complete. Warehouse finance remained largely unchanged due to the structure of the credit protections in place. The Company expects to continue to diligently monitor the allowance for loan and lease losses and adjust as necessary in future periods to maintain an appropriate and supportable level. When adding the $3.4 million balance of the credit mark to the allowance for loan and lease losses, the commercial finance coverage ratio increases to 1.52% and the total loans and leases coverage ratio increases to 1.98%, as of June 30, 2020. Within commercial finance, the coverage ratio on Crestmark division loans and leases was 1.52% at June 30, 2020, as compared to 1.41% at March 31, 2020 and 0.77% at June 30, 2019, and the coverage ratio on the insurance premium finance portfolio over those same periods were 0.66%, 0.64%, and 0.28%, respectively.
Activity in the allowance for loan and lease losses for the periods presented were as follows.
| (Unaudited) | Three Months Ended | Nine Months Ended | |||||||||||||||||||||||||||
| June 30, 2020 | March 31, 2020 | June 30, 2019 | June 30, 2020 | June 30, 2019 | |||||||||||||||||||||||||
| (Dollars in thousands) | |||||||||||||||||||||||||||||
| Beginning balance | $ | 65,355 | $ | 30,176 | $ | 48,672 | $ | 29,149 | $ | 13,040 | |||||||||||||||||||
| Provision - tax services loans | (100) | 19,596 | 914 | 20,407 | 24,883 | ||||||||||||||||||||||||
| Provision - all other loans and leases | 15,193 | 17,700 | 8,198 | 35,390 | 26,646 | ||||||||||||||||||||||||
| Charge-offs - tax services loans | (9,797) | — | (9,627) | (9,797) | (9,670) | ||||||||||||||||||||||||
| Charge-offs - all other loans and leases | (5,808) | (3,187) | (5,124) | (12,912) | (14,407) | ||||||||||||||||||||||||
| Recoveries - tax services loans | 15 | 74 | 36 | 827 | 212 | ||||||||||||||||||||||||
| Recoveries - all other loans and leases | 889 | 996 | 436 | 2,684 | 2,801 | ||||||||||||||||||||||||
| Ending balance | $ | 65,747 | $ | 65,355 | $ | 43,505 | $ | 65,747 | $ | 43,505 | |||||||||||||||||||
Provision for loan and lease losses was $15.1 million for the quarter ended June 30, 2020, compared to $9.1 million for the comparable period in the prior fiscal year. The increase in provision was primarily within the remaining community banking and commercial finance portfolios, partially offset by decreases in the consumer finance and tax services portfolios. Provision increases in the community banking and commercial finance portfolios was primarily attributable to the increased stress that the hospitality loans and its small ticket equipment finance relationships have experienced stemming from the ongoing economic uncertainty related to the COVID-19 pandemic. Loans and leases that received short-term payment deferrals were also analyzed and additional provision was applied as appropriate. Management believes that given the structure of the credit protections put in place for the consumer and warehouse finance lending lines, the coverage ratio for those loan portfolios was adequate as of June 30, 2020. Net charge-offs were $14.7 million for the quarter ended June 30, 2020 compared to $14.3 million for the quarter ended June 30, 2019. Total net charge-offs for the quarter ended June 30, 2020 consisted primarily of seasonal net charge-offs of $9.8 million in the tax services loan portfolio. The overall increase in total net charge-offs from the comparable quarter of the prior fiscal year was primarily within the commercial finance portfolio, offset partially by a decrease in the consumer finance portfolio.
6
The Company's past due loans and leases were as follows for the periods presented.
| As of June 30, 2020 | Accruing and Nonaccruing Loans and Leases | Nonperforming Loans and Leases | |||||||||||||||||||||||||||||||||||||||||||||||||||
| (Dollars in Thousands) | 30-59 Days Past Due | 60-89 Days Past Due | > 89 Days Past Due | Total Past Due | Current | Total Loans and Leases Receivable | > 89 Days Past Due and Accruing | Non-accrual balance | Total | ||||||||||||||||||||||||||||||||||||||||||||
| Commercial finance | $ | 13,865 | $ | 16,005 | $ | 27,150 | $ | 57,020 | $ | 2,101,885 | $ | 2,158,905 | $ | 8,635 | $ | 22,285 | $ | 30,920 | |||||||||||||||||||||||||||||||||||
| Consumer finance | 650 | 623 | 909 | 2,182 | 239,403 | 241,585 | 909 | — | 909 | ||||||||||||||||||||||||||||||||||||||||||||
| Tax services | — | 19,168 | — | 19,168 | — | 19,168 | — | — | — | ||||||||||||||||||||||||||||||||||||||||||||
| Warehouse finance | — | — | — | — | 277,614 | 277,614 | — | — | — | ||||||||||||||||||||||||||||||||||||||||||||
| Total National Lending | 14,515 | 35,796 | 28,059 | 78,370 | 2,618,902 | 2,697,272 | 9,544 | 22,285 | 31,829 | ||||||||||||||||||||||||||||||||||||||||||||
| Total Community Banking | 4,910 | 625 | 6,885 | 12,420 | 787,017 | 799,437 | 4,995 | 2,470 | 7,465 | ||||||||||||||||||||||||||||||||||||||||||||
| Total loans and leases held for investment | $ | 19,425 | $ | 36,421 | $ | 34,944 | $ | 90,790 | $ | 3,405,919 | $ | 3,496,709 | $ | 14,539 | $ | 24,755 | $ | 39,294 | |||||||||||||||||||||||||||||||||||
| As of March 31, 2020 | Accruing and Nonaccruing Loans and Leases | Nonperforming Loans and Leases | |||||||||||||||||||||||||||||||||||||||||||||||||||
| (Dollars in Thousands) | 30-59 Days Past Due | 60-89 Days Past Due | > 89 Days Past Due | Total Past Due | Current | Total Loans and Leases Receivable | > 89 Days Past Due and Accruing | Non-accrual balance | Total | ||||||||||||||||||||||||||||||||||||||||||||
| Commercial finance | $ | 35,810 | $ | 7,487 | $ | 18,721 | $ | 62,018 | $ | 1,964,329 | $ | 2,026,347 | $ | 9,372 | $ | 16,024 | $ | 25,396 | |||||||||||||||||||||||||||||||||||
| Consumer finance | 1,781 | 1,078 | 1,345 | 4,204 | 254,235 | 258,439 | 1,345 | — | 1,345 | ||||||||||||||||||||||||||||||||||||||||||||
| Tax services | 668 | — | — | 668 | 95,268 | 95,936 | — | — | — | ||||||||||||||||||||||||||||||||||||||||||||
| Warehouse finance | — | — | — | — | 333,829 | 333,829 | — | — | — | ||||||||||||||||||||||||||||||||||||||||||||
| Total National Lending | 38,259 | 8,565 | 20,066 | 66,890 | 2,647,661 | 2,714,551 | 10,717 | 16,024 | 26,741 | ||||||||||||||||||||||||||||||||||||||||||||
| Total Community Banking | 1,012 | 2,735 | 4,723 | 8,470 | 887,764 | 896,234 | 2,905 | 1,818 | 4,723 | ||||||||||||||||||||||||||||||||||||||||||||
| Total loans and leases held for investment | $ | 39,271 | $ | 11,300 | $ | 24,789 | $ | 75,360 | $ | 3,535,425 | $ | 3,610,785 | $ | 13,622 | $ | 17,842 | $ | 31,464 | |||||||||||||||||||||||||||||||||||
The Company's nonperforming assets at June 30, 2020, were $56.1 million, representing 0.64% of total assets, compared to $39.4 million, or 0.67% of total assets at March 31, 2020 and $51.0 million, or 0.84% of total assets at June 30, 2019. The increase in nonperforming assets on a linked quarter basis was primarily driven by an increase in commercial finance and community banking nonperforming loans and leases, as well as an increase in nonperforming operating leases. The year-over-year increase in nonperforming assets was primarily driven by an increase in commercial finance nonperforming loans and leases and an increase in nonperforming operating leases, mostly offset by a reduction in foreclosed and repossessed assets. The decrease in nonperforming assets as a percentage of total assets was primarily due to higher period-end assets at June 30, 2020 related to excess cash held at the Federal Reserve stemming from the additional EIP deposit balances.
The Company's nonperforming loans and leases at June 30, 2020, were $39.3 million, representing 1.10% of total gross loans and leases, compared to $31.5 million, or 0.87% of total gross loans and leases at March 31, 2020 and $20.8 million, or 0.57% of total gross loans and leases at June 30, 2019.
7
Deposits, Borrowings and Other Liabilities
Total average deposits for the fiscal 2020 third quarter increased by $2.61 billion to $7.22 billion compared to the same period in fiscal 2019, primarily due to the effects of the EIP program. Average noninterest-bearing deposits increased $3.35 billion, or 123%, for the fiscal 2020 third quarter when compared to the same period in fiscal 2019, while average wholesale deposits decreased $704.2 million, or 46%. Average deposits from the payments divisions increased 131% to $6.32 billion for the fiscal 2020 third quarter when compared to the same period in fiscal 2019. Excluding the balances on the EIP cards, average payments deposits for the fiscal 2020 third quarter were $3.99 billion, representing an increase of 46% compared to the same period of the prior year, which was largely driven by various stimulus payments loaded on partner cards along with lower levels of consumer spending.
The average balance of total deposits and interest-bearing liabilities was $7.49 billion for the three-month period ended June 30, 2020, compared to $5.14 billion for the same period in the prior fiscal year, representing an increase of 46%.
Total end-of-period deposits increased 59% to $7.59 billion at June 30, 2020, compared to $4.78 billion at June 30, 2019. The increase in end-of-period deposits was primarily driven by an increase in noninterest bearing deposits of $4.18 billion, of which $2.68 billion was attributable to the balances on the EIP cards. The increase in total end-of-period deposits was partially offset by a decrease of $884.2 million in wholesale deposits, as well as the sale of $290.5 million of community bank deposits during the second quarter of fiscal 2020.
Regulatory Capital
The Company and MetaBank, remained above the federal regulatory minimum capital requirements at June 30, 2020 and continued to be classified as well-capitalized institutions. Regulatory capital ratios of the Company and the Bank are stated in the table below.
The tables below include certain non-GAAP financial measures that are used by investors, analysts and bank regulatory agencies to assess the capital position of financial services companies. Management reviews these measures along with other measures of capital as part of its financial analysis.
| As of the dates indicated | June 30, 2020 | March 31, 2020 | December 31, 2019 | September 30, 2019 | June 30, 2019 | ||||||||||||||||||||||||
| Company | |||||||||||||||||||||||||||||
| Tier 1 leverage capital ratio | 5.91 | % | 7.28 | % | 8.28 | % | 8.33 | % | 8.05 | % | |||||||||||||||||||
| Common equity Tier 1 capital ratio | 11.51 | % | 10.27 | % | 10.10 | % | 10.35 | % | 10.19 | % | |||||||||||||||||||
| Tier 1 capital ratio | 11.90 | % | 10.63 | % | 10.46 | % | 10.71 | % | 10.55 | % | |||||||||||||||||||
| Total capital ratio | 14.99 | % | 13.61 | % | 12.74 | % | 13.01 | % | 13.22 | % | |||||||||||||||||||
| MetaBank | |||||||||||||||||||||||||||||
| Tier 1 leverage capital ratio | 6.89 | % | 8.52 | % | 9.70 | % | 9.65 | % | 9.37 | % | |||||||||||||||||||
| Common equity Tier 1 capital ratio | 13.82 | % | 12.39 | % | 12.18 | % | 12.31 | % | 12.22 | % | |||||||||||||||||||
| Tier 1 capital ratio | 13.86 | % | 12.44 | % | 12.24 | % | 12.37 | % | 12.27 | % | |||||||||||||||||||
| Total capital ratio | 15.12 | % | 13.69 | % | 12.90 | % | 13.02 | % | 13.26 | % | |||||||||||||||||||
8
The following table provides the non-GAAP financial measures used to compute certain of the ratios included in the table above, as well as a reconciliation of such non-GAAP financial measures to the most directly comparable financial measure in accordance with GAAP:
Standardized Approach(1) | June 30, 2020 | March 31, 2020 | December 31, 2019 | September 30, 2019 | June 30, 2019 | ||||||||||||||||||||||||
| (Dollars in Thousands) | |||||||||||||||||||||||||||||
| Total stockholders' equity | $ | 829,909 | $ | 805,074 | $ | 837,068 | $ | 843,958 | $ | 822,901 | |||||||||||||||||||
| Adjustments: | |||||||||||||||||||||||||||||
| LESS: Goodwill, net of associated deferred tax liabilities | 302,814 | 303,625 | 304,020 | 304,020 | 302,850 | ||||||||||||||||||||||||
| LESS: Certain other intangible assets | 42,865 | 44,909 | 47,855 | 50,501 | 53,249 | ||||||||||||||||||||||||
| LESS: Net deferred tax assets from operating loss and tax credit carry-forwards | 10,360 | 11,589 | 16,876 | 15,569 | 13,858 | ||||||||||||||||||||||||
| LESS: Net unrealized gains (losses) on available-for-sale securities | 8,382 | 2,337 | 3,897 | 6,458 | 2,329 | ||||||||||||||||||||||||
| LESS: Non-controlling interest | 3,787 | 3,762 | 4,305 | 4,047 | 3,508 | ||||||||||||||||||||||||
Common Equity Tier 1(1) | 461,701 | 438,852 | 460,115 | 463,363 | 447,107 | ||||||||||||||||||||||||
| Long-term borrowings and other instruments qualifying as Tier 1 | 13,661 | 13,661 | 13,661 | 13,661 | 13,661 | ||||||||||||||||||||||||
| Tier 1 minority interest not included in common equity tier 1 capital | 1,894 | 2,036 | 2,372 | 2,350 | 2,119 | ||||||||||||||||||||||||
| Total Tier 1 Capital | 477,256 | 454,549 | 476,148 | 479,374 | 462,887 | ||||||||||||||||||||||||
| Allowance for loan and lease losses | 50,338 | 53,580 | 30,239 | 29,272 | 43,641 | ||||||||||||||||||||||||
| Subordinated debentures (net of issuance costs) | 73,765 | 73,724 | 73,684 | 73,644 | 73,605 | ||||||||||||||||||||||||
| Total qualifying capital | $ | 601,359 | $ | 581,853 | $ | 580,071 | $ | 582,290 | $ | 580,133 | |||||||||||||||||||
(1) Capital ratios were determined using the Basel III capital rules that became effective on January 1, 2015. Basel III revised the definition of capital, increased minimum capital ratios, and introduced a minimum CET1 ratio; those changes are being fully phased in through the end of 2021.
The following table provides a reconciliation of tangible common equity and tangible common equity excluding accumulated other comprehensive income ("AOCI"), each of which is used in calculating tangible book value data, to Total Stockholders' Equity. Each of tangible common equity and tangible common equity excluding AOCI is a non-GAAP financial measure that is commonly used within the banking industry.
| June 30, 2020 | March 31, 2020 | December 31, 2019 | September 30, 2019 | June 30, 2019 | |||||||||||||||||||||||||
| (Dollars in Thousands) | |||||||||||||||||||||||||||||
| Total Stockholders' Equity | $ | 829,909 | $ | 805,074 | $ | 837,068 | $ | 843,958 | $ | 822,901 | |||||||||||||||||||
| Less: Goodwill | 309,505 | 309,505 | 309,505 | 309,505 | 307,941 | ||||||||||||||||||||||||
| Less: Intangible assets | 43,974 | 46,766 | 50,151 | 52,810 | 56,153 | ||||||||||||||||||||||||
| Tangible common equity | 476,430 | 448,803 | 477,412 | 481,643 | 458,807 | ||||||||||||||||||||||||
| Less: Accumulated other comprehensive income (loss) ("AOCI") | 7,995 | 1,654 | 3,895 | 6,339 | 2,308 | ||||||||||||||||||||||||
| Tangible common equity excluding AOCI | $ | 468,435 | $ | 447,149 | $ | 473,517 | $ | 475,304 | $ | 456,499 | |||||||||||||||||||
Conference Call
The Company will host a conference call and earnings webcast at 4:00 p.m. Central Time (5:00 p.m. Eastern Time) on Wednesday, July 22, 2020. The live webcast of the call can be accessed from Meta’s Investor Relations website at www.metafinancialgroup.com. Telephone participants may access the live conference call by dialing (844) 461-9934 beginning approximately 10 minutes prior to start time. Please ask to join the Meta Financial conference call, and provide conference ID 8468707 upon request. International callers should dial (636) 812-6634. A webcast replay will also be archived at www.metafinancialgroup.com for one year.
9
Forward-Looking Statements
The Company and MetaBank, N.A. ("MetaBank") may from time to time make written or oral “forward-looking statements,” including statements contained in this press release, the Company’s filings with the SEC, the Company’s reports to stockholders, and in other communications by the Company and MetaBank, which are made in good faith by the Company pursuant to the “safe harbor” provisions of the Private Securities Litigation Reform Act of 1995.
You can identify forward-looking statements by words such as “may,” “hope,” “will,” “should,” “expect,” “plan,” “anticipate,” “intend,” “believe,” “estimate,” “predict,” “potential,” “continue,” “could,” “future,” or the negative of those terms, or other words of similar meaning or similar expressions. You should carefully read statements that contain these words because they discuss our future expectations or state other “forward-looking” information. These forward-looking statements are based on information currently available to us and assumptions about future events, and include statements with respect to the Company’s beliefs, expectations, estimates, and intentions, which are subject to significant risks and uncertainties, and are subject to change based on various factors, some of which are beyond the Company’s control. Such risks, uncertainties and other factors may cause our actual growth, results of operations, financial condition, cash flows, performance and business prospects and opportunities to differ materially from those expressed in, or implied by, these forward-looking statements. Such statements address, among others, the following subjects: future operating results; expectations in connection with the impact of the ongoing COVID-19 pandemic and related government actions on our business, our industry and the capital markets; customer retention; loan and other product demand; expectations concerning the acquisitions and divestitures; new products and services, including those offered by Meta Payment Systems, Refund Advantage, EPS Financial and Specialty Consumer Services divisions; credit quality and adequacy of reserves; technology; and the Company's employees. The following factors, among others, could cause the Company's financial performance and results of operations to differ materially from the expectations, estimates, and intentions expressed in such forward-looking statements: maintaining our executive management team; expected growth opportunities may not be realized or may take longer to realize than expected; the potential adverse effects of the ongoing COVID-19 pandemic and any governmental or societal responses thereto, or other unusual and infrequently occurring events; actual changes in interest rates and the Fed Funds rate; additional changes in tax laws; the strength of the United States' economy, in general, and the strength of the local economies in which the Company conducts operations; changes in, trade, monetary, and fiscal policies and laws, including interest rate policies of the Board of Governors of the Federal Reserve System (the “Federal Reserve”); inflation, market, and monetary fluctuations; the timely and efficient development of, and acceptance of, new products and services offered by the Company or its strategic partners, as well as risks (including reputational and litigation) attendant thereto, and the perceived overall value of these products and services by users; the Company's ability to finalize a definitive program management agreement with H&R Block and the terms thereof; the risks of dealing with or utilizing third parties, including, in connection with the Company’s refund advance business, the risk of reduced volume of refund advance loans as a result of reduced customer demand for or usage of Meta’s strategic partners’ refund advance products; our relationship with, and any actions which may be initiated by, our regulators; the impact of changes in financial services laws and regulations, including, but not limited to, laws and regulations relating to the tax refund industry and the insurance premium finance industry and recent and potential changes in response to the COVID-19 pandemic such as the Coronavirus Aid, Relief, and Economic Security Act ("CARES Act") and the rules and regulations that may be promulgated thereunder; technological changes, including, but not limited to, the protection of our electronic systems and information; the impact of acquisitions and divestitures; litigation risk; the growth of the Company’s business, as well as expenses related thereto; continued maintenance by MetaBank of its status as a well-capitalized institution, particularly in light of our deposit base, a portion of which has been characterized as “brokered;” changes in consumer spending and saving habits; and the success of the Company at maintaining its high quality asset level and managing and collecting assets of borrowers in default should problem assets increase.
The foregoing list of factors is not exclusive. We caution you not to place undue reliance on these forward-looking statements. The forward-looking statements included in this press release speak only as of the date hereof. Additional discussions of factors affecting the Company’s business and prospects are reflected under the caption “Risk Factors” and in other sections of the Company’s Annual Report on Form 10-K for the Company’s fiscal year ended September 30, 2019, and in other filings made with the SEC. The Company expressly disclaims any intent or obligation to update any forward-looking statements, whether written or oral, that may be made from time to time by or on behalf of the Company or its subsidiaries, whether as a result of new information, changed circumstances, or future events or for any other reason.
10
Condensed Consolidated Statements of Financial Condition (Unaudited)
(Dollars in Thousands, Except Share Data)
| ASSETS | June 30, 2020 | March 31, 2020 | December 31, 2019 | September 30, 2019 | June 30, 2019 | ||||||||||||||||||||||||
| Cash and cash equivalents | $ | 3,108,141 | $ | 108,733 | $ | 152,189 | $ | 126,545 | $ | 100,732 | |||||||||||||||||||
| Investment securities available for sale, at fair value | 825,579 | 840,525 | 852,603 | 889,947 | 961,897 | ||||||||||||||||||||||||
| Mortgage-backed securities available for sale, at fair value | 338,250 | 355,094 | 362,120 | 382,546 | 395,201 | ||||||||||||||||||||||||
| Investment securities held to maturity, at cost | 98,205 | 108,105 | 116,313 | 127,582 | 138,128 | ||||||||||||||||||||||||
| Mortgage-backed securities held to maturity, at cost | 6,382 | 6,752 | 6,804 | 7,182 | 7,414 | ||||||||||||||||||||||||
| Loans held for sale | 79,905 | 13,610 | 264,266 | 148,777 | 62,839 | ||||||||||||||||||||||||
| Loans and leases | 3,502,646 | 3,618,924 | 3,590,474 | 3,658,847 | 3,631,031 | ||||||||||||||||||||||||
| Allowance for loan and lease losses | (65,747) | (65,355) | (30,176) | (29,149) | (43,505) | ||||||||||||||||||||||||
| Federal Reserve Bank and Federal Home Loan Bank stocks, at cost | 31,836 | 29,944 | 13,796 | 30,916 | 17,236 | ||||||||||||||||||||||||
| Accrued interest receivable | 17,545 | 16,958 | 18,687 | 20,400 | 19,722 | ||||||||||||||||||||||||
| Premises, furniture, and equipment, net | 40,361 | 38,871 | 38,671 | 45,932 | 46,360 | ||||||||||||||||||||||||
| Rental equipment, net | 216,336 | 200,837 | 211,673 | 208,537 | 184,732 | ||||||||||||||||||||||||
| Bank-owned life insurance | 91,697 | 91,081 | 90,458 | 89,827 | 89,193 | ||||||||||||||||||||||||
| Foreclosed real estate and repossessed assets | 6,784 | 7,249 | 1,328 | 29,494 | 29,514 | ||||||||||||||||||||||||
| Goodwill | 309,505 | 309,505 | 309,505 | 309,505 | 307,941 | ||||||||||||||||||||||||
| Intangible assets | 43,974 | 46,766 | 50,151 | 52,810 | 56,153 | ||||||||||||||||||||||||
| Prepaid assets | 6,806 | 9,727 | 14,813 | 9,476 | 22,023 | ||||||||||||||||||||||||
| Deferred taxes | 15,944 | 20,887 | 19,752 | 18,884 | 21,630 | ||||||||||||||||||||||||
| Other assets | 104,877 | 85,652 | 97,499 | 54,832 | 52,831 | ||||||||||||||||||||||||
| Total assets | $ | 8,779,026 | $ | 5,843,865 | $ | 6,180,926 | 6,182,890 | $ | 6,101,072 | ||||||||||||||||||||
| LIABILITIES AND STOCKHOLDERS’ EQUITY | |||||||||||||||||||||||||||||
| LIABILITIES | |||||||||||||||||||||||||||||
| Deposits held for sale | $ | — | $ | — | $ | 288,975 | $ | — | $ | — | |||||||||||||||||||
| Deposits: | |||||||||||||||||||||||||||||
| Noninterest-bearing checking | 6,537,809 | 2,900,484 | 2,927,967 | 2,358,010 | 2,751,931 | ||||||||||||||||||||||||
| Interest-bearing checking | 187,003 | 152,504 | 67,642 | 185,768 | 157,802 | ||||||||||||||||||||||||
| Savings deposits | 55,896 | 37,615 | 17,436 | 49,773 | 52,179 | ||||||||||||||||||||||||
| Money market deposits | 40,811 | 37,266 | 42,286 | 76,911 | 68,604 | ||||||||||||||||||||||||
| Time certificates of deposit | 25,000 | 25,492 | 23,454 | 109,275 | 116,698 | ||||||||||||||||||||||||
| Wholesale deposits | 743,806 | 809,043 | 1,438,820 | 1,557,268 | 1,628,000 | ||||||||||||||||||||||||
| Total deposits | 7,590,325 | 3,962,404 | 4,517,605 | 4,337,005 | 4,775,214 | ||||||||||||||||||||||||
| Short-term borrowings | — | 717,000 | 194,000 | 646,019 | 146,613 | ||||||||||||||||||||||||
| Long-term borrowings | 209,781 | 211,353 | 213,070 | 215,838 | 209,765 | ||||||||||||||||||||||||
| Accrued interest payable | 4,332 | 3,607 | 6,620 | 9,414 | 12,350 | ||||||||||||||||||||||||
| Accrued expenses and other liabilities | 144,679 | 144,427 | 123,588 | 130,656 | 134,229 | ||||||||||||||||||||||||
| Total liabilities | 7,949,117 | 5,038,791 | 5,343,858 | 5,338,932 | 5,278,171 | ||||||||||||||||||||||||
| STOCKHOLDERS’ EQUITY | |||||||||||||||||||||||||||||
| Preferred stock | — | — | — | — | — | ||||||||||||||||||||||||
| Common stock, $.01 par value | 346 | 346 | 372 | 378 | 379 | ||||||||||||||||||||||||
| Common stock, Nonvoting, $.01 par value | — | — | — | — | — | ||||||||||||||||||||||||
| Additional paid-in capital | 592,693 | 590,682 | 587,678 | 580,826 | 578,715 | ||||||||||||||||||||||||
| Retained earnings | 228,500 | 212,027 | 244,005 | 252,813 | 238,004 | ||||||||||||||||||||||||
| Accumulated other comprehensive income | 7,995 | 1,654 | 3,895 | 6,339 | 2,308 | ||||||||||||||||||||||||
| Treasury stock, at cost | (3,412) | (3,397) | (3,187) | (445) | (13) | ||||||||||||||||||||||||
| Total equity attributable to parent | 826,122 | 801,312 | 832,763 | 839,911 | 819,393 | ||||||||||||||||||||||||
| Noncontrolling interest | 3,787 | 3,762 | 4,305 | 4,047 | 3,508 | ||||||||||||||||||||||||
| Total stockholders’ equity | 829,909 | 805,074 | 837,068 | 843,958 | 822,901 | ||||||||||||||||||||||||
| Total liabilities and stockholders’ equity | $ | 8,779,026 | $ | 5,843,865 | $ | 6,180,926 | $ | 6,182,890 | $ | 6,101,072 | |||||||||||||||||||
11
Consolidated Statements of Operations (Unaudited)
(Dollars in Thousands, Except Share and Per Share Data)
| Three Months Ended | Nine Months Ended | ||||||||||||||||||||||||||||
| June 30, 2020 | March 31, 2020 | June 30, 2019 | June 30, 2020 | June 30, 2019 | |||||||||||||||||||||||||
| Interest and dividend income: | |||||||||||||||||||||||||||||
| Loans and leases, including fees | $ | 59,911 | $ | 70,493 | $ | 69,732 | $ | 199,107 | $ | 203,900 | |||||||||||||||||||
| Mortgage-backed securities | 2,269 | 2,493 | 3,063 | 7,151 | 8,622 | ||||||||||||||||||||||||
| Other investments | 5,226 | 6,417 | 8,837 | 18,176 | 32,380 | ||||||||||||||||||||||||
| 67,406 | 79,403 | 81,632 | 224,434 | 244,902 | |||||||||||||||||||||||||
| Interest expense: | |||||||||||||||||||||||||||||
| Deposits | 3,130 | 8,242 | 10,395 | 20,712 | 35,731 | ||||||||||||||||||||||||
| FHLB advances and other borrowings | 2,139 | 3,424 | 4,269 | 9,197 | 10,581 | ||||||||||||||||||||||||
| 5,269 | 11,666 | 14,664 | 29,909 | 46,312 | |||||||||||||||||||||||||
| Net interest income | 62,137 | 67,737 | 66,968 | 194,525 | 198,590 | ||||||||||||||||||||||||
| Provision for loan for lease losses | 15,093 | 37,296 | 9,112 | 55,796 | 51,529 | ||||||||||||||||||||||||
| Net interest income after provision for loan and lease losses | 47,044 | 30,441 | 57,856 | 138,729 | 147,061 | ||||||||||||||||||||||||
| Noninterest income: | |||||||||||||||||||||||||||||
| Refund transfer product fees | 4,595 | 28,939 | 6,697 | 33,726 | 38,559 | ||||||||||||||||||||||||
| Tax advance product fees | 28 | 29,536 | 34 | 31,840 | 34,757 | ||||||||||||||||||||||||
| Payments card and deposit fees | 21,302 | 23,156 | 21,377 | 65,957 | 66,855 | ||||||||||||||||||||||||
| Other bank and deposit fees | 214 | 381 | 495 | 1,083 | 1,449 | ||||||||||||||||||||||||
| Rental income | 11,231 | 11,100 | 9,386 | 34,682 | 30,167 | ||||||||||||||||||||||||
| Gain on sale of securities available-for-sale, net | — | — | 440 | — | 649 | ||||||||||||||||||||||||
| Gain on divestitures | — | 19,275 | — | 19,275 | — | ||||||||||||||||||||||||
| Gain (loss) on sale of other | 1,214 | 2,325 | 2,620 | 969 | 6,117 | ||||||||||||||||||||||||
| Other income | 2,464 | 5,801 | 2,741 | 11,512 | 8,012 | ||||||||||||||||||||||||
| Total noninterest income | 41,048 | 120,513 | 43,790 | 199,044 | 186,565 | ||||||||||||||||||||||||
| Noninterest expense: | |||||||||||||||||||||||||||||
| Compensation and benefits | 32,102 | 34,260 | 35,176 | 100,631 | 117,350 | ||||||||||||||||||||||||
| Refund transfer product expense | (139) | 7,449 | 287 | 7,482 | 7,478 | ||||||||||||||||||||||||
| Tax advance product expense | (11) | 1,698 | 425 | 2,820 | 3,101 | ||||||||||||||||||||||||
| Card processing | 7,128 | 6,696 | 4,613 | 19,432 | 18,670 | ||||||||||||||||||||||||
| Occupancy and equipment expense | 6,502 | 7,013 | 7,136 | 20,169 | 20,806 | ||||||||||||||||||||||||
| Operating lease equipment depreciation | 8,536 | 8,421 | 6,029 | 25,237 | 18,280 | ||||||||||||||||||||||||
| Legal and consulting | 4,660 | 5,909 | 4,065 | 15,242 | 12,341 | ||||||||||||||||||||||||
| Intangible amortization | 2,636 | 3,402 | 4,374 | 8,714 | 14,352 | ||||||||||||||||||||||||
| Impairment expense | — | 507 | — | 750 | 9,660 | ||||||||||||||||||||||||
| Other expense | 9,827 | 16,374 | 10,363 | 38,291 | 34,978 | ||||||||||||||||||||||||
| Total noninterest expense | 71,241 | 91,729 | 72,468 | 238,768 | 257,016 | ||||||||||||||||||||||||
| Income before income tax expense | 16,851 | 59,225 | 29,178 | 99,005 | 76,610 | ||||||||||||||||||||||||
| Income tax expense (benefit) | (2,426) | 5,617 | (1,158) | 3,870 | (3,244) | ||||||||||||||||||||||||
| Net income before noncontrolling interest | 19,277 | 53,608 | 30,336 | 95,135 | 79,854 | ||||||||||||||||||||||||
| Net income attributable to noncontrolling interest | 1,087 | 1,304 | 1,045 | 3,573 | 3,045 | ||||||||||||||||||||||||
| Net income attributable to parent | $ | 18,190 | $ | 52,304 | $ | 29,291 | $ | 91,562 | $ | 76,809 | |||||||||||||||||||
| Earnings per common share | |||||||||||||||||||||||||||||
| Basic | $ | 0.53 | $ | 1.45 | $ | 0.75 | $ | 2.54 | $ | 1.96 | |||||||||||||||||||
| Diluted | $ | 0.53 | $ | 1.45 | $ | 0.75 | $ | 2.54 | $ | 1.95 | |||||||||||||||||||
| Shares used in computing earnings per share | |||||||||||||||||||||||||||||
| Basic | 34,616,038 | 35,948,799 | 38,903,266 | 36,004,877 | 39,220,793 | ||||||||||||||||||||||||
| Diluted | 34,623,114 | 35,970,296 | 38,977,690 | 36,016,037 | 39,289,011 | ||||||||||||||||||||||||
12
Average Balances, Interest Rates and Yields
The following table presents, for the periods indicated, the total dollar amount of interest income from average interest-earning assets and the resulting yields, as well as the interest expense on average interest-bearing liabilities, expressed both in dollars and in rates. Only the yield/rate reflects tax-equivalent adjustments. Non-accruing loans and leases have been included in the table as loans carrying a zero yield.
| Three Months Ended June 30, | 2020 | 2019 | |||||||||||||||||||||||||||||||||
| (Dollars in Thousands) | Average Outstanding Balance | Interest Earned / Paid | Yield / Rate(1) | Average Outstanding Balance | Interest Earned / Paid | Yield / Rate(1) | |||||||||||||||||||||||||||||
| Interest-earning assets: | |||||||||||||||||||||||||||||||||||
| Cash and fed funds sold | $ | 2,692,270 | $ | 783 | 0.12 | % | $ | 80,100 | $ | 521 | 2.61 | % | |||||||||||||||||||||||
| Mortgage-backed securities | 342,174 | 2,269 | 2.67 | % | 421,725 | 3,063 | 2.91 | % | |||||||||||||||||||||||||||
| Tax exempt investment securities | 417,042 | 1,658 | 2.02 | % | 690,732 | 4,058 | 2.98 | % | |||||||||||||||||||||||||||
| Asset-backed securities | 336,562 | 1,770 | 2.11 | % | 307,581 | 2,701 | 3.52 | % | |||||||||||||||||||||||||||
| Other investment securities | 197,643 | 1,014 | 2.06 | % | 199,681 | 1,557 | 3.13 | % | |||||||||||||||||||||||||||
| Total investments | 1,293,420 | 6,711 | 2.22 | % | 1,619,719 | 11,379 | 3.09 | % | |||||||||||||||||||||||||||
| Commercial finance loans and leases | 2,160,175 | 40,375 | 7.52 | % | 1,775,905 | 44,332 | 10.01 | % | |||||||||||||||||||||||||||
| Consumer finance loans | 247,824 | 4,635 | 7.52 | % | 364,633 | 8,178 | 9.00 | % | |||||||||||||||||||||||||||
| Tax services loans | 39,845 | — | — | % | 45,142 | — | — | % | |||||||||||||||||||||||||||
| Warehouse finance loans | 304,839 | 4,582 | 6.05 | % | 223,546 | 3,491 | 6.26 | % | |||||||||||||||||||||||||||
| National lending loans and leases | 2,752,683 | 49,592 | 7.25 | % | 2,409,226 | 56,001 | 9.32 | % | |||||||||||||||||||||||||||
| Community banking loans | 870,245 | 10,319 | 4.77 | % | 1,189,912 | 13,731 | 4.63 | % | |||||||||||||||||||||||||||
| Total loans and leases | 3,622,928 | 59,911 | 6.65 | % | 3,599,138 | 69,732 | 7.77 | % | |||||||||||||||||||||||||||
| Total interest-earning assets | $ | 7,608,618 | $ | 67,406 | 3.59 | % | $ | 5,298,957 | $ | 81,632 | 6.26 | % | |||||||||||||||||||||||
| Non-interest-earning assets | 830,589 | 820,474 | |||||||||||||||||||||||||||||||||
| Total assets | $ | 8,439,206 | $ | 6,119,431 | |||||||||||||||||||||||||||||||
| Interest-bearing liabilities: | |||||||||||||||||||||||||||||||||||
Interest-bearing checking(2) | $ | 226,382 | $ | — | — | % | $ | 137,950 | $ | 85 | 0.25 | % | |||||||||||||||||||||||
| Savings | 55,572 | 1 | 0.01 | % | 54,247 | 9 | 0.07 | % | |||||||||||||||||||||||||||
| Money markets | 40,091 | 33 | 0.33 | % | 58,782 | 107 | 0.73 | % | |||||||||||||||||||||||||||
| Time deposits | 25,392 | 113 | 1.78 | % | 128,165 | 633 | 1.98 | % | |||||||||||||||||||||||||||
| Wholesale deposits | 817,414 | 2,983 | 1.47 | % | 1,521,594 | 9,561 | 2.52 | % | |||||||||||||||||||||||||||
| Total interest-bearing deposits | 1,164,852 | 3,130 | 1.08 | % | 1,900,738 | 10,395 | 2.19 | % | |||||||||||||||||||||||||||
| Overnight fed funds purchased | 59,055 | 48 | 0.33 | % | 363,857 | 2,368 | 2.61 | % | |||||||||||||||||||||||||||
| FHLB advances | 110,000 | 670 | 2.45 | % | 54,341 | 324 | 2.39 | % | |||||||||||||||||||||||||||
| Subordinated debentures | 73,738 | 1,153 | 6.29 | % | 73,583 | 1,163 | 6.34 | % | |||||||||||||||||||||||||||
| Other borrowings | 27,032 | 268 | 3.98 | % | 40,653 | 414 | 4.08 | % | |||||||||||||||||||||||||||
| Total borrowings | 269,825 | 2,139 | 3.19 | % | 532,434 | 4,269 | 3.22 | % | |||||||||||||||||||||||||||
| Total interest-bearing liabilities | 1,434,677 | 5,269 | 1.48 | % | 2,443,172 | 14,664 | 2.42 | % | |||||||||||||||||||||||||||
| Noninterest-bearing deposits | 6,057,314 | — | — | % | 2,710,288 | — | — | % | |||||||||||||||||||||||||||
| Total deposits and interest-bearing liabilities | $ | 7,491,991 | $ | 5,269 | 0.28 | % | $ | 5,143,460 | $ | 14,664 | 1.14 | % | |||||||||||||||||||||||
| Other noninterest-bearing liabilities | 122,940 | 149,207 | |||||||||||||||||||||||||||||||||
| Total liabilities | 7,614,931 | 5,292,667 | |||||||||||||||||||||||||||||||||
| Shareholders' equity | 824,276 | 826,764 | |||||||||||||||||||||||||||||||||
| Total liabilities and shareholders' equity | $ | 8,439,206 | $ | 6,119,431 | |||||||||||||||||||||||||||||||
| Net interest income and net interest rate spread including noninterest-bearing deposits | $ | 62,137 | 3.30 | % | $ | 66,968 | 5.12 | % | |||||||||||||||||||||||||||
| Net interest margin | 3.28 | % | 5.07 | % | |||||||||||||||||||||||||||||||
| Tax-equivalent effect | 0.02 | % | 0.08 | % | |||||||||||||||||||||||||||||||
Net interest margin, tax-equivalent(3) | 3.31 | % | 5.15 | % | |||||||||||||||||||||||||||||||
(1) Tax rate used to arrive at the TEY for the three months ended June 30, 2020 and 2019 was 21%.
(2) Of the total balance, $226.1 million are interest-bearing deposits where interest expense is paid by a third party and not by the Company.
(3) Net interest margin expressed on a fully-taxable-equivalent basis ("net interest margin, tax-equivalent") is a non-GAAP financial measure. The tax-equivalent adjustment to net interest income recognizes the estimated income tax savings when comparing taxable and tax-exempt assets and adjusting for federal and state exemption of interest income. The Company believes that it is a standard practice in the banking industry to present net interest margin expressed on a fully taxable equivalent basis and, accordingly, believes the presentation of this non-GAAP financial measure may be useful for peer comparison purposes.
13
Selected Financial Information
| As of and For the Three Months Ended | June 30, 2020 | March 31, 2020 | December 31, 2019 | September 30, 2019 | June 30, 2019 | ||||||||||||||||||||||||
| Equity to total assets | 9.45 | % | 13.78 | % | 13.54 | % | 13.65 | % | 13.49 | % | |||||||||||||||||||
| Book value per common share outstanding | $ | 23.96 | $ | 23.26 | $ | 22.52 | $ | 22.32 | $ | 21.72 | |||||||||||||||||||
| Tangible book value per common share outstanding | $ | 13.76 | $ | 12.97 | $ | 12.84 | $ | 12.74 | $ | 12.11 | |||||||||||||||||||
| Tangible book value per common share outstanding excluding AOCI | $ | 13.53 | $ | 12.92 | $ | 12.74 | $ | 12.57 | $ | 12.05 | |||||||||||||||||||
| Common shares outstanding | 34,631,160 | 34,607,962 | 37,172,081 | 37,807,064 | 37,878,205 | ||||||||||||||||||||||||
| Non-performing assets to total assets | 0.64 | % | 0.67 | % | 0.48 | % | 0.91 | % | 0.84 | % | |||||||||||||||||||
| Non-performing loans and leases to total loans and leases | 1.10 | % | 0.87 | % | 0.62 | % | 0.70 | % | 0.57 | % | |||||||||||||||||||
| Net interest margin | 3.28 | % | 4.78 | % | 4.94 | % | 4.95 | % | 5.07 | % | |||||||||||||||||||
| Net interest margin, tax-equivalent | 3.31 | % | 4.82 | % | 4.99 | % | 5.00 | % | 5.15 | % | |||||||||||||||||||
| Return on average assets | 0.86 | % | 3.16 | % | 1.38 | % | 1.32 | % | 1.91 | % | |||||||||||||||||||
| Return on average equity | 8.83 | % | 25.15 | % | 10.04 | % | 9.69 | % | 14.17 | % | |||||||||||||||||||
| Full-time equivalent employees | 999 | 992 | 1,088 | 1,186 | 1,218 | ||||||||||||||||||||||||
Quarterly Amortization of Intangibles Expense
| (Dollars in Thousands) | Actual | Anticipated | |||||||||||||||||||||||||||
| For the Three Months Ended | Jun 30, 2020 | Sep 30, 2020 | Dec 31, 2020 | Mar 31, 2021 | Jun 30, 2021 | Sep 30, 2021 | Dec 31, 2021 | Mar 31, 2022 | Jun 30, 2022 | ||||||||||||||||||||
Amortization of intangibles(1) | $ | 2,636 | $ | 2,265 | $ | 2,013 | $ | 2,757 | $ | 2,013 | $ | 1,761 | $ | 1,488 | $ | 2,170 | $ | 1,176 | |||||||||||
(1) These amounts are based upon the current reporting period’s intangible assets only. This table makes no assumption for expenses related to future acquired intangible assets.
14
About Meta Financial Group®
Meta Financial Group, Inc.® (Nasdaq: CASH) is a South Dakota-based financial holding company. Meta Financial Group’s banking subsidiary, MetaBank®, N.A., (“Meta”), is a leader in providing innovative financial solutions to consumers and businesses in under-served niche markets and believes in financial inclusion for all. Meta’s commercial lending division works with high-value niche industries, rapid-growth companies and technology adopters to grow their businesses and build more profitable customer relationships nationwide. Meta is one of the largest issuers of prepaid cards in the U.S., having issued more than a billion cards in partnership with banks, program managers, payments providers and other businesses, and offers a total payments services solution that includes ACH origination, wire transfers, and more. For more information, visit the Meta Financial Group website.
Investor Relations Contact: | |||||
Brittany Kelley Elsasser | |||||
Director of Investor Relations | |||||
605-362-2423 | |||||
| [email protected] | |||||
Media Relations: | |||||
| [email protected] | |||||
15
Quarterly Investor Update Third Quarter Fiscal Year 2020
Forward-Looking Statements This investor update contains “forward-looking statements” which are made in good faith by the Company pursuant to the “safe harbor” provisions of the Private Securities Litigation Reform Act of 1995. You can identify forward-looking statements by words such as “may,” “hope,” “will,” “should,” “expect,” “plan,” “anticipate,” “intend,” “believe,” “estimate,” “predict,” “potential,” “continue,” “could,” “future,” or the negative of those terms, or other words of similar meaning or similar expressions. These forward-looking statements are based on information currently available to us and assumptions about future events, and include statements with respect to the Company’s beliefs, expectations, estimates, and intentions, which are subject to significant risks and uncertainties, and are subject to change based on various factors, some of which are beyond the Company’s control. Factors that could cause the Company's financial performance and results of operations to differ materially from the expectations, estimates, and intentions expressed in such forward-looking statements include, among others: maintaining our executive management team; expected growth opportunities may not be realized or may take longer to realize than expected; the potential adverse effects of the ongoing COVID-19 pandemic and any governmental or societal responses thereto, or other unusual and infrequently occurring events; actual changes in interest rates and the Fed Funds rate; additional changes in tax laws; the strength of the United States' economy, in general, and the strength of the local economies in which the Company conducts operations; changes in, trade, monetary, and fiscal policies and laws, including interest rate policies of the Federal Reserve); inflation, market, and monetary fluctuations; the timely and efficient development of, and acceptance of, new products and services offered by the Company or its strategic partners, as well as risks (including reputational and litigation) attendant thereto, and the perceived overall value of these products and services by users; the Company’s ability to finalize a definitive program management agreement with H&R Block and the terms thereof; the risks of dealing with or utilizing third parties, including, in connection with the Company’s refund advance business, the risk of reduced volume of refund advance loans as a result of reduced customer demand for or usage of the Company’s strategic partners’ refund advance products; our relationship with, and any actions which may be initiated by, our regulators; the impact of changes in financial services laws and regulations, including, but not limited to, laws and regulations relating to the tax refund industry and the insurance premium finance industry and recent and potential changes in response to the COVID-19 pandemic such as the CARES Act and the rules and regulations that may be promulgated thereunder; technological changes, including, but not limited to, the protection of our electronic systems and information; the impact of acquisitions and divestitures; litigation risk; the growth of the Company’s business, as well as expenses related thereto; continued maintenance by MetaBank of its status as a well-capitalized institution, particularly in light of our growing deposit base, a portion of which has been characterized as “brokered;” changes in consumer spending and saving habits; the success of the Company at maintaining its high quality asset level and managing and collecting assets of borrowers in default should problem assets increase; and the other factors described under the caption “Risk Factors” and in other sections of the Company’s Annual Report on Form 10-K for the Company's fiscal year ended September 30, 2019 and in other filings made by the Company with the Securities and Exchange Commission (“SEC”). The forward-looking statements included herein speak only as of the date of this investor update. The Company expressly disclaims any intent or obligation to update any forward-looking statements, whether written or oral, that may be made from time to time by or on behalf of the Company or its subsidiaries, whether as a result of new information, changed circumstances or future events or for any other reason. 2 Third Quarter Fiscal Year 2020 | Nasdaq: CASH
Business Developments Third Quarter Ended June 30, 2020 • Signed letter of intent with Emerald Financial Services, LLC, a wholly owned indirect subsidiary of H&R Block, to enter into a multi-year program management agreement to offer certain financial products to H&R Block clients. • Renewed and extended relationship with Blackhawk Network for 20 years. • Promoted Brett Pharr to Co-President and Chief Operating Officer of MetaBank to better align business lines with Meta’s strategic initiatives. • Meta “CARES” • Selected as the prepaid debit card issuer for Economic Impact Payments (“EIP Cards”) as Treasury’s financial agent. • Issued 3.6 million cards representing $6.42 billion in funding. • As of July 19, 2020, $2.08 billion in balances remained outstanding. • Through June 30, 2020, funded 686 loan requests totaling $215.5 million for the Paycheck Protection Program (“PPP”). 3 Third Quarter Fiscal Year 2020 | Nasdaq: CASH
Selected Financial Highlights Third Quarter Ended June 30, 2020 INCOME STATEMENT ($ in thousands, except per share data) 3Q20 2Q20 3Q19 Net interest income 62,137 67,737 66,968 Provision for loan and lease losses 15,093 37,296 9,112 Payments card & deposit fees 21,302 23,156 21,377 Total noninterest income 41,048 120,513 43,790 Total noninterest expense 71,241 91,729 72,468 Net income before taxes 16,851 59,225 29,178 Income tax expense (benefit) (2,426) 5,617 (1,158) Net income before non-controlling interest 19,277 53,608 30,336 Net income attributable to non-controlling interest 1,087 1,304 1,045 Net income attributable to parent $ 18,190 $ 52,304 $ 29,291 Earnings per share, diluted $ 0.53 $ 1.45 $ 0.75 Average diluted shares 34,623,114 35,970,296 38,977,690 BALANCE SHEET ($ in thousands) 3Q20 2Q20 3Q19 Loans and leases 3,502,646 3,618,924 3,631,031 Allowance for loan and lease losses (65,747) (65,355) (43,505) Total assets $ 8,779,026 $ 5,843,865 $ 6,101,072 Noninterest-bearing checking 6,537,809 2,900,484 2,751,931 Total deposits 7,590,325 3,962,404 4,775,214 Total liabilities 7,949,117 5,038,791 5,278,171 Total stockholders' equity 829,909 805,074 822,901 Total liabilities and stockholders equity $ 8,779,026 $ 5,843,865 $ 6,101,072 Average loans and leases 3,622,928 4,195,772 3,599,138 Average assets 8,439,206 6,610,899 6,119,431 Average payments deposits 6,317,514 3,309,899 2,733,711 4 Third Quarter Fiscal Year 2020 | Nasdaq: CASH
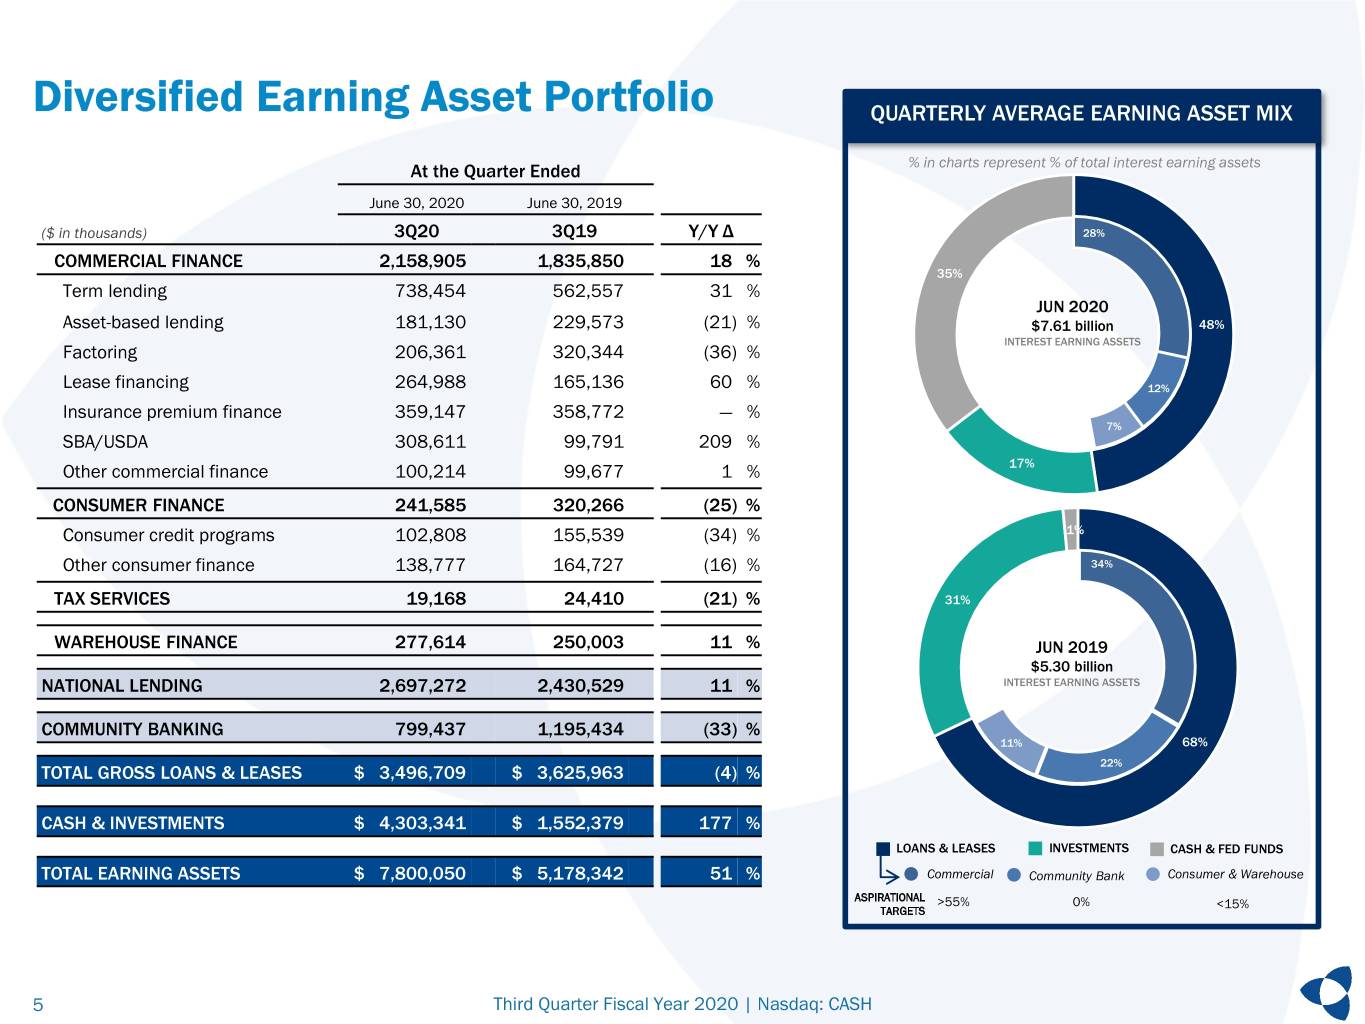
Diversified Earning Asset Portfolio QUARTERLY AVERAGE EARNING ASSET MIX At the Quarter Ended % in charts represent % of total interest earning assets June 30, 2020 June 30, 2019 ($ in thousands) 3Q20 3Q19 Y/Y Δ 28% COMMERCIAL FINANCE 2,158,905 1,835,850 18 % 35% Term lending 738,454 562,557 31 % JUN 2020 Asset-based lending 181,130 229,573 (21) % $7.61 billion 48% INTEREST EARNING ASSETS Factoring 206,361 320,344 (36) % Lease financing 264,988 165,136 60 % 12% Insurance premium finance 359,147 358,772 — % 7% SBA/USDA 308,611 99,791 209 % Other commercial finance 100,214 99,677 1 % 17% CONSUMER FINANCE 241,585 320,266 (25) % Consumer credit programs 102,808 155,539 (34) % 1% Other consumer finance 138,777 164,727 (16) % 34% TAX SERVICES 19,168 24,410 (21) % 31% WAREHOUSE FINANCE 277,614 250,003 11 % JUN 2019 $5.30 billion NATIONAL LENDING 2,697,272 2,430,529 11 % INTEREST EARNING ASSETS COMMUNITY BANKING 799,437 1,195,434 (33) % 11% 68% 22% TOTAL GROSS LOANS & LEASES $ 3,496,709 $ 3,625,963 (4) % CASH & INVESTMENTS $ 4,303,341 $ 1,552,379 177 % LOANS & LEASES INVESTMENTS CASH & FED FUNDS TOTAL EARNING ASSETS $ 7,800,050 $ 5,178,342 51 % Commercial Community Bank Consumer & Warehouse ASPIRATIONAL >55% 0% <15% TARGETS 5 Third Quarter Fiscal Year 2020 | Nasdaq: CASH
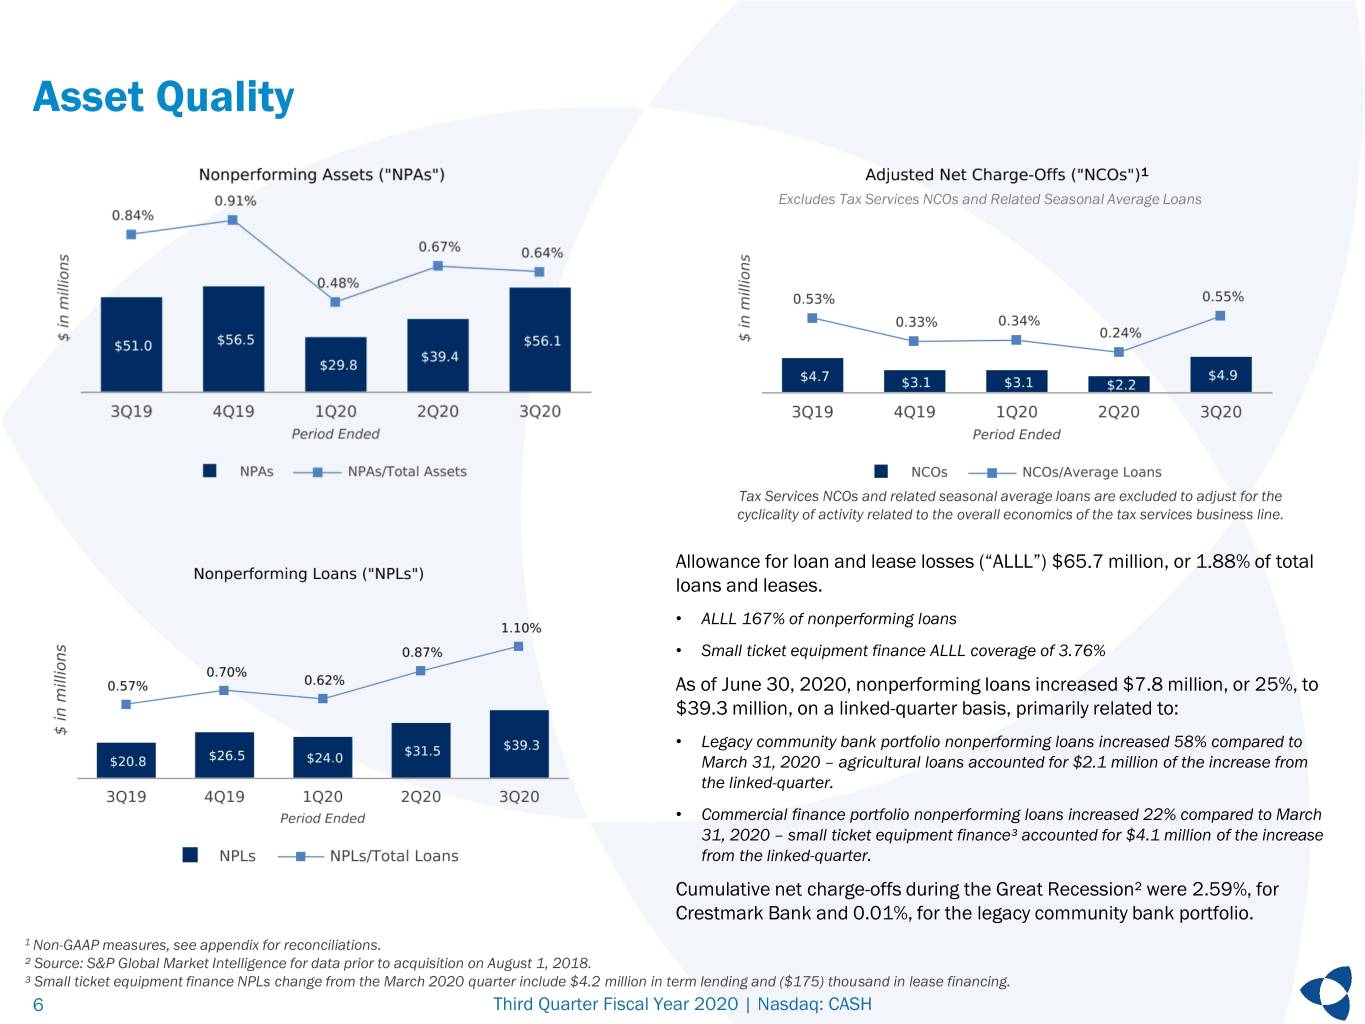
Asset Quality 1 Excludes Tax Services NCOs and Related Seasonal Average Loans Tax Services NCOs and related seasonal average loans are excluded to adjust for the cyclicality of activity related to the overall economics of the tax services business line. Allowance for loan and lease losses (“ALLL”) $65.7 million, or 1.88% of total loans and leases. • ALLL 167% of nonperforming loans • Small ticket equipment finance ALLL coverage of 3.76% As of June 30, 2020, nonperforming loans increased $7.8 million, or 25%, to $39.3 million, on a linked-quarter basis, primarily related to: • Legacy community bank portfolio nonperforming loans increased 58% compared to March 31, 2020 – agricultural loans accounted for $2.1 million of the increase from the linked-quarter. • Commercial finance portfolio nonperforming loans increased 22% compared to March 31, 2020 – small ticket equipment finance³ accounted for $4.1 million of the increase from the linked-quarter. Cumulative net charge-offs during the Great Recession² were 2.59%, for Crestmark Bank and 0.01%, for the legacy community bank portfolio. 1 Non-GAAP measures, see appendix for reconciliations. ² Source: S&P Global Market Intelligence for data prior to acquisition on August 1, 2018. ³ Small ticket equipment finance NPLs change from the March 2020 quarter include $4.2 million in term lending and ($175) thousand in lease financing. 6 Third Quarter Fiscal Year 2020 | Nasdaq: CASH
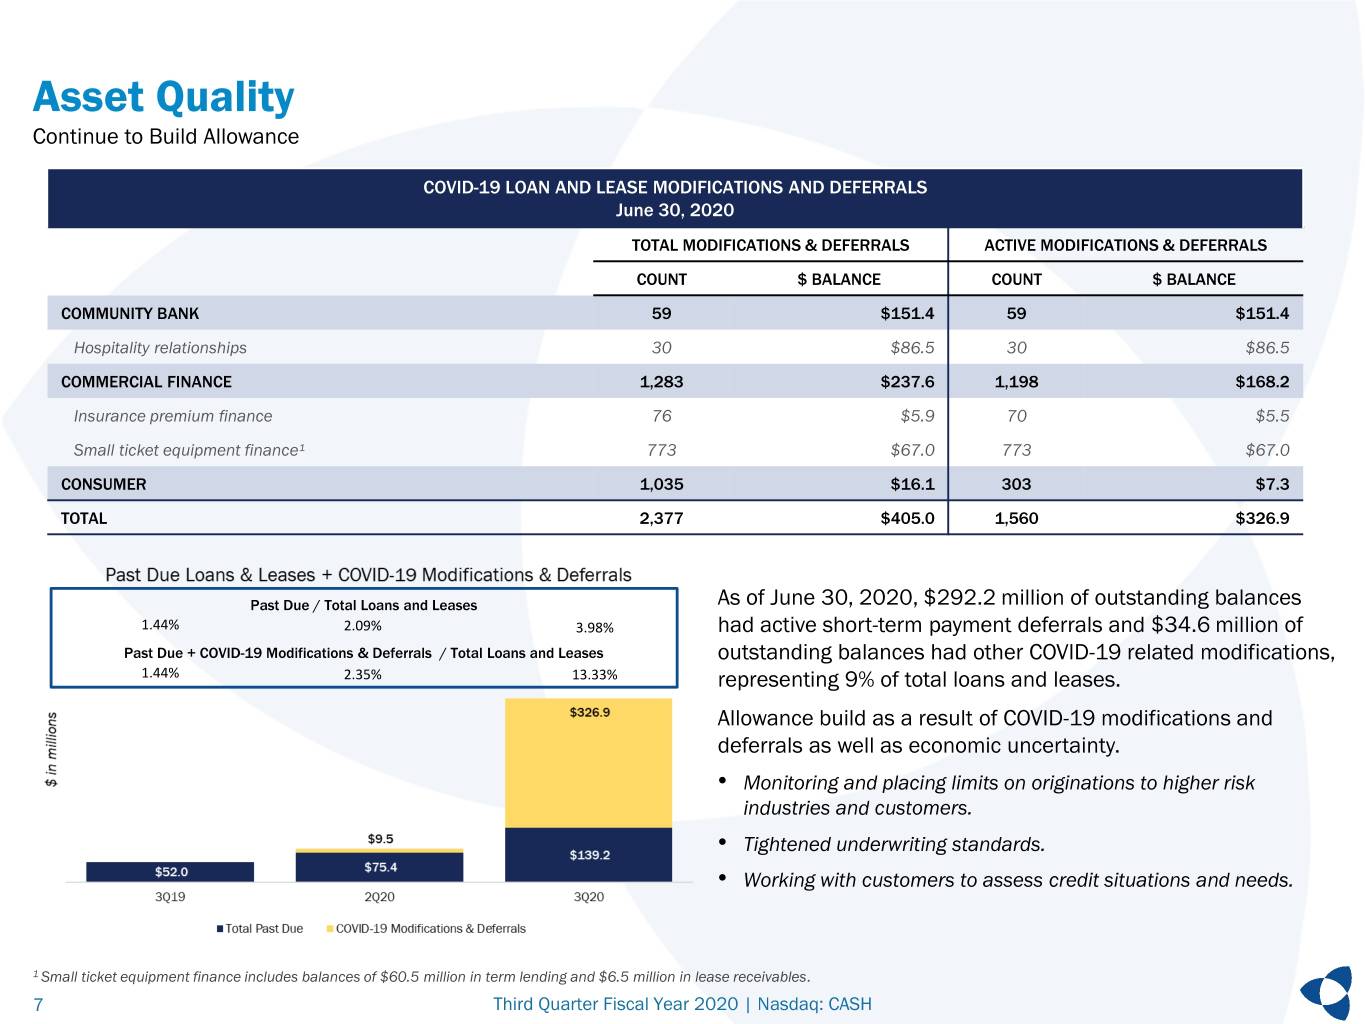
Asset Quality Continue to Build Allowance COVID-19 LOAN AND LEASE MODIFICATIONS AND DEFERRALS June 30, 2020 TOTAL MODIFICATIONS & DEFERRALS ACTIVE MODIFICATIONS & DEFERRALS COUNT $ BALANCE COUNT $ BALANCE COMMUNITY BANK 59 $151.4 59 $151.4 Hospitality relationships 30 $86.5 30 $86.5 COMMERCIAL FINANCE 1,283 $237.6 1,198 $168.2 Insurance premium finance 76 $5.9 70 $5.5 Small ticket equipment finance¹ 773 $67.0 773 $67.0 CONSUMER 1,035 $16.1 303 $7.3 TOTAL 2,377 $405.0 1,560 $326.9 Past Due / Total Loans and Leases As of June 30, 2020, $292.2 million of outstanding balances 1.44% 2.09% 3.98% had active short-term payment deferrals and $34.6 million of Past Due + COVID-19 Modifications & Deferrals / Total Loans and Leases outstanding balances had other COVID-19 related modifications, 1.44% 2.35% 13.33% representing 9% of total loans and leases. Allowance build as a result of COVID-19 modifications and deferrals as well as economic uncertainty. • Monitoring and placing limits on originations to higher risk industries and customers. • Tightened underwriting standards. • Working with customers to assess credit situations and needs. 1 Small ticket equipment finance includes balances of $60.5 million in term lending and $6.5 million in lease receivables. 7 Third Quarter Fiscal Year 2020 | Nasdaq: CASH
Commercial Finance & Community Bank Portfolios 8 Third Quarter Fiscal Year 2020 | Nasdaq: CASH
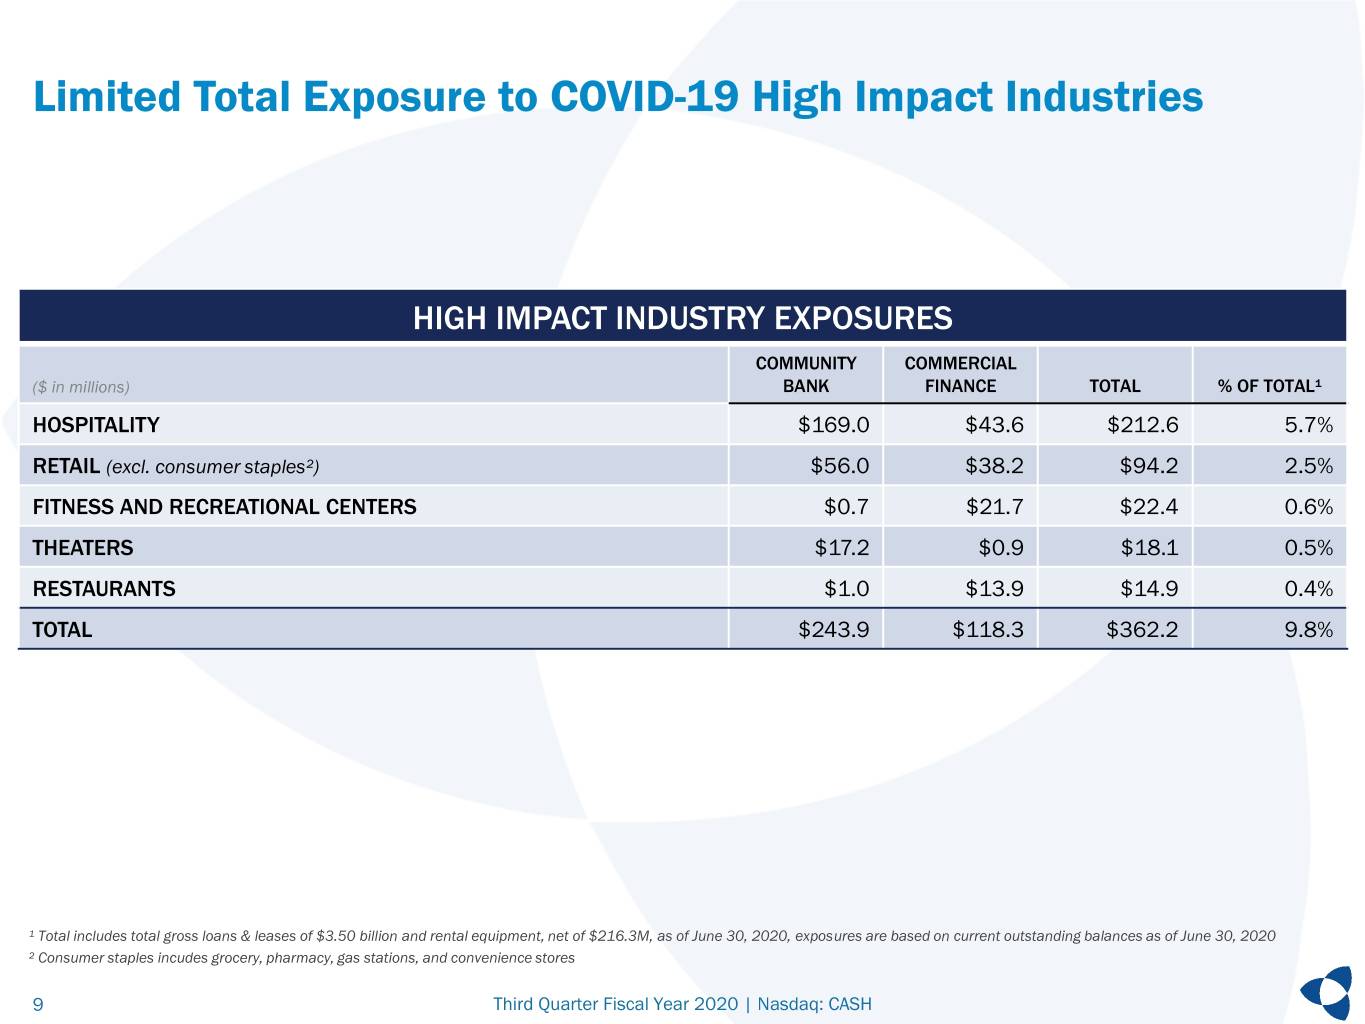
Limited Total Exposure to COVID-19 High Impact Industries HIGH IMPACT INDUSTRY EXPOSURES COMMUNITY COMMERCIAL ($ in millions) BANK FINANCE TOTAL % OF TOTAL¹ HOSPITALITY $169.0 $43.6 $212.6 5.7% RETAIL (excl. consumer staples²) $56.0 $38.2 $94.2 2.5% FITNESS AND RECREATIONAL CENTERS $0.7 $21.7 $22.4 0.6% THEATERS $17.2 $0.9 $18.1 0.5% RESTAURANTS $1.0 $13.9 $14.9 0.4% TOTAL $243.9 $118.3 $362.2 9.8% ¹ Total includes total gross loans & leases of $3.50 billion and rental equipment, net of $216.3M, as of June 30, 2020, exposures are based on current outstanding balances as of June 30, 2020 ² Consumer staples incudes grocery, pharmacy, gas stations, and convenience stores 9 Third Quarter Fiscal Year 2020 | Nasdaq: CASH
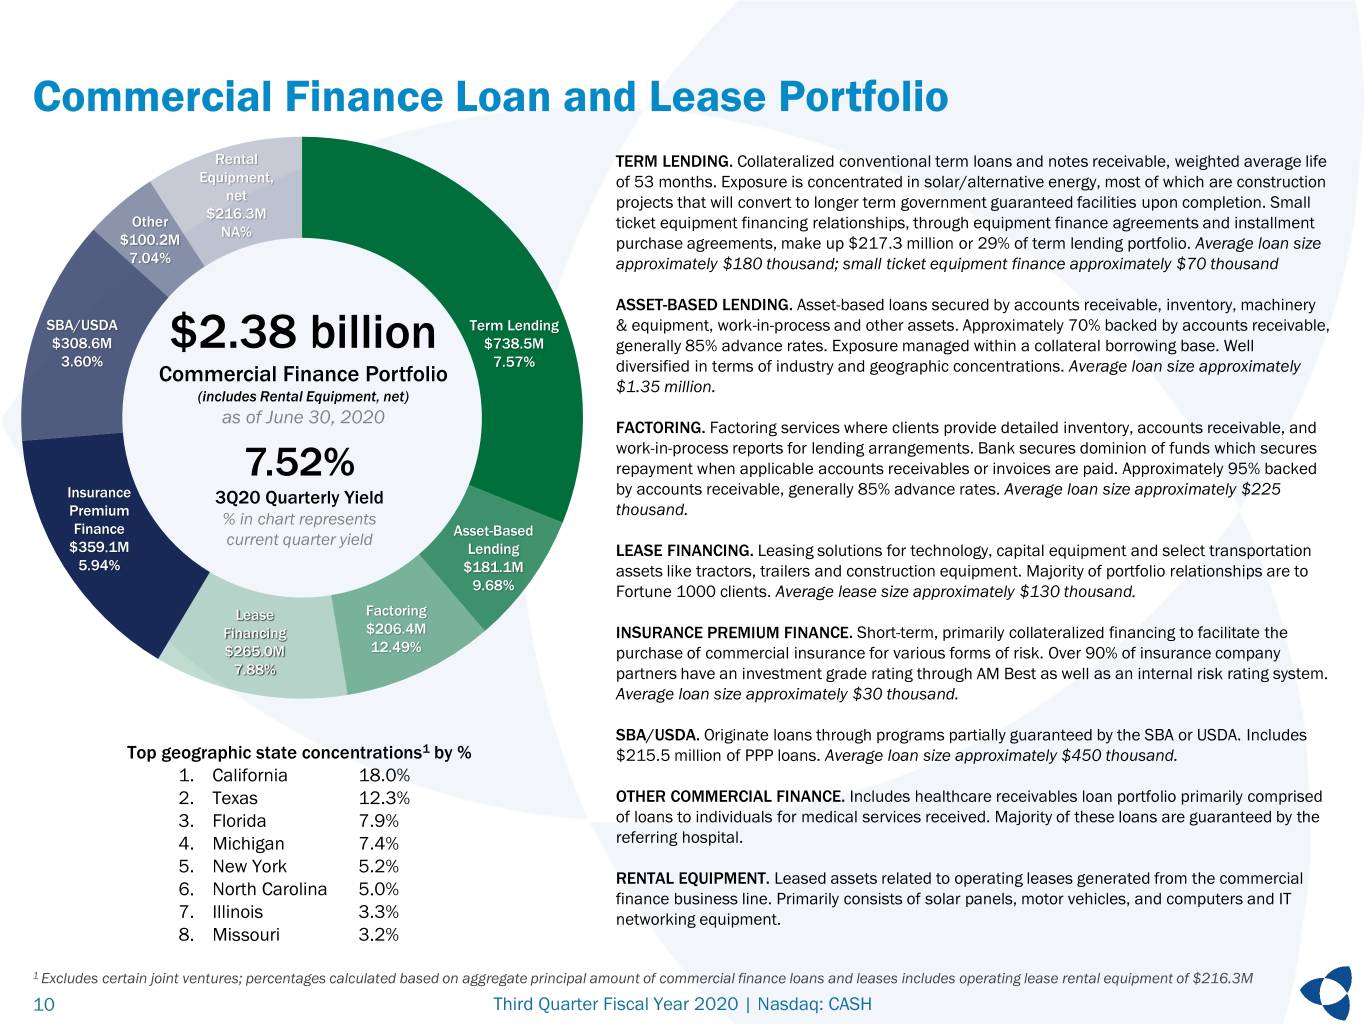
Commercial Finance Loan and Lease Portfolio Rental TERM LENDING. Collateralized conventional term loans and notes receivable, weighted average life Equipment, of 53 months. Exposure is concentrated in solar/alternative energy, most of which are construction net projects that will convert to longer term government guaranteed facilities upon completion. Small $216.3M Other ticket equipment financing relationships, through equipment finance agreements and installment NA% $100.2M purchase agreements, make up $217.3 million or 29% of term lending portfolio. Average loan size 7.04% approximately $180 thousand; small ticket equipment finance approximately $70 thousand ASSET-BASED LENDING. Asset-based loans secured by accounts receivable, inventory, machinery SBA/USDA Term Lending & equipment, work-in-process and other assets. Approximately 70% backed by accounts receivable, $308.6M $2.38 billion $738.5M generally 85% advance rates. Exposure managed within a collateral borrowing base. Well 3.60% 7.57% Commercial Finance Portfolio diversified in terms of industry and geographic concentrations. Average loan size approximately $1.35 million. (includes Rental Equipment, net) as of June 30, 2020 FACTORING. Factoring services where clients provide detailed inventory, accounts receivable, and work-in-process reports for lending arrangements. Bank secures dominion of funds which secures 7.52% repayment when applicable accounts receivables or invoices are paid. Approximately 95% backed Insurance 3Q20 Quarterly Yield by accounts receivable, generally 85% advance rates. Average loan size approximately $225 thousand. Premium % in chart represents Finance Asset-Based current quarter yield $359.1M Lending LEASE FINANCING. Leasing solutions for technology, capital equipment and select transportation 5.94% $181.1M assets like tractors, trailers and construction equipment. Majority of portfolio relationships are to 9.68% Fortune 1000 clients. Average lease size approximately $130 thousand. Lease Factoring Financing $206.4M INSURANCE PREMIUM FINANCE. Short-term, primarily collateralized financing to facilitate the $265.0M 12.49% purchase of commercial insurance for various forms of risk. Over 90% of insurance company 7.88% partners have an investment grade rating through AM Best as well as an internal risk rating system. Average loan size approximately $30 thousand. SBA/USDA. Originate loans through programs partially guaranteed by the SBA or USDA. Includes Top geographic state concentrations1 by % $215.5 million of PPP loans. Average loan size approximately $450 thousand. 1. California 18.0% 2. Texas 12.3% OTHER COMMERCIAL FINANCE. Includes healthcare receivables loan portfolio primarily comprised 3. Florida 7.9% of loans to individuals for medical services received. Majority of these loans are guaranteed by the 4. Michigan 7.4% referring hospital. 5. New York 5.2% RENTAL EQUIPMENT. Leased assets related to operating leases generated from the commercial 6. North Carolina 5.0% finance business line. Primarily consists of solar panels, motor vehicles, and computers and IT 7. Illinois 3.3% networking equipment. 8. Missouri 3.2% 1 Excludes certain joint ventures; percentages calculated based on aggregate principal amount of commercial finance loans and leases includes operating lease rental equipment of $216.3M 10 Third Quarter Fiscal Year 2020 | Nasdaq: CASH
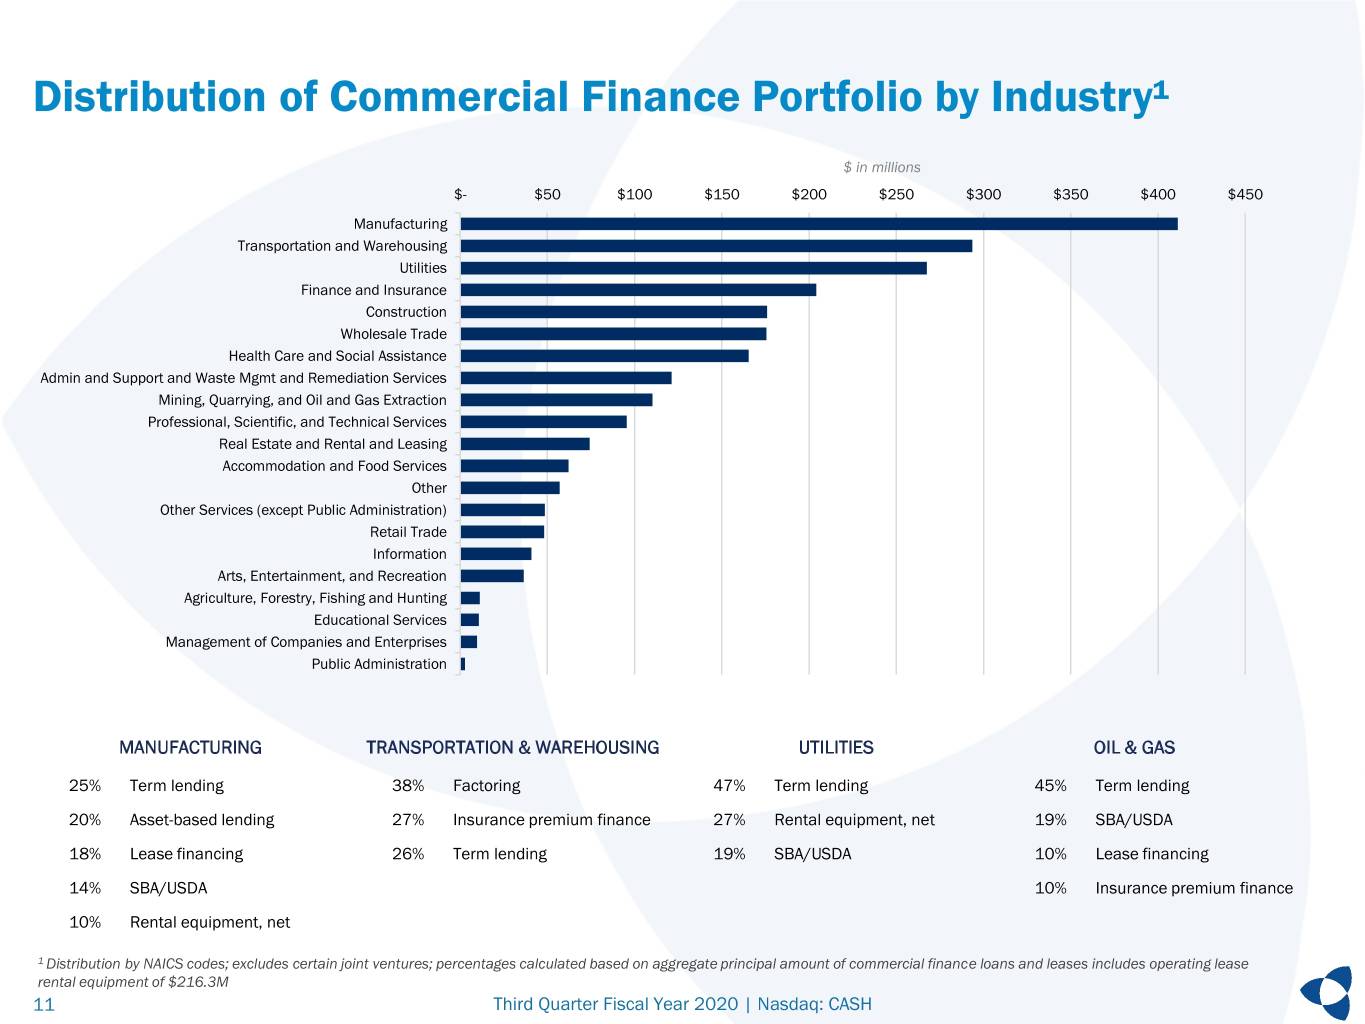
Distribution of Commercial Finance Portfolio by Industry¹ $ in millions $- $50 $100 $150 $200 $250 $300 $350 $400 $450 Manufacturing Transportation and Warehousing Utilities Finance and Insurance Construction Wholesale Trade Health Care and Social Assistance Admin and Support and Waste Mgmt and Remediation Services Mining, Quarrying, and Oil and Gas Extraction Professional, Scientific, and Technical Services Real Estate and Rental and Leasing Accommodation and Food Services Other Other Services (except Public Administration) Retail Trade Information Arts, Entertainment, and Recreation Agriculture, Forestry, Fishing and Hunting Educational Services Management of Companies and Enterprises Public Administration MANUFACTURING TRANSPORTATION & WAREHOUSING UTILITIES OIL & GAS 25% Term lending 38% Factoring 47% Term lending 45% Term lending 20% Asset-based lending 27% Insurance premium finance 27% Rental equipment, net 19% SBA/USDA 18% Lease financing 26% Term lending 19% SBA/USDA 10% Lease financing 14% SBA/USDA 10% Insurance premium finance 10% Rental equipment, net 1 Distribution by NAICS codes; excludes certain joint ventures; percentages calculated based on aggregate principal amount of commercial finance loans and leases includes operating lease rental equipment of $216.3M 11 Third Quarter Fiscal Year 2020 | Nasdaq: CASH
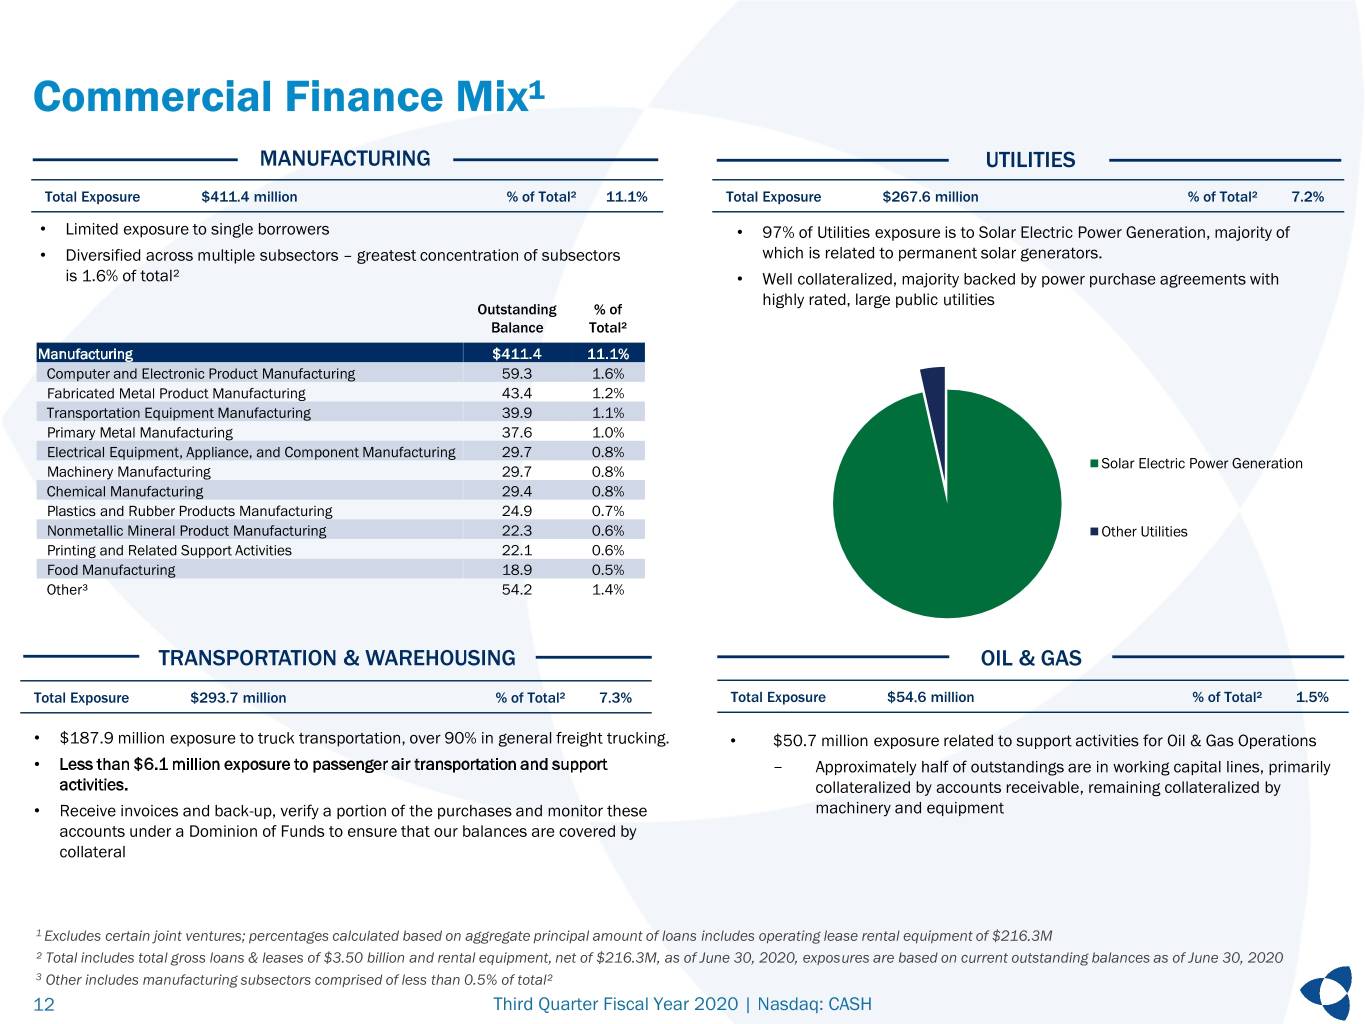
Commercial Finance Mix¹ MANUFACTURING UTILITIES Total Exposure $411.4 million % of Total² 11.1% Total Exposure $267.6 million % of Total² 7.2% • Limited exposure to single borrowers • 97% of Utilities exposure is to Solar Electric Power Generation, majority of • Diversified across multiple subsectors – greatest concentration of subsectors which is related to permanent solar generators. is 1.6% of total² • Well collateralized, majority backed by power purchase agreements with highly rated, large public utilities Outstanding % of Balance Total² Manufacturing $411.4 11.1% Computer and Electronic Product Manufacturing 59.3 1.6% Fabricated Metal Product Manufacturing 43.4 1.2% Transportation Equipment Manufacturing 39.9 1.1% Primary Metal Manufacturing 37.6 1.0% Electrical Equipment, Appliance, and Component Manufacturing 29.7 0.8% Solar Electric Power Generation Machinery Manufacturing 29.7 0.8% Chemical Manufacturing 29.4 0.8% Plastics and Rubber Products Manufacturing 24.9 0.7% Nonmetallic Mineral Product Manufacturing 22.3 0.6% Other Utilities Printing and Related Support Activities 22.1 0.6% Food Manufacturing 18.9 0.5% Other³ 54.2 1.4% TRANSPORTATION & WAREHOUSING OIL & GAS Total Exposure $293.7 million % of Total² 7.3% Total Exposure $54.6 million % of Total² 1.5% • $187.9 million exposure to truck transportation, over 90% in general freight trucking. • $50.7 million exposure related to support activities for Oil & Gas Operations • Less than $6.1 million exposure to passenger air transportation and support - Approximately half of outstandings are in working capital lines, primarily activities. collateralized by accounts receivable, remaining collateralized by • Receive invoices and back-up, verify a portion of the purchases and monitor these machinery and equipment accounts under a Dominion of Funds to ensure that our balances are covered by collateral 1 Excludes certain joint ventures; percentages calculated based on aggregate principal amount of loans includes operating lease rental equipment of $216.3M ² Total includes total gross loans & leases of $3.50 billion and rental equipment, net of $216.3M, as of June 30, 2020, exposures are based on current outstanding balances as of June 30, 2020 3 Other includes manufacturing subsectors comprised of less than 0.5% of total² 12 Third Quarter Fiscal Year 2020 | Nasdaq: CASH
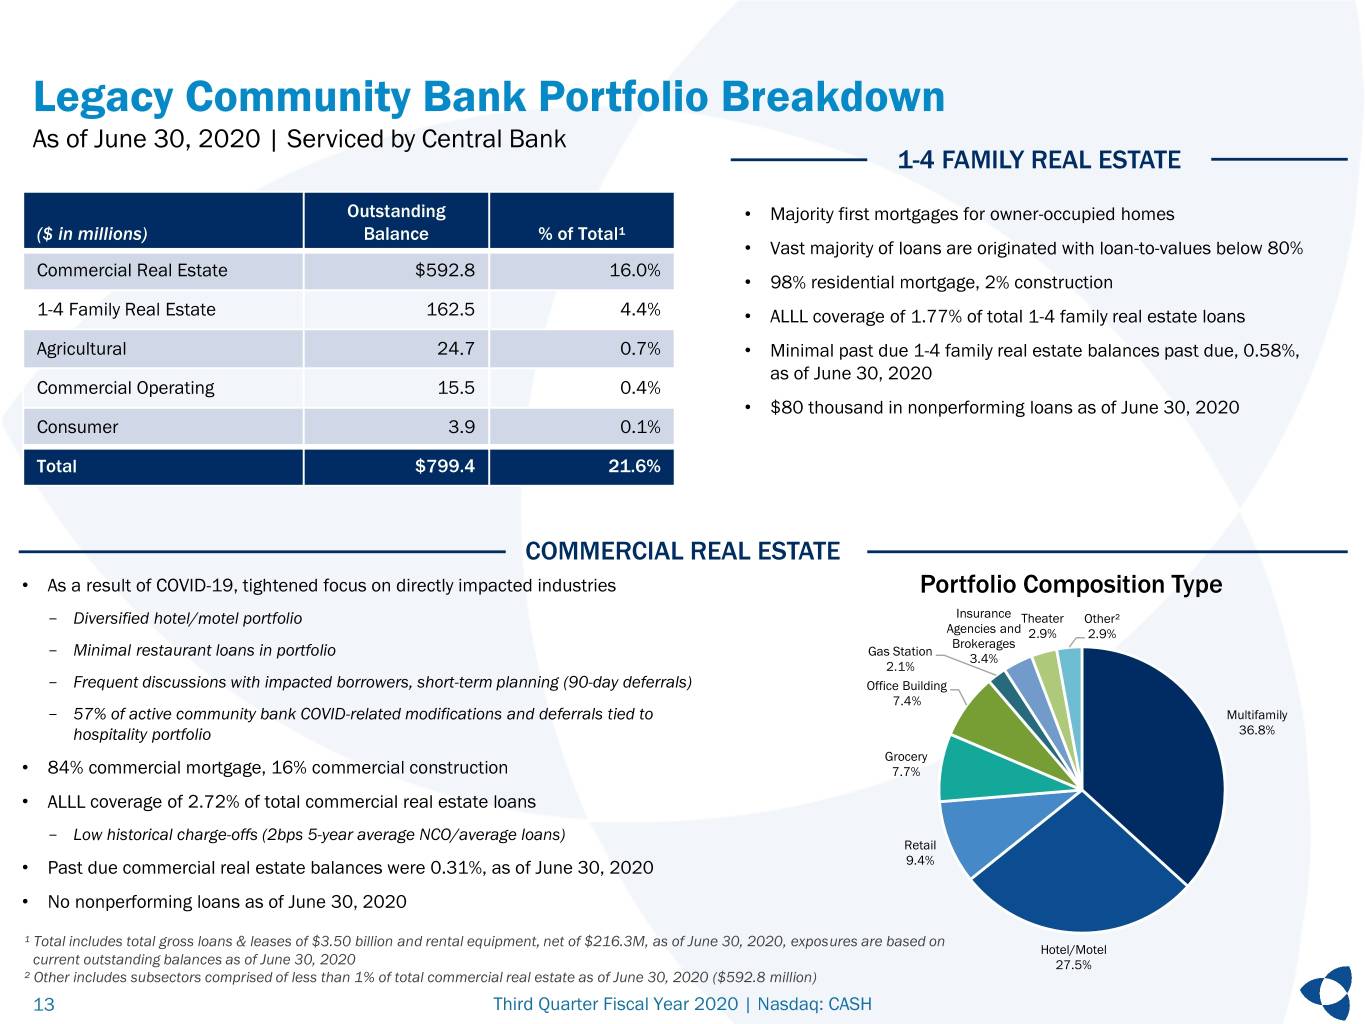
Legacy Community Bank Portfolio Breakdown As of June 30, 2020 | Serviced by Central Bank 1-4 FAMILY REAL ESTATE Outstanding • Majority first mortgages for owner-occupied homes ($ in millions) Balance % of Total¹ • Vast majority of loans are originated with loan-to-values below 80% Commercial Real Estate $592.8 16.0% • 98% residential mortgage, 2% construction 1-4 Family Real Estate 162.5 4.4% • ALLL coverage of 1.77% of total 1-4 family real estate loans Agricultural 24.7 0.7% • Minimal past due 1-4 family real estate balances past due, 0.58%, as of June 30, 2020 Commercial Operating 15.5 0.4% • $80 thousand in nonperforming loans as of June 30, 2020 Consumer 3.9 0.1% Total $799.4 21.6% COMMERCIAL REAL ESTATE • As a result of COVID-19, tightened focus on directly impacted industries Portfolio Composition Type - Diversified hotel/motel portfolio Insurance Theater Other² Agencies and 2.9% 2.9% Brokerages Gas Station - Minimal restaurant loans in portfolio 3.4% 2.1% - Frequent discussions with impacted borrowers, short-term planning (90-day deferrals) Office Building 7.4% - 57% of active community bank COVID-related modifications and deferrals tied to Multifamily hospitality portfolio 36.8% Grocery • 84% commercial mortgage, 16% commercial construction 7.7% • ALLL coverage of 2.72% of total commercial real estate loans - Low historical charge-offs (2bps 5-year average NCO/average loans) Retail • Past due commercial real estate balances were 0.31%, as of June 30, 2020 9.4% • No nonperforming loans as of June 30, 2020 ¹ Total includes total gross loans & leases of $3.50 billion and rental equipment, net of $216.3M, as of June 30, 2020, exposures are based on Hotel/Motel current outstanding balances as of June 30, 2020 27.5% ² Other includes subsectors comprised of less than 1% of total commercial real estate as of June 30, 2020 ($592.8 million) 13 Third Quarter Fiscal Year 2020 | Nasdaq: CASH
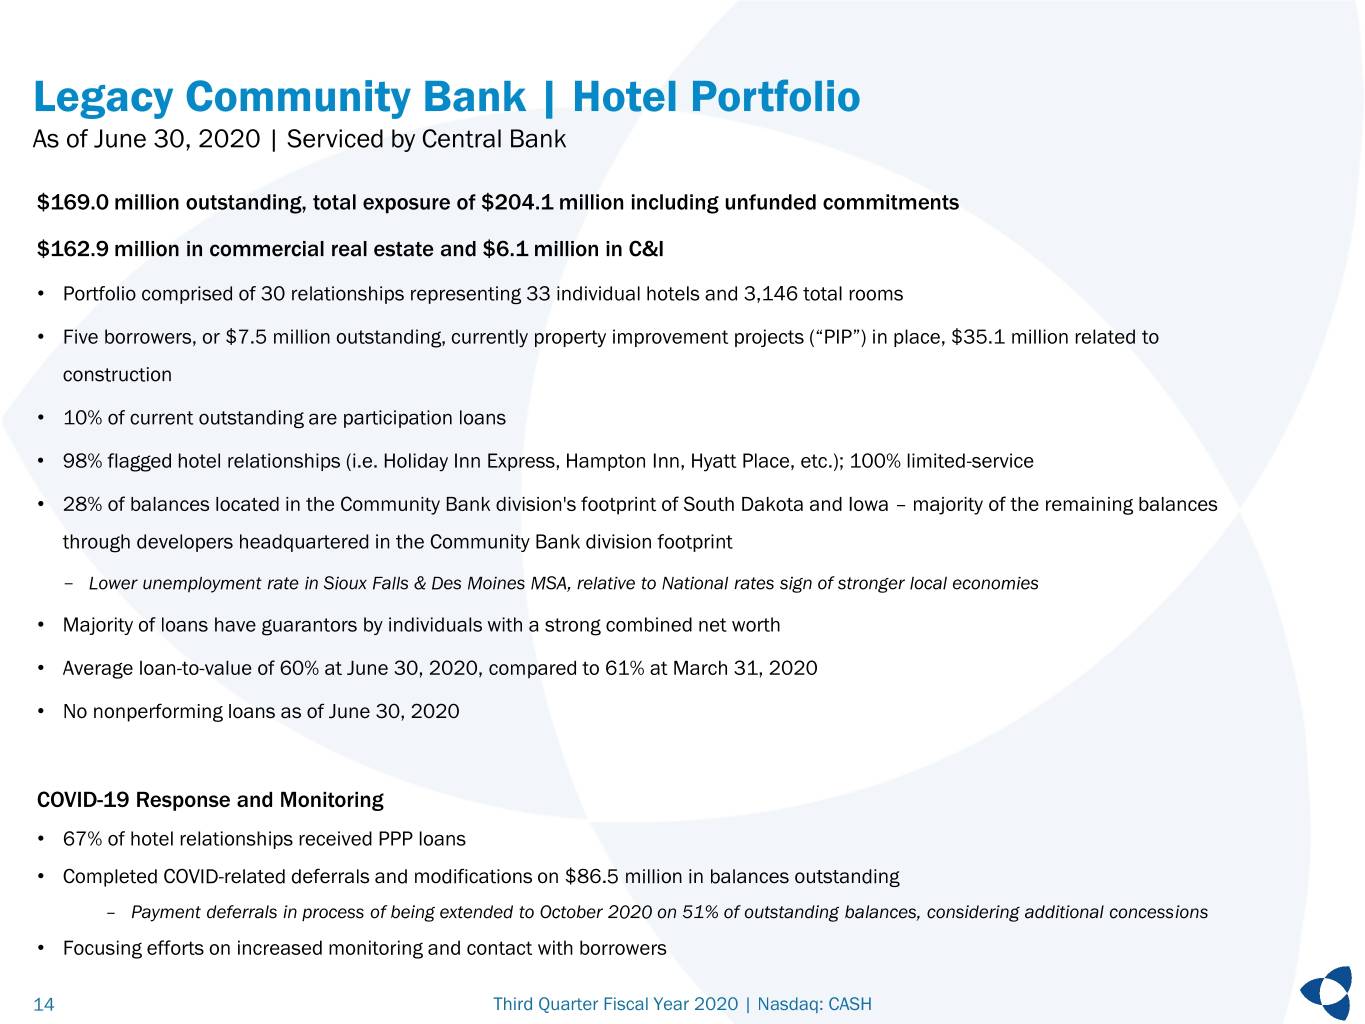
Legacy Community Bank | Hotel Portfolio As of June 30, 2020 | Serviced by Central Bank $169.0 million outstanding, total exposure of $204.1 million including unfunded commitments $162.9 million in commercial real estate and $6.1 million in C&I • Portfolio comprised of 30 relationships representing 33 individual hotels and 3,146 total rooms • Five borrowers, or $7.5 million outstanding, currently property improvement projects (“PIP”) in place, $35.1 million related to construction • 10% of current outstanding are participation loans • 98% flagged hotel relationships (i.e. Holiday Inn Express, Hampton Inn, Hyatt Place, etc.); 100% limited-service • 28% of balances located in the Community Bank division's footprint of South Dakota and Iowa – majority of the remaining balances through developers headquartered in the Community Bank division footprint - Lower unemployment rate in Sioux Falls & Des Moines MSA, relative to National rates sign of stronger local economies • Majority of loans have guarantors by individuals with a strong combined net worth • Average loan-to-value of 60% at June 30, 2020, compared to 61% at March 31, 2020 • No nonperforming loans as of June 30, 2020 COVID-19 Response and Monitoring • 67% of hotel relationships received PPP loans • Completed COVID-related deferrals and modifications on $86.5 million in balances outstanding – Payment deferrals in process of being extended to October 2020 on 51% of outstanding balances, considering additional concessions • Focusing efforts on increased monitoring and contact with borrowers 14 Third Quarter Fiscal Year 2020 | Nasdaq: CASH
Payments 15 Third Quarter Fiscal Year 2020 | Nasdaq: CASH
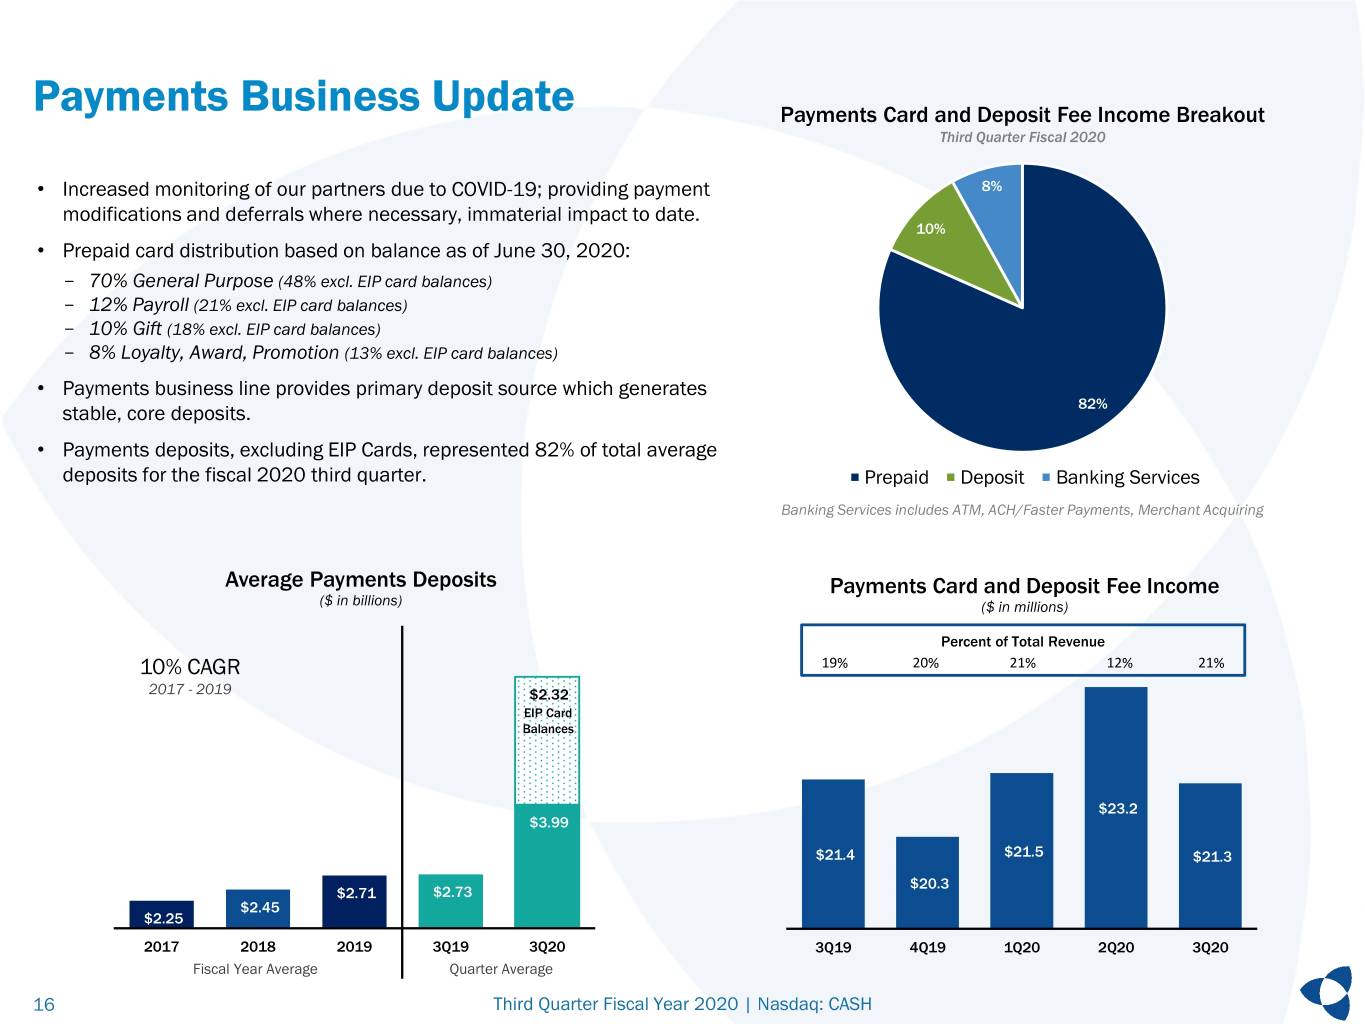
Payments Business Update Payments Card and Deposit Fee Income Breakout Third Quarter Fiscal 2020 • Increased monitoring of our partners due to COVID-19; providing payment 8% modifications and deferrals where necessary, immaterial impact to date. 10% • Prepaid card distribution based on balance as of June 30, 2020: - 70% General Purpose (48% excl. EIP card balances) - 12% Payroll (21% excl. EIP card balances) - 10% Gift (18% excl. EIP card balances) - 8% Loyalty, Award, Promotion (13% excl. EIP card balances) • Payments business line provides primary deposit source which generates stable, core deposits. 82% • Payments deposits, excluding EIP Cards, represented 82% of total average deposits for the fiscal 2020 third quarter. Prepaid Deposit Banking Services Banking Services includes ATM, ACH/Faster Payments, Merchant Acquiring Average Payments Deposits Payments Card and Deposit Fee Income ($ in billions) ($ in millions) Percent of Total Revenue 10% CAGR 19% 20% 21% 12% 21% 2017 - 2019 $2.32 EIP Card Balances $23.2 $3.99 $21.4 $21.5 $21.3 $20.3 $2.71 $2.73 $2.45 $2.25 2017 2018 2019 3Q19 3Q20 3Q19 4Q19 1Q20 2Q20 3Q20 Fiscal Year Average Quarter Average 16 Third Quarter Fiscal Year 2020 | Nasdaq: CASH
Interest Rate Risk and Capital 17 Third Quarter Fiscal Year 2020 | Nasdaq: CASH
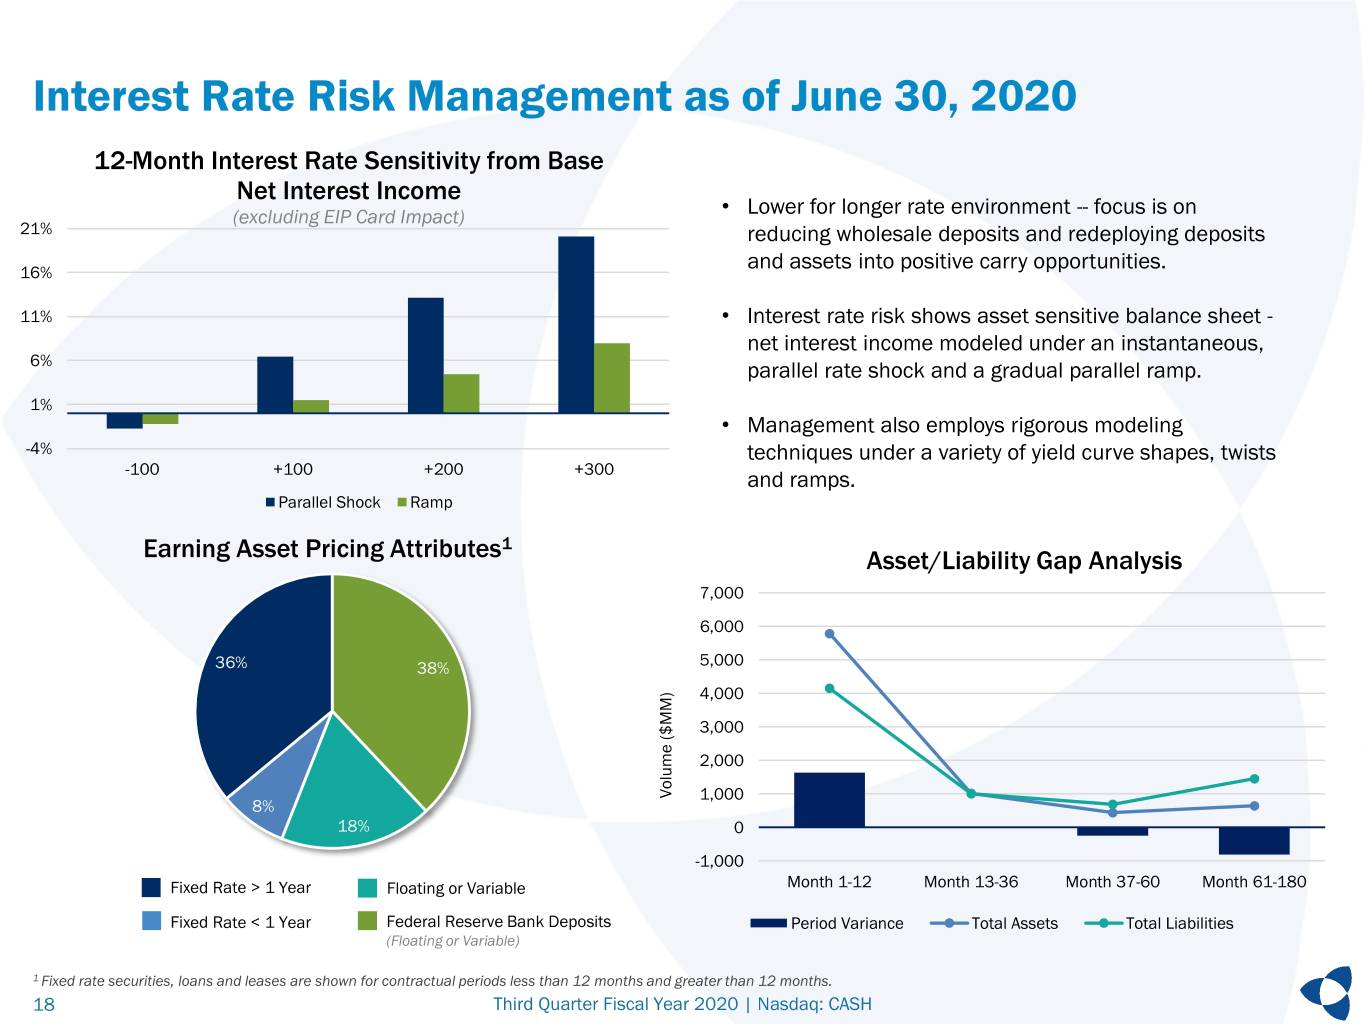
Interest Rate Risk Management as of June 30, 2020 12-Month Interest Rate Sensitivity from Base Net Interest Income (excluding EIP Card Impact) • Lower for longer rate environment -- focus is on 21% reducing wholesale deposits and redeploying deposits and assets into positive carry opportunities. 16% 11% • Interest rate risk shows asset sensitive balance sheet - net interest income modeled under an instantaneous, 6% parallel rate shock and a gradual parallel ramp. 1% • Management also employs rigorous modeling -4% techniques under a variety of yield curve shapes, twists -100 +100 +200 +300 and ramps. Parallel Shock Ramp 1 Earning Asset Pricing Attributes Asset/Liability Gap Analysis 7,000 6,000 36% 38% 5,000 4,000 3,000 2,000 Volume ($MM) Volume 1,000 8% 18% 0 -1,000 Fixed Rate > 1 Year Floating or Variable Month 1-12 Month 13-36 Month 37-60 Month 61-180 Fixed Rate < 1 Year Federal Reserve Bank Deposits Period Variance Total Assets Total Liabilities (Floating or Variable) 1 Fixed rate securities, loans and leases are shown for contractual periods less than 12 months and greater than 12 months. 18 Third Quarter Fiscal Year 2020 | Nasdaq: CASH

Strong Capital and Sources of Liquidity Regulatory Capital as of June 30, 2020 At June 30, 2020 Meta Financial Group, Inc. MetaBank Tier 1 Leverage 5.91% 6.89% Capital Ratio Trends Tier 1 Leverage – Adjusted¹ N/A 9.67% Common Equity Tier 1 11.51% 13.82% Tier 1 Capital 11.90% 13.86% Total Capital 14.99% 15.12% • MetaBank adjusted Tier 1 Leverage of 9.67% better reflects the go-forward balance sheet removing the impact from the temporary EIP Cards. • Strong capital position post-tax season, which also benefited from the gain on sale from the divesture of the community bank division. Primary & Secondary Liquidity Sources ($ in millions) Cash and Cash Equivalents $425 EIP Card Related Cash and Cash Equivalents $2,675 Unpledged Investment Securities $170 FHLB Borrowing Capacity $1,150 Funds Available through Fed Discount Window $355 PPP Loan Collateral $215 Meta Financial Group, Inc. MetaBank Unsecured Lines of Credit $1,240 - $1,510 Minimum Requirement to be Well-Capitalized under Prompt Corrective Action Provisions 1 Non-GAAP measure, see appendix for reconciliations. 19 Third Quarter Fiscal Year 2020 | Nasdaq: CASH
Appendix 20 Third Quarter Fiscal Year 2020 | Nasdaq: CASH
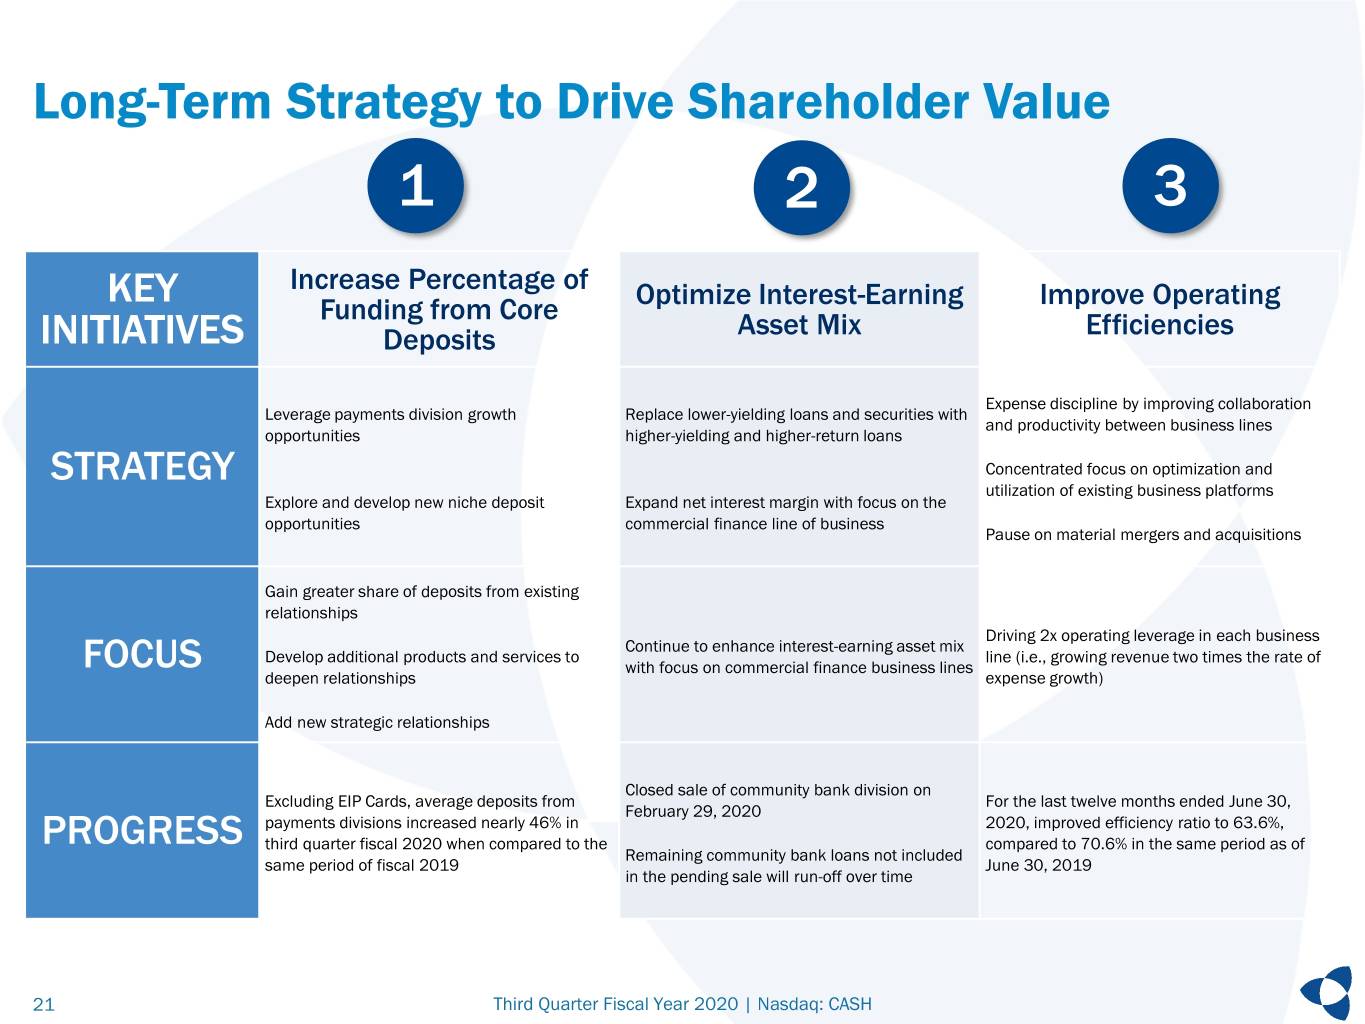
Long-Term Strategy to Drive Shareholder Value 1 2 3 KEY Increase Percentage of Optimize Interest-Earning Improve Operating Funding from Core Asset Mix Efficiencies INITIATIVES Deposits Expense discipline by improving collaboration Leverage payments division growth Replace lower-yielding loans and securities with and productivity between business lines opportunities higher-yielding and higher-return loans STRATEGY Concentrated focus on optimization and utilization of existing business platforms Explore and develop new niche deposit Expand net interest margin with focus on the opportunities commercial finance line of business Pause on material mergers and acquisitions Gain greater share of deposits from existing relationships Driving 2x operating leverage in each business Continue to enhance interest-earning asset mix Develop additional products and services to line (i.e., growing revenue two times the rate of FOCUS with focus on commercial finance business lines deepen relationships expense growth) Add new strategic relationships Closed sale of community bank division on Excluding EIP Cards, average deposits from For the last twelve months ended June 30, February 29, 2020 payments divisions increased nearly 46% in 2020, improved efficiency ratio to 63.6%, PROGRESS third quarter fiscal 2020 when compared to the compared to 70.6% in the same period as of Remaining community bank loans not included same period of fiscal 2019 June 30, 2019 in the pending sale will run-off over time 21 Third Quarter Fiscal Year 2020 | Nasdaq: CASH
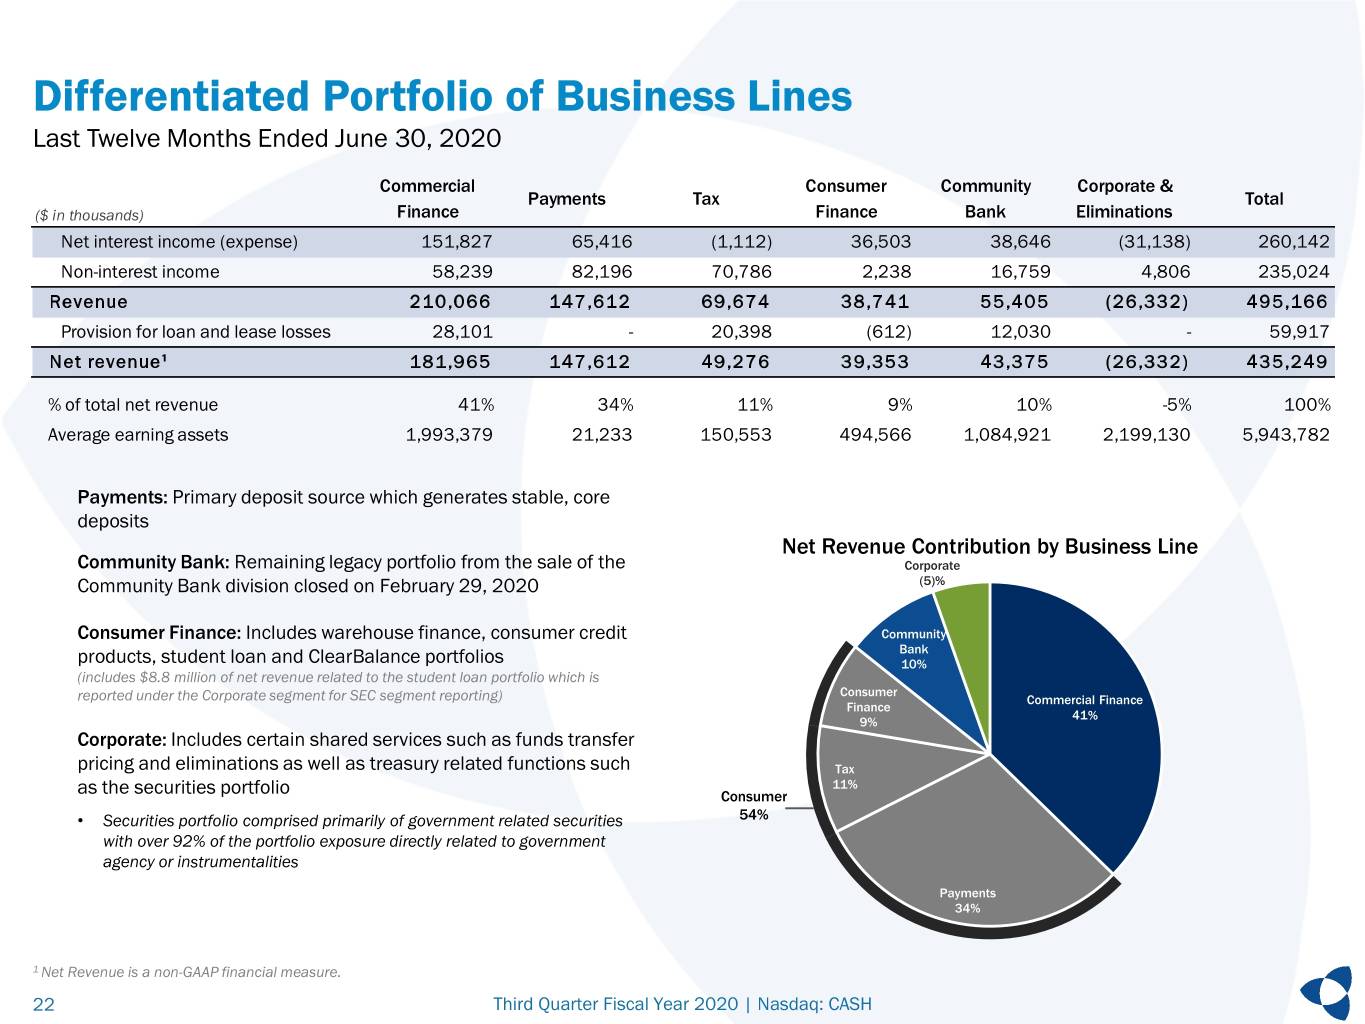
Differentiated Portfolio of Business Lines Last Twelve Months Ended June 30, 2020 Commercial Consumer Community Corporate & Payments Tax Total ($ in thousands) Finance Finance Bank Eliminations Net interest income (expense) 151,827 65,416 (1,112) 36,503 38,646 (31,138) 260,142 Non-interest income 58,239 82,196 70,786 2,238 16,759 4,806 235,024 Revenue 210,066 147,612 69,674 38,741 55,405 (26,332) 495,166 Provision for loan and lease losses 28,101 - 20,398 (612) 12,030 - 59,917 Net revenue¹ 181,965 147,612 49,276 39,353 43,375 (26,332) 435,249 % of total net revenue 41% 34% 11% 9% 10% -5% 100% Average earning assets 1,993,379 21,233 150,553 494,566 1,084,921 2,199,130 5,943,782 Payments: Primary deposit source which generates stable, core deposits Net Revenue Contribution by Business Line Community Bank: Remaining legacy portfolio from the sale of the Corporate Community Bank division closed on February 29, 2020 (5)% Consumer Finance: Includes warehouse finance, consumer credit Community Bank products, student loan and ClearBalance portfolios 10% (includes $8.8 million of net revenue related to the student loan portfolio which is Consumer reported under the Corporate segment for SEC segment reporting) Commercial Finance Finance 41% 9% Corporate: Includes certain shared services such as funds transfer pricing and eliminations as well as treasury related functions such Tax 11% as the securities portfolio Consumer • Securities portfolio comprised primarily of government related securities 54% with over 92% of the portfolio exposure directly related to government agency or instrumentalities Payments 34% 1 Net Revenue is a non-GAAP financial measure. 22 Third Quarter Fiscal Year 2020 | Nasdaq: CASH
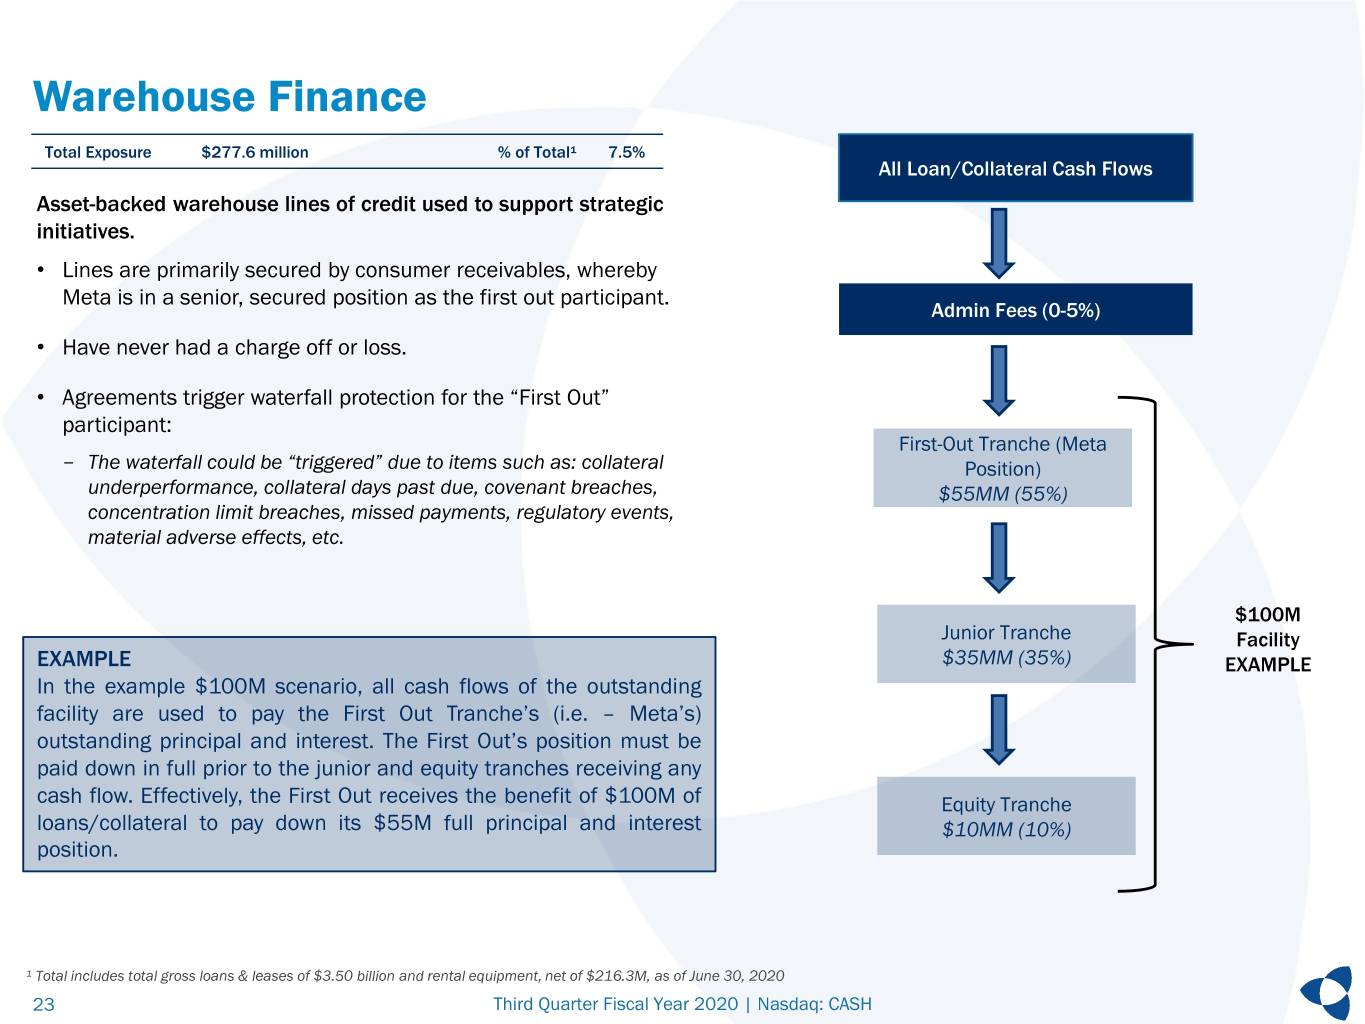
Warehouse Finance Total Exposure $277.6 million % of Total¹ 7.5% All Loan/Collateral Cash Flows Asset-backed warehouse lines of credit used to support strategic initiatives. • Lines are primarily secured by consumer receivables, whereby Meta is in a senior, secured position as the first out participant. Admin Fees (0-5%) • Have never had a charge off or loss. • Agreements trigger waterfall protection for the “First Out” participant: First-Out Tranche (Meta - The waterfall could be “triggered” due to items such as: collateral Position) underperformance, collateral days past due, covenant breaches, $55MM (55%) concentration limit breaches, missed payments, regulatory events, material adverse effects, etc. $100M Junior Tranche Facility EXAMPLE $35MM (35%) EXAMPLE In the example $100M scenario, all cash flows of the outstanding facility are used to pay the First Out Tranche’s (i.e. – Meta’s) outstanding principal and interest. The First Out’s position must be paid down in full prior to the junior and equity tranches receiving any cash flow. Effectively, the First Out receives the benefit of $100M of Equity Tranche loans/collateral to pay down its $55M full principal and interest $10MM (10%) position. ¹ Total includes total gross loans & leases of $3.50 billion and rental equipment, net of $216.3M, as of June 30, 2020 23 Third Quarter Fiscal Year 2020 | Nasdaq: CASH
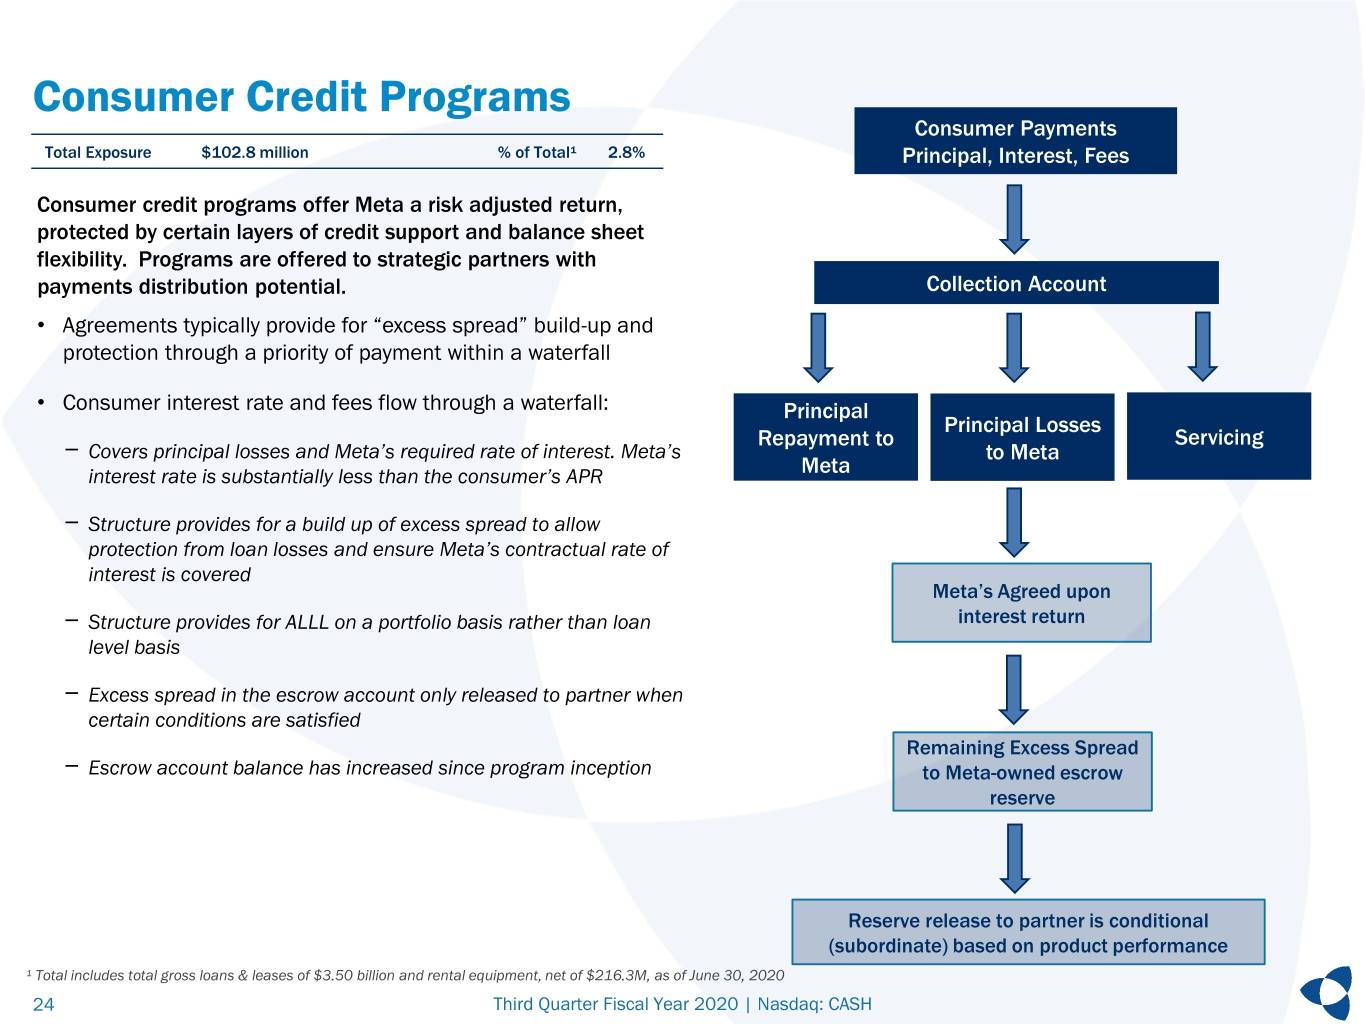
Consumer Credit Programs Consumer Payments Total Exposure $102.8 million % of Total¹ 2.8% Principal, Interest, Fees Consumer credit programs offer Meta a risk adjusted return, protected by certain layers of credit support and balance sheet flexibility. Programs are offered to strategic partners with payments distribution potential. Collection Account • Agreements typically provide for “excess spread” build-up and protection through a priority of payment within a waterfall • Consumer interest rate and fees flow through a waterfall: Principal Principal Losses Repayment to Servicing - Covers principal losses and Meta’s required rate of interest. Meta’s to Meta interest rate is substantially less than the consumer’s APR Meta - Structure provides for a build up of excess spread to allow protection from loan losses and ensure Meta’s contractual rate of interest is covered Meta’s Agreed upon - Structure provides for ALLL on a portfolio basis rather than loan interest return level basis - Excess spread in the escrow account only released to partner when certain conditions are satisfied Remaining Excess Spread - Escrow account balance has increased since program inception to Meta-owned escrow reserve Reserve release to partner is conditional (subordinate) based on product performance ¹ Total includes total gross loans & leases of $3.50 billion and rental equipment, net of $216.3M, as of June 30, 2020 24 Third Quarter Fiscal Year 2020 | Nasdaq: CASH
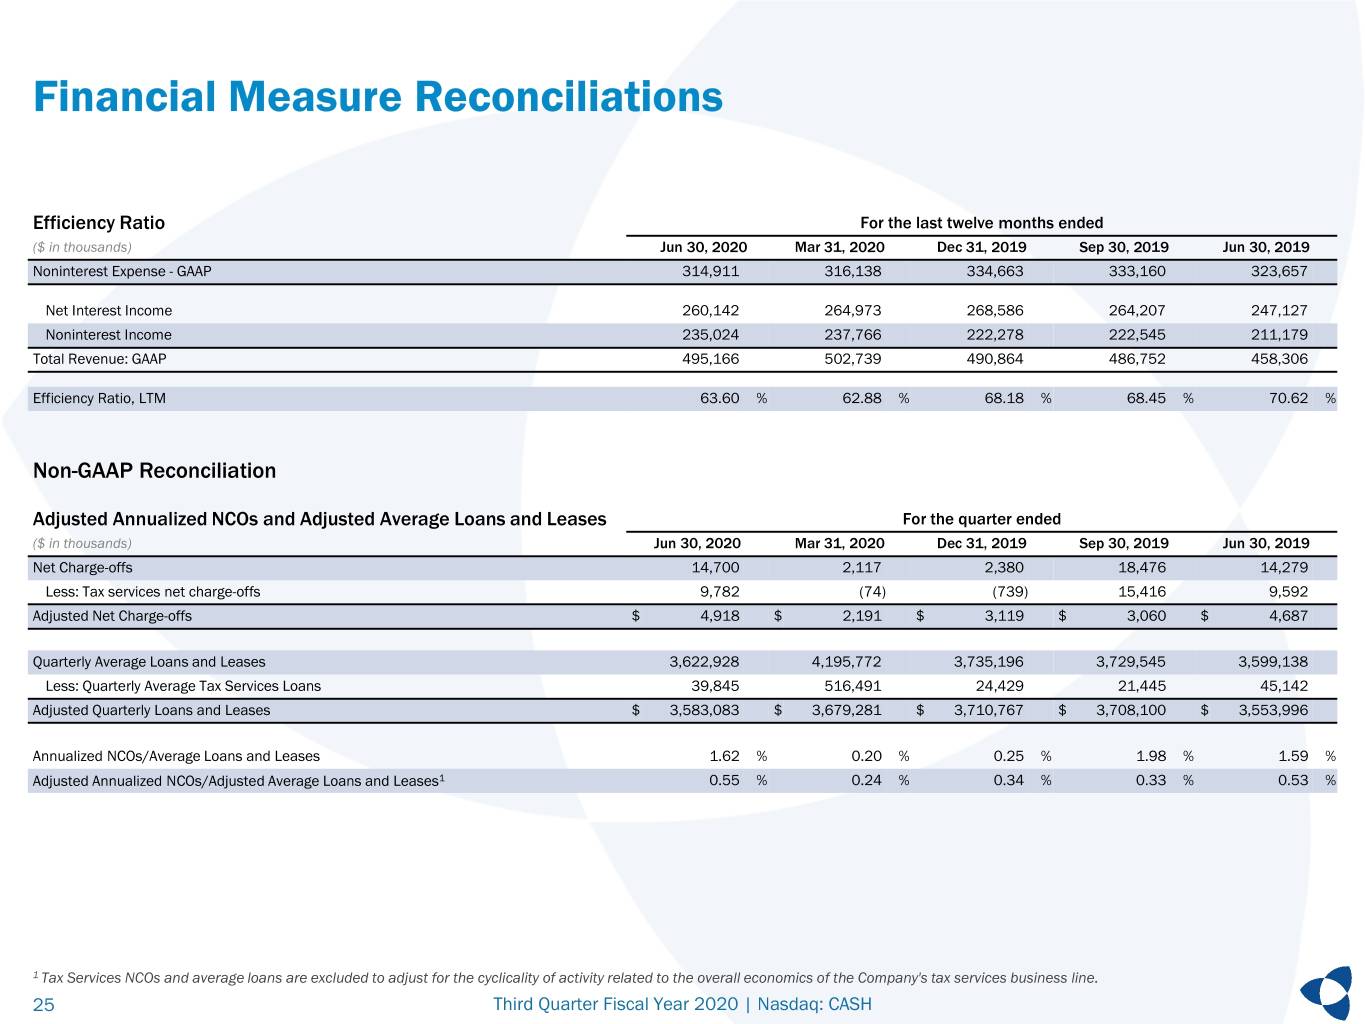
Financial Measure Reconciliations Efficiency Ratio For the last twelve months ended ($ in thousands) Jun 30, 2020 Mar 31, 2020 Dec 31, 2019 Sep 30, 2019 Jun 30, 2019 Noninterest Expense - GAAP 314,911 316,138 334,663 333,160 323,657 Net Interest Income 260,142 264,973 268,586 264,207 247,127 Noninterest Income 235,024 237,766 222,278 222,545 211,179 Total Revenue: GAAP 495,166 502,739 490,864 486,752 458,306 Efficiency Ratio, LTM 63.60 % 62.88 % 68.18 % 68.45 % 70.62 % Non-GAAP Reconciliation Adjusted Annualized NCOs and Adjusted Average Loans and Leases For the quarter ended ($ in thousands) Jun 30, 2020 Mar 31, 2020 Dec 31, 2019 Sep 30, 2019 Jun 30, 2019 Net Charge-offs 14,700 2,117 2,380 18,476 14,279 Less: Tax services net charge-offs 9,782 (74) (739) 15,416 9,592 Adjusted Net Charge-offs $ 4,918 $ 2,191 $ 3,119 $ 3,060 $ 4,687 Quarterly Average Loans and Leases 3,622,928 4,195,772 3,735,196 3,729,545 3,599,138 Less: Quarterly Average Tax Services Loans 39,845 516,491 24,429 21,445 45,142 Adjusted Quarterly Loans and Leases $ 3,583,083 $ 3,679,281 $ 3,710,767 $ 3,708,100 $ 3,553,996 Annualized NCOs/Average Loans and Leases 1.62 % 0.20 % 0.25 % 1.98 % 1.59 % Adjusted Annualized NCOs/Adjusted Average Loans and Leases1 0.55 % 0.24 % 0.34 % 0.33 % 0.53 % 1 Tax Services NCOs and average loans are excluded to adjust for the cyclicality of activity related to the overall economics of the Company's tax services business line. 25 Third Quarter Fiscal Year 2020 | Nasdaq: CASH

Non-GAAP Reconciliations MetaBank Period-end Tier 1 Leverage Adjusted Net Interest Margin Three Months Ended June 30, 2020 June 30, 2020 Total stockholder's equity $ 919,733 Average interest-earning assets 7,608,618 ADJUSTMENTS: Net interest income 62,137 LESS: Goodwill, net of associated deferred tax liabilities 302,815 Net interest margin 3.28 % LESS: Certain other intangible assets 42,865 LESS: Net deferred tax assets from operating loss and tax credit carry- ADJUSTMENTS FOR EIP CARDS forwards 10,360 Interest-earning assets 7,608,618 LESS: Net unrealized gains (losses) on available-for-sale securities 8,382 LESS: Cash adjustment 2,323,425 Common Equity Tier 1 Capital ("CET1") (1) 555,311 Adjusted average interest-earning assets 5,285,193 Tier 1 minority interest not included in common equity tier 1 capital 1,894 Total Tier 1 capital 557,205 Net Interest Income 62,137 LESS: Cash interest adjustment 578 Total Assets (Quarter Average) $ 8,446,393 Adjusted net interest income 61,559 ADD: Available for sale securities amortized cost (8,420) Adjusted net interest margin 4.68 % ADD: Deferred tax 2,104 LESS: Deductions from CET1 356,040 Adjusted total assets $ 8,084,037 MetaBank Regulatory Tier 1 Leverage 6.89 % Total Adjusted Assets (Quarter Average) $ 8,084,037 LESS: EIP Card Related Assets (Cash) 2,323,425 Adjusted total assets $ 5,760,612 MetaBank Adjusted Tier 1 Leverage 9.67 % 26 Third Quarter Fiscal Year 2020 | Nasdaq: CASH