
CBSH 8-K
Commerce Bancshares Inc /Mo/ (CBSH)
8-K
2020-04-28
For: 2020-04-28
View Original
Added on
April 11, 2026
UNITED STATES
SECURITIES AND EXCHANGE COMMISSION
Washington, D.C. 20549
__________________________
Form 8-K
CURRENT REPORT
PURSUANT TO SECTION 13 OR 15(d) OF THE
SECURITIES EXCHANGE ACT OF 1934
Date of Report (Date of earliest event reported): April 28, 2020
(Exact name of registrant as specified in its charter)
| (State of Incorporation) | (Commission File Number) | (IRS Employer Identification No.) | ||||||||||||
| (Address of principal executive offices) | (Zip Code) | ||||||||||
(816 ) 234-2000
(Registrant’s telephone number, including area code)
Check the appropriate box below if the Form 8-K filing is intended to simultaneously satisfy the filing obligation of the registrant under any of the following provisions:
| Securities registered pursuant to Section 12(b) of the Act: | ||||||||
| Title of class | Trading symbol(s) | Name of exchange on which registered | ||||||
Indicate by check mark whether the registrant is an emerging growth company as defined in Rule 405 of the Securities Act of 1933 or Rule 12b-2 of the Securities Exchange Act of 1934.
Emerging growth company ☐
If an emerging growth company, indicate by check mark if the registrant has elected not to use the extended transition period for complying with any new or revised financial accounting standards provided pursuant to Section 13(a) of the Exchange Act. ☐
Item 2.02 Results of Operations and Financial Condition
A copy of the press release issued April 28, 2020 by Commerce Bancshares, Inc. announcing First Quarter 2020 earnings is furnished under Item 2.02 of this Current Report on Form 8-K as Exhibit 99.1. Additionally, a slide presentation for investors and analysts is being furnished as Exhibit 99.2 to this Current Report on Form 8-K.
The information in this Current Report on Form 8-K, including the exhibits, is furnished pursuant to Item 2.02 and shall not be deemed “filed” for the purposes of Section 18 of the Securities Exchange Act of 1934, as amended, or otherwise subject to the liabilities under that Section. Furthermore, the information in this Current Report on Form 8-K, including the exhibit, shall not be deemed to be incorporated by reference into the filings of Commerce Bancshares, Inc. under the Securities Act of 1933, as amended.
All information included in this Current Report on Form 8-K is available on the Company’s Internet site at http://www.commercebank.com.
Item 9.01 Financial Statements and Exhibits
Exhibits
104 The XBRL tags on the cover page of this Form 8-K are embedded within the Inline XBRL document.
SIGNATURE
Pursuant to the requirements of the Securities Exchange Act of 1934, the Registrant has duly caused this report to be signed on its behalf by the undersigned hereunto duly authorized.
| COMMERCE BANCSHARES, INC. | |||||||||||
| By: | /s/ Paul A. Steiner | ||||||||||
| Paul A. Steiner | |||||||||||
Controller (Chief Accounting Officer) | |||||||||||
Date: April 28, 2020
Exhibit 99.1
Exhibit 99.1
 | CBSH | ||||
| 1000 Walnut Street / Suite 700 / Kansas City, Missouri 64106 / 816.234.2000 | |||||
 | |||||
FOR IMMEDIATE RELEASE:
Tuesday, April 28, 2020
COMMERCE BANCSHARES, INC. REPORTS
FIRST QUARTER EARNINGS PER SHARE OF $.44
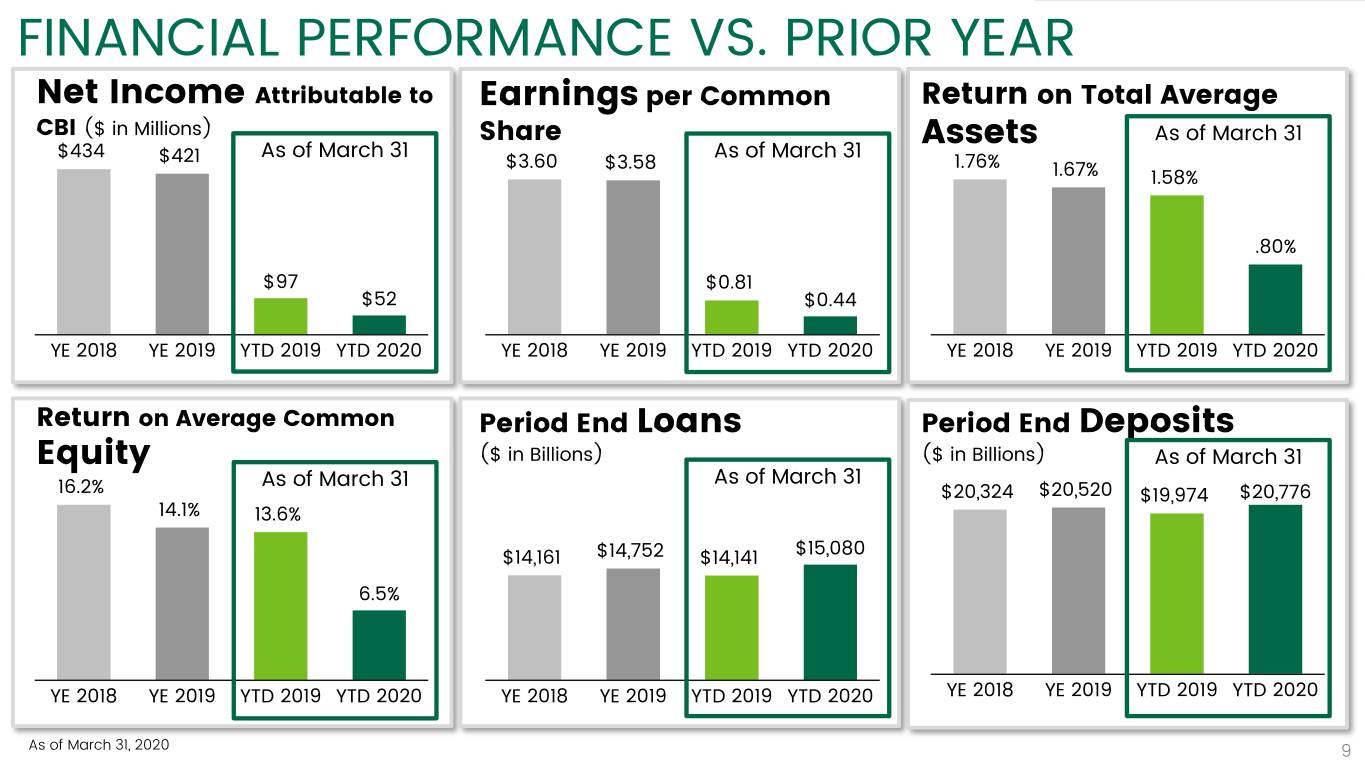
Commerce Bancshares, Inc. announced earnings of $.44 per common share for the three months ended March 31, 2020, compared to $.81 per share in the same quarter last year and $.93 per share in the fourth quarter of 2019. Net income attributable to Commerce Bancshares, Inc. for the first quarter of 2020 amounted to $51.9 million, compared to $97.1 million in the first quarter of 2019 and $106.9 million in the prior quarter. For the current quarter, the return on average assets was .80%, the return on average common equity was 6.48% and the efficiency ratio was 59.2%.
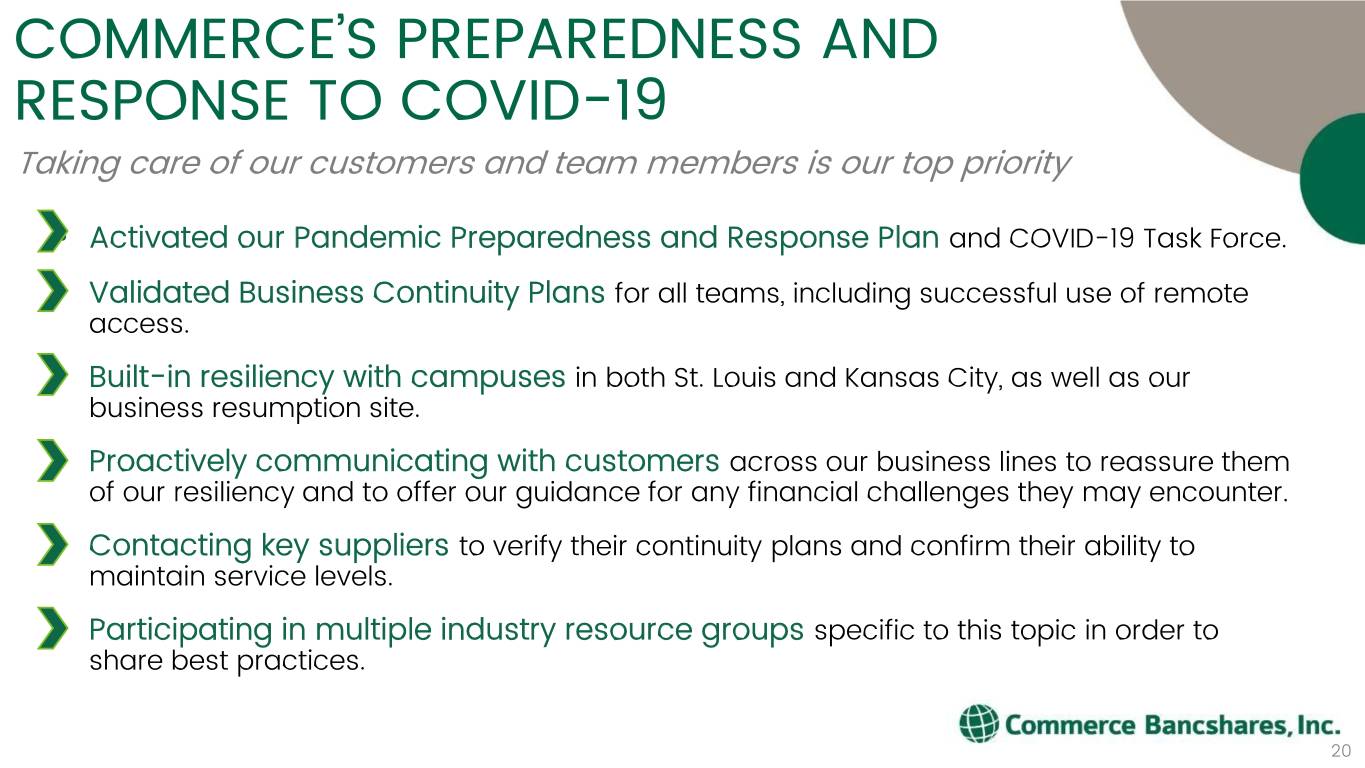
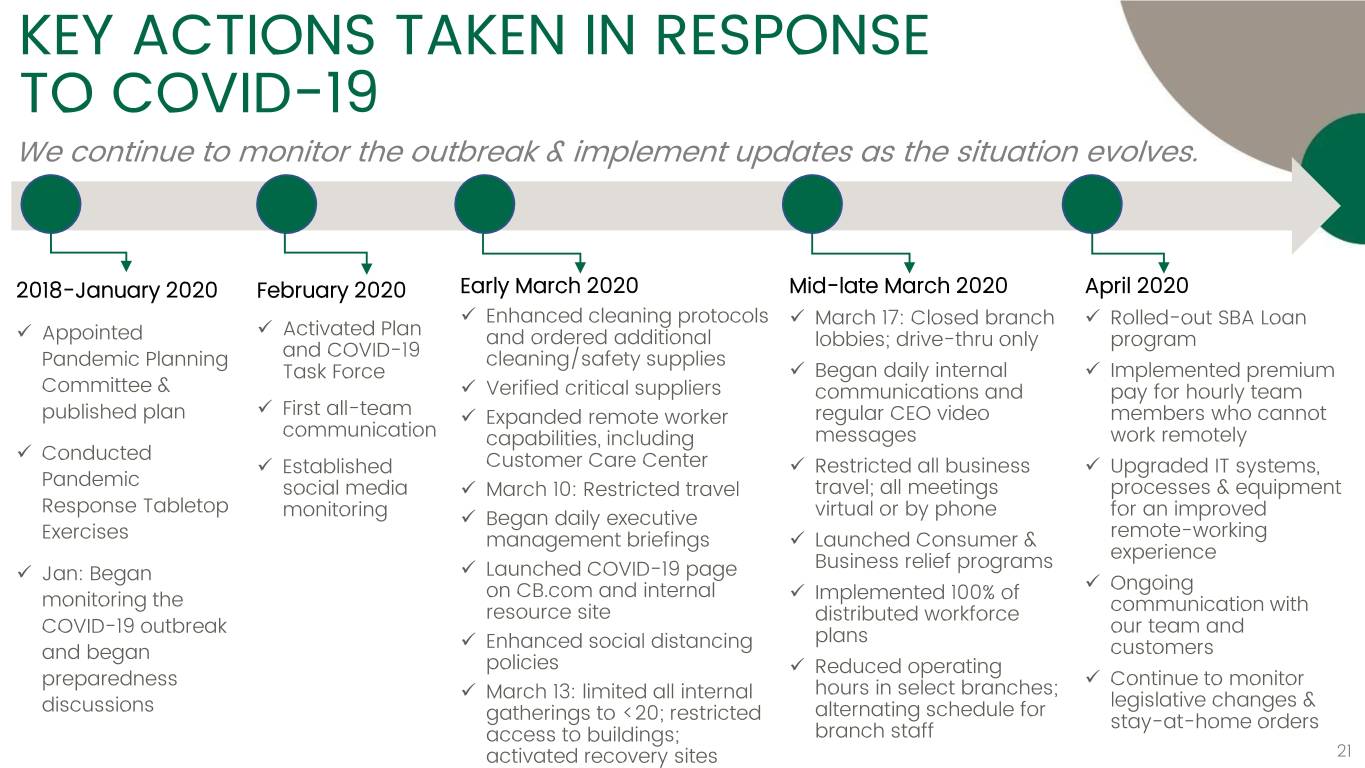
In announcing these results, John Kemper, Chief Executive Officer, said, “While the U.S. economy entered this quarter on solid footing, it is currently in an unprecedented state of uncertainty amid the global COVID-19 pandemic. Commerce is committed to being there for our customers in this difficult time. As part of this commitment, we are suspending foreclosure proceedings, offering fee waivers and providing relief through loan modification programs. To ensure we are positioned to serve our customers, we have mobilized a significant team of internal resources, redeploying branch teams to assist in our customer care center. We have similarly cross-trained other personnel to provide our commercial customers access to much needed funding through the Small Business Administration’s new Paycheck Protection Program. As of April 17, when the initial CARES Act allocation from this program was exhausted, we assisted 4,529 customers in securing approximately $1.5 billion of funding, with a median loan size of $64 thousand. Our industry-leading capital levels and steadfast commitment to sound credit policy enables us to be a source of strength to our employees, customers and communities in this period of uncertainty.”
Mr. Kemper continued, “For Commerce, a fundamentally sound financial quarter was impacted by two significant charges, stemming primarily from COVID-19 and the resulting economic outlook. First, the provision for credit losses was increased to recognize expected future losses on loans and unfunded lending commitments. Second, we recognized unrealized losses on our portfolio of private equity investments through our quarterly valuation process. Compared to the prior quarter, we experienced robust growth in average loans, driven mainly by commercial and personal real estate loans, even as auto and consumer credit card lending were seasonally lower. Net interest margin declined 3 basis points this quarter, holding up well in a challenging interest rate environment. Fee income totaled $123.7 million this quarter and reflected growth over the first quarter of 2019 in trust, capital market, deposit account, and bank card fees.”
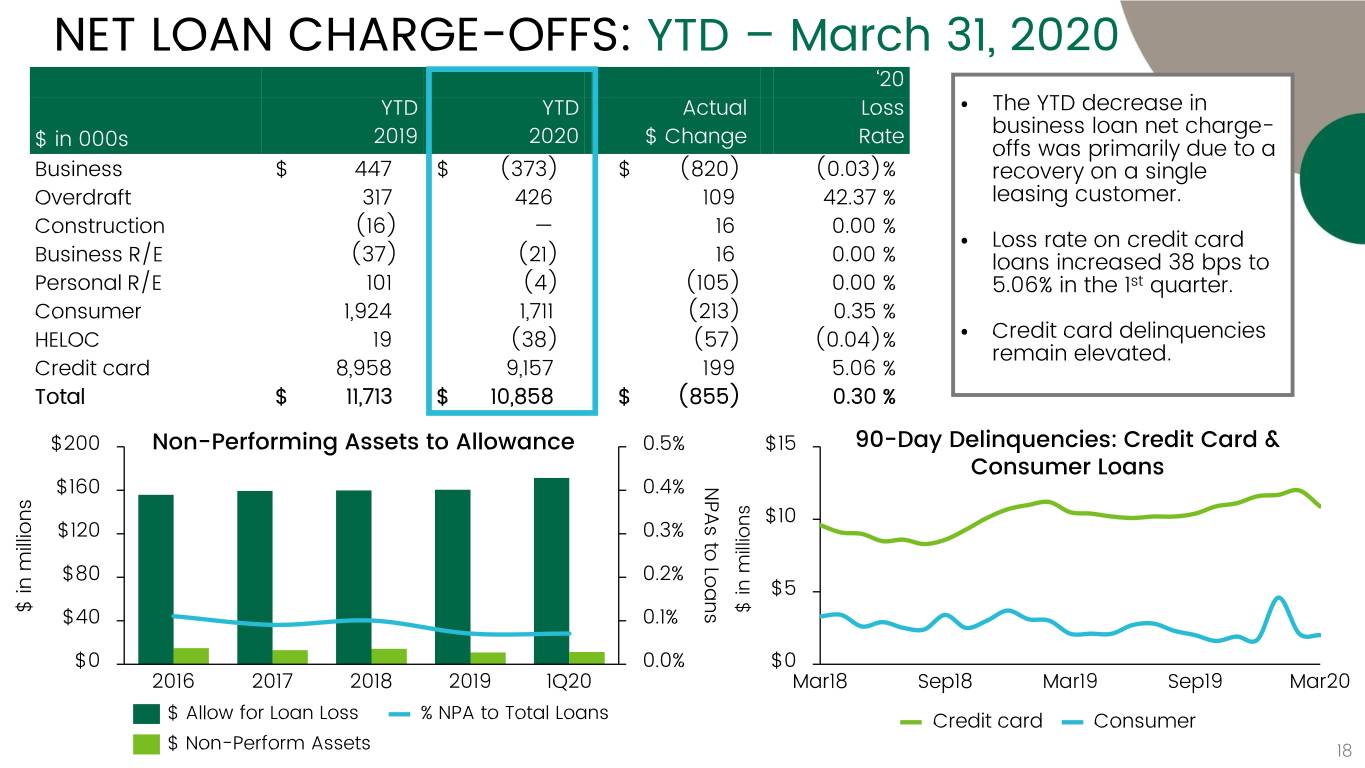
Mr. Kemper continued, "This quarter net loan charge-offs totaled $10.9 million, compared to $15.2 million in the prior quarter and $11.7 million in the first quarter of 2019. The ratio of annualized net loan charge-offs to average loans was .30% in the current quarter, .42% in the prior quarter and .34% in the first quarter of last year. Net loan charge-offs on commercial loans declined $3.5 million from the previous quarter and resulted in a net recovery this quarter, while net loan
Exhibit 99.1
charge-offs on personal banking loans decreased $883 thousand to $11.3 million, mostly the result of lower consumer loan losses. Non-performing assets totaled $11.1 million this quarter and remained at very low levels.
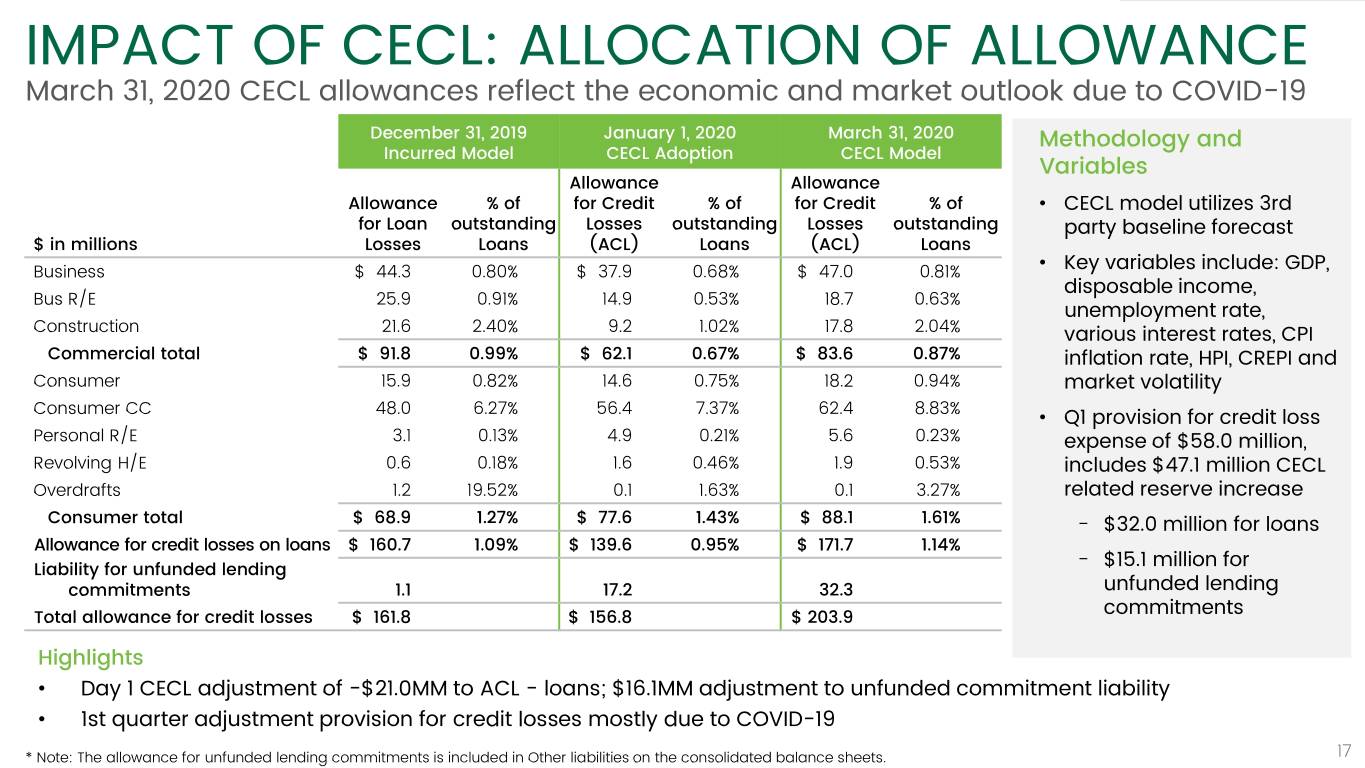
"On January 1, 2020, Commerce adopted the CECL accounting standard. At that time, economic conditions were stable and the economic forecast supporting our CECL model reflected the prevailingly benign credit environment. The day one adoption reduced our allowance for credit losses on loans $21.0 million and increased our liability for unfunded commitments $16.1 million, resulting in a net increase to retained earnings of $3.8 million, after tax. By the end of the quarter, in light of the COVID-19 pandemic, the economic forecast used in our CECL model became significantly more pessimistic. As a result, the provision for credit losses for the first three months of 2020 totaled $58.0 million, which includes a provision for credit losses for loans and for unfunded loan commitments. The provision for credit losses on loans totaled $42.9 million and exceeded net loan charge-offs by $32.0 million, while the provision for credit losses for unfunded commitments totaled $15.1 million. The allowance for credit losses on loans amounted to $171.7 million at March 31, 2020, or 1.14% of period end loans, while the liability for unfunded commitments totaled $32.3 million at March 31, 2020.”
Total assets at March 31, 2020 were $26.8 billion, total loans were $15.1 billion, and total deposits were $20.8 billion. During the quarter, the Company paid a common cash dividend of $.27 per share, representing an 8.9% increase over the rate paid in the fourth quarter of 2019, and also paid an annualized 6% cash dividend on its preferred stock. The Company purchased 869,692 of its common shares this quarter.
Commerce Bancshares, Inc. is a regional bank holding company offering a full line of banking services, including payment solutions, investment management and securities brokerage. Commerce Bank, a subsidiary of Commerce Bancshares, Inc., leverages more than 150 years of proven strength and experience to help individuals and businesses solve financial challenges. In addition to offering payment solutions across the U.S., Commerce Bank currently operates full service banking facilities across the Midwest including the St. Louis and Kansas City metropolitan areas, Springfield, Central Missouri, Central Illinois, Wichita, Tulsa, Oklahoma City, and Denver. It also maintains commercial offices in Dallas, Houston, Cincinnati, Nashville, Des Moines, Indianapolis, and Grand Rapids. Commerce delivers high-touch service and sophisticated financial solutions at regional branches, commercial offices, ATMs, online, mobile and through a 24/7 customer service line.
This financial news release, including management's discussion of first quarter results, is posted to the Company's web site at www.commercebank.com.
* * * * * * * * * * * * * * *
For additional information, contact
Matthew Burkemper, Investor Relations
at 8000 Forsyth, Mailstop: CBIR-1
Clayton, MO 63105
or by telephone at (314) 746-7485
Web Site: http://www.commercebank.com
Email: [email protected]
Exhibit 99.1
COMMERCE BANCSHARES, INC. and SUBSIDIARIES
FINANCIAL HIGHLIGHTS
| For the Three Months Ended | ||||||||||||||
| (Unaudited) (Dollars in thousands, except per share data) | March 31, 2020 | December 31, 2019 | March 31, 2019 | |||||||||||
FINANCIAL SUMMARY | ||||||||||||||
| Net interest income | $201,065 | $202,659 | $203,488 | |||||||||||
| Non-interest income | 123,663 | 143,461 | 121,240 | |||||||||||
Total revenue | 324,728 | 346,120 | 324,728 | |||||||||||
| Investment securities losses, net | (13,301) | (248) | (925) | |||||||||||
| Provision for credit losses | 57,953 | 15,206 | 12,463 | |||||||||||
| Non-interest expense | 193,698 | 195,174 | 191,425 | |||||||||||
Income before taxes | 59,776 | 135,492 | 119,915 | |||||||||||
| Income taxes | 10,173 | 28,214 | 22,860 | |||||||||||
| Non-controlling interest (income) expense | (2,254) | 398 | (83) | |||||||||||
Net income attributable to Commerce Bancshares, Inc. | 51,857 | 106,880 | 97,138 | |||||||||||
| Preferred stock dividends | 2,250 | 2,250 | 2,250 | |||||||||||
Net income available to common shareholders | $49,607 | $104,630 | $94,888 | |||||||||||
| Earnings per common share: | ||||||||||||||
| Net income — basic | $.44 | $.94 | $.81 | |||||||||||
| Net income — diluted | $.44 | $.93 | $.81 | |||||||||||
| Effective tax rate | 16.40 | % | 20.88 | % | 19.05 | % | ||||||||
| Tax equivalent net interest income | $204,402 | $206,156 | $207,104 | |||||||||||
Average total interest earning assets (1) | $ | 24,691,014 | $ | 24,372,575 | $ | 23,874,861 | ||||||||
| Diluted wtd. average shares outstanding | 111,375,938 | 112,011,108 | 115,816,037 | |||||||||||
| RATIOS | ||||||||||||||
Average loans to deposits (2) | 72.57 | % | 71.73 | % | 70.96 | % | ||||||||
| Return on total average assets | .80 | 1.65 | 1.58 | |||||||||||
Return on average common equity (3) | 6.48 | 13.90 | 13.64 | |||||||||||
| Non-interest income to total revenue | 38.08 | 41.45 | 37.34 | |||||||||||
Efficiency ratio (4) | 59.17 | 56.29 | 58.76 | |||||||||||
| Net yield on interest earning assets | 3.33 | 3.36 | 3.52 | |||||||||||
| EQUITY SUMMARY | ||||||||||||||
| Cash dividends per common share | $.270 | $.248 | $.248 | |||||||||||
| Cash dividends on common stock | $30,292 | $27,933 | $28,858 | |||||||||||
| Cash dividends on preferred stock | $2,250 | $2,250 | $2,250 | |||||||||||
Book value per common share (5) | $27.86 | $26.70 | $24.94 | |||||||||||
Market value per common share (5) | $50.35 | $67.94 | $55.30 | |||||||||||
| High market value per common share | $71.92 | $68.65 | $60.97 | |||||||||||
| Low market value per common share | $45.51 | $54.56 | $52.97 | |||||||||||
Common shares outstanding (5) | 111,535,295 | 112,131,549 | 116,231,063 | |||||||||||
Tangible common equity to tangible assets (6) | 11.13 | % | 10.99 | % | 11.06 | % | ||||||||
| Tier I leverage ratio | 11.13 | % | 11.38 | % | 11.67 | % | ||||||||
| OTHER QTD INFORMATION | ||||||||||||||
| Number of bank/ATM locations | 317 | 316 | 319 | |||||||||||
| Full-time equivalent employees | 4,854 | 4,858 | 4,841 | |||||||||||
(1)Excludes allowance for credit losses on loans and unrealized gains/(losses) on available for sale debt securities.
(2)Includes loans held for sale.
(3)Annualized net income available to common shareholders divided by average total equity less preferred stock.
(4)The efficiency ratio is calculated as non-interest expense (excluding intangibles amortization) as a percent of revenue.
(5)As of period end.
(6)The tangible common equity ratio is calculated as stockholders’ equity reduced by preferred stock, goodwill and other intangible assets (excluding mortgage servicing rights) divided by total assets reduced by goodwill and other intangible assets (excluding mortgage servicing rights).
All share and per share amounts have been restated to reflect the 5% stock dividend distributed in December 2019.
Exhibit 99.1
COMMERCE BANCSHARES, INC. and SUBSIDIARIES
CONSOLIDATED STATEMENTS OF INCOME
| For the Three Months Ended | ||||||||||||||||||||
| (Unaudited) (In thousands, except per share data) | March 31, 2020 | December 31, 2019 | September 30, 2019 | June 30, 2019 | March 31, 2019 | |||||||||||||||
| Interest income | $221,485 | $226,665 | $231,743 | $238,412 | $227,865 | |||||||||||||||
| Interest expense | 20,420 | 24,006 | 28,231 | 26,778 | 24,377 | |||||||||||||||
| Net interest income | 201,065 | 202,659 | 203,512 | 211,634 | 203,488 | |||||||||||||||
| Provision for credit losses | 57,953 | 15,206 | 10,963 | 11,806 | 12,463 | |||||||||||||||
Net interest income after credit losses | 143,112 | 187,453 | 192,549 | 199,828 | 191,025 | |||||||||||||||
| NON-INTEREST INCOME | ||||||||||||||||||||
| Bank card transaction fees | 40,200 | 41,079 | 44,510 | 42,646 | 39,644 | |||||||||||||||
| Trust fees | 39,965 | 40,405 | 39,592 | 38,375 | 37,256 | |||||||||||||||
| Deposit account charges and other fees | 23,677 | 24,974 | 24,032 | 23,959 | 23,018 | |||||||||||||||
| Capital market fees | 3,790 | 2,536 | 1,787 | 1,944 | 1,879 | |||||||||||||||
| Consumer brokerage services | 4,077 | 4,139 | 4,030 | 3,888 | 3,747 | |||||||||||||||
| Loan fees and sales | 3,235 | 3,465 | 4,755 | 4,238 | 3,309 | |||||||||||||||
| Other | 8,719 | 26,863 | 14,037 | 12,209 | 12,387 | |||||||||||||||
| Total non-interest income | 123,663 | 143,461 | 132,743 | 127,259 | 121,240 | |||||||||||||||
INVESTMENT SECURITIES GAINS (LOSSES), NET | (13,301) | (248) | 4,909 | (110) | (925) | |||||||||||||||
| NON-INTEREST EXPENSE | ||||||||||||||||||||
| Salaries and employee benefits | 128,937 | 126,901 | 123,836 | 120,062 | 122,128 | |||||||||||||||
| Net occupancy | 11,748 | 12,218 | 12,293 | 11,145 | 11,501 | |||||||||||||||
| Equipment | 4,821 | 4,859 | 4,941 | 4,790 | 4,471 | |||||||||||||||
| Supplies and communication | 4,658 | 4,851 | 5,106 | 5,275 | 5,162 | |||||||||||||||
| Data processing and software | 23,555 | 23,934 | 23,457 | 23,248 | 22,260 | |||||||||||||||
| Marketing | 5,979 | 3,951 | 6,048 | 6,015 | 5,900 | |||||||||||||||
| Other | 14,000 | 18,460 | 15,339 | 19,244 | 20,003 | |||||||||||||||
| Total non-interest expense | 193,698 | 195,174 | 191,020 | 189,779 | 191,425 | |||||||||||||||
| Income before income taxes | 59,776 | 135,492 | 139,181 | 137,198 | 119,915 | |||||||||||||||
| Less income taxes | 10,173 | 28,214 | 29,101 | 28,899 | 22,860 | |||||||||||||||
| Net income | 49,603 | 107,278 | 110,080 | 108,299 | 97,055 | |||||||||||||||
Less non-controlling interest expense (income) | (2,254) | 398 | 838 | 328 | (83) | |||||||||||||||
Net income attributable to Commerce Bancshares, Inc. | 51,857 | 106,880 | 109,242 | 107,971 | 97,138 | |||||||||||||||
| Less preferred stock dividends | 2,250 | 2,250 | 2,250 | 2,250 | 2,250 | |||||||||||||||
Net income available to common shareholders | $49,607 | $104,630 | $106,992 | $105,721 | $94,888 | |||||||||||||||
| Net income per common share — basic | $.44 | $.94 | $.93 | $.91 | $.81 | |||||||||||||||
| Net income per common share — diluted | $.44 | $.93 | $.93 | $.91 | $.81 | |||||||||||||||
| OTHER INFORMATION | ||||||||||||||||||||
| Return on total average assets | .80 | % | 1.65 | % | 1.72 | % | 1.73 | % | 1.58 | % | ||||||||||
Return on average common equity (1) | 6.48 | 13.90 | 14.21 | 14.46 | 13.64 | |||||||||||||||
Efficiency ratio (2) | 59.17 | 56.29 | 56.66 | 55.88 | 58.76 | |||||||||||||||
| Effective tax rate | 16.40 | 20.88 | 21.04 | 21.11 | 19.05 | |||||||||||||||
| Net yield on interest earning assets | 3.33 | 3.36 | 3.43 | 3.61 | 3.52 | |||||||||||||||
| Tax equivalent net interest income | $204,402 | $206,156 | $206,958 | $215,203 | $207,104 | |||||||||||||||
(1)Annualized net income available to common shareholders divided by average total equity less preferred stock.
(2)The efficiency ratio is calculated as non-interest expense (excluding intangibles amortization) as a percent of revenue.
Exhibit 99.1
COMMERCE BANCSHARES, INC. and SUBSIDIARIES
CONSOLIDATED BALANCE SHEETS - PERIOD END
| (Unaudited) (In thousands) | March 31, 2020 | December 31, 2019 | March 31, 2019 | |||||||||||
| ASSETS | ||||||||||||||
| Loans | ||||||||||||||
| Business | $ | 5,773,865 | $ | 5,565,449 | $ | 5,175,541 | ||||||||
| Real estate — construction and land | 873,402 | 899,377 | 925,269 | |||||||||||
| Real estate — business | 2,960,308 | 2,833,554 | 2,859,614 | |||||||||||
| Real estate — personal | 2,464,819 | 2,354,760 | 2,125,087 | |||||||||||
| Consumer | 1,941,787 | 1,964,145 | 1,893,212 | |||||||||||
| Revolving home equity | 349,735 | 349,251 | 364,010 | |||||||||||
| Consumer credit card | 706,753 | 764,977 | 772,396 | |||||||||||
| Overdrafts | 3,143 | 6,304 | 5,593 | |||||||||||
| Total loans | 15,073,812 | 14,737,817 | 14,120,722 | |||||||||||
| Allowance for credit losses on loans | (171,653) | (160,682) | (160,682) | |||||||||||
Net loans | 14,902,159 | 14,577,135 | 13,960,040 | |||||||||||
| Loans held for sale | 6,214 | 13,809 | 20,085 | |||||||||||
| Investment securities: | ||||||||||||||
| Available for sale debt securities | 8,678,586 | 8,571,626 | 8,627,890 | |||||||||||
| Trading debt securities | 24,291 | 28,161 | 30,427 | |||||||||||
| Equity securities | 4,038 | 4,209 | 4,694 | |||||||||||
| Other securities | 155,074 | 137,892 | 129,504 | |||||||||||
Total investment securities | 8,861,989 | 8,741,888 | 8,792,515 | |||||||||||
Federal funds sold and short-term securities purchased under agreements to resell | 400 | — | 250 | |||||||||||
Long-term securities purchased under agreements to resell | 850,000 | 850,000 | 700,000 | |||||||||||
| Interest earning deposits with banks | 474,156 | 395,850 | 166,077 | |||||||||||
| Cash and due from banks | 401,185 | 491,615 | 428,018 | |||||||||||
| Premises and equipment — net | 369,745 | 370,637 | 362,679 | |||||||||||
| Goodwill | 138,921 | 138,921 | 138,921 | |||||||||||
| Other intangible assets — net | 8,433 | 9,534 | 8,511 | |||||||||||
| Other assets | 779,815 | 476,400 | 456,375 | |||||||||||
Total assets | $ | 26,793,017 | $ | 26,065,789 | $ | 25,033,471 | ||||||||
| LIABILITIES AND STOCKHOLDERS’ EQUITY | ||||||||||||||
| Deposits: | ||||||||||||||
| Non-interest bearing | $ | 6,952,236 | $ | 6,890,687 | $ | 6,298,724 | ||||||||
| Savings, interest checking and money market | 12,049,279 | 11,621,716 | 11,799,346 | |||||||||||
| Certificates of deposit of less than $100,000 | 619,758 | 626,157 | 599,289 | |||||||||||
| Certificates of deposit of $100,000 and over | 1,154,590 | 1,381,855 | 1,276,994 | |||||||||||
Total deposits | 20,775,863 | 20,520,415 | 19,974,353 | |||||||||||
Federal funds purchased and securities sold under agreements to repurchase | 1,428,013 | 1,850,772 | 1,722,751 | |||||||||||
| Other borrowings | 756,461 | 2,418 | 2,022 | |||||||||||
| Other liabilities | 580,216 | 553,712 | 291,132 | |||||||||||
Total liabilities | 23,540,553 | 22,927,317 | 21,990,258 | |||||||||||
| Stockholders’ equity: | ||||||||||||||
| Preferred stock | 144,784 | 144,784 | 144,784 | |||||||||||
| Common stock | 563,978 | 563,978 | 559,432 | |||||||||||
| Capital surplus | 2,133,623 | 2,151,464 | 2,074,912 | |||||||||||
| Retained earnings | 224,643 | 201,562 | 307,193 | |||||||||||
| Treasury stock | (69,149) | (37,548) | (60,547) | |||||||||||
| Accumulated other comprehensive income | 253,136 | 110,444 | 11,981 | |||||||||||
Total stockholders’ equity | 3,251,015 | 3,134,684 | 3,037,755 | |||||||||||
| Non-controlling interest | 1,449 | 3,788 | 5,458 | |||||||||||
Total equity | 3,252,464 | 3,138,472 | 3,043,213 | |||||||||||
Total liabilities and equity | $ | 26,793,017 | $ | 26,065,789 | $ | 25,033,471 | ||||||||
Exhibit 99.1
COMMERCE BANCSHARES, INC. and SUBSIDIARIES
AVERAGE BALANCE SHEETS
| (Unaudited) (In thousands) | For the Three Months Ended | ||||||||||||||||
| March 31, 2020 | December 31, 2019 | September 30, 2019 | June 30, 2019 | March 31, 2019 | |||||||||||||
| ASSETS: | |||||||||||||||||
| Loans: | |||||||||||||||||
| Business | $ | 5,493,657 | $ | 5,362,020 | $ | 5,263,312 | $ | 5,142,794 | $ | 5,084,920 | |||||||
| Real estate — construction and land | 924,086 | 901,367 | 920,206 | 908,777 | 907,062 | ||||||||||||
| Real estate — business | 2,853,632 | 2,820,189 | 2,883,379 | 2,868,503 | 2,864,177 | ||||||||||||
| Real estate — personal | 2,390,716 | 2,283,530 | 2,175,156 | 2,135,048 | 2,119,365 | ||||||||||||
| Consumer | 1,950,491 | 1,961,631 | 1,924,434 | 1,907,979 | 1,929,202 | ||||||||||||
| Revolving home equity | 350,256 | 347,527 | 354,040 | 361,673 | 370,962 | ||||||||||||
| Consumer credit card | 727,569 | 749,056 | 763,377 | 766,080 | 781,167 | ||||||||||||
| Overdrafts | 4,044 | 18,322 | 9,240 | 4,889 | 4,205 | ||||||||||||
Total loans | 14,694,451 | 14,443,642 | 14,293,144 | 14,095,743 | 14,061,060 | ||||||||||||
| Allowance for credit losses on loans | (139,482) | (159,776) | (160,387) | (161,403) | (159,275) | ||||||||||||
| Net loans | 14,554,969 | 14,283,866 | 14,132,757 | 13,934,340 | 13,901,785 | ||||||||||||
| Loans held for sale | 12,875 | 15,363 | 19,882 | 20,731 | 18,350 | ||||||||||||
| Investment securities: | |||||||||||||||||
U.S. government and federal agency obligations | 802,556 | 826,702 | 825,544 | 843,974 | 909,466 | ||||||||||||
Government-sponsored enterprise obligations | 134,296 | 184,973 | 181,929 | 199,506 | 199,480 | ||||||||||||
| State and municipal obligations | 1,222,595 | 1,207,584 | 1,172,259 | 1,222,008 | 1,283,349 | ||||||||||||
Mortgage-backed securities | 4,685,782 | 4,685,794 | 4,712,508 | 4,614,703 | 4,360,428 | ||||||||||||
| Asset-backed securities | 1,182,556 | 1,258,297 | 1,297,685 | 1,412,452 | 1,525,623 | ||||||||||||
Other debt securities | 321,733 | 331,167 | 334,218 | 331,459 | 335,612 | ||||||||||||
| Unrealized gain (loss) on debt securities | 191,275 | 149,591 | 152,706 | 42,009 | (48,925) | ||||||||||||
| Total available for sale debt securities | 8,540,793 | 8,644,108 | 8,676,849 | 8,666,111 | 8,565,033 | ||||||||||||
Trading debt securities | 34,055 | 32,518 | 29,622 | 30,169 | 25,411 | ||||||||||||
| Equity securities | 4,273 | 4,200 | 4,705 | 4,717 | 4,568 | ||||||||||||
| Other securities | 144,096 | 141,501 | 134,896 | 130,433 | 130,057 | ||||||||||||
| Total investment securities | 8,723,217 | 8,822,327 | 8,846,072 | 8,831,430 | 8,725,069 | ||||||||||||
Federal funds sold and short-term securities purchased under agreements to resell | 326 | 714 | 1,080 | 1,601 | 4,797 | ||||||||||||
| Long-term securities purchased under agreements to resell | 850,000 | 849,986 | 713,030 | 700,000 | 700,000 | ||||||||||||
| Interest earning deposits with banks | 601,420 | 390,134 | 226,582 | 331,999 | 316,660 | ||||||||||||
| Other assets | 1,368,464 | 1,315,395 | 1,292,191 | 1,251,555 | 1,197,261 | ||||||||||||
| Total assets | $ | 26,111,271 | $ | 25,677,785 | $ | 25,231,594 | $ | 25,071,656 | $ | 24,863,922 | |||||||
| LIABILITIES AND EQUITY: | |||||||||||||||||
Non-interest bearing deposits | $ | 6,615,108 | $ | 6,552,862 | $ | 6,290,036 | $ | 6,335,620 | $ | 6,324,738 | |||||||
| Savings | 952,709 | 924,282 | 924,581 | 929,974 | 896,378 | ||||||||||||
| Interest checking and money market | 10,777,400 | 10,618,347 | 10,409,111 | 10,642,648 | 10,762,550 | ||||||||||||
Certificates of deposit of less than $100,000 | 622,840 | 626,944 | 620,138 | 605,440 | 590,200 | ||||||||||||
Certificates of deposit of $100,000 and over | 1,299,443 | 1,434,309 | 1,503,805 | 1,378,402 | 1,267,517 | ||||||||||||
| Total deposits | 20,267,500 | 20,156,744 | 19,747,671 | 19,892,084 | 19,841,383 | ||||||||||||
| Borrowings: | |||||||||||||||||
Federal funds purchased and securities sold under agreements to repurchase | 1,990,051 | 1,836,982 | 1,884,939 | 1,793,526 | 1,771,534 | ||||||||||||
| Other borrowings | 161,698 | 94,471 | 77,248 | 1,318 | 1,248 | ||||||||||||
| Total borrowings | 2,151,749 | 1,931,453 | 1,962,187 | 1,794,844 | 1,772,782 | ||||||||||||
| Other liabilities | 466,980 | 458,094 | 390,560 | 307,433 | 284,018 | ||||||||||||
| Total liabilities | 22,886,229 | 22,546,291 | 22,100,418 | 21,994,361 | 21,898,183 | ||||||||||||
| Equity | 3,225,042 | 3,131,494 | 3,131,176 | 3,077,295 | 2,965,739 | ||||||||||||
| Total liabilities and equity | $ | 26,111,271 | $ | 25,677,785 | $ | 25,231,594 | $ | 25,071,656 | $ | 24,863,922 | |||||||
Exhibit 99.1
COMMERCE BANCSHARES, INC. and SUBSIDIARIES
AVERAGE RATES
| (Unaudited) | For the Three Months Ended | |||||||||||||||||||
| March 31, 2020 | December 31, 2019 | September 30, 2019 | June 30, 2019 | March 31, 2019 | ||||||||||||||||
| ASSETS: | ||||||||||||||||||||
| Loans: | ||||||||||||||||||||
Business (1) | 3.50 | % | 3.59 | % | 3.85 | % | 4.02 | % | 4.07 | % | ||||||||||
| Real estate — construction and land | 4.78 | 5.05 | 5.46 | 5.63 | 5.73 | |||||||||||||||
| Real estate — business | 4.16 | 4.22 | 4.42 | 4.60 | 4.61 | |||||||||||||||
| Real estate — personal | 3.83 | 3.85 | 3.91 | 3.97 | 4.00 | |||||||||||||||
| Consumer | 4.78 | 4.76 | 4.88 | 4.77 | 4.73 | |||||||||||||||
| Revolving home equity | 4.61 | 4.76 | 5.17 | 5.20 | 5.17 | |||||||||||||||
| Consumer credit card | 12.26 | 12.11 | 12.42 | 12.33 | 12.18 | |||||||||||||||
| Overdrafts | — | — | — | — | — | |||||||||||||||
| Total loans | 4.39 | 4.47 | 4.71 | 4.82 | 4.85 | |||||||||||||||
| Loans held for sale | 6.15 | 5.32 | 6.15 | 6.98 | 7.38 | |||||||||||||||
| Investment securities: | ||||||||||||||||||||
U.S. government and federal agency obligations | 2.09 | 2.16 | 2.36 | 4.66 | .78 | |||||||||||||||
Government-sponsored enterprise obligations | 4.19 | 2.17 | 2.69 | 2.32 | 2.35 | |||||||||||||||
State and municipal obligations (1) | 3.11 | 3.05 | 3.14 | 3.18 | 3.19 | |||||||||||||||
Mortgage-backed securities | 2.37 | 2.72 | 2.61 | 2.70 | 2.76 | |||||||||||||||
| Asset-backed securities | 2.63 | 2.62 | 2.80 | 2.79 | 2.70 | |||||||||||||||
| Other debt securities | 2.94 | 2.82 | 2.63 | 2.68 | 2.69 | |||||||||||||||
| Total available for sale debt securities | 2.54 | 2.69 | 2.69 | 2.97 | 2.59 | |||||||||||||||
Trading debt securities (1) | 2.52 | 2.81 | 2.91 | 3.14 | 3.24 | |||||||||||||||
Equity securities (1) | 46.78 | 49.40 | 35.67 | 35.97 | 37.55 | |||||||||||||||
Other securities (1) | 5.31 | 6.58 | 6.19 | 6.69 | 5.73 | |||||||||||||||
| Total investment securities | 2.61 | 2.78 | 2.76 | 3.04 | 2.66 | |||||||||||||||
Federal funds sold and short-term securities purchased under agreements to resell | 2.47 | 2.22 | 2.57 | 2.76 | 2.79 | |||||||||||||||
Long-term securities purchased under agreements to resell | 3.53 | 2.26 | 2.01 | 2.11 | 2.18 | |||||||||||||||
| Interest earning deposits with banks | .86 | 1.61 | 2.17 | 2.40 | 2.42 | |||||||||||||||
| Total interest earning assets | 3.66 | 3.75 | 3.90 | 4.05 | 3.93 | |||||||||||||||
| LIABILITIES AND EQUITY: | ||||||||||||||||||||
| Interest bearing deposits: | ||||||||||||||||||||
| Savings | .11 | .11 | .11 | .11 | .11 | |||||||||||||||
| Interest checking and money market | .30 | .35 | .38 | .38 | .35 | |||||||||||||||
Certificates of deposit of less than $100,000 | 1.15 | 1.16 | 1.11 | 1.01 | .87 | |||||||||||||||
Certificates of deposit of $100,000 and over | 1.62 | 1.79 | 1.99 | 2.02 | 1.92 | |||||||||||||||
| Total interest bearing deposits | .45 | .52 | .58 | .55 | .51 | |||||||||||||||
| Borrowings: | ||||||||||||||||||||
Federal funds purchased and securities sold under agreements to repurchase | .96 | 1.20 | 1.74 | 1.80 | 1.72 | |||||||||||||||
| Other borrowings | .82 | 2.05 | 2.33 | 1.52 | 1.62 | |||||||||||||||
| Total borrowings | .95 | 1.25 | 1.76 | 1.80 | 1.72 | |||||||||||||||
| Total interest bearing liabilities | .52 | % | .61 | % | .73 | % | .70 | % | .65 | % | ||||||||||
| Net yield on interest earning assets | 3.33 | % | 3.36 | % | 3.43 | % | 3.61 | % | 3.52 | % | ||||||||||
(1) Stated on a tax equivalent basis using a federal income tax rate of 21%.
Exhibit 99.1
COMMERCE BANCSHARES, INC. and SUBSIDIARIES
CREDIT QUALITY
| For the Three Months Ended | ||||||||||||||||||||
| (Unaudited) (In thousands, except per share data) | March 31, 2020 | December 31, 2019 | September 30, 2019 | June 30, 2019 | March 31, 2019 | |||||||||||||||
| ALLOWANCE FOR CREDIT LOSSES ON LOANS | ||||||||||||||||||||
| Balance at beginning of period | $ | 160,682 | $ | 160,682 | $ | 161,182 | $ | 160,682 | $ | 159,932 | ||||||||||
| Adoption of ASU 2016-13 | (21,039) | — | — | — | — | |||||||||||||||
| Provision for credit losses on loans | 42,868 | 15,206 | 10,963 | 11,806 | 12,463 | |||||||||||||||
| Net charge-offs (recoveries): | ||||||||||||||||||||
| Commercial portfolio: | ||||||||||||||||||||
Business | (373) | 3,036 | 335 | 284 | 447 | |||||||||||||||
Real estate — construction and land | — | — | — | (101) | (16) | |||||||||||||||
Real estate — business | (21) | 35 | (44) | (14) | (37) | |||||||||||||||
| (394) | 3,071 | 291 | 169 | 394 | ||||||||||||||||
| Personal banking portfolio: | ||||||||||||||||||||
Consumer credit card | 9,157 | 8,829 | 8,568 | 9,066 | 8,958 | |||||||||||||||
Consumer | 1,711 | 2,838 | 2,069 | 1,723 | 1,924 | |||||||||||||||
Overdraft | 426 | 507 | 446 | 253 | 317 | |||||||||||||||
Real estate — personal | (4) | 6 | (30) | (21) | 101 | |||||||||||||||
Revolving home equity | (38) | (45) | 119 | 116 | 19 | |||||||||||||||
| 11,252 | 12,135 | 11,172 | 11,137 | 11,319 | ||||||||||||||||
| Total net loan charge-offs | 10,858 | 15,206 | 11,463 | 11,306 | 11,713 | |||||||||||||||
| Balance at end of period | $ | 171,653 | $ | 160,682 | $ | 160,682 | $ | 161,182 | $ | 160,682 | ||||||||||
| LIABILITY FOR UNFUNDED LENDING COMMITMENTS | $ | 32,251 | $ | 1,075 | $ | 1,075 | $ | 1,075 | $ | 1,075 | ||||||||||
| NET CHARGE-OFF RATIOS* | ||||||||||||||||||||
| Commercial portfolio: | ||||||||||||||||||||
| Business | (.03) | % | .22 | % | .03 | % | .02 | % | .04 | % | ||||||||||
| Real estate — construction and land | — | — | — | (.04) | (.01) | |||||||||||||||
| Real estate — business | — | — | (.01) | — | (.01) | |||||||||||||||
| (.02) | .13 | .01 | .01 | .02 | ||||||||||||||||
| Personal banking portfolio: | ||||||||||||||||||||
| Consumer credit card | 5.06 | 4.68 | 4.45 | 4.75 | 4.65 | |||||||||||||||
| Consumer | .35 | .57 | .43 | .36 | .40 | |||||||||||||||
| Overdraft | 42.37 | 10.98 | 19.15 | 20.76 | 30.57 | |||||||||||||||
| Real estate — personal | — | — | (.01) | — | .02 | |||||||||||||||
| Revolving home equity | (.04) | (.05) | .13 | .13 | .02 | |||||||||||||||
| .83 | .90 | .85 | .86 | .88 | ||||||||||||||||
| Total | .30 | % | .42 | % | .32 | % | .32 | % | .34 | % | ||||||||||
| CREDIT QUALITY RATIOS | ||||||||||||||||||||
| Non-performing assets to total loans | .07 | % | .07 | % | .08 | % | .08 | % | .09 | % | ||||||||||
| Non-performing assets to total assets | .04 | .04 | .05 | .05 | .05 | |||||||||||||||
| Allowance for credit losses on loans to total loans | 1.14 | 1.09 | 1.11 | 1.13 | 1.14 | |||||||||||||||
| NON-PERFORMING ASSETS | ||||||||||||||||||||
| Non-accrual loans: | ||||||||||||||||||||
| Business | $ | 7,356 | $ | 7,489 | $ | 7,753 | $ | 8,428 | $ | 8,569 | ||||||||||
| Real estate — construction and land | 2 | 2 | 3 | 3 | 4 | |||||||||||||||
| Real estate — business | 1,532 | 1,030 | 2,359 | 950 | 1,746 | |||||||||||||||
| Real estate — personal | 1,743 | 1,699 | 1,618 | 1,752 | 1,848 | |||||||||||||||
| Total | 10,633 | 10,220 | 11,733 | 11,133 | 12,167 | |||||||||||||||
| Foreclosed real estate | 422 | 365 | 502 | 897 | 737 | |||||||||||||||
| Total non-performing assets | $ | 11,055 | $ | 10,585 | $ | 12,235 | $ | 12,030 | $ | 12,904 | ||||||||||
| Loans past due 90 days and still accruing interest | $ | 16,520 | $ | 19,859 | $ | 16,308 | $ | 16,532 | $ | 16,655 | ||||||||||
*as a percentage of average loans (excluding loans held for sale)
Exhibit 99.1
COMMERCE BANCSHARES, INC.
Management Discussion of First Quarter Results
March 31, 2020
For the quarter ended March 31, 2020, net income attributable to Commerce Bancshares, Inc. (net income) amounted to $51.9 million, compared to $106.9 million in the previous quarter and $97.1 million in the same quarter last year. The decrease in net income from the previous quarter was primarily the result of an increase in provision for credit losses and unrealized securities losses in the Company’s private equity investment portfolio. Non-interest income was also lower this quarter than in the prior quarter, however, the decrease was primarily due to a gain realized on the sale of the Company’s corporate trust business in the prior quarter. Net interest margin declined slightly, as lower interest earned on loans and investment securities was offset by declining interest expense on deposits. Average loans increased $248.3 million over the previous quarter, while average deposits increased $110.8 million. For the quarter, the return on average assets was .80%, the return on average common equity was 6.48%, and the efficiency ratio was 59.17%.
Balance Sheet Review
During the 1st quarter of 2020, average loans totaled $14.7 billion, an increase of $248.3 million over the prior quarter, and increased $627.9 million, or 4.46%, over the same quarter last year. Period-end loans grew $328.4 million over the prior quarter and $939.2 million over March 31, 2019. Compared to the previous quarter, average loan growth was primarily driven by increases in business loans and personal real estate loans of $131.6 million and $107.2 million, respectively. Additionally, business real estate and construction loans grew $33.4 million and $22.7 million this quarter, respectively. This growth was partly offset by a decline in consumer card loans of $21.5 million. Consumer loans saw higher demand for health services financing, but that growth was offset by lower auto loans and other consumer lending. Growth in business loans was the result of increased commercial and industrial lending, while personal real estate loan balances grew due to a higher portion of loans originated being retained rather than sold during the 1st quarter of 2020 compared to the previous quarter. During the current quarter, the Company sold certain fixed rate personal real estate loans totaling $39.3 million, compared to $61.5 million in the prior quarter.
Total average available for sale debt securities decreased $103.3 million from the previous quarter to $8.5 billion, at fair value. The decrease in investment securities was mainly the result of declines in asset-backed, U.S. government and federal agency, and government-sponsored enterprise obligation securities. Purchases of securities during the quarter totaled $648.9 million, and sales, maturities and pay downs were $636.5 million. At March 31, 2020, the duration of the investment portfolio was 2.6 years, and maturities and pay downs of approximately $1.4 billion are expected to occur during the next 12 months.
Total average deposits increased $110.8 million this quarter compared to the previous quarter. The increase in deposits resulted from growth in interest checking and money market deposits ($159.1 million), demand deposits ($62.2 million), and savings deposits ($28.4 million). These increases were partially offset by declines in certificates of deposit ($139.0 million). Compared to the previous quarter, total average consumer and wealth deposits (including private banking) grew $141.0 million and $64.1 million, respectively, while average commercial deposits decreased $159.4 million this quarter. The average loans to deposits ratio was 72.6% in the current quarter and 71.7% in the prior quarter. The Company’s average borrowings, which includes customer repurchase agreements, were $2.2
billion in the 1st quarter of 2020 and $1.9 billion in the prior quarter.
Net Interest Income
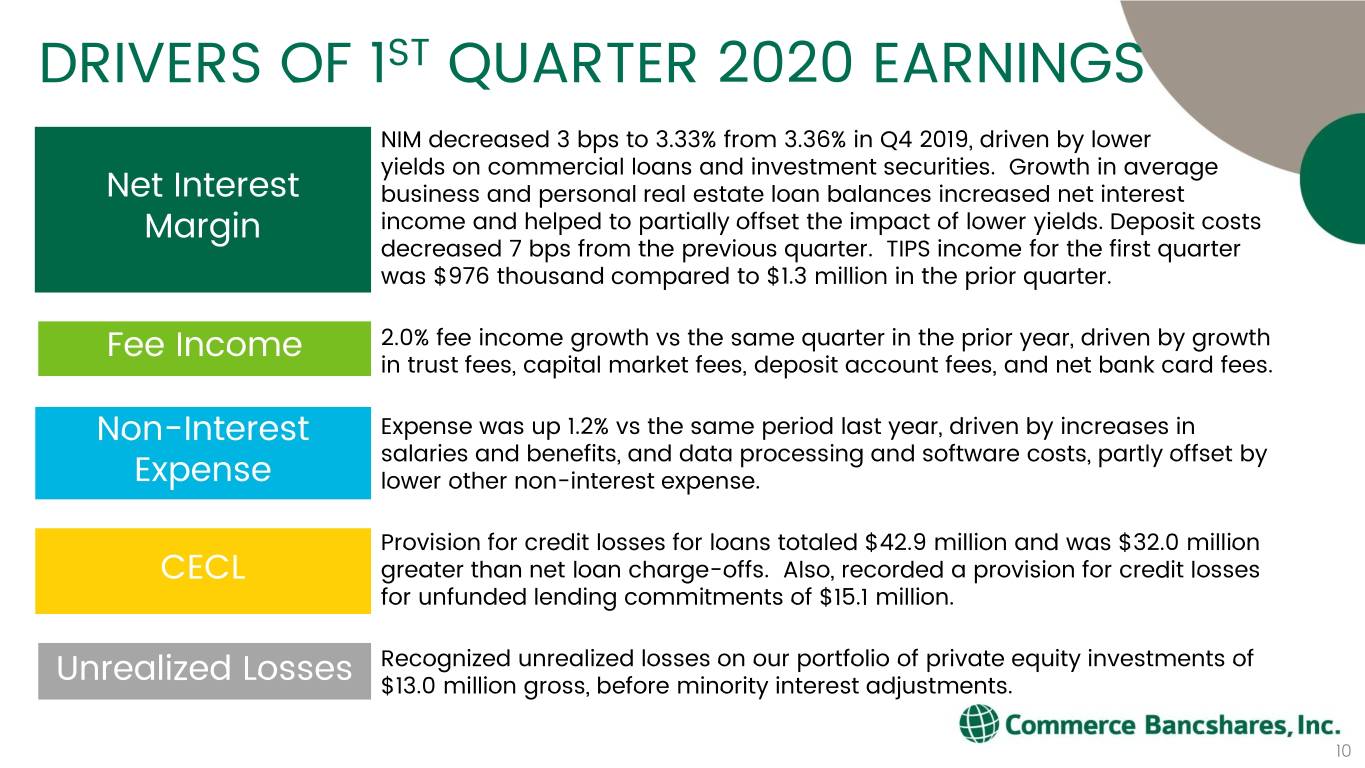
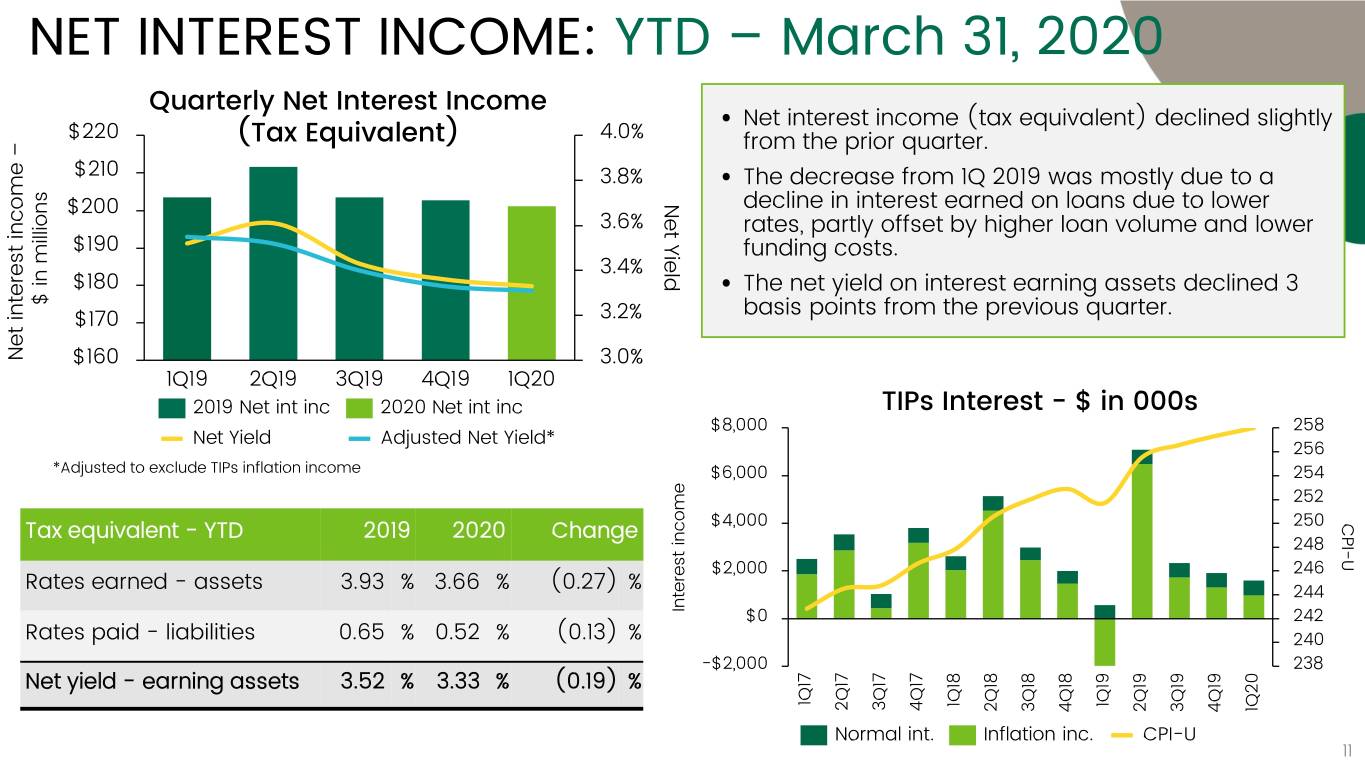
Net interest income in the 1st quarter of 2020 amounted to $201.1 million, a decrease of $1.6 million compared to the previous quarter. On a tax equivalent basis, net interest income for the current quarter decreased $1.8 million from the previous quarter to $204.4 million. The decline in net interest income was mainly due to a $2.2 million adjustment this quarter to premium amortization on mortgage-backed securities for prepayment speed changes. The net yield on earning assets (tax equivalent) decreased to 3.33%, compared to 3.36% in the prior quarter.
Compared to the previous quarter, interest income on loans (tax equivalent) decreased $2.3 million, mostly as a result of lower yields on loans, particularly commercial loans. Growth in average business and personal real estate loan balances increased net interest income and helped to partially offset the impact of lower yields. The average tax-equivalent yield on the loan portfolio declined eight basis points this quarter to 4.39%, compared to 4.47% in the previous quarter.
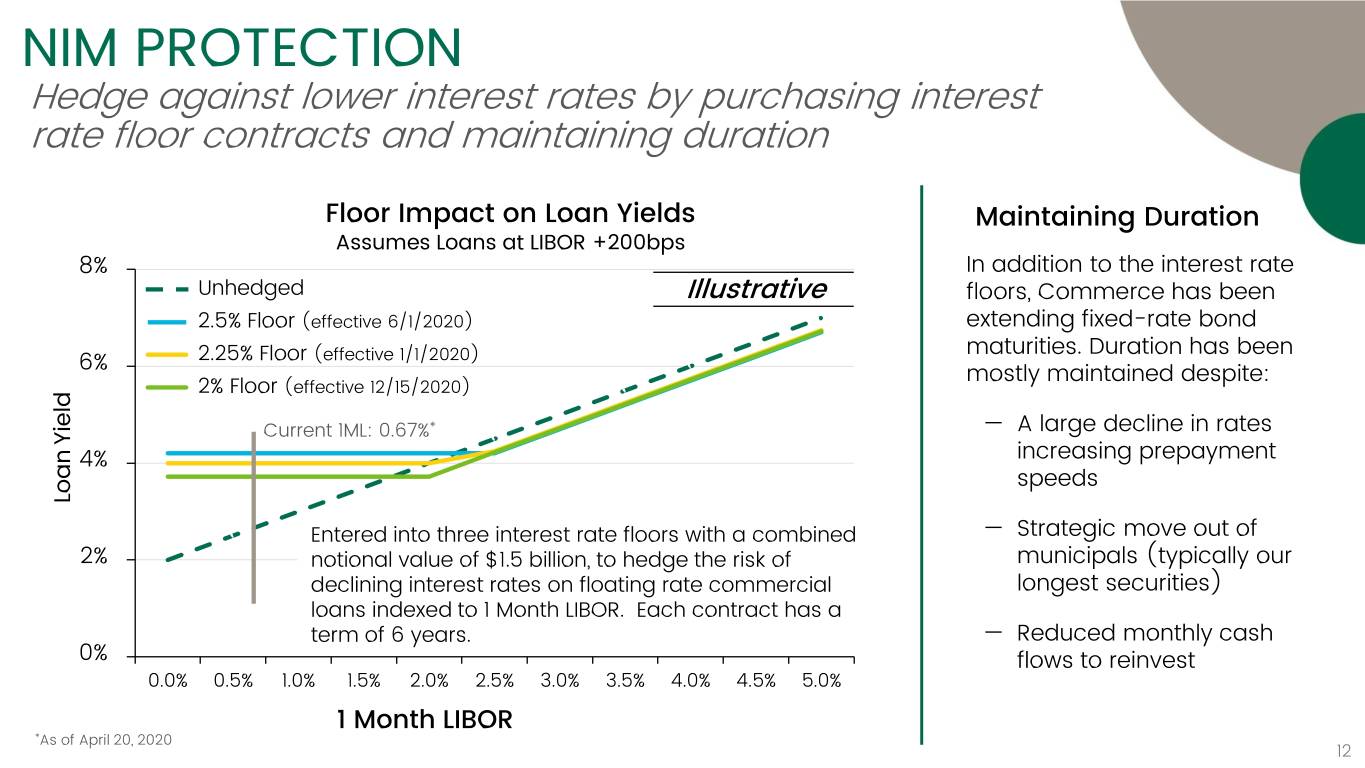
Interest income on investment securities (tax equivalent) decreased $5.4 million from the previous quarter, mainly due to lower interest income earned on mortgage-backed securities due to the $2.2 million premium amortization adjustment, as noted above. The decrease was partially offset by $2.6 million of higher interest income on our long-term securities purchased under agreements to resell. These assets were structured with embedded and leveraged interest rate floor spreads to hedge against falling rates. Also, inflation income on inflation protected securities declined $333 thousand this quarter. The yield on total investment securities was 2.61% in the current quarter, down from 2.78% in the previous quarter.
Interest costs on deposits totaled 45 basis points in the 1st quarter of 2020, compared to 52 basis points in the prior quarter. Interest expense on deposits decreased $2.6 million this quarter compared to the previous quarter mainly due to lower rates on all deposit categories, as well as lower balances of jumbo certificates of deposit. Borrowing costs decreased $964 thousand this quarter due to lower rates paid on borrowings, especially securities sold under agreements to repurchase, partially offset by higher balances of those agreements and of Federal Home Loan Bank borrowings. The overall rate paid on interest bearing liabilities was .52% in the current quarter, compared to .61% in the prior quarter.
Non-Interest Income
In the 1st quarter of 2020, total non-interest income amounted to $123.7 million, an increase of $2.4 million, or 2.0%, compared to the same period last year and decreased $19.8 million, or 13.8%, compared to the prior quarter. The increase in non-interest income over the same period last year was mainly due to growth in trust, capital market, deposit account, and net bank card fees.
Total net bank card fees in the current quarter increased $556 thousand, or 1.4%, over the same period last year, and decreased $879 thousand, or 2.1%, compared to the prior quarter. Net corporate card fees increased $154 thousand over the same quarter last year mainly due to lower rewards expense. Net debit card fees increased $191 thousand, or 2.1%, due to higher
COMMERCE BANCSHARES, INC. Exhibit 99.1
Management Discussion of First Quarter Results
March 31, 2020
interchange income. Net merchant income declined $119 thousand, or 2.6%, mainly due to higher network expense, while net credit card fees increased $330 thousand, or 10.5% on lower rewards expense. Total net bank card fees this quarter were comprised of fees on corporate card ($23.0 million), debit card ($9.3 million), merchant ($4.4 million) and credit card ($3.5 million) transactions.
In the current quarter, trust fees increased $2.7 million, or 7.3%, over the same period last year, resulting from continued growth in private client fee income. Compared to the same period last year, deposit account fees increased $659 thousand, or 2.9%, due to growth in corporate cash management and deposit account fees. Additionally, capital market fees grew $1.9 million, or 101.7%, cash sweep fees grew $329 thousand, or 9.6%, and consumer brokerage service fees increased $330 thousand, or 8.8%, over amounts recorded in the same quarter last year.
Compared to the prior quarter, deposit account fees, bank card fees, and trust fees declined during the 1st quarter of 2020. Deposit account fees declined $1.3 million this quarter compared to the previous quarter due to lower corporate cash management and overdraft fees. Growth in capital market fees of $1.3 million partially offset these declines. Other non-interest income declined in the 1st quarter of 2020 mainly due to the sale of the Company’s corporate trust business in the prior quarter. Swap fees also declined $1.7 million in the current quarter compared to the prior quarter. Also, the Company’s deferred compensation plan assets are held in a trust and are recorded as both an asset and a liability. Fair value equity adjustments on these assets affecting both other income and other expense decreased $3.8 million from the same quarter last year and $3.6 million from the previous quarter. For the 1st quarter of 2020, non-interest income comprised 38.1% of the Company’s total revenue.
Investment Securities Gains and Losses
The Company recorded net securities losses of $13.3 million in the current quarter, compared to losses of $248 thousand in the prior quarter and losses of $925 thousand in the 1st quarter of 2019. Net securities losses in the current quarter primarily resulted from unrealized losses in the Company’s private equity investment portfolio, as the economic conditions resulting from the COVID-19 pandemic negatively impacted investment valuations.
Non-Interest Expense
Non-interest expense for the current quarter amounted to $193.7 million, compared to $191.4 million in the same period last year and $195.2 million in the prior quarter. The increase in non-interest expense compared to the same period last year was mainly due to higher salaries and employee benefits expense. Higher data processing and software expense also contributed to the increase. These increases in expense were partially offset by lower other non-interest expense.
Compared to the 1st quarter of last year, salaries and employee benefits expense increased $6.8 million, or 5.6%, driven mainly by growth in full-time salary costs and higher incentive compensation and retirement plan expense. Full-time equivalent employees totaled 4,854 and 4,841 at March 31, 2020 and 2019, respectively.
For the current quarter compared to the same quarter of last year, data processing and software expense increased $1.3
million due to higher costs for service providers. Supplies and communication expense decreased $504 thousand due to lower costs for debit and credit card reissuance and lower data network expense. Other non-interest expense decreased mostly due to lower operating losses, fees paid to outside service providers and travel and entertainment expenses, in addition to the decline in the Company’s deferred compensation liability, as mentioned previously. These decreases in expense were partially offset by a $1.1 million impairment on the Company’s mortgage servicing rights during the 1st quarter of 2020.
Income Taxes
The effective tax rate for the Company was 16.40% in the current quarter, 20.88% in the previous quarter, and 19.05% in the 1st quarter of 2019. The decrease in the effective tax rate in the current quarter compared to the prior quarter and the same quarter last year is mostly due to mix of taxable and non-taxable income and expenses.
Credit Quality
Net loan charge-offs in the 1st quarter of 2020 amounted to $10.9 million, compared to $15.2 million in the prior quarter and $11.7 million in the same period last year. The ratio of annualized net loan charge-offs to total average loans was .30% in the current quarter, .42% in the previous quarter, and .34% in the 1st quarter of last year. Compared to prior quarter, net loan charge-offs on commercial loans decreased $3.5 million to net recoveries of $394 thousand, while net loan charge-offs on personal banking loans decreased $883 thousand to $11.3 million.
In the 1st quarter of 2020, annualized net loan charge-offs on average consumer credit card loans were 5.06%, compared to 4.68% in the previous quarter, and 4.65% in the same quarter last year. Consumer loan net charge-offs were .35% of average consumer loans in the current quarter, .57% in the prior quarter and .40% in the same quarter last year.
On January 1, 2020, the Company adopted ASU 2016-13, "Measurement of Credit Losses on Financial Instruments", known as the current expected credit loss (CECL) model. As a result of CECL, the Company's provision for loan losses is now included in provision for credit losses on the income statement. Additionally, the provision for credit losses includes a provision for expected credit losses on the Company's unfunded lending commitments and available for sale securities. Upon adoption of CECL, our allowance for credit losses was reduced $21.0 million and our liability for unfunded lending commitments increased $16.1 million, resulting in a net increase to retained earnings of $3.8 million, net of tax.
This quarter, provision for credit losses for loans totaled $42.9 million and was $32.0 million greater than net loan charge-offs. The increase in the provision for credit losses on loans was driven by a significant deterioration of the economic forecast used in our CECL model as of March 31, 2020 due to the COVID-19 pandemic. At March 31, 2020, the allowance for credit losses on loans totaled $171.7 million, or 1.14% of total loans. Additionally, the provision for credit losses on unfunded lending commitments totaled $15.1 million. The liability for unfunded lending commitments at March 31, 2020 was $32.3 million.
At March 31, 2020, total non-performing assets amounted to $11.1 million, an increase of $470 thousand over the previous quarter. Non-performing assets are comprised of non-accrual
COMMERCE BANCSHARES, INC. Exhibit 99.1
Management Discussion of First Quarter Results
March 31, 2020
loans and foreclosed real estate ($10.6 million and $422 thousand, respectively). At March 31, 2020, the balance of non-accrual loans, which represented .07% of loans outstanding, included business loans of $7.4 million, business real estate loans of $1.5 million, and personal real estate loans of $1.7 million. Loans more than 90 days past due and still accruing interest totaled $16.5 million at March 31, 2020.
Other
During the 1st quarter of 2020, the Company paid a cash dividend of $.27 per common share, representing an 8.9% increase over the same period last year. The Company also paid an annualized 6% cash dividend on its preferred stock. The Company purchased 869,692 shares of treasury stock during the current quarter at an average price of $61.11.
Forward Looking Information
This information contains forward-looking statements within the meaning of the Private Securities Litigation Reform Act of 1995. Such statements include future financial and operating results, expectations, intentions and other statements that are not historical facts. Such statements are based on current beliefs and expectations of the Company’s management and are subject to significant risks and uncertainties. Actual results may differ materially from those set forth in the forward-looking statements.

Embracing a Growth Mindset COMMERCE BANCSHARES, INC. INVESTOR UPDATE 1st Quarter 2020
CAUTIONARY STATEMENT A number of statements we will be making in our presentation and in the accompanying slides are “forward-looking statements” within the meaning of the Private Securities Litigation Reform Act of 1995, such as statements of the Corporation’s plans, goals, objectives, expectations, projections, estimates and intentions. These forward- looking statements involve significant risks and uncertainties and are subject to change based on various factors (some of which are beyond the Corporation’s control). Factors that could cause the Corporation’s actual results to differ materially from such forward- looking statements made herein or by management of the Corporation are set forth in the Corporation’s 2019 Annual Report on Form 10-K and the Corporation’s Current Reports on Form 8-K. 2 2
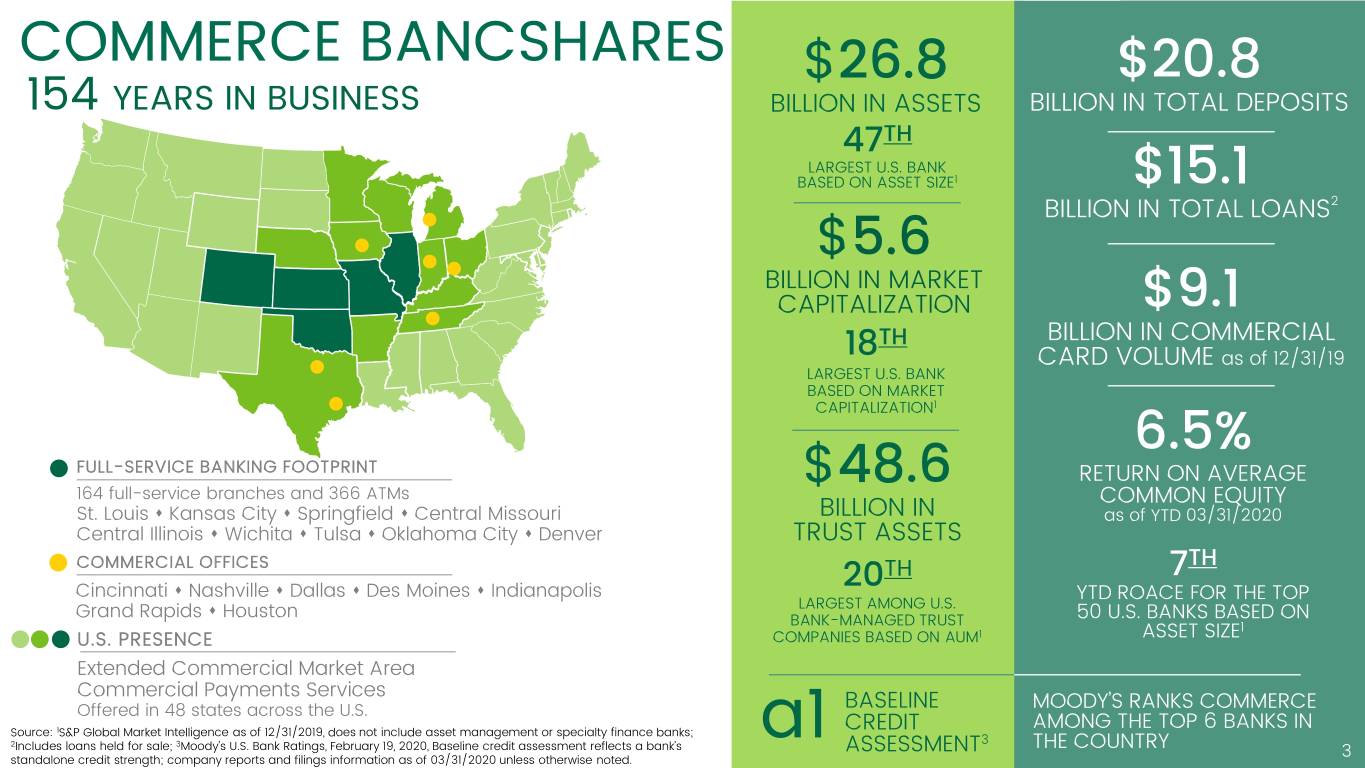
COMMERCE BANCSHARES $26.8 $20.8 154 YEARS IN BUSINESS BILLION IN ASSETS BILLION IN TOTAL DEPOSITS 47TH LARGEST U.S. BANK BASED ON ASSET SIZE1 $15.1 BILLION IN TOTAL LOANS2 $5.6 BILLION IN MARKET CAPITALIZATION $9.1 TH BILLION IN COMMERCIAL 18 CARD VOLUME as of 12/31/19 LARGEST U.S. BANK BASED ON MARKET CAPITALIZATION1 6.5% FULL-SERVICE BANKING FOOTPRINT RETURN ON AVERAGE 164 full-service branches and 366 ATMs $48.6 COMMON EQUITY St. Louis ⬧ Kansas City ⬧ Springfield ⬧ Central Missouri BILLION IN as of YTD 03/31/2020 Central Illinois ⬧ Wichita ⬧ Tulsa ⬧ Oklahoma City ⬧ Denver TRUST ASSETS COMMERCIAL OFFICES TH 7TH Cincinnati ⬧ Nashville ⬧ Dallas ⬧ Des Moines ⬧ Indianapolis 20 YTD ROACE FOR THE TOP Grand Rapids ⬧ Houston LARGEST AMONG U.S. 50 U.S. BANKS BASED ON BANK-MANAGED TRUST 1 U.S. PRESENCE COMPANIES BASED ON AUM1 ASSET SIZE Extended Commercial Market Area Commercial Payments Services Offered in 48 states across the U.S. BASELINE MOODY’S RANKS COMMERCE Source: 1S&P Global Market Intelligence as of 12/31/2019, does not include asset management or specialty finance banks; CREDIT AMONG THE TOP 6 BANKS IN 2 3 3 Includes loans held for sale; Moody’s U.S. Bank Ratings, February 19, 2020, Baseline credit assessment reflects a bank’s ASSESSMENT THE COUNTRY 3 standalone credit strength; company reports and filings information as of 03/31/2020 unless otherwise noted. a1
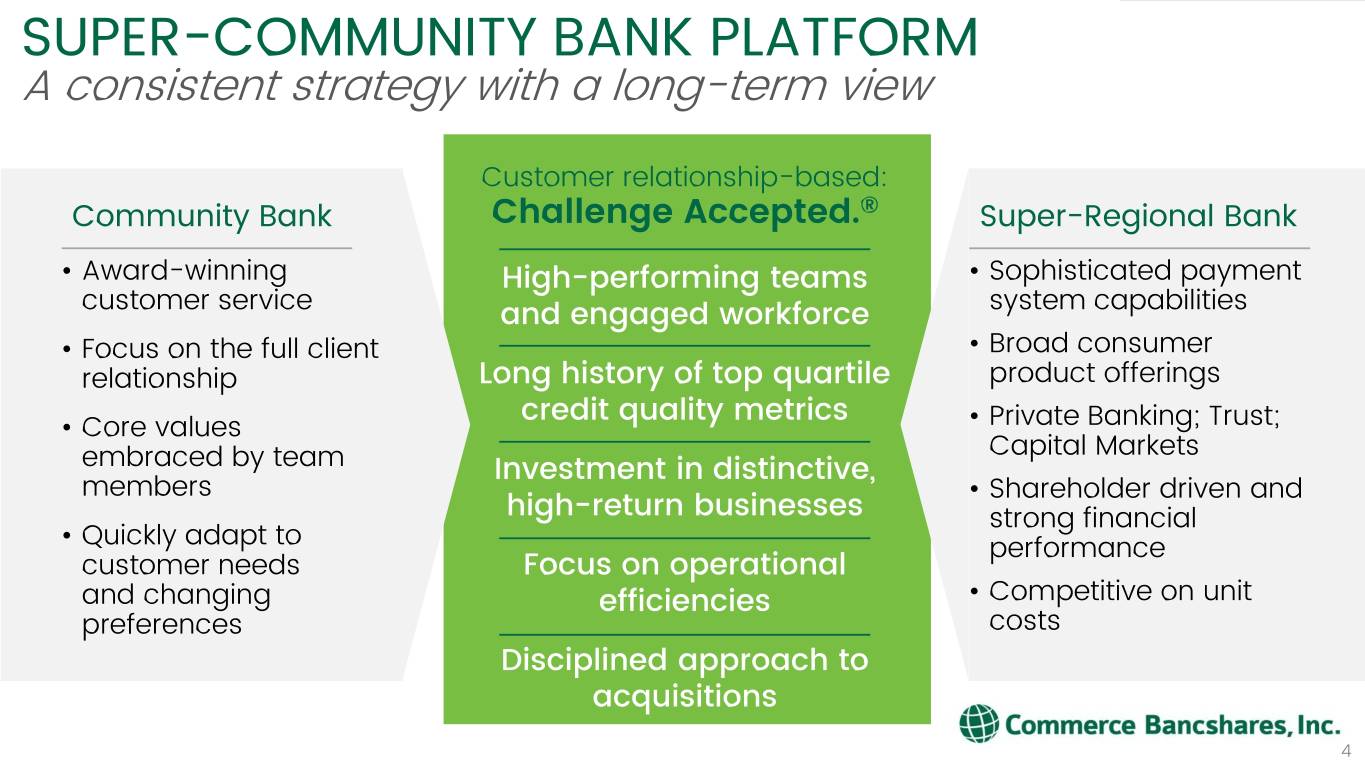
SUPER-COMMUNITY BANK PLATFORM A consistent strategy with a long-term view Customer relationship-based: Community Bank Challenge Accepted.® Super-Regional Bank • • Award-winning High-performing teams Sophisticated payment customer service and engaged workforce system capabilities • • Focus on the full client Broad consumer relationship Long history of top quartile product offerings credit quality metrics • • Core values Private Banking; Trust; Capital Markets embraced by team Investment in distinctive, members • Shareholder driven and high-return businesses • strong financial Quickly adapt to performance customer needs Focus on operational • and changing efficiencies Competitive on unit preferences costs Disciplined approach to acquisitions 4

OUR STRONG CULTURE IS THE KEY DRIVER TO OUR LONG-TERM SUCCESS A culture At Commerce, our core values shape the way we live and work. formed 150+ years ago to • We have a long We make decisions today that will be a force for V sustain us well into the future. good in our term View region and • We see diversity and inclusion as an our industry We collaborate O imperative and seize opportunities to as One team build teams that reflect all sides of We act with an issue. I Integrity • We value integrity, we recognize our first duty is to conduct business in We are C Customer ways that merit trust and confidence, focused and that adhere to the highest standards of governance and ethics. We strive for E • We value relationships, our Excellence customers are our primary focus. 5
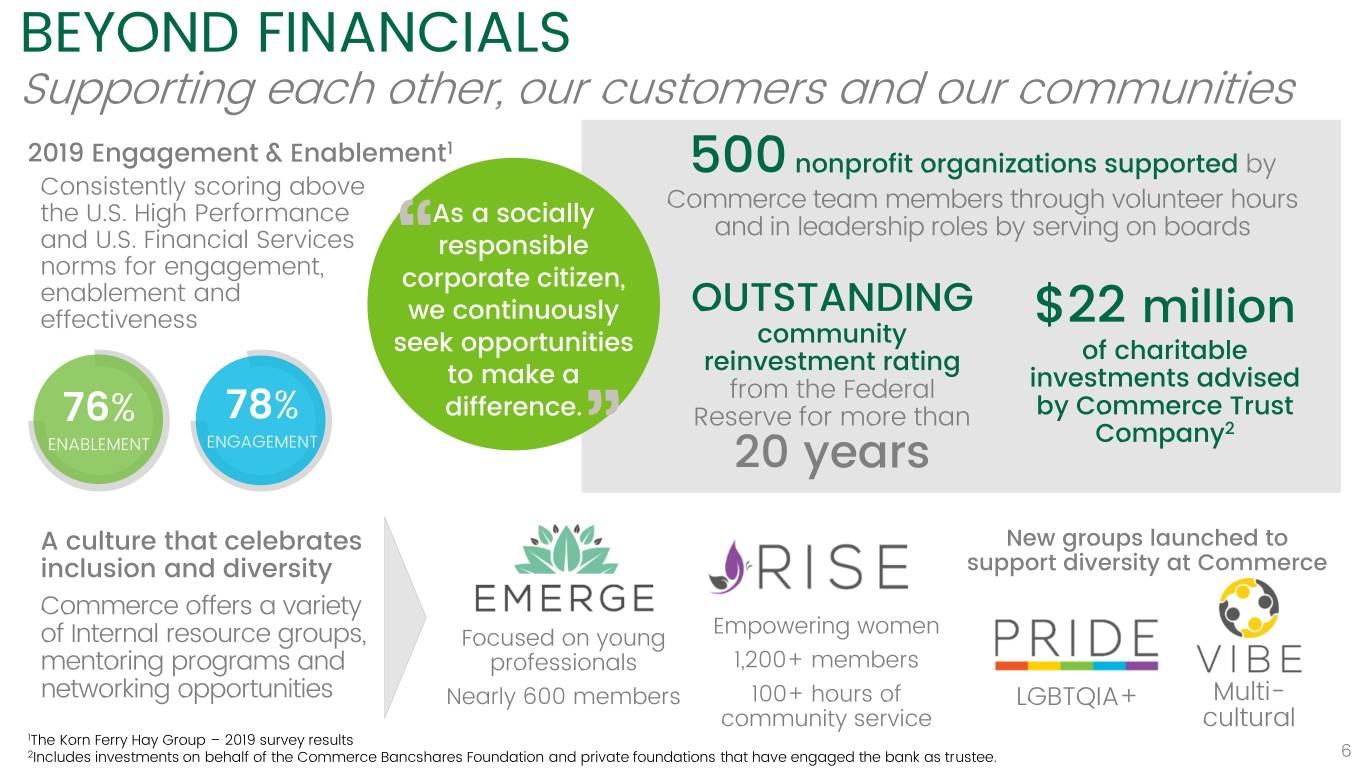
BEYOND FINANCIALS Supporting each other, our customers and our communities 1 2019 Engagement & Enablement nonprofit organizations supported by Consistently scoring above 500 Commerce team members through volunteer hours the U.S. High Performance As a socially and in leadership roles by serving on boards and U.S. Financial Services responsible norms for engagement, corporate citizen, enablement and OUTSTANDING effectiveness “we continuously $22 million seek opportunities community reinvestment rating of charitable to make a from the Federal investments advised 76% 78% difference. Reserve for more than by Commerce Trust Company2 ENABLEMENT ENGAGEMENT ” 20 years A culture that celebrates New groups launched to inclusion and diversity support diversity at Commerce Commerce offers a variety Empowering women of Internal resource groups, Focused on young mentoring programs and professionals 1,200+ members networking opportunities Nearly 600 members 100+ hours of LGBTQIA+ Multi- community service cultural 1The Korn Ferry Hay Group – 2019 survey results 2Includes investments on behalf of the Commerce Bancshares Foundation and private foundations that have engaged the bank as trustee. 6

RECENT RECOGNITION Commerce Bank was named a Commerce Bank was named among Top Midsize Employer by Forbes for America’s Best Banks 2020 by Forbes. the third consecutive year and Ranked in the top quartile nationally ranked in the top one-third among and 2nd Missouri-based bank. Since a selection of 500 employers. We the first list debuted, Commerce has placed 13th among all banking consistently ranked near the top and financial services companies among the highest-performing and 7th among employers institutions. headquartered in Missouri. Commerce Trust Company Commerce Bank was selected as received Highly Commended status one of 20 best-in-class banks in for Best Private Wealth Manager in Bank Director’s 2019 client services with assets over $5 RankingBanking study. We placed billion. PAM Awards recognize top third overall in the Midwest and investment professionals, wealth ranked first in the Midwest for Best advisors, legal firms, consultants Branch Network Strategy, Best Core and other key service providers Deposit Growth Strategy and Best operating within the private asset Retail Strategy. management industry. Commerce named Outstanding Employer 2019 by Korn Ferry1. The award publicly recognizes employers that have achieved best-in-class levels of engagement and enablement. Commerce is one of only three companies in the U.S. to receive this global award. 1The Korn Ferry Hay Group – based on 2018 survey results 7

Q1 FINANCIAL RESULTS 8
FINANCIAL PERFORMANCE VS. PRIOR YEAR Net Income Attributable to Earnings per Common Return on Total Average CBI ($ in Millions) Share As of March 31 $434 As of March 31 As of March 31 Assets $421 $3.60 $3.58 1.76% 1.67% 1.58% .80% $97 $0.81 $52 $0.44 YE 2018 YE 2019 YTD 2019 YTD 2020 YE 2018 YE 2019 YTD 2019 YTD 2020 YE 2018 YE 2019 YTD 2019 YTD 2020 Return on Average Common Period End Loans Period End Deposits Equity ($ in Billions) ($ in Billions) As of March 31 As of March 31 As of March 31 16.2% $20,324 $20,520 $19,974 $20,776 14.1% 13.6% $15,080 $14,161 $14,752 $14,141 6.5% YE 2018 YE 2019 YTD 2019 YTD 2020 YE 2018 YE 2019 YTD 2019 YTD 2020 YE 2018 YE 2019 YTD 2019 YTD 2020 As of March 31, 2020 9
DRIVERS OF 1ST QUARTER 2020 EARNINGS NIM decreased 3 bps to 3.33% from 3.36% in Q4 2019, driven by lower yields on commercial loans and investment securities. Growth in average Net Interest business and personal real estate loan balances increased net interest Margin income and helped to partially offset the impact of lower yields. Deposit costs decreased 7 bps from the previous quarter. TIPS income for the first quarter was $976 thousand compared to $1.3 million in the prior quarter. 2.0% fee income growth vs the same quarter in the prior year, driven by growth Fee Income in trust fees, capital market fees, deposit account fees, and net bank card fees. Non-Interest Expense was up 1.2% vs the same period last year, driven by increases in salaries and benefits, and data processing and software costs, partly offset by Expense lower other non-interest expense. Provision for credit losses for loans totaled $42.9 million and was $32.0 million CECL greater than net loan charge-offs. Also, recorded a provision for credit losses for unfunded lending commitments of $15.1 million. Recognized unrealized losses on our portfolio of private equity investments of Unrealized Losses $13.0 million gross, before minority interest adjustments. 10
NET INTEREST INCOME: YTD – March 31, 2020 Quarterly Net Interest Income ⦁ Net interest income (tax equivalent) declined slightly $220 (Tax Equivalent) 4.0% – from the prior quarter. $210 3.8% ⦁ The decrease from 1Q 2019 was mostly due to a $200 Net Yield decline in interest earned on loans due to lower 3.6% rates, partly offset by higher loan volume and lower $190 funding costs. 3.4% $180 ⦁ The net yield on interest earning assets declined 3 $ in millions in $ basis points from the previous quarter. $170 3.2% Net interest income interestNet $160 3.0% 1Q19 2Q19 3Q19 4Q19 1Q20 2019 Net int inc 2020 Net int inc TIPs Interest - $ in 000s $8,000 258 Net Yield Adjusted Net Yield* 256 *Adjusted to exclude TIPs inflation income $6,000 254 252 $4,000 250 CPI Tax equivalent - YTD 2019 2020 Change 248 - U $2,000 246 Rates earned - assets 3.93 % 3.66 % (0.27) % 244 Interest Interest income $0 242 Rates paid - liabilities 0.65 % 0.52 % (0.13) % 240 -$2,000 238 Net yield - earning assets 3.52 % 3.33 % (0.19) % 1Q17 1Q18 1Q19 2Q17 3Q17 4Q17 2Q18 3Q18 1Q20 2Q19 3Q19 4Q18 4Q19 Normal int. Inflation inc. CPI-U 1111
NIM PROTECTION Hedge against lower interest rates by purchasing interest rate floor contracts and maintaining duration Floor Impact on Loan Yields Maintaining Duration Assumes Loans at LIBOR +200bps 8% In addition to the interest rate Unhedged Illustrative floors, Commerce has been 2.5% Floor (effective 6/1/2020) extending fixed-rate bond maturities. Duration has been 6% 2.25% Floor (effective 1/1/2020) mostly maintained despite: 2% Floor (effective 12/15/2020) * — A large decline in rates Yield Current 1ML: 0.67% 4% increasing prepayment speeds Loan Entered into three interest rate floors with a combined — Strategic move out of 2% notional value of $1.5 billion, to hedge the risk of municipals (typically our declining interest rates on floating rate commercial longest securities) loans indexed to 1 Month LIBOR. Each contract has a term of 6 years. — Reduced monthly cash 0% flows to reinvest 0.0% 0.5% 1.0% 1.5% 2.0% 2.5% 3.0% 3.5% 4.0% 4.5% 5.0% 1 Month LIBOR *As of April 20, 2020 12 12
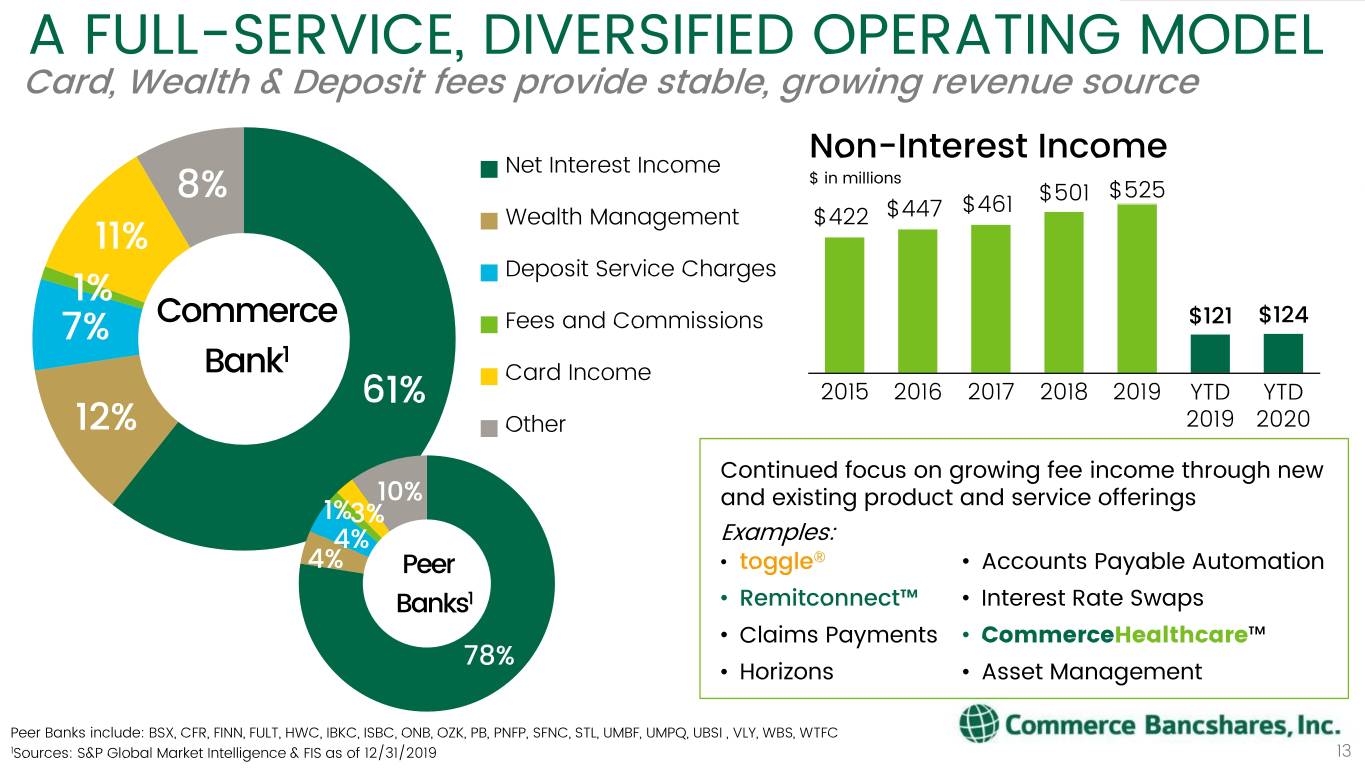
A FULL-SERVICE, DIVERSIFIED OPERATING MODEL Card, Wealth & Deposit fees provide stable, growing revenue source Non-Interest Income Net Interest Income $ in millions $501 $525 8% $461 Wealth Management $422 $447 11% Deposit Service Charges 1% 7% Commerce Fees and Commissions $121 $124 1 Bank Card Income 61% 2015 2016 2017 2018 2019 YTD YTD 12% Other 2019 2020 Continued focus on growing fee income through new 10% and existing product and service offerings 1%3% 4% Examples: 4% Peer • toggle® • Accounts Payable Automation • • Banks1 Remitconnect™ Interest Rate Swaps • Claims Payments • CommerceHealthcare™ 78% • Horizons • Asset Management Peer Banks include: BSX, CFR, FINN, FULT, HWC, IBKC, ISBC, ONB, OZK, PB, PNFP, SFNC, STL, UMBF, UMPQ, UBSI , VLY, WBS, WTFC 1Sources: S&P Global Market Intelligence & FIS as of 12/31/2019 13
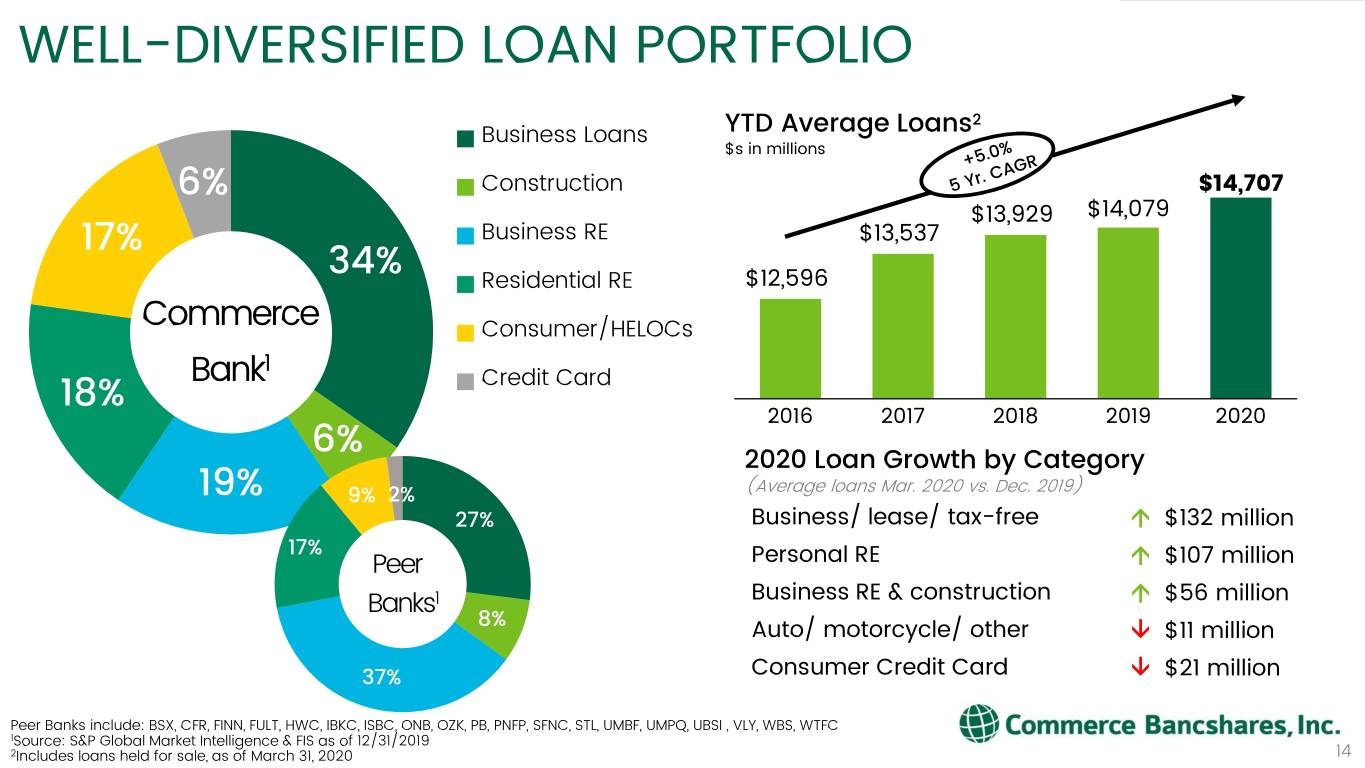
WELL-DIVERSIFIED LOAN PORTFOLIO 2 Business Loans YTD Average Loans $s in millions 6% Construction $14,707 $13,929 $14,079 17% Business RE $13,537 34% Residential RE $12,596 Commerce Consumer/HELOCs 1 Bank Credit Card 18% 2016 2017 2018 2019 2020 6% 2020 Loan Growth by Category (Average loans Mar. 2020 vs. Dec. 2019) 19% 9% 2% 27% Business/ lease/ tax-free $132 million 17% Peer Personal RE $107 million Banks1 Business RE & construction $56 million 8% Auto/ motorcycle/ other $11 million 37% Consumer Credit Card $21 million Peer Banks include: BSX, CFR, FINN, FULT, HWC, IBKC, ISBC, ONB, OZK, PB, PNFP, SFNC, STL, UMBF, UMPQ, UBSI , VLY, WBS, WTFC 1Source: S&P Global Market Intelligence & FIS as of 12/31/2019 2Includes loans held for sale, as of March 31, 2020 14
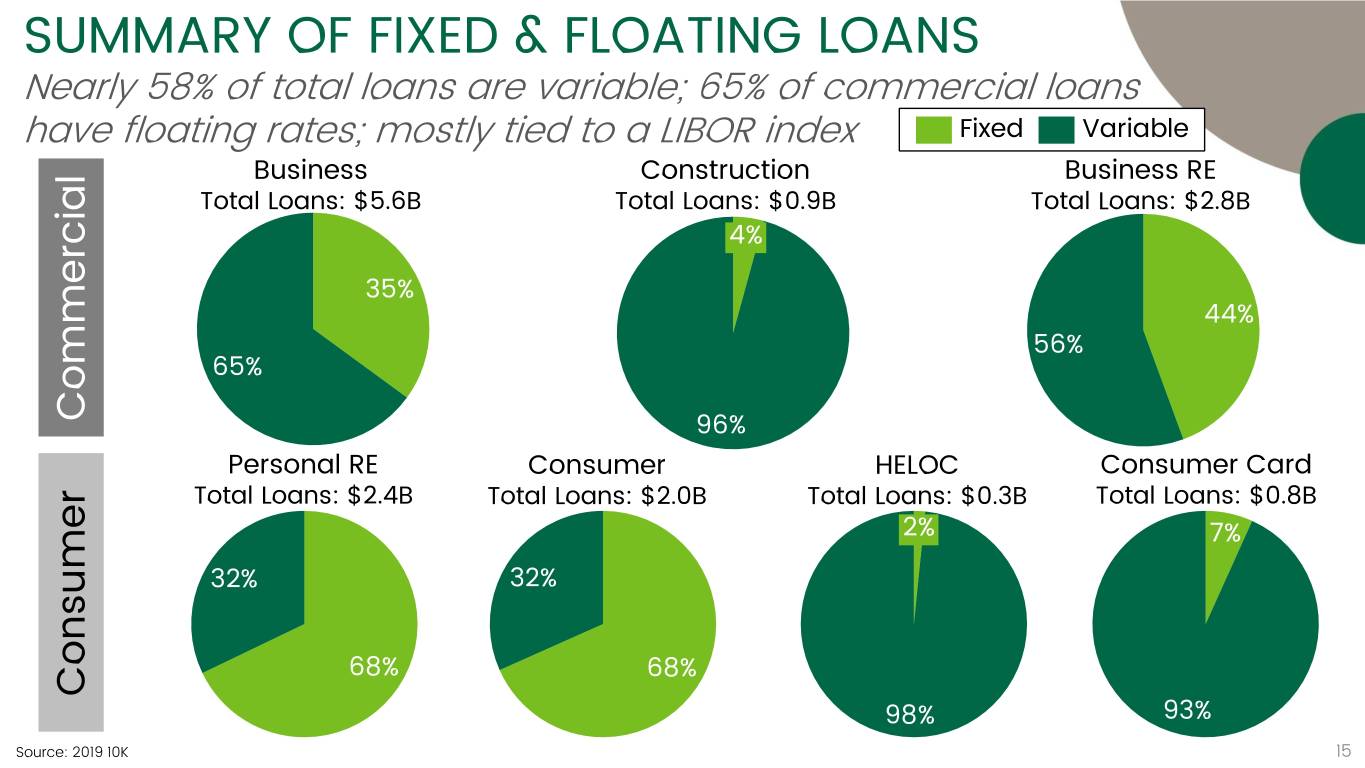
SUMMARY OF FIXED & FLOATING LOANS Nearly 58% of total loans are variable; 65% of commercial loans have floating rates; mostly tied to a LIBOR index Fixed Variable Business Construction Business RE Total Loans: $5.6B Total Loans: $0.9B Total Loans: $2.8B 4% 35% 44% 56% 65% Commercial 96% Personal RE Consumer HELOC Consumer Card Total Loans: $2.4B Total Loans: $2.0B Total Loans: $0.3B Total Loans: $0.8B 2% 7% 32% 32% 68% 68% Consumer 98% 93% 15 Source: 2019 10K 15
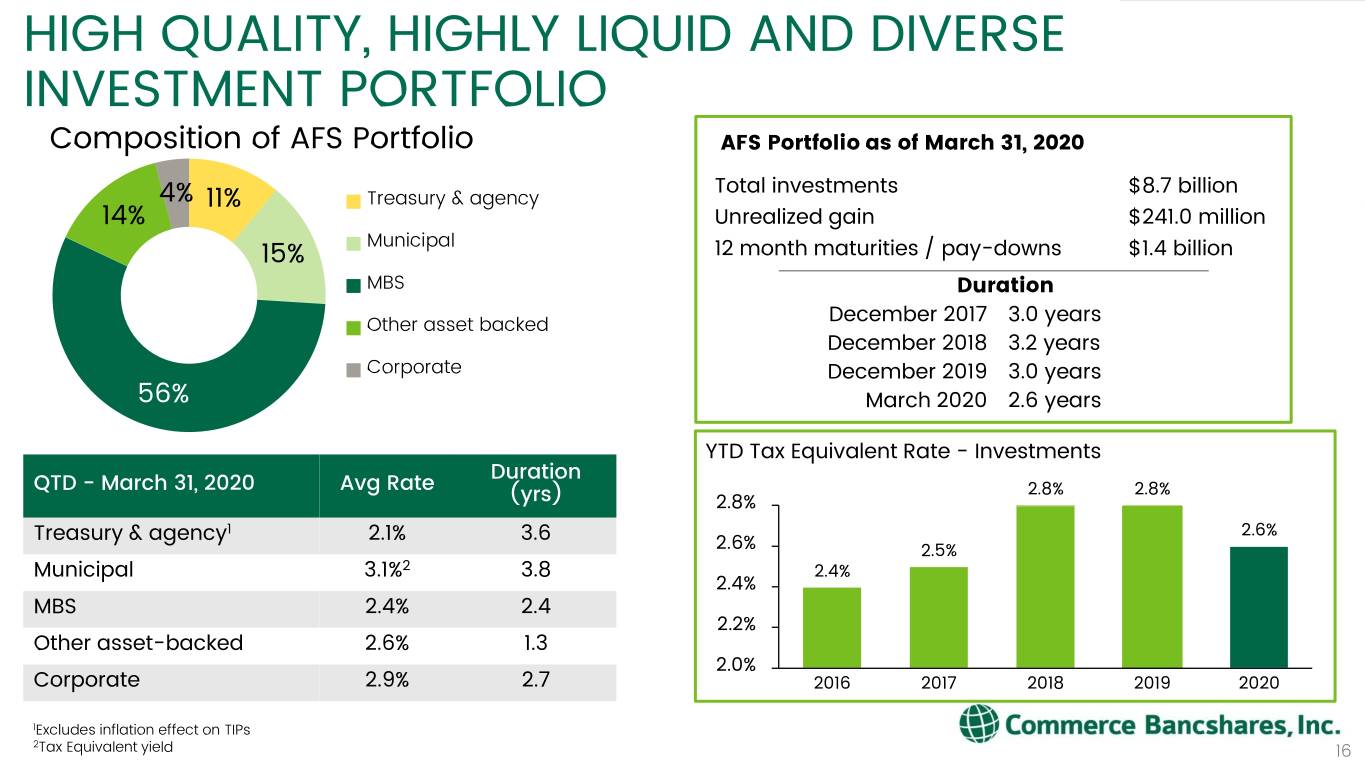
HIGH QUALITY, HIGHLY LIQUID AND DIVERSE INVESTMENT PORTFOLIO Composition of AFS Portfolio AFS Portfolio as of March 31, 2020 Total investments $8.7 billion 4% 11% Treasury & agency 14% Unrealized gain $241.0 million Municipal 15% 12 month maturities / pay-downs $1.4 billion MBS Duration Other asset backed December 2017 3.0 years December 2018 3.2 years Corporate December 2019 3.0 years 56% March 2020 2.6 years YTD Tax Equivalent Rate - Investments Duration QTD - March 31, 2020 Avg Rate 2.8% 2.8% (yrs) 2.8% Treasury & agency1 2.1% 3.6 2.6% 2.6% 2.5% Municipal 3.1%2 3.8 2.4% 2.4% MBS 2.4% 2.4 2.2% Other asset-backed 2.6% 1.3 2.0% Corporate 2.9% 2.7 2016 2017 2018 2019 2020 1Excludes inflation effect on TIPs 2 16 Tax Equivalent yield 16
IMPACT OF CECL: ALLOCATION OF ALLOWANCE March 31, 2020 CECL allowances reflect the economic and market outlook due to COVID-19 December 31, 2019 January 1, 2020 March 31, 2020 Methodology and Incurred Model CECL Adoption CECL Model Variables Allowance Allowance Allowance % of for Credit % of for Credit % of • CECL model utilizes 3rd for Loan outstanding Losses outstanding Losses outstanding party baseline forecast $ in millions Losses Loans (ACL) Loans (ACL) Loans • Business $ 44.3 0.80% $ 37.9 0.68% $ 47.0 0.81% Key variables include: GDP, disposable income, Bus R/E 25.9 0.91% 14.9 0.53% 18.7 0.63% unemployment rate, Construction 21.6 2.40% 9.2 1.02% 17.8 2.04% various interest rates, CPI Commercial total $ 91.8 0.99% $ 62.1 0.67% $ 83.6 0.87% inflation rate, HPI, CREPI and Consumer 15.9 0.82% 14.6 0.75% 18.2 0.94% market volatility Consumer CC 48.0 6.27% 56.4 7.37% 62.4 8.83% • Q1 provision for credit loss Personal R/E 3.1 0.13% 4.9 0.21% 5.6 0.23% expense of $58.0 million, Revolving H/E 0.6 0.18% 1.6 0.46% 1.9 0.53% includes $47.1 million CECL Overdrafts 1.2 19.52% 0.1 1.63% 0.1 3.27% related reserve increase Consumer total $ 68.9 1.27% $ 77.6 1.43% $ 88.1 1.61% − $32.0 million for loans Allowance for credit losses on loans $ 160.7 1.09% $ 139.6 0.95% $ 171.7 1.14% Liability for unfunded lending − $15.1 million for commitments 1.1 17.2 32.3 unfunded lending Total allowance for credit losses $ 161.8 $ 156.8 $ 203.9 commitments Highlights • Day 1 CECL adjustment of -$21.0MM to ACL - loans; $16.1MM adjustment to unfunded commitment liability • 1st quarter adjustment provision for credit losses mostly due to COVID-19 * Note: The allowance for unfunded lending commitments is included in Other liabilities on the consolidated balance sheets. 17
NET LOAN CHARGE-OFFS: YTD – March 31, 2020 ‘20 ⦁ YTD YTD Actual Loss The YTD decrease in 2019 2020 $ Change Rate business loan net charge- $ in 000s offs was primarily due to a Business $ 447 $ (373) $ (820) (0.03)% recovery on a single Overdraft 317 426 109 42.37 % leasing customer. Construction (16) — 16 0.00 % ⦁ Loss rate on credit card Business R/E (37) (21) 16 0.00 % loans increased 38 bps to Personal R/E 101 (4) (105) 0.00 % 5.06% in the 1st quarter. Consumer 1,924 1,711 (213) 0.35 % ⦁ HELOC 19 (38) (57) (0.04)% Credit card delinquencies remain elevated. Credit card 8,958 9,157 199 5.06 % Total $ 11,713 $ 10,858 $ (855) 0.30 % $200 Non-Performing Assets to Allowance 0.5% $15 90-Day Delinquencies: Credit Card & Consumer Loans $160 0.4% NPAs to Loans $10 $120 0.3% $80 0.2% $5 $ in millions in $ $ in $ millions $40 0.1% $0 0.0% $0 2016 2017 2018 2019 1Q20 Mar18 Sep18 Mar19 Sep19 Mar20 $ Allow for Loan Loss % NPA to Total Loans Credit card Consumer $ Non-Perform Assets 18

COMMERCE AND COVID-19 19
COMMERCE’S PREPAREDNESS AND RESPONSE TO COVID-19 Taking care of our customers and team members is our top priority • Activated our Pandemic Preparedness and Response Plan and COVID-19 Task Force. • Validated Business Continuity Plans for all teams, including successful use of remote access. • Built-in resiliency with campuses in both St. Louis and Kansas City, as well as our business resumption site. • Proactively communicating with customers across our business lines to reassure them of our resiliency and to offer our guidance for any financial challenges they may encounter. • Contacting key suppliers to verify their continuity plans and confirm their ability to maintain service levels. • Participating in multiple industry resource groups specific to this topic in order to share best practices. 20
KEY ACTIONS TAKEN IN RESPONSE TO COVID-19 We continue to monitor the outbreak & implement updates as the situation evolves. 2018-January 2020 February 2020 Early March 2020 Mid-late March 2020 April 2020 ✓ Enhanced cleaning protocols ✓ March 17: Closed branch ✓ Rolled-out SBA Loan ✓ ✓ Activated Plan Appointed and ordered additional lobbies; drive-thru only program Pandemic Planning and COVID-19 cleaning/safety supplies Task Force ✓ Began daily internal ✓ Implemented premium ✓ Committee & Verified critical suppliers communications and pay for hourly team ✓ published plan First all-team ✓ Expanded remote worker regular CEO video members who cannot communication capabilities, including messages work remotely ✓ Conducted ✓ Established Customer Care Center ✓ Restricted all business ✓ Upgraded IT systems, Pandemic social media ✓ March 10: Restricted travel travel; all meetings processes & equipment Response Tabletop monitoring ✓ Began daily executive virtual or by phone for an improved Exercises management briefings ✓ Launched Consumer & remote-working experience ✓ Business relief programs ✓ Jan: Began Launched COVID-19 page ✓ ✓ Ongoing monitoring the on CB.com and internal Implemented 100% of resource site distributed workforce communication with COVID-19 outbreak ✓ plans our team and Enhanced social distancing customers and began ✓ policies Reduced operating ✓ preparedness ✓ hours in select branches; Continue to monitor March 13: limited all internal legislative changes & discussions gatherings to <20; restricted alternating schedule for branch staff stay-at-home orders access to buildings; 21 activated recovery sites 21
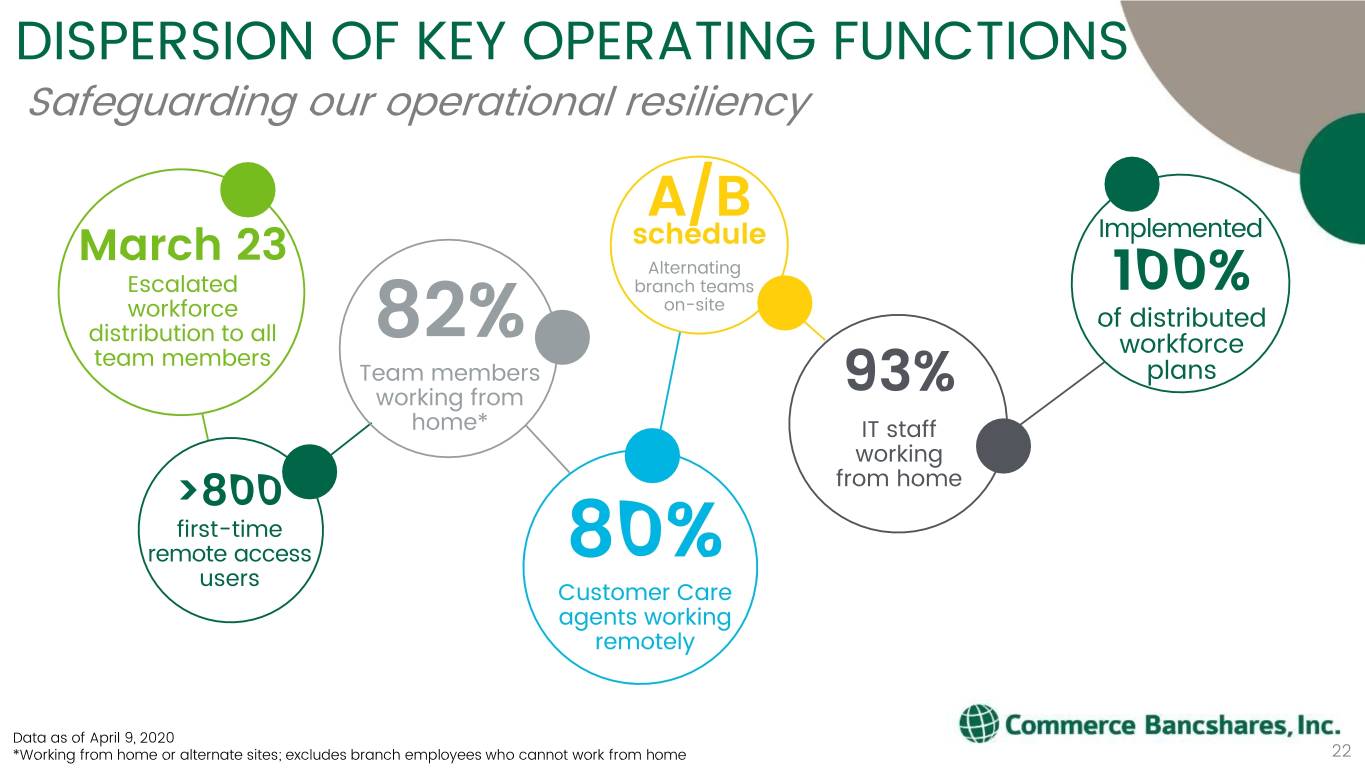
DISPERSION OF KEY OPERATING FUNCTIONS Safeguarding our operational resiliency scheduleA/B Implemented March 23 Alternating Escalated branch teams on-site 100% workforce of distributed distribution to all workforce team members 82% Team members plans working from 93% home* IT staff working >800 from home first-time remote access users 80% Customer Care agents working remotely Data as of April 9, 2020 *Working from home or alternate sites; excludes branch employees who cannot work from home 22
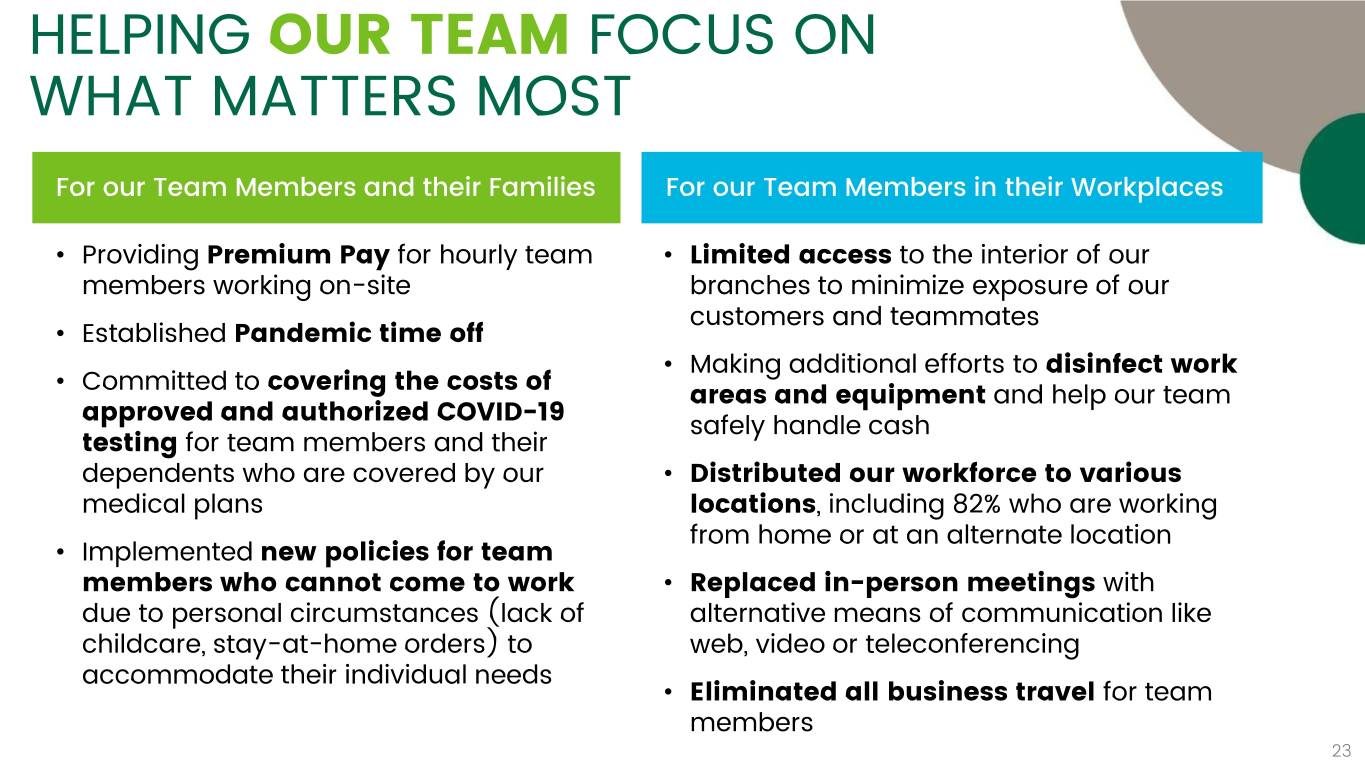
HELPING OUR TEAM FOCUS ON WHAT MATTERS MOST For our Team Members and their Families For our Team Members in their Workplaces • Providing Premium Pay for hourly team • Limited access to the interior of our members working on-site branches to minimize exposure of our customers and teammates • Established Pandemic time off • Making additional efforts to disinfect work • Committed to covering the costs of areas and equipment and help our team approved and authorized COVID-19 safely handle cash testing for team members and their dependents who are covered by our • Distributed our workforce to various medical plans locations, including 82% who are working from home or at an alternate location • Implemented new policies for team members who cannot come to work • Replaced in-person meetings with due to personal circumstances (lack of alternative means of communication like childcare, stay-at-home orders) to web, video or teleconferencing accommodate their individual needs • Eliminated all business travel for team members 23
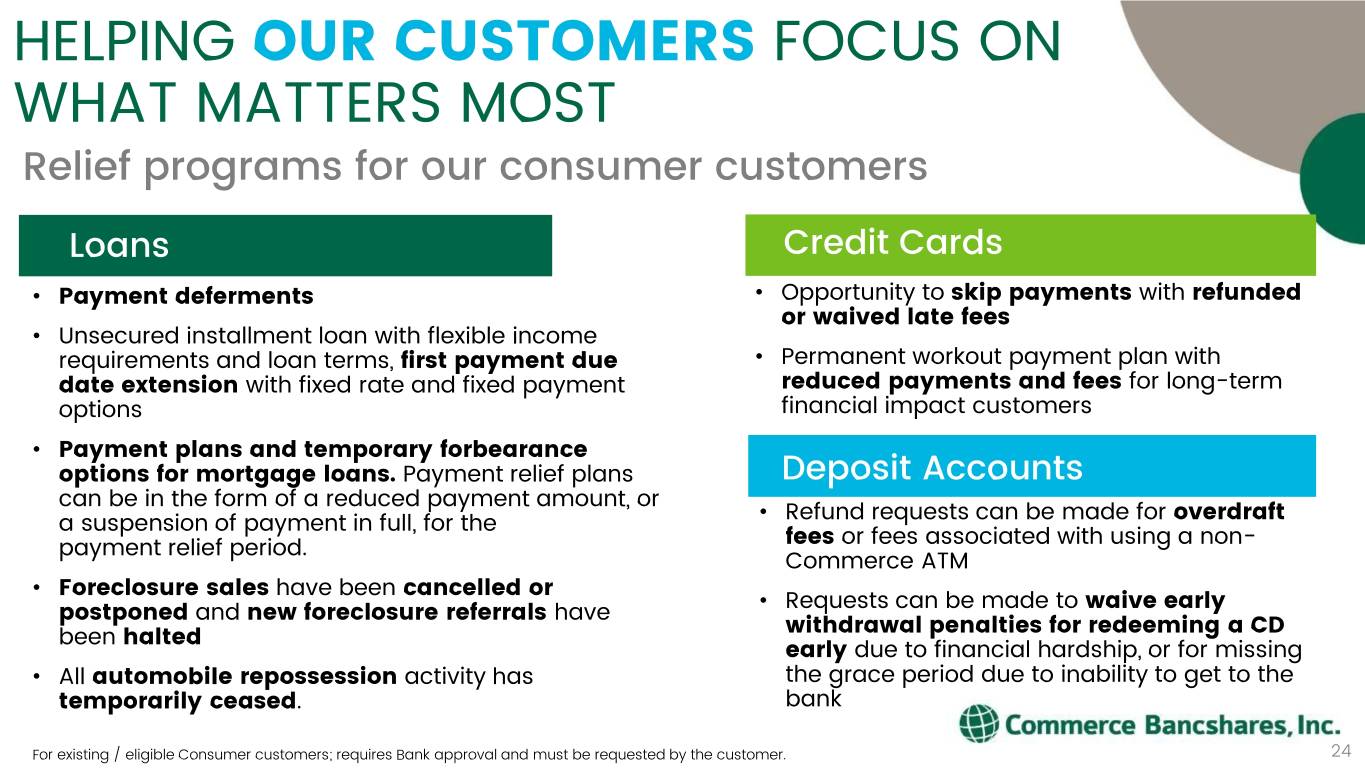
HELPING OUR CUSTOMERS FOCUS ON WHAT MATTERS MOST Relief programs for our consumer customers Loans Credit Cards • Payment deferments • Opportunity to skip payments with refunded or waived late fees • Unsecured installment loan with flexible income requirements and loan terms, first payment due • Permanent workout payment plan with date extension with fixed rate and fixed payment reduced payments and fees for long-term options financial impact customers • Payment plans and temporary forbearance options for mortgage loans. Payment relief plans Deposit Accounts can be in the form of a reduced payment amount, or • Refund requests can be made for overdraft a suspension of payment in full, for the fees or fees associated with using a non- payment relief period. Commerce ATM • Foreclosure sales have been cancelled or • Requests can be made to waive early postponed and new foreclosure referrals have withdrawal penalties for redeeming a CD been halted early due to financial hardship, or for missing • All automobile repossession activity has the grace period due to inability to get to the temporarily ceased. bank For existing / eligible Consumer customers; requires Bank approval and must be requested by the customer. 24
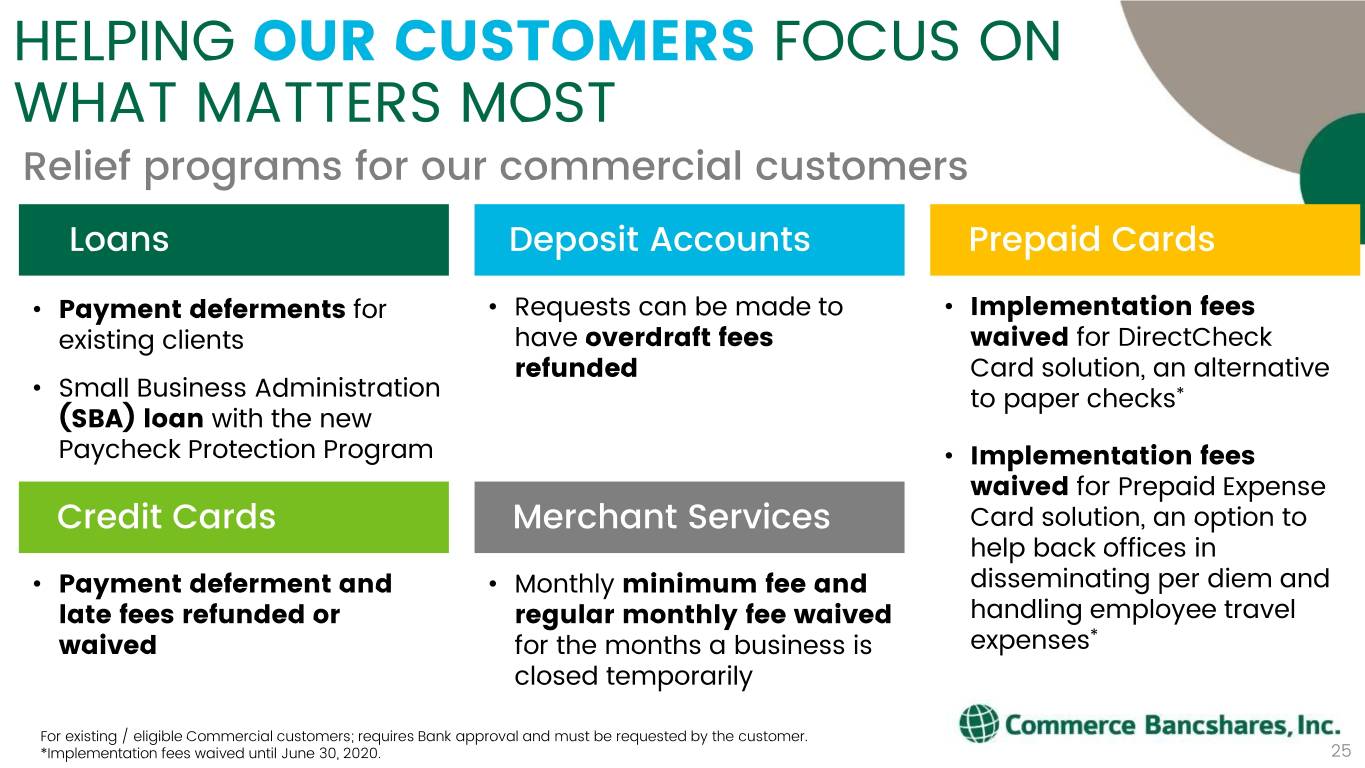
HELPING OUR CUSTOMERS FOCUS ON WHAT MATTERS MOST Relief programs for our commercial customers Loans Deposit Accounts Prepaid Cards • Payment deferments for • Requests can be made to • Implementation fees existing clients have overdraft fees waived for DirectCheck • refunded Card solution, an alternative Small Business Administration to paper checks* (SBA) loan with the new Paycheck Protection Program • Implementation fees waived for Prepaid Expense Credit Cards Merchant Services Card solution, an option to help back offices in • Payment deferment and • Monthly minimum fee and disseminating per diem and late fees refunded or regular monthly fee waived handling employee travel * waived for the months a business is expenses closed temporarily For existing / eligible Commercial customers; requires Bank approval and must be requested by the customer. *Implementation fees waived until June 30, 2020. 25
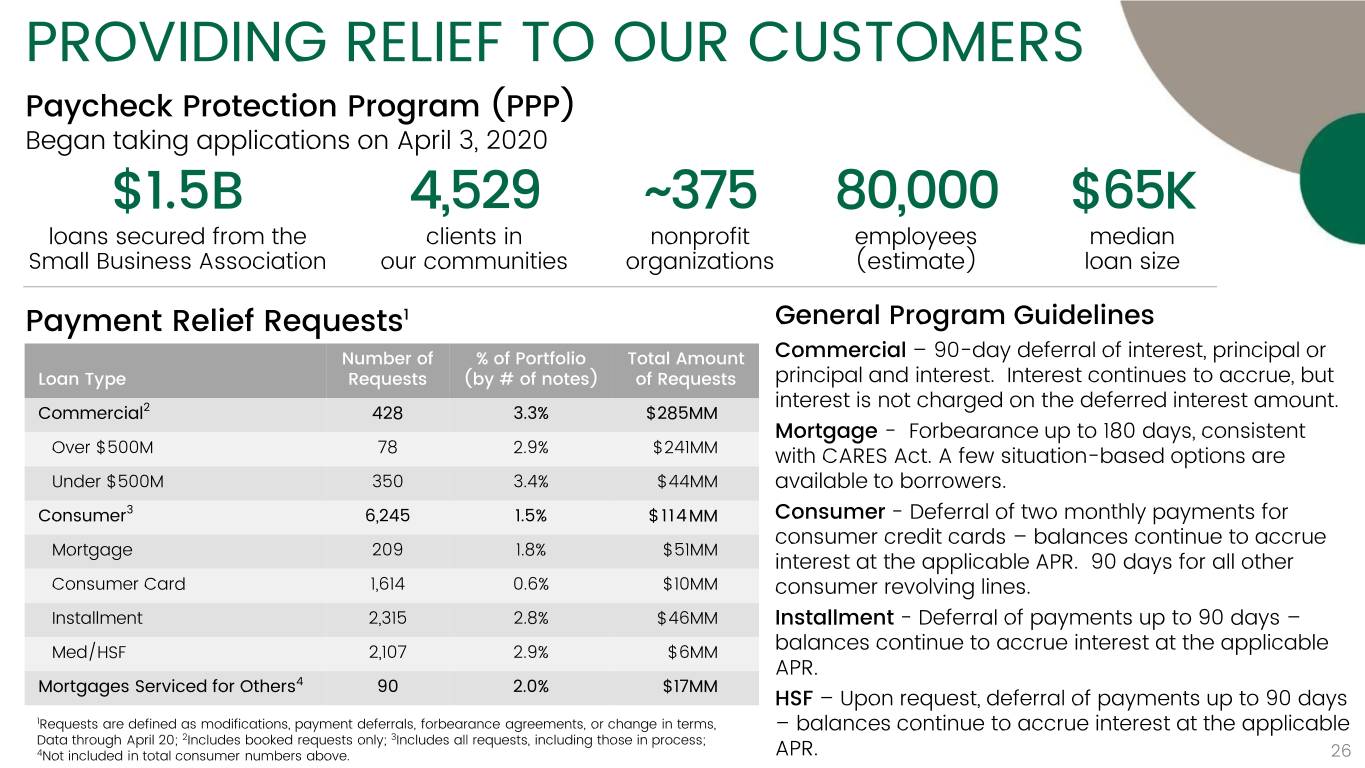
PROVIDING RELIEF TO OUR CUSTOMERS Paycheck Protection Program (PPP) Began taking applications on April 3, 2020 $1.5B 4,529 ~375 80,000 $65K loans secured from the clients in nonprofit employees median Small Business Association our communities organizations (estimate) loan size Payment Relief Requests1 General Program Guidelines Number of % of Portfolio Total Amount Commercial – 90-day deferral of interest, principal or Loan Type Requests (by # of notes) of Requests principal and interest. Interest continues to accrue, but 2 interest is not charged on the deferred interest amount. Commercial 428 3.3% $285MM Mortgage - Forbearance up to 180 days, consistent Over $500M 78 2.9% $241MM with CARES Act. A few situation-based options are Under $500M 350 3.4% $44MM available to borrowers. Consumer3 6,245 1.5% $114MM Consumer - Deferral of two monthly payments for consumer credit cards – balances continue to accrue Mortgage 209 1.8% $51MM interest at the applicable APR. 90 days for all other Consumer Card 1,614 0.6% $10MM consumer revolving lines. Installment 2,315 2.8% $46MM Installment - Deferral of payments up to 90 days – Med/HSF 2,107 2.9% $6MM balances continue to accrue interest at the applicable APR. Mortgages Serviced for Others4 90 2.0% $17MM HSF – Upon request, deferral of payments up to 90 days 1Requests are defined as modifications, payment deferrals, forbearance agreements, or change in terms, – balances continue to accrue interest at the applicable Data through April 20; 2Includes booked requests only; 3Includes all requests, including those in process; 4Not included in total consumer numbers above. APR. 26
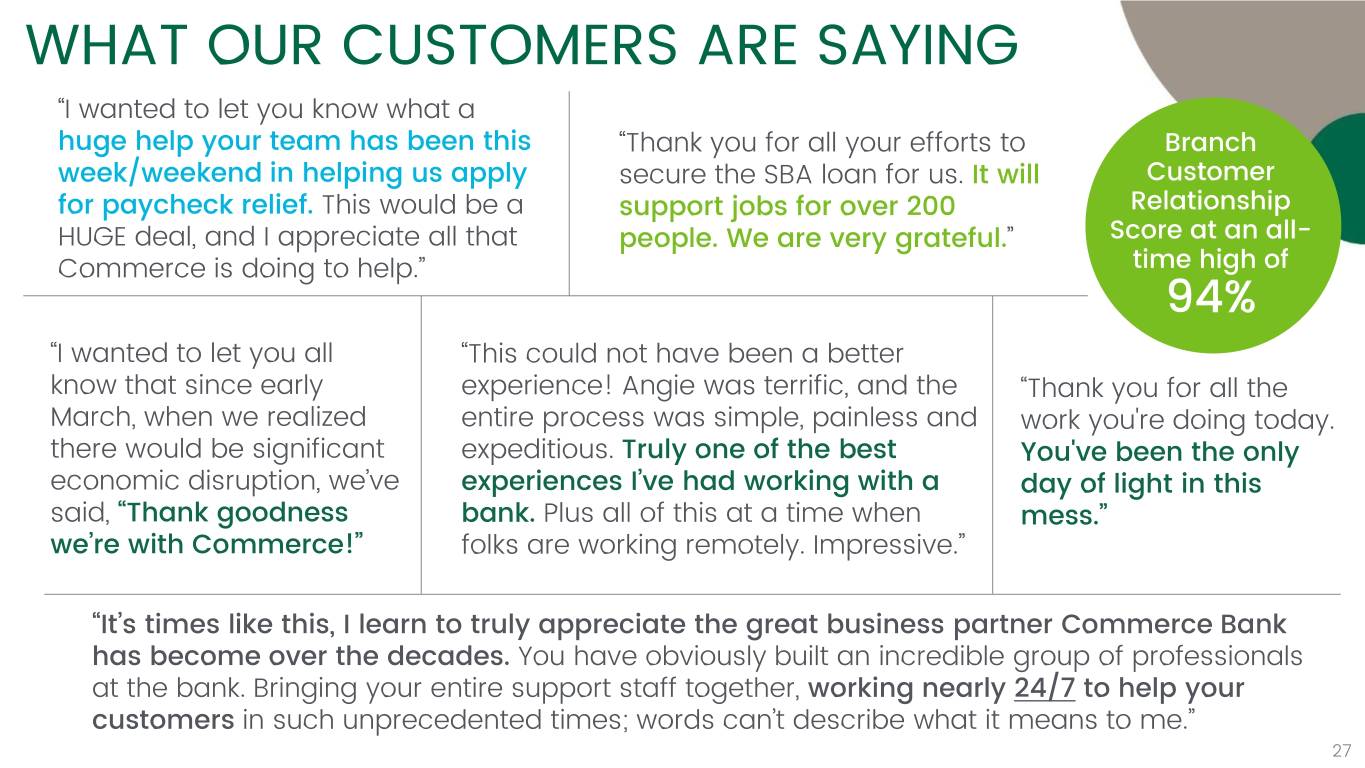
WHAT OUR CUSTOMERS ARE SAYING “I wanted to let you know what a huge help your team has been this “Thank you for all your efforts to Branch week/weekend in helping us apply secure the SBA loan for us. It will Customer for paycheck relief. This would be a support jobs for over 200 Relationship HUGE deal, and I appreciate all that people. We are very grateful.” Score at an all- Commerce is doing to help.” time high of 94% “I wanted to let you all “This could not have been a better know that since early experience! Angie was terrific, and the “Thank you for all the March, when we realized entire process was simple, painless and work you're doing today. there would be significant expeditious. Truly one of the best You've been the only economic disruption, we’ve experiences I’ve had working with a day of light in this said, “Thank goodness bank. Plus all of this at a time when mess.” we’re with Commerce!” folks are working remotely. Impressive.” “It’s times like this, I learn to truly appreciate the great business partner Commerce Bank has become over the decades. You have obviously built an incredible group of professionals at the bank. Bringing your entire support staff together, working nearly 24/7 to help your customers in such unprecedented times; words can’t describe what it means to me.” 27
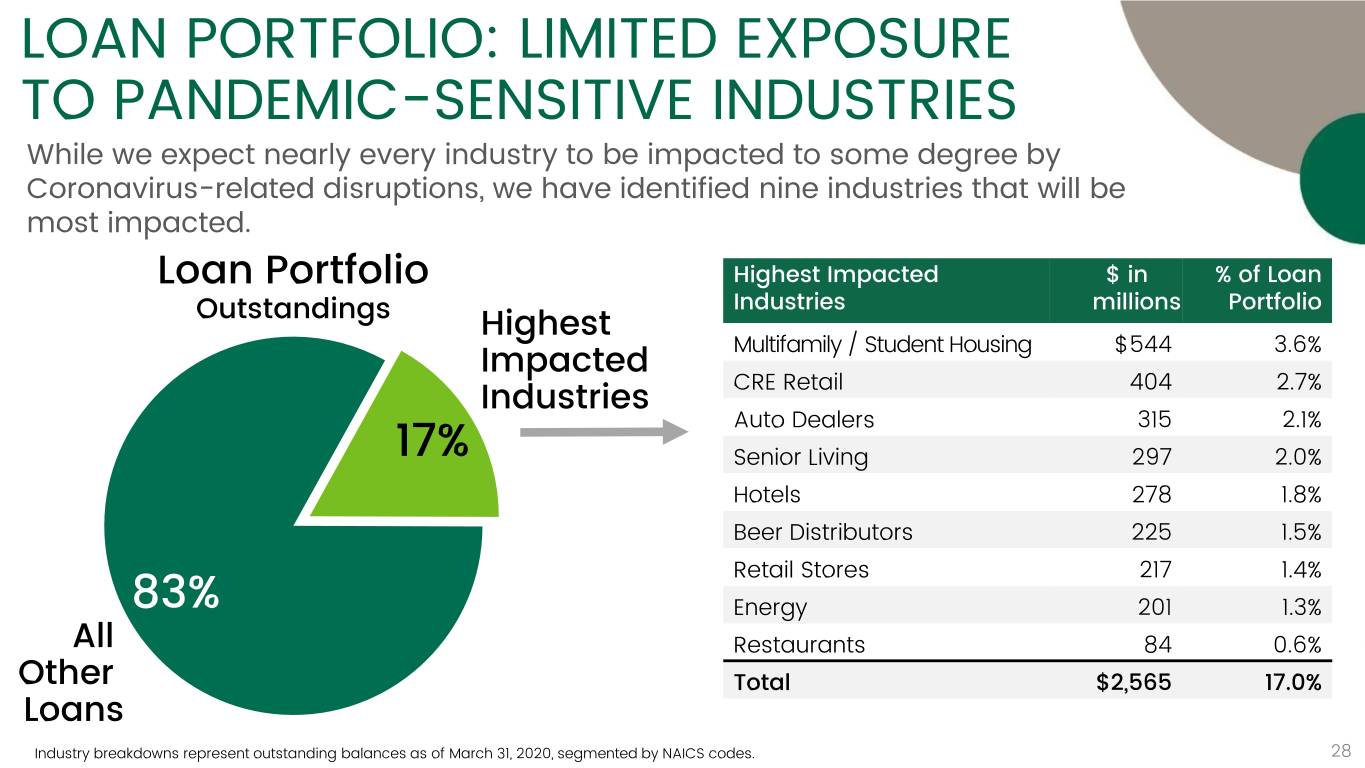
LOAN PORTFOLIO: LIMITED EXPOSURE TO PANDEMIC-SENSITIVE INDUSTRIES While we expect nearly every industry to be impacted to some degree by Coronavirus-related disruptions, we have identified nine industries that will be most impacted. Loan Portfolio Highest Impacted $ in % of Loan Industries millions Portfolio Outstandings Highest Multifamily / Student Housing $544 3.6% Impacted CRE Retail 404 2.7% Industries Auto Dealers 315 2.1% 17% Senior Living 297 2.0% Hotels 278 1.8% Beer Distributors 225 1.5% Retail Stores 217 1.4% 83% Energy 201 1.3% All Restaurants 84 0.6% Other Total $2,565 17.0% Loans Industry breakdowns represent outstanding balances as of March 31, 2020, segmented by NAICS codes. 28
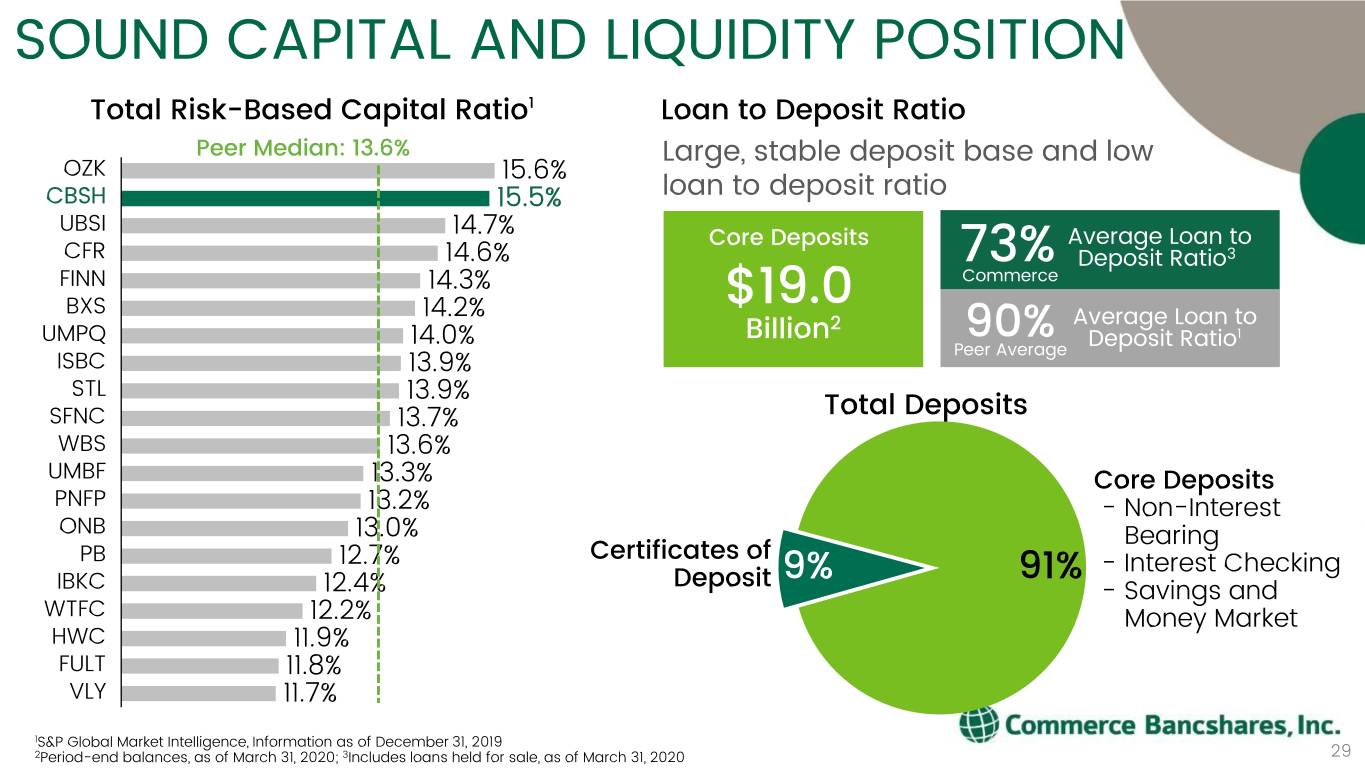
SOUND CAPITAL AND LIQUIDITY POSITION Total Risk-Based Capital Ratio1 Loan to Deposit Ratio Peer Median: 13.6% Large, stable deposit base and low OZK 15.6% CBSH 15.5% loan to deposit ratio UBSI 14.7% Core Deposits Average Loan to CFR 14.6% 73% Deposit Ratio3 FINN 14.3% Commerce BXS 14.2% $19.02 Average Loan to UMPQ Billion 1 14.0% Peer90% Average Deposit Ratio ISBC 13.9% STL 13.9% SFNC 13.7% Total Deposits WBS 13.6% UMBF 13.3% Core Deposits PNFP 13.2% - Non-Interest ONB 13.0% Bearing Certificates of PB 12.7% 9% 91% - Interest Checking IBKC 12.4% Deposit - Savings and WTFC 12.2% Money Market HWC 11.9% FULT 11.8% VLY 11.7% 1S&P Global Market Intelligence, Information as of December 31, 2019 2Period-end balances, as of March 31, 2020; 3Includes loans held for sale, as of March 31, 2020 29
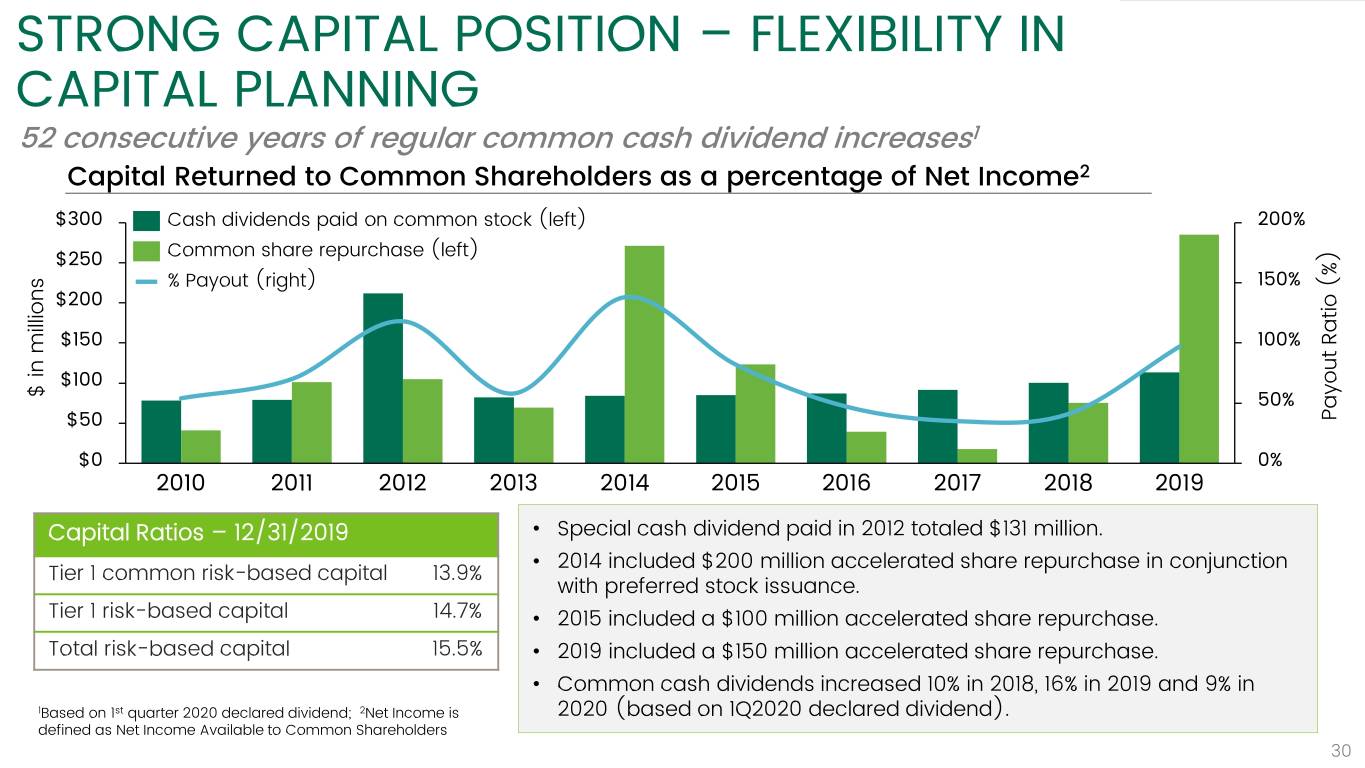
STRONG CAPITAL POSITION – FLEXIBILITY IN CAPITAL PLANNING 52 consecutive years of regular common cash dividend increases1 Capital Returned to Common Shareholders as a percentage of Net Income2 $300 Cash dividends paid on common stock (left) 200% $250 Common share repurchase (left) % Payout (right) 150% $200 $150 100% $100 $ in millions in $ 50% $50 (%) Ratio Payout $0 0% 2010 2011 2012 2013 2014 2015 2016 2017 2018 2019 Capital Ratios – 12/31/2019 • Special cash dividend paid in 2012 totaled $131 million. • 2014 included $200 million accelerated share repurchase in conjunction Tier 1 common risk-based capital 13.9% with preferred stock issuance. Tier 1 risk-based capital 14.7% • 2015 included a $100 million accelerated share repurchase. Total risk-based capital 15.5% • 2019 included a $150 million accelerated share repurchase. • Common cash dividends increased 10% in 2018, 16% in 2019 and 9% in 1Based on 1st quarter 2020 declared dividend; 2Net Income is 2020 (based on 1Q2020 declared dividend). defined as Net Income Available to Common Shareholders 30 30

STRATEGIC POSITION 31
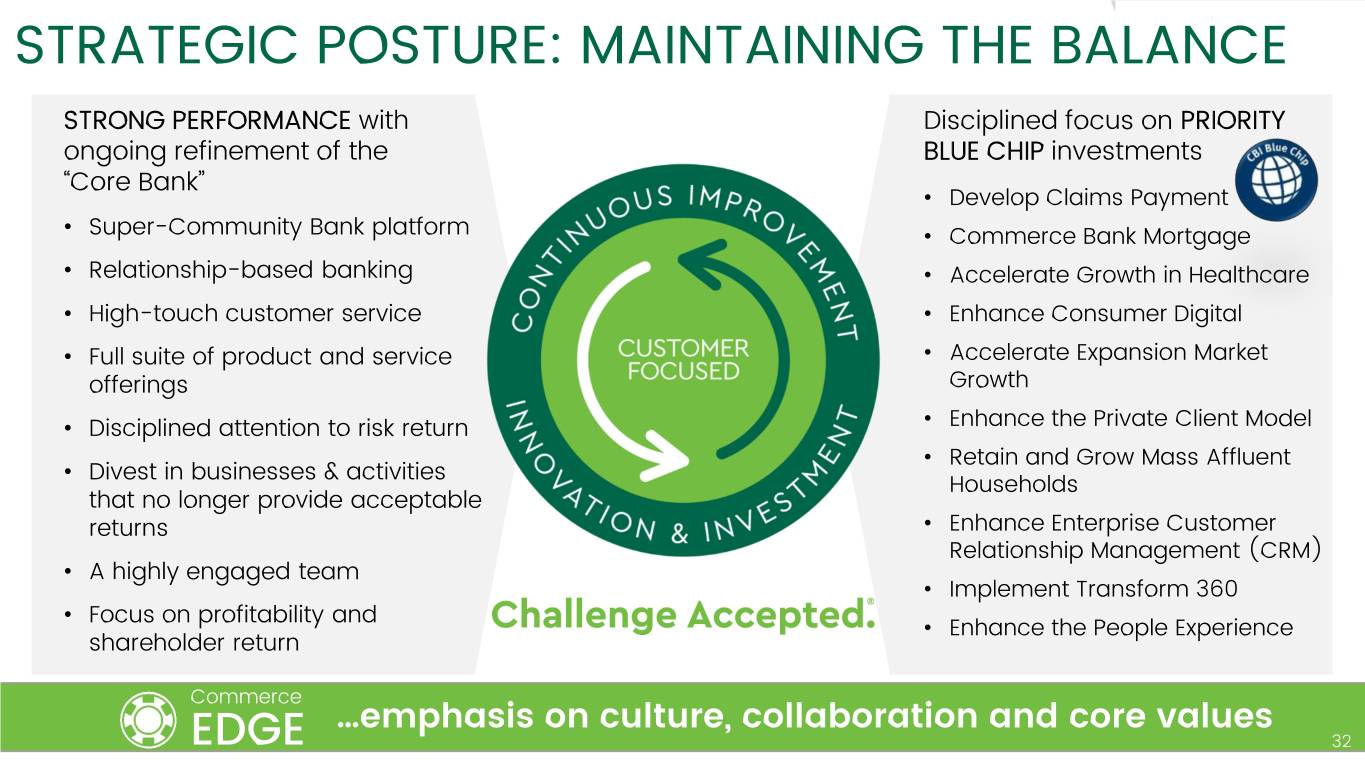
STRATEGIC POSTURE: MAINTAINING THE BALANCE STRONG PERFORMANCE with Disciplined focus on PRIORITY ongoing refinement of the BLUE CHIP investments “Core Bank” • Develop Claims Payment • Super-Community Bank platform • Commerce Bank Mortgage • Relationship-based banking • Accelerate Growth in Healthcare • High-touch customer service • Enhance Consumer Digital • • Full suite of product and service Accelerate Expansion Market offerings Growth • • Disciplined attention to risk return Enhance the Private Client Model • Retain and Grow Mass Affluent • Divest in businesses & activities Households that no longer provide acceptable • returns Enhance Enterprise Customer Relationship Management (CRM) • A highly engaged team • Implement Transform 360 • Focus on profitability and • Enhance the People Experience shareholder return Commerce …emphasis on culture, collaboration and core values EDGE 32

GROWTH MINDSET: CONSUMER BANKING Enhancing the Customer Experience Engaging with customers through the channels they prefer. CommercePremier Branch Design Advanced ATMs • Technology investments • New engagement programs • Enhanced product offerings • Improved operating model Video Advisors Exploration Centers Consumer Digital Business 2018 2019 Evolving our digital experiences to meet our customers’ expectations. 25 22 4.7 releases releases 74k ratings • Digital Mortgage application • CommercePremier user interface • Mobile push notifications, improved alerts management • Pilot Appointment setting solution 33
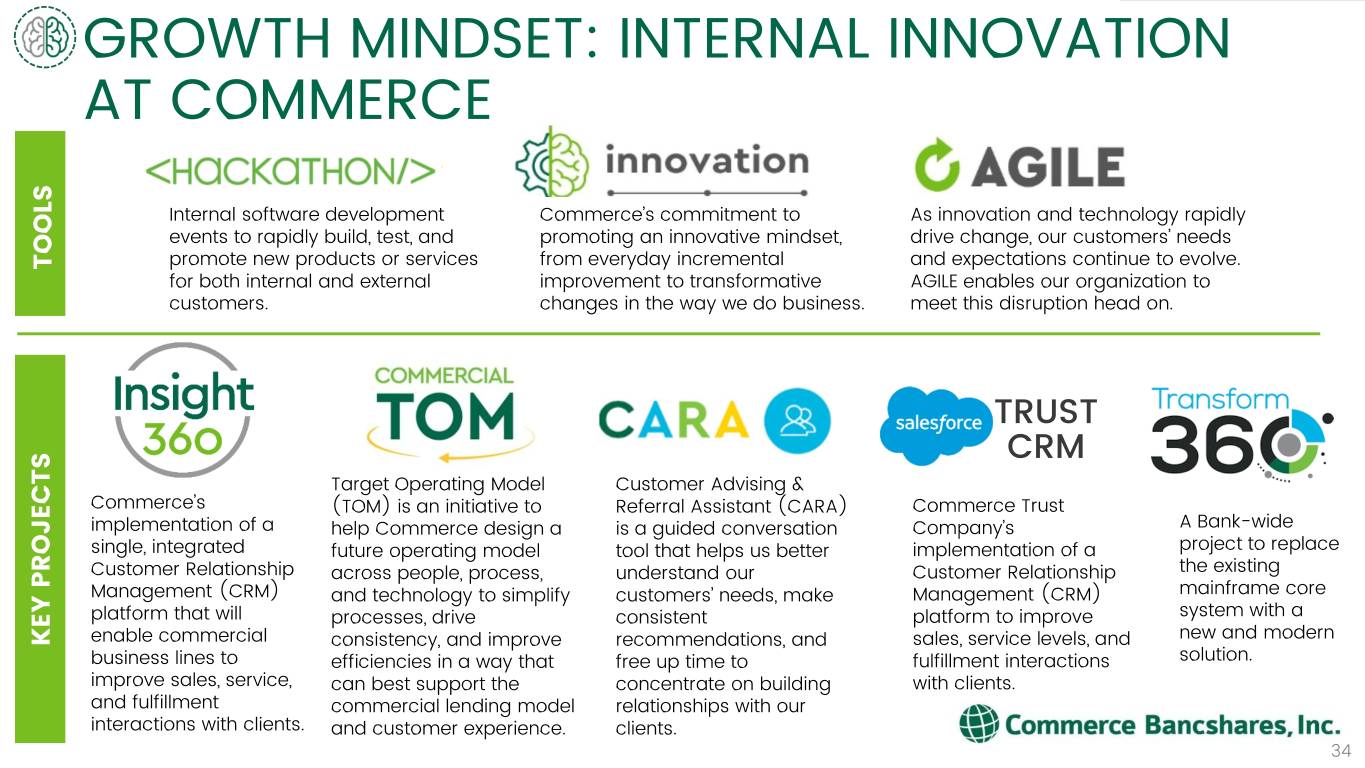
GROWTH MINDSET: INTERNAL INNOVATION AT COMMERCE Internal software development Commerce’s commitment to As innovation and technology rapidly events to rapidly build, test, and promoting an innovative mindset, drive change, our customers’ needs TOOLS promote new products or services from everyday incremental and expectations continue to evolve. for both internal and external improvement to transformative AGILE enables our organization to customers. changes in the way we do business. meet this disruption head on. TRUST CRM Target Operating Model Customer Advising & Commerce’s (TOM) is an initiative to Referral Assistant (CARA) Commerce Trust implementation of a help Commerce design a is a guided conversation Company’s A Bank-wide single, integrated future operating model tool that helps us better implementation of a project to replace Customer Relationship across people, process, understand our Customer Relationship the existing Management (CRM) and technology to simplify customers’ needs, make Management (CRM) mainframe core platform that will processes, drive consistent platform to improve system with a KEY PROJECTS KEY enable commercial consistency, and improve recommendations, and sales, service levels, and new and modern business lines to efficiencies in a way that free up time to fulfillment interactions solution. improve sales, service, can best support the concentrate on building with clients. and fulfillment commercial lending model relationships with our interactions with clients. and customer experience. clients. 34
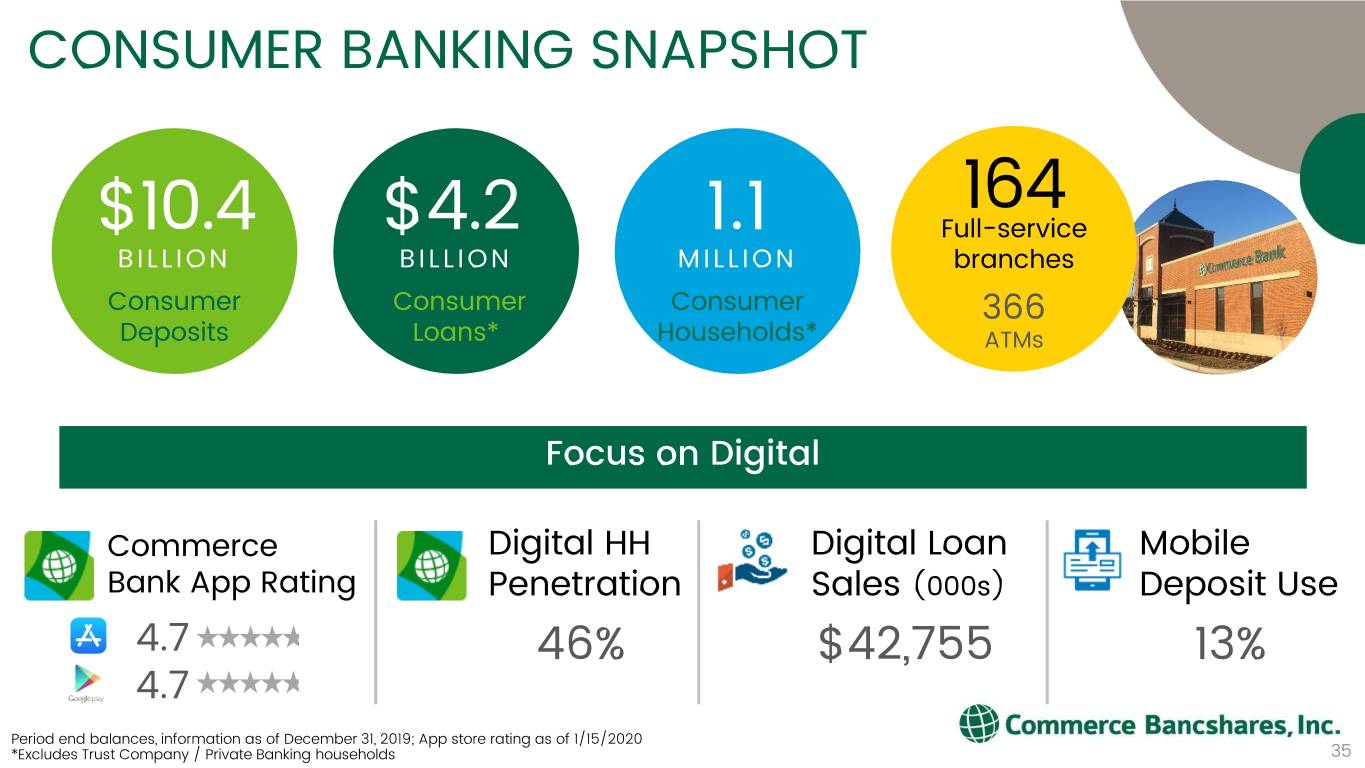
CONSUMER BANKING SNAPSHOT 164 $10.4 $4.2 1.1 Full-service BILLION BILLION MILLION branches Consumer Consumer Consumer 366 Deposits Loans* Households* ATMs Focus on Digital Commerce Digital HH Digital Loan Mobile Bank App Rating Penetration Sales (000s) Deposit Use 4.7 46% $42,755 13% 4.7 Period end balances, information as of December 31, 2019; App store rating as of 1/15/2020 35 *Excludes Trust Company / Private Banking households 35
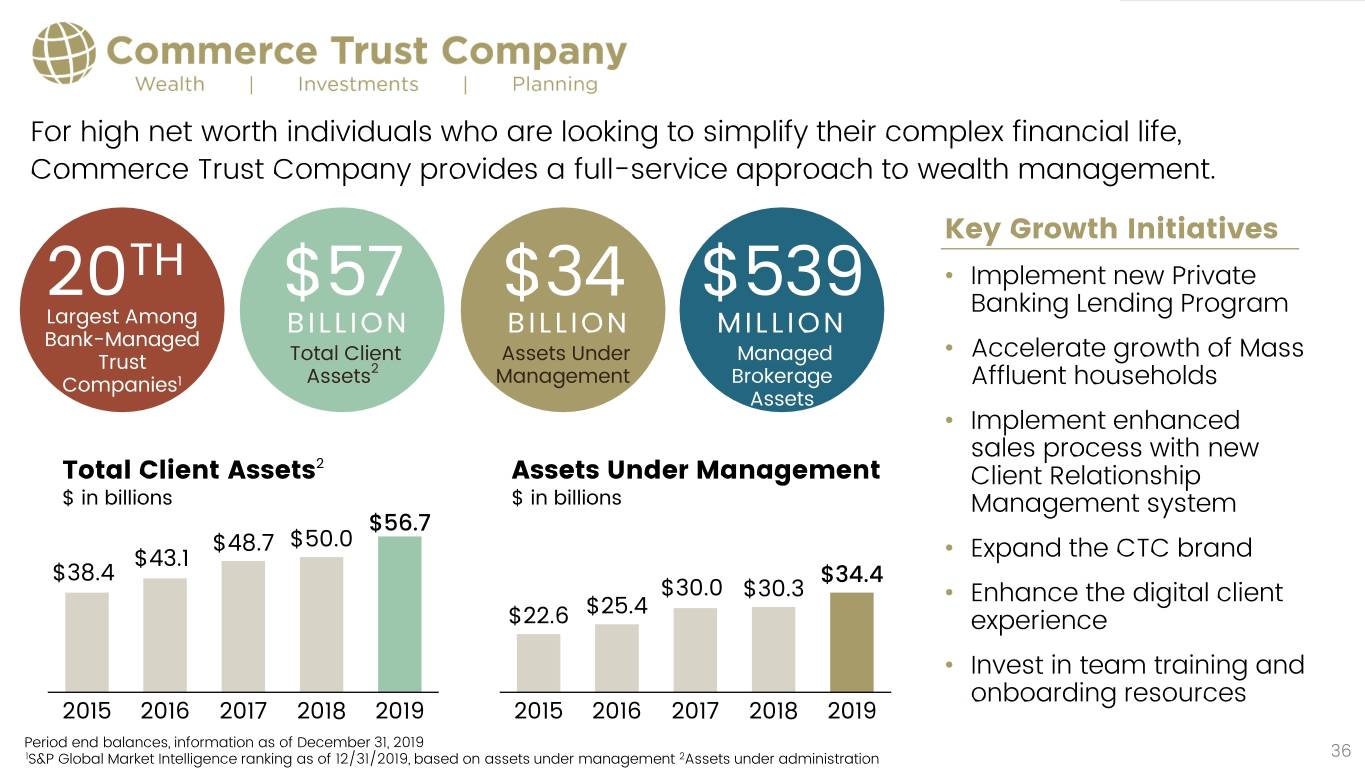
For high net worth individuals who are looking to simplify their complex financial life, Commerce Trust Company provides a full-service approach to wealth management. Key Growth Initiatives TH • Implement new Private 20Largest Among $57 $34 $539 Banking Lending Program Bank-Managed BILLION BILLION MILLION Total Client Assets Under Managed • Accelerate growth of Mass Trust 2 Companies1 Assets Management Brokerage Affluent households Assets • Implement enhanced 2 sales process with new Total Client Assets Assets Under Management Client Relationship $ in billions $ in billions Management system $56.7 $48.7 $50.0 • $43.1 Expand the CTC brand $38.4 $34.4 $30.0 $30.3 • $25.4 Enhance the digital client $22.6 experience • Invest in team training and onboarding resources 2015 2016 2017 2018 2019 2015 2016 2017 2018 2019 Period end balances, information as of December 31, 2019 36 1S&P Global Market Intelligence ranking as of 12/31/2019, based on assets under management 2Assets under administration 36
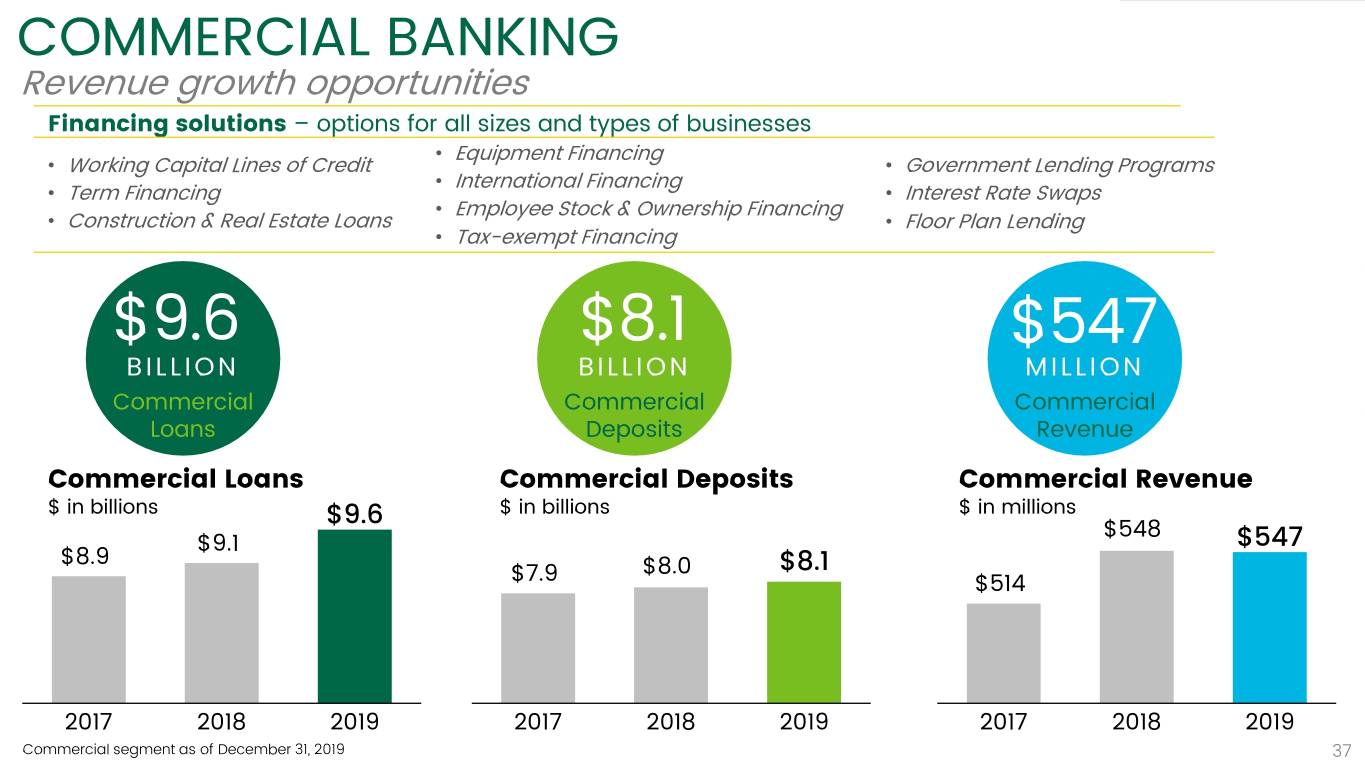
COMMERCIAL BANKING Revenue growth opportunities Financing solutions – options for all sizes and types of businesses • Equipment Financing • Working Capital Lines of Credit • Government Lending Programs • International Financing • Term Financing • Interest Rate Swaps • Employee Stock & Ownership Financing • Construction & Real Estate Loans • Floor Plan Lending • Tax-exempt Financing $9.6 $8.1 $547 BILLION BILLION MILLION Commercial Commercial Commercial Loans Deposits Revenue Commercial Loans Commercial Deposits Commercial Revenue $ in billions $ in billions $ in millions $9.6 $548 $9.1 $547 $8.9 $8.0 $8.1 $7.9 $514 2017 2018 2019 2017 2018 2019 2017 2018 2019 Commercial segment as of December 31, 2019 37
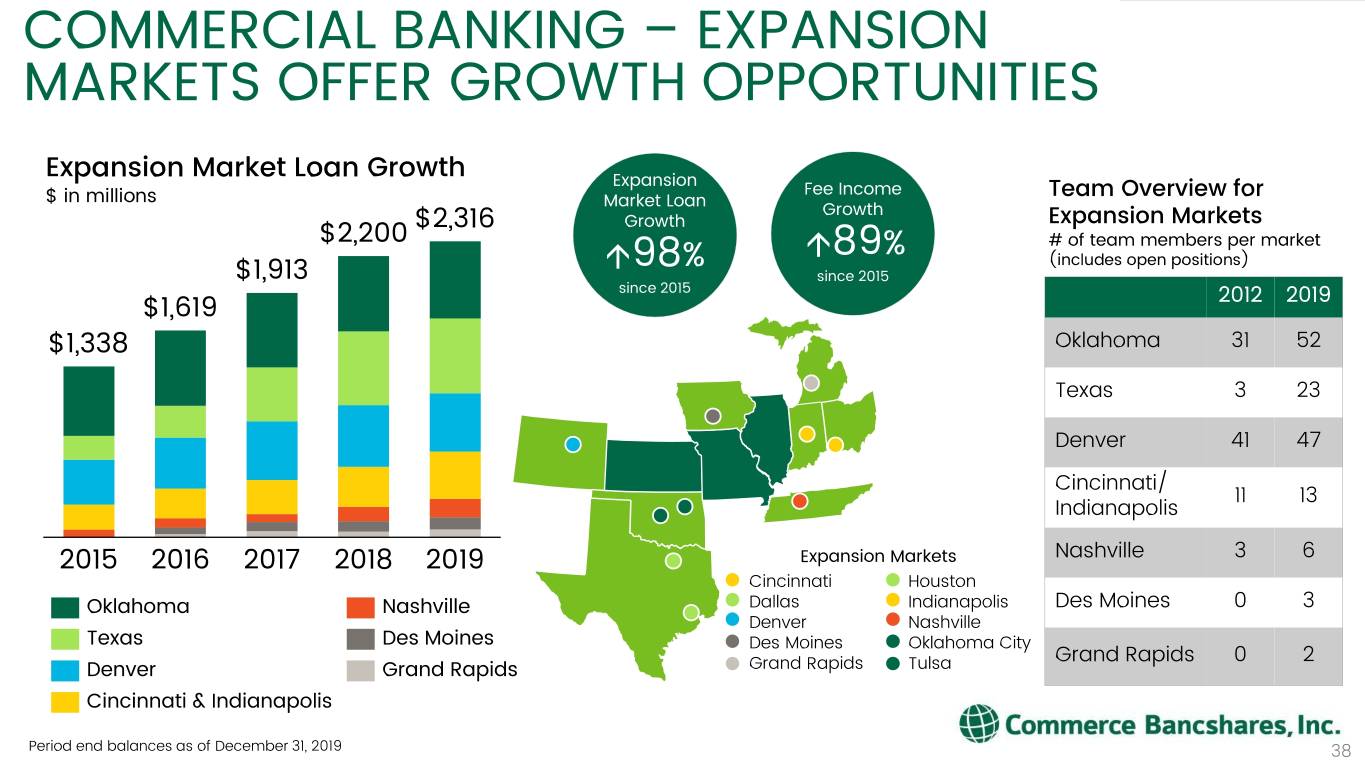
COMMERCIAL BANKING – EXPANSION MARKETS OFFER GROWTH OPPORTUNITIES Expansion Market Loan Growth Expansion Fee Income $ in millions Market Loan Team Overview for Growth $2,316 Growth Expansion Markets $2,200 # of team members per market 89% (includes open positions) $1,913 98% since 2015 since 2015 2012 2019 $1,619 $1,338 Oklahoma 31 52 Texas 3 23 Denver 41 47 Cincinnati/ 11 13 Indianapolis 2015 2016 2017 2018 2019 Expansion Markets Nashville 3 6 • Cincinnati • Houston • • Oklahoma Nashville Dallas Indianapolis Des Moines 0 3 • Denver • Nashville Texas Des Moines • Des Moines • Oklahoma City • • Grand Rapids 0 2 Denver Grand Rapids Grand Rapids Tulsa Cincinnati & Indianapolis Period end balances as of December 31, 2019 38
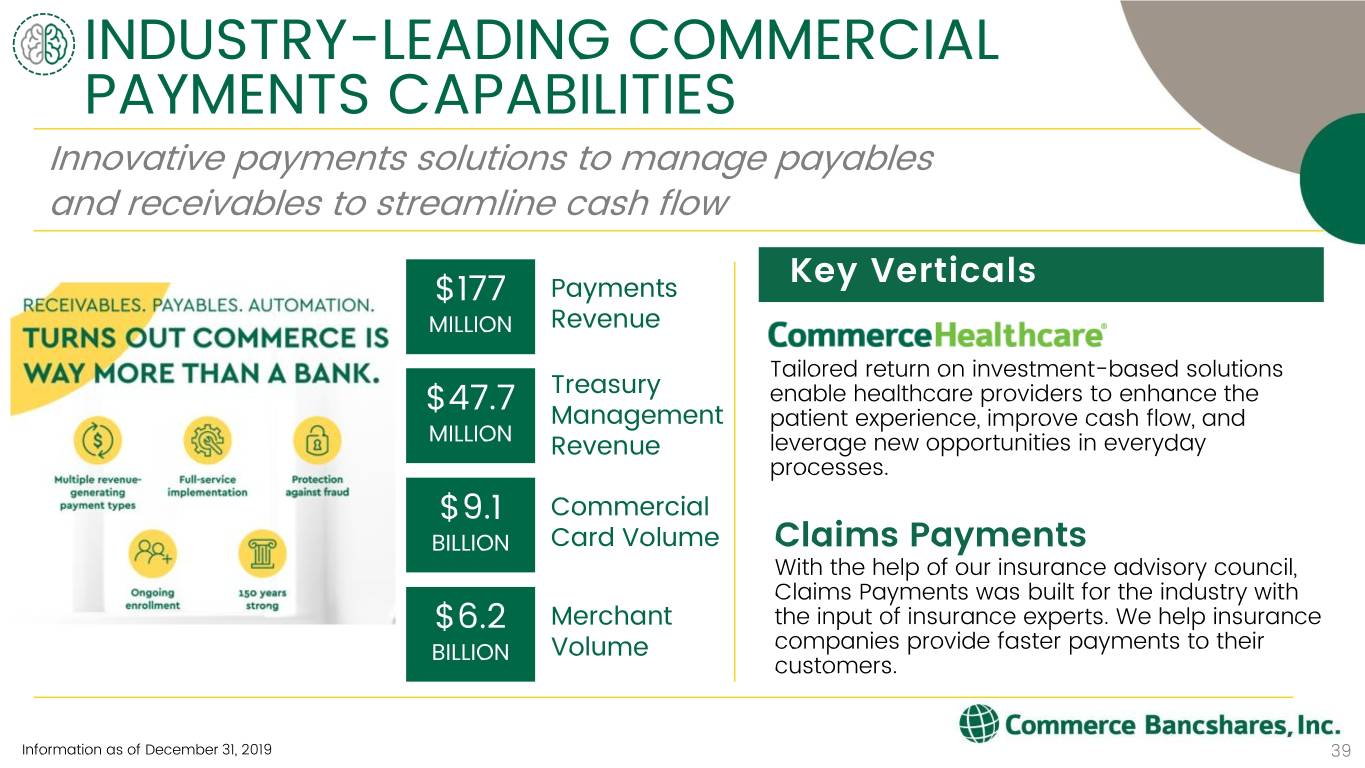
INDUSTRY-LEADING COMMERCIAL PAYMENTS CAPABILITIES Innovative payments solutions to manage payables and receivables to streamline cash flow Key Verticals $177 Payments MILLION Revenue Tailored return on investment-based solutions Treasury enable healthcare providers to enhance the $47.7 Management patient experience, improve cash flow, and MILLION Revenue leverage new opportunities in everyday processes. $9.1 Commercial BILLION Card Volume Claims Payments With the help of our insurance advisory council, Claims Payments was built for the industry with $6.2 Merchant the input of insurance experts. We help insurance BILLION Volume companies provide faster payments to their customers. Information as of December 31, 2019 39
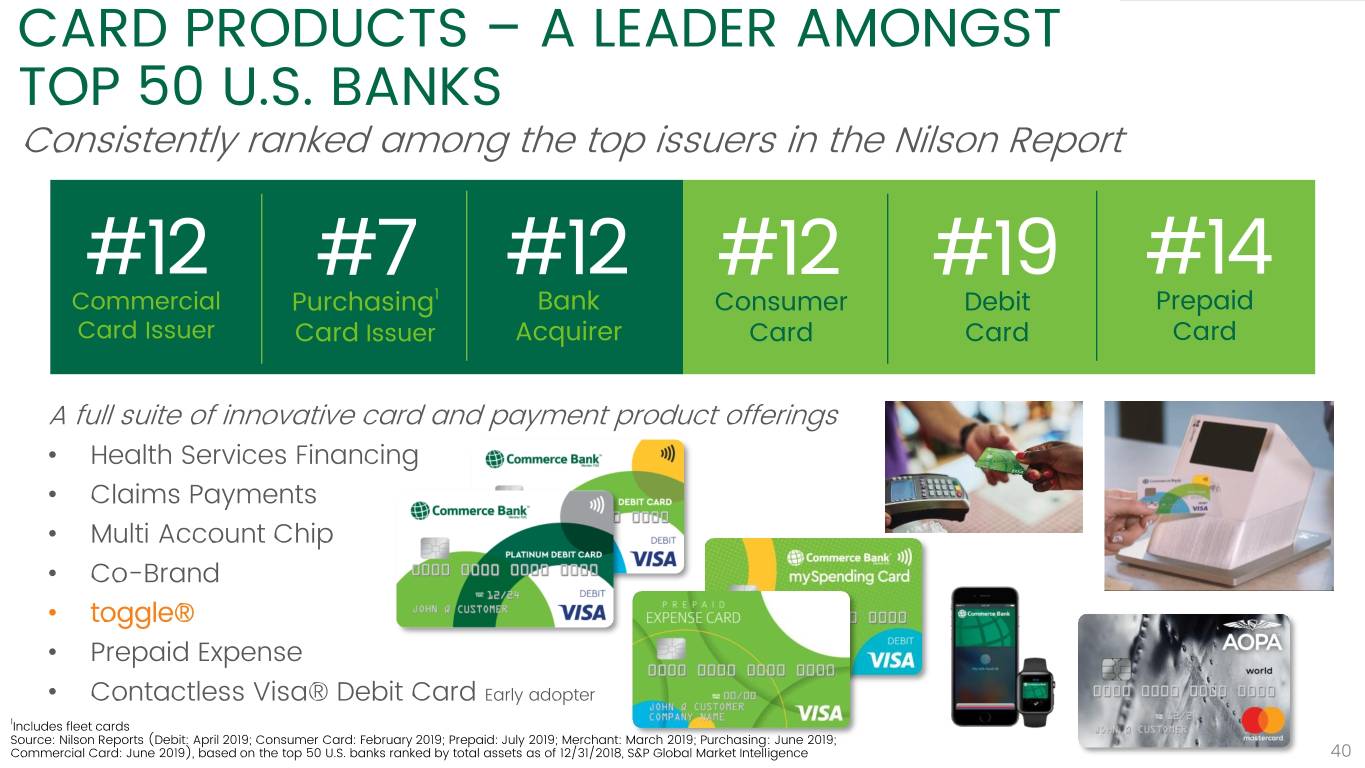
CARD PRODUCTS – A LEADER AMONGST TOP 50 U.S. BANKS Consistently ranked among the top issuers in the Nilson Report Commercial Consumer Commercial#12 Purchasing#7 1 #12Bank Consumer#12 #19Debit #14Prepaid Card Issuer Card Issuer Acquirer Card Card Card A full suite of innovative card and payment product offerings • Health Services Financing • Claims Payments • Multi Account Chip • Co-Brand • toggle® • Prepaid Expense • Contactless Visa® Debit Card Early adopter 1 Includes fleet cards Source: Nilson Reports (Debit: April 2019; Consumer Card: February 2019; Prepaid: July 2019; Merchant: March 2019; Purchasing: June 2019; Commercial Card: June 2019), based on the top 50 U.S. banks ranked by total assets as of 12/31/2018, S&P Global Market Intelligence 40
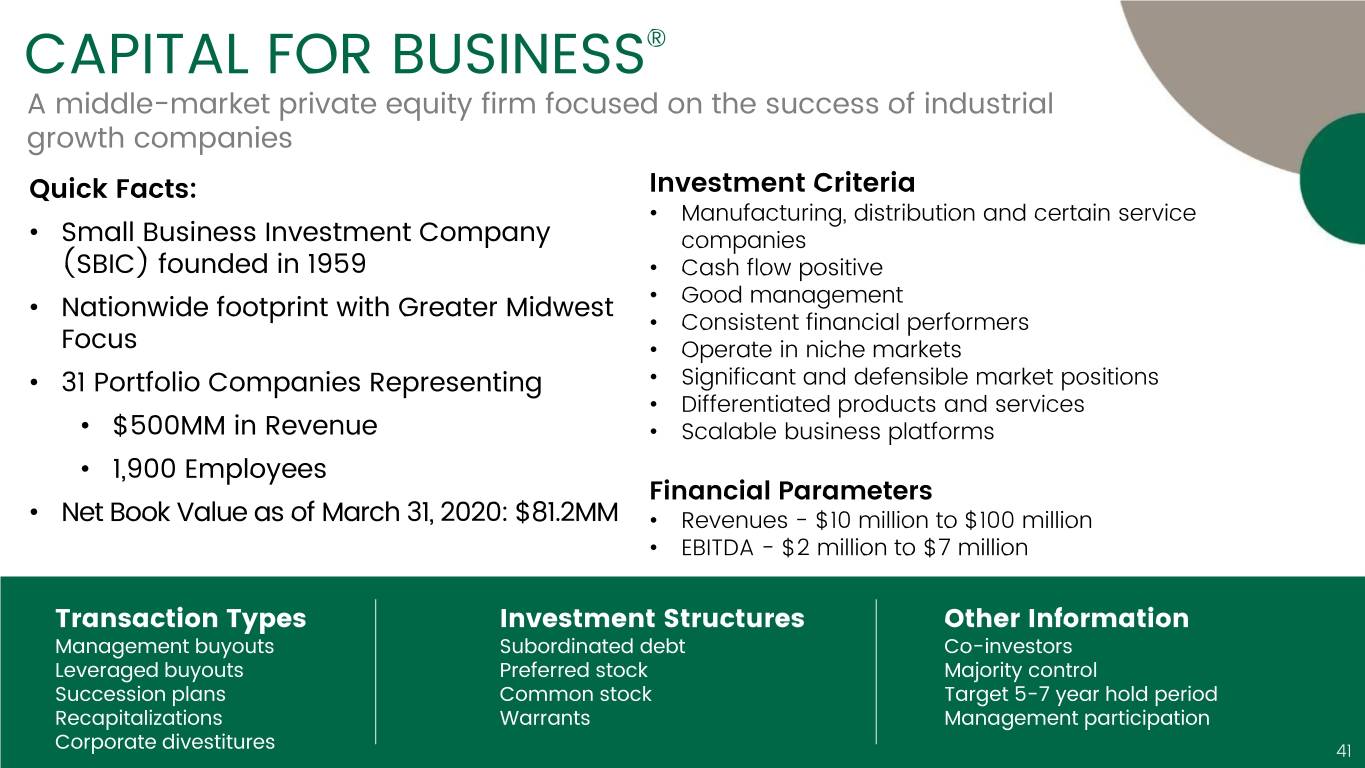
CAPITAL FOR BUSINESS® A middle-market private equity firm focused on the success of industrial growth companies Quick Facts: Investment Criteria • • Manufacturing, distribution and certain service Small Business Investment Company companies (SBIC) founded in 1959 • Cash flow positive • Good management • Nationwide footprint with Greater Midwest • Consistent financial performers Focus • Operate in niche markets • • 31 Portfolio Companies Representing Significant and defensible market positions • Differentiated products and services • $500MM in Revenue • Scalable business platforms • 1,900 Employees • Financial Parameters Net Book Value as of March 31, 2020: $81.2MM • Revenues - $10 million to $100 million • EBITDA - $2 million to $7 million Transaction Types Investment Structures Other Information Management buyouts Subordinated debt Co-investors Leveraged buyouts Preferred stock Majority control Succession plans Common stock Target 5-7 year hold period Recapitalizations Warrants Management participation Corporate divestitures 41
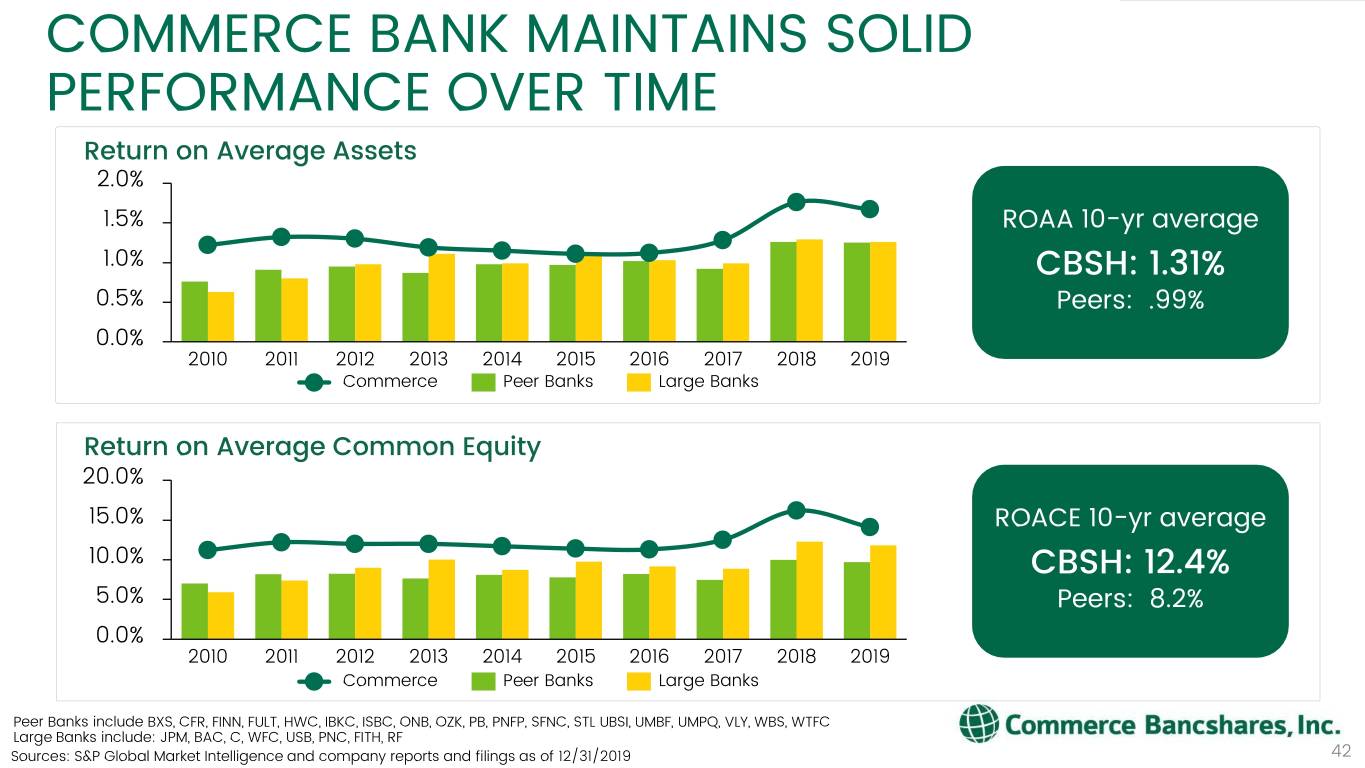
COMMERCE BANK MAINTAINS SOLID PERFORMANCE OVER TIME Return on Average Assets 2.0% 1.5% ROAA 10-yr average 1.0% CBSH: 1.31% 0.5% Peers: .99% 0.0% 2010 2011 2012 2013 2014 2015 2016 2017 2018 2019 Commerce Peer Banks Large Banks Return on Average Common Equity 20.0% 15.0% ROACE 10-yr average 10.0% CBSH: 12.4% 5.0% Peers: 8.2% 0.0% 2010 2011 2012 2013 2014 2015 2016 2017 2018 2019 Commerce Peer Banks Large Banks Peer Banks include BXS, CFR, FINN, FULT, HWC, IBKC, ISBC, ONB, OZK, PB, PNFP, SFNC, STL UBSI, UMBF, UMPQ, VLY, WBS, WTFC Large Banks include: JPM, BAC, C, WFC, USB, PNC, FITH, RF Sources: S&P Global Market Intelligence and company reports and filings as of 12/31/2019 42
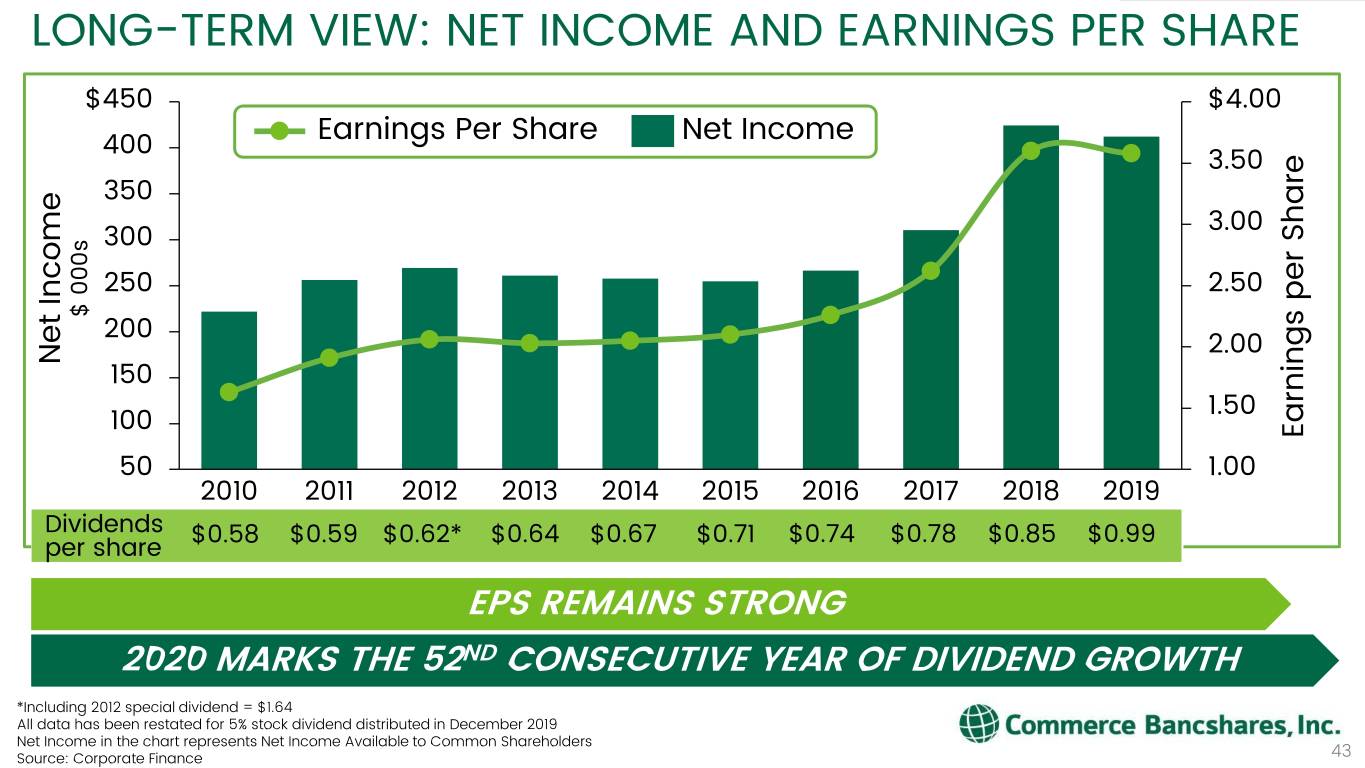
LONG-TERM VIEW: NET INCOME AND EARNINGS PER SHARE $450 $4.00 400 Earnings Per Share Net Income 3.50 350 3.00 300 250 2.50 $ $ 000s 200 Net Income Net 2.00 150 1.50 100 Earnings per Share 50 1.00 2010 2011 2012 2013 2014 2015 2016 2017 2018 2019 Dividends $0.58 $0.59 $0.62* $0.64 $0.67 $0.71 $0.74 $0.78 $0.85 $0.99 per share EPS REMAINS STRONG 2020 MARKS THE 52ND CONSECUTIVE YEAR OF DIVIDEND GROWTH *Including 2012 special dividend = $1.64 All data has been restated for 5% stock dividend distributed in December 2019 Net Income in the chart represents Net Income Available to Common Shareholders Source: Corporate Finance 43
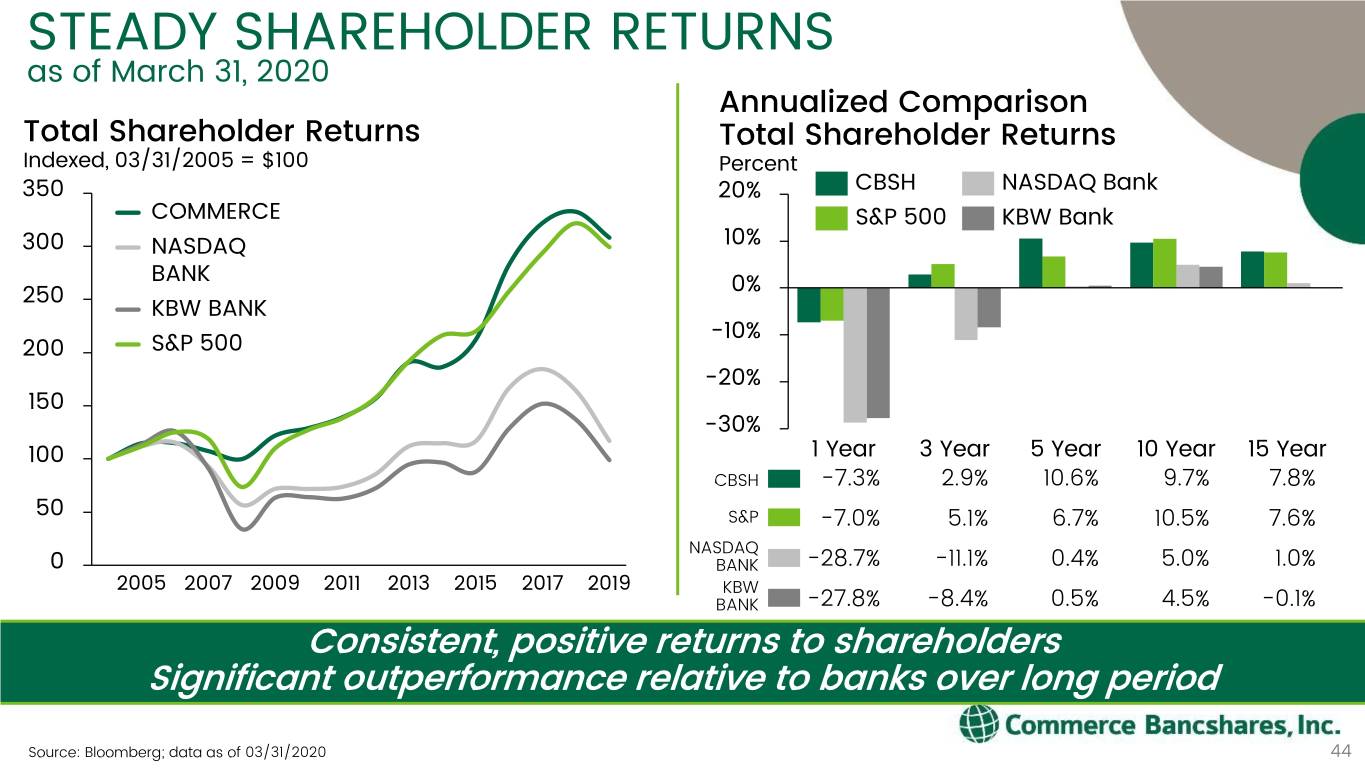
STEADY SHAREHOLDER RETURNS as of March 31, 2020 Annualized Comparison Total Shareholder Returns Total Shareholder Returns Indexed, 03/31/2005 = $100 Percent 350 20% CBSH NASDAQ Bank COMMERCE S&P 500 KBW Bank 300 NASDAQ 10% BANK 250 0% KBW BANK -10% 200 S&P 500 -20% 150 -30% 100 1 Year 3 Year 5 Year 10 Year 15 Year CBSH -7.3% 2.9% 10.6% 9.7% 7.8% 50 S&P -7.0% 5.1% 6.7% 10.5% 7.6% NASDAQ 0 BANK -28.7% -11.1% 0.4% 5.0% 1.0% 2005 2007 2009 2011 2013 2015 2017 2019 KBW BANK -27.8% -8.4% 0.5% 4.5% -0.1% Consistent, positive returns to shareholders Significant outperformance relative to banks over long period Source: Bloomberg; data as of 03/31/2020 44

Contact Information: Matthew Burkemper Senior Vice President, Commerce Bank Corporate Development and Investor Relations 314.746.7485 [email protected] Commerce Bancshares, Inc. Investor Relations website: http://investor.commercebank.com/

Embracing a Growth Mindset