
EBC 8-K
Eastern Bankshares, Inc. (EBC)
8-K
2022-04-28
For: 2022-04-28
View Original
Added on
April 06, 2026
UNITED STATES
SECURITIES AND EXCHANGE COMMISSION
WASHINGTON, D.C. 20549
FORM 8-K
CURRENT REPORT
PURSUANT TO SECTION 13 OR 15(D)
OF THE SECURITIES EXCHANGE ACT OF 1934
Date of Report (Date of Earliest Event Reported): April 28, 2022
(Exact Name of Registrant as Specified in Charter)
| (State or Other Jurisdiction of Incorporation or Organization) | (Commission File Number) | (I.R.S. Employer Identification No.) | ||||||||||||
| , | | |||||||||||||
| (Address of Principal Executive Offices) | (Zip Code) | |||||||||||||
Registrant’s telephone number, including area code: (800 ) 327-8376
Not Applicable
(Former name or former address, if changed since last report)
Check the appropriate box below if the Form 8-K filing is intended to simultaneously satisfy the filing obligation of the Registrant under any of the following provisions:
| Written communications pursuant to Rule 425 under the Securities Act (17 CFR 230.425) | |||||
| Soliciting material pursuant to Rule 14a-12 under the Exchange Act (17 CFR 240.14a-12) | |||||
| Pre-commencement communications pursuant to Rule 14d-2(b) under the Exchange Act (17 CFR 240.14d-2(b)) | |||||
| Pre-commencement communications pursuant to Rule 13e-4(c) under the Exchange Act (17 CFR 240.13e-4(c)) | |||||
Securities registered pursuant to Section 12(b) of the Act:
| Title of each class | Trading Symbol(s) | Name of each exchange on which registered | ||||||||||||
Indicate by check mark whether the Registrant is an emerging growth company as defined in Rule 405 of the Securities Act of 1933 (§230.405 of this chapter) or Rule 12b-2 of the Securities Exchange Act of 1934 (§240.12b-2 of this chapter).
Emerging growth company ☐
If an emerging growth company, indicate by check mark if the Registrant has elected not to use the extended transition period for complying with any new or revised financial accounting standards provided pursuant to Section 13(a) of the Exchange Act. ☐
Item 2.02 Results of Operations and Financial Condition.
On April 28, 2022, Eastern Bankshares, Inc., a Massachusetts corporation (the “Company”) and the stock holding company for Eastern Bank, issued a press release in which it announced its earnings for the quarter ended March 31, 2022. A copy of the press release is furnished herewith as Exhibit 99.1.
Item 7.01 Regulation FD Disclosure.
In the press release announcing the Company's earnings for the quarter ended March 31, 2022, the Company announced the approval by its Board of Directors of a regular quarterly cash dividend of $0.10 per share payable on June 15, 2022 to shareholders of record on June 3, 2022.
In connection with issuing such press release, the Company posted an investor presentation in the “Presentations” section of the Company’s investor relations website at investor.easternbank.com on April 28, 2022. A copy of the presentation is furnished herewith as Exhibit 99.2.
Item 9.01 Financial Statements and Exhibits.
(d)Exhibits
| Exhibit | Description | ||||
| 99.1 | |||||
| 99.2 | |||||
| 104 | Cover Page Interactive Data File (embedded within the Inline XBRL document) | ||||
SIGNATURES
Pursuant to the requirements of the Securities Exchange Act of 1934, as amended, the Registrant has duly caused this report to be signed on its behalf by the undersigned, hereunto duly authorized.
| EASTERN BANKSHARES, INC. | |||||||||||
DATE: April 28, 2022 | By: | /s/ James B. Fitzgerald | |||||||||
| James B. Fitzgerald | |||||||||||
| Chief Financial Officer | |||||||||||
Exhibit 99.1
Eastern Bankshares, Inc. Reports First Quarter 2022 Financial Results
Company Declares Quarterly Cash Dividend
BOSTON, April 28, 2022 (BUSINESS WIRE) — Eastern Bankshares, Inc. (the “Company,” or together with its affiliates and subsidiaries, “Eastern”) (NASDAQ Global Select Market: EBC), the stock holding company of Eastern Bank, today announced its 2022 first quarter financial results and the declaration of a quarterly cash dividend. Net income for the first quarter of 2022 was $51.5 million, or $0.30 per diluted share, compared to net income of $35.1 million, or $0.20 per diluted share, reported for the fourth quarter of 2021. Operating net income* for the first quarter of 2022 was $55.1 million, or $0.32 per diluted share, compared to $44.9 million, or $0.26 per diluted share, reported for the prior quarter.
“Our first quarter results were strong as we began to realize the benefits of the investments we’ve made to grow our business and solidify our position as the leading community bank in Greater Boston,” said Bob Rivers, Chief Executive Officer and Chair of the Board of Eastern Bankshares, Inc. and Eastern Bank. “We remain focused on delivering on our strategic priorities, which include developing new ways to deliver our offerings and services to customers, expanding our role as an employer of choice, and contributing positively to our local community while delivering greater value to our shareholders. Our operating earnings in the first quarter were 23% higher than the same period a year ago, and we believe we are well positioned to benefit from higher interest rates in the quarters ahead.”
HIGHLIGHTS FOR THE FIRST QUARTER OF 2022
•Operating net income* of $55.1 million for the first quarter of 2022 is 23% higher than the prior quarter and 18% higher than the prior year quarter.
•Loan growth excluding Paycheck Protection Program (“PPP”) loans was 3.1% on an annualized basis. Commercial loan growth excluding PPP loans was 4.4% on an annualized basis.
•The Company adopted Accounting Standards Update (“ASU”) 2016-13 (defined below) which included the current expected credit losses methodology ("CECL") as of January 1, 2022 and recorded a net decrease to retained earnings of $20.1 million in connection with such adoption. The Company recorded a $0.5 million release of allowance for loan losses for the first quarter.
•The Company repurchased 2,866,621 shares of its common stock during the first quarter of 2022 at a weighted average price of $21.12 excluding commissions, for an aggregate purchase price of $60.5 million.
•Subsequent to quarter end, on April 1, 2022, the Company completed the previously announced transfer of its cannabis banking and money service business to Needham Bank, marking the last Century Bancorp, Inc. (“Century”) integration milestone.
BALANCE SHEET
Total assets were $22.8 billion at March 31, 2022, representing a decrease of $676.1 million, or 3%, from December 31, 2021.
•Total securities decreased $198.5 million, or 2%, from the prior quarter, to $8.3 billion, due to a decline in the market value of available for sale securities, investment sales and paydowns partially offset by reinvestment. Cash and equivalents declined $401.3 million from the prior quarter to $830.5 million.
•Total loans were $12.2 billion, representing a decrease of $99.3 million, or 1%, from the prior quarter. The decrease was driven by PPP loan paydowns of $190.2 million, partially offset by loan growth excluding PPP loans of $90.9 million, or 3.1% on an annualized basis.
•Deposits totaled $19.4 billion, representing a decrease of $235.5 million, or 1%, from the prior quarter.
•Shareholders’ equity was $3.0 billion, representing a decrease of $398.0 million from the prior quarter. The decrease was driven primarily by a decline in the market value of the available for sale investment portfolio which drove a decrease in accumulated other comprehensive income of $356.0 million. Additional paid-in capital decreased $57.6 million in the first quarter associated primarily with the Company’s share repurchase activity. Retained earnings increased $14.3 million as net income was partially offset by a $20.1 million reduction related to the adoption of CECL and quarterly dividends. Please refer to the Asset Quality section of this press release for additional information on CECL and Appendix E to this press release for a roll forward of tangible shareholders’ equity*.
•At March 31, 2022, book value per share was $16.40 and tangible book value per share* was $12.83.
1
NET INTEREST INCOME
Net interest income was $128.1 million for the first quarter, compared to $122.4 million in the prior quarter, representing an increase of $5.7 million from the prior quarter.
•The increase in net interest income on a consecutive quarter basis was primarily due to an increase in average earning assets of $2.4 billion, a result of the full quarter impact of the Century merger. This was partially offset by a decline in the net interest margin.
•Included in net interest income was $5.8 million and $10.8 million of PPP fee accretion net of deferred cost amortization in the first quarter and prior quarter, respectively. During the first quarter of 2022, $190.2 million in PPP loans were forgiven by the U.S. Small Business Administration or otherwise paid down compared to $276.3 million in the prior quarter.
•The net interest margin on a fully tax equivalent (“FTE”) basis* was 2.42% for the first quarter, representing a 12 basis point decrease from the prior quarter. The prior quarter’s net interest margin benefited from higher PPP fee accretion compared to the first quarter.
NONINTEREST INCOME
Noninterest income was $46.4 million for the first quarter, compared to $49.0 million for the prior quarter, representing a decrease of $2.6 million. Noninterest income on an operating basis* was $53.3 million for the first quarter, compared to $44.5 million for the prior quarter, an increase of $8.8 million.
•Insurance commissions increased $7.8 million to $28.7 million in the first quarter, compared to $20.9 million in the prior quarter, driven by seasonality. Compared to the prior year quarter, insurance commissions increased $0.6 million, or 2%.
•Service charges on deposit accounts increased $1.3 million to $8.5 million in the first quarter, primarily due to higher account analysis fees.
•Trust and investment advisory fees decreased $0.4 million on a consecutive quarter basis to $6.1 million.
•Loan-level interest rate swap income was $2.9 million in the first quarter, compared to $0.5 million in the prior quarter, representing an increase of $2.4 million. The increase was driven by a $2.0 million increase in the fair value of such interest rate swap transactions and a $0.4 million increase in cash income due to higher swap transaction volume.
•Losses from investments held in rabbi trust accounts were $4.4 million in the first quarter compared to gains of $4.4 million in the prior quarter, representing a decrease of $8.9 million due to weaker investment performance in the period as compared to the prior quarter.
•Realized losses on available for sale securities totaled $2.2 million in the first quarter compared to no gain or loss in the prior quarter.
•Other noninterest income decreased $2.0 million in the first quarter, due primarily to decreased income on bank owned life insurance policies.
Please refer to Appendix B to this press release for a reconciliation of operating revenues and expenses*.
NONINTEREST EXPENSE
Noninterest expense was $108.9 million for the first quarter, compared to $143.6 million in the prior quarter, representing a decrease of $34.7 million. The decrease was primarily driven by a reduction in merger and acquisition costs of $30.7 million related to the merger with Century. Noninterest expense on an operating basis* for the first quarter was $110.9 million, compared to $110.3 million in the prior quarter, an increase of $0.6 million.
•Salaries and employee benefits expense was $69.5 million in the first quarter, representing a decrease of $26.8 million from the prior quarter, primarily due to a reduction in costs incurred in the prior quarter related to the Century merger as well as a decrease in benefits expense attributable to the lower market value of investments held in rabbi trust accounts associated with the Company’s defined contribution supplemental executive retirement plan.
•Office occupancy and equipment expense was $11.6 million in the first quarter, a decrease of $4.6 million from the prior quarter, primarily due to a reduction in expenses associated with the Century merger.
•Professional services expense was $4.7 million in the first quarter, a decrease of $5.2 million from the prior quarter, primarily due to a reduction in expenses associated with the Century merger.
2
Please refer to Appendix B to this press release for a reconciliation of operating revenues and expenses*.
ASSET QUALITY
The Company adopted ASU 2016-13, Financial Instruments-Credit Losses on Financial Instruments and relevant amendments (Topic 326) (“ASU 2016-13”) on January 1, 2022, which replaced the incurred loss methodology with an expected loss methodology that is referred to as the current expected credit losses methodology or CECL. Upon the January 1, 2022 adoption of CECL, the allowance for loan losses increased $27.1 million, and the reserve for unfunded commitments increased $1.0 million for a combined increase of $28.1 million for the allowance for credit losses. There was no material impact to other in-scope assets. The after-tax decrease to retained earnings of $20.1 million, or $0.11 per share, was recognized as a reduction to retained earnings and represented the cumulative effective adjustment from a change in accounting policies.
The allowance for loan losses was $124.2 million at March 31, 2022, or 1.02% of total loans, compared to $97.8 million or 0.80% of total loans at December 31, 2021. The increase in the reserve ratio was primarily due to the additional reserves required under CECL for loans acquired from Century which were recorded at fair value at the time of acquisition. Under CECL, the credit mark that is part of the day one fair value adjustment on acquired loans cannot be considered in the allowance computation, whereas, under the incurred loss model, the credit mark could be considered. The Company released loan loss reserves totaling $0.5 million in the first quarter, compared to a release of $4.3 million in the prior quarter.
Non-performing loans totaled $33.8 million at March 31, 2022 compared to $35.0 million at the end of the prior quarter. During the first quarter of 2022, the Company recorded total net charge-offs of $0.2 million, or 0.01% of average total loans on an annualized basis, compared to $1.3 million and 0.05% in the prior quarter, respectively.
At March 31, 2022, approximately $49.0 million in COVID-19 modified loans remained under modified payment terms, down from $106.7 million at December 31, 2021. The commercial real estate portfolio contained $39.4 million of the remaining COVID-19 modifications at period end, all of which were in the hotel segment.
DIVIDENDS AND SHARE REPURCHASES
The Company’s Board of Directors has declared a quarterly cash dividend of $0.10 per common share. The dividend will be payable on June 15, 2022, to shareholders of record as of the close of business on June 3, 2022.
The Company repurchased 2,866,621 shares of its common stock during the first quarter of 2022 at a weighted average price of $21.12 excluding commissions, for an aggregate purchase price of $60.5 million. Through March 31, 2022, the Company had repurchased 4,002,499 shares of its common stock in total under the Company’s current repurchase authorization at a weighted average price of $20.92 excluding commissions, for an aggregate purchase price of $83.7 million. At March 31, 2022, there were 5,335,401 shares available for repurchase and $141.3 million in total market value remaining under the Company’s current repurchase authorization, which expires on November 30, 2022 and is limited to $225.0 million in total market value.
CONFERENCE CALL INFORMATION
A conference call and webcast covering Eastern’s first quarter 2022 earnings will be held on Friday, April 29, 2022 at 9:00 a.m. Eastern Time. To join by telephone, participants can call the toll-free dial-in number (833) 233-4460 from within the U.S. or (647) 689-4543 if outside the U.S. and reference conference ID 5295184. The conference call will be simultaneously webcast. Participants may join the webcast on the Company’s Investor Relations website at investor.easternbank.com. A replay of the webcast will be made available on demand on this site.
ABOUT EASTERN BANKSHARES, INC.
Eastern Bankshares, Inc. is the stock holding company for Eastern Bank. Founded in 1818, Boston-based Eastern Bank has more than 120 locations serving communities in eastern Massachusetts, southern and coastal New Hampshire, and Rhode Island. As of March 31, 2022, Eastern Bank had approximately $23 billion
3
in total assets. Eastern provides banking, investment and insurance products and services for consumers and businesses of all sizes, including through its Eastern Wealth Management division and its Eastern Insurance Group LLC subsidiary. Eastern takes pride in its outspoken advocacy and community support that includes $240 million in charitable giving since 1994. An inclusive company, Eastern employs approximately 2,100 deeply committed professionals who value relationships with their customers, colleagues, and communities. For investor information, visit investor.easternbank.com.
CONTACT
Investor Contact
Jillian Belliveau
Eastern Bankshares, Inc.
781-598-7920
Media Contact
Andrea Goodman
Eastern Bank
781-598-7847
NON-GAAP FINANCIAL MEASURES
*Denotes a non-GAAP financial measure used in this press release.
A non-GAAP financial measure is defined as a numerical measure of the Company’s historical or future financial performance, financial position or cash flows that excludes (or includes) amounts, or is subject to adjustments that have the effect of excluding (or including) amounts that are included in the most directly comparable measure calculated and presented in accordance with accounting principles generally accepted in the United States (“GAAP”) in the Company’s statement of income, balance sheet or statement of cash flows (or equivalent statements).
The Company presents non-GAAP financial measures, which management uses to evaluate the Company’s performance, and which exclude the effects of certain transactions that management believes are unrelated to its core business and are therefore not necessarily indicative of its current performance or financial position. Management believes excluding these items facilitates greater visibility for investors into the Company’s core businesses as well as underlying trends that may, to some extent, be obscured by inclusion of such items in the corresponding GAAP financial measures.
There are items in the Company’s financial statements that impact its financial results, but which management believes are unrelated to the Company’s core business. Accordingly, the Company presents noninterest income on an operating basis, total operating revenue, noninterest expense on an operating basis, operating net income, operating earnings per share, operating return on average assets, operating return on average shareholders’ equity, the operating efficiency ratio, and the ratio of noninterest income to total revenue on an operating basis. Each of these figures excludes the impact of such applicable items because management believes such exclusion can provide greater visibility into the Company’s core business and underlying trends. Such items that management does not consider to be core to the Company’s business include (i) income and expenses from investments held in rabbi trusts, (ii) gains and losses on sales of securities available for sale, net, (iii) gains and losses on the sale of other assets, (iv) rabbi trust employee benefits, (v) impairment charges on tax credit investments and associated tax credit benefits, (vi) expenses indirectly associated with the Company’s initial public offering (“IPO”), (vii) other real estate owned (“OREO”) gains, (viii) merger and acquisition expenses, (ix) the stock donation to the Eastern Bank Foundation (“EBF”) in connection with the Company’s mutual-to-stock conversion and IPO, and (x) settlement of putative consumer class action litigation matters related to overdraft and non-sufficient funds fees, and associated settlement expenses. The Company does not provide an outlook for its total noninterest income and total noninterest expense because each contains income or expense components, as applicable, such as income associated with rabbi trust accounts and rabbi trust employee benefit
4
expense, which are market-driven, and over which the Company cannot exercise control. Accordingly, reconciliations of the Company’s outlook for its noninterest income on an operating basis and its noninterest expense on an operating basis to an outlook for total noninterest income and total noninterest expense, respectively, cannot be made available without unreasonable effort.
Management presents certain asset quality metrics excluding PPP loans which it does not consider to be part of the Company’s core portfolio. These metrics include the ratio of total nonperforming loans to total loans excluding PPP loans, the ratio of the allowance for loan losses to total loans excluding PPP loans, and the ratio of annualized net charge-offs to average total loans excluding PPP loans. The Company anticipates that the vast majority of its PPP loans outstanding at March 31, 2022 will be forgiven, and to the extent not forgiven, a PPP loan is intended to be 100% guaranteed by the SBA.
Management also presents tangible assets, tangible shareholders’ equity, tangible book value per share, and the ratio of tangible shareholders’ equity to tangible assets, each of which excludes the impact of goodwill and other intangible assets, as management believes these financial measures provide investors with the ability to further assess the Company’s performance, identify trends in its core business and provide a comparison of its capital adequacy to other companies. The Company included the tangible ratios because management believes that investors may find it useful to have access to the same analytical tools used by management to assess performance and identify trends.
These non-GAAP financial measures presented in this press release should not be considered an alternative or substitute for financial results or measures determined in accordance with GAAP or as an indication of the Company’s cash flows from operating activities, a measure of its liquidity position or an indication of funds available for its cash needs. An item which management considers to be non-core and excludes when computing these non-GAAP measures can be of substantial importance to the Company’s results for any particular period. In addition, management’s methodology for calculating non-GAAP financial measures may differ from the methodologies employed by other banking companies to calculate the same or similar performance measures, and accordingly, the Company’s reported non-GAAP financial measures may not be comparable to the same or similar performance measures reported by other banking companies. Please refer to Appendices A-E for reconciliations of the Company's GAAP financial measures to the non-GAAP financial measures in this press release.
FORWARD-LOOKING STATEMENTS
This press release contains “forward-looking statements” within the meaning of section 27A of the Securities Act of 1933, as amended, and section 21E of the Securities Exchange Act of 1934, as amended. Forward-looking statements include statements regarding anticipated future events and can be identified by the fact that they do not relate strictly to historical or current facts. You can identify these statements from the use of the words “may,” “will,” “should,” “could,” “would,” “plan,” “potential,” “estimate,” “project,” “believe,” “intend,” “anticipate,” “expect,” “target” and similar expressions. Forward-looking statements, by their nature, are subject to risks and uncertainties. There are many factors that could cause actual results to differ materially from expected results described in the forward-looking statements.
Certain factors that could cause actual results to differ materially from expected results include developments in the Company’s market relating to the COVID-19 pandemic, including the severity and duration of the associated economic slowdown; adverse developments in the level and direction of loan delinquencies and charge-offs and changes in estimates of the adequacy of the allowance for loan losses; increased competitive pressures; changes in the interest rate environment; risks that revenue or expense synergies or the other expected benefits of the Company’s merger with Century (“Transaction”) may not fully materialize for the Company in the timeframe expected or at all, or may be more costly to achieve; risks that the Company is unable to successfully implement integration strategies for the transaction; reputational risks and the reaction of customers to the Transaction; and diversion of management time on Transaction-related issues; as well as general economic conditions or conditions within the securities markets; and legislative and regulatory changes and related compliance costs that could adversely affect the business in which the Company and its subsidiary Eastern Bank are engaged, including inflation, interest rates, interest rate sensitivity and liquidity, including the effect of, and changes in, monetary and fiscal policies and laws, such as the interest rate policies of the Board of Governors of the Federal Reserve System; market and monetary fluctuations, including fluctuations due to actual or anticipated changes to federal tax laws; credit quality, including adverse developments in local or regional real estate markets that
5
decrease collateral values associated with existing loans; and the failure of the Company to execute all of its planned share repurchases. For further discussion of such factors, please see the Company’s most recent Annual Report on Form 10-K and subsequent filings with the U.S. Securities and Exchange Commission (the “SEC”), which are available on the SEC’s website at www.sec.gov.
Further, given the ongoing and dynamic nature of the COVID-19 pandemic, it is difficult to predict what continued effects the COVID-19 pandemic will have on the Company's business and results of operations. The COVID-19 pandemic and the related local and national economic disruption may result in a continued decline in demand for the Company's products and services; increased levels of loan delinquencies, problem assets and foreclosures; an increase in the Company's allowance for loan losses; a decline in the value of loan collateral, including real estate; reduced demand for office space in the Company’s markets due to remote and/or hybrid work arrangements; a greater decline in the yield on the Company's interest-earning assets than the decline in the cost of the Company's interest-bearing liabilities; and increased cybersecurity risks, as employees continue to work remotely. You should not place undue reliance on forward-looking statements, which reflect the Company's expectations only as of the date of this press release. The Company does not undertake any obligation to update forward-looking statements.
6
EASTERN BANKSHARES, INC. AND SUBSIDIARIES
SELECTED FINANCIAL HIGHLIGHTS
Certain information in this press release is presented as reviewed by the Company’s management and includes information derived from the Company’s Consolidated Statements of Income, non-GAAP financial measures, and operational and performance metrics. For information on non-GAAP financial measures, please see the section titled "Non-GAAP Financial Measures."
| As of and for the three months ended | |||||||||||||||||
| (Unaudited, dollars in thousands, except per share amounts) | Mar 31, 2022 | Dec 31, 2021 | Sep 30, 2021 | Jun 30, 2021 | Mar 31, 2021 | ||||||||||||
| Earnings data | |||||||||||||||||
| Net interest income | $ | 128,124 | $ | 122,437 | $ | 102,691 | $ | 104,608 | $ | 100,091 | |||||||
| Noninterest income | 46,415 | 49,001 | 43,209 | 45,733 | 55,212 | ||||||||||||
| Total revenue | 174,539 | 171,438 | 145,900 | 150,341 | 155,303 | ||||||||||||
| Noninterest expense | 108,866 | 143,602 | 98,970 | 107,335 | 94,049 | ||||||||||||
| Pre-tax, pre-provision income | 65,673 | 27,836 | 46,930 | 43,006 | 61,254 | ||||||||||||
| Release of allowance for loan losses | (485) | (4,318) | (1,488) | (3,300) | (580) | ||||||||||||
| Pre-tax income | 66,158 | 32,154 | 48,418 | 46,306 | 61,834 | ||||||||||||
| Net income | 51,516 | 35,087 | 37,106 | 34,809 | 47,663 | ||||||||||||
| Operating net income (non-GAAP) | 55,107 | 44,860 | 37,391 | 37,097 | 46,537 | ||||||||||||
| Per-share data | |||||||||||||||||
| Earnings per share, basic | $ | 0.30 | $ | 0.20 | $ | 0.22 | $ | 0.20 | $ | 0.28 | |||||||
| Earnings per share, diluted | $ | 0.30 | $ | 0.20 | $ | 0.22 | $ | 0.20 | $ | 0.28 | |||||||
| Operating earnings per share, basic (non-GAAP) | $ | 0.32 | $ | 0.26 | $ | 0.22 | $ | 0.22 | $ | 0.27 | |||||||
| Operating earnings per share, diluted (non-GAAP) | $ | 0.32 | $ | 0.26 | $ | 0.22 | $ | 0.22 | $ | 0.27 | |||||||
| Book value per share | $ | 16.40 | $ | 18.28 | $ | 18.36 | $ | 18.37 | $ | 18.14 | |||||||
| Tangible book value per share (non-GAAP) | $ | 12.83 | $ | 14.80 | $ | 16.33 | $ | 16.33 | $ | 16.12 | |||||||
| Profitability | |||||||||||||||||
| Return on average assets (1) | 0.90 | % | 0.67 | % | 0.84 | % | 0.83 | % | 1.19 | % | |||||||
| Operating return on average assets (non-GAAP) (1) | 0.96 | % | 0.86 | % | 0.86 | % | 0.89 | % | 1.15 | % | |||||||
| Return on average shareholders' equity ("ROE") (1) | 6.38 | % | 4.07 | % | 4.27 | % | 4.10 | % | 5.66 | % | |||||||
| Operating ROE (non-GAAP) (1) | 6.82 | % | 5.19 | % | 4.30 | % | 4.36 | % | 5.53 | % | |||||||
| Net interest margin (FTE) (1) | 2.42 | % | 2.54 | % | 2.53 | % | 2.69 | % | 2.71 | % | |||||||
| Cost of deposits (1) | 0.07 | % | 0.06 | % | 0.02 | % | 0.03 | % | 0.03 | % | |||||||
| Fee income ratio | 26.59 | % | 28.58 | % | 29.62 | % | 30.42 | % | 35.55 | % | |||||||
| Efficiency ratio | 62.37 | % | 83.76 | % | 67.83 | % | 71.39 | % | 60.56 | % | |||||||
| Operating efficiency ratio (non-GAAP) | 60.39 | % | 65.21 | % | 66.14 | % | 67.78 | % | 60.22 | % | |||||||
| Balance Sheet (end of period) | |||||||||||||||||
| Total assets | $ | 22,836,072 | $ | 23,512,128 | $ | 17,461,223 | $ | 17,047,453 | $ | 16,726,795 | |||||||
| Total loans | 12,182,203 | 12,281,510 | 9,504,562 | 9,621,075 | 9,916,475 | ||||||||||||
| Total deposits | 19,392,816 | 19,628,311 | 13,649,964 | 13,250,433 | 12,980,875 | ||||||||||||
| Total loans / total deposits | 63 | % | 63 | % | 70 | % | 73 | % | 76 | % | |||||||
| PPP loans | $ | 141,166 | $ | 331,385 | $ | 533,965 | $ | 825,784 | $ | 1,238,053 | |||||||
| Asset quality | |||||||||||||||||
| Allowance for loan losses ("ALLL") (2) | $ | 124,166 | $ | 97,787 | $ | 103,398 | $ | 105,637 | $ | 111,080 | |||||||
| ALLL / total nonperforming loans ("NPLs") | 367.13 | % | 279.53 | % | 245.77 | % | 253.74 | % | 252.72 | % | |||||||
| Total NPLs / total loans | 0.28 | % | 0.29 | % | 0.44 | % | 0.43 | % | 0.44 | % | |||||||
| Total NPLs / total loans (excl. PPP loans) (non-GAAP) | 0.28 | % | 0.29 | % | 0.47 | % | 0.47 | % | 0.51 | % | |||||||
| Net charge-offs ("NCOs") / average total loans (1) | 0.01 | % | 0.05 | % | 0.03 | % | 0.09 | % | 0.06 | % | |||||||
| NCOs / average total loans (excl. PPP loans) (non-GAAP) (1) | 0.01 | % | 0.05 | % | 0.03 | % | 0.10 | % | 0.06 | % | |||||||
| Remaining COVID-19 loan modifications | $ | 49,033 | $ | 106,657 | $ | 110,596 | $ | 149,805 | $ | 178,430 | |||||||
| Capital adequacy | |||||||||||||||||
| Shareholders' equity / assets | 13.17 | % | 14.49 | % | 19.64 | % | 20.12 | % | 20.25 | % | |||||||
| Tangible shareholders' equity / tangible assets (non-GAAP) | 10.61 | % | 12.06 | % | 17.85 | % | 18.30 | % | 18.42 | % | |||||||
| (1) Presented on an annualized basis. | |||||||||||||||||
(2) The Company adopted ASU 2016-13 on January 1, 2022 using the modified retrospective approach. Accordingly, at March 31, 2022, the allowance for loan losses was determined in accordance with ASC 326, “Financial Instruments-Credit Losses” and ASC 310, “Receivables,” as amended. At December 31, 2021, the allowance for loan losses was determined in accordance with ASC 450, “Contingencies” and ASC 310, “Receivables.” | |||||||||||||||||
7
EASTERN BANKSHARES, INC. AND SUBSIDIARIES
CONSOLIDATED BALANCE SHEETS
| As of | Mar 31, 2022 change from | ||||||||||||||||||||||||||||
| (Unaudited, dollars in thousands) | Mar 31, 2022 | Dec 31, 2021 | Mar 31, 2021 | Dec 31, 2021 | Mar 31, 2021 | ||||||||||||||||||||||||
| ASSETS | △ $ | △ % | △ $ | △ % | |||||||||||||||||||||||||
| Cash and due from banks | $ | 118,362 | $ | 144,634 | $ | 79,497 | (26,272) | (18) | % | 38,865 | 49 | % | |||||||||||||||||
| Short-term investments | 712,132 | 1,087,158 | 1,780,835 | (375,026) | (34) | % | (1,068,703) | (60) | % | ||||||||||||||||||||
| Cash and cash equivalents | 830,494 | 1,231,792 | 1,860,332 | (401,298) | (33) | % | (1,029,838) | (55) | % | ||||||||||||||||||||
| Available for sale ("AFS") securities | 7,917,305 | 8,511,224 | 3,986,253 | (593,919) | (7) | % | 3,931,052 | 99 | % | ||||||||||||||||||||
| Held to maturity ("HTM") securities | 395,434 | — | — | 395,434 | — | % | 395,434 | — | % | ||||||||||||||||||||
| Total securities | 8,312,739 | 8,511,224 | 3,986,253 | (198,485) | (2) | % | 4,326,486 | 109 | % | ||||||||||||||||||||
| Loans held for sale | 1,166 | 1,206 | 2,022 | (40) | (3) | % | (856) | (42) | % | ||||||||||||||||||||
| Loans: | |||||||||||||||||||||||||||||
| Commercial and industrial | 2,886,560 | 2,960,527 | 1,986,366 | (73,967) | (2) | % | 900,194 | 45 | % | ||||||||||||||||||||
| Commercial real estate | 4,609,824 | 4,522,513 | 3,676,941 | 87,311 | 2 | % | 932,883 | 25 | % | ||||||||||||||||||||
| Commercial construction | 246,093 | 222,328 | 249,416 | 23,765 | 11 | % | (3,323) | (1) | % | ||||||||||||||||||||
| Business banking | 1,201,007 | 1,334,694 | 1,513,051 | (133,687) | (10) | % | (312,044) | (21) | % | ||||||||||||||||||||
| Total commercial loans | 8,943,484 | 9,040,062 | 7,425,774 | (96,578) | (1) | % | 1,517,710 | 20 | % | ||||||||||||||||||||
| Residential real estate | 1,936,182 | 1,926,810 | 1,406,510 | 9,372 | — | % | 529,672 | 38 | % | ||||||||||||||||||||
| Consumer home equity | 1,099,211 | 1,100,153 | 832,466 | (942) | — | % | 266,745 | 32 | % | ||||||||||||||||||||
| Other consumer | 203,326 | 214,485 | 251,725 | (11,159) | (5) | % | (48,399) | (19) | % | ||||||||||||||||||||
| Total loans | 12,182,203 | 12,281,510 | 9,916,475 | (99,307) | (1) | % | 2,265,728 | 23 | % | ||||||||||||||||||||
| Allowance for loan losses | (124,166) | (97,787) | (111,080) | (26,379) | 27 | % | (13,086) | 12 | % | ||||||||||||||||||||
| Unamortized prem./disc. and def. fees | (24,434) | (26,442) | (32,673) | 2,008 | (8) | % | 8,239 | (25) | % | ||||||||||||||||||||
| Net loans | 12,033,603 | 12,157,281 | 9,772,722 | (123,678) | (1) | % | 2,260,881 | 23 | % | ||||||||||||||||||||
| Federal Home Loan Bank stock, at cost | 10,904 | 10,904 | 8,805 | — | — | % | 2,099 | 24 | % | ||||||||||||||||||||
| Premises and equipment | 73,180 | 80,984 | 46,619 | (7,804) | (10) | % | 26,561 | 57 | % | ||||||||||||||||||||
| Bank-owned life insurance | 157,954 | 157,091 | 79,110 | 863 | 1 | % | 78,844 | 100 | % | ||||||||||||||||||||
| Goodwill and other intangibles, net | 654,759 | 649,703 | 376,002 | 5,056 | 1 | % | 278,757 | 74 | % | ||||||||||||||||||||
| Deferred income taxes, net | 183,137 | 76,535 | 31,508 | 106,602 | 139 | % | 151,629 | 481 | % | ||||||||||||||||||||
| Prepaid expenses | 188,704 | 179,330 | 150,453 | 9,374 | 5 | % | 38,251 | 25 | % | ||||||||||||||||||||
| Other assets | 389,432 | 456,078 | 412,969 | (66,646) | (15) | % | (23,537) | (6) | % | ||||||||||||||||||||
| Total assets | 22,836,072 | 23,512,128 | 16,726,795 | (676,056) | (3) | % | 6,109,277 | 37 | % | ||||||||||||||||||||
| LIABILITIES AND SHAREHOLDERS' EQUITY | |||||||||||||||||||||||||||||
| Deposits: | |||||||||||||||||||||||||||||
| Demand | 6,788,742 | 7,020,864 | 5,369,164 | (232,122) | (3) | % | 1,419,578 | 26 | % | ||||||||||||||||||||
| Interest checking accounts | 4,662,134 | 4,478,566 | 2,482,731 | 183,568 | 4 | % | 2,179,403 | 88 | % | ||||||||||||||||||||
| Savings accounts | 2,089,427 | 2,077,495 | 1,362,463 | 11,932 | 1 | % | 726,964 | 53 | % | ||||||||||||||||||||
| Money market investment | 5,406,198 | 5,525,005 | 3,522,990 | (118,807) | (2) | % | 1,883,208 | 53 | % | ||||||||||||||||||||
| Certificates of deposit | 446,315 | 526,381 | 243,527 | (80,066) | (15) | % | 202,788 | 83 | % | ||||||||||||||||||||
| Total deposits | 19,392,816 | 19,628,311 | 12,980,875 | (235,495) | (1) | % | 6,411,941 | 49 | % | ||||||||||||||||||||
| Borrowed funds: | |||||||||||||||||||||||||||||
| Federal Home Loan Bank advances | 13,689 | 14,020 | 14,473 | (331) | (2) | % | (784) | (5) | % | ||||||||||||||||||||
| Escrow deposits of borrowers | 21,233 | 20,258 | 14,878 | 975 | 5 | % | 6,355 | 43 | % | ||||||||||||||||||||
| Total borrowed funds | 34,922 | 34,278 | 29,351 | 644 | 2 | % | 5,571 | 19 | % | ||||||||||||||||||||
| Other liabilities | 399,942 | 443,187 | 329,524 | (43,245) | (10) | % | 70,418 | 21 | % | ||||||||||||||||||||
| Total liabilities | 19,827,680 | 20,105,776 | 13,339,750 | (278,096) | (1) | % | 6,487,930 | 49 | % | ||||||||||||||||||||
| Shareholders' equity: | |||||||||||||||||||||||||||||
| Common shares | 1,834 | 1,863 | 1,868 | (29) | (2) | % | (34) | (2) | % | ||||||||||||||||||||
| Additional paid-in capital | 1,777,670 | 1,835,241 | 1,854,895 | (57,571) | (3) | % | (77,225) | (4) | % | ||||||||||||||||||||
| Unallocated common shares held by the employee stock ownership plan ("ESOP") | (141,455) | (142,709) | (146,472) | 1,254 | (1) | % | 5,017 | (3) | % | ||||||||||||||||||||
| Retained earnings | 1,782,997 | 1,768,653 | 1,702,946 | 14,344 | 1 | % | 80,051 | 5 | % | ||||||||||||||||||||
| Accumulated other comprehensive income ("AOCI"), net of tax | (412,654) | (56,696) | (26,192) | (355,958) | 628 | % | (386,462) | 1475 | % | ||||||||||||||||||||
| Total shareholders' equity | 3,008,392 | 3,406,352 | 3,387,045 | (397,960) | (12) | % | (378,653) | (11) | % | ||||||||||||||||||||
| Total liabilities and shareholders' equity | 22,836,072 | 23,512,128 | 16,726,795 | (676,056) | (3) | % | 6,109,277 | 37 | % | ||||||||||||||||||||
8
EASTERN BANKSHARES, INC. AND SUBSIDIARIES
CONSOLIDATED STATEMENTS OF INCOME
Certain previously reported amounts have been reclassified to conform to the current period’s presentation.
| Three months ended | Three months ended Mar 31, 2022 change from three months ended | ||||||||||||||||||||||||||||
| (Unaudited, dollars in thousands, except share data) | Mar 31, 2022 | Dec 31, 2021 | Mar 31, 2021 | Dec 31, 2021 | Mar 31, 2021 | ||||||||||||||||||||||||
| Interest and dividend income: | △ $ | △ % | △ $ | △ % | |||||||||||||||||||||||||
| Interest and fees on loans | $ | 101,367 | $ | 101,275 | $ | 88,639 | 92 | — | % | 12,728 | 14 | % | |||||||||||||||||
| Taxable interest and dividends on securities | 27,876 | 21,335 | 10,206 | 6,541 | 31 | % | 17,670 | 173 | % | ||||||||||||||||||||
| Non-taxable interest and dividends on securities | 1,806 | 1,815 | 1,856 | (9) | — | % | (50) | (3) | % | ||||||||||||||||||||
| Interest on federal funds sold and other short-term investments | 436 | 452 | 432 | (16) | (4) | % | 4 | 1 | % | ||||||||||||||||||||
| Total interest and dividend income | 131,485 | 124,877 | 101,133 | 6,608 | 5 | % | 30,352 | 30 | % | ||||||||||||||||||||
| Interest expense: | |||||||||||||||||||||||||||||
| Interest on deposits | 3,322 | 2,398 | 1,002 | 924 | 39 | % | 2,320 | 232 | % | ||||||||||||||||||||
| Interest on borrowings | 39 | 42 | 40 | (3) | (7) | % | (1) | (3) | % | ||||||||||||||||||||
| Total interest expense | 3,361 | 2,440 | 1,042 | 921 | 38 | % | 2,319 | 223 | % | ||||||||||||||||||||
| Net interest income | 128,124 | 122,437 | 100,091 | 5,687 | 5 | % | 28,033 | 28 | % | ||||||||||||||||||||
| Release of allowance for loan losses | (485) | (4,318) | (580) | 3,833 | (89) | % | 95 | (16) | % | ||||||||||||||||||||
| Net interest income after release of allowance for loan losses | 128,609 | 126,755 | 100,671 | 1,854 | 1 | % | 27,938 | 28 | % | ||||||||||||||||||||
| Noninterest income: | |||||||||||||||||||||||||||||
| Insurance commissions | 28,713 | 20,937 | 28,147 | 7,776 | 37 | % | 566 | 2 | % | ||||||||||||||||||||
| Service charges on deposit accounts | 8,537 | 7,261 | 5,367 | 1,276 | 18 | % | 3,170 | 59 | % | ||||||||||||||||||||
| Trust and investment advisory fees | 6,141 | 6,541 | 5,663 | (400) | (6) | % | 478 | 8 | % | ||||||||||||||||||||
| Debit card processing fees | 2,945 | 3,169 | 2,749 | (224) | (7) | % | 196 | 7 | % | ||||||||||||||||||||
| Interest rate swap income | 2,932 | 512 | 5,405 | 2,420 | 473 | % | (2,473) | (46) | % | ||||||||||||||||||||
| (Losses) income from investments held in rabbi trusts | (4,433) | 4,444 | 1,846 | (8,877) | (200) | % | (6,279) | (340) | % | ||||||||||||||||||||
| Gains on sales of mortgage loans held for sale, net | 169 | 561 | 1,479 | (392) | (70) | % | (1,310) | (89) | % | ||||||||||||||||||||
| (Losses) gains on sales of securities available for sale, net | (2,172) | — | 1,164 | (2,172) | — | % | (3,336) | (287) | % | ||||||||||||||||||||
| Other | 3,583 | 5,576 | 3,392 | (1,993) | (36) | % | 191 | 6 | % | ||||||||||||||||||||
| Total noninterest income | 46,415 | 49,001 | 55,212 | (2,586) | (5) | % | (8,797) | (16) | % | ||||||||||||||||||||
| Noninterest expense: | |||||||||||||||||||||||||||||
| Salaries and employee benefits | 69,526 | 96,362 | 64,040 | (26,836) | (28) | % | 5,486 | 9 | % | ||||||||||||||||||||
| Office occupancy and equipment | 11,614 | 16,194 | 8,217 | (4,580) | (28) | % | 3,397 | 41 | % | ||||||||||||||||||||
| Data processing | 15,320 | 12,947 | 12,129 | 2,373 | 18 | % | 3,191 | 26 | % | ||||||||||||||||||||
| Professional services | 4,701 | 9,866 | 4,148 | (5,165) | (52) | % | 553 | 13 | % | ||||||||||||||||||||
| Marketing | 1,574 | 1,955 | 1,691 | (381) | (19) | % | (117) | (7) | % | ||||||||||||||||||||
| Loan expenses | 1,168 | 1,229 | 1,847 | (61) | (5) | % | (679) | (37) | % | ||||||||||||||||||||
| Federal Deposit Insurance Corporation ("FDIC") insurance | 1,412 | 1,237 | 948 | 175 | 14 | % | 464 | 49 | % | ||||||||||||||||||||
| Amortization of intangible assets | 827 | 726 | 532 | 101 | 14 | % | 295 | 55 | % | ||||||||||||||||||||
| Other | 2,724 | 3,086 | 497 | (362) | (12) | % | 2,227 | 448 | % | ||||||||||||||||||||
| Total noninterest expense | 108,866 | 143,602 | 94,049 | (34,736) | (24) | % | 14,817 | 16 | % | ||||||||||||||||||||
| Income before income tax expense (benefit) | 66,158 | 32,154 | 61,834 | 34,004 | 106 | % | 4,324 | 7 | % | ||||||||||||||||||||
| Income tax expense (benefit) (1) | 14,642 | (2,933) | 14,171 | 17,575 | (599) | % | 471 | 3 | % | ||||||||||||||||||||
| Net income | 51,516 | 35,087 | 47,663 | 16,429 | 47 | % | 3,853 | 8 | % | ||||||||||||||||||||
| Share data: | |||||||||||||||||||||||||||||
| Earnings per share, basic | $ | 0.30 | $ | 0.20 | $ | 0.28 | |||||||||||||||||||||||
| Earnings per share, diluted | $ | 0.30 | $ | 0.20 | $ | 0.28 | |||||||||||||||||||||||
| (1) The net tax benefit amount for the quarter ended December 31, 2021 reflects the impact of the release of $11.3 million of the $12.0 million valuation allowance associated with the stock donation to the Eastern Bank Foundation made in the quarter ended December 31, 2020. | |||||||||||||||||||||||||||||
9
EASTERN BANKSHARES, INC. AND SUBSIDIARIES
AVERAGE BALANCES, INTEREST, YIELDS AND RATES, AND NET INTEREST MARGIN
| As of and for the three months ended | |||||||||||||||||||||||||||||||||||||||||||||||||||||
| Mar 31, 2022 | Dec 31, 2021 | Mar 31, 2021 | |||||||||||||||||||||||||||||||||||||||||||||||||||
| (Unaudited, dollars in thousands) | Avg. Balance | Interest | Yield / Cost (5) | Avg. Balance | Interest | Yield / Cost (5) | Avg. Balance | Interest | Yield / Cost (5) | ||||||||||||||||||||||||||||||||||||||||||||
| Interest-earning assets: | |||||||||||||||||||||||||||||||||||||||||||||||||||||
| Loans (1): | |||||||||||||||||||||||||||||||||||||||||||||||||||||
| Commercial | $ | 8,973,094 | $ | 78,226 | 3.54 | % | $ | 8,021,665 | $ | 80,326 | 3.97 | % | $ | 7,317,951 | $ | 69,210 | 3.84 | % | |||||||||||||||||||||||||||||||||||
| Residential | 1,937,494 | 14,471 | 3.03 | % | 1,735,324 | 12,993 | 2.97 | % | 1,393,139 | 11,274 | 3.28 | % | |||||||||||||||||||||||||||||||||||||||||
| Consumer | 1,293,489 | 10,450 | 3.28 | % | 1,189,106 | 9,683 | 3.23 | % | 1,105,698 | 8,937 | 3.28 | % | |||||||||||||||||||||||||||||||||||||||||
| Total loans | 12,204,077 | 103,147 | 3.43 | % | 10,946,095 | 103,002 | 3.73 | % | 9,816,788 | 89,421 | 3.69 | % | |||||||||||||||||||||||||||||||||||||||||
| Investment securities | 8,647,200 | 30,163 | 1.41 | % | 7,336,783 | 23,633 | 1.28 | % | 3,631,530 | 12,577 | 1.40 | % | |||||||||||||||||||||||||||||||||||||||||
| Federal funds sold and other short-term investments | 1,003,416 | 436 | 0.18 | % | 1,201,223 | 452 | 0.15 | % | 1,740,561 | 432 | 0.10 | % | |||||||||||||||||||||||||||||||||||||||||
| Total interest-earning assets | 21,854,693 | 133,746 | 2.48 | % | 19,484,101 | 127,087 | 2.59 | % | 15,188,879 | 102,430 | 2.73 | % | |||||||||||||||||||||||||||||||||||||||||
| Non-interest-earning assets | 1,436,702 | 1,373,219 | 1,120,603 | ||||||||||||||||||||||||||||||||||||||||||||||||||
| Total assets | $ | 23,291,395 | $ | 20,857,320 | $ | 16,309,482 | |||||||||||||||||||||||||||||||||||||||||||||||
| Interest-bearing liabilities: | |||||||||||||||||||||||||||||||||||||||||||||||||||||
| Deposits: | |||||||||||||||||||||||||||||||||||||||||||||||||||||
| Savings | $ | 2,076,754 | $ | 51 | 0.01 | % | $ | 1,800,862 | $ | 61 | 0.01 | % | $ | 1,300,057 | $ | 64 | 0.02 | % | |||||||||||||||||||||||||||||||||||
| Interest checking | 4,596,026 | 2,032 | 0.18 | % | 3,830,427 | 1,267 | 0.13 | % | 2,391,025 | 234 | 0.04 | % | |||||||||||||||||||||||||||||||||||||||||
| Money market | 5,568,264 | 920 | 0.07 | % | 4,743,313 | 788 | 0.07 | % | 3,440,214 | 587 | 0.07 | % | |||||||||||||||||||||||||||||||||||||||||
| Time deposits | 481,833 | 319 | 0.27 | % | 388,511 | 281 | 0.29 | % | 251,115 | 117 | 0.19 | % | |||||||||||||||||||||||||||||||||||||||||
| Total interest-bearing deposits | 12,722,877 | 3,322 | 0.11 | % | 10,763,113 | 2,397 | 0.09 | % | 7,382,411 | 1,002 | 0.06 | % | |||||||||||||||||||||||||||||||||||||||||
| Borrowings | 30,669 | 39 | 0.52 | % | 29,204 | 42 | 0.57 | % | 25,625 | 40 | 0.63 | % | |||||||||||||||||||||||||||||||||||||||||
| Total interest-bearing liabilities | 12,753,546 | 3,361 | 0.11 | % | 10,792,317 | 2,439 | 0.09 | % | 7,408,036 | 1,042 | 0.06 | % | |||||||||||||||||||||||||||||||||||||||||
| Demand deposit accounts | 6,821,811 | 6,226,291 | 5,125,831 | ||||||||||||||||||||||||||||||||||||||||||||||||||
| Other noninterest-bearing liabilities | 442,591 | 415,481 | 358,087 | ||||||||||||||||||||||||||||||||||||||||||||||||||
| Total liabilities | 20,017,948 | 17,434,089 | 12,891,954 | ||||||||||||||||||||||||||||||||||||||||||||||||||
| Shareholders' equity | 3,273,447 | 3,423,231 | 3,417,528 | ||||||||||||||||||||||||||||||||||||||||||||||||||
| Total liabilities and shareholders' equity | $ | 23,291,395 | $ | 20,857,320 | $ | 16,309,482 | |||||||||||||||||||||||||||||||||||||||||||||||
| Net interest income - FTE | $ | 130,385 | $ | 124,648 | $ | 101,388 | |||||||||||||||||||||||||||||||||||||||||||||||
| Net interest rate spread (2) | 2.37 | % | 2.50 | % | 2.67 | % | |||||||||||||||||||||||||||||||||||||||||||||||
| Net interest-earning assets (3) | $ | 9,101,147 | $ | 8,691,784 | $ | 7,780,843 | |||||||||||||||||||||||||||||||||||||||||||||||
| Net interest margin - FTE (4) | 2.42 | % | 2.54 | % | 2.71 | % | |||||||||||||||||||||||||||||||||||||||||||||||
| (1) Includes non-accrual loans. | |||||||||||||||||||||||||||||||||||||||||||||||||||||
| (2) Net interest rate spread represents the difference between the weighted average yield on interest-earning assets and the weighted average cost of interest-bearing liabilities. | |||||||||||||||||||||||||||||||||||||||||||||||||||||
| (3) Net interest-earning assets represent total interest-earning assets less total interest-bearing liabilities. | |||||||||||||||||||||||||||||||||||||||||||||||||||||
| (4) Net interest margin represents net interest income divided by average total interest-earning assets. | |||||||||||||||||||||||||||||||||||||||||||||||||||||
| (5) Presented on an annualized basis. | |||||||||||||||||||||||||||||||||||||||||||||||||||||
10
EASTERN BANKSHARES, INC. AND SUBSIDIARIES
ASSET QUALITY - NON-PERFORMING ASSETS (1)
| As of | |||||||||||||||||
| Mar 31, 2022 | Dec 31, 2021 | Sep 30, 2021 | Jun 30, 2021 | Mar 31, 2021 | |||||||||||||
| (Unaudited, dollars in thousands) | |||||||||||||||||
| Non-accrual loans: | |||||||||||||||||
| Commercial | $ | 17,919 | $ | 20,630 | $ | 29,166 | $ | 29,356 | $ | 30,275 | |||||||
| Residential | 8,256 | 6,681 | 7,185 | 6,445 | 8,127 | ||||||||||||
| Consumer | 7,646 | 5,682 | 4,262 | 4,106 | 3,873 | ||||||||||||
| Total non-accrual loans | 33,821 | 32,993 | 40,613 | 39,907 | 42,275 | ||||||||||||
| Total accruing loans past due 90 days or more (2): | — | 1,990 | 1,458 | 1,725 | 1,679 | ||||||||||||
| Total non-performing loans | 33,821 | 34,983 | 42,071 | 41,632 | 43,954 | ||||||||||||
| Other real estate owned | — | — | — | 38 | — | ||||||||||||
| Other non-performing assets: | — | — | — | — | — | ||||||||||||
| Total non-performing assets | $ | 33,821 | $ | 34,983 | $ | 42,071 | $ | 41,670 | $ | 43,954 | |||||||
| Total accruing troubled debt restructured loans | $ | 32,016 | $ | 33,336 | $ | 34,723 | $ | 38,316 | $ | 39,367 | |||||||
| Total non-performing loans to total loans | 0.28 | % | 0.29 | % | 0.44 | % | 0.43 | % | 0.44 | % | |||||||
| Total non-performing assets to total assets | 0.15 | % | 0.15 | % | 0.24 | % | 0.24 | % | 0.26 | % | |||||||
| (1) Non-performing assets are comprised of NPLs, OREO, and non-performing securities. NPLs consist of non-accrual loans and loans that are more than 90 days past due but still accruing interest. OREO consists of real estate properties, which primarily serve as collateral to secure the Company’s loans, that it controls due to foreclosure or acceptance of a deed in lieu of foreclosure. | |||||||||||||||||
(2) Loans that were past due 90 days or more and still accruing in prior quarters were comprised solely of purchased credit impaired (PCI) loans. PCI loans were not subject to classification as nonaccrual in the same manner as originated loans as their interest income related to the accretable yield recognized and not to contractual interest payments at the loan level. In connection with the Company’s adoption of CECL on January 1, 2022, all PCI loans are now considered purchased credit deteriorated (PCD) loans. Interest income recognition for PCD loans is consistent with originated loans and, therefore, PCD loans cease accruing interest at 90 days past due unless management believes that collateral held by the Company is clearly sufficient and in full satisfaction of both principal and interest. There were no PCD or originated loans at March 31, 2022 that were past due 90 days or more and still accruing. | |||||||||||||||||
11
EASTERN BANKSHARES, INC. AND SUBSIDIARIES
ASSET QUALITY - PROVISION, ALLOWANCE, AND NET CHARGE OFFS
| Three months ended | |||||||||||||||||
| Mar 31, 2022 | Dec 31, 2021 | Sep 30, 2021 | Jun 30, 2021 | Mar 31, 2021 | |||||||||||||
| (Unaudited, dollars in thousands) | |||||||||||||||||
| Average total loans | $ | 12,204,077 | $ | 10,946,095 | $ | 9,528,522 | $ | 9,796,701 | $ | 9,816,788 | |||||||
| Allowance for loan losses, beginning of the period | 97,787 | 103,398 | 105,637 | 111,080 | 113,031 | ||||||||||||
| Total cumulative effect of change in accounting principle (1): | 27,086 | — | — | — | — | ||||||||||||
| Charged-off loans: | |||||||||||||||||
| Commercial and industrial | 1 | 1,008 | — | 550 | — | ||||||||||||
| Commercial real estate | — | 5 | 8 | — | 234 | ||||||||||||
| Commercial construction | — | — | — | — | — | ||||||||||||
| Business banking | 945 | 1,002 | 867 | 1,838 | 1,384 | ||||||||||||
| Residential real estate | — | 35 | — | — | — | ||||||||||||
| Consumer home equity | — | 24 | — | — | — | ||||||||||||
| Other consumer | 661 | 666 | 742 | 275 | 364 | ||||||||||||
| Total charged-off loans | 1,607 | 2,740 | 1,617 | 2,663 | 1,982 | ||||||||||||
| Recoveries on loans previously charged-off: | |||||||||||||||||
| Commercial and industrial | 250 | 873 | 40 | 13 | 9 | ||||||||||||
| Commercial real estate | 14 | — | — | 4 | — | ||||||||||||
| Commercial construction | — | — | — | — | — | ||||||||||||
| Business banking | 928 | 399 | 469 | 291 | 365 | ||||||||||||
| Residential real estate | 10 | 7 | 88 | 17 | 10 | ||||||||||||
| Consumer home equity | 4 | 48 | 63 | 3 | 71 | ||||||||||||
| Other consumer | 179 | 120 | 206 | 192 | 156 | ||||||||||||
| Total recoveries | 1,385 | 1,447 | 866 | 520 | 611 | ||||||||||||
| Net loans charged-off (recoveries): | |||||||||||||||||
| Commercial and industrial | (249) | 135 | (40) | 537 | (9) | ||||||||||||
| Commercial real estate | (14) | 5 | 8 | (4) | 234 | ||||||||||||
| Commercial construction | — | — | — | — | — | ||||||||||||
| Business banking | 17 | 603 | 398 | 1,547 | 1,019 | ||||||||||||
| Residential real estate | (10) | 28 | (88) | (17) | (10) | ||||||||||||
| Consumer home equity | (4) | (24) | (63) | (3) | (71) | ||||||||||||
| Other consumer | 482 | 546 | 536 | 83 | 208 | ||||||||||||
| Total net loans charged-off | 222 | 1,293 | 751 | 2,143 | 1,371 | ||||||||||||
| Release of allowance for loan losses | (485) | (4,318) | (1,488) | (3,300) | (580) | ||||||||||||
| Total allowance for loan losses, end of period (2) | $ | 124,166 | $ | 97,787 | $ | 103,398 | $ | 105,637 | $ | 111,080 | |||||||
| Net charge-offs to average total loans outstanding during this period (3) | 0.01 | % | 0.05 | % | 0.03 | % | 0.09 | % | 0.06 | % | |||||||
| Allowance for loan losses as a percent of total loans | 1.02 | % | 0.80 | % | 1.09 | % | 1.10 | % | 1.12 | % | |||||||
| Allowance for loan losses as a percent of nonperforming loans | 367.13 | % | 279.53 | % | 245.77 | % | 253.74 | % | 252.72 | % | |||||||
| (1) Represents the adjustment needed to reflect the cumulative day one impact pursuant to the Company’s adoption of ASU 2016-13 (i.e., cumulative effect adjustment related the adoption of ASU 2016-13 as of January 1, 2022). The adjustment represents a $27.1 million increase to the allowance for loan losses attributable to the change in accounting methodology which requires the estimation of the allowance for credit losses resulting from the Company’s adoption of the standard. The adjustment also includes the adjustment needed to reflect the day one reclassification of the Company’s financial assets that were previously classified as purchase credit-impaired ("PCI") financial assets as purchased credit-deteriorated ("PCD") financial assets and the associated gross-up of $0.1 million, pursuant to the Company’s adoption of ASU 2016-13. | |||||||||||||||||
| (2) The balance of accrued interest receivable excluded from amortized cost and the calculation of the allowance for credit losses amounted to $31.1 million at March 31, 2022. | |||||||||||||||||
| (3) Presented on an annualized basis. | |||||||||||||||||
12
APPENDIX A: Reconciliation of Non-GAAP Earnings Metrics
For information on non-GAAP financial measures, please see the section titled "Non-GAAP Financial Measures."
| Three Months Ended | |||||||||||||||||
| (Unaudited, dollars in thousands, except share data) | Mar 31, 2022 | Dec 31, 2021 | Sep 30, 2021 | Jun 30, 2021 | Mar 31, 2021 | ||||||||||||
| Net income (GAAP) | $ | 51,516 | $ | 35,087 | $ | 37,106 | $ | 34,809 | $ | 47,663 | |||||||
| Add: | |||||||||||||||||
| Noninterest income components: | |||||||||||||||||
| Losses (income) from investments held in rabbi trusts | 4,433 | (4,444) | 289 | (4,216) | (1,846) | ||||||||||||
| Losses (gains) on sales of securities available for sale, net | 2,172 | — | (1) | (1) | (1,164) | ||||||||||||
| Losses (gains) on sales of other assets | 274 | (34) | (490) | (29) | (18) | ||||||||||||
| Noninterest expense components: | |||||||||||||||||
| Rabbi trust employee benefit (income) expense | (2,087) | 2,519 | (53) | 2,063 | 986 | ||||||||||||
| Impairment charge (reversal) on tax credit investments | — | 116 | 1,133 | (1,419) | — | ||||||||||||
| Gain on sale of OREO | — | — | (87) | — | — | ||||||||||||
| Merger and acquisition expenses | 34 | 30,652 | 740 | 3,479 | 589 | ||||||||||||
| Settlement and expenses for putative consumer class action matters | — | — | — | 3,325 | — | ||||||||||||
| Total impact of non-GAAP adjustments | 4,826 | 28,809 | 1,531 | 3,202 | (1,453) | ||||||||||||
| Less net tax benefit (expense) associated with non-GAAP adjustments (1) | 1,235 | 19,036 | 1,246 | 914 | (327) | ||||||||||||
| Non-GAAP adjustments, net of tax | $ | 3,591 | $ | 9,773 | $ | 285 | $ | 2,288 | $ | (1,126) | |||||||
| Operating net income (non-GAAP) | $ | 55,107 | $ | 44,860 | $ | 37,391 | $ | 37,097 | $ | 46,537 | |||||||
| Weighted average common shares outstanding during the period (2): | |||||||||||||||||
| Basic | 169,857,950 | 172,246,799 | 172,298,615 | 172,173,707 | 172,049,044 | ||||||||||||
| Diluted | 169,968,156 | 172,481,829 | 172,298,615 | 172,173,707 | 172,049,044 | ||||||||||||
| Earnings per share, basic | $ | 0.30 | $ | 0.20 | $ | 0.22 | $ | 0.20 | $ | 0.28 | |||||||
| Earnings per share, diluted | $ | 0.30 | $ | 0.20 | $ | 0.22 | $ | 0.20 | $ | 0.28 | |||||||
| Operating earnings per share, basic (non-GAAP) | $ | 0.32 | $ | 0.26 | $ | 0.22 | $ | 0.22 | $ | 0.27 | |||||||
| Operating earnings per share, diluted (non-GAAP) | $ | 0.32 | $ | 0.26 | $ | 0.22 | $ | 0.22 | $ | 0.27 | |||||||
| Return on average assets (3) | 0.90 | % | 0.67 | % | 0.84 | % | 0.83 | % | 1.19 | % | |||||||
| Add: | |||||||||||||||||
| Losses (income) from investments held in rabbi trusts (3) | 0.08% | (0.08)% | 0.01% | (0.10)% | (0.05)% | ||||||||||||
| Losses (gains) on sales of securities available for sale, net (3) | 0.04% | —% | 0.00% | 0.00% | (0.03)% | ||||||||||||
| Losses (gains) on sales of other assets (3) | 0.00% | 0.00% | (0.01)% | 0.00% | 0.00% | ||||||||||||
| Rabbi trust employee benefit (income) expense (3) | (0.04)% | 0.05% | 0.00% | 0.05% | 0.02% | ||||||||||||
| Impairment charge (reversal) on tax credit investments (3) | —% | 0.00% | 0.03% | (0.03)% | —% | ||||||||||||
| Gain on sale of OREO (3) | —% | —% | 0.00% | —% | —% | ||||||||||||
| Merger and acquisition expenses (3) | 0.00% | 0.58% | 0.02% | 0.08% | 0.01% | ||||||||||||
| Settlement and expenses for putative consumer class action matters (3) | —% | —% | —% | 0.08% | —% | ||||||||||||
| Less net tax benefit (expense) associated with non-GAAP adjustments (1) (3) | 0.02% | 0.36% | 0.03% | 0.02% | (0.01)% | ||||||||||||
| Operating return on average assets (non-GAAP) (3) | 0.96 | % | 0.86 | % | 0.86 | % | 0.89 | % | 1.15 | % | |||||||
| Return on average shareholders' equity (3) | 6.38 | % | 4.07 | % | 4.27 | % | 4.10 | % | 5.66 | % | |||||||
| Add: | |||||||||||||||||
| Losses (income) from investments held in rabbi trusts (3) | 0.55% | (0.52)% | 0.03% | (0.50)% | (0.22)% | ||||||||||||
| Losses (gains) on sales of securities available for sale, net (3) | 0.27% | —% | 0.00% | 0.00% | (0.14)% | ||||||||||||
| Losses (gains) on sale of other assets (3) | 0.03% | 0.00% | (0.06)% | 0.00% | 0.00% | ||||||||||||
| Rabbi trust employee benefit (income) expense (3) | (0.26)% | 0.29% | (0.01)% | 0.24% | 0.12% | ||||||||||||
| Impairment charge (reversal) on tax credit investments (3) | 0.00% | 0.01% | 0.13% | (0.17)% | 0.00% | ||||||||||||
| Gain on sale of OREO (3) | —% | —% | (0.01)% | —% | —% | ||||||||||||
| Merger and acquisition expenses (3) | 0.00% | 3.55% | 0.09% | 0.41% | 0.07% | ||||||||||||
| Settlement and expenses for putative consumer class action matters (3) | —% | —% | —% | 0.39% | —% | ||||||||||||
| Less net tax benefit (expense) associated with non-GAAP adjustments (1) (3) | 0.15% | 2.21% | 0.14% | 0.11% | (0.04)% | ||||||||||||
| Operating return on average shareholders' equity (non-GAAP) (3) | 6.82 | % | 5.19 | % | 4.30 | % | 4.36 | % | 5.53 | % | |||||||
| (1) The net tax benefit (expense) associated with these items is determined by assessing whether each item is included or excluded from net taxable income and applying our combined statutory tax rate only to those items included in net taxable income. The net tax benefit amount for the quarter ended December 31, 2021 reflects the impact of the release of $11.3 million of the $12.0 million valuation allowance associated with the stock donation to the Eastern Bank Foundation made in the quarter ended December 31, 2020. | |||||||||||||||||
(2) Shares held by the Company’s ESOP that have not been allocated to employees in accordance with the terms of the ESOP are not deemed outstanding for earnings per share calculations. | |||||||||||||||||
| (3) Presented on an annualized basis. | |||||||||||||||||
13
APPENDIX B: Reconciliation of Non-GAAP Operating Revenues and Expenses
For information on non-GAAP financial measures, please see the section titled "Non-GAAP Financial Measures."
| Three Months Ended | |||||||||||||||||
| Mar 31, 2022 | Dec 31, 2021 | Sep 30, 2021 | Jun 30, 2021 | Mar 31, 2021 | |||||||||||||
| (Unaudited, dollars in thousands) | |||||||||||||||||
| Net interest income (GAAP) | $ | 128,124 | $ | 122,437 | $ | 102,691 | $ | 104,608 | $ | 100,091 | |||||||
| Add: | |||||||||||||||||
| Tax-equivalent adjustment (non-GAAP) | 2,261 | 2,211 | 1,316 | 1,269 | 1,297 | ||||||||||||
| Fully-taxable equivalent net interest income (non-GAAP) | $ | 130,385 | $ | 124,648 | $ | 104,007 | $ | 105,877 | $ | 101,388 | |||||||
| Noninterest income (GAAP) | $ | 46,415 | $ | 49,001 | $ | 43,209 | $ | 45,733 | $ | 55,212 | |||||||
| Less: | |||||||||||||||||
| (Losses) income from investments held in rabbi trusts | (4,433) | 4,444 | (289) | 4,216 | 1,846 | ||||||||||||
| (Losses) gains on sales of securities available for sale, net | (2,172) | — | 1 | 1 | 1,164 | ||||||||||||
| (Losses) gains on sales of other assets | (274) | 34 | 490 | 29 | 18 | ||||||||||||
| Noninterest income on an operating basis (non-GAAP) | $ | 53,294 | $ | 44,523 | $ | 43,007 | $ | 41,487 | $ | 52,184 | |||||||
| Noninterest expense (GAAP) | $ | 108,866 | $ | 143,602 | $ | 98,970 | $ | 107,335 | $ | 94,049 | |||||||
| Less: | |||||||||||||||||
| Rabbi trust employee benefit (income) expense | (2,087) | 2,519 | (53) | 2,063 | 986 | ||||||||||||
| Impairment charge (reversal) on tax credit investments | — | 116 | 1,133 | (1,419) | — | ||||||||||||
| Gain on sale of OREO | — | — | (87) | — | — | ||||||||||||
| Merger and acquisition expenses | 34 | 30,652 | 740 | 3,479 | 589 | ||||||||||||
| Settlement and expenses for putative consumer class action matters | — | — | — | 3,325 | — | ||||||||||||
| Noninterest expense on an operating basis (non-GAAP) | $ | 110,919 | $ | 110,315 | $ | 97,237 | $ | 99,887 | $ | 92,474 | |||||||
| Total revenue (GAAP) | $ | 174,539 | $ | 171,438 | $ | 145,900 | $ | 150,341 | $ | 155,303 | |||||||
| Total operating revenue (non-GAAP) | $ | 183,679 | $ | 169,171 | $ | 147,014 | $ | 147,364 | $ | 153,572 | |||||||
| Efficiency ratio (GAAP) | 62.37 | % | 83.76 | % | 67.83 | % | 71.39 | % | 60.56 | % | |||||||
| Operating efficiency ratio (non-GAAP) | 60.39 | % | 65.21 | % | 66.14 | % | 67.78 | % | 60.22 | % | |||||||
| Noninterest income / total revenue (GAAP) | 26.59 | % | 28.58 | % | 29.62 | % | 30.42 | % | 35.55 | % | |||||||
| Noninterest income / total revenue on an operating basis (non-GAAP) | 29.01 | % | 26.32 | % | 29.25 | % | 28.15 | % | 33.98 | % | |||||||
14
APPENDIX C: Reconciliation of Non-GAAP Capital Metrics
For information on non-GAAP financial measures, please see the section titled "Non-GAAP Financial Measures."
| As of | |||||||||||||||||
| Mar 31, 2022 | Dec 31, 2021 | Sep 30, 2021 | Jun 30, 2021 | Mar 31, 2021 | |||||||||||||
| (Unaudited, dollars in thousands, except share data) | |||||||||||||||||
| Tangible shareholders' equity: | |||||||||||||||||
| Total shareholders' equity (GAAP) | $ | 3,008,392 | $ | 3,406,352 | $ | 3,429,292 | $ | 3,430,622 | $ | 3,387,045 | |||||||
| Less: Goodwill and other intangibles | 654,759 | 649,703 | 379,772 | 380,402 | 376,002 | ||||||||||||
| Tangible shareholders' equity (non-GAAP) | 2,353,633 | 2,756,649 | 3,049,520 | 3,050,220 | 3,011,043 | ||||||||||||
| Tangible assets: | |||||||||||||||||
| Total assets (GAAP) | 22,836,072 | 23,512,128 | 17,461,223 | 17,047,453 | 16,726,795 | ||||||||||||
| Less: Goodwill and other intangibles | 654,759 | 649,703 | 379,772 | 380,402 | 376,002 | ||||||||||||
| Tangible assets (non-GAAP) | $ | 22,181,313 | $ | 22,862,425 | $ | 17,081,451 | $ | 16,667,051 | $ | 16,350,793 | |||||||
| Shareholders' equity to assets ratio (GAAP) | 13.17 | % | 14.49 | % | 19.64 | % | 20.12 | % | 20.25 | % | |||||||
| Tangible shareholders' equity to tangible assets ratio (non-GAAP) | 10.61 | % | 12.06 | % | 17.85 | % | 18.30 | % | 18.42 | % | |||||||
| Common shares outstanding | 183,438,711 | 186,305,332 | 186,758,154 | 186,758,154 | 186,758,154 | ||||||||||||
| Book value per share (GAAP) | $ | 16.40 | $ | 18.28 | $ | 18.36 | $ | 18.37 | $ | 18.14 | |||||||
| Tangible book value per share (non-GAAP) | $ | 12.83 | $ | 14.80 | $ | 16.33 | $ | 16.33 | $ | 16.12 | |||||||
15
APPENDIX D: Reconciliation of Non-GAAP Credit Metrics
For information on non-GAAP financial measures, please see the section titled "Non-GAAP Financial Measures."
| As of | |||||||||||||||||
| (Unaudited, dollars in thousands) | Mar 31, 2022 | Dec 31, 2021 | Sep 30, 2021 | Jun 30, 2021 | Mar 31, 2021 | ||||||||||||
| Total loans excluding PPP loans: | |||||||||||||||||
| Total loans (GAAP) (1) | $ | 12,157,769 | $ | 12,255,068 | $ | 9,481,458 | $ | 9,591,336 | $ | 9,883,802 | |||||||
| Less: PPP loans (1) | 137,307 | 321,215 | 514,018 | 799,964 | 1,210,598 | ||||||||||||
| Total loans excluding PPP loans (non-GAAP) | $ | 12,020,462 | $ | 11,933,853 | $ | 8,967,440 | $ | 8,791,372 | $ | 8,673,204 | |||||||
| Total nonperforming loans (NPLs) (GAAP) | $ | 33,821 | $ | 34,983 | $ | 42,071 | $ | 41,632 | $ | 43,954 | |||||||
| Total NPLs / total loans (GAAP) | 0.28 | % | 0.29 | % | 0.44 | % | 0.43 | % | 0.44 | % | |||||||
| Total NPLs / total loans (excl. PPP loans) (non-GAAP) | 0.28 | % | 0.29 | % | 0.47 | % | 0.47 | % | 0.51 | % | |||||||
| Allowance for loan losses (ALLL) (GAAP) | $ | 124,166 | $ | 97,787 | $ | 103,398 | $ | 105,637 | $ | 111,080 | |||||||
| ALLL / total loans (GAAP) | 1.02 | % | 0.80 | % | 1.09 | % | 1.10 | % | 1.12 | % | |||||||
| ALLL / total loans (excl. PPP loans) (non-GAAP) | 1.03 | % | 0.82 | % | 1.15 | % | 1.20 | % | 1.28 | % | |||||||
| As of and for the three months ended | |||||||||||||||||
| (Unaudited, dollars in thousands) | Mar 31, 2022 | Dec 31, 2021 | Sep 30, 2021 | Jun 30, 2021 | Mar 31, 2021 | ||||||||||||
| Average total loans excluding PPP Loans: | |||||||||||||||||
| Average total loans (GAAP) | $ | 12,204,077 | $ | 10,946,095 | $ | 9,528,522 | $ | 9,796,701 | $ | 9,816,788 | |||||||
| Less: Average PPP loans | 219,198 | 419,894 | 649,443 | 1,073,688 | 1,131,516 | ||||||||||||
| Average total loans excluding PPP loans (non-GAAP) | $ | 11,984,879 | $ | 10,526,201 | $ | 8,879,079 | $ | 8,723,013 | $ | 8,685,272 | |||||||
| Total net loans charged-off (NCOs) (GAAP) | $ | 222 | $ | 1,293 | $ | 751 | $ | 2,143 | $ | 1,371 | |||||||
| NCOs / Average total loans (GAAP) (2) | 0.01 | % | 0.05 | % | 0.03 | % | 0.09 | % | 0.06 | % | |||||||
| NCOs / Average total loans (excl. PPP loans) (non-GAAP) (2) | 0.01 | % | 0.05 | % | 0.03 | % | 0.10 | % | 0.06 | % | |||||||
| (1) Includes unamortized premiums, net of unearned discounts and deferred fees. | |||||||||||||||||
| (2) Presented on an annualized basis. | |||||||||||||||||
16
APPENDIX E: Tangible Shareholders’ Equity Roll Forward Analysis
For information on non-GAAP financial measures, please see the section titled "Non-GAAP Financial Measures."
| As of | Mar 31, 2022 change from | |||||||||||||
| Mar 31, 2022 | Dec 31, 2021 | Dec 31, 2021 | ||||||||||||
| (Unaudited, dollars in thousands, except per share amounts) | ||||||||||||||
| Common stock | $ | 1,834 | $ | 1,863 | $ | (29) | ||||||||
| Additional paid in capital | 1,777,670 | 1,835,241 | (57,571) | |||||||||||
| Unallocated ESOP common stock | (141,455) | (142,709) | 1,254 | |||||||||||
| Retained earnings | 1,782,997 | 1,768,653 | 14,344 | |||||||||||
| AOCI, net of tax - available for sale securities | (410,611) | (58,586) | (352,025) | |||||||||||
| AOCI, net of tax - pension | (5,595) | (5,471) | (124) | |||||||||||
| AOCI, net of tax - cash flow hedge | 3,552 | 7,361 | (3,809) | |||||||||||
| Total shareholders' equity: | $ | 3,008,392 | $ | 3,406,352 | $ | (397,960) | ||||||||
| Less: Goodwill and other intangibles | 654,759 | 649,703 | 5,056 | |||||||||||
| Tangible shareholders' equity (non-GAAP) | $ | 2,353,633 | $ | 2,756,649 | $ | (403,016) | ||||||||
| Common shares outstanding | 183,438,711 | 186,305,332 | (2,866,621) | |||||||||||
| Per share: | ||||||||||||||
| Common stock | $ | 0.01 | $ | 0.01 | $ | — | ||||||||
| Additional paid in capital | 9.69 | 9.85 | (0.16) | |||||||||||
| Unallocated ESOP common stock | (0.77) | (0.77) | (0.01) | |||||||||||
| Retained earnings | 9.72 | 9.49 | 0.23 | |||||||||||
| AOCI, net of tax - available for sale securities | (2.24) | (0.31) | (1.92) | |||||||||||
| AOCI, net of tax - pension | (0.03) | (0.03) | — | |||||||||||
| AOCI, net of tax - cash flow hedge | 0.02 | 0.04 | (0.02) | |||||||||||
| Total shareholders' equity: | $ | 16.40 | $ | 18.28 | $ | (1.88) | ||||||||
| Less: Goodwill and other intangibles | 3.57 | 3.49 | 0.08 | |||||||||||
| Tangible shareholders' equity (non-GAAP) | $ | 12.83 | $ | 14.80 | $ | (1.97) | ||||||||
17

DO NOT REFRESH Color PaletteComplementary 000 / 000 / 051 Body text 074 / 075 / 076 030 / 152 / 213 185 / 197 / 212 023 / 061 / 110 119 / 139 / 154 255 / 107 / 000109 / 110 / 112 237 / 237 / 238 000 / 139 / 151 137 / 139 / 141 197 / 064 / 044 166 / 168 / 171 103 / 086 / 164 208 / 210 / 211 238 / 184 / 028 Q1 Earnings Presentation April 28 | 2022 Exhibit 99.2
DO NOT REFRESH Color PaletteComplementary 000 / 000 / 051 Body text 074 / 075 / 076 030 / 152 / 213 185 / 197 / 212 023 / 061 / 110 119 / 139 / 154 255 / 107 / 000109 / 110 / 112 237 / 237 / 238 000 / 139 / 151 137 / 139 / 141 197 / 064 / 044 166 / 168 / 171 103 / 086 / 164 208 / 210 / 211 238 / 184 / 028 2 On the call Presenter Topic Bob Rivers Opening Remarks Chief Executive Officer & Chair of the Board Jim Fitzgerald FinancialsChief Administrative Officer, Chief Financial Officer & Treasurer
DO NOT REFRESH Color PaletteComplementary 000 / 000 / 051 Body text 074 / 075 / 076 030 / 152 / 213 185 / 197 / 212 023 / 061 / 110 119 / 139 / 154 255 / 107 / 000109 / 110 / 112 237 / 237 / 238 000 / 139 / 151 137 / 139 / 141 197 / 064 / 044 166 / 168 / 171 103 / 086 / 164 208 / 210 / 211 238 / 184 / 028 3 Forward-looking statements This presentation contains “forward-looking statements” within the meaning of section 27A of the Securities Act of 1933, as amended, and section 21E of the Securities Exchange Act of 1934, as amended. Forward-looking statements include statements regarding anticipated future events and can be identified by the fact that they do not relate strictly to historical or current facts. You can identify these statements from the use of the words “may,” “will,” “should,” “could,” “would,” “plan,” “potential,” “estimate,” “project,” “believe,” “intend,” “anticipate,” “expect,” “target” and similar expressions. Forward-looking statements, by their nature, are subject to risks and uncertainties. There are many factors that could cause actual results to differ materially from expected results described in the forward-looking statements. Certain factors that could cause actual results to differ materially from expected results include developments in the Company’s market relating to the COVID-19 pandemic, including the severity and duration of the associated economic slowdown; adverse developments in the level and direction of loan delinquencies and charge-offs and changes in estimates of the adequacy of the allowance for loan losses; increased competitive pressures; changes in the interest rate environment; risks that revenue or expense synergies or the other expected benefits of the Company’s merger with Century (“Transaction”) may not fully materialize for the Company in the timeframe expected or at all, or may be more costly to achieve; risks that the Company is unable to successfully implement integration strategies for the transaction; reputational risks and the reaction of customers to the Transaction; and diversion of management time on Transaction-related issues; as well as general economic conditions or conditions within the securities markets; and legislative and regulatory changes and related compliance costs that could adversely affect the business in which the Company and its subsidiary Eastern Bank are engaged, including inflation, interest rates, interest rate sensitivity and liquidity, including the effect of, and changes in, monetary and fiscal policies and laws, such as the interest rate policies of the Board of Governors of the Federal Reserve System; market and monetary fluctuations, including fluctuations due to actual or anticipated changes to federal tax laws; credit quality, including adverse developments in local or regional real estate markets that decrease collateral values associated with existing loans; and the failure of the Company to execute all of its planned share repurchases. For further discussion of such factors, please see the Company’s most recent Annual Report on Form 10-K and subsequent filings with the U.S. Securities and Exchange Commission (the “SEC”), which are available on the SEC’s website at www.sec.gov. Further, given the ongoing and dynamic nature of the COVID-19 pandemic, it is difficult to predict what continued effects the COVID-19 pandemic will have on the Company's business and results of operations. The COVID-19 pandemic and the related local and national economic disruption may result in a continued decline in demand for the Company's products and services; increased levels of loan delinquencies, problem assets and foreclosures; an increase in the Company's allowance for loan losses; a decline in the value of loan collateral, including real estate; reduced demand for office space in the Company's markets due to remote and/or hybrid work arrangements; a greater decline in the yield on the Company's interest-earning assets than the decline in the cost of the Company's interest-bearing liabilities; and increased cybersecurity risks, as employees continue to work remotely. Accordingly, you should not place undue reliance on forward-looking statements, which reflect the Company's expectations only as of the date of this presentation. The Company does not undertake any obligation to update forward-looking statements.
DO NOT REFRESH Color PaletteComplementary 000 / 000 / 051 Body text 074 / 075 / 076 030 / 152 / 213 185 / 197 / 212 023 / 061 / 110 119 / 139 / 154 255 / 107 / 000109 / 110 / 112 237 / 237 / 238 000 / 139 / 151 137 / 139 / 141 197 / 064 / 044 166 / 168 / 171 103 / 086 / 164 208 / 210 / 211 238 / 184 / 028 4 Non-GAAP financial measures used in this presentation are denoted by an asterisk. A non-GAAP financial measure is defined as a numerical measure of the Company’s historical or future financial performance, financial position or cash flows that excludes (or includes) amounts, or is subject to adjustments that have the effect of excluding (or including) amounts that are included in the most directly comparable measure calculated and presented in accordance with accounting principles generally accepted in the United States (“GAAP”) in the Company’s statement of income, balance sheet or statement of cash flows (or equivalent statements). The Company presents non-GAAP financial measures, which management uses to evaluate the Company’s performance, and which exclude the effects of certain transactions that management believes are unrelated to its core business and are therefore not necessarily indicative of its current performance or financial position. Management believes excluding these items facilitates greater visibility for investors into the Company’s core businesses as well as underlying trends that may, to some extent, be obscured by inclusion of such items in the corresponding GAAP financial measures. There are items in the Company’s financial statements that impact its financial results, but which management believes are unrelated to the Company’s core business. Accordingly, the Company presents noninterest income on an operating basis, total operating revenue, noninterest expense on an operating basis, operating net income, operating earnings per share, operating return on average assets, operating return on average shareholders’ equity, the operating efficiency ratio, and the ratio of noninterest income to total revenue on an operating basis. Each of these figures excludes the impact of such applicable items because management believes such exclusion can provide greater visibility into the Company’s core business and underlying trends. Such items that management does not consider to be core to the Company’s business include (i) income and expenses from investments held in rabbi trusts, (ii) gains and losses on sales of securities available for sale, net, (iii) gains and losses on the sale of other assets, (iv) rabbi trust employee benefits, (v) impairment charges on tax credit investments and associated tax credit benefits, (vi) expenses indirectly associated with the Company’s initial public offering (“IPO”), (vii) other real estate owned (“OREO”) gains, (viii) merger and acquisition expenses, (ix) the stock donation to the Eastern Bank Foundation (“EBF”) in connection with the Company’s mutual-to-stock conversion and IPO, and (x) settlement of putative consumer class action litigation matters related to overdraft and non-sufficient funds fees, and associated settlement expenses. The Company does not provide an outlook for its total noninterest income and total noninterest expense because each contains income or expense components, as applicable, such as income associated with rabbi trust accounts and rabbi trust employee benefit expense, which are market-driven, and over which the Company cannot exercise control. Accordingly, reconciliations of the Company’s outlook for its noninterest income on an operating basis and its noninterest expense on an operating basis to an outlook for total noninterest income and total noninterest expense, respectively, cannot be made available without unreasonable effort. Management presents certain asset quality metrics excluding PPP loans which it does not consider to be part of the Company’s core portfolio. These metrics include the ratio of total nonperforming loans to total loans excluding PPP loans, the ratio of the allowance for loan losses to total loans excluding PPP loans, and the ratio of annualized net charge-offs to average total loans excluding PPP loans. The Company does not provide an outlook for its ratio of the allowance for loan losses to total loans because it contains components, such as the volume of PPP loans which is market-driven, over which the Company cannot exercise control. Accordingly, a reconciliation of the Company’s outlook for its ratio of the allowance for loan losses to total loans to an outlook for its ratio of the allowance for loan losses to total loans excluding PPP loans cannot be made available without unreasonable effort. The Company does not provide an outlook for its ratio of annualized net charge-offs to average total loans because it contains components, such as the volume PPP loans which is market-driven, over which the Company cannot exercise control. Accordingly, a reconciliation of the Company’s outlook for its ratio of annualized net charge-offs to average total loans to an outlook for its ratio of annualized net charge-offs to average total loans excluding PPP loans cannot be made available without unreasonable effort. The Company anticipates that the vast majority of its PPP loans outstanding at March 31, 2022 will be forgiven, and to the extent not forgiven, a PPP loan is intended to be 100% guaranteed by the SBA. Management also presents tangible assets, tangible shareholders’ equity, tangible book value per share, and the ratio of tangible shareholders’ equity to tangible assets, each of which excludes the impact of goodwill and other intangible assets, as management believes these financial measures provide investors with the ability to further assess the Company’s performance, identify trends in its core business and provide a comparison of its capital adequacy to other companies. The Company included the tangible ratios because management believes that investors may find it useful to have access to the same analytical tools used by management to assess performance and identify trends. These non-GAAP financial measures presented in this presentation should not be considered an alternative or substitute for financial results or measures determined in accordance with GAAP or as an indication of the Company’s cash flows from operating activities, a measure of its liquidity position or an indication of funds available for its cash needs. An item which management considers to be non-core and excludes when computing these non-GAAP measures can be of substantial importance to the Company’s results for any particular period. In addition, management’s methodology for calculating non-GAAP financial measures may differ from the methodologies employed by other banking companies to calculate the same or similar performance measures, and accordingly, the Company’s reported non-GAAP financial measures may not be comparable to the same or similar performance measures reported by other banking companies. Please refer to Appendices A-E for a reconciliations of the Company's GAAP financial measures to the non- GAAP financial measures in this presentation. Non-GAAP financial measures
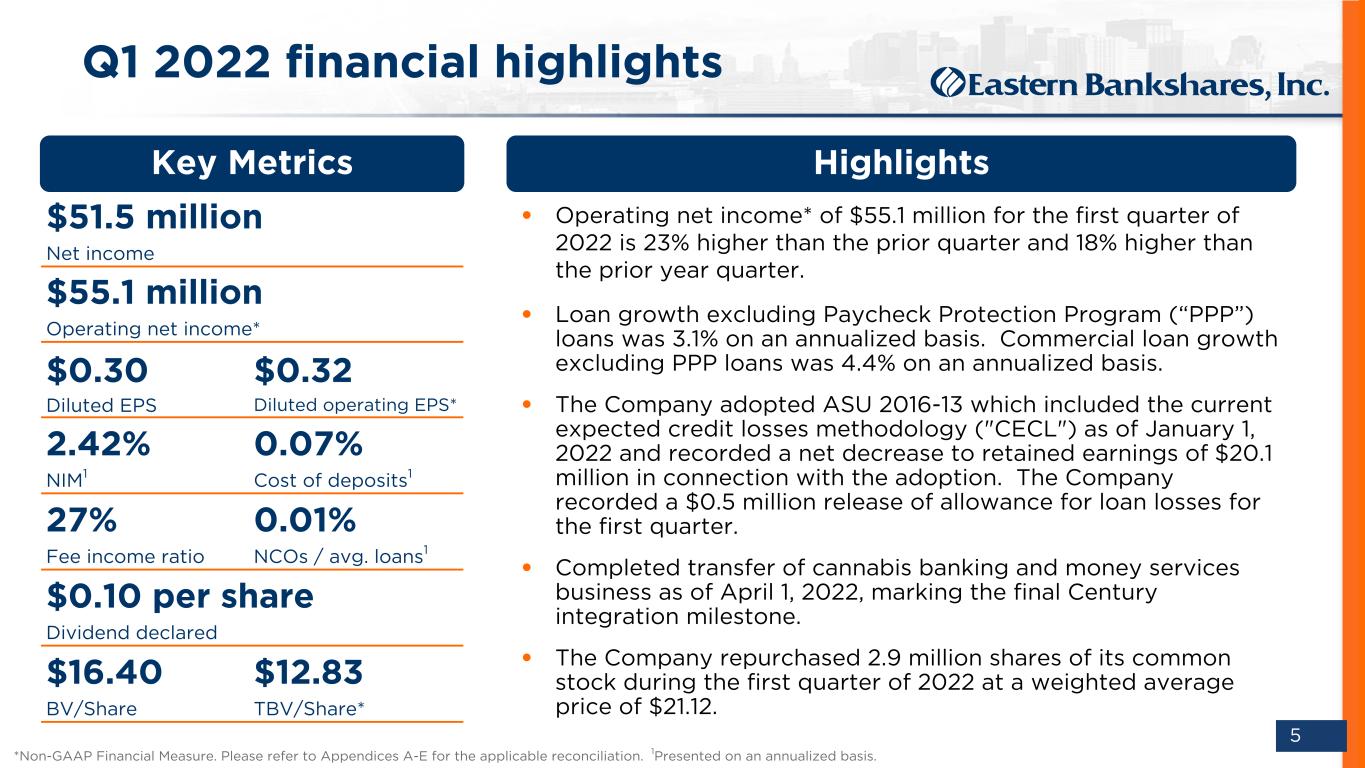
DO NOT REFRESH Color PaletteComplementary 000 / 000 / 051 Body text 074 / 075 / 076 030 / 152 / 213 185 / 197 / 212 023 / 061 / 110 119 / 139 / 154 255 / 107 / 000109 / 110 / 112 237 / 237 / 238 000 / 139 / 151 137 / 139 / 141 197 / 064 / 044 166 / 168 / 171 103 / 086 / 164 208 / 210 / 211 238 / 184 / 028 5 Q1 2022 financial highlights • Operating net income* of $55.1 million for the first quarter of 2022 is 23% higher than the prior quarter and 18% higher than the prior year quarter. • Loan growth excluding Paycheck Protection Program (“PPP”) loans was 3.1% on an annualized basis. Commercial loan growth excluding PPP loans was 4.4% on an annualized basis. • The Company adopted ASU 2016-13 which included the current expected credit losses methodology ("CECL") as of January 1, 2022 and recorded a net decrease to retained earnings of $20.1 million in connection with the adoption. The Company recorded a $0.5 million release of allowance for loan losses for the first quarter. • Completed transfer of cannabis banking and money services business as of April 1, 2022, marking the final Century integration milestone. • The Company repurchased 2.9 million shares of its common stock during the first quarter of 2022 at a weighted average price of $21.12. *Non-GAAP Financial Measure. Please refer to Appendices A-E for the applicable reconciliation. 1Presented on an annualized basis. Key Metrics Highlights $0.10 per share Dividend declared $51.5 million Net income $55.1 million Operating net income* $0.30 $0.32 Diluted EPS Diluted operating EPS* $16.40 $12.83 BV/Share TBV/Share* 2.42% 0.07% NIM1 Cost of deposits1 27% 0.01% Fee income ratio NCOs / avg. loans1
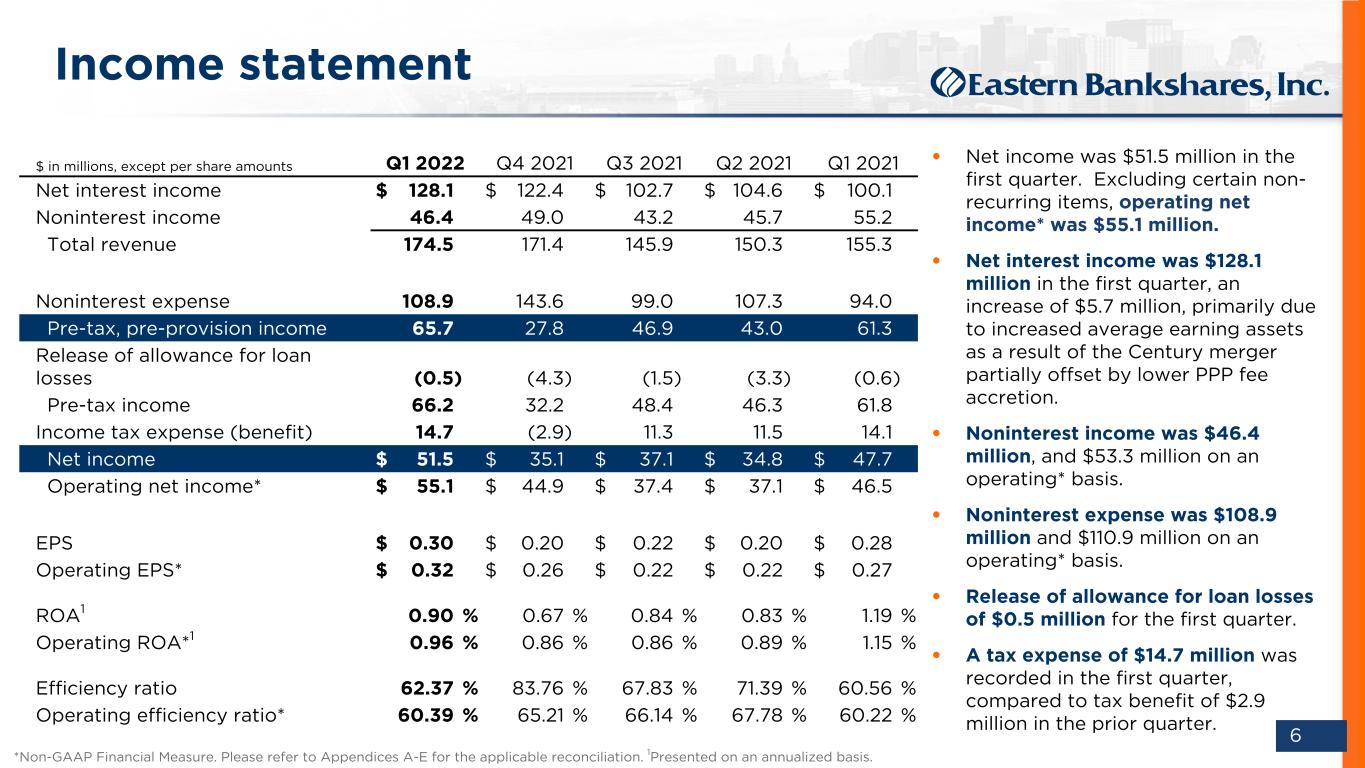
DO NOT REFRESH Color PaletteComplementary 000 / 000 / 051 Body text 074 / 075 / 076 030 / 152 / 213 185 / 197 / 212 023 / 061 / 110 119 / 139 / 154 255 / 107 / 000109 / 110 / 112 237 / 237 / 238 000 / 139 / 151 137 / 139 / 141 197 / 064 / 044 166 / 168 / 171 103 / 086 / 164 208 / 210 / 211 238 / 184 / 028 6 • Net income was $51.5 million in the first quarter. Excluding certain non- recurring items, operating net income* was $55.1 million. • Net interest income was $128.1 million in the first quarter, an increase of $5.7 million, primarily due to increased average earning assets as a result of the Century merger partially offset by lower PPP fee accretion. • Noninterest income was $46.4 million, and $53.3 million on an operating* basis. • Noninterest expense was $108.9 million and $110.9 million on an operating* basis. • Release of allowance for loan losses of $0.5 million for the first quarter. • A tax expense of $14.7 million was recorded in the first quarter, compared to tax benefit of $2.9 million in the prior quarter. $ in millions, except per share amounts Q1 2022 Q4 2021 Q3 2021 Q2 2021 Q1 2021 Net interest income $ 128.1 $ 122.4 $ 102.7 $ 104.6 $ 100.1 Noninterest income 46.4 49.0 43.2 45.7 55.2 Total revenue 174.5 171.4 145.9 150.3 155.3 Noninterest expense 108.9 143.6 99.0 107.3 94.0 Pre-tax, pre-provision income 65.7 27.8 46.9 43.0 61.3 Release of allowance for loan losses (0.5) (4.3) (1.5) (3.3) (0.6) Pre-tax income 66.2 32.2 48.4 46.3 61.8 Income tax expense (benefit) 14.7 (2.9) 11.3 11.5 14.1 Net income $ 51.5 $ 35.1 $ 37.1 $ 34.8 $ 47.7 Operating net income* $ 55.1 $ 44.9 $ 37.4 $ 37.1 $ 46.5 EPS $ 0.30 $ 0.20 $ 0.22 $ 0.20 $ 0.28 Operating EPS* $ 0.32 $ 0.26 $ 0.22 $ 0.22 $ 0.27 ROA1 0.90 % 0.67 % 0.84 % 0.83 % 1.19 % Operating ROA*1 0.96 % 0.86 % 0.86 % 0.89 % 1.15 % Efficiency ratio 62.37 % 83.76 % 67.83 % 71.39 % 60.56 % Operating efficiency ratio* 60.39 % 65.21 % 66.14 % 67.78 % 60.22 % *Non-GAAP Financial Measure. Please refer to Appendices A-E for the applicable reconciliation. 1Presented on an annualized basis. Income statement
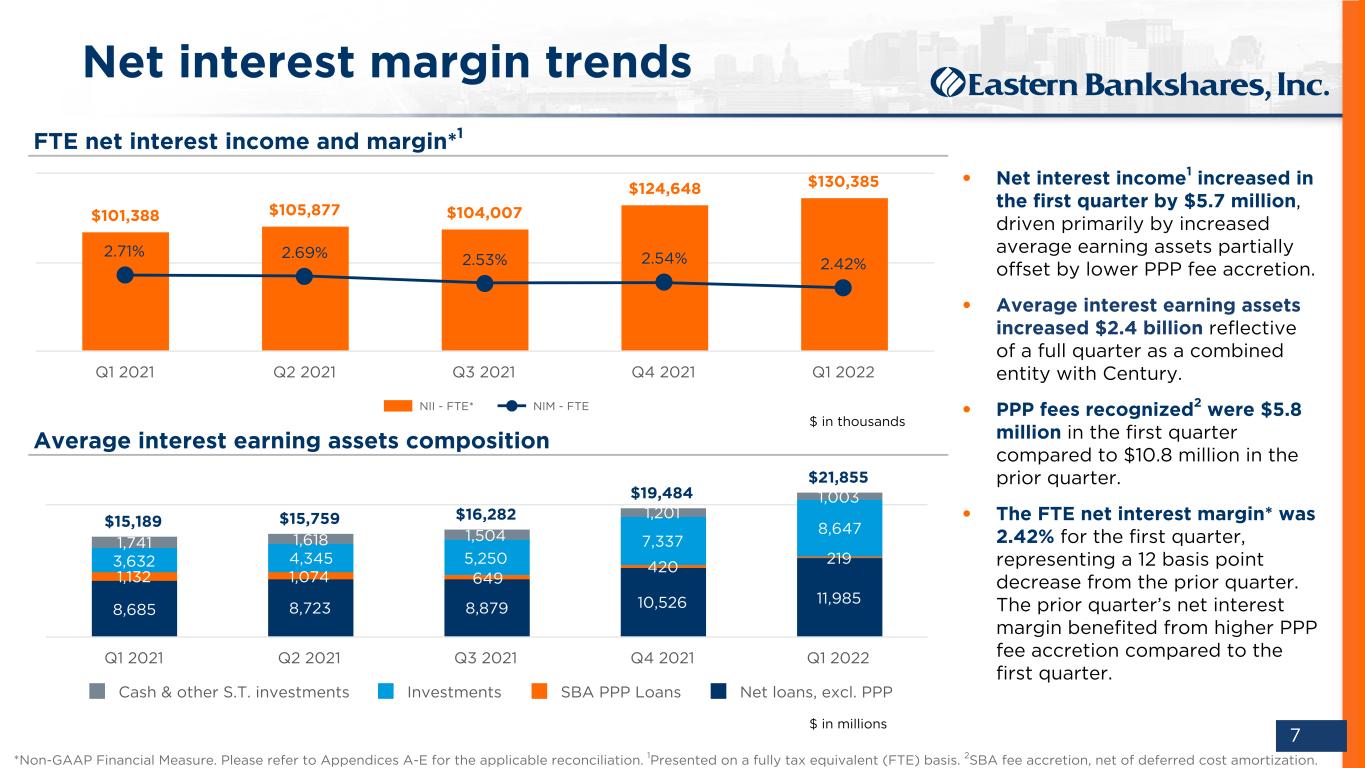
DO NOT REFRESH Color PaletteComplementary 000 / 000 / 051 Body text 074 / 075 / 076 030 / 152 / 213 185 / 197 / 212 023 / 061 / 110 119 / 139 / 154 255 / 107 / 000109 / 110 / 112 237 / 237 / 238 000 / 139 / 151 137 / 139 / 141 197 / 064 / 044 166 / 168 / 171 103 / 086 / 164 208 / 210 / 211 238 / 184 / 028 7 FTE net interest income and margin*1 Average interest earning assets composition $101,388 $105,877 $104,007 $124,648 $130,385 2.71% 2.69% 2.53% 2.54% 2.42% NII - FTE* NIM - FTE Q1 2021 Q2 2021 Q3 2021 Q4 2021 Q1 2022 • Net interest income1 increased in the first quarter by $5.7 million, driven primarily by increased average earning assets partially offset by lower PPP fee accretion. • Average interest earning assets increased $2.4 billion reflective of a full quarter as a combined entity with Century. • PPP fees recognized2 were $5.8 million in the first quarter compared to $10.8 million in the prior quarter. • The FTE net interest margin* was 2.42% for the first quarter, representing a 12 basis point decrease from the prior quarter. The prior quarter’s net interest margin benefited from higher PPP fee accretion compared to the first quarter. Net interest margin trends $15,189 $15,759 $16,282 $19,484 $21,855 8,685 8,723 8,879 10,526 11,985 1,132 1,074 649 420 2193,632 4,345 5,250 7,337 8,647 1,741 1,618 1,504 1,201 1,003 Cash & other S.T. investments Investments SBA PPP Loans Net loans, excl. PPP Q1 2021 Q2 2021 Q3 2021 Q4 2021 Q1 2022 $ in thousands $ in millions *Non-GAAP Financial Measure. Please refer to Appendices A-E for the applicable reconciliation. 1Presented on a fully tax equivalent (FTE) basis. 2SBA fee accretion, net of deferred cost amortization.
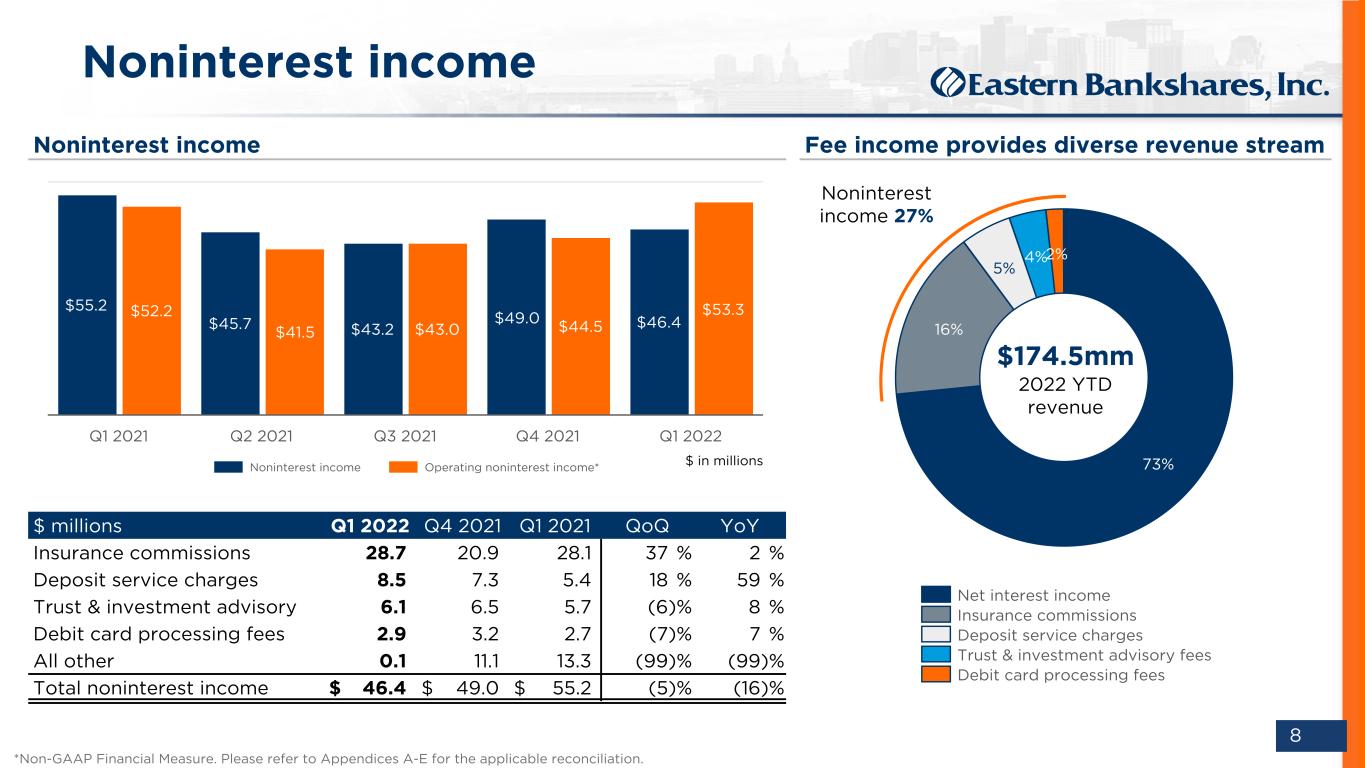
DO NOT REFRESH Color PaletteComplementary 000 / 000 / 051 Body text 074 / 075 / 076 030 / 152 / 213 185 / 197 / 212 023 / 061 / 110 119 / 139 / 154 255 / 107 / 000109 / 110 / 112 237 / 237 / 238 000 / 139 / 151 137 / 139 / 141 197 / 064 / 044 166 / 168 / 171 103 / 086 / 164 208 / 210 / 211 238 / 184 / 028 8 73% 16% 5% 4%2% Net interest income Insurance commissions Deposit service charges Trust & investment advisory fees Debit card processing fees Noninterest income Noninterest income Fee income provides diverse revenue stream $174.5mm 2022 YTD revenue Noninterest income 27% $55.2 $45.7 $43.2 $49.0 $46.4 $52.2 $41.5 $43.0 $44.5 $53.3 Noninterest income Operating noninterest income* Q1 2021 Q2 2021 Q3 2021 Q4 2021 Q1 2022 $ in millions *Non-GAAP Financial Measure. Please refer to Appendices A-E for the applicable reconciliation. $ millions Q1 2022 Q4 2021 Q1 2021 QoQ YoY Insurance commissions 28.7 20.9 28.1 37 % 2 % Deposit service charges 8.5 7.3 5.4 18 % 59 % Trust & investment advisory 6.1 6.5 5.7 (6) % 8 % Debit card processing fees 2.9 3.2 2.7 (7) % 7 % All other 0.1 11.1 13.3 (99) % (99) % Total noninterest income $ 46.4 $ 49.0 $ 55.2 (5) % (16) %
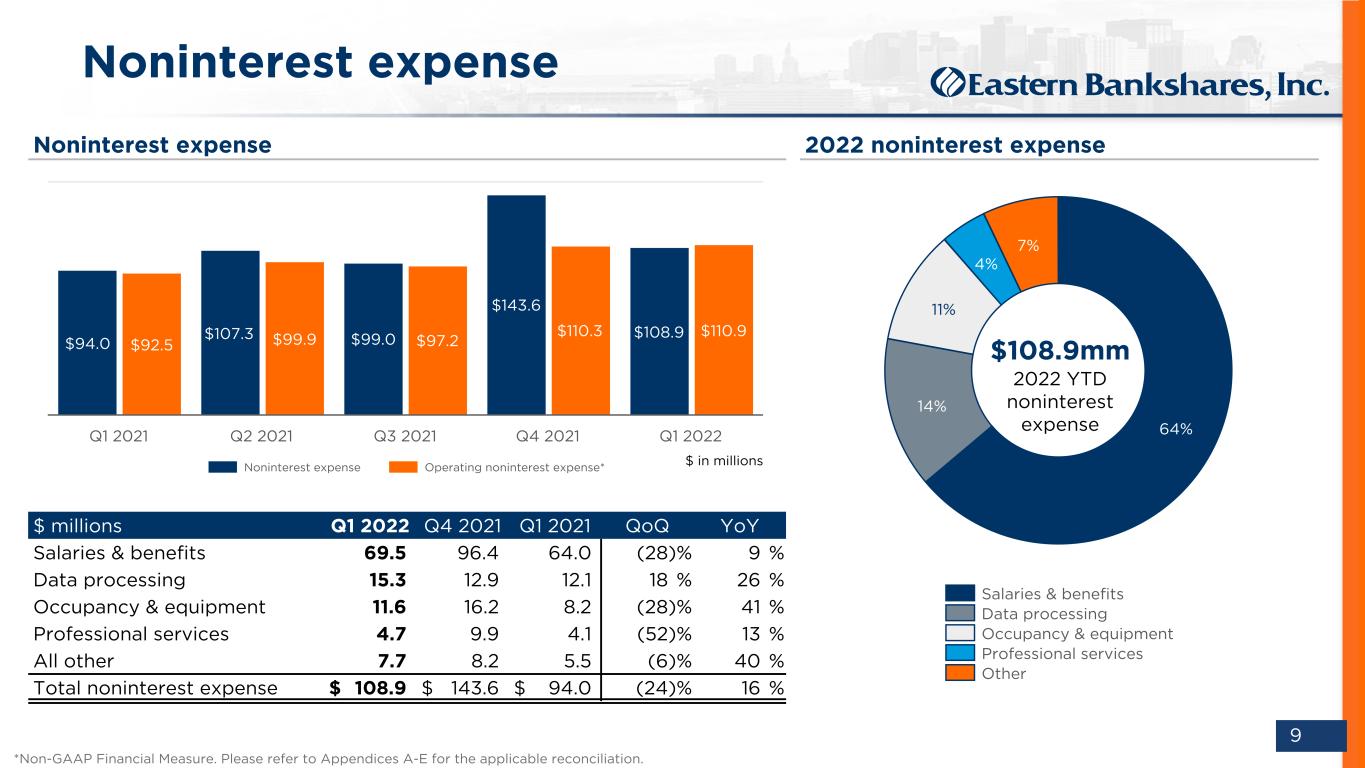
DO NOT REFRESH Color PaletteComplementary 000 / 000 / 051 Body text 074 / 075 / 076 030 / 152 / 213 185 / 197 / 212 023 / 061 / 110 119 / 139 / 154 255 / 107 / 000109 / 110 / 112 237 / 237 / 238 000 / 139 / 151 137 / 139 / 141 197 / 064 / 044 166 / 168 / 171 103 / 086 / 164 208 / 210 / 211 238 / 184 / 028 9 $94.0 $107.3 $99.0 $143.6 $108.9 $92.5 $99.9 $97.2 $110.3 $110.9 Noninterest expense Operating noninterest expense* Q1 2021 Q2 2021 Q3 2021 Q4 2021 Q1 2022 Noninterest expense Noninterest expense 2022 noninterest expense 64% 14% 11% 4% 7% Salaries & benefits Data processing Occupancy & equipment Professional services Other $108.9mm 2022 YTD noninterest expense *Non-GAAP Financial Measure. Please refer to Appendices A-E for the applicable reconciliation. $ millions Q1 2022 Q4 2021 Q1 2021 QoQ YoY Salaries & benefits 69.5 96.4 64.0 (28) % 9 % Data processing 15.3 12.9 12.1 18 % 26 % Occupancy & equipment 11.6 16.2 8.2 (28) % 41 % Professional services 4.7 9.9 4.1 (52) % 13 % All other 7.7 8.2 5.5 (6) % 40 % Total noninterest expense $ 108.9 $ 143.6 $ 94.0 (24) % 16 % $ in millions
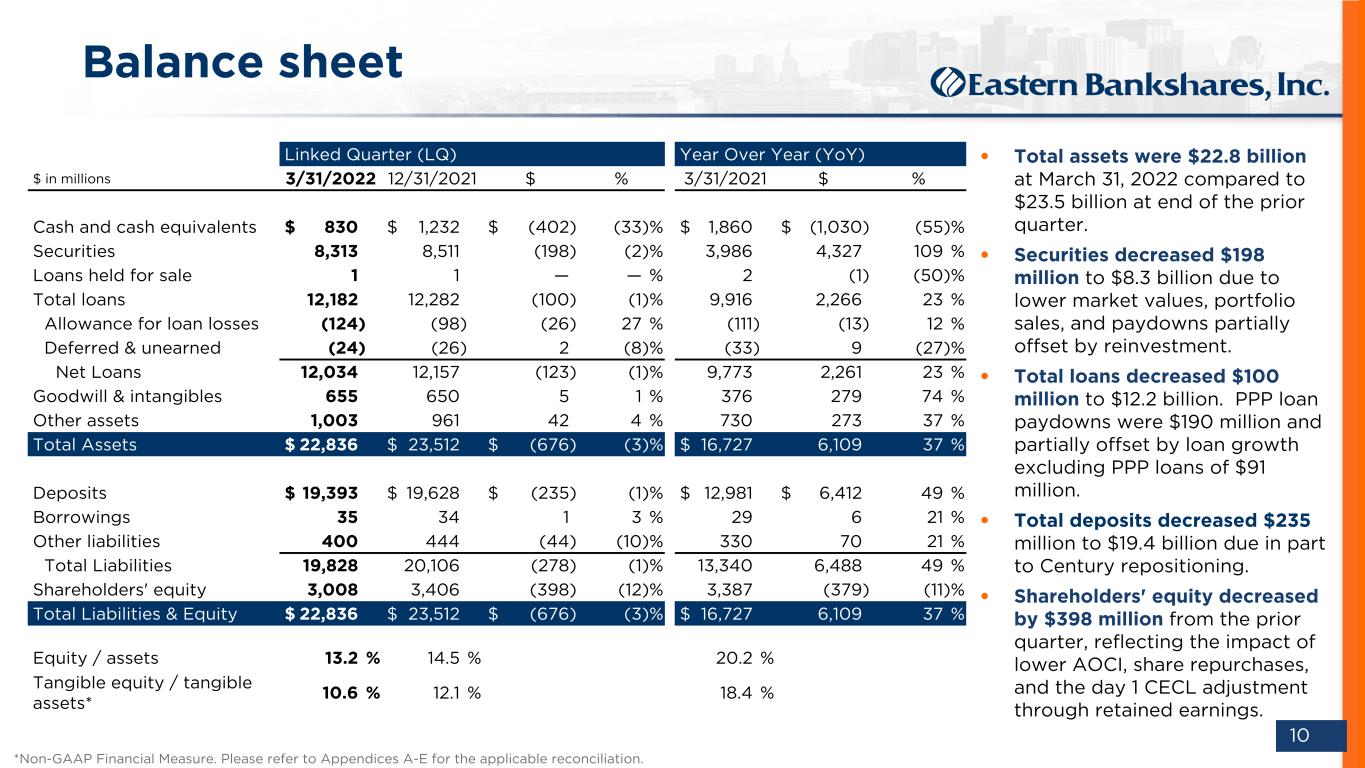
DO NOT REFRESH Color PaletteComplementary 000 / 000 / 051 Body text 074 / 075 / 076 030 / 152 / 213 185 / 197 / 212 023 / 061 / 110 119 / 139 / 154 255 / 107 / 000109 / 110 / 112 237 / 237 / 238 000 / 139 / 151 137 / 139 / 141 197 / 064 / 044 166 / 168 / 171 103 / 086 / 164 208 / 210 / 211 238 / 184 / 028 10 Linked Quarter (LQ) Year Over Year (YoY) $ in millions 3/31/2022 12/31/2021 $ % 3/31/2021 $ % Cash and cash equivalents $ 830 $ 1,232 $ (402) (33) % $ 1,860 $ (1,030) (55) % Securities 8,313 8,511 (198) (2) % 3,986 4,327 109 % Loans held for sale 1 1 — — % 2 (1) (50) % Total loans 12,182 12,282 (100) (1) % 9,916 2,266 23 % Allowance for loan losses (124) (98) (26) 27 % (111) (13) 12 % Deferred & unearned (24) (26) 2 (8) % (33) 9 (27) % Net Loans 12,034 12,157 (123) (1) % 9,773 2,261 23 % Goodwill & intangibles 655 650 5 1 % 376 279 74 % Other assets 1,003 961 42 4 % 730 273 37 % Total Assets $ 22,836 $ 23,512 $ (676) (3) % $ 16,727 6,109 37 % Deposits $ 19,393 $ 19,628 $ (235) (1) % $ 12,981 $ 6,412 49 % Borrowings 35 34 1 3 % 29 6 21 % Other liabilities 400 444 (44) (10) % 330 70 21 % Total Liabilities 19,828 20,106 (278) (1) % 13,340 6,488 49 % Shareholders' equity 3,008 3,406 (398) (12) % 3,387 (379) (11) % Total Liabilities & Equity $ 22,836 $ 23,512 $ (676) (3) % $ 16,727 6,109 37 % Equity / assets 13.2 % 14.5 % 20.2 % Tangible equity / tangible assets* 10.6 % 12.1 % 18.4 % • Total assets were $22.8 billion at March 31, 2022 compared to $23.5 billion at end of the prior quarter. • Securities decreased $198 million to $8.3 billion due to lower market values, portfolio sales, and paydowns partially offset by reinvestment. • Total loans decreased $100 million to $12.2 billion. PPP loan paydowns were $190 million and partially offset by loan growth excluding PPP loans of $91 million. • Total deposits decreased $235 million to $19.4 billion due in part to Century repositioning. • Shareholders' equity decreased by $398 million from the prior quarter, reflecting the impact of lower AOCI, share repurchases, and the day 1 CECL adjustment through retained earnings. Balance sheet *Non-GAAP Financial Measure. Please refer to Appendices A-E for the applicable reconciliation.
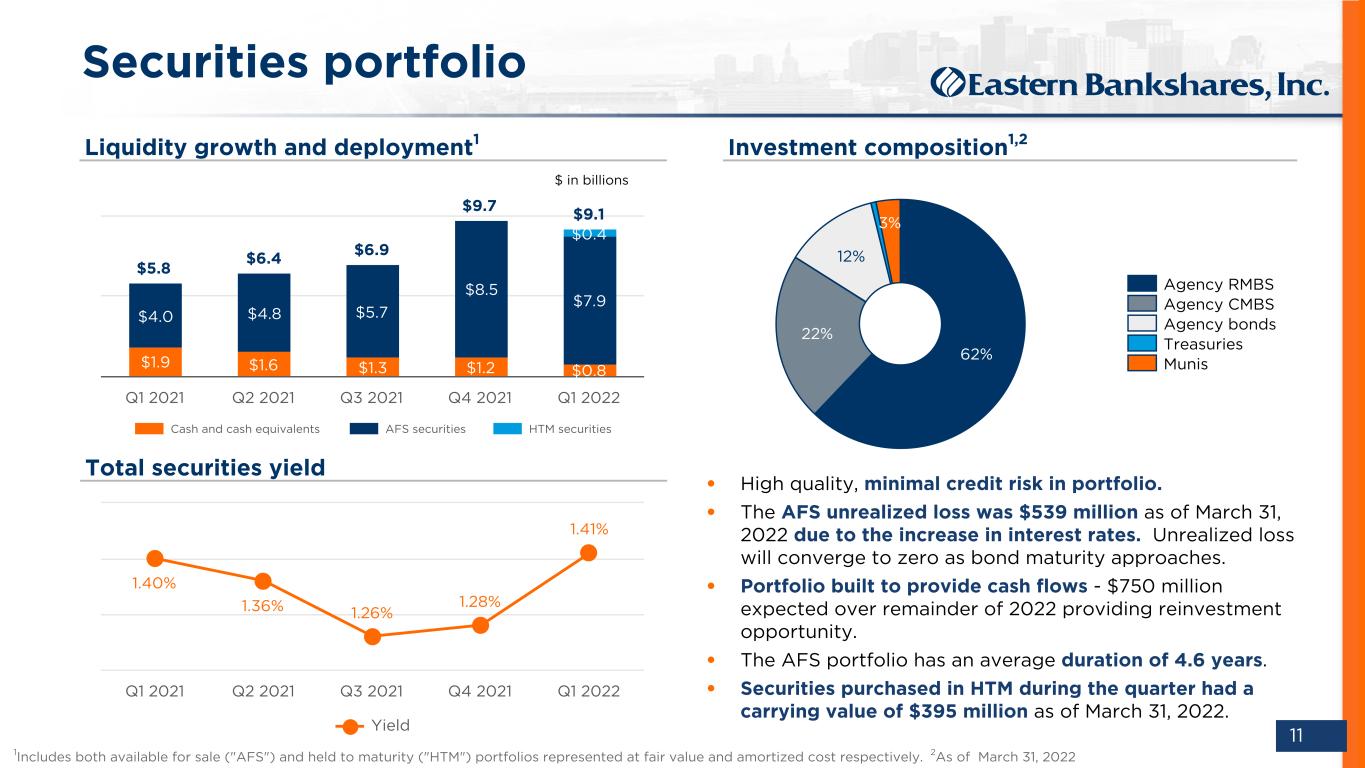
DO NOT REFRESH Color PaletteComplementary 000 / 000 / 051 Body text 074 / 075 / 076 030 / 152 / 213 185 / 197 / 212 023 / 061 / 110 119 / 139 / 154 255 / 107 / 000109 / 110 / 112 237 / 237 / 238 000 / 139 / 151 137 / 139 / 141 197 / 064 / 044 166 / 168 / 171 103 / 086 / 164 208 / 210 / 211 238 / 184 / 028 11 Securities portfolio Investment composition1,2 $ in billions Liquidity growth and deployment1 Total securities yield • High quality, minimal credit risk in portfolio. • The AFS unrealized loss was $539 million as of March 31, 2022 due to the increase in interest rates. Unrealized loss will converge to zero as bond maturity approaches. • Portfolio built to provide cash flows - $750 million expected over remainder of 2022 providing reinvestment opportunity. • The AFS portfolio has an average duration of 4.6 years. • Securities purchased in HTM during the quarter had a carrying value of $395 million as of March 31, 2022. 62% 22% 12% 3% 0% Agency RMBS Agency CMBS Agency bonds Treasuries Munis 1.40% 1.36% 1.26% 1.28% 1.41% Yield Q1 2021 Q2 2021 Q3 2021 Q4 2021 Q1 2022 1Includes both available for sale ("AFS") and held to maturity ("HTM") portfolios represented at fair value and amortized cost respectively. 2As of March 31, 2022 $5.8 $6.4 $6.9 $9.7 $9.1 $1.9 $1.6 $1.3 $1.2 $0.8 $4.0 $4.8 $5.7 $8.5 $7.9 $0.4 Cash and cash equivalents AFS securities HTM securities Q1 2021 Q2 2021 Q3 2021 Q4 2021 Q1 2022
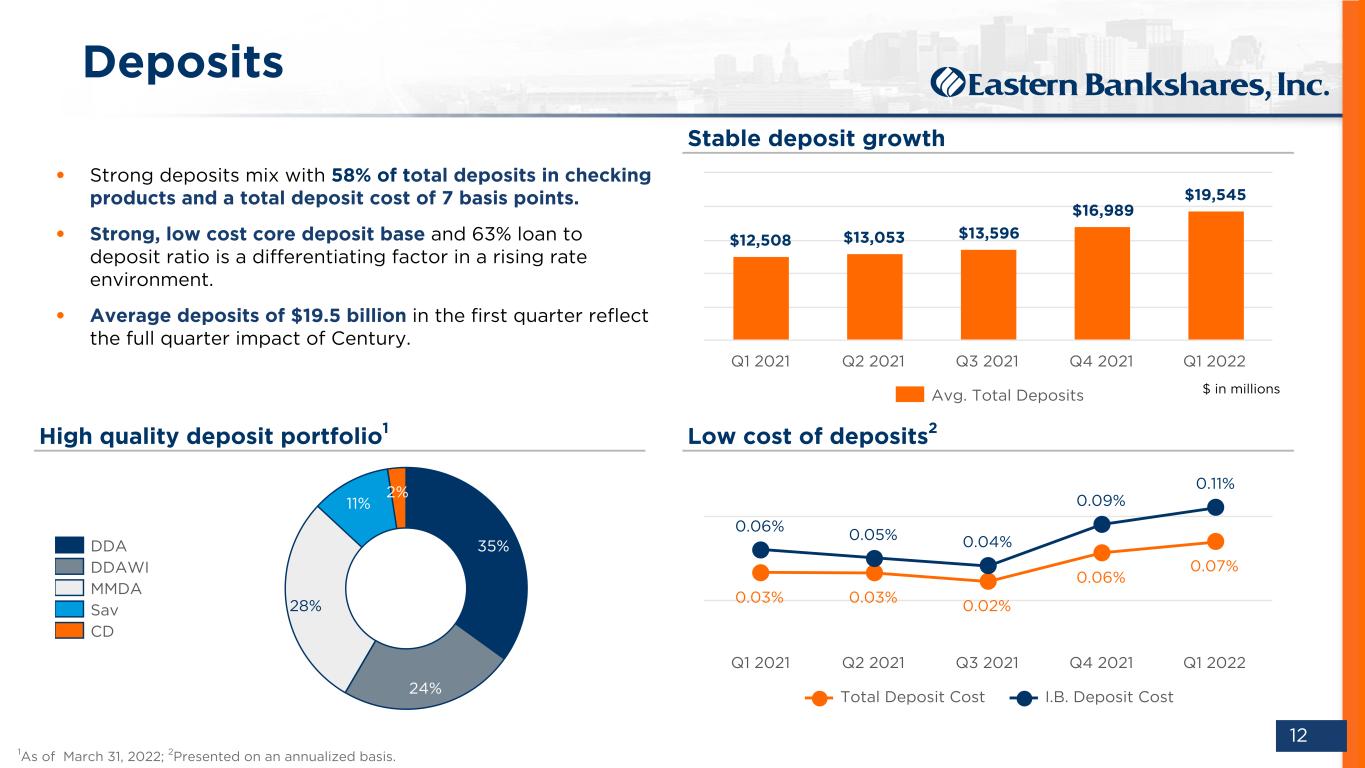
DO NOT REFRESH Color PaletteComplementary 000 / 000 / 051 Body text 074 / 075 / 076 030 / 152 / 213 185 / 197 / 212 023 / 061 / 110 119 / 139 / 154 255 / 107 / 000109 / 110 / 112 237 / 237 / 238 000 / 139 / 151 137 / 139 / 141 197 / 064 / 044 166 / 168 / 171 103 / 086 / 164 208 / 210 / 211 238 / 184 / 028 12 • Strong deposits mix with 58% of total deposits in checking products and a total deposit cost of 7 basis points. • Strong, low cost core deposit base and 63% loan to deposit ratio is a differentiating factor in a rising rate environment. • Average deposits of $19.5 billion in the first quarter reflect the full quarter impact of Century. Stable deposit growth Low cost of deposits2High quality deposit portfolio1 35% 24% 28% 11% 2% DDA DDAWI MMDA Sav CD $12,508 $13,053 $13,596 $16,989 $19,545 Avg. Total Deposits Q1 2021 Q2 2021 Q3 2021 Q4 2021 Q1 2022 0.03% 0.03% 0.02% 0.06% 0.07% 0.06% 0.05% 0.04% 0.09% 0.11% Total Deposit Cost I.B. Deposit Cost Q1 2021 Q2 2021 Q3 2021 Q4 2021 Q1 2022 Deposits $ in millions 1As of March 31, 2022; 2Presented on an annualized basis.
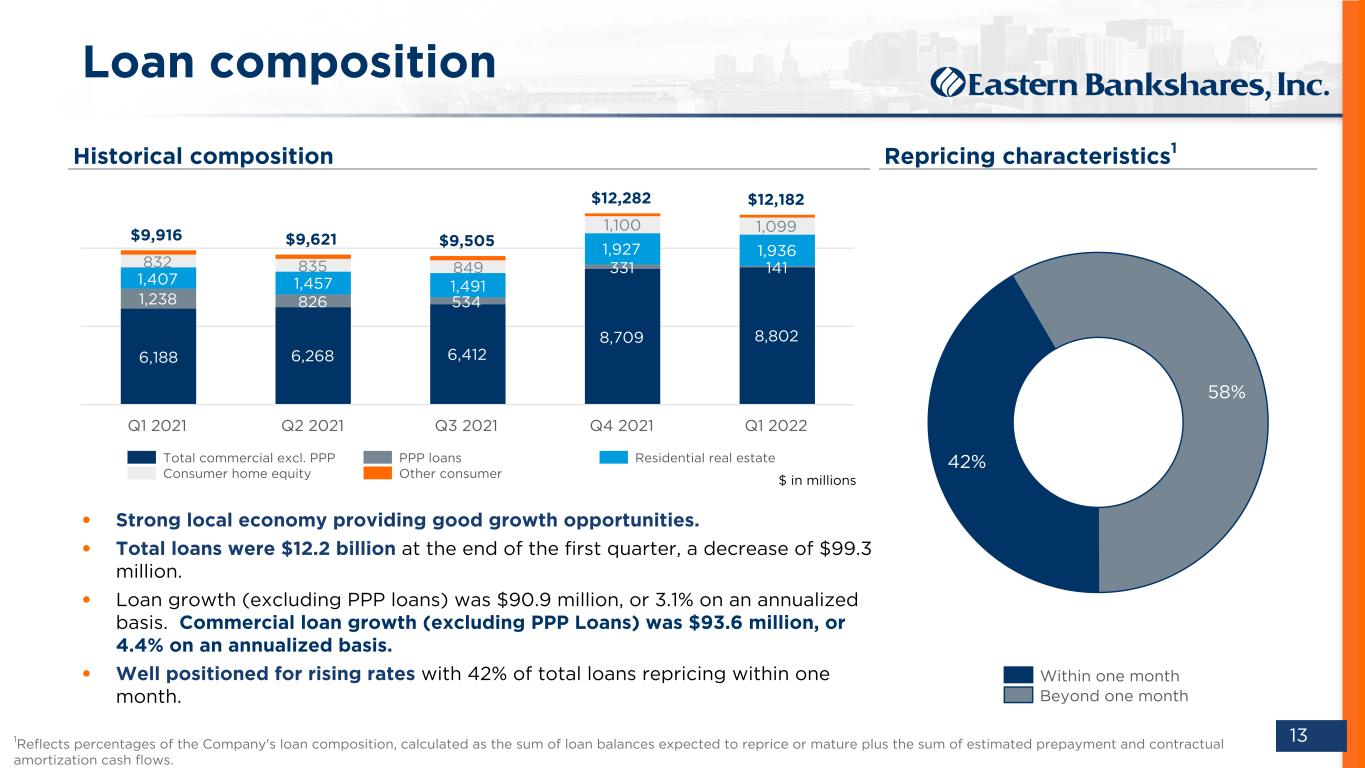
DO NOT REFRESH Color PaletteComplementary 000 / 000 / 051 Body text 074 / 075 / 076 030 / 152 / 213 185 / 197 / 212 023 / 061 / 110 119 / 139 / 154 255 / 107 / 000109 / 110 / 112 237 / 237 / 238 000 / 139 / 151 137 / 139 / 141 197 / 064 / 044 166 / 168 / 171 103 / 086 / 164 208 / 210 / 211 238 / 184 / 028 13 42% 58% Within one month Beyond one month • Strong local economy providing good growth opportunities. • Total loans were $12.2 billion at the end of the first quarter, a decrease of $99.3 million. • Loan growth (excluding PPP loans) was $90.9 million, or 3.1% on an annualized basis. Commercial loan growth (excluding PPP Loans) was $93.6 million, or 4.4% on an annualized basis. • Well positioned for rising rates with 42% of total loans repricing within one month. Loan composition Repricing characteristics1 $9,916 $9,621 $9,505 $12,282 $12,182 6,188 6,268 6,412 8,709 8,802 1,238 826 534 331 141 1,407 1,457 1,491 1,927 1,936 832 835 849 1,100 1,099 Total commercial excl. PPP PPP loans Residential real estate Consumer home equity Other consumer Q1 2021 Q2 2021 Q3 2021 Q4 2021 Q1 2022 Historical composition $ in millions 1Reflects percentages of the Company's loan composition, calculated as the sum of loan balances expected to reprice or mature plus the sum of estimated prepayment and contractual amortization cash flows.
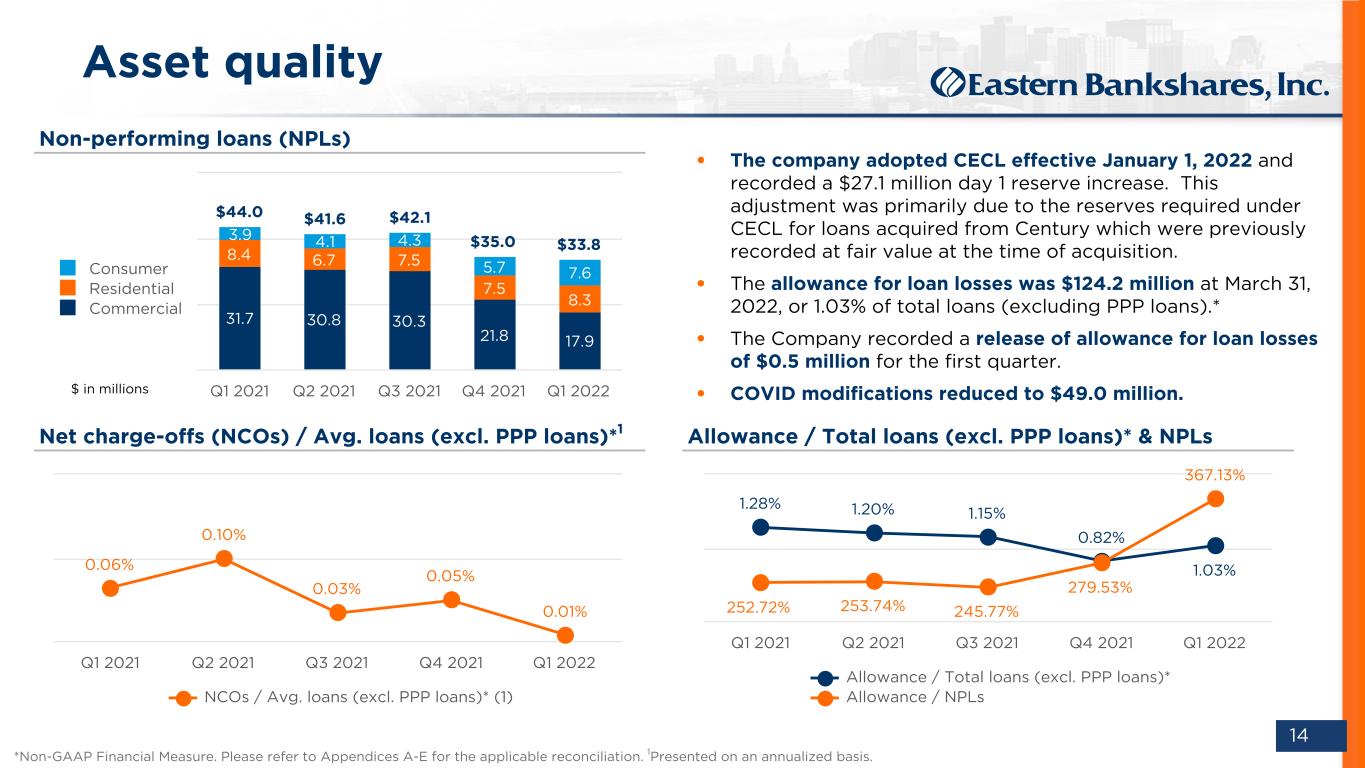
DO NOT REFRESH Color PaletteComplementary 000 / 000 / 051 Body text 074 / 075 / 076 030 / 152 / 213 185 / 197 / 212 023 / 061 / 110 119 / 139 / 154 255 / 107 / 000109 / 110 / 112 237 / 237 / 238 000 / 139 / 151 137 / 139 / 141 197 / 064 / 044 166 / 168 / 171 103 / 086 / 164 208 / 210 / 211 238 / 184 / 028 14 Net charge-offs (NCOs) / Avg. loans (excl. PPP loans)*1 Non-performing loans (NPLs) Allowance / Total loans (excl. PPP loans)* & NPLs 0.06% 0.10% 0.03% 0.05% 0.01% NCOs / Avg. loans (excl. PPP loans)* (1) Q1 2021 Q2 2021 Q3 2021 Q4 2021 Q1 2022 1.28% 1.20% 1.15% 0.82% 1.03% 252.72% 253.74% 245.77% 279.53% 367.13% Allowance / Total loans (excl. PPP loans)* Allowance / NPLs Q1 2021 Q2 2021 Q3 2021 Q4 2021 Q1 2022 $44.0 $41.6 $42.1 $35.0 $33.8 31.7 30.8 30.3 21.8 17.9 8.4 6.7 7.5 7.5 8.3 3.9 4.1 4.3 5.7 7.6Consumer Residential Commercial Q1 2021 Q2 2021 Q3 2021 Q4 2021 Q1 2022 • The company adopted CECL effective January 1, 2022 and recorded a $27.1 million day 1 reserve increase. This adjustment was primarily due to the reserves required under CECL for loans acquired from Century which were previously recorded at fair value at the time of acquisition. • The allowance for loan losses was $124.2 million at March 31, 2022, or 1.03% of total loans (excluding PPP loans).* • The Company recorded a release of allowance for loan losses of $0.5 million for the first quarter. • COVID modifications reduced to $49.0 million. Asset quality *Non-GAAP Financial Measure. Please refer to Appendices A-E for the applicable reconciliation. 1Presented on an annualized basis. $ in millions
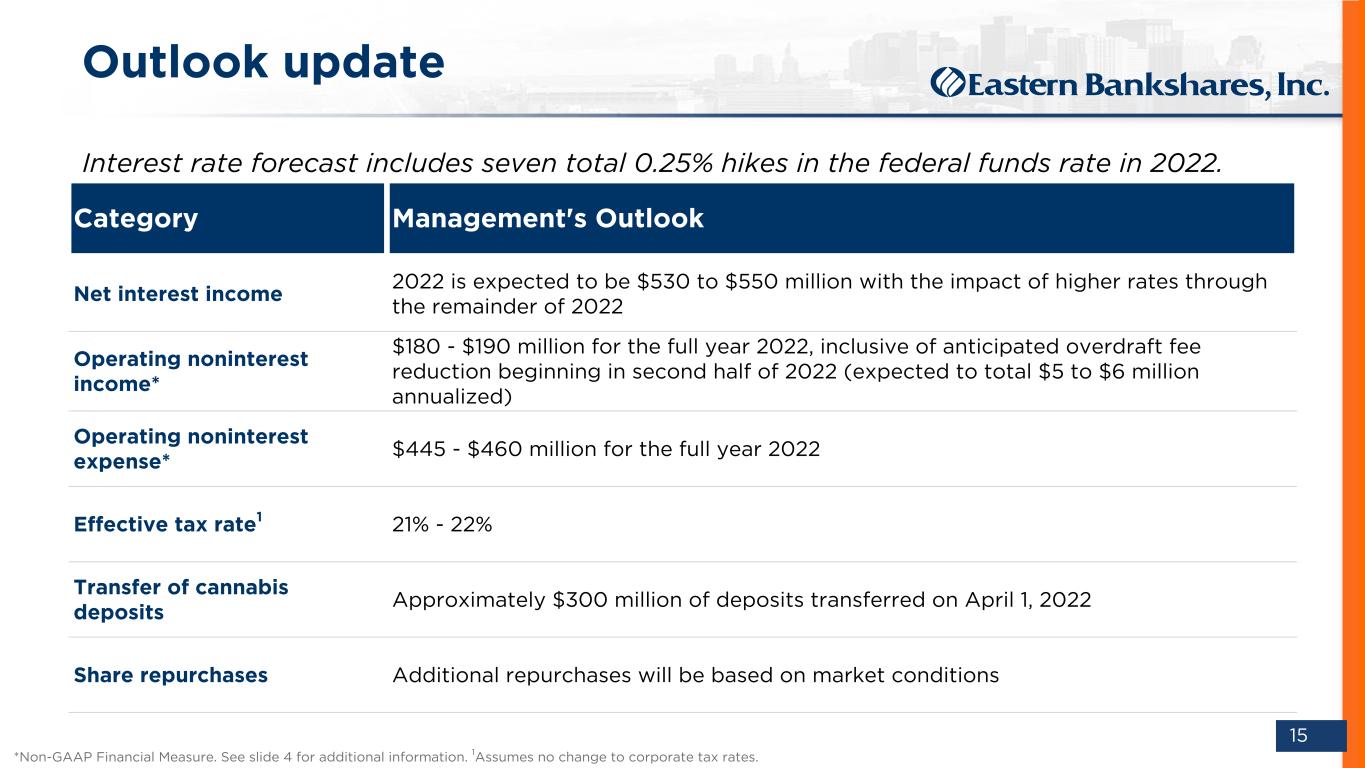
DO NOT REFRESH Color PaletteComplementary 000 / 000 / 051 Body text 074 / 075 / 076 030 / 152 / 213 185 / 197 / 212 023 / 061 / 110 119 / 139 / 154 255 / 107 / 000109 / 110 / 112 237 / 237 / 238 000 / 139 / 151 137 / 139 / 141 197 / 064 / 044 166 / 168 / 171 103 / 086 / 164 208 / 210 / 211 238 / 184 / 028 15 Outlook update Interest rate forecast includes seven total 0.25% hikes in the federal funds rate in 2022. *Non-GAAP Financial Measure. See slide 4 for additional information. 1Assumes no change to corporate tax rates. Category Management's Outlook Net interest income 2022 is expected to be $530 to $550 million with the impact of higher rates through the remainder of 2022 Operating noninterest income* $180 - $190 million for the full year 2022, inclusive of anticipated overdraft fee reduction beginning in second half of 2022 (expected to total $5 to $6 million annualized) Operating noninterest expense* $445 - $460 million for the full year 2022 Effective tax rate1 21% - 22% Transfer of cannabis deposits Approximately $300 million of deposits transferred on April 1, 2022 Share repurchases Additional repurchases will be based on market conditions

DO NOT REFRESH Color PaletteComplementary 000 / 000 / 051 Body text 074 / 075 / 076 030 / 152 / 213 185 / 197 / 212 023 / 061 / 110 119 / 139 / 154 255 / 107 / 000109 / 110 / 112 237 / 237 / 238 000 / 139 / 151 137 / 139 / 141 197 / 064 / 044 166 / 168 / 171 103 / 086 / 164 208 / 210 / 211 238 / 184 / 028 Appendix
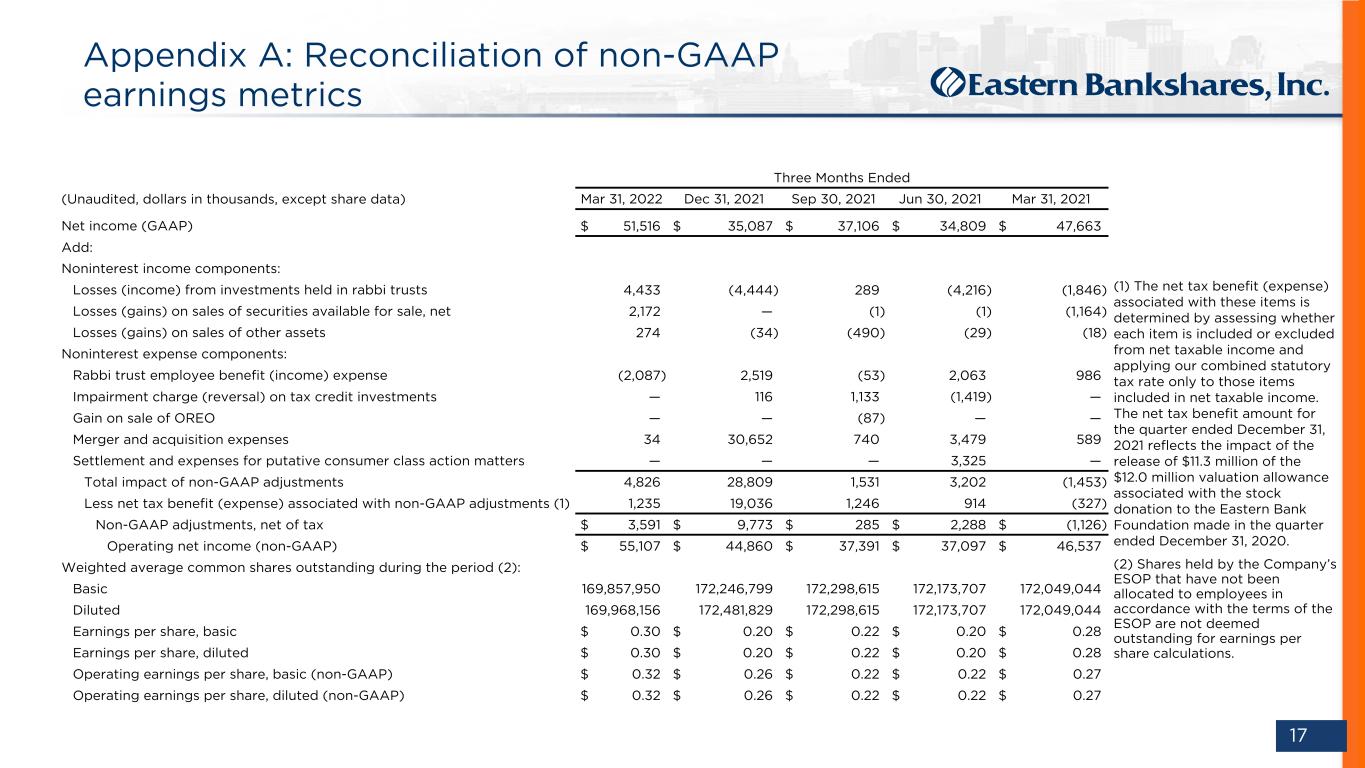
DO NOT REFRESH Color PaletteComplementary 000 / 000 / 051 Body text 074 / 075 / 076 030 / 152 / 213 185 / 197 / 212 023 / 061 / 110 119 / 139 / 154 255 / 107 / 000109 / 110 / 112 237 / 237 / 238 000 / 139 / 151 137 / 139 / 141 197 / 064 / 044 166 / 168 / 171 103 / 086 / 164 208 / 210 / 211 238 / 184 / 028 17 Appendix A: Reconciliation of non-GAAP earnings metrics (1) The net tax benefit (expense) associated with these items is determined by assessing whether each item is included or excluded from net taxable income and applying our combined statutory tax rate only to those items included in net taxable income. The net tax benefit amount for the quarter ended December 31, 2021 reflects the impact of the release of $11.3 million of the $12.0 million valuation allowance associated with the stock donation to the Eastern Bank Foundation made in the quarter ended December 31, 2020. (2) Shares held by the Company’s ESOP that have not been allocated to employees in accordance with the terms of the ESOP are not deemed outstanding for earnings per share calculations. Three Months Ended (Unaudited, dollars in thousands, except share data) Mar 31, 2022 Dec 31, 2021 Sep 30, 2021 Jun 30, 2021 Mar 31, 2021 Net income (GAAP) $ 51,516 $ 35,087 $ 37,106 $ 34,809 $ 47,663 Add: Noninterest income components: Losses (income) from investments held in rabbi trusts 4,433 (4,444) 289 (4,216) (1,846) Losses (gains) on sales of securities available for sale, net 2,172 — (1) (1) (1,164) Losses (gains) on sales of other assets 274 (34) (490) (29) (18) Noninterest expense components: Rabbi trust employee benefit (income) expense (2,087) 2,519 (53) 2,063 986 Impairment charge (reversal) on tax credit investments — 116 1,133 (1,419) — Gain on sale of OREO — — (87) — — Merger and acquisition expenses 34 30,652 740 3,479 589 Settlement and expenses for putative consumer class action matters — — — 3,325 — Total impact of non-GAAP adjustments 4,826 28,809 1,531 3,202 (1,453) Less net tax benefit (expense) associated with non-GAAP adjustments (1) 1,235 19,036 1,246 914 (327) Non-GAAP adjustments, net of tax $ 3,591 $ 9,773 $ 285 $ 2,288 $ (1,126) Operating net income (non-GAAP) $ 55,107 $ 44,860 $ 37,391 $ 37,097 $ 46,537 Weighted average common shares outstanding during the period (2): Basic 169,857,950 172,246,799 172,298,615 172,173,707 172,049,044 Diluted 169,968,156 172,481,829 172,298,615 172,173,707 172,049,044 Earnings per share, basic $ 0.30 $ 0.20 $ 0.22 $ 0.20 $ 0.28 Earnings per share, diluted $ 0.30 $ 0.20 $ 0.22 $ 0.20 $ 0.28 Operating earnings per share, basic (non-GAAP) $ 0.32 $ 0.26 $ 0.22 $ 0.22 $ 0.27 Operating earnings per share, diluted (non-GAAP) $ 0.32 $ 0.26 $ 0.22 $ 0.22 $ 0.27
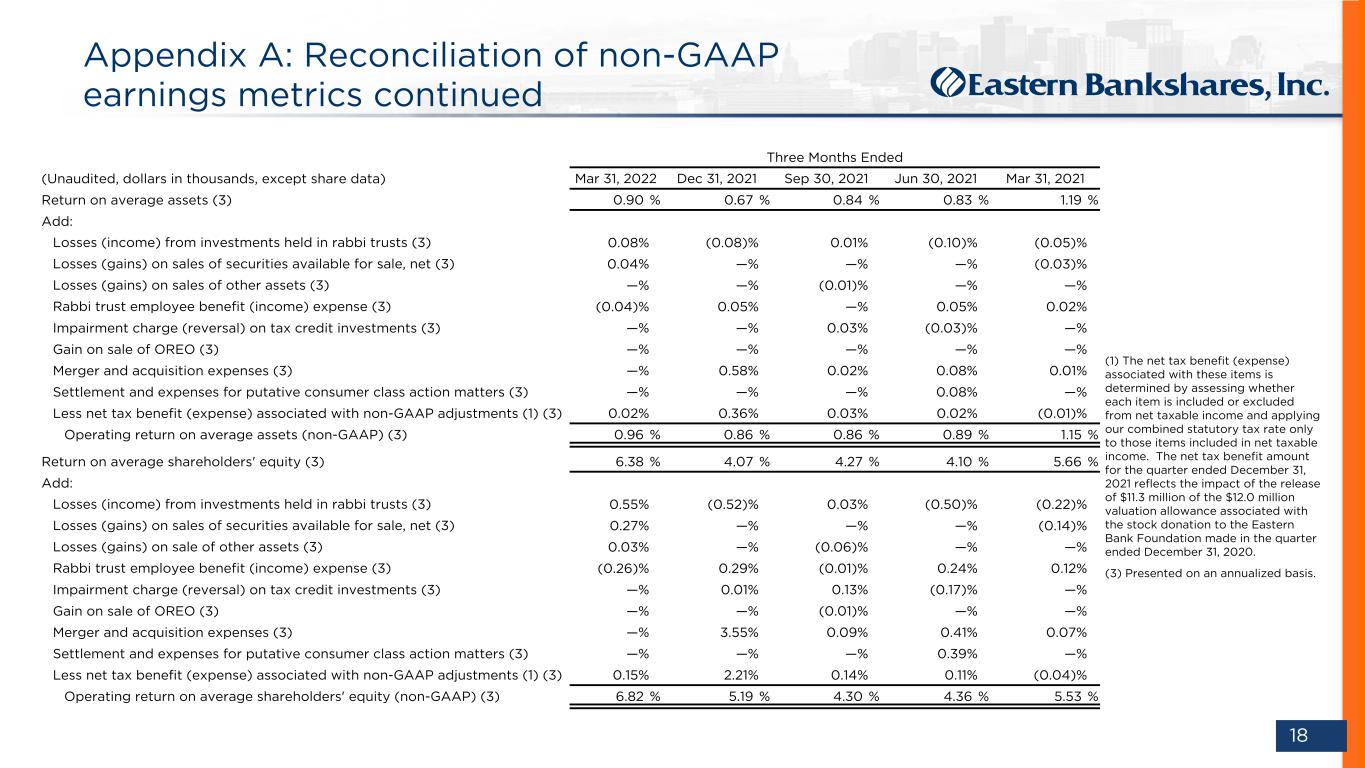
DO NOT REFRESH Color PaletteComplementary 000 / 000 / 051 Body text 074 / 075 / 076 030 / 152 / 213 185 / 197 / 212 023 / 061 / 110 119 / 139 / 154 255 / 107 / 000109 / 110 / 112 237 / 237 / 238 000 / 139 / 151 137 / 139 / 141 197 / 064 / 044 166 / 168 / 171 103 / 086 / 164 208 / 210 / 211 238 / 184 / 028 18 Appendix A: Reconciliation of non-GAAP earnings metrics continued Three Months Ended (Unaudited, dollars in thousands, except share data) Mar 31, 2022 Dec 31, 2021 Sep 30, 2021 Jun 30, 2021 Mar 31, 2021 Return on average assets (3) 0.90 % 0.67 % 0.84 % 0.83 % 1.19 % Add: Losses (income) from investments held in rabbi trusts (3) 0.08 % (0.08) % 0.01 % (0.10) % (0.05) % Losses (gains) on sales of securities available for sale, net (3) 0.04 % — % — % — % (0.03) % Losses (gains) on sales of other assets (3) — % — % (0.01) % — % — % Rabbi trust employee benefit (income) expense (3) (0.04) % 0.05 % — % 0.05 % 0.02 % Impairment charge (reversal) on tax credit investments (3) — % — % 0.03 % (0.03) % — % Gain on sale of OREO (3) — % — % — % — % — % Merger and acquisition expenses (3) — % 0.58 % 0.02 % 0.08 % 0.01 % Settlement and expenses for putative consumer class action matters (3) — % — % — % 0.08 % — % Less net tax benefit (expense) associated with non-GAAP adjustments (1) (3) 0.02 % 0.36 % 0.03 % 0.02 % (0.01) % Operating return on average assets (non-GAAP) (3) 0.96 % 0.86 % 0.86 % 0.89 % 1.15 % Return on average shareholders' equity (3) 6.38 % 4.07 % 4.27 % 4.10 % 5.66 % Add: Losses (income) from investments held in rabbi trusts (3) 0.55 % (0.52) % 0.03 % (0.50) % (0.22) % Losses (gains) on sales of securities available for sale, net (3) 0.27 % — % — % — % (0.14) % Losses (gains) on sale of other assets (3) 0.03 % — % (0.06) % — % — % Rabbi trust employee benefit (income) expense (3) (0.26) % 0.29 % (0.01) % 0.24 % 0.12 % Impairment charge (reversal) on tax credit investments (3) — % 0.01 % 0.13 % (0.17) % — % Gain on sale of OREO (3) — % — % (0.01) % — % — % Merger and acquisition expenses (3) — % 3.55 % 0.09 % 0.41 % 0.07 % Settlement and expenses for putative consumer class action matters (3) — % — % — % 0.39 % — % Less net tax benefit (expense) associated with non-GAAP adjustments (1) (3) 0.15 % 2.21 % 0.14 % 0.11 % (0.04) % Operating return on average shareholders' equity (non-GAAP) (3) 6.82 % 5.19 % 4.30 % 4.36 % 5.53 % (1) The net tax benefit (expense) associated with these items is determined by assessing whether each item is included or excluded from net taxable income and applying our combined statutory tax rate only to those items included in net taxable income. The net tax benefit amount for the quarter ended December 31, 2021 reflects the impact of the release of $11.3 million of the $12.0 million valuation allowance associated with the stock donation to the Eastern Bank Foundation made in the quarter ended December 31, 2020. (3) Presented on an annualized basis.
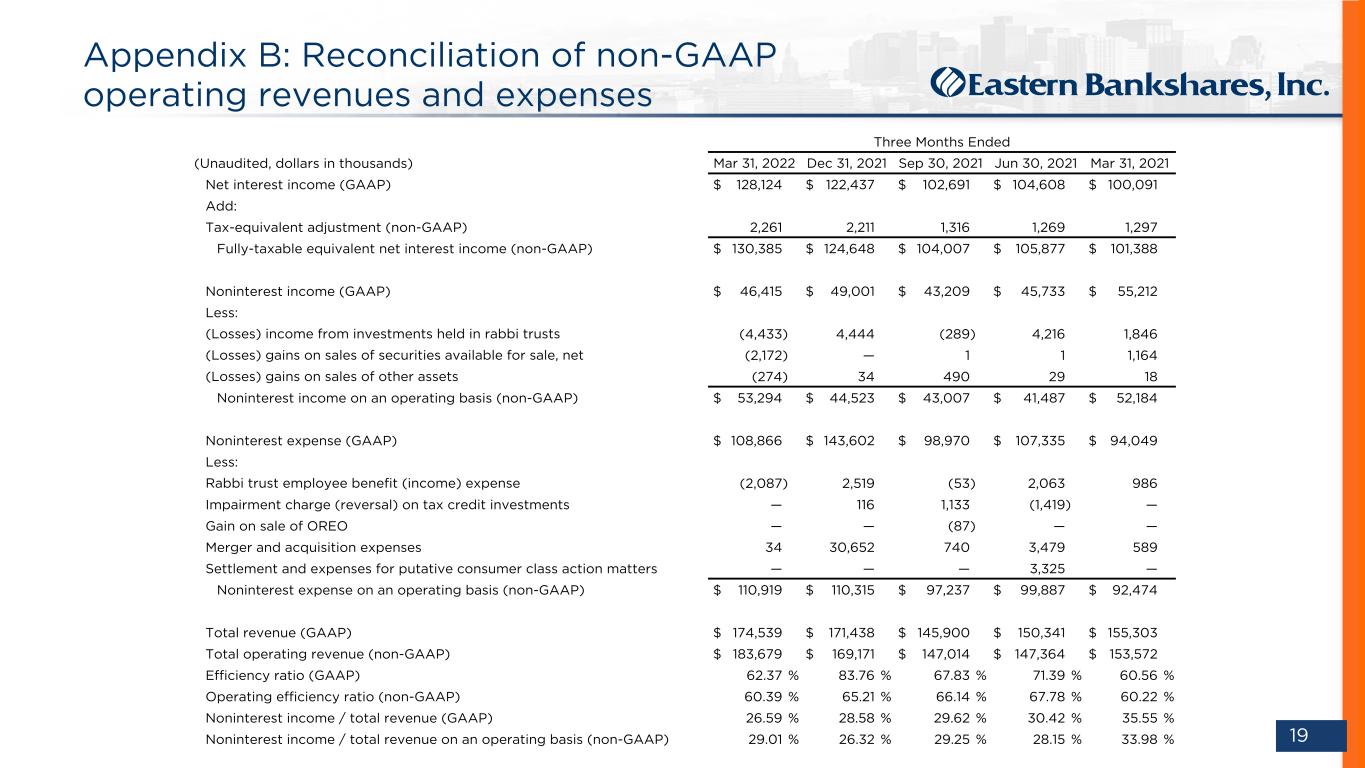
DO NOT REFRESH Color PaletteComplementary 000 / 000 / 051 Body text 074 / 075 / 076 030 / 152 / 213 185 / 197 / 212 023 / 061 / 110 119 / 139 / 154 255 / 107 / 000109 / 110 / 112 237 / 237 / 238 000 / 139 / 151 137 / 139 / 141 197 / 064 / 044 166 / 168 / 171 103 / 086 / 164 208 / 210 / 211 238 / 184 / 028 19 Appendix B: Reconciliation of non-GAAP operating revenues and expenses Three Months Ended (Unaudited, dollars in thousands) Mar 31, 2022 Dec 31, 2021 Sep 30, 2021 Jun 30, 2021 Mar 31, 2021 Net interest income (GAAP) $ 128,124 $ 122,437 $ 102,691 $ 104,608 $ 100,091 Add: Tax-equivalent adjustment (non-GAAP) 2,261 2,211 1,316 1,269 1,297 Fully-taxable equivalent net interest income (non-GAAP) $ 130,385 $ 124,648 $ 104,007 $ 105,877 $ 101,388 Noninterest income (GAAP) $ 46,415 $ 49,001 $ 43,209 $ 45,733 $ 55,212 Less: (Losses) income from investments held in rabbi trusts (4,433) 4,444 (289) 4,216 1,846 (Losses) gains on sales of securities available for sale, net (2,172) — 1 1 1,164 (Losses) gains on sales of other assets (274) 34 490 29 18 Noninterest income on an operating basis (non-GAAP) $ 53,294 $ 44,523 $ 43,007 $ 41,487 $ 52,184 Noninterest expense (GAAP) $ 108,866 $ 143,602 $ 98,970 $ 107,335 $ 94,049 Less: Rabbi trust employee benefit (income) expense (2,087) 2,519 (53) 2,063 986 Impairment charge (reversal) on tax credit investments — 116 1,133 (1,419) — Gain on sale of OREO — — (87) — — Merger and acquisition expenses 34 30,652 740 3,479 589 Settlement and expenses for putative consumer class action matters — — — 3,325 — Noninterest expense on an operating basis (non-GAAP) $ 110,919 $ 110,315 $ 97,237 $ 99,887 $ 92,474 Total revenue (GAAP) $ 174,539 $ 171,438 $ 145,900 $ 150,341 $ 155,303 Total operating revenue (non-GAAP) $ 183,679 $ 169,171 $ 147,014 $ 147,364 $ 153,572 Efficiency ratio (GAAP) 62.37 % 83.76 % 67.83 % 71.39 % 60.56 % Operating efficiency ratio (non-GAAP) 60.39 % 65.21 % 66.14 % 67.78 % 60.22 % Noninterest income / total revenue (GAAP) 26.59 % 28.58 % 29.62 % 30.42 % 35.55 % Noninterest income / total revenue on an operating basis (non-GAAP) 29.01 % 26.32 % 29.25 % 28.15 % 33.98 %
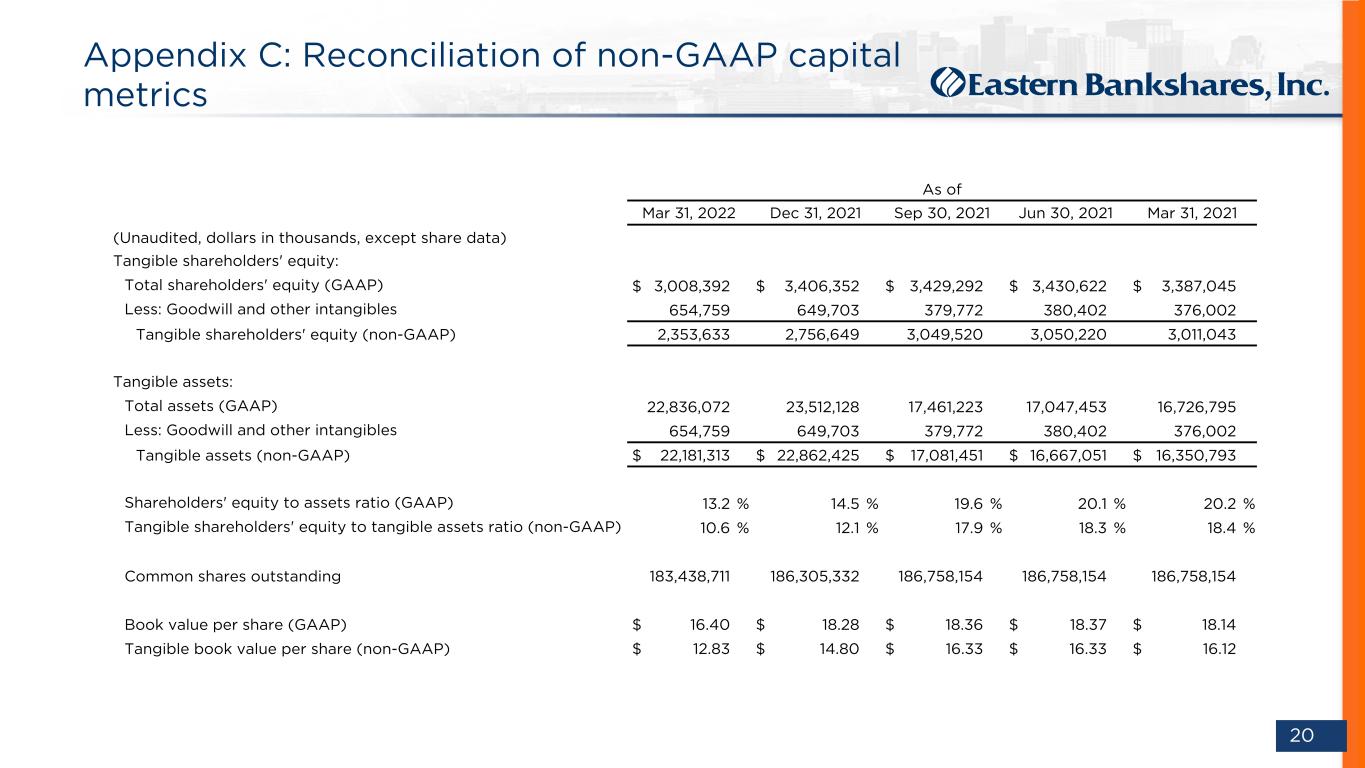
DO NOT REFRESH Color PaletteComplementary 000 / 000 / 051 Body text 074 / 075 / 076 030 / 152 / 213 185 / 197 / 212 023 / 061 / 110 119 / 139 / 154 255 / 107 / 000109 / 110 / 112 237 / 237 / 238 000 / 139 / 151 137 / 139 / 141 197 / 064 / 044 166 / 168 / 171 103 / 086 / 164 208 / 210 / 211 238 / 184 / 028 20 Appendix C: Reconciliation of non-GAAP capital metrics As of Mar 31, 2022 Dec 31, 2021 Sep 30, 2021 Jun 30, 2021 Mar 31, 2021 (Unaudited, dollars in thousands, except share data) Tangible shareholders' equity: Total shareholders' equity (GAAP) $ 3,008,392 $ 3,406,352 $ 3,429,292 $ 3,430,622 $ 3,387,045 Less: Goodwill and other intangibles 654,759 649,703 379,772 380,402 376,002 Tangible shareholders' equity (non-GAAP) 2,353,633 2,756,649 3,049,520 3,050,220 3,011,043 Tangible assets: Total assets (GAAP) 22,836,072 23,512,128 17,461,223 17,047,453 16,726,795 Less: Goodwill and other intangibles 654,759 649,703 379,772 380,402 376,002 Tangible assets (non-GAAP) $ 22,181,313 $ 22,862,425 $ 17,081,451 $ 16,667,051 $ 16,350,793 Shareholders' equity to assets ratio (GAAP) 13.2 % 14.5 % 19.6 % 20.1 % 20.2 % Tangible shareholders' equity to tangible assets ratio (non-GAAP) 10.6 % 12.1 % 17.9 % 18.3 % 18.4 % Common shares outstanding 183,438,711 186,305,332 186,758,154 186,758,154 186,758,154 Book value per share (GAAP) $ 16.40 $ 18.28 $ 18.36 $ 18.37 $ 18.14 Tangible book value per share (non-GAAP) $ 12.83 $ 14.80 $ 16.33 $ 16.33 $ 16.12
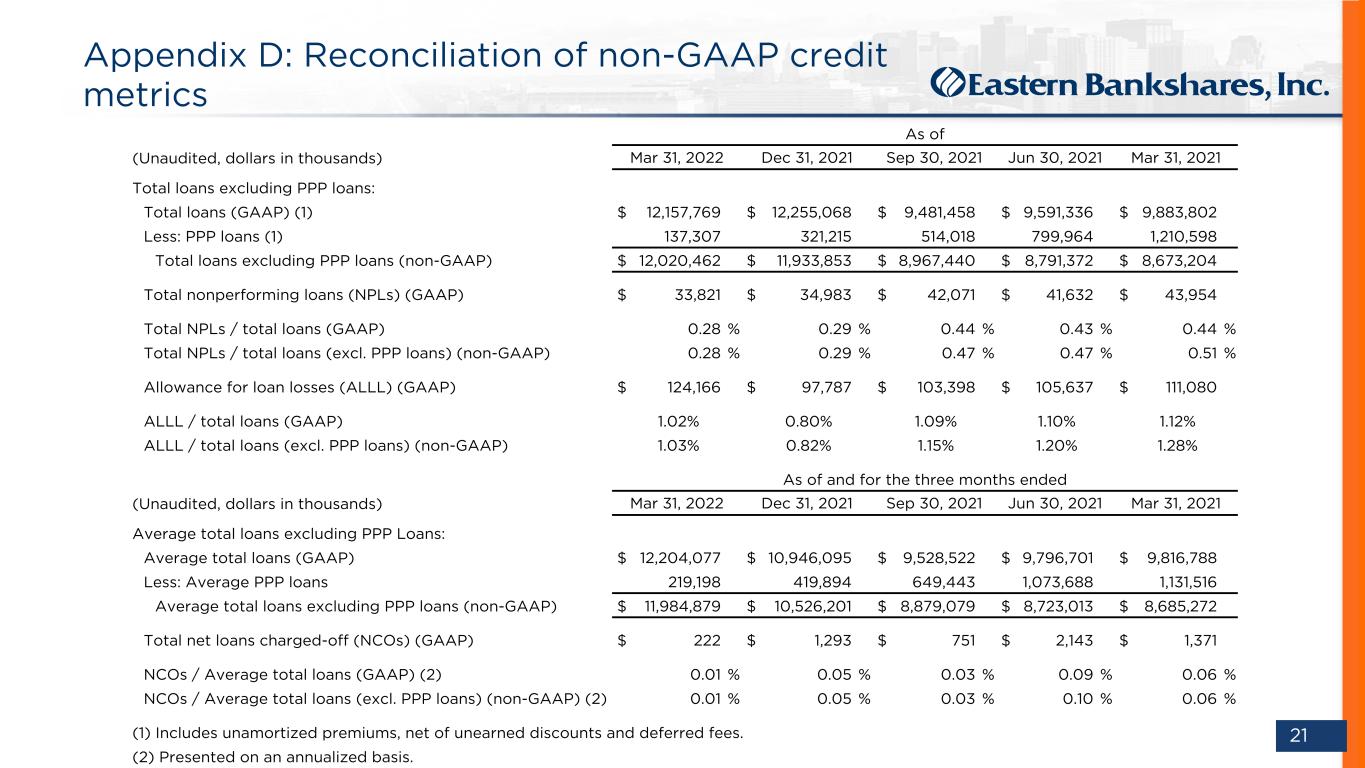
DO NOT REFRESH Color PaletteComplementary 000 / 000 / 051 Body text 074 / 075 / 076 030 / 152 / 213 185 / 197 / 212 023 / 061 / 110 119 / 139 / 154 255 / 107 / 000109 / 110 / 112 237 / 237 / 238 000 / 139 / 151 137 / 139 / 141 197 / 064 / 044 166 / 168 / 171 103 / 086 / 164 208 / 210 / 211 238 / 184 / 028 21 Appendix D: Reconciliation of non-GAAP credit metrics As of (Unaudited, dollars in thousands) Mar 31, 2022 Dec 31, 2021 Sep 30, 2021 Jun 30, 2021 Mar 31, 2021 Total loans excluding PPP loans: Total loans (GAAP) (1) $ 12,157,769 $ 12,255,068 $ 9,481,458 $ 9,591,336 $ 9,883,802 Less: PPP loans (1) 137,307 321,215 514,018 799,964 1,210,598 Total loans excluding PPP loans (non-GAAP) $ 12,020,462 $ 11,933,853 $ 8,967,440 $ 8,791,372 $ 8,673,204 Total nonperforming loans (NPLs) (GAAP) $ 33,821 $ 34,983 $ 42,071 $ 41,632 $ 43,954 Total NPLs / total loans (GAAP) 0.28 % 0.29 % 0.44 % 0.43 % 0.44 % Total NPLs / total loans (excl. PPP loans) (non-GAAP) 0.28 % 0.29 % 0.47 % 0.47 % 0.51 % Allowance for loan losses (ALLL) (GAAP) $ 124,166 $ 97,787 $ 103,398 $ 105,637 $ 111,080 ALLL / total loans (GAAP) 1.02% 0.80% 1.09% 1.10% 1.12% ALLL / total loans (excl. PPP loans) (non-GAAP) 1.03% 0.82% 1.15% 1.20% 1.28% As of and for the three months ended (Unaudited, dollars in thousands) Mar 31, 2022 Dec 31, 2021 Sep 30, 2021 Jun 30, 2021 Mar 31, 2021 Average total loans excluding PPP Loans: Average total loans (GAAP) $ 12,204,077 $ 10,946,095 $ 9,528,522 $ 9,796,701 $ 9,816,788 Less: Average PPP loans 219,198 419,894 649,443 1,073,688 1,131,516 Average total loans excluding PPP loans (non-GAAP) $ 11,984,879 $ 10,526,201 $ 8,879,079 $ 8,723,013 $ 8,685,272 Total net loans charged-off (NCOs) (GAAP) $ 222 $ 1,293 $ 751 $ 2,143 $ 1,371 NCOs / Average total loans (GAAP) (2) 0.01 % 0.05 % 0.03 % 0.09 % 0.06 % NCOs / Average total loans (excl. PPP loans) (non-GAAP) (2) 0.01 % 0.05 % 0.03 % 0.10 % 0.06 % (1) Includes unamortized premiums, net of unearned discounts and deferred fees. (2) Presented on an annualized basis.
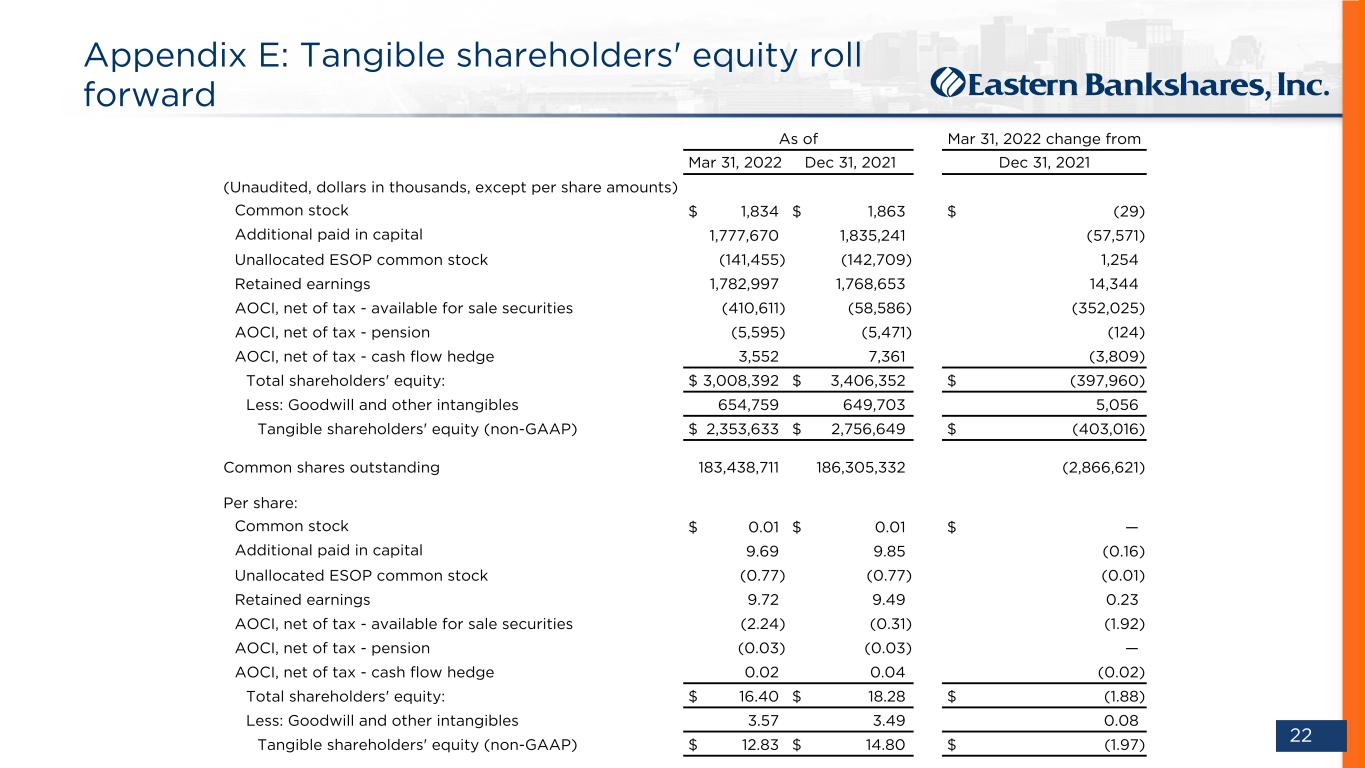
DO NOT REFRESH Color PaletteComplementary 000 / 000 / 051 Body text 074 / 075 / 076 030 / 152 / 213 185 / 197 / 212 023 / 061 / 110 119 / 139 / 154 255 / 107 / 000109 / 110 / 112 237 / 237 / 238 000 / 139 / 151 137 / 139 / 141 197 / 064 / 044 166 / 168 / 171 103 / 086 / 164 208 / 210 / 211 238 / 184 / 028 22 Appendix E: Tangible shareholders' equity roll forward As of Mar 31, 2022 change from Mar 31, 2022 Dec 31, 2021 Dec 31, 2021 (Unaudited, dollars in thousands, except per share amounts) Common stock $ 1,834 $ 1,863 $ (29) Additional paid in capital 1,777,670 1,835,241 (57,571) Unallocated ESOP common stock (141,455) (142,709) 1,254 Retained earnings 1,782,997 1,768,653 14,344 AOCI, net of tax - available for sale securities (410,611) (58,586) (352,025) AOCI, net of tax - pension (5,595) (5,471) (124) AOCI, net of tax - cash flow hedge 3,552 7,361 (3,809) Total shareholders' equity: $ 3,008,392 $ 3,406,352 $ (397,960) Less: Goodwill and other intangibles 654,759 649,703 5,056 Tangible shareholders' equity (non-GAAP) $ 2,353,633 $ 2,756,649 $ (403,016) Common shares outstanding 183,438,711 186,305,332 (2,866,621) Per share: Common stock $ 0.01 $ 0.01 $ — Additional paid in capital 9.69 9.85 (0.16) Unallocated ESOP common stock (0.77) (0.77) (0.01) Retained earnings 9.72 9.49 0.23 AOCI, net of tax - available for sale securities (2.24) (0.31) (1.92) AOCI, net of tax - pension (0.03) (0.03) — AOCI, net of tax - cash flow hedge 0.02 0.04 (0.02) Total shareholders' equity: $ 16.40 $ 18.28 $ (1.88) Less: Goodwill and other intangibles 3.57 3.49 0.08 Tangible shareholders' equity (non-GAAP) $ 12.83 $ 14.80 $ (1.97)