
EONR 8-K
EON Resources Inc. (EONR)
UNITED STATES
SECURITIES AND EXCHANGE COMMISSION
Washington, D.C. 20549
FORM
CURRENT REPORT
Pursuant to Section 13 or 15(d) of
The Securities Exchange Act of 1934
Date
of Report (Date of earliest event reported):
(Exact name of registrant as specified in its charter)
| (State or other jurisdiction of incorporation) |
(Commission File Number) | (IRS Employer Identification No.) |
(Address of principal executive offices, including zip code)
(
(Registrant’s telephone number, including area code)
N/A
(Former name or former address, if changed since last report.)
Check the appropriate box below if the Form 8-K filing is intended to simultaneously satisfy the filing obligation of the registrant under any of the following provisions:
| Written communications pursuant to Rule 425 under the Securities Act (17 CFR 230.425) |
| Soliciting material pursuant to Rule 14a-12 under the Exchange Act (17 CFR 240.14a-12) |
| Pre-commencement communications pursuant to Rule 14d-2(b) under the Exchange Act (17 CFR 240.14d-2(b)) |
| Pre-commencement communications pursuant to Rule 13e-4(c) under the Exchange Act (17 CFR 240.13e-4(c)) |
Securities registered pursuant to Section 12(b) of the Act:
| Title of each class: | Trading symbol | Name of each exchange on which registered | ||
Indicate by check mark whether the registrant is an emerging growth company as defined in Rule 405 of the Securities Act of 1933 (17 CFR§230.405) or Rule 12b-2 of the Securities Exchange Act of 1934 (17 CFR §240.12b-2).
Emerging
growth company
If
an emerging growth company, indicate by check mark if the registrant has elected not to use the extended transition period for complying
with any new or revised financial accounting standards provided pursuant to Section 13(a) of the Exchange Act.
Item 2.02 Results of Operations and Financial Conditions.
On May 19, 2025, EON Resources Inc. (the “Company”) issued a press release in which the Company provided certain first quarter 2025 financial results. A copy of this press release is included as Exhibit 99.1 to this Current Report on Form 8-K.
On May 21, 2025, the Company issued a press release and uploaded a presentation to its website related to certain first quarter 2025 financial results. A copy of this press release is included as Exhibit 99.2 to this Current Report on Form 8-K and a copy of the presentation is included as Exhibit 99.3 to this Current Report on Form 8-K.
Item 7.01 Regulation FD Disclosure.
The Company will host a conference call on Thursday, May 22, 2025, at 2:00 p.m. Eastern Time to review its first quarter 2025 financial results. To access the conference call, go to https://www.webcaster4.com/Webcast/Page/2999/52512. An audio webcast of the conference call will be available within two hours of the call on the EONR website.
In addition, attached as Exhibit 99.4 is an updated investor presentation for use by the Company in meetings with certain of its stockholders, investors, and other persons, following release of the Company’s first quarter 2025 financial results.
The information in Item 2.01 and this Item 7.01 and in Exhibits 99.1, 99.2, 99.3, and 99.4 attached hereto is being furnished and shall not be deemed “filed” for purposes of Section 18 of the Securities Exchange Act of 1934, as amended (the “Exchange Act”), or otherwise subject to the liabilities of that section, nor shall it be deemed incorporated by reference in any filing under the Securities Act of 1933, as amended, or the Exchange Act, except as expressly set forth by specific reference in such filing.
Item 9.01. Financial Statements and Exhibits.
(d) Exhibits
The following exhibits are being filed herewith:
| Exhibit Number |
Description | |
| 99.1 | Press Release of EON Resources, Inc. issued on May 19, 2025. | |
| 99.2 | Press Release of EON Resources, Inc. issued on May 21, 2025. | |
| 99.3 | Earnings Release Presentation dated May 2025. | |
| 99.4 | Investor Presentation updated as of May 2025. | |
| 104 | Cover Page Interactive Data File (embedded within the Inline XBRL document) |
1
SIGNATURE
Pursuant to the requirements of the Securities Exchange Act of 1934, the registrant has duly caused this report to be signed on its behalf by the undersigned hereunto duly authorized.
| May 21, 2025 | EON Resources Inc. | |
| By: | /s/ Mitchell B. Trotter | |
| Name: | Mitchell B. Trotter | |
| Title: | Chief Financial Officer | |
2
Exhibit 99.1
EON Resources Inc. Announces
Results for the First Quarter of 2025
Cost Reductions and Balance Sheet Improvements
Result in Improved Bottom Line and Income from Operations
HOUSTON, TX / May 19, 2025 / EON Resources Inc. (NYSE American: EONR) (“EON” or the “Company”) is an independent upstream energy company with oil and gas properties in the Permian Basin. Today, the Company reports revenue and earnings for the first quarter of 2025.
The management and field teams have made huge strides to upgrade the operational condition of the field; stabilize production rates which had declined by the time the Company closed on the acquisition of LH Operating, LLC (the “Acquisition”); and resolve Acquisition related issues. The Company believes it is now in a position for growth with a bright future ahead.
Key actions since the Acquisition that position the Company for a profitable future:
| ● | The Company entered into an agreement (the “Seller Agreement”) with Pogo Royalty, LLC (“Seller”) that when closed will result in the (i) restructure of the Company’s balance sheet eliminating approximately $40 million in debt and obligations, and (ii) the purchase of a 10% Overriding Royalty Interest in all of the Company’s oil and gas properties. The closing with the Seller is expected to occur in June 2025. Consideration to Seller is agreed to be $22 million in cash and the issuance of 3 million shares of the Company’s Class A common stock. The summary of the Agreement with Seller can be found in the Seller Agreement Press Release published on the Company’s website. |
| ● | EON signed an expanded non-binding Letter of Intent (“LOI”) with Enstream Capital Management, LLC (“Enstream”) concerning a volumetric funding arrangement (“VMA”) and revenue sharing for $52.8 million. The funds will be used for the consideration to Seller under the Seller Agreement, field development, and retirement of senior debt. A summary of the Enstream LOI Press Release appears on the Company’s website. We expect to close on this transaction in June 2025. |
| ● | As announced in its Horizontal Drilling Program Press Release, the Company conducted a study for horizontal drilling in the lower intervals of the San Andres formation on the Company’s oil and gas properties which could potentially yield up to 20 million untapped barrels of oil. The study has identified 50 well locations to be drilled over several years commencing in Q1 of 2026. Each well will cost approximately $3.7 million to drill and is expected to produce 300 to 400 barrels of oil per day (“BOPD”). The Company is actively in discussions with potential drilling partners to share in the working interest ownership, costs and the related revenues. |
| ● | The focus on the field over the past year has resulted in infrastructure enhancements nearing completion and stabilizing production. The Company’s engineers have been using technology and science to analyze well logs and prior results in efforts at increasing production and identification of the best pay in the Seven Rivers formation. The Company’s team has also rolled out the use of an AI application for our well pumpers to improve efficiencies and increase production as described in the AI Implementation Press Release located on the Company’s website. |
| ● | The Company continues to make improvements to its balance sheet. In addition to the Seller Agreement, the efforts have included (i) reduction of the senior debt from an original $28 million to approximately $22 million in the principal balance with an escrow reserve of $2.6 million; (ii) termination of a Forward Purchase Agreement (“FPA”) in Q4 of 2024 and removal of related obligations from the balance sheet as of the end of 2024; and (iii) conversion of short-term private loans and warrant liabilities to long-term Convertible Notes (into Class A Common Stock of the Company). |
Financial highlights for the quarter ended March 31, 2025:
| ● | Revenues: |
| ○ | Total revenues for the quarter were $4.6 million. Up $850K from Q4 of 2024 comprised of: $225K due to higher oil prices in Q1; lower negative non-cash hedging impact in Q1 versus Q4 of $575K; and $50K increase in generated gas revenues. |
| ○ | Our current oil production is 70% hedged at a price of $70.00 per barrel or greater through the end of CY 2025. |
| ○ | The gas revenues increase was due to the higher market price for gas in Q1 than Q4. |
| ● | Field results: |
| ○ | The Company had income from operations of $1.8 million for the first quarter. |
| ○ | The lease operating expenses (“LOE”) dropped to $683K per month for the first quarter from the $700K per month runrate for most of 2024. |
| ○ | The capital expenditures for the first quarter were $600K. |
| ● | General and administrative (“G&A”) costs: |
| ○ | Salaries and fees decreased in Q1 by $225K, and should remain lower for 2025. |
| ○ | While lower than Q4 and Q3 of 2024, the Q1 professional fees for legal, audit and consulting services primarily reflect year end reporting and closing efforts, and certain costs stemming from various trailing legal matters. |
| ○ | Insurance costs are down $75K in Q1 due to lower renewal rates for 2025. |
| ● | Other income and expense: |
| ○ | Interest expense of $1.7 million in Q1 of 2025 is $165K lower than Q4 of 2024 due to note conversions in our efforts to clean-up the balance sheet, and the reduction of the principal balance of the Company’s senior reserve-based loan. |
| ○ | The net $500K of non-cash impacts primarily include $300K for the amortization of financing costs, and non-cash impacts on certain liabilities driven by stock prices. |
“EON is continuing to take action to reduce costs amid a challenging operating environment. EON’s actions to improve its operating costs structure through transformation producing oil plans are expected to aid our reaching profitability in 2025,” said Dante Caravaggio, President and CEO. “The team has made tremendous progress in upgrading our infrastructure and modernizing the field that has been restricting production. We continue to see the potential of the Seven Rivers waterflood as the field team has commenced the fracing of several wells with good results, and we have re-started acid treatments with an improved formula, which shows promising results. We see as much, or more, potential from horizontal drilling in the San Andres, which we expect to commence in Q1 of 2026. The permitting of such wells and sourcing of a horizontal drilling partner for the San Andres development is underway now.”
“Behind the scenes, we had a team using technology and science to analyze well logs and prior results to assist in increasing production and identifying the best pay in the Seven Rivers. This team also produced a study for a horizontal drilling program in the San Andres interval, which has significant potential for 2026 and beyond,” said Jesse Allen, Vice President of Operations. “Our infrastructure improvements to date are resulting in lower LOE costs in the first quarter, and our analytical work is expected to lower the cost of workovers.”
“As we announced in our press releases dated February 11, 2025, and March 25, 2025, we are renegotiating our debt structure to reduce interest expense and streamline our corporate cost structure which will have a positive impact on profitability in 2025 and beyond,” said Mitchell B. Trotter, CFO. “The management team has made good progress and continues to focus on actions to improve and make the balance sheet stronger.”
2
About the Oil Field Property
In November 2023, the Company acquired LH Operating, LLC (“LHO”) including its holdings in New Mexico of oil and gas waterflood production comprising 13,700 contiguous leasehold acres, 342 producing wells and 207 injection wells situated on 20 federal and 3 state leases in the Grayburg-Jackson Oil Field. The Grayburg-Jackson Oil Field is located on the Northwest Shelf of the prolific Permian Basin in Eddy County, New Mexico.
Leasehold rights of LHO, now a wholly owned subsidiary of the Company, include the Seven Rivers, Queen, Grayburg and San Andres intervals that range from as shallow as 1,500 feet to 4,000 feet in depth. The December 2023 reserve report from our third-party engineer, William H. Cobb and Associates, Inc. (“Cobb”), reflects LHO to have proven reserves of approximately 15.4 million barrels of oil and 3.5 billion cubic feet of natural gas. The mapped original-oil-in-place (“OOIP”) in the LHO leasehold is approximately 876 million barrels of oil in the Grayburg and San Andres intervals and 80 million barrels in the Seven Rivers interval for a total OOIP of approximately 956,000,000 barrels of oil.
Our primary production is currently from the Seven Rivers zone. In addition to proven reserves, the Company believes it may access an additional 34 million barrels of oil by adding perforations in the Grayburg and San Andres formations. With proven oil reserves of over 15 million barrels, combined with the potential 34 million additional barrels from the Grayburg and San Andres zones, LHO should produce oil and a revenue stream for more than two decades with a low decline rate.
About EON Resources Inc.
EON is an independent upstream energy company focused on maximizing total returns to its shareholders through the development of onshore oil and natural gas properties in the United States. EON’s long-term goal is to maximize total shareholder value from a diversified portfolio of long-life oil and natural gas properties built through acquisition and through selective development, production enhancement, and other exploitation efforts on its oil and natural gas properties.
EON’s Class A Common Stock trades on the NYSE American Stock Exchange (NYSE American: EONR) and the Company’s public warrants trade on the NYSE American Stock Exchange (NYSE American: EONR WS). For more information on EON, please visit the Company’s website: https://eon-r.com/
Forward-Looking Statements
This press release includes “forward-looking statements” within the meaning of the Private Securities Litigation Reform Act of 1995 that involve risks and uncertainties that could cause actual results to differ materially from what is expected. Words such as “expects,” “believes,” “anticipates,” “intends,” “estimates,” “seeks,” “may,” “might,” “plan,” “possible,” “should” and variations and similar words and expressions are intended to identify such forward-looking statements, but the absence of these words does not mean that a statement is not forward-looking. Such forward-looking statements relate to future events or future results, based on currently available information and reflect the Company’s management’s current beliefs. A number of factors could cause actual events or results to differ materially from the events and results discussed in the forward-looking statements. Important factors - including the availability of funds, the results of financing efforts and the risks relating to our business - that could cause actual results to differ materially from the Company’s expectations are disclosed in the Company’s documents filed from time to time on EDGAR (see www.edgar-online.com) and with the Securities and Exchange Commission (see www.sec.gov). Readers are cautioned not to place undue reliance on these forward-looking statements, which speak only as of the date of this press release. Except as expressly required by applicable securities law, the Company disclaims any intention or obligation to update or revise any forward-looking statements whether as a result of new information, future events or otherwise.
Investor Relations
Michael J. Porter, President
PORTER, LEVAY & ROSE, INC.
3
Exhibit 99.2
EON Resources Inc. Posts
Updated Investor Deck and Q1 2025 Earnings Call Deck to the Company Website
HOUSTON, TX / May 21, 2025 / EON Resources Inc. (NYSE American: EONR) (“EON” or the “Company”) is an independent upstream energy company with oil and gas properties in the Permian Basin. Today, the Company posted an updated investor deck and the first quarter of 2025 earnings call deck to the Company’s website: https://www.eon-r.com/presentations
About the Oil Field Property
In November 2023, the Company acquired LH Operating, LLC (“LHO”) including its holdings in New Mexico of oil and gas waterflood production comprising 13,700 contiguous leasehold acres, 342 producing wells and 207 injection wells situated on 20 federal and 3 state leases in the Grayburg-Jackson Oil Field. The Grayburg-Jackson Oil Field is located on the Northwest Shelf of the prolific Permian Basin in Eddy County, New Mexico.
Leasehold rights of LHO, now a wholly owned subsidiary of the Company, include the Seven Rivers, Queen, Grayburg and San Andres intervals that range from as shallow as 1,500 feet to 4,000 feet in depth. The December 2023 reserve report from our third-party engineer, William H. Cobb and Associates, Inc. (“Cobb”), reflects LHO to have proven reserves of approximately 15.4 million barrels of oil and 3.5 billion cubic feet of natural gas. The mapped original-oil-in-place (“OOIP”) in the LHO leasehold is approximately 876 million barrels of oil in the Grayburg and San Andres intervals and 80 million barrels in the Seven Rivers interval for a total OOIP of approximately 956,000,000 barrels of oil.
Our primary production is currently from the Seven Rivers zone. In addition to proven reserves, the Company believes it may access an additional 34 million barrels of oil by adding perforations in the Grayburg and San Andres formations. With proven oil reserves of over 15 million barrels, combined with the potential 34 million additional barrels from the Grayburg and San Andres zones, LHO should produce oil and a revenue stream for more than two decades with a low decline rate.
About EON Resources Inc.
EON is an independent upstream energy company focused on maximizing total returns to its shareholders through the development of onshore oil and natural gas properties in the United States. EON’s long-term goal is to maximize total shareholder value from a diversified portfolio of long-life oil and natural gas properties built through acquisition and through selective development, production enhancement, and other exploitation efforts on its oil and natural gas properties.
EON’s Class A Common Stock trades on the NYSE American Stock Exchange (NYSE American: EONR) and the Company’s public warrants trade on the NYSE American Stock Exchange (NYSE American: EONR WS). For more information on EON, please visit the Company’s website: https://eon-r.com/
Forward-Looking Statements
This press release includes “forward-looking statements” within the meaning of the Private Securities Litigation Reform Act of 1995 that involve risks and uncertainties that could cause actual results to differ materially from what is expected. Words such as “expects,” “believes,” “anticipates,” “intends,” “estimates,” “seeks,” “may,” “might,” “plan,” “possible,” “should” and variations and similar words and expressions are intended to identify such forward-looking statements, but the absence of these words does not mean that a statement is not forward-looking. Such forward-looking statements relate to future events or future results, based on currently available information and reflect the Company’s management’s current beliefs. A number of factors could cause actual events or results to differ materially from the events and results discussed in the forward-looking statements. Important factors - including the availability of funds, the results of financing efforts and the risks relating to our business - that could cause actual results to differ materially from the Company’s expectations are disclosed in the Company’s documents filed from time to time on EDGAR (see www.edgar-online.com) and with the Securities and Exchange Commission (see www.sec.gov). Readers are cautioned not to place undue reliance on these forward-looking statements, which speak only as of the date of this press release. Except as expressly required by applicable securities law, the Company disclaims any intention or obligation to update or revise any forward-looking statements whether as a result of new information, future events or otherwise.
Investor Relations
Michael J. Porter, President
PORTER, LEVAY & ROSE, INC.
Exhibit 99.3
EON Resources Inc. Conference Call – May 2025 NYSE American: EONR https:// www.EON - R.com/
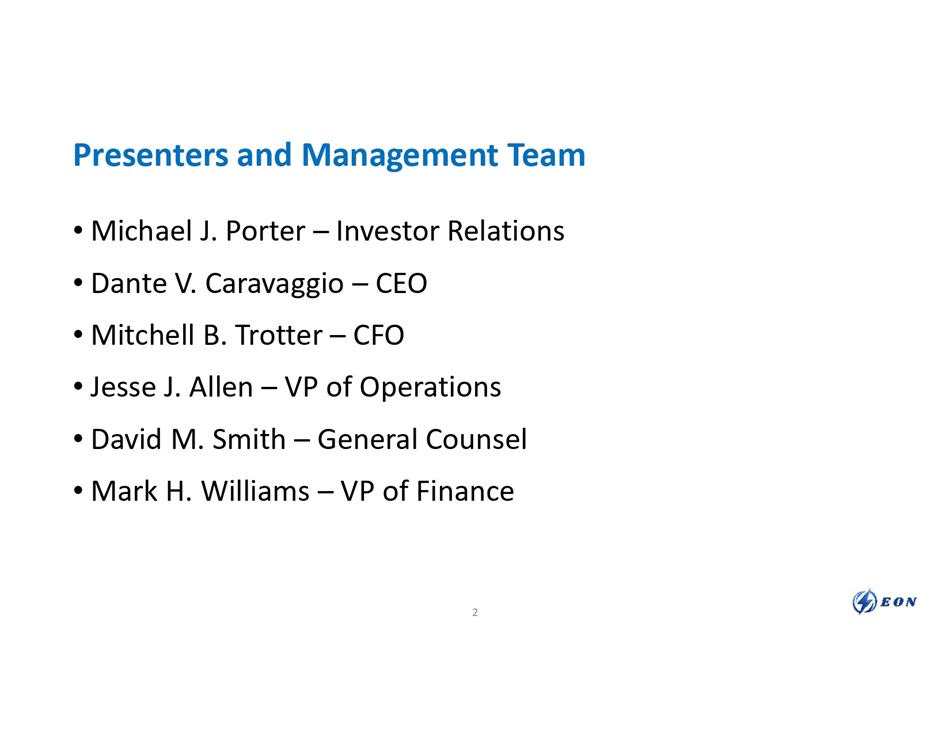
Presenters and Management Team • Michael J. Porter – Investor Relations • Dante V. Caravaggio – CEO • Mitchell B. Trotter – CFO • Jesse J. Allen – VP of Operations • David M. Smith – General Counsel • Mark H. Williams – VP of Finance 2
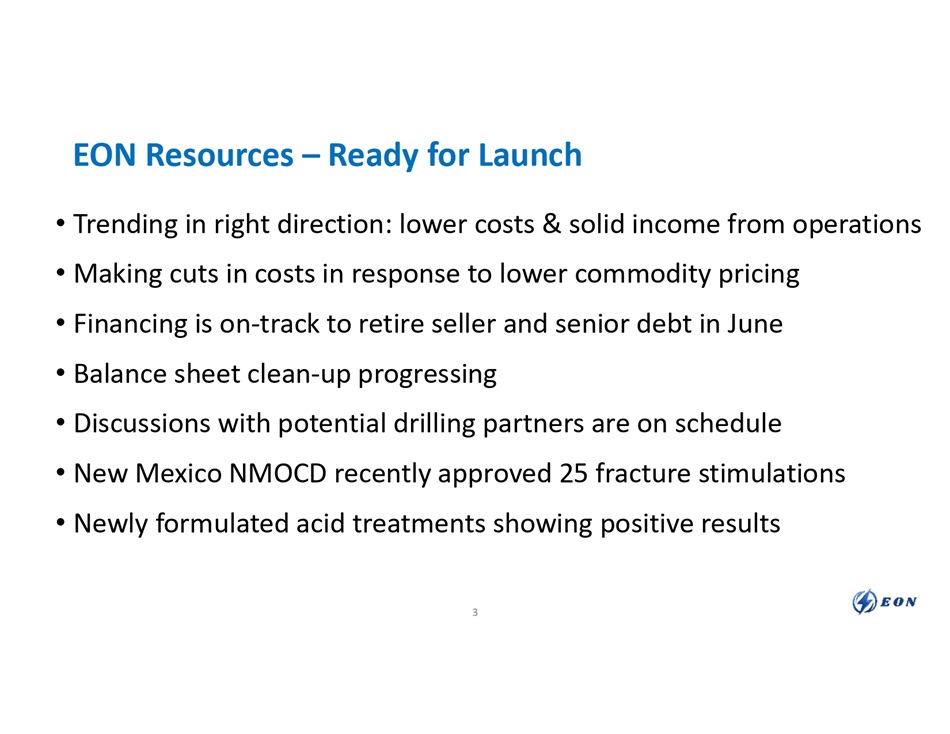
EON Resources – Ready for Launch • Trending in right direction: lower costs & solid income from operations • Making cuts in costs in response to lower commodity pricing • Financing is on - track to retire seller and senior debt in June • Balance sheet clean - up progressing • Discussions with potential drilling partners are on schedule • New Mexico NMOCD recently approved 25 fracture stimulations • Newly formulated acid treatments showing positive results 3
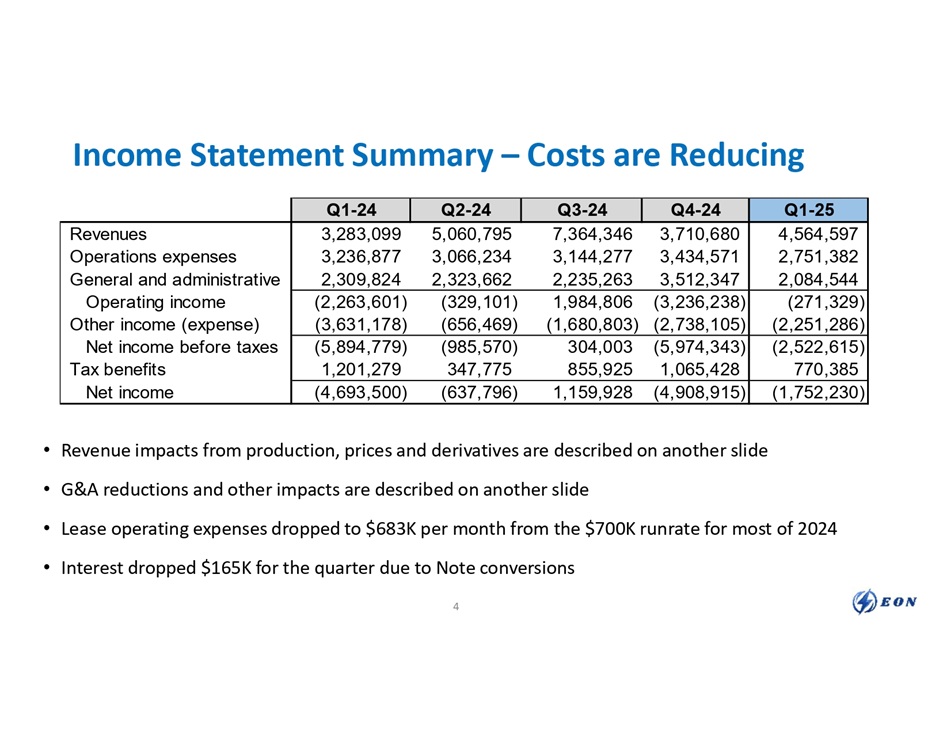
Income Statement Summary – Costs are Reducing • Revenue impacts from production, prices and derivatives are described on another slide • G&A reductions and other impacts are described on another slide • Lease operating expenses dropped to $683K per month from the $700K runrate for most of 2024 • Interest dropped $165K for the quarter due to Note conversions 4 Q1 - 25 Q4 - 24 Q3 - 24 Q2 - 24 Q1 - 24 4,564,597 3,710,680 7,364,346 5,060,795 3,283,099 Revenues 2,751,382 3,434,571 3,144,277 3,066,234 3,236,877 Operations expenses 2,084,544 3,512,347 2,235,263 2,323,662 2,309,824 General and administrative (271,329) (3,236,238) 1,984,806 (329,101) (2,263,601) Operating income (2,251,286) (2,738,105) (1,680,803) (656,469) (3,631,178) Other income (expense) (2,522,615) (5,974,343) 304,003 (985,570) (5,894,779) Net income before taxes 770,385 1,065,428 855,925 347,775 1,201,279 Tax benefits (1,752,230) (4,908,915) 1,159,928 (637,796) (4,693,500) Net income

Revenues – Hedging Program Mitigates Oil Price Drop • Oil revenues were impacted by: • Production remains stable • Average oil sold price per barrel fluctuations drove the revenue changes by quarter • Hedging is at a responsible level with 70% hedged $70.00 or higher for all 2025 • Derivatives impact minimal as oil prices averaged $70.00 for the quarter • Gas revenues up based on higher market price for gas Q1 - 25 Q4 - 24 Q3 - 24 Q2 - 24 Q1 - 24 62,702 62,140 62,949 61,259 64,339 Net barrels of oil 70.06 67.05 83.80 79.76 77.27 Average oil price 4,392,605 4,166,335 5,275,254 4,885,959 4,971,150 Oil 139,532 86,816 89,978 128,084 178,608 Gas 117,532 127,839 98,452 130,230 130,588 Other (54,435) 23,556 (107,970) (261,447) (60,065) Hedges: Cash 4,595,234 4,404,546 5,355,714 4,882,826 5,220,282 Cash based revenues (30,636) (693,866) 2,008,631 177,969 (1,937,183) Hedges: Non - cash 4,564,597 3,710,680 7,364,346 5,060,795 3,283,099 Total revenues 5
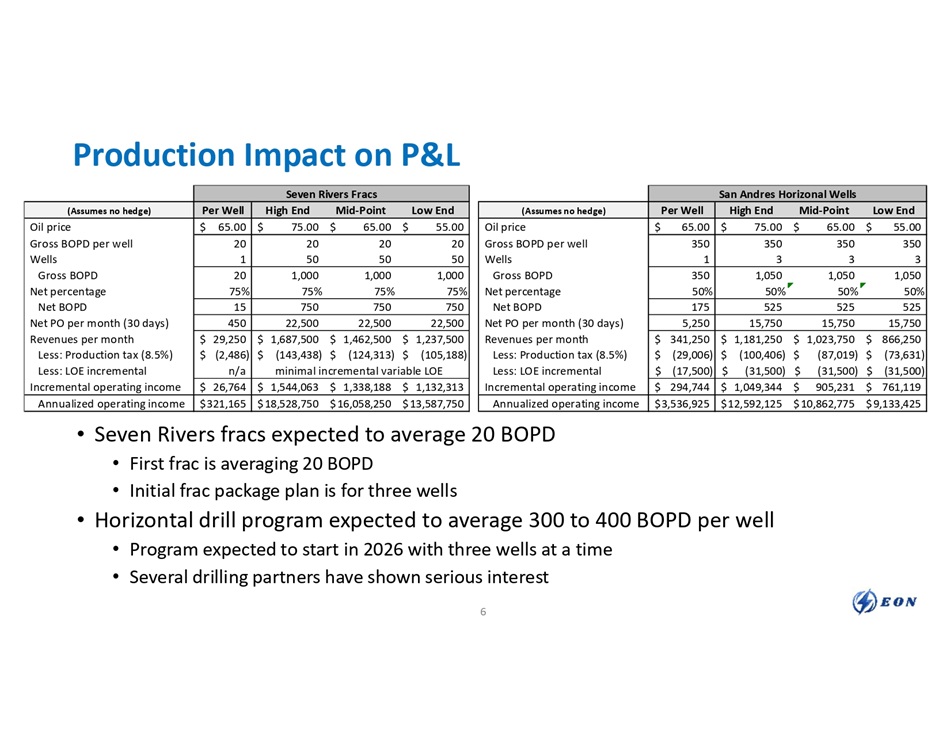
Production Impact on P&L • Seven Rivers fracs expected to average 20 BOPD • First frac is averaging 20 BOPD • Initial frac package plan is for three wells • Horizontal drill program expected to average 300 to 400 BOPD per well • Program expected to start in 2026 with three wells at a time • Several drilling partners have shown serious interest Seven Rivers Fracs Low End Mid - Point High End Per Well (Assumes no hedge) $ 55.00 $ 65.00 $ 75.00 $ 65.00 Oil price 20 20 20 20 Gross BOPD per well 50 50 50 1 Wells 1,000 1,000 1,000 20 Gross BOPD 75% 75% 75% 75% Net percentage 750 750 750 15 Net BOPD 22,500 22,500 22,500 450 Net PO per month (30 days) $ 1,687,500 $ 1,462,500 $ 1,237,500 $ 29,250 Revenues per month $ (143,438) $ (124,313) $ (105,188) $ (2,486) Less: Production tax (8.5%) minimal incremental variable LOE n/a Less: LOE incremental $ 1,132,313 $ 1,338,188 $ 1,544,063 $ 26,764 Incremental operating income $ 13,587,750 $ 16,058,250 $ 18,528,750 $ 321,165 Annualized operating income San Andres Horizonal Wells Low End Mid - Point High End Per Well (Assumes no hedge) $ 55.00 $ 65.00 $ 75.00 $ 65.00 Oil price 350 350 350 350 Gross BOPD per well 3 3 3 1 Wells 1,050 1,050 1,050 350 Gross BOPD 50% 50% 50% 50% Net percentage 525 525 525 175 Net BOPD 15,750 15,750 15,750 5,250 Net PO per month (30 days) $ 1,181,250 $ 1,023,750 $ 866,250 $ 341,250 Revenues per month $ (100,406) $ (87,019) $ (73,631) $ (29,006) Less: Production tax (8.5%) $ (31,500) $ (31,500) $ (31,500) $ (17,500) Less: LOE incremental $ 761,119 $ 905,231 $ 1,049,344 $ 294,744 Incremental operating income $ 9,133,425 $ 10,862,775 $ 12,592,125 $ 3,536,925 Annualized operating income 6
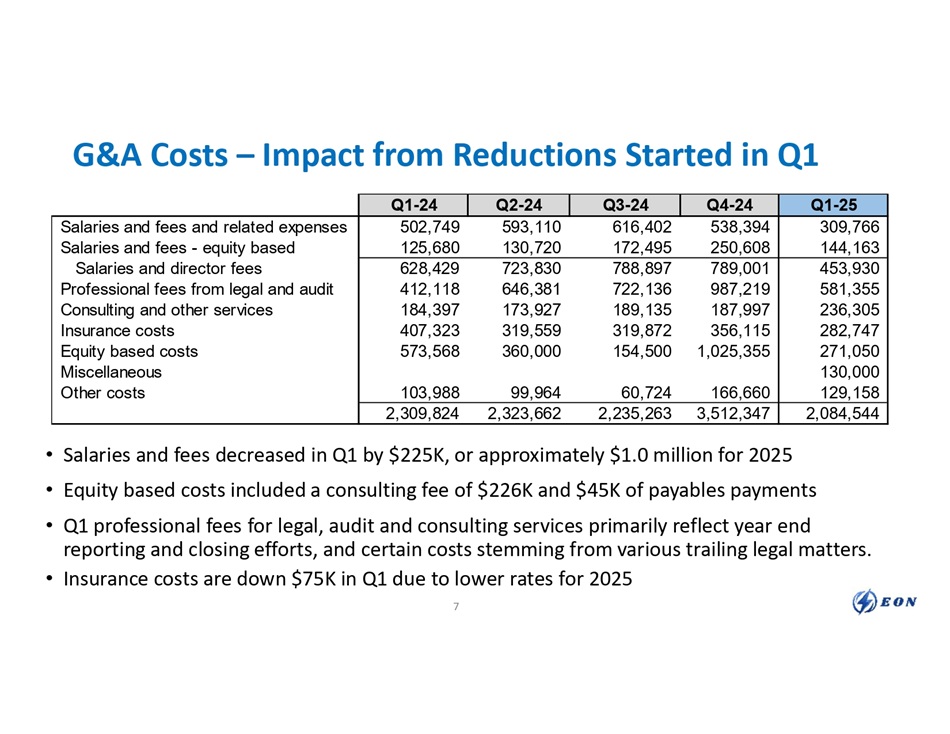
G&A Costs – Impact from Reductions Started in Q1 • Salaries and fees decreased in Q1 by $225K, or approximately $1.0 million for 2025 • Equity based costs included a consulting fee of $226K and $45K of payables payments • Q1 professional fees for legal, audit and consulting services primarily reflect year end reporting and closing efforts, and certain costs stemming from various trailing legal matters. • Insurance costs are down $75K in Q1 due to lower rates for 2025 7 Q1 - 25 Q4 - 24 Q3 - 24 Q2 - 24 Q1 - 24 309,766 538,394 616,402 593,110 502,749 Salaries and fees and related expenses 144,163 250,608 172,495 130,720 125,680 Salaries and fees - equity based 453,930 789,001 788,897 723,830 628,429 Salaries and director fees 581,355 987,219 722,136 646,381 412,118 Professional fees from legal and audit 236,305 187,997 189,135 173,927 184,397 Consulting and other services 282,747 356,115 319,872 319,559 407,323 Insurance costs 271,050 1,025,355 154,500 360,000 573,568 Equity based costs 130,000 Miscellaneous 129,158 166,660 60,724 99,964 103,988 Other costs 2,084,544 3,512,347 2,235,263 2,323,662 2,309,824
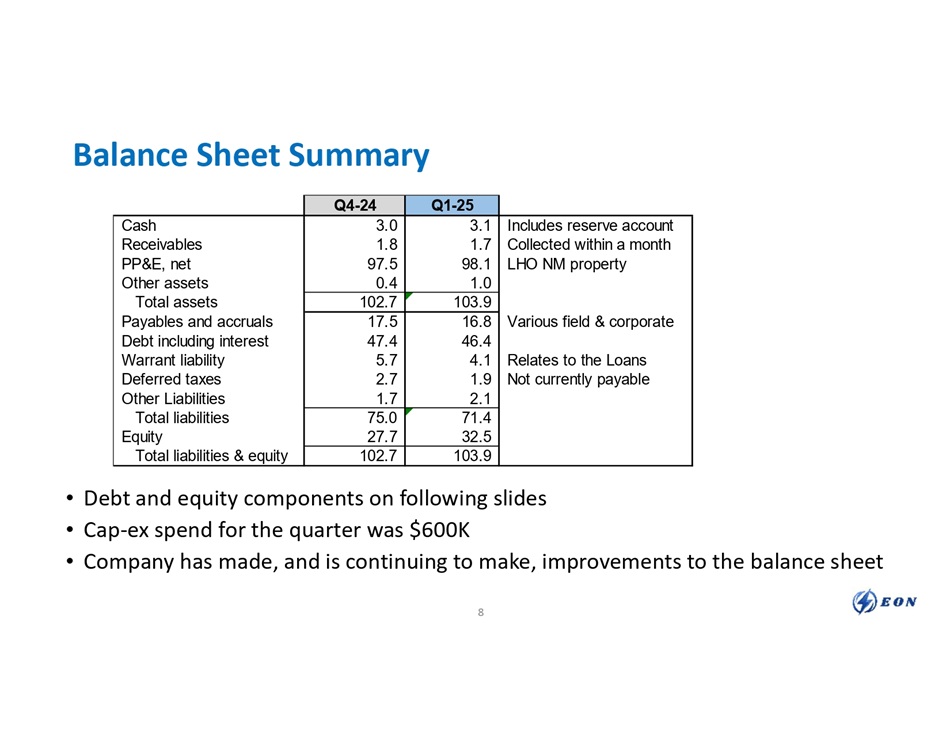
Balance Sheet Summary • Debt and equity components on following slides • Cap - ex spend for the quarter was $600K • Company has made, and is continuing to make, improvements to the balance sheet 8 Q1 - 25 Q4 - 24 Includes reserve account 3.1 3.0 Cash Collected within a month 1.7 1.8 Receivables LHO NM property 98.1 97.5 PP&E, net 1.0 0.4 Other assets 103.9 102.7 Total assets Various field & corporate 16.8 17.5 Payables and accruals 46.4 47.4 Debt including interest Relates to the Loans 4.1 5.7 Warrant liability Not currently payable 1.9 2.7 Deferred taxes 2.1 1.7 Other Liabilities 71.4 75.0 Total liabilities 32.5 27.7 Equity 103.9 102.7 Total liabilities & equity
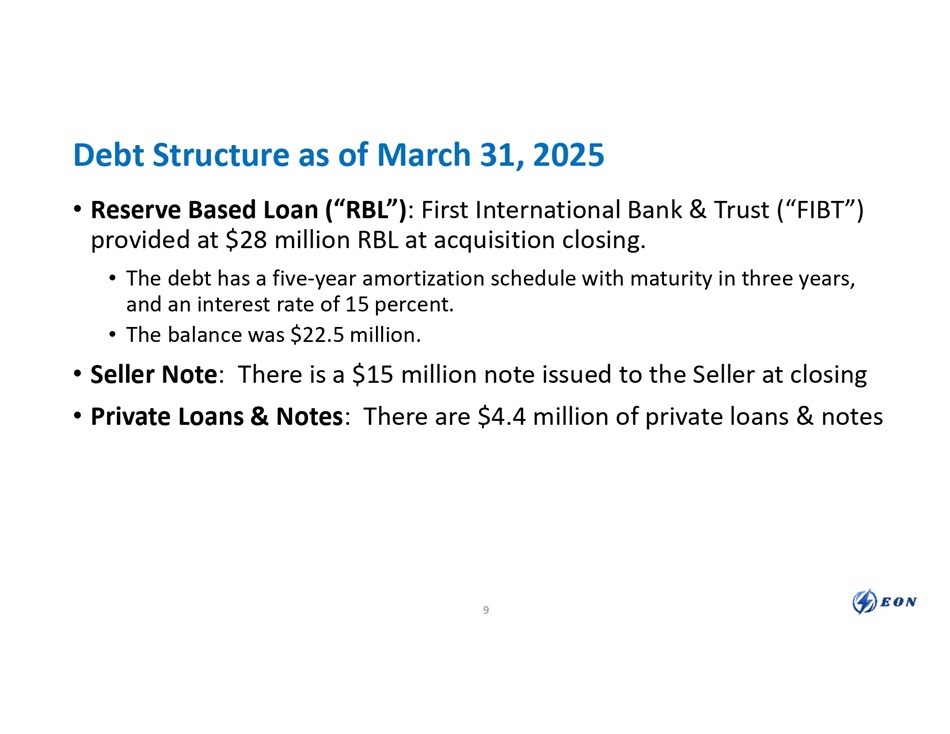
Debt Structure as of March 31, 2025 • Reserve Based Loan (“RBL”) : First International Bank & Trust (“FIBT”) provided at $28 million RBL at acquisition closing. • The debt has a five - year amortization schedule with maturity in three years, and an interest rate of 15 percent. • The balance was $22.5 million. • Seller Note : There is a $15 million note issued to the Seller at closing • Private Loans & Notes : There are $4.4 million of private loans & notes 9
Equity Structure as of March 31, 2025 • Common stock : There were 17 million shares outstanding. • Preferred stock : There are no preferred stock shares issued on the 1.0 million shares authorized, and there are no designated classes of preferred stock. • There are $15 million of preferred units at a subsidiary level that are included in the minority interest component of shareholder equity. The preferred units automatically convert to common stock at the end of two years based on a formula. There is no cash obligation to the Company • Warrants : There were 14.3 million warrants outstanding that are convertible to 11.0 million Class A shares 10
Funding Options • The Company is opposed to using excessive amount of equity for fund raising. Options for a properly balanced approach are: • Volumetric funding • Debt financing • Equity instruments • Volumetric funding as described in our March 20 th press release • A production/revenue sharing instrument that neither debt nor equity • Does not dilute our common stock • Payments fluctuate with production and oil prices mitigating risk • Minimizes/reduces default risk by not being a traditional loan • Planned uses for field development; Seller consideration; and refinancing • Back - up alternatives of a combination of debt and/or equity 11
Operations – 2024 • Safety – No reportable incidents • Operational highlights • Stabilized production • Water and flowline repairs and upgrades • Electrical repairs and upgrades • Purchased key pumps, hot oiler, well testers, etc. • Reduced LOE to $683K per month from 2024 runrate of 700K 12
Operations – Increasing Production • Plans to increase production • Sand fracs with low temperature RCS has been successful • Acid treatment with improved formula has been successful • Bringing back on - line down wells and injection wells • Horizontal well program 13
Questions & Thank You for Attending NYSE American: EONR https:// www.EON - R.com/
Disclaimer • This presentation of EON Resources Inc. (“EON” or the “Company”) shall not constitute a “solicitation” as defined in Rule 14a - 1 of the Securities Exchange Act of 1934, as amended. • This presentation is not an offer, or a solicitation of an offer, to buy or sell any investment or other specific product. Any offering of securities (the “Securities”) will not be registered under the Securities Act of 1933, as amended (the “Act”), and will be offered as a private placement to a limited number of institutional “accredited investors” as defined in Rule 501(a)(1), (2), (3) or (7) under the Act or “qualified institutional buyers” as defined in Rule 144A under the Act. Accordingly, the Securities must continue to be held unless the Securities are registered under the Act or a subsequent disposition is exempt from the registration requirements of the Act. Investors should consult with their legal counsel as to the applicable requirements for a purchaser to avail itself of any exemption under the Act. The transfer of the Securities may also be subject to conditions set forth in an agreement under which they are to be issued. Investors should be aware that they might be required to bear the final risk of their investment for an indefinite period of time. EON is not making an offer of the Securities in any state where the offer is not permitted. • The information in this presentation may not be complete and may be changed at any time. Before you invest in the Company’s securities, you should read the documents the Company has filed or may file with the SEC for more complete information about the Company. Copies of any such filing may be obtained for free by visiting the SEC website at www.sec.gov. Filings by EON with the SEC may also be viewed through links on the EON website at EON - R.com. • This presentation is not intended to form the basis of any investment decision by the recipient and does not constitute investment, tax or legal advice. No representation or warranty, express or implied, is or will be given by the Company or any of its affiliates, directors, officers, employees or advisers or any other person as to the accuracy or completeness of the information in this presentation or any other written, oral or other communications transmitted or otherwise made available to any party and no responsibility or liability whatsoever is accepted for the accuracy or sufficiency thereof or for any errors, omissions or misstatements, negligent or otherwise, relating thereto. Accordingly, none of the Company or any of its affiliates, directors, officers, employees or advisers or any other person shall be liable for any direct, indirect or consequential loss or damages suffered by any person as a result of relying on any statement in or omission from this presentation and any such liability is expressly disclaimed. • The financial information and data contained in this presentation is unaudited and does not conform to Regulation S - X promulgated by the SEC. Accordingly, such information and date may not be included in, may be adjusted in, or may be presented differently in, any proxy statement, prospectus or other report or document to be filed or furnished by EON with the SEC. Certain financial measures in this presentation are not calculated pursuant to U.S. generally accepted accounting principles (“GAAP”). These non - GAAP financial measures are in addition to, and not as a substitute for or superior to measures of financial performance prepared in accordance with GAAP. There are a number of limitations related to the use of these non - GAAP financial measures as compared to their nearest GAAP equivalents. For example, other companies may calculate non - GAAP financial measures differently or may use other measures to evaluate their performance, all of which could reduce the usefulness of the non - GAAP financial measures herein as tools for comparison. • Certain statements contained in this presentation relate to the historical experience of our management team. An investment in the Company is not an investment in any of our management team’s past investments, companies or funds affiliated with them. The historical results of these persons, investments, companies, funds or affiliates is not necessarily indicative of future performance of the Company. • This Presentation may contain estimated or projected financial information, including, without limitation, EON’s projected revenue, gross operating profit, income before taxes and EBITDA for calendar years 2024, 2025, and 2026. Such estimated or projected financial information constitutes forward - looking information and is for illustrative purposes only and should not be relied upon as necessarily being indicative of future results. The assumptions and estimates underlying such estimated or projected financial information are inherently uncertain and are subject to a wide variety of significant business, economic, competitive and other risks and uncertainties that could cause actual results to differ materially from those contained in the prospective financial information. See “Forward - Looking Statements” below. Actual results may differ materially from the results contemplated by the estimated or projected financial information contained in this presentation, and the inclusion of such information in this presentation should not be regarded as a representation by any person that the results reflected in such estimates and projections will be achieved. The independent registered public accounting firm of EON did not audit, review, compile, or perform any procedures with respect to the estimates or projections for the purpose of their inclusion in this presentation, and accordingly, did not express an opinion or provide any other form of assurance with respect thereto for the purpose of this presentation. 15
Disclaimer • Forward - Looking Statements • Statements in this presentation which are not statements of historical fact are “forward - looking statements” . Our forward - looking statements include, but are not limited to, statements regarding our or our management team’s expectations, hopes, beliefs, intentions or strategies regarding the future . In addition, any statements that refer to projections, forecasts or other characterizations of future events or circumstances, including any underlying assumptions, are forward - looking statements . The words “anticipate,” “believe,” “continue,” “could,” “estimate,” “expect,” “intends,” “may,” “might,” “plan,” “possible,” “potential,” “predict,” “project,” “should,” “would” and similar expressions may identify forward - looking statements, but the absence of these words does not mean that a statement is not forward - looking . All statements other than statements of historical fact included in this presentation are forward - looking statements and are based on various underlying assumptions and expectations and are subject to known and unknown risks and uncertainties, and may include projections of our future financial performance based on our growth strategies, business plans and anticipated trends in our business . These forward - looking statements, are only predictions based on our current expectations and projections about future events . There are important factors that could cause our actual results, level of activity, performance or achievements to differ materially from the results, level of activity, performance, targets, goals or achievements expressed or implied in the forward - looking statements . These factors include, but are not limited to, those discussed in our Annual Report on Form 10 - K under Item 1 A “Risk Factors,” and also discussed from time to time in our quarterly reports on Form 10 - Q, current reports on Form 8 - K, proxy statements, and other SEC filings including the following : ( 1 ) the financial and business performance of the Company, ( 2 ) the Company’s abilities to execute its business strategies, ( 3 ) the level of production on our properties, ( 4 ) overall and regional supply and demand factors, delays, or interruptions of production, ( 5 ) competition in the oil and natural gas industry, ( 6 ) risks associated with the drilling and operation of crude oil and natural gas wells, including uncertainties with respect to identified drilling locations and estimates of reserves, and ( 7 ) the effect of existing and future laws and regulatory actions, including federal and state legislative and regulatory initiatives relating to hydraulic fracturing and environmental matters, including climate change . These forward - looking statements are based on the information available to, and the expectations and assumptions deemed reasonable by, the Company at the time this presentation was prepared . Although the Company believes that the assumptions underlying such statements are reasonable, it cannot give assurance that they will be attained . We undertake no obligation to update or revise any forward - looking statements, whether as a result of new information, future events or otherwise, except as may be required under applicable securities law . You are cautioned not to place undue reliance upon any forward - looking statements, which speak only as of the date made . EON undertakes no commitment to update or revise the forward - looking statements, whether as a result of new information, future events or otherwise, except as may be required by law . • In preparing this presentation, the Company has substantially and materially relied on the Evaluations of Certain Oil and Gas Properties ("reserve reports") rendered by William M . Cobb & Associates, Inc . ("Cobb"), an unrelated third party that had previously been engaged and compensated by EON concerning the oil and gas assets owned by EON including, without limitation, the proved reserves and future income as of the date of the Cobb reserve reports, the most recent reflecting values as of December 31 , 2023 . 16
Exhibit 99.4
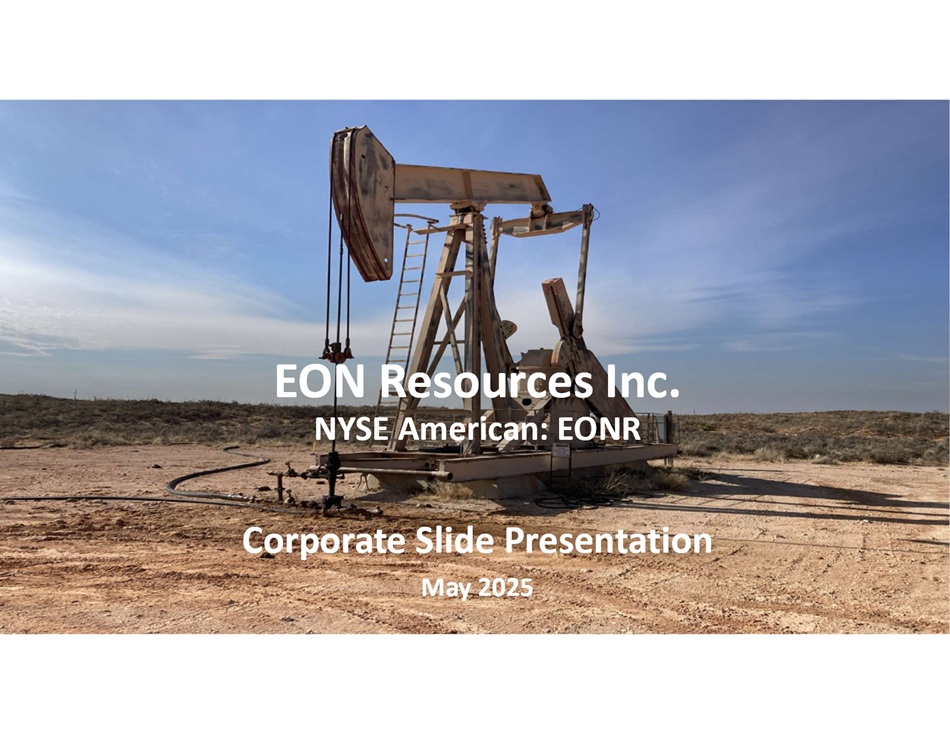
EON Resources Inc. NYSE American: EONR Corporate Slide Presentation May 2025
Disclaimer • This presentation of EON Resources Inc. (“EON” or the “Company”) shall not constitute a “solicitation” as defined in Rule 14a - 1 of the Securities Exchange Act of 1934, as amended. • This presentation is not an offer, or a solicitation of an offer, to buy or sell any investment or other specific product. Any offering of securities (the “Securities”) will not be registered under the Securities Act of 1933, as amended (the “Act”), and will be offered as a private placement to a limited number of institutional “accredited investors” as defined in Rule 501(a)(1), (2), (3) or (7) under the Act or “qualified institutional buyers” as defined in Rule 144A under the Act. Accordingly, the Securities must continue to be held unless the Securities are registered under the Act or a subsequent disposition is exempt from the registration requirements of the Act. Investors should consult with their legal counsel as to the applicable requirements for a purchaser to avail itself of any exemption under the Act. The transfer of the Securities may also be subject to conditions set forth in an agreement under which they are to be issued. Investors should be aware that they might be required to bear the final risk of their investment for an indefinite period of time. EON is not making an offer of the Securities in any state where the offer is not permitted. • The information in this presentation may not be complete and may be changed at any time. Before you invest in the Company’s securities, you should read the documents the Company has filed or may file with the SEC for more complete information about the Company. Copies of any such filing may be obtained for free by visiting the SEC website at www.sec.gov. Filings by EON with the SEC may also be viewed through links on the EON website at EON - R.com. • This presentation is not intended to form the basis of any investment decision by the recipient and does not constitute investment, tax or legal advice. No representation or warranty, express or implied, is or will be given by the Company or any of its affiliates, directors, officers, employees or advisers or any other person as to the accuracy or completeness of the information in this presentation or any other written, oral or other communications transmitted or otherwise made available to any party and no responsibility or liability whatsoever is accepted for the accuracy or sufficiency thereof or for any errors, omissions or misstatements, negligent or otherwise, relating thereto. Accordingly, none of the Company or any of its affiliates, directors, officers, employees or advisers or any other person shall be liable for any direct, indirect or consequential loss or damages suffered by any person as a result of relying on any statement in or omission from this presentation and any such liability is expressly disclaimed. • The financial information and data contained in this presentation is unaudited and does not conform to Regulation S - X promulgated by the SEC. Accordingly, such information and date may not be included in, may be adjusted in, or may be presented differently in, any proxy statement, prospectus or other report or document to be filed or furnished by EON with the SEC. Certain financial measures in this presentation are not calculated pursuant to U.S. generally accepted accounting principles (“GAAP”). These non - GAAP financial measures are in addition to, and not as a substitute for or superior to measures of financial performance prepared in accordance with GAAP. There are a number of limitations related to the use of these non - GAAP financial measures as compared to their nearest GAAP equivalents. For example, other companies may calculate non - GAAP financial measures differently or may use other measures to evaluate their performance, all of which could reduce the usefulness of the non - GAAP financial measures herein as tools for comparison. • Certain statements contained in this presentation relate to the historical experience of our management team. An investment in the Company is not an investment in any of our management team’s past investments, companies or funds affiliated with them. The historical results of these persons, investments, companies, funds or affiliates is not necessarily indicative of future performance of the Company. • This Presentation may contain estimated or projected financial information, including, without limitation, EON’s projected revenue, gross operating profit, income before taxes and EBITDA for calendar years 2024, 2025, and 2026. Such estimated or projected financial information constitutes forward - looking information and is for illustrative purposes only and should not be relied upon as necessarily being indicative of future results. The assumptions and estimates underlying such estimated or projected financial information are inherently uncertain and are subject to a wide variety of significant business, economic, competitive and other risks and uncertainties that could cause actual results to differ materially from those contained in the prospective financial information. See “Forward - Looking Statements” below. Actual results may differ materially from the results contemplated by the estimated or projected financial information contained in this presentation, and the inclusion of such information in this presentation should not be regarded as a representation by any person that the results reflected in such estimates and projections will be achieved. The independent registered public accounting firm of EON did not audit, review, compile, or perform any procedures with respect to the estimates or projections for the purpose of their inclusion in this presentation, and accordingly, did not express an opinion or provide any other form of assurance with respect thereto for the purpose of this presentation. 2
Disclaimer • Forward - Looking Statements • Statements in this presentation which are not statements of historical fact are “forward - looking statements” . Our forward - looking statements include, but are not limited to, statements regarding our or our management team’s expectations, hopes, beliefs, intentions or strategies regarding the future . In addition, any statements that refer to projections, forecasts or other characterizations of future events or circumstances, including any underlying assumptions, are forward - looking statements . The words “anticipate,” “believe,” “continue,” “could,” “estimate,” “expect,” “intends,” “may,” “might,” “plan,” “possible,” “potential,” “predict,” “project,” “should,” “would” and similar expressions may identify forward - looking statements, but the absence of these words does not mean that a statement is not forward - looking . All statements other than statements of historical fact included in this presentation are forward - looking statements and are based on various underlying assumptions and expectations and are subject to known and unknown risks and uncertainties, and may include projections of our future financial performance based on our growth strategies, business plans and anticipated trends in our business . These forward - looking statements, are only predictions based on our current expectations and projections about future events . There are important factors that could cause our actual results, level of activity, performance or achievements to differ materially from the results, level of activity, performance, targets, goals or achievements expressed or implied in the forward - looking statements . These factors include, but are not limited to, those discussed in our Annual Report on Form 10 - K under Item 1 A “Risk Factors,” and also discussed from time to time in our quarterly reports on Form 10 - Q, current reports on Form 8 - K, proxy statements, and other SEC filings including the following : ( 1 ) the financial and business performance of the Company, ( 2 ) the Company’s abilities to execute its business strategies, ( 3 ) the level of production on our properties, ( 4 ) overall and regional supply and demand factors, delays, or interruptions of production, ( 5 ) competition in the oil and natural gas industry, ( 6 ) risks associated with the drilling and operation of crude oil and natural gas wells, including uncertainties with respect to identified drilling locations and estimates of reserves, and ( 7 ) the effect of existing and future laws and regulatory actions, including federal and state legislative and regulatory initiatives relating to hydraulic fracturing and environmental matters, including climate change . These forward - looking statements are based on the information available to, and the expectations and assumptions deemed reasonable by, the Company at the time this presentation was prepared . Although the Company believes that the assumptions underlying such statements are reasonable, it cannot give assurance that they will be attained . We undertake no obligation to update or revise any forward - looking statements, whether as a result of new information, future events or otherwise, except as may be required under applicable securities law . You are cautioned not to place undue reliance upon any forward - looking statements, which speak only as of the date made . EON undertakes no commitment to update or revise the forward - looking statements, whether as a result of new information, future events or otherwise, except as may be required by law . • In preparing this presentation, the Company has substantially and materially relied on the Evaluations of Certain Oil and Gas Properties ("reserve reports") rendered by William M . Cobb & Associates, Inc . ("Cobb"), an unrelated third party that had previously been engaged and compensated by EON concerning the oil and gas assets owned by EON including, without limitation, the proved reserves and future income as of the date of the Cobb reserve reports, the most recent reflecting values as of December 31 , 2023 . 3
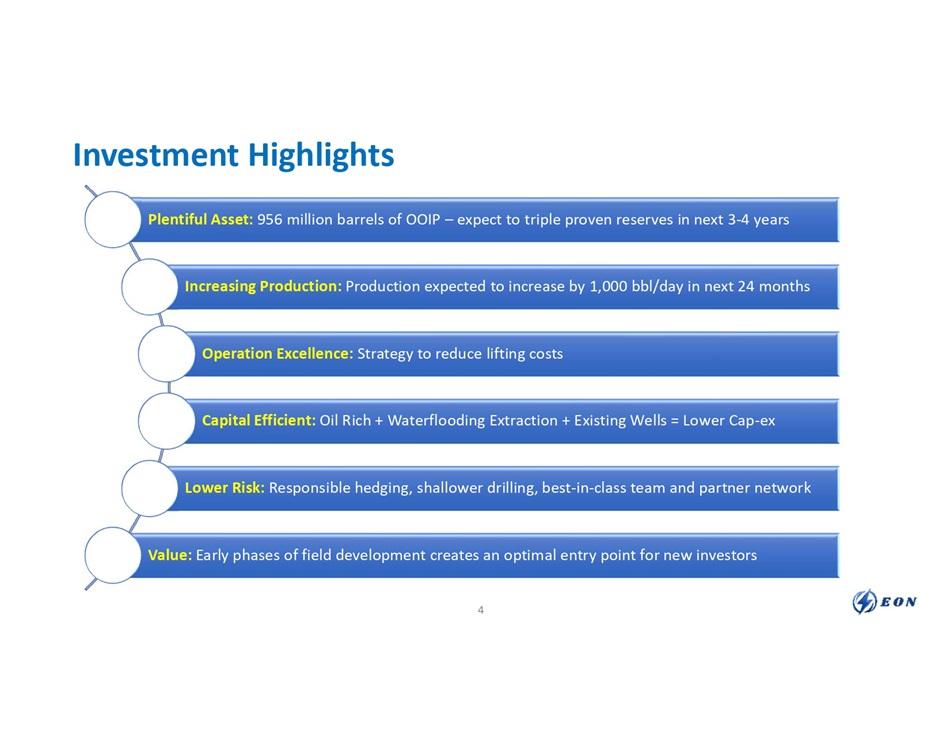
Investment Highlights Plentiful Asset: 956 million barrels of OOIP – expect to triple proven reserves in next 3 - 4 years Increasing Production: Production expected to increase by 1,000 bbl/day in next 24 months Operation Excellence: Strategy to reduce lifting costs Capital Efficient: Oil Rich + Waterflooding Extraction + Existing Wells = Lower Cap - ex Lower Risk: Responsible hedging, shallower drilling, best - in - class team and partner network Value: Early phases of field development creates an optimal entry point for new investors 4
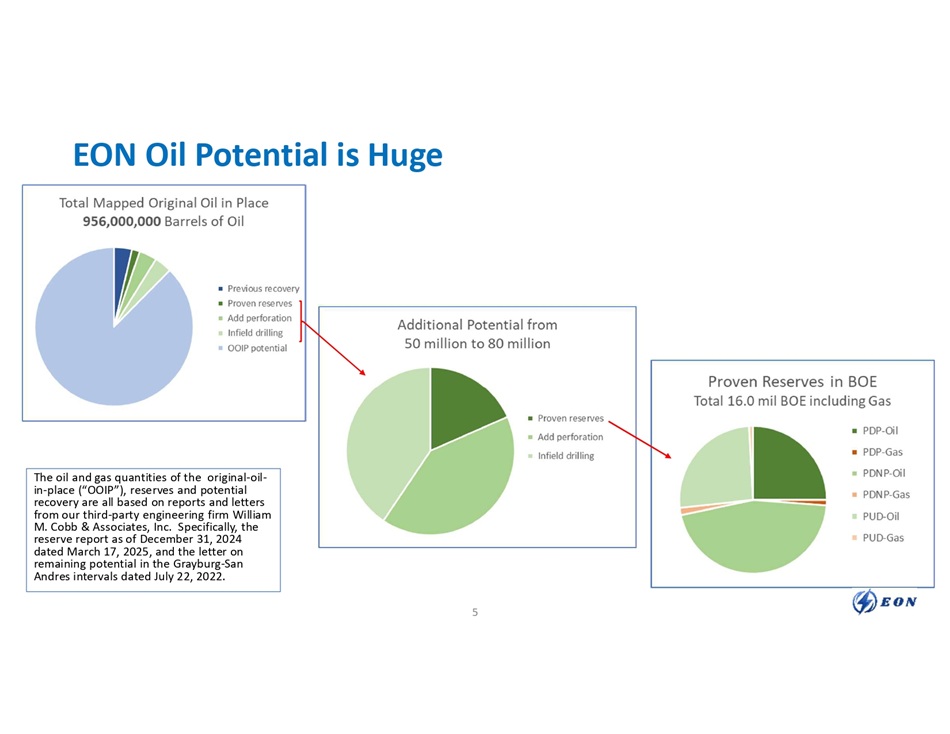
EON Oil Potential is Huge The oil and gas quantities of the original - oil - in - place (“OOIP”), reserves and potential recovery are all based on reports and letters from our third - party engineering firm William M. Cobb & Associates, Inc. Specifically, the reserve report as of December 31, 2024 dated March 17, 2025, and the letter on remaining potential in the Grayburg - San Andres intervals dated July 22, 2022. 5
Growth Strategy
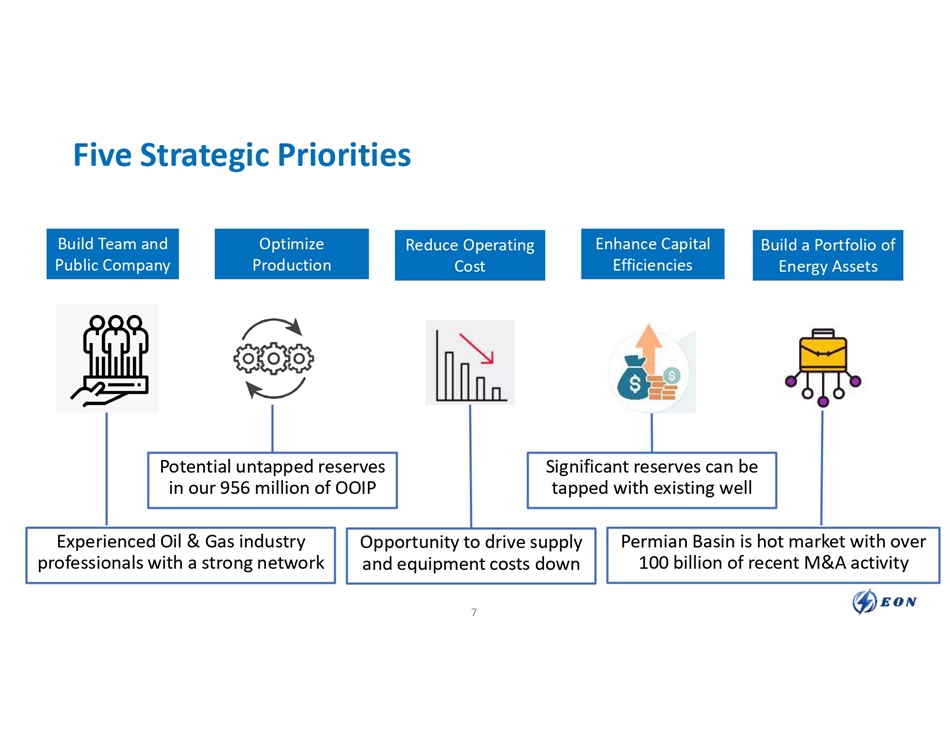
Five Strategic Priorities Build Team and Public Company Build Team and Public Company Optimize Production Optimize Production Reduce Operating Cost Reduce Operating Cost Enhance Capital Efficiencies Enhance Capital Efficiencies Build a Portfolio of Energy Assets Build a Portfolio of Energy Assets Experienced Oil & Gas industry professionals with a strong network Potential untapped reserves in our 956 million of OOIP Opportunity to drive supply and equipment costs down Significant reserves can be tapped with existing well Permian Basin is hot market with over 100 billion of recent M&A activity 7
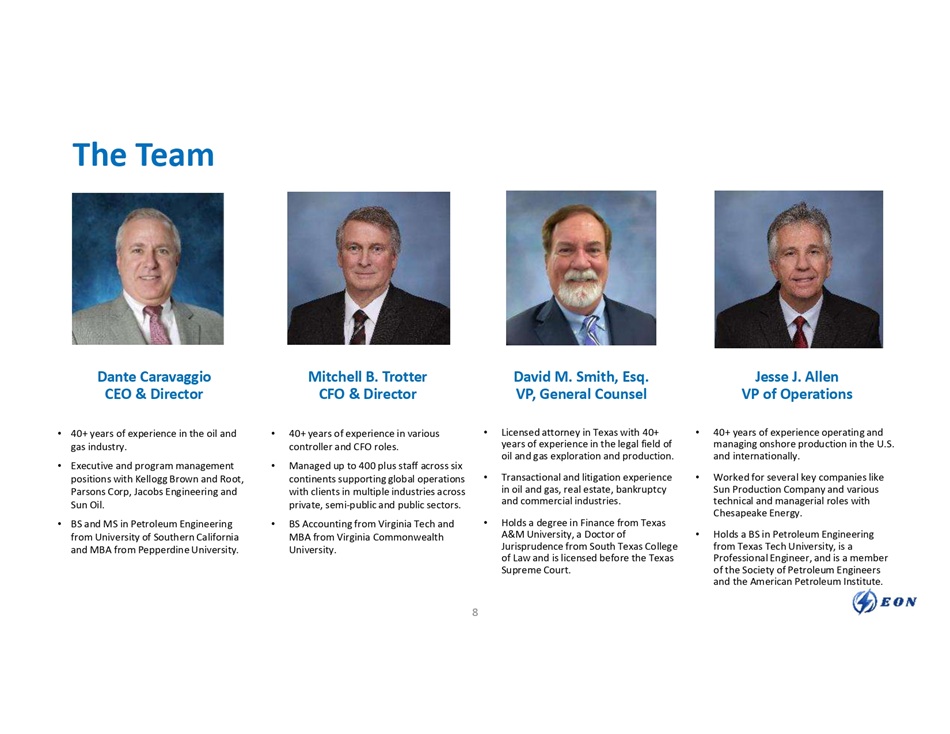
The Team Dante Caravaggio CEO & Director Mitchell B. Trotter CFO & Director David M. Smith, Esq. VP, General Counsel Jesse J. Allen VP of Operations • 40+ years of experience in the oil and gas industry. • Executive and program management positions with Kellogg Brown and Root, Parsons Corp, Jacobs Engineering and Sun Oil. • BS and MS in Petroleum Engineering from University of Southern California and MBA from Pepperdine University. • 40 + years of experience in various controller and CFO roles . • Managed up to 400 plus staff across six continents supporting global operations with clients in multiple industries across private, semi - public and public sectors . • BS Accounting from Virginia Tech and MBA from Virginia Commonwealth University. • Licensed attorney in Texas with 40+ years of experience in the legal field of oil and gas exploration and production. • Transactional and litigation experience in oil and gas, real estate, bankruptcy and commercial industries. • Holds a degree in Finance from Texas A&M University, a Doctor of Jurisprudence from South Texas College of Law and is licensed before the Texas Supreme Court. • 40+ years of experience operating and managing onshore production in the U.S. and internationally. • Worked for several key companies like Sun Production Company and various technical and managerial roles with Chesapeake Energy. • Holds a BS in Petroleum Engineering from Texas Tech University, is a Professional Engineer, and is a member of the Society of Petroleum Engineers and the American Petroleum Institute. 8
Optimizing Production • What was done? • Predecessor transitioned to a waterflood approach in the Seven Rivers zone in 2020 and increased production to 1,400 BOEPD over a two - year period • Due to lack of cap - ex and attention, the production stabilized and then dropped to 900 BOEPD over the 1 ½ years until EON acquisition • The EON team has been upgrading infrastructure that has been restricting production • Production was stabilized by the EON team and production is starting to tick upwards • What is being done? • EON is continuing to analyze well logs to follow the science to increase production • Re - commencing recompletions and stimulations with expected lower costs than the predecessor • New fracs to tap into the PDNP reserves now that infrastructure upgrades are near completion • What are options for the future? • The Cobb reserve report plan has BOEPD increasing by 2 ½ times by end of 2028 • Horizontal drilling program in the San Andres expected to commence Q1 of 2026 • Infield drilling to reduce the patterns from 40 acre spacing to 20 or 10 acre spacing 9
Reducing Costs • The management and field leadership team are on an on - going basis, reviewing areas to identify where we can: enhance maintaining of the field; reduce lift and cap - ex expenditures; and increase production • Using a scientific and analytical approach is expected to reduce workover cost per well to the $150K range from the original estimates of $250K • Implemented an AI automation state - of - the - art software application to reduce costs with operational efficiencies, and ability to leverage current cost structure as new wells are put into production • Reducing G&A costs in 2025 compared to 2024 by: reduced certain salary related costs which started in January; reduced insurance costs by $500K; professional fees in second half of 2025 expected to be at lower annualized runrate of $2.0 million; and there was approximately $1.6 million of non - cash expense in G&A relating to equity settlement costs relating to the acquisition that will not be repeated in 2025. 10
Responsible use of Capital Spend • The Grayburg - Jackson oil field has 550 existing wells that can be utilized to recover proven reserves without new drilling, and hence significant upfront capital spend can be avoided • The team of petroleum engineers and geologists are studying well responses to best determine the most cost and capital effective process to maximize production • EON plans to have a drilling partner for the horizontal drilling program in the San Andres to share the higher upfront investment costs • The company is recycling water both from our field and from an offset producer to minimize the capital needed to operate the oil field, and to avoid the use of our fresh water well, which is our back - up source 11
Industry and Acquisition Strategy Overview • EON is an independent energy company with an acquisition and value creation strategy focused on building a company in the energy industry in North America that complements the experience of our management team and can benefit from our operational expertise and executive oversight • Our focus is to maximize total shareholder value from a diversified portfolio of long - life oil and natural gas properties built through acquisition and through selective development, production enhancement, and other exploitation efforts on its oil and natural gas properties • Our first acquisition and operational entity was a waterflood property located on the Northwest Shelf of the Permian Basin . We are actively exploring opportunities to expand our presence in the Permian Basin 12
The Property
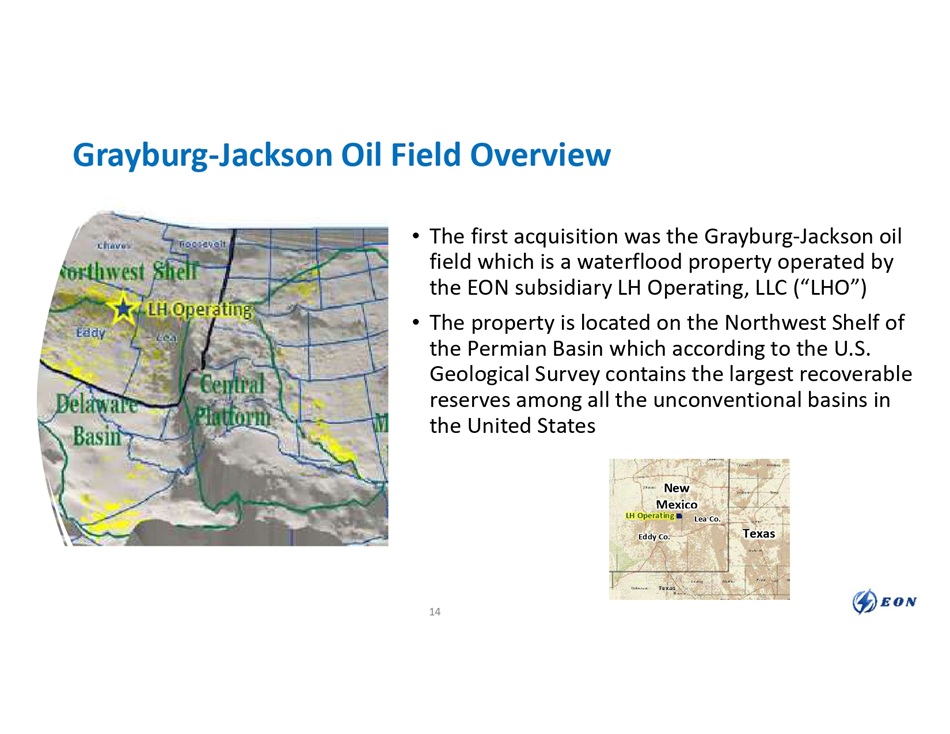
• The first acquisition was the Grayburg - Jackson oil field which is a waterflood property operated by the EON subsidiary LH Operating, LLC (“LHO”) • The property is located on the Northwest Shelf of the Permian Basin which according to the U.S. Geological Survey contains the largest recoverable reserves among all the unconventional basins in the United States Grayburg - Jackson Oil Field Overview Mex New ico Texas Eddy Co. Lea Co. LH Operating 14
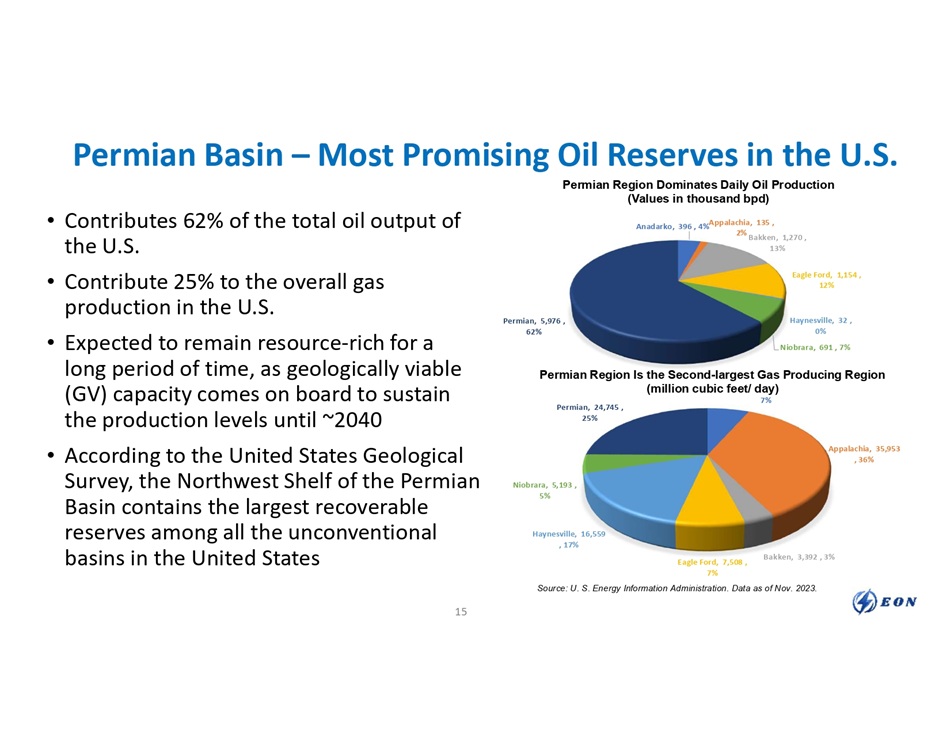
Anadarko, 6,587 , Appalachia, 35,953 , 36% Bakken, 3,392 , 3% Eagle Ford, 7,508 , 7% Haynesville, 16,559 , 17% Niobrara, 5,193 , 5% Permian, 24,745 , 25% Permian Basin – Most Promising Oil Reserves in the U.S. • Contributes 62% of the total oil output of the U.S. • Contribute 25% to the overall gas production in the U.S. • Expected to remain resource - rich for a long period of time, as geologically viable (GV) capacity comes on board to sustain the production levels until ~2040 • According to the United States Geological Survey, the Northwest Shelf of the Permian Basin contains the largest recoverable reserves among all the unconventional basins in the United States Anadarko, 396 , 4% Appalachia, 135 , 2% Bakken, 1,270 , 13% Eagle Ford, 1,154 , 12% Haynesville, 32 , 0% Niobrara, 691 , 7% Permian, 5,976 , 62% Permian Region Dominates Daily Oil Production (Values in thousand bpd) Permian Region Is the Second - largest Gas Producing Region (million cubic feet/ day) 7% Source: U. S. Energy Information Administration. Data as of Nov. 2023. 15
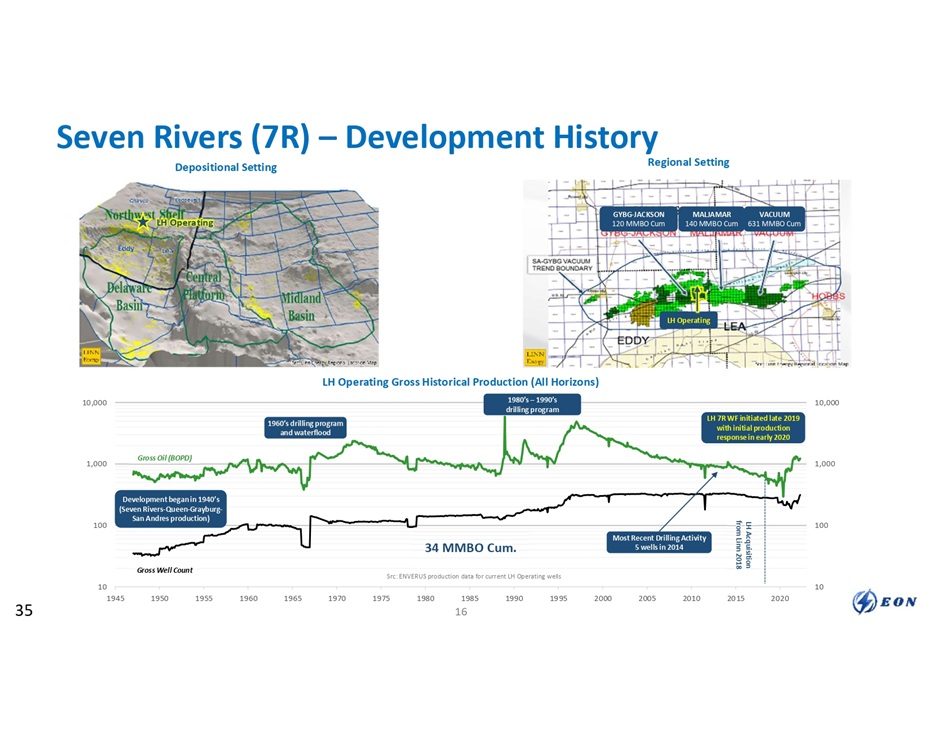
10 100 1,000 10,000 10 100 1,000 10,000 1945 1950 1955 1960 1965 1970 2000 2005 2010 2015 2020 Seven Rivers (7R) – Development History Depositional Setting LH Operating Regional Setting GYBG - JACKSON 120 MMBO Cum MALJAMAR 140 MMBO Cum VACUUM 631 MMBO Cum LH Operating Gross Oil (BOPD) Gross Well Count Development began in 1940’s (Seven Rivers - Queen - Grayburg - San Andres production) 1960’s drilling program and waterflood LH Operating Gross Historical Production (All Horizons) 1980’s – 1990’s drilling program 34 MMBO Cum. Src: ENVERUS production data for current LH Operating wells 1975 1980 1985 1990 1995 Most Recent Drilling Activity 5 wells in 2014 LH 7R WF initiated late 2019 with initial production response in early 2020 LH Acquisition from Linn 2018 35 16
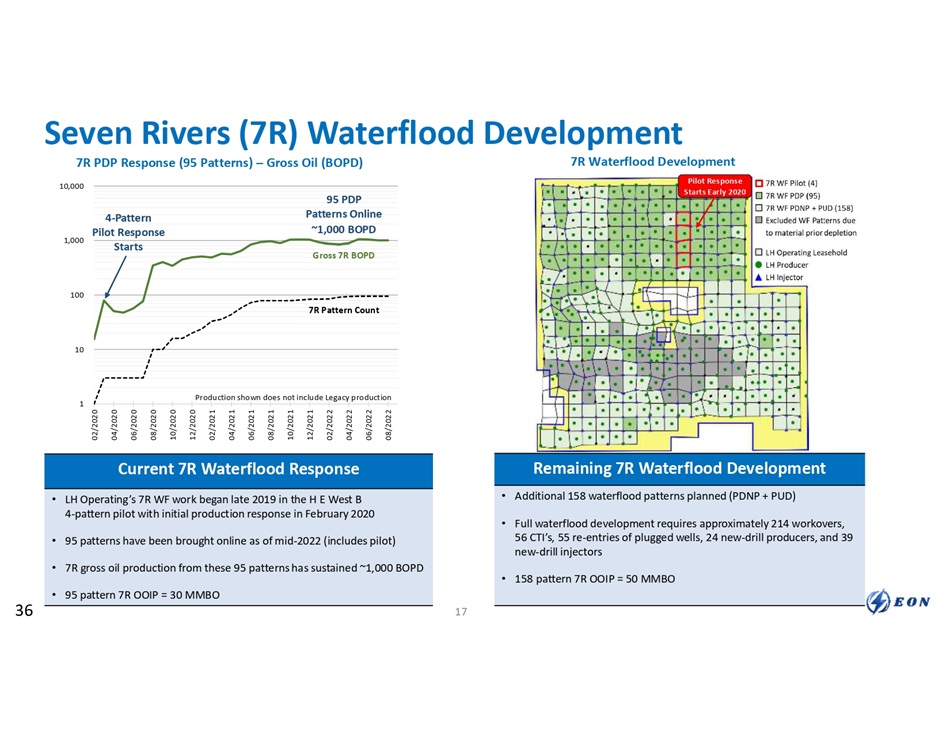
Seven Rivers (7R) Waterflood Development 7R Waterflood Development Pilot Response Starts Early 2020 Current 7R Waterflood Response • LH Operating’s 7R WF work began late 2019 in the H E West B 4 - pattern pilot with initial production response in February 2020 • 95 patterns have been brought online as of mid - 2022 (includes pilot) • 7R gross oil production from these 95 patterns has sustained ~1,000 BOPD • 95 pattern 7R OOIP = 30 MMBO Remaining 7R Waterflood Development • Additional 158 waterflood patterns planned (PDNP + PUD) • Full waterflood development requires approximately 214 workovers, 56 CTI’s, 55 re - entries of plugged wells, 24 new - drill producers, and 39 new - drill injectors • 158 pattern 7R OOIP = 50 MMBO 7R PDP Response (95 Patterns) – Gross Oil (BOPD) 10,000 1 10 100 1,000 02/2020 04/2020 06/2020 08/2020 10/2020 12/2020 02/2021 04/2021 06/2021 08/2021 10/2021 12/2021 02/2022 04/2022 06/2022 08/2022 4 - Pattern Pilot Response Starts 95 PDP Patterns Online ~1,000 BOPD Production shown does not include Legacy production 7R Pattern Count Gross 7R BOPD 36 17
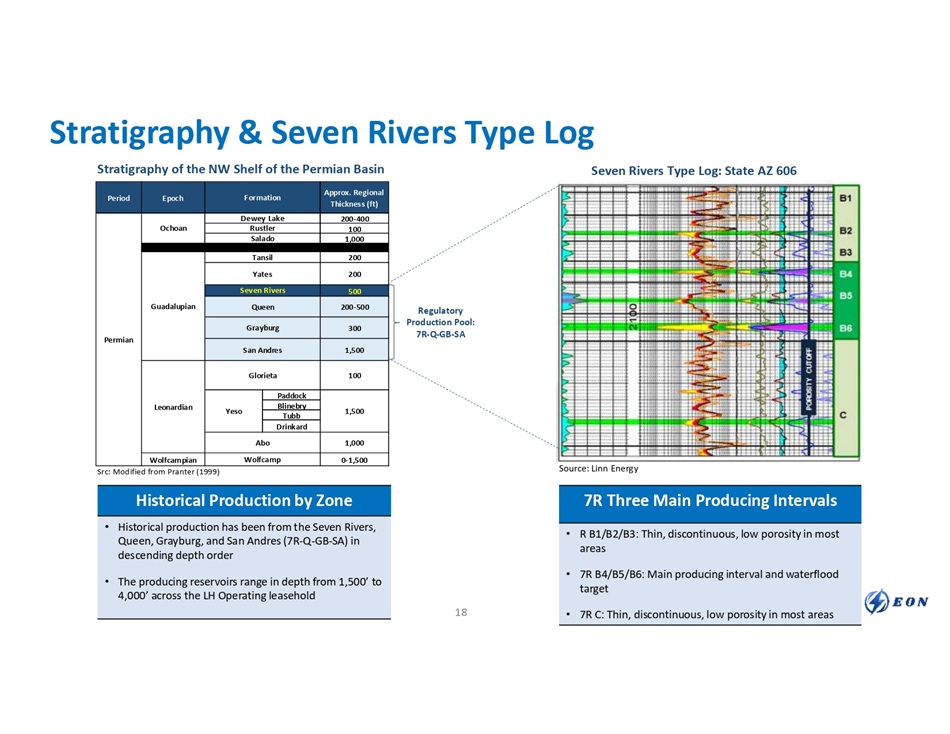
Regulatory Production Pool: 7R - Q - GB - SA Approx. Regional Thickness (ft) Formation Epoch Period 200 - 400 Dewey Lake Ochoan Permian 100 Rustler 1,000 Salado 200 Tansil Guadalupian 200 Yates 500 Seven Rivers 200 - 500 Queen 300 Grayburg 1,500 San Andres 100 Glorieta Leonardian 1,500 Paddock Yeso Blinebry Tubb Drinkard 1,000 Abo 0 - 1,500 Wolfcamp Wolfcampian Historical Production by Zone • Historical production has been from the Seven Rivers, Queen, Grayburg, and San Andres (7R - Q - GB - SA) in descending depth order • The producing reservoirs range in depth from 1,500’ to 4,000’ across the LH Operating leasehold Stratigraphy & Seven Rivers Type Log Source: Linn Energy Src: Modified from Pranter (1999) 7R Three Main Producing Intervals • R B1/B2/B3: Thin, discontinuous, low porosity in most areas • 7R B4/B5/B6: Main producing interval and waterflood target • 7R C: Thin, discontinuous, low porosity in most areas Stratigraphy of the NW Shelf of the Permian Basin Seven Rivers Type Log: State AZ 606 18
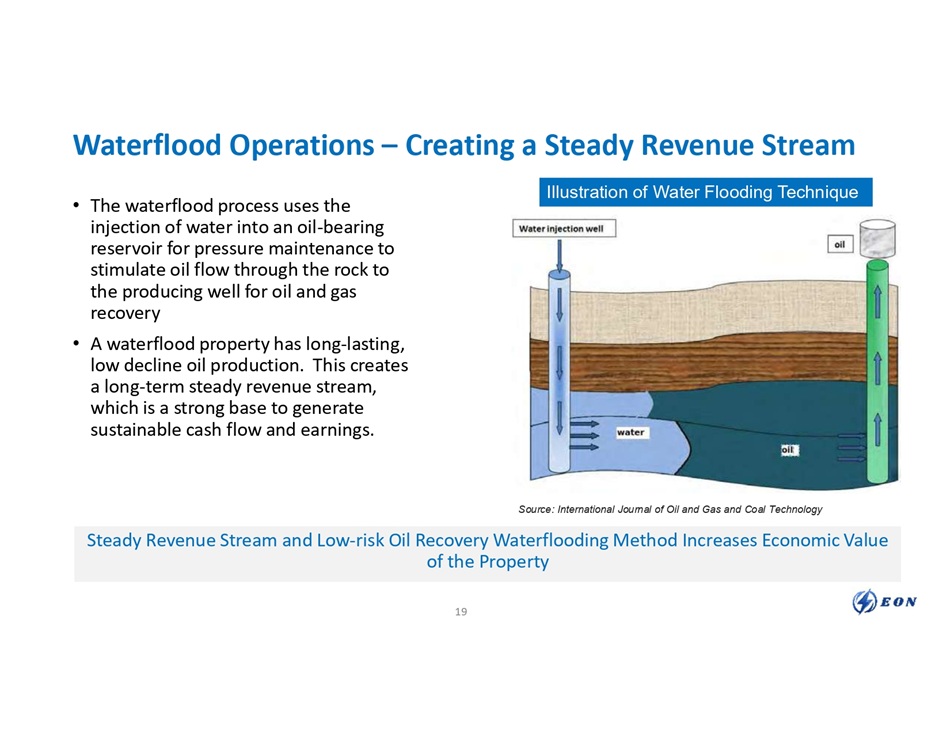
Waterflood Operations – Creating a Steady Revenue Stream • The waterflood process uses the injection of water into an oil - bearing reservoir for pressure maintenance to stimulate oil flow through the rock to the producing well for oil and gas recovery • A waterflood property has long - lasting, low decline oil production. This creates a long - term steady revenue stream, which is a strong base to generate sustainable cash flow and earnings. Illustration of Water Flooding Technique Source: International Journal of Oil and Gas and Coal Technology Steady Revenue Stream and Low - risk Oil Recovery Waterflooding Method Increases Economic Value of the Property Steady Revenue Stream and Low - risk Oil Recovery Waterflooding Method Increases Economic Value of the Property 19
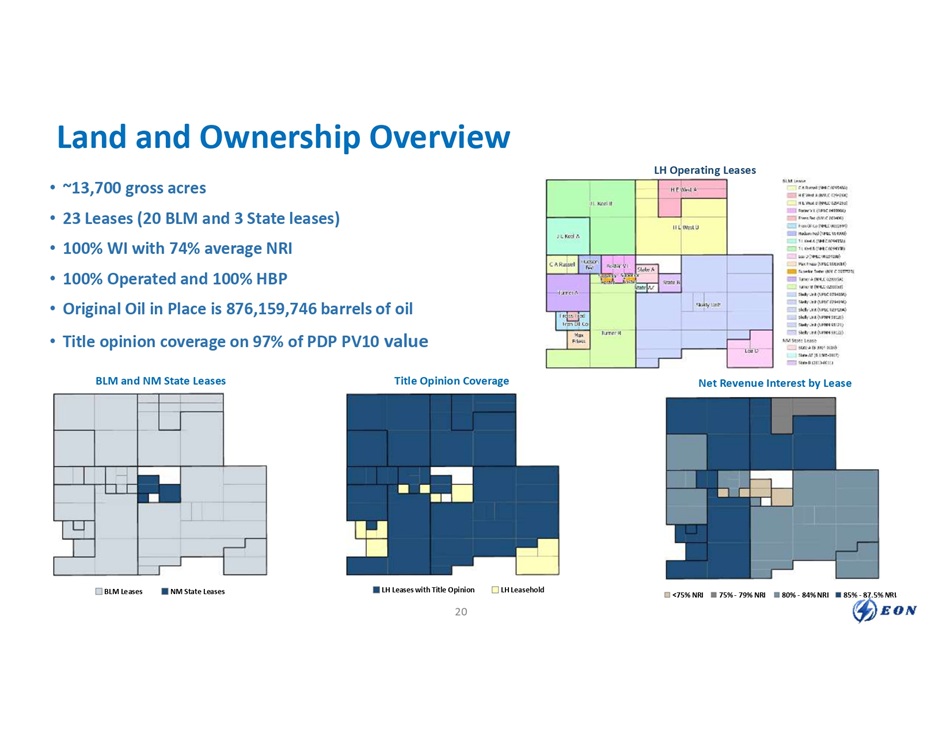
• ~13,700 gross acres • 23 Leases (20 BLM and 3 State leases) • 100% WI with 74% average NRI • 100% Operated and 100% HBP • Original Oil in Place is 876,159,746 barrels of oil • Title opinion coverage on 97% of PDP PV10 value BLM and NM State Leases Title Opinion Coverage BLM Leases NM State Leases LH Leases with Title Opinion LH Leasehold <75% NRI 75% - 79% NRI 85% - 87.5% NRI 80% - 84% NRI Net Revenue Interest by Lease LH Operating Leases Land and Ownership Overview 20
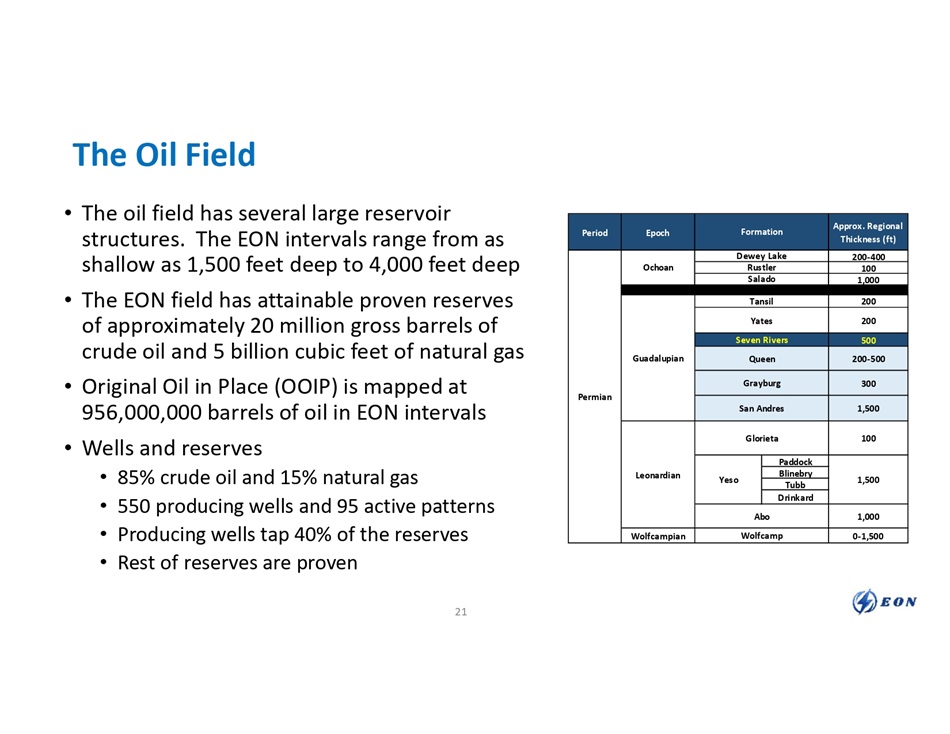
The Oil Field • The oil field has several large reservoir structures. The EON intervals range from as shallow as 1,500 feet deep to 4,000 feet deep • The EON field has attainable proven reserves of approximately 20 million gross barrels of crude oil and 5 billion cubic feet of natural gas • Original Oil in Place (OOIP) is mapped at 956,000,000 barrels of oil in EON intervals • Wells and reserves • 85% crude oil and 15% natural gas • 550 producing wells and 95 active patterns • Producing wells tap 40% of the reserves • Rest of reserves are proven Approx. Regional Thickness (ft) Formation Epoch Period 200 - 400 Dewey Lake Ochoan Permian 100 Rustler 1,000 Salado 200 Tansil Guadalupian 200 Yates 500 Seven Rivers 200 - 500 Queen 300 Grayburg 1,500 San Andres 100 Glorieta Leonardian 1,500 Paddock Yeso Blinebry Tubb Drinkard 1,000 Abo 0 - 1,500 Wolfcamp Wolfcampian 21
Financials
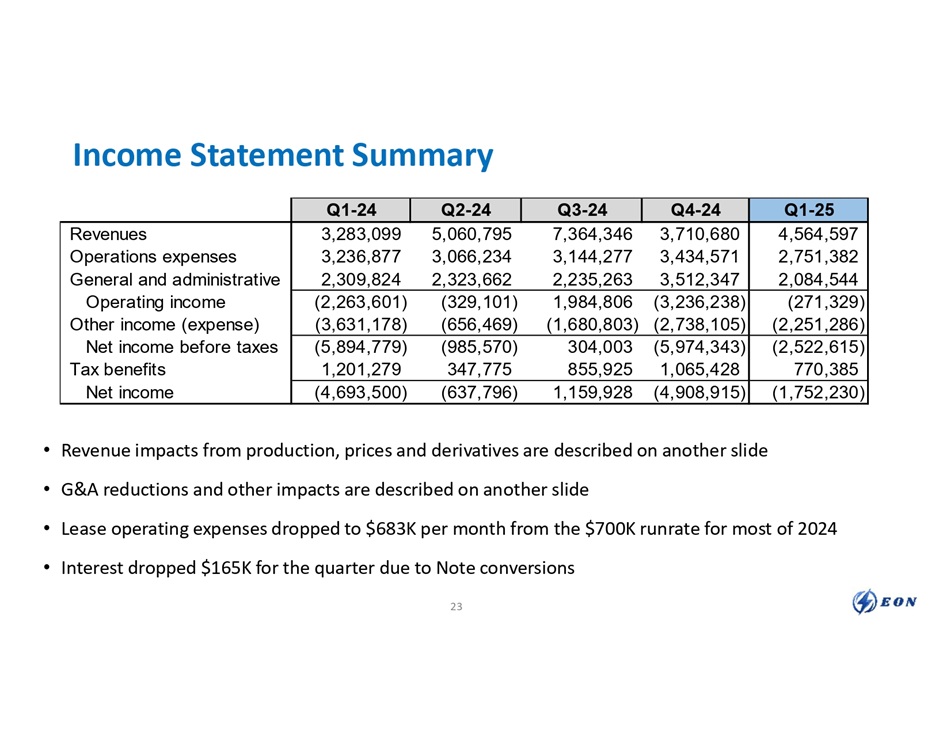
Income Statement Summary • Revenue impacts from production, prices and derivatives are described on another slide • G&A reductions and other impacts are described on another slide • Lease operating expenses dropped to $683K per month from the $700K runrate for most of 2024 • Interest dropped $165K for the quarter due to Note conversions 23 Q1 - 25 Q4 - 24 Q3 - 24 Q2 - 24 Q1 - 24 4,564,597 3,710,680 7,364,346 5,060,795 3,283,099 Revenues 2,751,382 3,434,571 3,144,277 3,066,234 3,236,877 Operations expenses 2,084,544 3,512,347 2,235,263 2,323,662 2,309,824 General and administrative (271,329) (3,236,238) 1,984,806 (329,101) (2,263,601) Operating income (2,251,286) (2,738,105) (1,680,803) (656,469) (3,631,178) Other income (expense) (2,522,615) (5,974,343) 304,003 (985,570) (5,894,779) Net income before taxes 770,385 1,065,428 855,925 347,775 1,201,279 Tax benefits (1,752,230) (4,908,915) 1,159,928 (637,796) (4,693,500) Net income
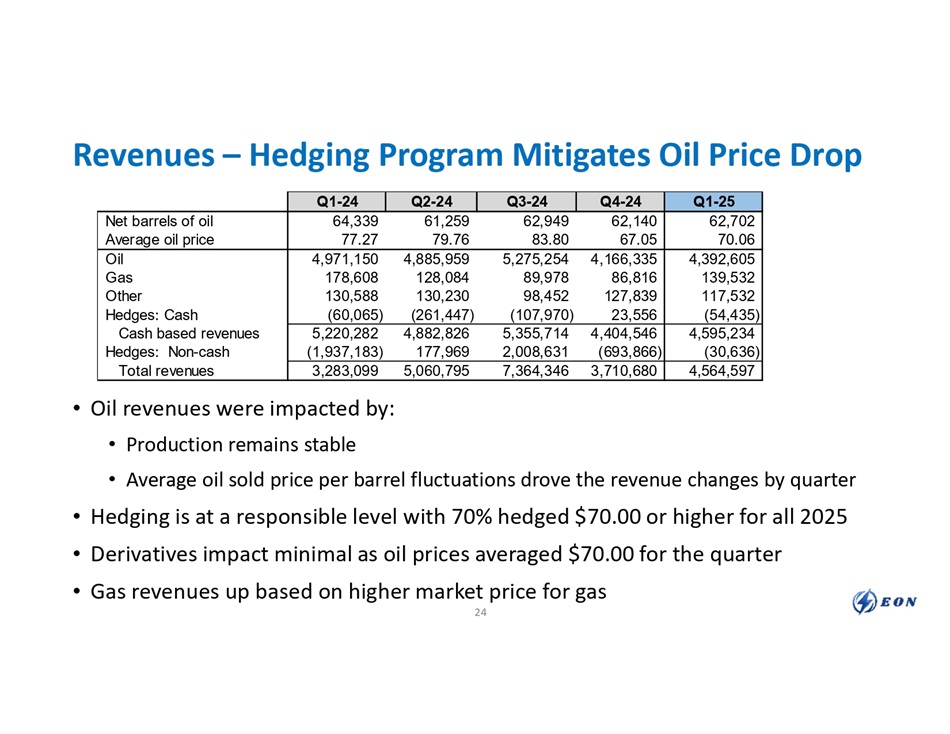
Revenues – Hedging Program Mitigates Oil Price Drop • Oil revenues were impacted by: • Production remains stable • Average oil sold price per barrel fluctuations drove the revenue changes by quarter • Hedging is at a responsible level with 70% hedged $70.00 or higher for all 2025 • Derivatives impact minimal as oil prices averaged $70.00 for the quarter • Gas revenues up based on higher market price for gas Q1 - 25 Q4 - 24 Q3 - 24 Q2 - 24 Q1 - 24 62,702 62,140 62,949 61,259 64,339 Net barrels of oil 70.06 67.05 83.80 79.76 77.27 Average oil price 4,392,605 4,166,335 5,275,254 4,885,959 4,971,150 Oil 139,532 86,816 89,978 128,084 178,608 Gas 117,532 127,839 98,452 130,230 130,588 Other (54,435) 23,556 (107,970) (261,447) (60,065) Hedges: Cash 4,595,234 4,404,546 5,355,714 4,882,826 5,220,282 Cash based revenues (30,636) (693,866) 2,008,631 177,969 (1,937,183) Hedges: Non - cash 4,564,597 3,710,680 7,364,346 5,060,795 3,283,099 Total revenues 24
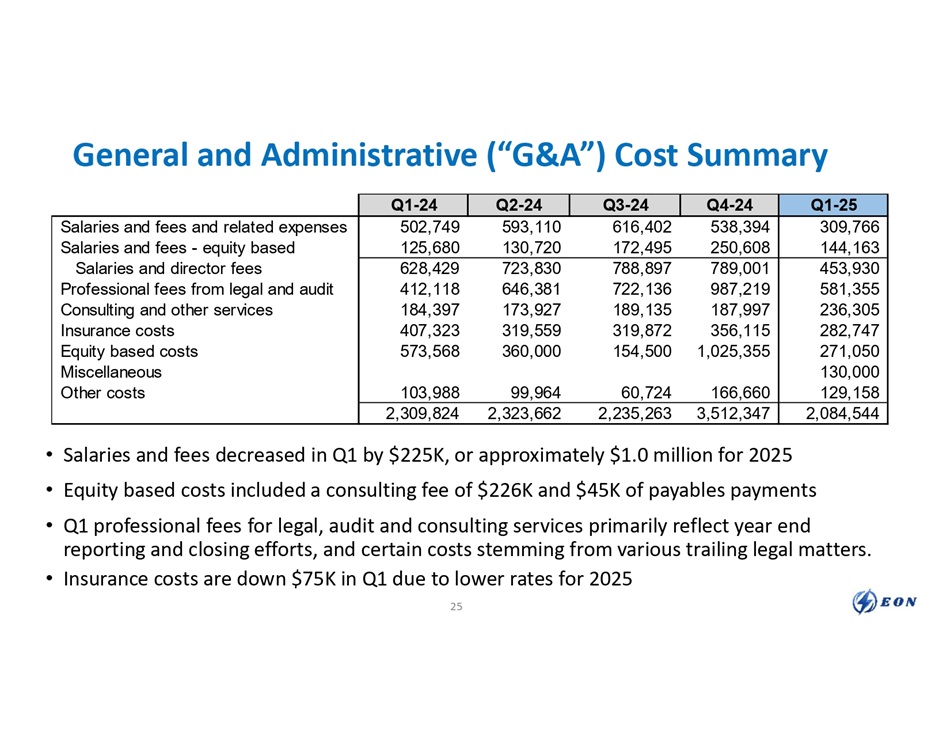
General and Administrative (“G&A”) Cost Summary • Salaries and fees decreased in Q1 by $225K, or approximately $1.0 million for 2025 • Equity based costs included a consulting fee of $226K and $45K of payables payments • Q1 professional fees for legal, audit and consulting services primarily reflect year end reporting and closing efforts, and certain costs stemming from various trailing legal matters. • Insurance costs are down $75K in Q1 due to lower rates for 2025 25 Q1 - 25 Q4 - 24 Q3 - 24 Q2 - 24 Q1 - 24 309,766 538,394 616,402 593,110 502,749 Salaries and fees and related expenses 144,163 250,608 172,495 130,720 125,680 Salaries and fees - equity based 453,930 789,001 788,897 723,830 628,429 Salaries and director fees 581,355 987,219 722,136 646,381 412,118 Professional fees from legal and audit 236,305 187,997 189,135 173,927 184,397 Consulting and other services 282,747 356,115 319,872 319,559 407,323 Insurance costs 271,050 1,025,355 154,500 360,000 573,568 Equity based costs 130,000 Miscellaneous 129,158 166,660 60,724 99,964 103,988 Other costs 2,084,544 3,512,347 2,235,263 2,323,662 2,309,824
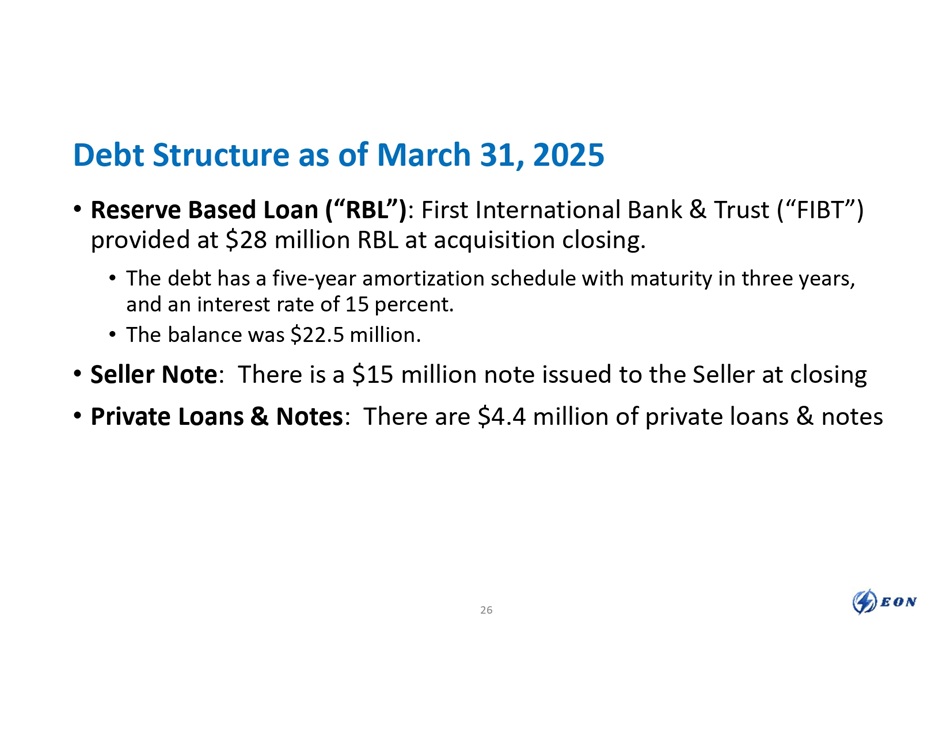
Debt Structure as of March 31, 2025 • Reserve Based Loan (“RBL”) : First International Bank & Trust (“FIBT”) provided at $28 million RBL at acquisition closing. • The debt has a five - year amortization schedule with maturity in three years, and an interest rate of 15 percent. • The balance was $22.5 million. • Seller Note : There is a $15 million note issued to the Seller at closing • Private Loans & Notes : There are $4.4 million of private loans & notes 26
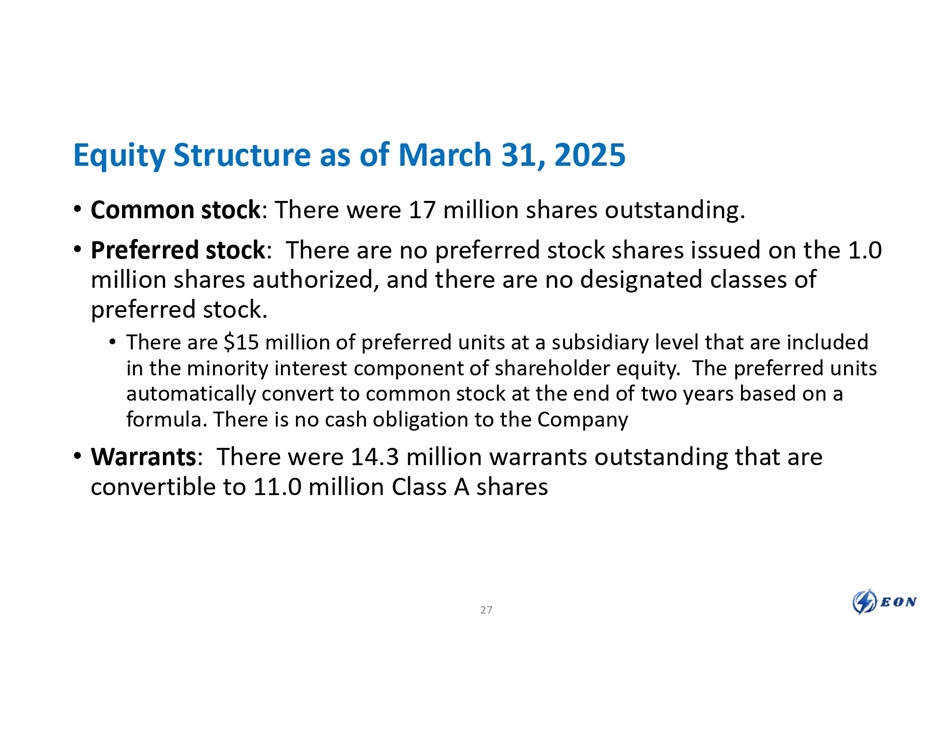
Equity Structure as of March 31, 2025 • Common stock : There were 17 million shares outstanding. • Preferred stock : There are no preferred stock shares issued on the 1.0 million shares authorized, and there are no designated classes of preferred stock. • There are $15 million of preferred units at a subsidiary level that are included in the minority interest component of shareholder equity. The preferred units automatically convert to common stock at the end of two years based on a formula. There is no cash obligation to the Company • Warrants : There were 14.3 million warrants outstanding that are convertible to 11.0 million Class A shares 27
Final Words
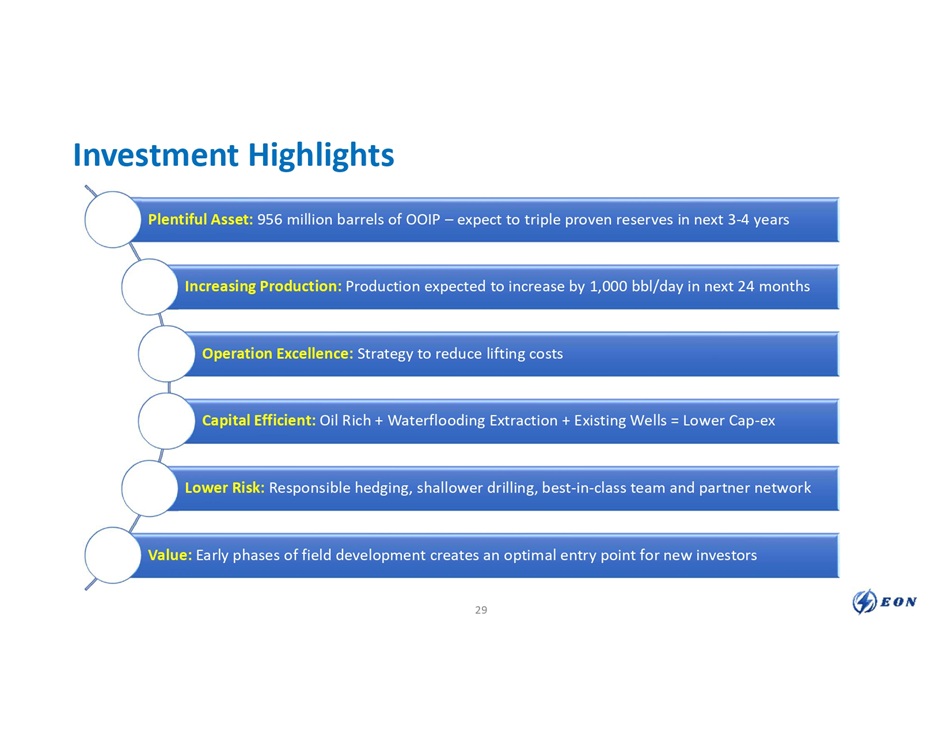
Investment Highlights Plentiful Asset: 956 million barrels of OOIP – expect to triple proven reserves in next 3 - 4 years Increasing Production: Production expected to increase by 1,000 bbl/day in next 24 months Operation Excellence: Strategy to reduce lifting costs Capital Efficient: Oil Rich + Waterflooding Extraction + Existing Wells = Lower Cap - ex Lower Risk: Responsible hedging, shallower drilling, best - in - class team and partner network Value: Early phases of field development creates an optimal entry point for new investors 29
Thank you for your interest in EON