
FBP 8-K
First Bancorp /Pr/ (FBP)
8-K
2020-02-27
For: 2020-02-27
View Original
Added on
April 07, 2026
UNITED STATES
SECURITIES AND EXCHANGE COMMISSION
Washington, DC 20549
Form 8-K
CURRENT REPORT
Pursuant to Section 13 or 15(d) of
the Securities Exchange Act of 1934
Date of Report (Date of Earliest Event Reported): February 27, 2020
(Exact Name of Registrant as Specified in its Charter)
|
|
|
|
|
(State or Other Jurisdiction of Incorporation)
|
(Commission File Number)
|
(I.R.S. Employer Identification No.)
|
|
|
||
|
(Address of Principal Executive Offices)
|
(Zip Code)
|
(787 ) 729-8200
(Registrant’s Telephone Number, including Area Code)
Not applicable
(Former name or former address, if changed since last report)
Check the appropriate box below if the Form 8-K filing is intended to simultaneously satisfy the filing obligation of the registrant under any of the following provisions:
|
Written communications pursuant to Rule 425 under the Securities Act (17 CFR 230.425)
|
|
Soliciting material pursuant to Rule 14a-12 under the Exchange Act (17 CFR 240.14a-12)
|
|
Pre-commencement communications pursuant to Rule 14d-2(b) under the Exchange Act (17 CFR 240.14d-2(b))
|
|
Pre-commencement communications pursuant to Rule 13e-4(c) under the Exchange Act (17 CFR 240.13e-4(c))
|
Securities registered pursuant to Section 12(b) of the Act:
|
Title of each class
|
Trading Symbol(s)
|
Name of each exchange on which registered
|
|
|
|
|
Indicate by check mark whether the registrant is an emerging growth company as defined in Rule 405 of the Securities Act of 1933 (§230.405 of this chapter) or Rule 12b-2 of
the Securities Exchange Act of 1934 (§240.12b-2 of this chapter).
Emerging growth company ☐
If an emerging growth company, indicate by check mark if the registrant has elected not to use the extended transition period for complying with any new or revised
financial accounting standards provided pursuant to Section 13(a) of the Exchange Act. ☐
| Item 2.02 |
Results of Operations and Financial Condition.
|
Information about First BanCorp's financial condition as of December 31, 2019 is incorporated by reference herein from the investor presentation attached hereto as
Exhibit 99.1.
| Item 7.01. |
Regulation FD Disclosure.
|
The executive officers of First BanCorp are using the materials filed as Exhibit 99.1 hereto, in whole or in part, in meetings with investors and analysts. A copy of the
investor presentation is attached hereto as Exhibit 99.1.
The information in this Item 7.01 of this Form 8-K shall not be deemed “filed” for purposes of Section 18 of the Securities Exchange Act of 1934, as amended (the
“Exchange Act”), or otherwise subject to the liabilities of that section, nor shall it be deemed incorporated by reference in any filing under the Securities Act of 1933, as amended, or the Exchange Act, except as expressly set forth by specific
reference in such a filing.
| Item 9.01 |
Financial Statements and Exhibits
|
| (d) |
Exhibits
|
|
Exhibit
|
Description of Exhibit
|
|
|
99.1
|
First BanCorp Investor Presentation dated February 2020.
|
|
|
|
||
|
104
|
Cover Page Interactive Data File (embedded within the Inline XBRL document).
|
2
Exhibit Index
|
Exhibit
|
Description of Exhibit
|
|
|
First BanCorp Investor Presentation dated February 2020.
|
||
|
104
|
Cover Page Interactive Data File (embedded within the Inline XBRL document).
|
SIGNATURE
Pursuant to the requirements of the Securities Exchange Act of 1934, the registrant has duly caused this report to be signed on its behalf by the
undersigned hereunto duly authorized.
|
Date: February 27, 2020
|
First BanCorp.
|
||
|
By:
|
/s/ Orlando Berges
|
||
|
Name:
|
Orlando Berges
|
||
|
Title:
|
EVP and Chief Financial Officer
|
||
3
Exhibit 99.1

Investor PresentationFebruary 2020

Forward-Looking Statements This presentation may contain “forward-looking statements” concerning First
BanCorp.’s (the “Corporation”) future economic, operational and financial performance. “Forward-looking statements” include, without limitation, statements relating to the impact the Corporation expects its proposed acquisition of Banco
Santander Puerto Rico to have on the combined entity’s operations, financial condition, and financial results, and the Corporation’s expectations about its ability to successfully complete the transaction and integrate the combined businesses
and the amount of cost savings and overall operational efficiencies the Corporation expects to realize as a result of the proposed acquisition. The words or phrases “expect,” “anticipate,” “intend,” “look forward,” “should,” “would,” “believes”
and similar expressions are meant to identify “forward-looking statements” within the meaning of Section 27A of the Securities Act of 1933, as amended, and Section 21E of the Securities Exchange Act of 1934, as amended, and are subject to the
safe harbor created by such sections. The Corporation cautions readers not to place undue reliance on any such “forward-looking statements,” which speak only as of the date made, and advises readers that various factors, including, but not
limited to, the following could cause actual results to differ materially from those expressed in, or implied by such forward-looking statements: the possibility that the proposed acquisition does not close when expected or at all or because
required regulatory or other approvals (including bank regulatory approvals or antitrust clearances) and other conditions to closing are not received or satisfied on a timely basis or at all the failure to close for any other reason; that the
businesses of the Corporation and Banco Santander Puerto Rico will not be integrated successfully; that the cost savings and any synergies from the proposed acquisition may not be fully realized or may take longer to realize than expected;
disruption from the proposed acquisition making it more difficult to maintain relationships with employees, customers or other parties with whom the Corporation or Banco Santander Puerto Rico have business relationships; diversion of management
time on merger-related issues; the reaction to the transaction of the Corporation’s or Banco Santander Puerto Rico’s customers, employees and counterparties and other factors, many of which are beyond the control of the Corporation and Banco
Santander Puerto Rico; the actual pace and magnitude of economic recovery in the regions impacted by the two hurricanes that affected the Corporation’s service areas during the third quarter of 2017 compared to management’s current views on the
economic recovery; uncertainties about how and when rebuilding will take place in the regions affected by the recent storms, including the rebuilding of the public infrastructure, such as Puerto Rico’s power grid, what level of government,
private or philanthropic funds will be invested in the affected communities; how many dislocated individuals will return to their homes in both the short- and long-term, and what other demographic changes will take place; uncertainty as to the
ultimate outcomes of actions taken, or those that may have to be taken, by the Puerto Rico government, or the oversight board established by the Puerto Rico Oversight, Management, and Economic Stability Act (PROMESA) to address Puerto Rico’s
financial problems, including the filing of a form of bankruptcy under Title III of PROMESA that provides a court debt restructuring process similar to U.S. bankruptcy protection; the ability of the Puerto Rico government or any of its public
corporations or other instrumentalities to repay its respective debt obligations, including the effect of payment defaults on the Puerto Rico government general obligations, bonds of the Government Development Bank for Puerto Rico and certain
bonds of government public corporations, and recent and any future downgrades of the long-term and short-term debt ratings of the Puerto Rico government, which could exacerbate Puerto Rico’s adverse economic conditions and, in turn, further
adversely impact the Corporation; a decrease in demand for the Corporation’s products and services and lower revenues and earnings because of the continued recession in Puerto Rico; uncertainty as to the availability of certain funding sources,
such as brokered CDs; the Corporation’s reliance on brokered CDs to fund operations and provide liquidity; the weakness of the real estate markets and of the consumer and commercial sectors and their impact on the credit quality of the
Corporation’s loans and other assets, which have contributed and may continue to contribute to, among other things, high levels of non-performing assets, charge-offs and provisions for loan and lease losses, and may subject the Corporation to
further risk from loan defaults and foreclosures; a decrease in demand for the Corporation’s products and services and lower revenues and earnings because of the continued recession in Puerto Rico; uncertainty as to the availability of certain
funding sources, such as brokered CDs; the Corporation’s reliance on brokered CDs to fund operations and provide liquidity; the weakness of the real estate markets and of the consumer and commercial sectors and their impact on the credit
quality of the Corporation’s loans and other assets, which have contributed and may continue to contribute to, among other things, high levels of non-performing assets, charge-offs and provisions for loan and lease losses, and may subject the
Corporation to further risk from loan defaults and foreclosures; the ability of FirstBank Puerto Rico (“FirstBank”) to realize the benefits of its deferred tax assets subject to the remaining valuation allowance; adverse changes in general
economic conditions in Puerto Rico, the U.S., and the U.S. Virgin Islands and British Virgin Islands, including the interest rate environment, market liquidity, housing absorption rates, real estate prices, and disruptions in the U.S. capital
markets, which reduced interest margins and affected funding sources, and has affected demand for all of the Corporation’s products and services and reduced the Corporation’s revenues and earnings, and the value of the Corporation’s assets, and
may continue to have these effects; an adverse change in the Corporation’s ability to attract new clients and retain existing ones; the risk that additional portions of the unrealized losses in the Corporation’s investment portfolio are
determined to be other-than-temporary, including additional impairments on the Puerto Rico government’s obligations; uncertainty about regulatory and legislative changes for financial services companies in Puerto Rico, the U.S., and the U.S.
and British Virgin Islands, which could affect the Corporation’s financial condition or performance and could cause the Corporation’s actual results for future periods to differ materially from prior results and anticipated or projected
results; changes in the fiscal and monetary policies and regulations of the U.S. federal government and the Puerto Rico and other governments, including those determined by the Federal Reserve Board, the New York Fed, the Federal Deposit
Insurance Corporation (“FDIC”), government-sponsored housing agencies, and regulators in Puerto Rico and the U.S. and British Virgin Islands; the risk of possible failure or circumvention of controls and procedures and the risk that the
Corporation’s risk management policies may not be adequate; the risk that the FDIC may increase the deposit insurance premium and/or require special assessments to replenish its insurance fund, causing an additional increase in the
Corporation’s non-interest expenses; the impact on the Corporation’s results of operations and financial condition of acquisitions and dispositions; a need to recognize additional impairments on the Corporation’s financial instruments, goodwill
or other intangible assets relating to acquisitions; the risk that downgrades in the credit ratings of the Corporation’s long-term senior debt will adversely affect the Corporation’s ability to access necessary external funds; the impact on the
Corporation’s businesses, business practices and results of operations of a potential higher interest rate environment; uncertainty as to whether FirstBank will be able to satisfy its regulators regarding, among other things, its asset quality,
liquidity plans, maintenance of capital levels and compliance with applicable laws, regulations and related requirements; and general competitive factors and industry consolidation. The Corporation does not undertake, and specifically disclaims
any obligation, to update any “forward-looking statements” to reflect occurrences or unanticipated events or circumstances after the date of such statements, except as required by the federal securities laws. 2
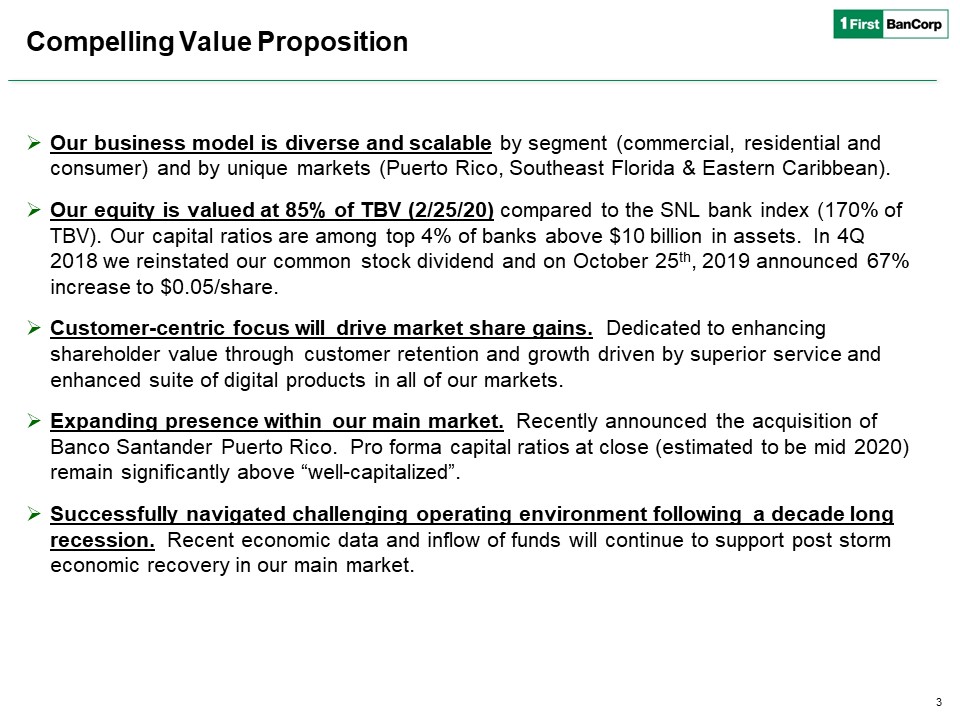
Compelling Value Proposition Our business model is diverse and scalable by segment (commercial,
residential and consumer) and by unique markets (Puerto Rico, Southeast Florida & Eastern Caribbean). Our equity is valued at 85% of TBV (2/25/20) compared to the SNL bank index (170% of TBV). Our capital ratios are among top 4% of banks
above $10 billion in assets. In 4Q 2018 we reinstated our common stock dividend and on October 25th, 2019 announced 67% increase to $0.05/share.Customer-centric focus will drive market share gains. Dedicated to enhancing shareholder value
through customer retention and growth driven by superior service and enhanced suite of digital products in all of our markets.Expanding presence within our main market. Recently announced the acquisition of Banco Santander Puerto Rico. Pro
forma capital ratios at close (estimated to be mid 2020) remain significantly above “well-capitalized”. Successfully navigated challenging operating environment following a decade long recession. Recent economic data and inflow of funds will
continue to support post storm economic recovery in our main market. 3
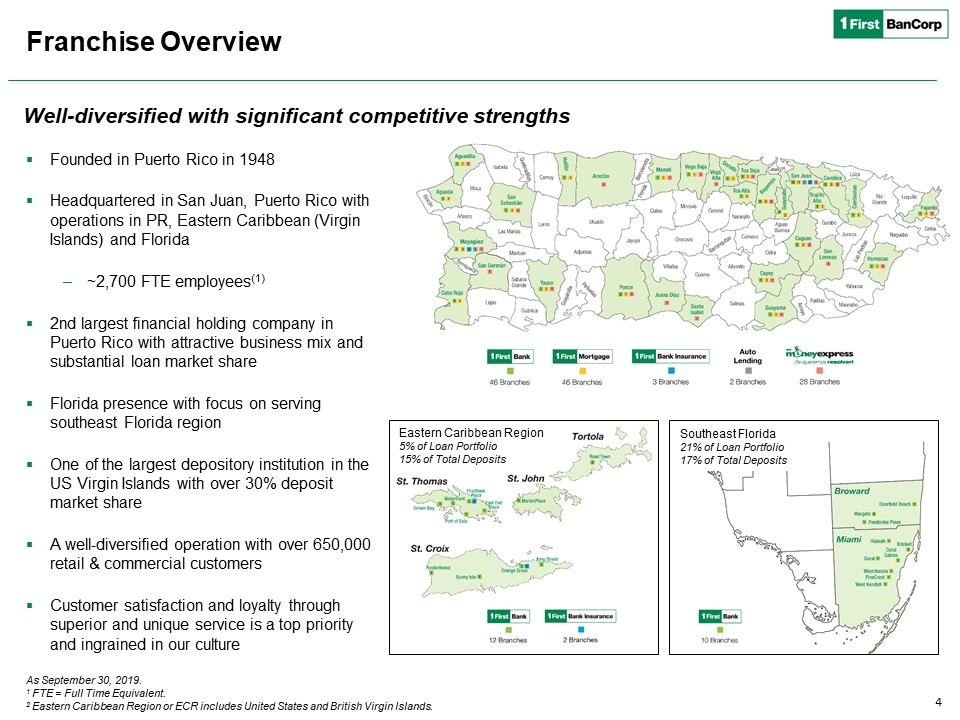
Franchise Overview Founded in Puerto Rico in 1948 Headquartered in San Juan, Puerto Rico with operations
in PR, Eastern Caribbean (Virgin Islands) and Florida~2,700 FTE employees(1) 2nd largest financial holding company in Puerto Rico with attractive business mix and substantial loan market shareFlorida presence with focus on serving southeast
Florida regionOne of the largest depository institution in the US Virgin Islands with over 30% deposit market shareA well-diversified operation with over 650,000 retail & commercial customersCustomer satisfaction and loyalty through
superior and unique service is a top priority and ingrained in our culture As September 30, 2019.1 FTE = Full Time Equivalent.2 Eastern Caribbean Region or ECR includes United States and British Virgin Islands. Well-diversified with
significant competitive strengths Eastern Caribbean Region5% of Loan Portfolio15% of Total Deposits Southeast Florida21% of Loan Portfolio17% of Total Deposits 4
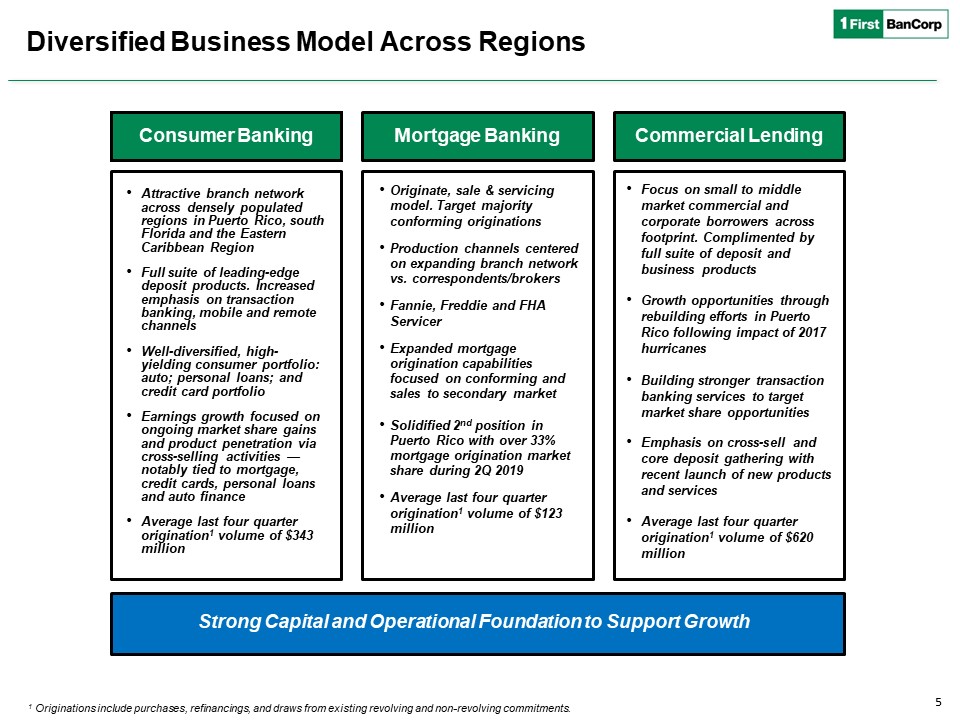
Diversified Business Model Across Regions Strong Capital and Operational Foundation to Support Growth 1
Originations include purchases, refinancings, and draws from existing revolving and non-revolving commitments. Consumer Banking Attractive branch network across densely populated regions in Puerto Rico, south Florida and the Eastern
Caribbean Region Full suite of leading-edge deposit products. Increased emphasis on transaction banking, mobile and remote channelsWell-diversified, high-yielding consumer portfolio: auto; personal loans; and credit card portfolioEarnings
growth focused on ongoing market share gains and product penetration via cross-selling activities —notably tied to mortgage, credit cards, personal loans and auto financeAverage last four quarter origination1 volume of $343 million Mortgage
Banking Originate, sale & servicing model. Target majority conforming originationsProduction channels centered on expanding branch network vs. correspondents/brokersFannie, Freddie and FHA ServicerExpanded mortgage origination
capabilities focused on conforming and sales to secondary market Solidified 2nd position in Puerto Rico with over 33% mortgage origination market share during 2Q 2019Average last four quarter origination1 volume of $123 million Commercial
Lending Focus on small to middle market commercial and corporate borrowers across footprint. Complimented by full suite of deposit and business productsGrowth opportunities through rebuilding efforts in Puerto Rico following impact of 2017
hurricanesBuilding stronger transaction banking services to target market share opportunitiesEmphasis on cross-sell and core deposit gathering with recent launch of new products and servicesAverage last four quarter origination1 volume of $620
million 5
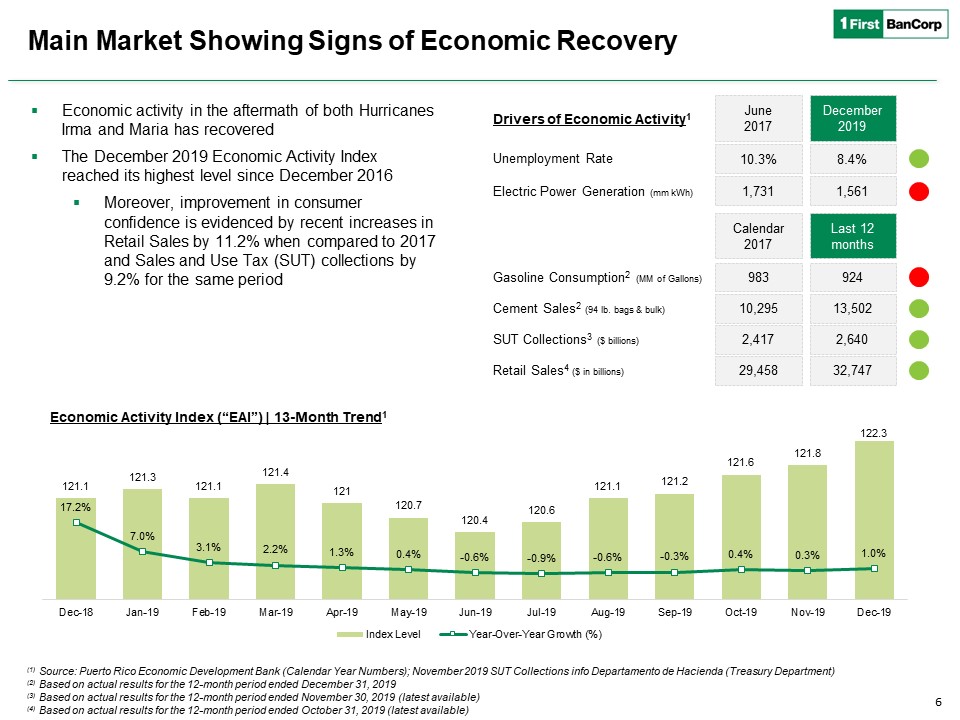
Main Market Showing Signs of Economic Recovery 6 Economic activity in the aftermath of both Hurricanes
Irma and Maria has recoveredThe December 2019 Economic Activity Index reached its highest level since December 2016Moreover, improvement in consumer confidence is evidenced by recent increases in Retail Sales by 11.2% when compared to 2017 and
Sales and Use Tax (SUT) collections by 9.2% for the same period Drivers of Economic Activity1 Economic Activity Index (“EAI”) | 13-Month Trend1 (1) Source: Puerto Rico Economic Development Bank (Calendar Year Numbers); November 2019 SUT
Collections info Departamento de Hacienda (Treasury Department)(2) Based on actual results for the 12-month period ended December 31, 2019(3) Based on actual results for the 12-month period ended November 30, 2019 (latest available)(4) Based on
actual results for the 12-month period ended October 31, 2019 (latest available) Unemployment Rate 10.3% June 2017 December2019 8.4% Electric Power Generation (mm kWh) 1,731 1,561 Gasoline Consumption2 (MM of
Gallons) 983 924 Calendar 2017 Cement Sales2 (94 lb. bags & bulk) 10,295 13,502 Last 12 months SUT Collections3 ($ billions) 2,417 2,640 Retail Sales4 ($ in billions) 29,458 32,747
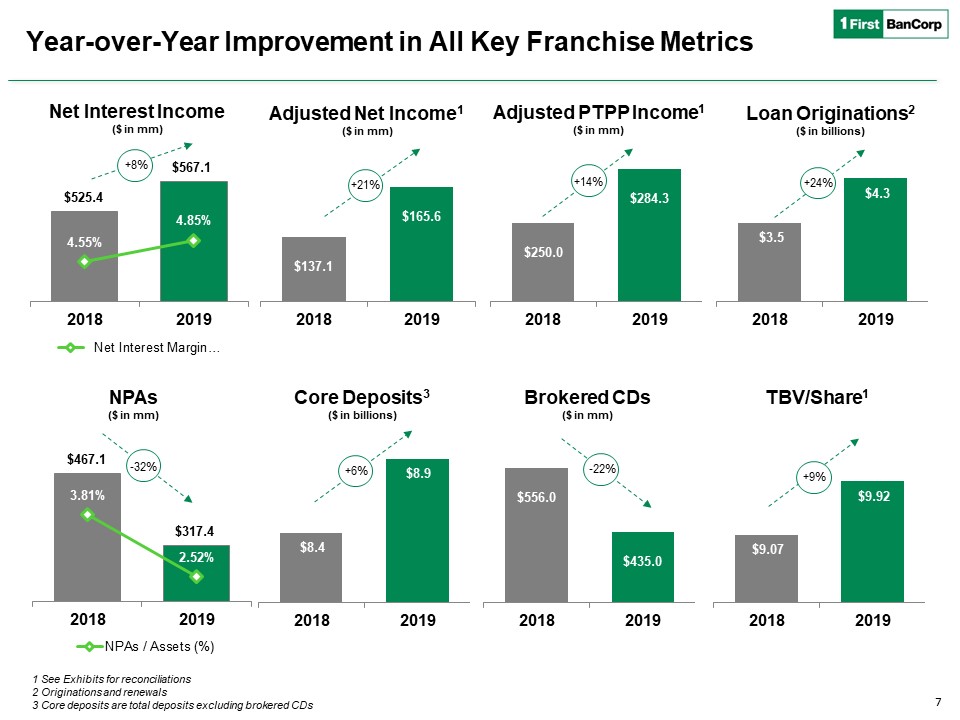
Year-over-Year Improvement in All Key Franchise Metrics 7 Adjusted Net Income1($ in mm) Net Interest
Income($ in mm) Adjusted PTPP Income1($ in mm) +21% +14% Loan Originations2($ in billions) +24% Core Deposits3($ in billions) +8% NPAs($ in mm) -32% TBV/Share1 +9% Brokered CDs($ in mm) -22% 1 See Exhibits for
reconciliations2 Originations and renewals3 Core deposits are total deposits excluding brokered CDs +6%
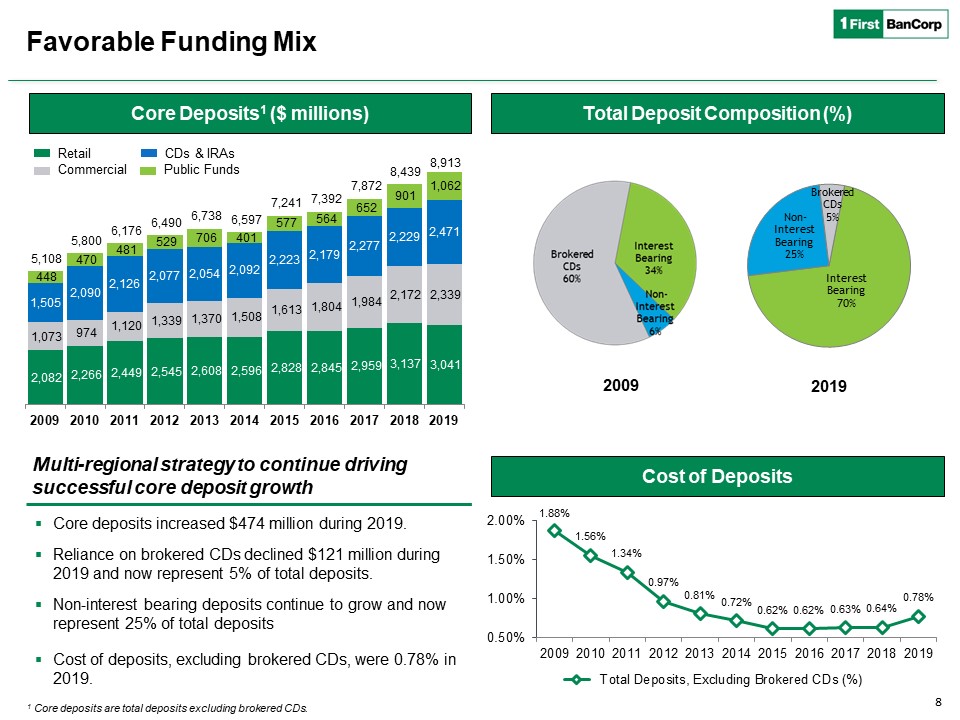
1 Core deposits are total deposits excluding brokered CDs. Favorable Funding Mix Total Deposit
Composition (%) Core Deposits1 ($ millions) Core deposits increased $474 million during 2019.Reliance on brokered CDs declined $121 million during 2019 and now represent 5% of total deposits.Non-interest bearing deposits continue to grow and
now represent 25% of total deposits Cost of deposits, excluding brokered CDs, were 0.78% in 2019. Multi-regional strategy to continue driving successful core deposit growth 2009 2019 Cost of Deposits Retail Commercial CDs &
IRAs Public Funds 8
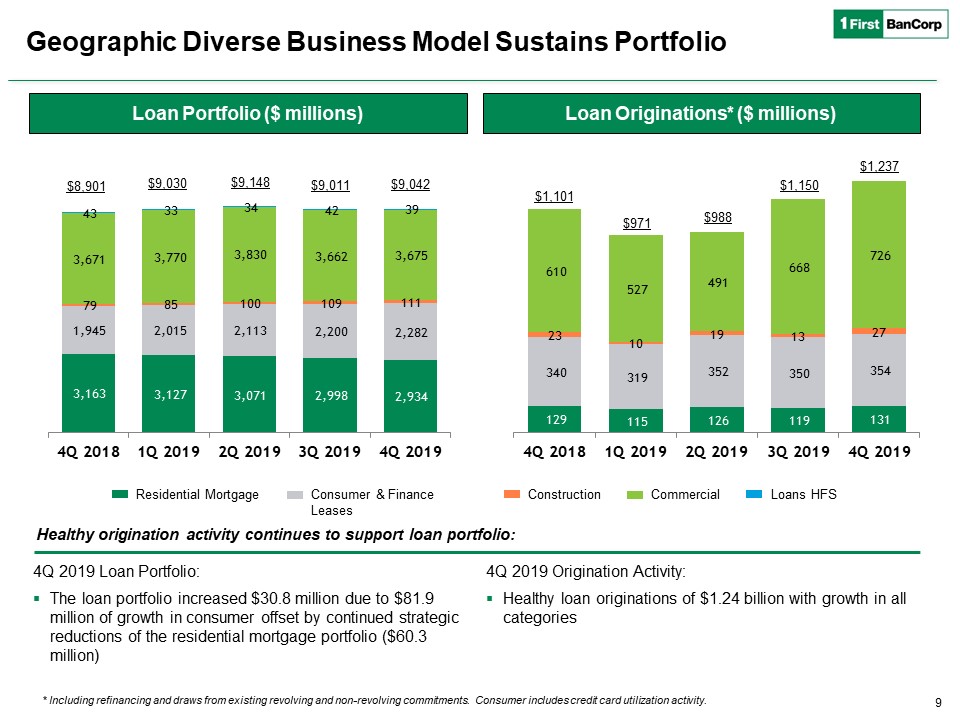
9 Loan Originations* ($ millions) Loan Portfolio ($ millions) Residential Mortgage Consumer &
Finance Leases Construction Commercial Loans HFS Healthy origination activity continues to support loan portfolio: * Including refinancing and draws from existing revolving and non-revolving commitments. Consumer includes credit
card utilization activity. $9,042 $9,030 $1,101 $9,148 $9,011 $1,150 4Q 2019 Loan Portfolio:The loan portfolio increased $30.8 million due to $81.9 million of growth in consumer offset by continued strategic reductions of the
residential mortgage portfolio ($60.3 million) 4Q 2019 Origination Activity:Healthy loan originations of $1.24 billion with growth in all categories $8,901 $988 $971 $1,237 Geographic Diverse Business Model Sustains Portfolio
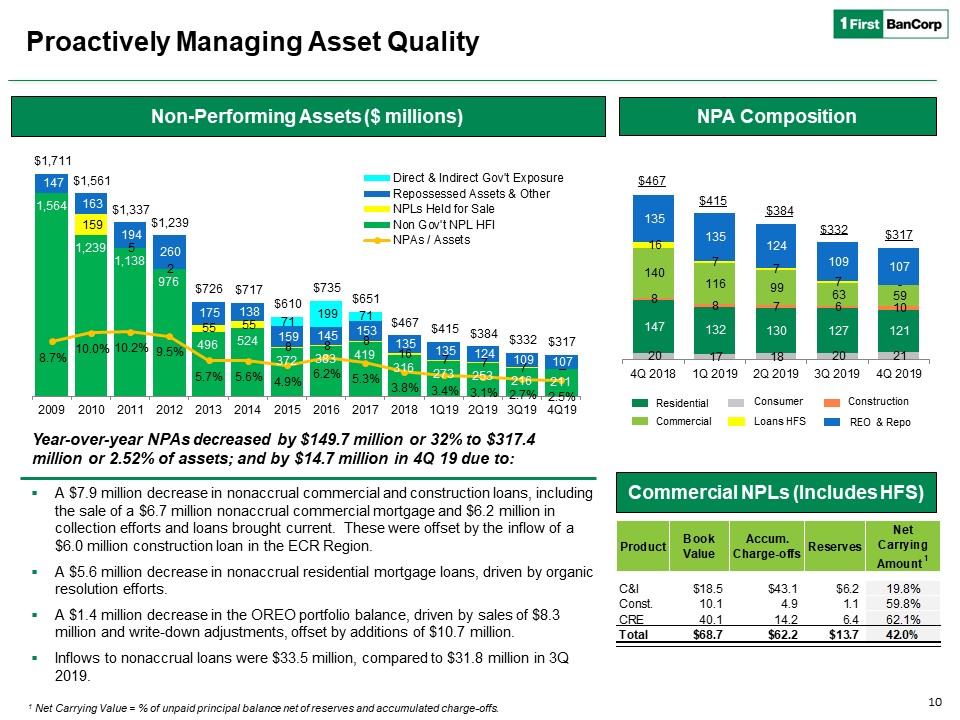
Proactively Managing Asset Quality Commercial NPLs (Includes HFS) NPA
Composition Residential Consumer Construction Commercial Loans HFS REO & Repo $332 $467 $317 $415 1 Net Carrying Value = % of unpaid principal balance net of reserves and accumulated charge-offs. $384 Non-Performing
Assets ($ millions) 10 A $7.9 million decrease in nonaccrual commercial and construction loans, including the sale of a $6.7 million nonaccrual commercial mortgage and $6.2 million in collection efforts and loans brought current. These were
offset by the inflow of a $6.0 million construction loan in the ECR Region.A $5.6 million decrease in nonaccrual residential mortgage loans, driven by organic resolution efforts.A $1.4 million decrease in the OREO portfolio balance, driven by
sales of $8.3 million and write-down adjustments, offset by additions of $10.7 million.Inflows to nonaccrual loans were $33.5 million, compared to $31.8 million in 3Q 2019. Year-over-year NPAs decreased by $149.7 million or 32% to $317.4
million or 2.52% of assets; and by $14.7 million in 4Q 19 due to:
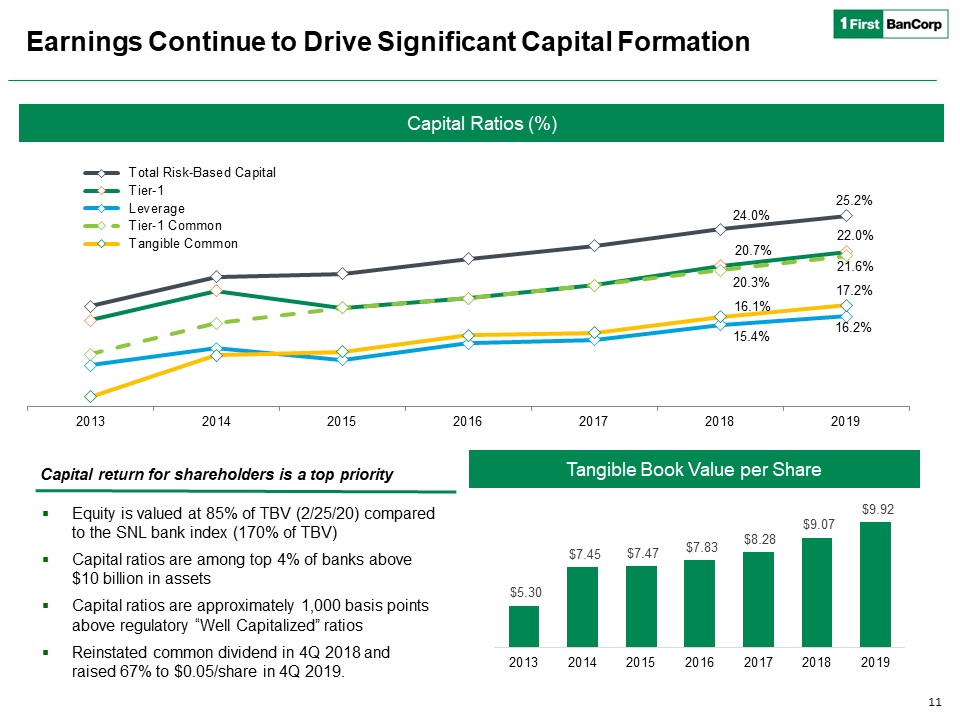
Earnings Continue to Drive Significant Capital Formation Tangible Book Value per Share Capital Ratios
(%) Equity is valued at 85% of TBV (2/25/20) compared to the SNL bank index (170% of TBV)Capital ratios are among top 4% of banks above $10 billion in assetsCapital ratios are approximately 1,000 basis points above regulatory “Well
Capitalized” ratiosReinstated common dividend in 4Q 2018 and raised 67% to $0.05/share in 4Q 2019. Capital return for shareholders is a top priority 11
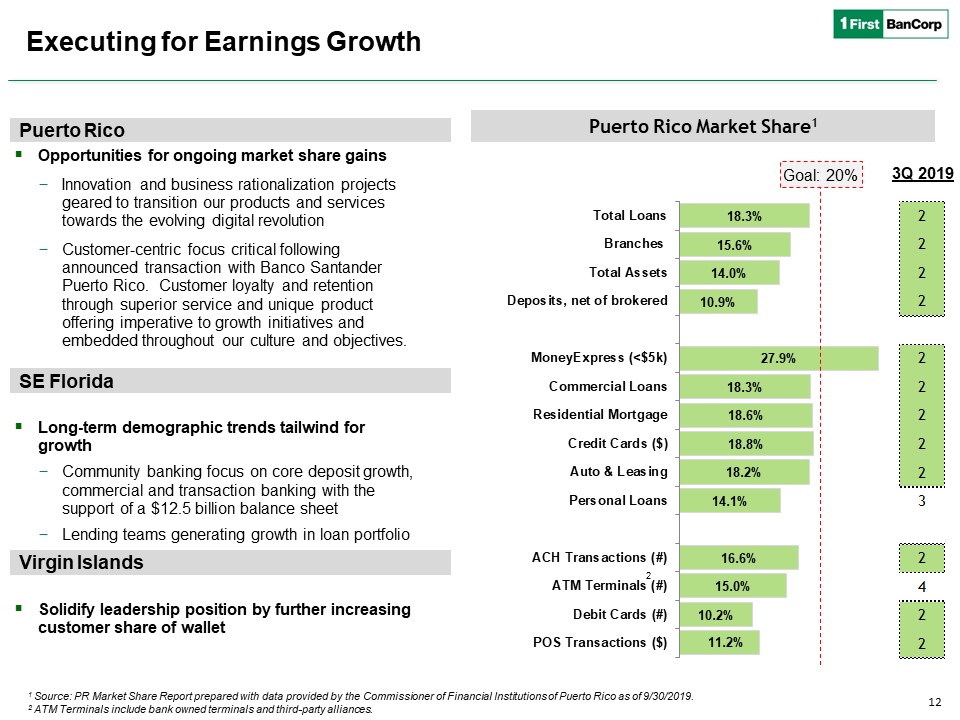
3Q 2019 Goal: 20% Puerto Rico Executing for Earnings Growth Opportunities for ongoing market share
gainsInnovation and business rationalization projects geared to transition our products and services towards the evolving digital revolutionCustomer-centric focus critical following announced transaction with Banco Santander Puerto Rico.
Customer loyalty and retention through superior service and unique product offering imperative to growth initiatives and embedded throughout our culture and objectives.Long-term demographic trends tailwind for growth Community banking focus on
core deposit growth, commercial and transaction banking with the support of a $12.5 billion balance sheetLending teams generating growth in loan portfolioSolidify leadership position by further increasing customer share of wallet Puerto Rico
Market Share(1) 1 Source: PR Market Share Report prepared with data provided by the Commissioner of Financial Institutions of Puerto Rico as of 9/30/2019.2 ATM Terminals include bank owned terminals and third-party alliances. Puerto Rico
Market Share1 SE Florida Virgin Islands 12 2
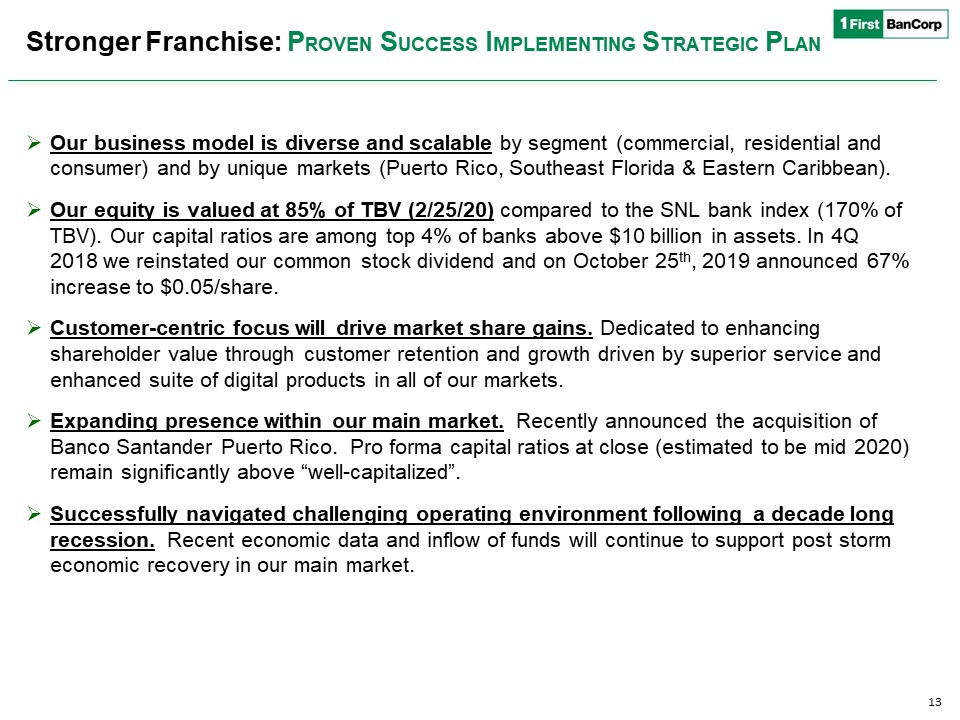
Stronger Franchise: Proven Success Implementing Strategic Plan Our business model is diverse and
scalable by segment (commercial, residential and consumer) and by unique markets (Puerto Rico, Southeast Florida & Eastern Caribbean). Our equity is valued at 85% of TBV (2/25/20) compared to the SNL bank index (170% of TBV). Our capital
ratios are among top 4% of banks above $10 billion in assets. In 4Q 2018 we reinstated our common stock dividend and on October 25th, 2019 announced 67% increase to $0.05/share.Customer-centric focus will drive market share gains. Dedicated to
enhancing shareholder value through customer retention and growth driven by superior service and enhanced suite of digital products in all of our markets. Expanding presence within our main market. Recently announced the acquisition of Banco
Santander Puerto Rico. Pro forma capital ratios at close (estimated to be mid 2020) remain significantly above “well-capitalized”. Successfully navigated challenging operating environment following a decade long recession. Recent economic data
and inflow of funds will continue to support post storm economic recovery in our main market. 13

Exhibits
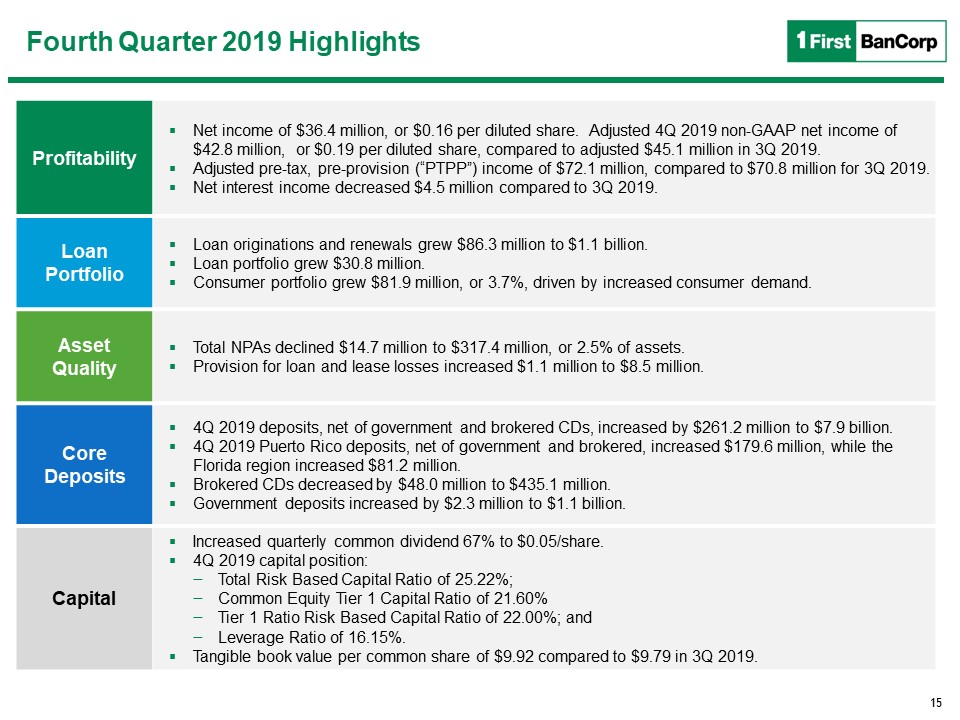
15 Fourth Quarter 2019 Highlights Profitability Net income of $36.4 million, or $0.16 per diluted
share. Adjusted 4Q 2019 non-GAAP net income of $42.8 million, or $0.19 per diluted share, compared to adjusted $45.1 million in 3Q 2019.Adjusted pre-tax, pre-provision (“PTPP”) income of $72.1 million, compared to $70.8 million for 3Q 2019. Net
interest income decreased $4.5 million compared to 3Q 2019. Loan Portfolio Loan originations and renewals grew $86.3 million to $1.1 billion.Loan portfolio grew $30.8 million.Consumer portfolio grew $81.9 million, or 3.7%, driven by increased
consumer demand. Asset Quality Total NPAs declined $14.7 million to $317.4 million, or 2.5% of assets.Provision for loan and lease losses increased $1.1 million to $8.5 million. Core Deposits 4Q 2019 deposits, net of government and
brokered CDs, increased by $261.2 million to $7.9 billion. 4Q 2019 Puerto Rico deposits, net of government and brokered, increased $179.6 million, while the Florida region increased $81.2 million.Brokered CDs decreased by $48.0 million to
$435.1 million.Government deposits increased by $2.3 million to $1.1 billion. Capital Increased quarterly common dividend 67% to $0.05/share.4Q 2019 capital position: Total Risk Based Capital Ratio of 25.22%;Common Equity Tier 1 Capital Ratio
of 21.60%Tier 1 Ratio Risk Based Capital Ratio of 22.00%; andLeverage Ratio of 16.15%.Tangible book value per common share of $9.92 compared to $9.79 in 3Q 2019.
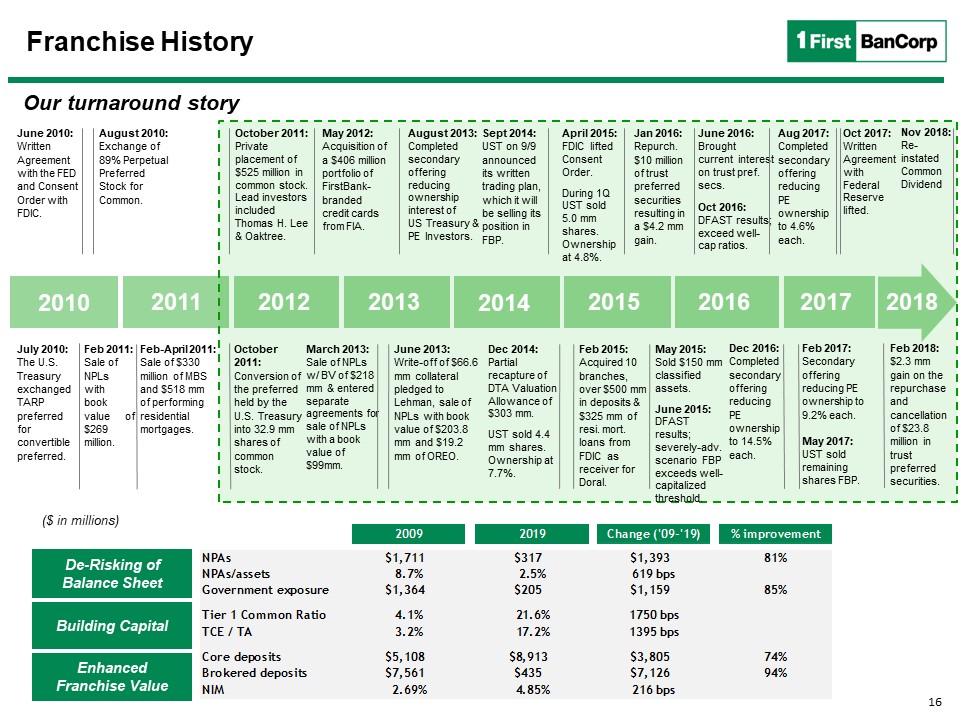
Franchise History Our turnaround story De-Risking of Balance Sheet Building Capital Enhanced
Franchise Value June 2010: Written Agreement with the FED and Consent Order with FDIC. July 2010:The U.S. Treasury exchanged TARP preferred for convertible preferred. August 2010: Exchange of 89% Perpetual Preferred Stock for Common. Feb
2011: Sale of NPLs with book value of $269 million. Feb-April 2011: Sale of $330 million of MBS and $518 mm of performing residential mortgages. March 2013: Sale of NPLs w/ BV of $218 mm & entered separate agreements for sale of NPLs with
a book value of $99mm. 2010 2011 October 2011: Conversion of the preferred held by the U.S. Treasury into 32.9 mm shares of common stock. May 2012: Acquisition of a $406 million portfolio of FirstBank-branded credit cards from
FIA. June 2013: Write-off of $66.6 mm collateral pledged to Lehman, sale of NPLs with book value of $203.8 mm and $19.2 mm of OREO. October 2011: Private placement of $525 million in common stock. Lead investors included Thomas H. Lee &
Oaktree. August 2013: Completed secondary offering reducing ownership interest of US Treasury & PE Investors. Sept 2014: UST on 9/9 announced its written trading plan, which it will be selling its position in FBP. ($ in millions) Dec
2014: Partial recapture of DTA Valuation Allowance of $303 mm.UST sold 4.4 mm shares. Ownership at 7.7%. Feb 2015: Acquired 10 branches, over $500 mm in deposits & $325 mm of resi. mort. loans from FDIC as receiver for Doral. April 2015:
FDIC lifted Consent Order.During 1Q UST sold 5.0 mm shares. Ownership at 4.8%. May 2015: Sold $150 mm classified assets.June 2015:DFAST results; severely-adv. scenario FBP exceeds well-capitalized threshold. Jan 2016: Repurch. $10 million of
trust preferred securities resulting in a $4.2 mm gain. June 2016: Brought current interest on trust pref. secs.Oct 2016:DFAST results; exceed well-cap ratios. 2012 2013 2014 2015 Dec 2016: Completed secondary offering reducing PE
ownership to 14.5% each. 2016 Feb 2017: Secondary offering reducing PE ownership to 9.2% each.May 2017:UST sold remaining shares FBP. Oct 2017:Written Agreement with Federal Reserve lifted. Aug 2017: Completed secondary offering reducing
PE ownership to 4.6% each. 2017 2018 Feb 2018: $2.3 mm gain on the repurchase and cancellation of $23.8 million in trust preferred securities. Nov 2018:Re-instated Common Dividend 16
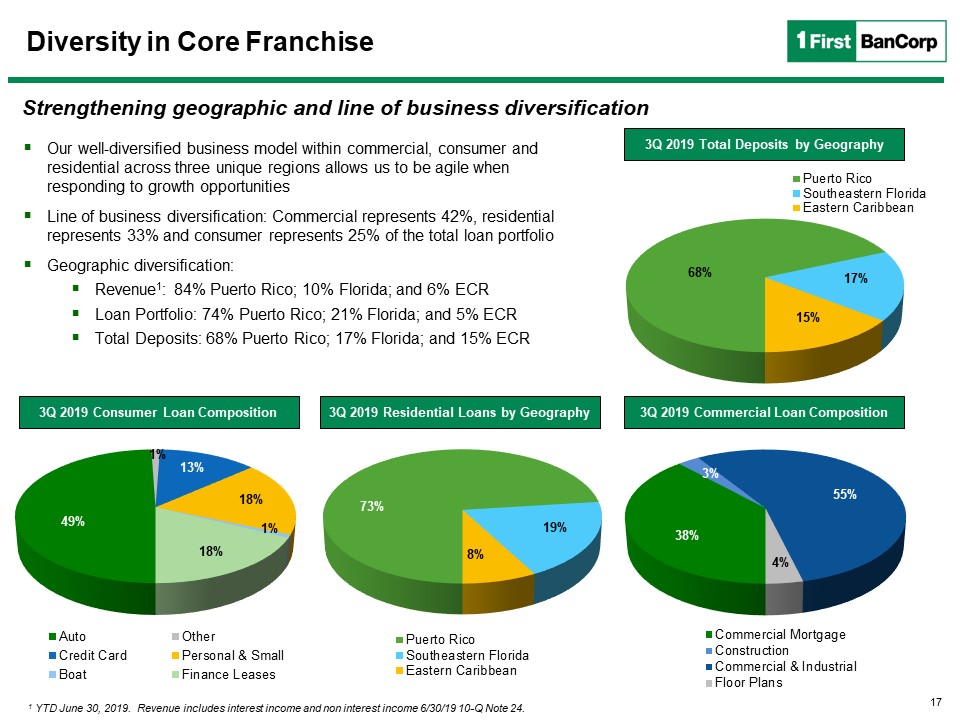
Our well-diversified business model within commercial, consumer and residential across three unique
regions allows us to be agile when responding to growth opportunitiesLine of business diversification: Commercial represents 42%, residential represents 33% and consumer represents 25% of the total loan portfolioGeographic
diversification:Revenue1: 84% Puerto Rico; 10% Florida; and 6% ECRLoan Portfolio: 74% Puerto Rico; 21% Florida; and 5% ECRTotal Deposits: 68% Puerto Rico; 17% Florida; and 15% ECR Diversity in Core Franchise Strengthening geographic and line
of business diversification 3Q 2019 Total Deposits by Geography 1 YTD June 30, 2019. Revenue includes interest income and non interest income 6/30/19 10-Q Note 24. 3Q 2019 Consumer Loan Composition 3Q 2019 Residential Loans by Geography 3Q
2019 Commercial Loan Composition 17
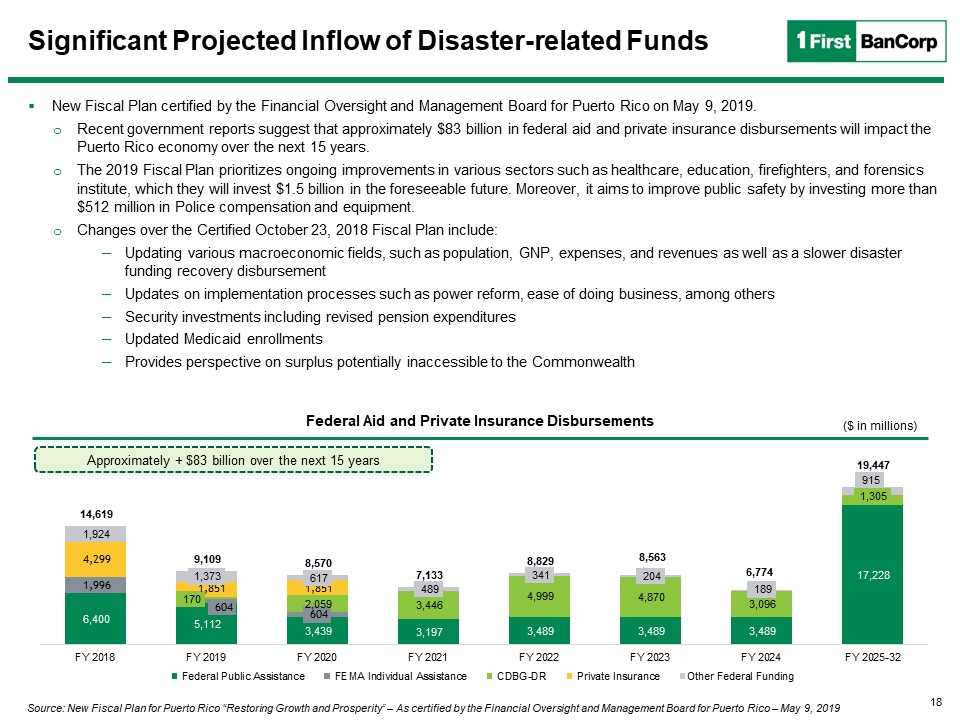
Significant Projected Inflow of Disaster-related Funds New Fiscal Plan certified by the Financial
Oversight and Management Board for Puerto Rico on May 9, 2019.Recent government reports suggest that approximately $83 billion in federal aid and private insurance disbursements will impact the Puerto Rico economy over the next 15 years.The
2019 Fiscal Plan prioritizes ongoing improvements in various sectors such as healthcare, education, firefighters, and forensics institute, which they will invest $1.5 billion in the foreseeable future. Moreover, it aims to improve public safety
by investing more than $512 million in Police compensation and equipment.Changes over the Certified October 23, 2018 Fiscal Plan include:Updating various macroeconomic fields, such as population, GNP, expenses, and revenues as well as a slower
disaster funding recovery disbursementUpdates on implementation processes such as power reform, ease of doing business, among othersSecurity investments including revised pension expendituresUpdated Medicaid enrollmentsProvides perspective on
surplus potentially inaccessible to the Commonwealth Federal Aid and Private Insurance Disbursements ($ in millions) Approximately + $83 billion over the next 15 years Source: New Fiscal Plan for Puerto Rico “Restoring Growth and
Prosperity” – As certified by the Financial Oversight and Management Board for Puerto Rico – May 9, 2019 18
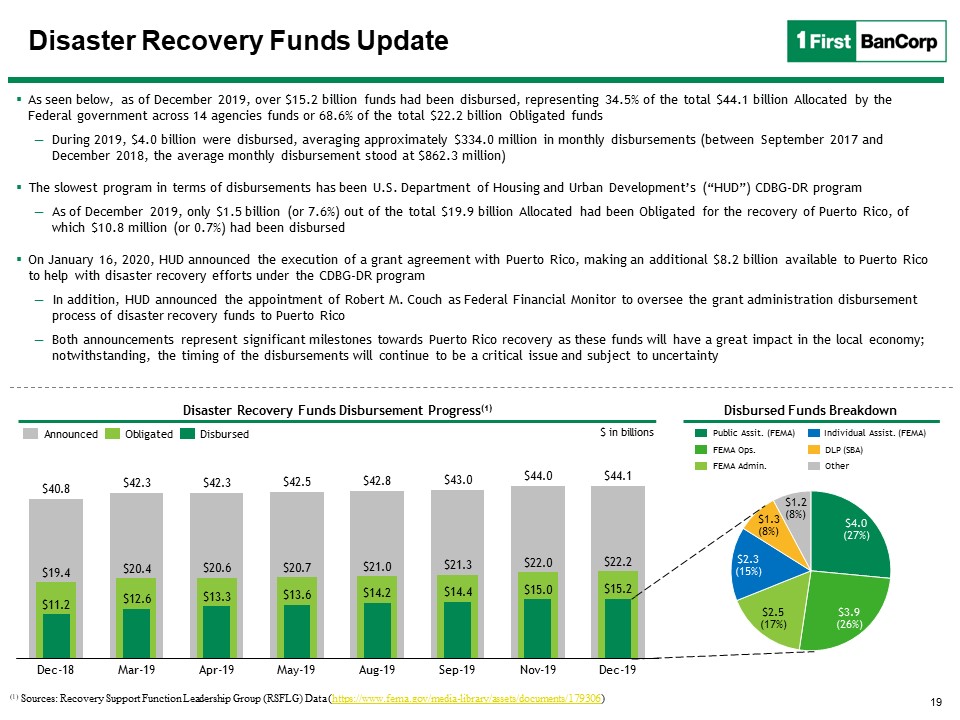
Disaster Recovery Funds Update 19 As seen below, as of December 2019, over $15.2 billion funds had
been disbursed, representing 34.5% of the total $44.1 billion Allocated by the Federal government across 14 agencies funds or 68.6% of the total $22.2 billion Obligated fundsDuring 2019, $4.0 billion were disbursed, averaging approximately
$334.0 million in monthly disbursements (between September 2017 and December 2018, the average monthly disbursement stood at $862.3 million)The slowest program in terms of disbursements has been U.S. Department of Housing and Urban
Development’s (“HUD”) CDBG-DR program As of December 2019, only $1.5 billion (or 7.6%) out of the total $19.9 billion Allocated had been Obligated for the recovery of Puerto Rico, of which $10.8 million (or 0.7%) had been disbursedOn January
16, 2020, HUD announced the execution of a grant agreement with Puerto Rico, making an additional $8.2 billion available to Puerto Rico to help with disaster recovery efforts under the CDBG-DR programIn addition, HUD announced the appointment
of Robert M. Couch as Federal Financial Monitor to oversee the grant administration disbursement process of disaster recovery funds to Puerto Rico Both announcements represent significant milestones towards Puerto Rico recovery as these funds
will have a great impact in the local economy; notwithstanding, the timing of the disbursements will continue to be a critical issue and subject to uncertainty (1) Sources: Recovery Support Function Leadership Group (RSFLG) Data
(https://www.fema.gov/media-library/assets/documents/179306) $43.0 $42.8 $44.0 $40.8 $42.3 $42.3 $42.5 $44.1 $20.4 $20.7 $21.3 $19.4 $20.6 $21.0 $22.0 $22.2 Sep-19 $13.3 $11.2 Mar-19 $15.2 Nov-19 Apr-19 Aug-19 Dec-19 $15.0 Dec-18 May-19 $12.6 $13.6 $14.2 $14.4 Announced Obligated Disbursed $4.0(27%) $2.3(15%) $3.9(26%) $2.5(17%) $1.3(8%) $1.2(8%) Disaster
Recovery Funds Disbursement Progress(1) Public Assit. (FEMA) FEMA Ops. FEMA Admin. Individual Assist. (FEMA) DLP (SBA) Other Disbursed Funds Breakdown $ in billions
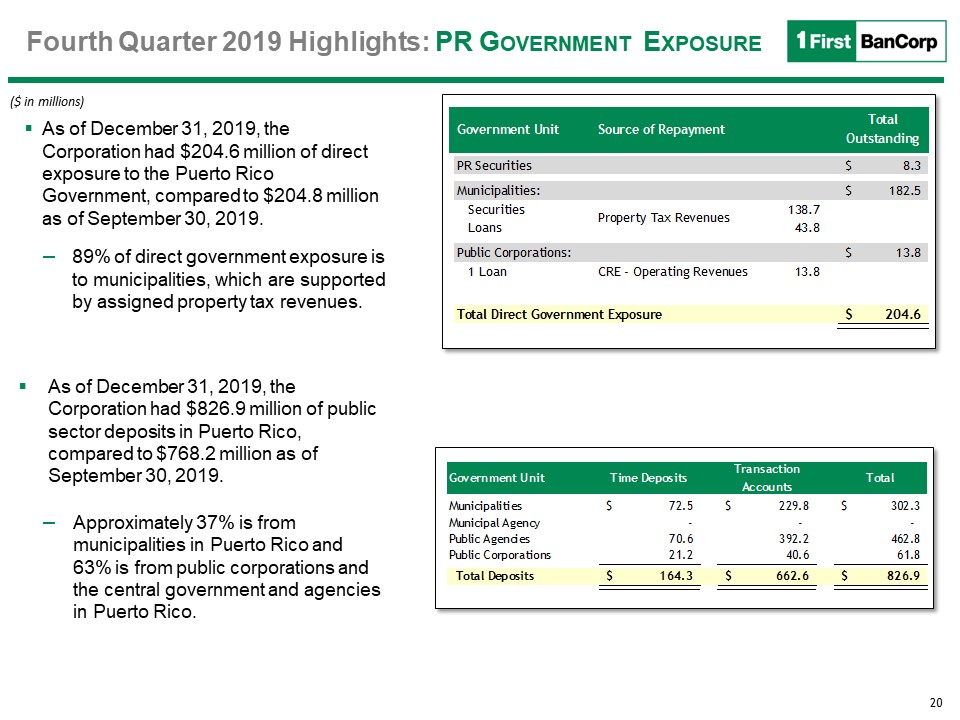
20 Fourth Quarter 2019 Highlights: PR Government Exposure ($ in millions) As of December 31, 2019,
the Corporation had $204.6 million of direct exposure to the Puerto Rico Government, compared to $204.8 million as of September 30, 2019. 89% of direct government exposure is to municipalities, which are supported by assigned property tax
revenues. As of December 31, 2019, the Corporation had $826.9 million of public sector deposits in Puerto Rico, compared to $768.2 million as of September 30, 2019.Approximately 37% is from municipalities in Puerto Rico and 63% is from public
corporations and the central government and agencies in Puerto Rico.
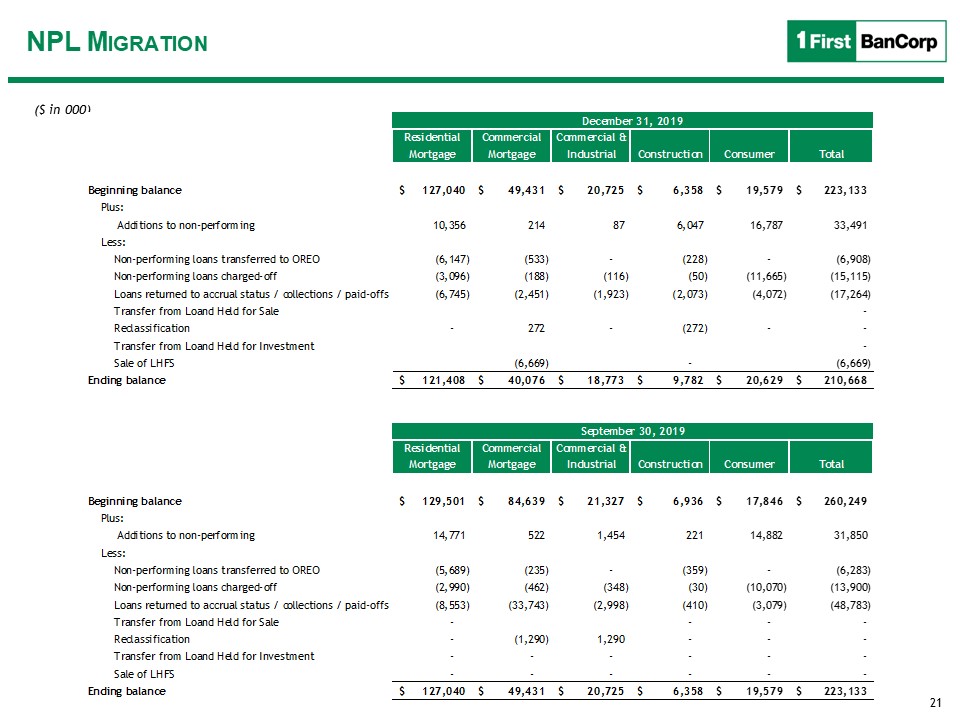
21 NPL Migration ($ in 000)
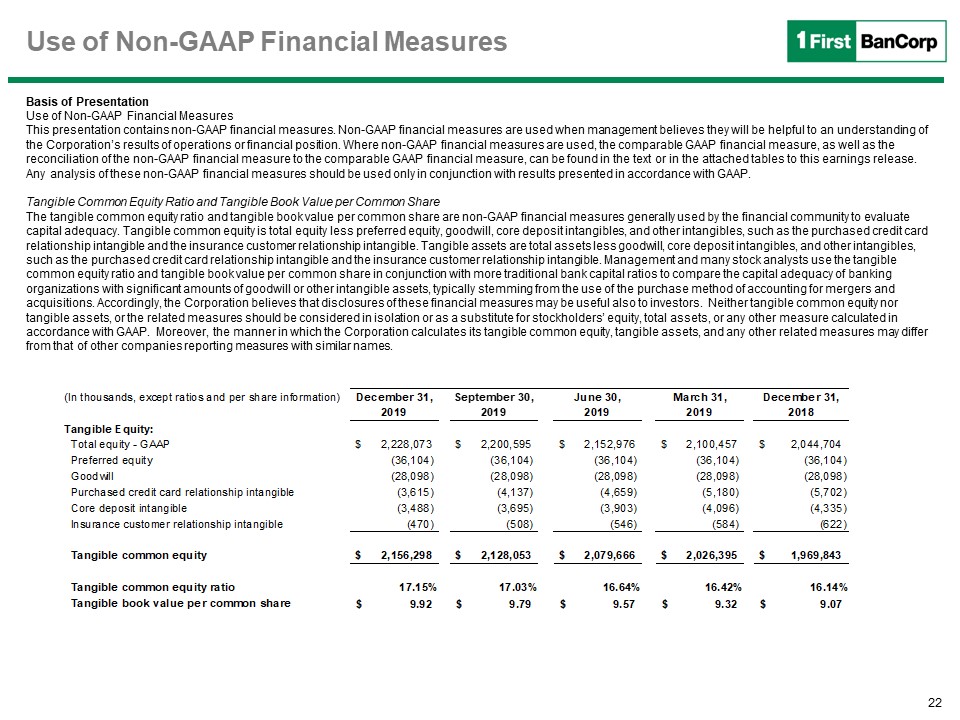
22 Use of Non-GAAP Financial Measures Basis of PresentationUse of Non-GAAP Financial Measures This
presentation contains non-GAAP financial measures. Non-GAAP financial measures are used when management believes they will be helpful to an understanding of the Corporation’s results of operations or financial position. Where non-GAAP financial
measures are used, the comparable GAAP financial measure, as well as the reconciliation of the non-GAAP financial measure to the comparable GAAP financial measure, can be found in the text or in the attached tables to this earnings release. Any
analysis of these non-GAAP financial measures should be used only in conjunction with results presented in accordance with GAAP. Tangible Common Equity Ratio and Tangible Book Value per Common Share The tangible common equity ratio and tangible
book value per common share are non-GAAP financial measures generally used by the financial community to evaluate capital adequacy. Tangible common equity is total equity less preferred equity, goodwill, core deposit intangibles, and other
intangibles, such as the purchased credit card relationship intangible and the insurance customer relationship intangible. Tangible assets are total assets less goodwill, core deposit intangibles, and other intangibles, such as the purchased
credit card relationship intangible and the insurance customer relationship intangible. Management and many stock analysts use the tangible common equity ratio and tangible book value per common share in conjunction with more traditional bank
capital ratios to compare the capital adequacy of banking organizations with significant amounts of goodwill or other intangible assets, typically stemming from the use of the purchase method of accounting for mergers and acquisitions.
Accordingly, the Corporation believes that disclosures of these financial measures may be useful also to investors. Neither tangible common equity nor tangible assets, or the related measures should be considered in isolation or as a substitute
for stockholders’ equity, total assets, or any other measure calculated in accordance with GAAP. Moreover, the manner in which the Corporation calculates its tangible common equity, tangible assets, and any other related measures may differ
from that of other companies reporting measures with similar names.
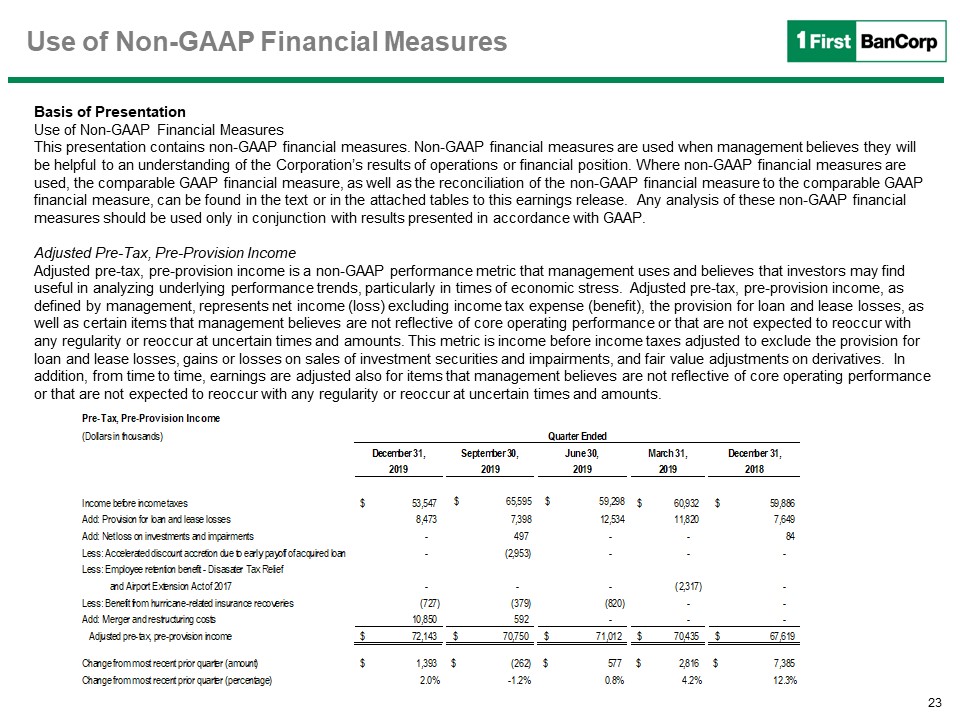
23 Use of Non-GAAP Financial Measures Basis of PresentationUse of Non-GAAP Financial Measures This
presentation contains non-GAAP financial measures. Non-GAAP financial measures are used when management believes they will be helpful to an understanding of the Corporation’s results of operations or financial position. Where non-GAAP financial
measures are used, the comparable GAAP financial measure, as well as the reconciliation of the non-GAAP financial measure to the comparable GAAP financial measure, can be found in the text or in the attached tables to this earnings release. Any
analysis of these non-GAAP financial measures should be used only in conjunction with results presented in accordance with GAAP. Adjusted Pre-Tax, Pre-Provision IncomeAdjusted pre-tax, pre-provision income is a non-GAAP performance metric that
management uses and believes that investors may find useful in analyzing underlying performance trends, particularly in times of economic stress. Adjusted pre-tax, pre-provision income, as defined by management, represents net income (loss)
excluding income tax expense (benefit), the provision for loan and lease losses, as well as certain items that management believes are not reflective of core operating performance or that are not expected to reoccur with any regularity or
reoccur at uncertain times and amounts. This metric is income before income taxes adjusted to exclude the provision for loan and lease losses, gains or losses on sales of investment securities and impairments, and fair value adjustments on
derivatives. In addition, from time to time, earnings are adjusted also for items that management believes are not reflective of core operating performance or that are not expected to reoccur with any regularity or reoccur at uncertain times
and amounts.
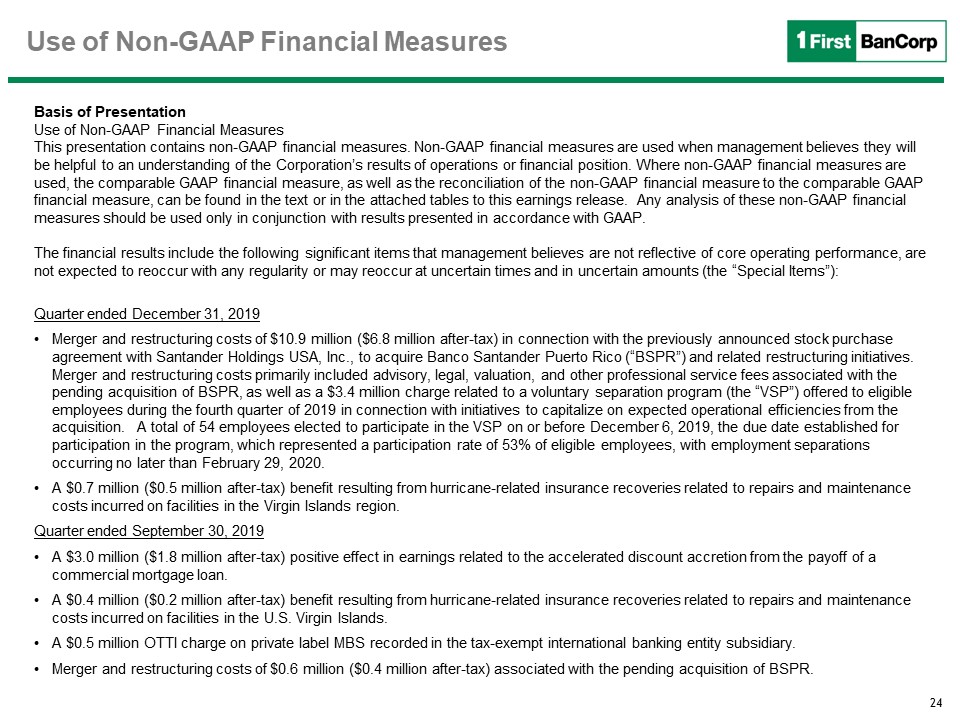
24 Use of Non-GAAP Financial Measures Basis of PresentationUse of Non-GAAP Financial Measures This
presentation contains non-GAAP financial measures. Non-GAAP financial measures are used when management believes they will be helpful to an understanding of the Corporation’s results of operations or financial position. Where non-GAAP financial
measures are used, the comparable GAAP financial measure, as well as the reconciliation of the non-GAAP financial measure to the comparable GAAP financial measure, can be found in the text or in the attached tables to this earnings release. Any
analysis of these non-GAAP financial measures should be used only in conjunction with results presented in accordance with GAAP. The financial results include the following significant items that management believes are not reflective of core
operating performance, are not expected to reoccur with any regularity or may reoccur at uncertain times and in uncertain amounts (the “Special Items”):Quarter ended December 31, 2019Merger and restructuring costs of $10.9 million ($6.8 million
after-tax) in connection with the previously announced stock purchase agreement with Santander Holdings USA, Inc., to acquire Banco Santander Puerto Rico (“BSPR”) and related restructuring initiatives. Merger and restructuring costs primarily
included advisory, legal, valuation, and other professional service fees associated with the pending acquisition of BSPR, as well as a $3.4 million charge related to a voluntary separation program (the “VSP”) offered to eligible employees
during the fourth quarter of 2019 in connection with initiatives to capitalize on expected operational efficiencies from the acquisition. A total of 54 employees elected to participate in the VSP on or before December 6, 2019, the due date
established for participation in the program, which represented a participation rate of 53% of eligible employees, with employment separations occurring no later than February 29, 2020. A $0.7 million ($0.5 million after-tax) benefit resulting
from hurricane-related insurance recoveries related to repairs and maintenance costs incurred on facilities in the Virgin Islands region.Quarter ended September 30, 2019A $3.0 million ($1.8 million after-tax) positive effect in earnings related
to the accelerated discount accretion from the payoff of a commercial mortgage loan.A $0.4 million ($0.2 million after-tax) benefit resulting from hurricane-related insurance recoveries related to repairs and maintenance costs incurred on
facilities in the U.S. Virgin Islands.A $0.5 million OTTI charge on private label MBS recorded in the tax-exempt international banking entity subsidiary. Merger and restructuring costs of $0.6 million ($0.4 million after-tax) associated with
the pending acquisition of BSPR.
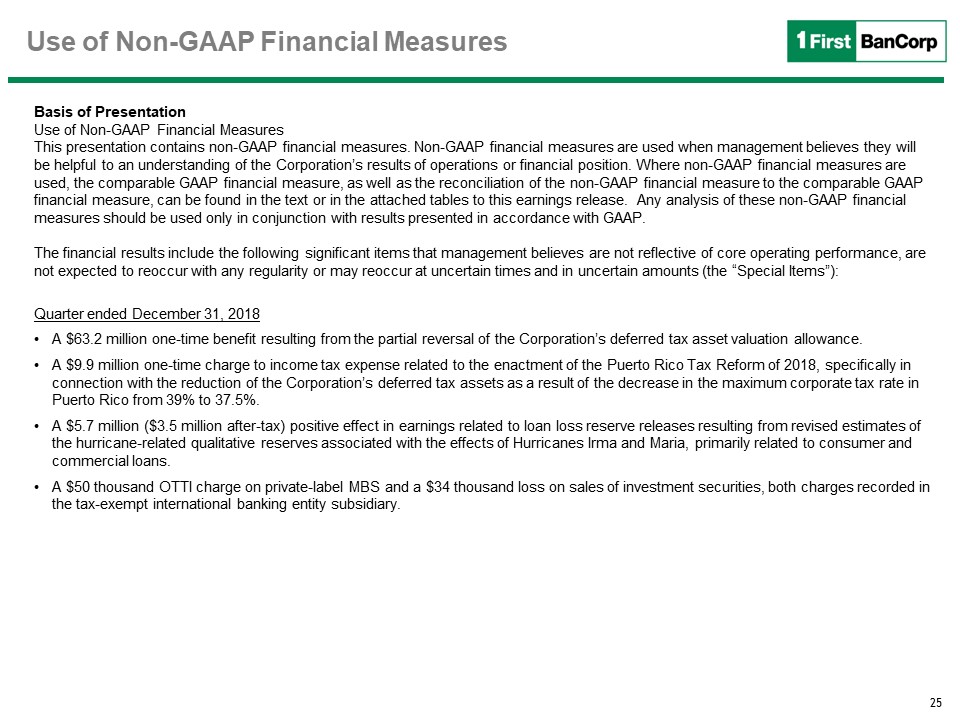
25 Use of Non-GAAP Financial Measures Basis of PresentationUse of Non-GAAP Financial Measures This
presentation contains non-GAAP financial measures. Non-GAAP financial measures are used when management believes they will be helpful to an understanding of the Corporation’s results of operations or financial position. Where non-GAAP financial
measures are used, the comparable GAAP financial measure, as well as the reconciliation of the non-GAAP financial measure to the comparable GAAP financial measure, can be found in the text or in the attached tables to this earnings release. Any
analysis of these non-GAAP financial measures should be used only in conjunction with results presented in accordance with GAAP. The financial results include the following significant items that management believes are not reflective of core
operating performance, are not expected to reoccur with any regularity or may reoccur at uncertain times and in uncertain amounts (the “Special Items”):Quarter ended December 31, 2018A $63.2 million one-time benefit resulting from the partial
reversal of the Corporation’s deferred tax asset valuation allowance.A $9.9 million one-time charge to income tax expense related to the enactment of the Puerto Rico Tax Reform of 2018, specifically in connection with the reduction of the
Corporation’s deferred tax assets as a result of the decrease in the maximum corporate tax rate in Puerto Rico from 39% to 37.5%.A $5.7 million ($3.5 million after-tax) positive effect in earnings related to loan loss reserve releases resulting
from revised estimates of the hurricane-related qualitative reserves associated with the effects of Hurricanes Irma and Maria, primarily related to consumer and commercial loans.A $50 thousand OTTI charge on private-label MBS and a $34 thousand
loss on sales of investment securities, both charges recorded in the tax-exempt international banking entity subsidiary.
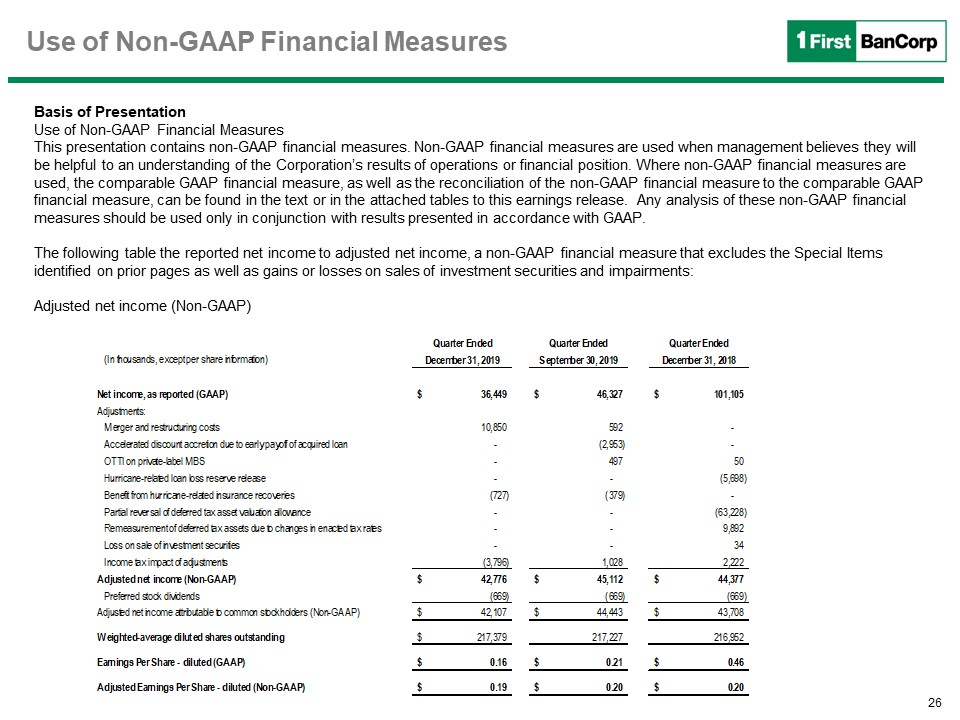
26 Use of Non-GAAP Financial Measures Basis of PresentationUse of Non-GAAP Financial Measures This
presentation contains non-GAAP financial measures. Non-GAAP financial measures are used when management believes they will be helpful to an understanding of the Corporation’s results of operations or financial position. Where non-GAAP financial
measures are used, the comparable GAAP financial measure, as well as the reconciliation of the non-GAAP financial measure to the comparable GAAP financial measure, can be found in the text or in the attached tables to this earnings release. Any
analysis of these non-GAAP financial measures should be used only in conjunction with results presented in accordance with GAAP. The following table the reported net income to adjusted net income, a non-GAAP financial measure that excludes the
Special Items identified on prior pages as well as gains or losses on sales of investment securities and impairments:Adjusted net income (Non-GAAP)
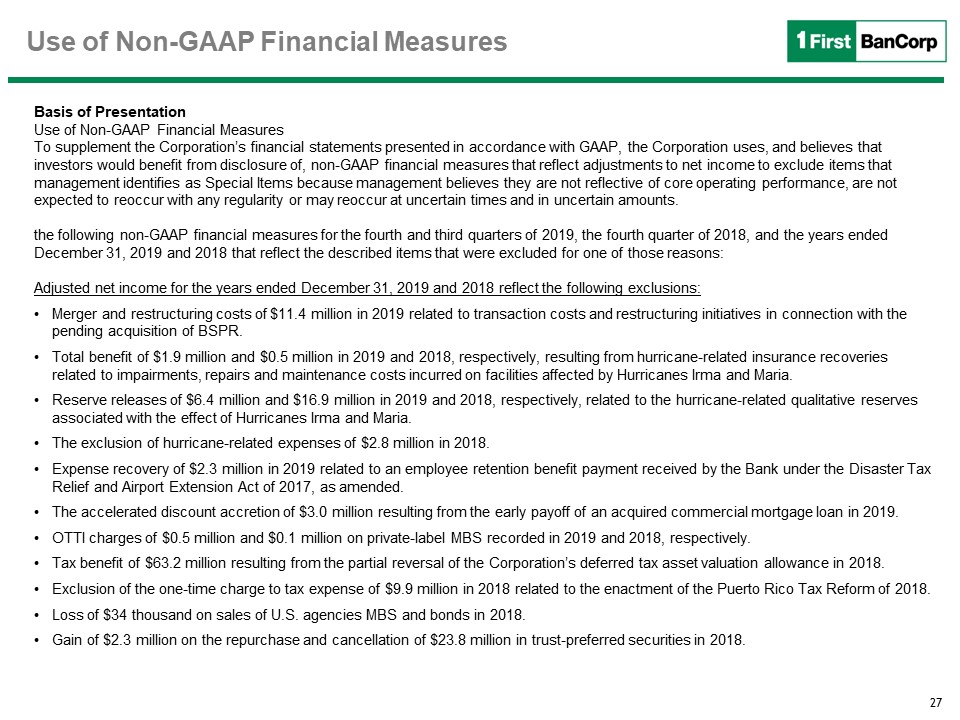
27 Use of Non-GAAP Financial Measures Basis of PresentationUse of Non-GAAP Financial Measures To
supplement the Corporation’s financial statements presented in accordance with GAAP, the Corporation uses, and believes that investors would benefit from disclosure of, non-GAAP financial measures that reflect adjustments to net income to
exclude items that management identifies as Special Items because management believes they are not reflective of core operating performance, are not expected to reoccur with any regularity or may reoccur at uncertain times and in uncertain
amounts. the following non-GAAP financial measures for the fourth and third quarters of 2019, the fourth quarter of 2018, and the years ended December 31, 2019 and 2018 that reflect the described items that were excluded for one of those
reasons:Adjusted net income for the years ended December 31, 2019 and 2018 reflect the following exclusions:Merger and restructuring costs of $11.4 million in 2019 related to transaction costs and restructuring initiatives in connection with
the pending acquisition of BSPR.Total benefit of $1.9 million and $0.5 million in 2019 and 2018, respectively, resulting from hurricane-related insurance recoveries related to impairments, repairs and maintenance costs incurred on facilities
affected by Hurricanes Irma and Maria.Reserve releases of $6.4 million and $16.9 million in 2019 and 2018, respectively, related to the hurricane-related qualitative reserves associated with the effect of Hurricanes Irma and Maria.The exclusion
of hurricane-related expenses of $2.8 million in 2018.Expense recovery of $2.3 million in 2019 related to an employee retention benefit payment received by the Bank under the Disaster Tax Relief and Airport Extension Act of 2017, as amended.The
accelerated discount accretion of $3.0 million resulting from the early payoff of an acquired commercial mortgage loan in 2019.OTTI charges of $0.5 million and $0.1 million on private-label MBS recorded in 2019 and 2018, respectively.Tax
benefit of $63.2 million resulting from the partial reversal of the Corporation’s deferred tax asset valuation allowance in 2018.Exclusion of the one-time charge to tax expense of $9.9 million in 2018 related to the enactment of the Puerto Rico
Tax Reform of 2018.Loss of $34 thousand on sales of U.S. agencies MBS and bonds in 2018.Gain of $2.3 million on the repurchase and cancellation of $23.8 million in trust-preferred securities in 2018.
28 Use of Non-GAAP Financial Measures Basis of PresentationUse of Non-GAAP Financial Measures To
supplement the Corporation’s financial statements presented in accordance with GAAP, the Corporation uses, and believes that investors would benefit from disclosure of, non-GAAP financial measures that reflect adjustments to net income to
exclude items that management identifies as Special Items because management believes they are not reflective of core operating performance, are not expected to reoccur with any regularity or may reoccur at uncertain times and in uncertain
amounts. the following non-GAAP financial measures for the fourth and third quarters of 2019, the fourth quarter of 2018, and the years ended December 31, 2019 and 2018 that reflect the described items that were excluded for one of those
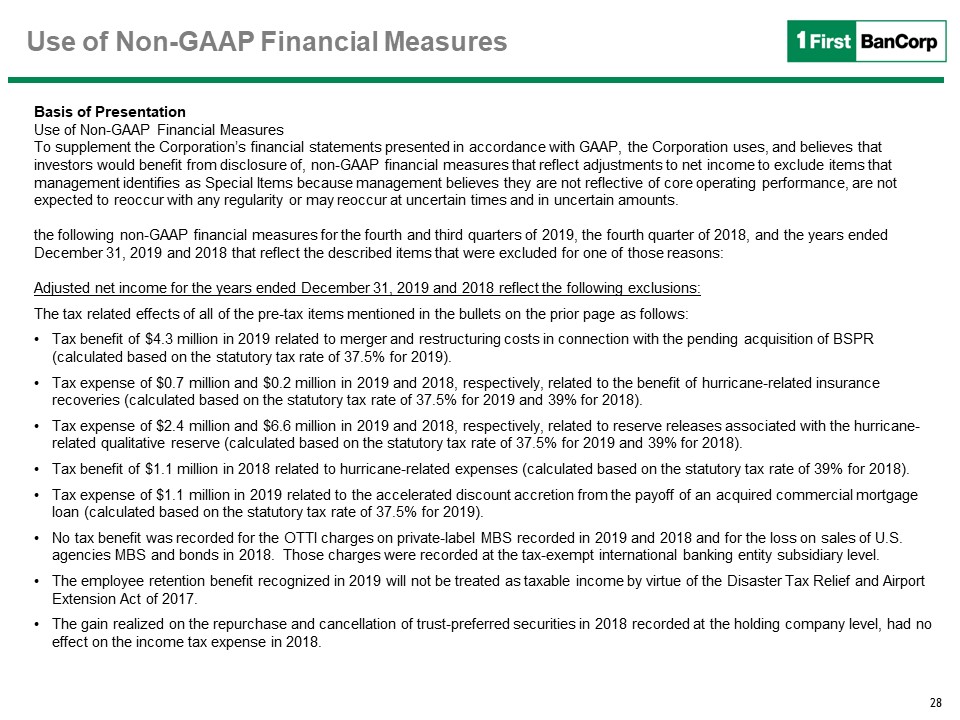
reasons:Adjusted net income for the years ended December 31, 2019 and 2018 reflect the following exclusions:The tax related effects of all of the pre-tax items mentioned in the bullets on the prior page as follows:Tax benefit of $4.3 million in
2019 related to merger and restructuring costs in connection with the pending acquisition of BSPR (calculated based on the statutory tax rate of 37.5% for 2019).Tax expense of $0.7 million and $0.2 million in 2019 and 2018, respectively,
related to the benefit of hurricane-related insurance recoveries (calculated based on the statutory tax rate of 37.5% for 2019 and 39% for 2018).Tax expense of $2.4 million and $6.6 million in 2019 and 2018, respectively, related to reserve
releases associated with the hurricane-related qualitative reserve (calculated based on the statutory tax rate of 37.5% for 2019 and 39% for 2018).Tax benefit of $1.1 million in 2018 related to hurricane-related expenses (calculated based on
the statutory tax rate of 39% for 2018).Tax expense of $1.1 million in 2019 related to the accelerated discount accretion from the payoff of an acquired commercial mortgage loan (calculated based on the statutory tax rate of 37.5% for 2019).No
tax benefit was recorded for the OTTI charges on private-label MBS recorded in 2019 and 2018 and for the loss on sales of U.S. agencies MBS and bonds in 2018. Those charges were recorded at the tax-exempt international banking entity subsidiary
level.The employee retention benefit recognized in 2019 will not be treated as taxable income by virtue of the Disaster Tax Relief and Airport Extension Act of 2017.The gain realized on the repurchase and cancellation of trust-preferred
securities in 2018 recorded at the holding company level, had no effect on the income tax expense in 2018.
29 Use of Non-GAAP Financial Measures Basis of PresentationUse of Non-GAAP Financial Measures This
presentation contains non-GAAP financial measures. Non-GAAP financial measures are used when management believes they will be helpful to an understanding of the Corporation’s results of operations or financial position. Where non-GAAP financial
measures are used, the comparable GAAP financial measure, as well as the reconciliation of the non-GAAP financial measure to the comparable GAAP financial measure, can be found in the text or in the attached tables to this earnings release. Any
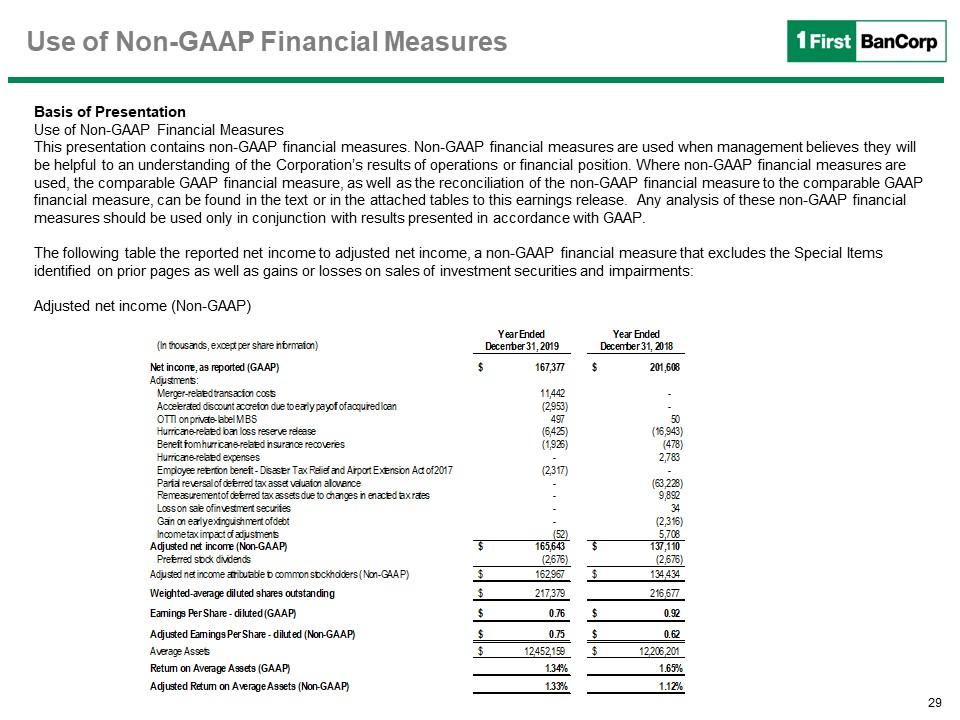
analysis of these non-GAAP financial measures should be used only in conjunction with results presented in accordance with GAAP. The following table the reported net income to adjusted net income, a non-GAAP financial measure that excludes the
Special Items identified on prior pages as well as gains or losses on sales of investment securities and impairments:Adjusted net income (Non-GAAP)
First BanCorp.Acquisition ofBanco Santander Puerto RicoOctober 21, 2019
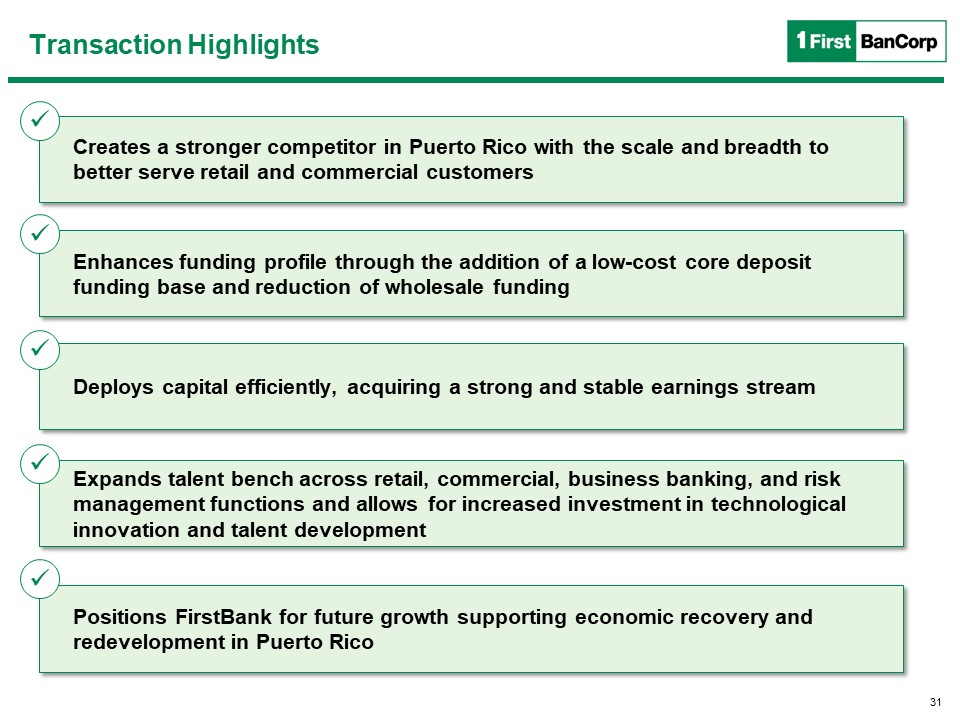
Transaction Highlights Creates a stronger competitor in Puerto Rico with the scale and breadth to better
serve retail and commercial customers Enhances funding profile through the addition of a low-cost core deposit funding base and reduction of wholesale funding Deploys capital efficiently, acquiring a strong and stable earnings stream Expands
talent bench across retail, commercial, business banking, and risk management functions and allows for increased investment in technological innovation and talent development Positions FirstBank for future growth supporting economic recovery
and redevelopment in Puerto Rico 31
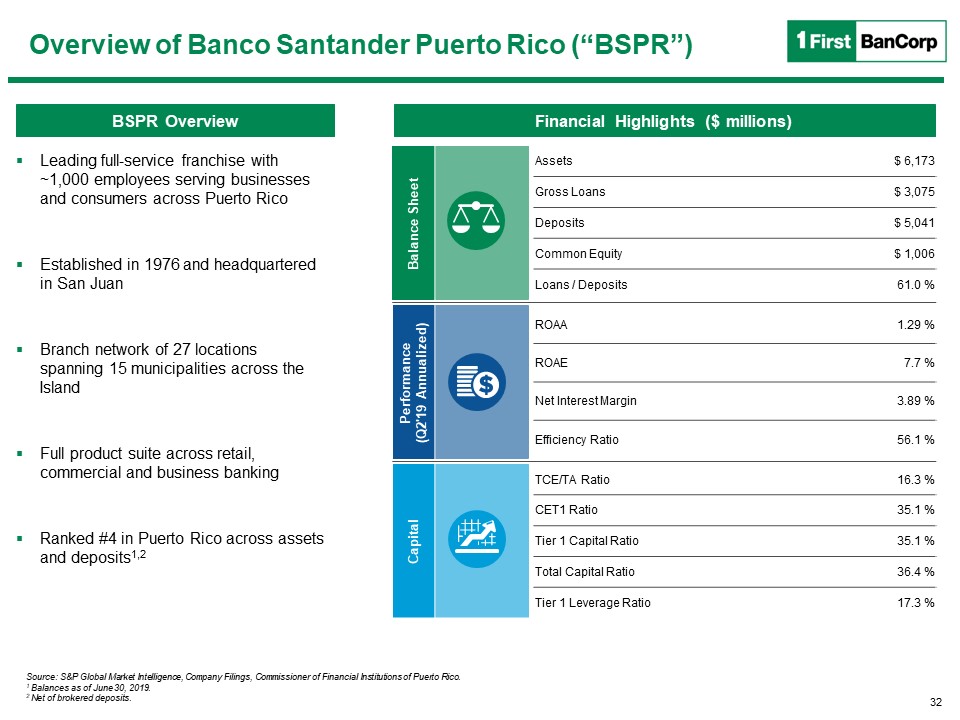
Overview of Banco Santander Puerto Rico (“BSPR”) BSPR Overview Financial Highlights ($
millions) Source: S&P Global Market Intelligence, Company Filings, Commissioner of Financial Institutions of Puerto Rico.1 Balances as of June 30, 2019.2 Net of brokered deposits. Leading full-service franchise with ~1,000 employees
serving businesses and consumers across Puerto RicoEstablished in 1976 and headquartered in San JuanBranch network of 27 locations spanning 15 municipalities across the IslandFull product suite across retail, commercial and business
bankingRanked #4 in Puerto Rico across assets and deposits1,2 Balance Sheet Assets $ 6,173 Gross Loans $ 3,075 Deposits $ 5,041 Common Equity $ 1,006 Loans / Deposits 61.0
% Performance(Q2'19 Annualized) ROAA 1.29 % ROAE 7.7 % Net Interest Margin 3.89 % Efficiency Ratio 56.1 % Capital TCE/TA Ratio 16.3 % CET1 Ratio 35.1 %
Tier 1 Capital Ratio 35.1 % Total Capital Ratio 36.4 % Tier 1 Leverage Ratio 17.3 % 32
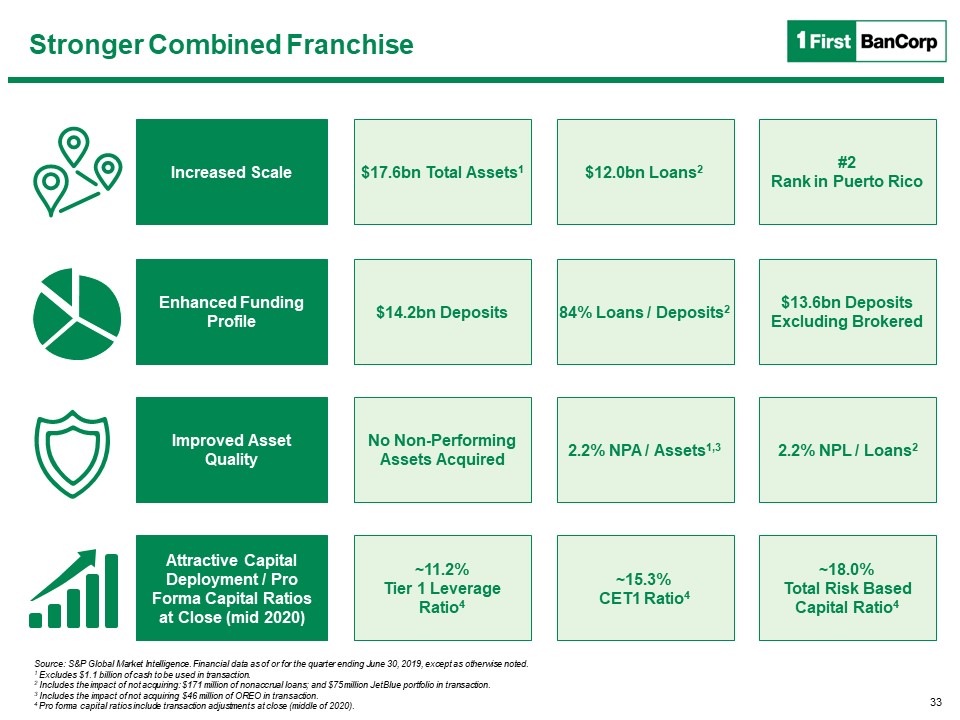
Stronger Combined Franchise Increased Scale Enhanced Funding Profile Improved Asset
Quality Attractive Capital Deployment / Pro Forma Capital Ratios at Close (mid 2020) $17.6bn Total Assets1 $12.0bn Loans2 #2 Rank in Puerto Rico $14.2bn Deposits 84% Loans / Deposits2 $13.6bn Deposits Excluding Brokered No
Non-Performing Assets Acquired 2.2% NPA / Assets1,3 2.2% NPL / Loans2 ~11.2% Tier 1 Leverage Ratio4 ~15.3% CET1 Ratio4 ~18.0% Total Risk Based Capital Ratio4 Source: S&P Global Market Intelligence. Financial data as of or for the
quarter ending June 30, 2019, except as otherwise noted.1 Excludes $1.1 billion of cash to be used in transaction.2 Includes the impact of not acquiring: $171 million of nonaccrual loans; and $75 million JetBlue portfolio in transaction.3
Includes the impact of not acquiring $46 million of OREO in transaction.4 Pro forma capital ratios include transaction adjustments at close (middle of 2020). 33
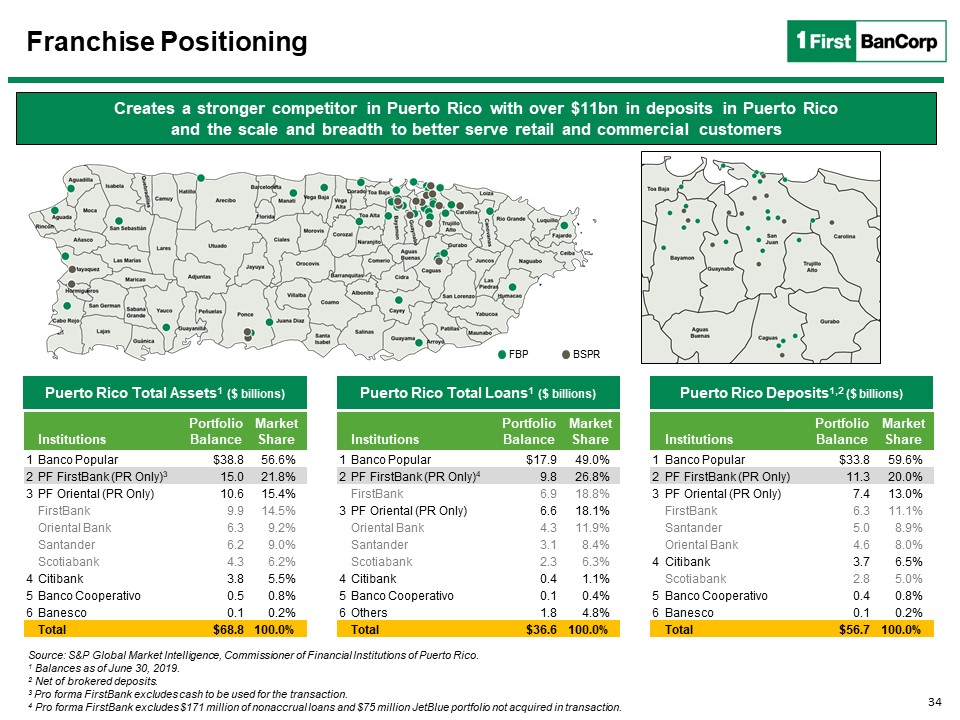
Franchise Positioning Creates a stronger competitor in Puerto Rico with over $11bn in deposits in Puerto
Rico and the scale and breadth to better serve retail and commercial customers Source: S&P Global Market Intelligence, Commissioner of Financial Institutions of Puerto Rico.1 Balances as of June 30, 2019.2 Net of brokered deposits.3 Pro
forma FirstBank excludes cash to be used for the transaction.4 Pro forma FirstBank excludes $171 million of nonaccrual loans and $75 million JetBlue portfolio not acquired in transaction. Puerto Rico Total Assets1 ($ billions) Puerto Rico
Total Loans1 ($ billions) Puerto Rico Deposits1,2 ($ billions) FBP BSPR Institutions Portfolio Balance Market Share 1 Banco Popular $38.8 56.6% 2 PF FirstBank (PR Only)3 15.0 21.8% 3 PF Oriental (PR Only) 10.6
15.4% FirstBank 9.9 14.5% Oriental Bank 6.3 9.2% Santander 6.2 9.0% Scotiabank 4.3 6.2% 4 Citibank 3.8 5.5% 5 Banco Cooperativo 0.5 0.8% 6 Banesco 0.1 0.2% Total $68.8
100.0% Institutions Portfolio Balance Market Share 1 Banco Popular $17.9 49.0% 2 PF FirstBank (PR Only)4 9.8 26.8% FirstBank 6.9 18.8% 3 PF Oriental (PR Only) 6.6 18.1% Oriental Bank 4.3
11.9% Santander 3.1 8.4% Scotiabank 2.3 6.3% 4 Citibank 0.4 1.1% 5 Banco Cooperativo 0.1 0.4% 6 Others 1.8 4.8% Total $36.6 100.0% Institutions Portfolio Balance Market Share 1 Banco Popular
$33.8 59.6% 2 PF FirstBank (PR Only) 11.3 20.0% 3 PF Oriental (PR Only) 7.4 13.0% FirstBank 6.3 11.1% Santander 5.0 8.9% Oriental Bank 4.6 8.0% 4 Citibank 3.7 6.5% Scotiabank 2.8 5.0% 5 Banco
Cooperativo 0.4 0.8% 6 Banesco 0.1 0.2% Total $56.7 100.0% 34
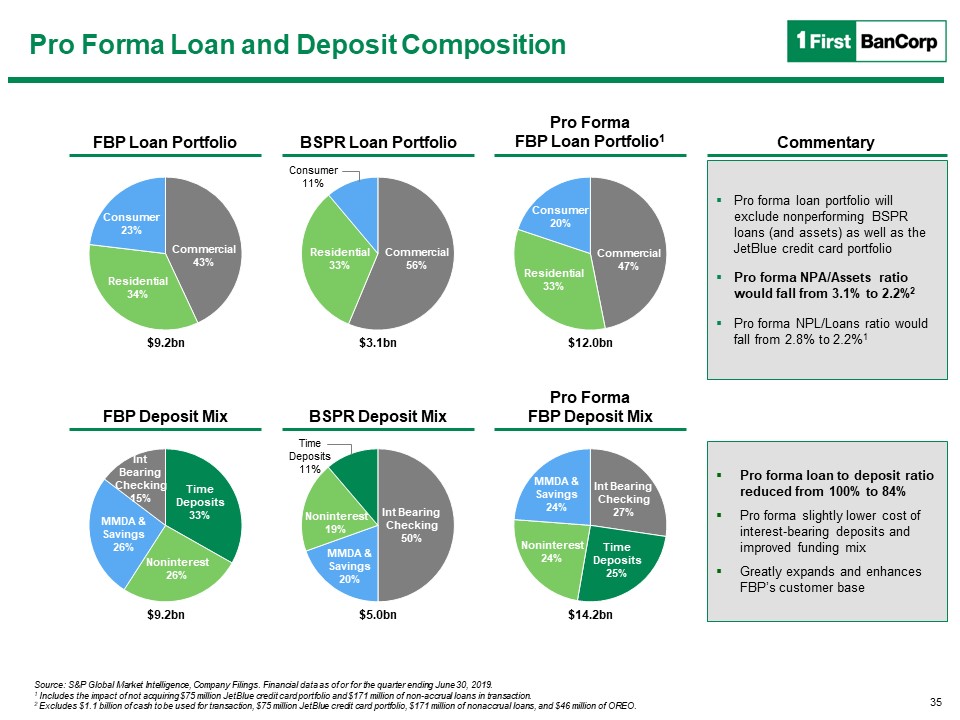
Pro Forma Loan and Deposit Composition FBP Loan Portfolio BSPR Loan Portfolio Pro FormaFBP Loan
Portfolio1 Commentary FBP Deposit Mix BSPR Deposit Mix Pro FormaFBP Deposit Mix Pro forma loan portfolio will exclude nonperforming BSPR loans (and assets) as well as the JetBlue credit card portfolioPro forma NPA/Assets ratio would fall
from 3.1% to 2.2%2Pro forma NPL/Loans ratio would fall from 2.8% to 2.2%1 Pro forma loan to deposit ratio reduced from 100% to 84%Pro forma slightly lower cost of interest-bearing deposits and improved funding mixGreatly expands and enhances
FBP’s customer base $9.2bn $3.1bn $12.0bn $9.2bn $5.0bn $14.2bn Source: S&P Global Market Intelligence, Company Filings. Financial data as of or for the quarter ending June 30, 2019.1 Includes the impact of not acquiring $75 million
JetBlue credit card portfolio and $171 million of non-accrual loans in transaction.2 Excludes $1.1 billion of cash to be used for transaction, $75 million JetBlue credit card portfolio, $171 million of nonaccrual loans, and $46 million of
OREO. 35
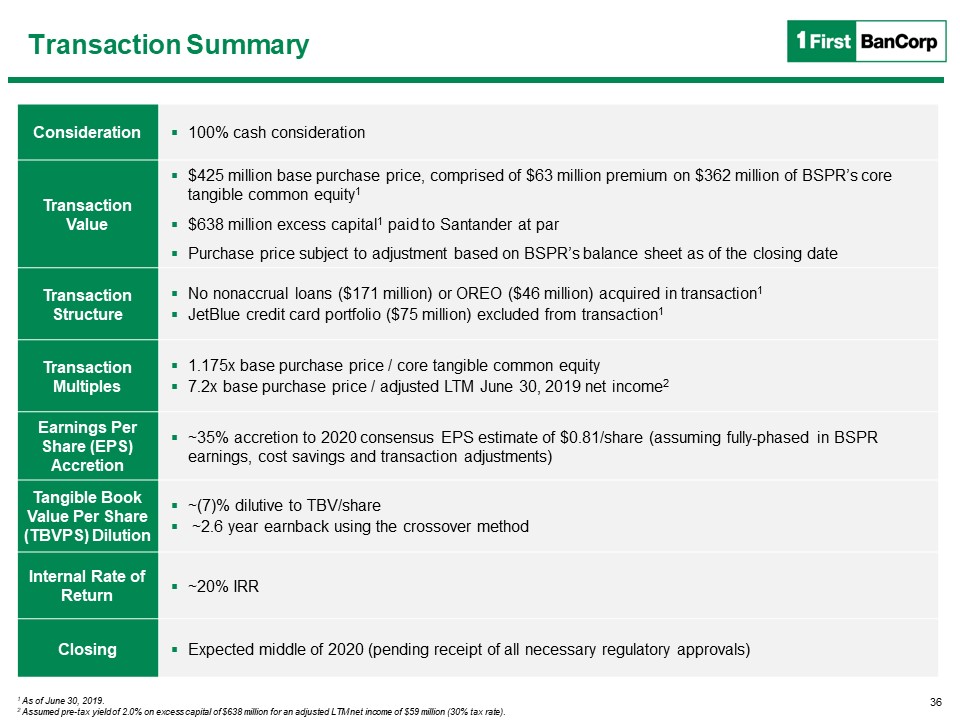
Transaction Summary Consideration 100% cash consideration Transaction Value $425 million base
purchase price, comprised of $63 million premium on $362 million of BSPR’s core tangible common equity1$638 million excess capital1 paid to Santander at parPurchase price subject to adjustment based on BSPR’s balance sheet as of the closing
date Transaction Structure No nonaccrual loans ($171 million) or OREO ($46 million) acquired in transaction1JetBlue credit card portfolio ($75 million) excluded from transaction1 Transaction Multiples 1.175x base purchase price / core
tangible common equity7.2x base purchase price / adjusted LTM June 30, 2019 net income2 Earnings Per Share (EPS) Accretion ~35% accretion to 2020 consensus EPS estimate of $0.81/share (assuming fully-phased in BSPR earnings, cost savings and
transaction adjustments) Tangible Book Value Per Share (TBVPS) Dilution ~(7)% dilutive to TBV/share ~2.6 year earnback using the crossover method Internal Rate of Return ~20% IRR Closing Expected middle of 2020 (pending receipt of all
necessary regulatory approvals) 1 As of June 30, 2019.2 Assumed pre-tax yield of 2.0% on excess capital of $638 million for an adjusted LTM net income of $59 million (30% tax rate). 36
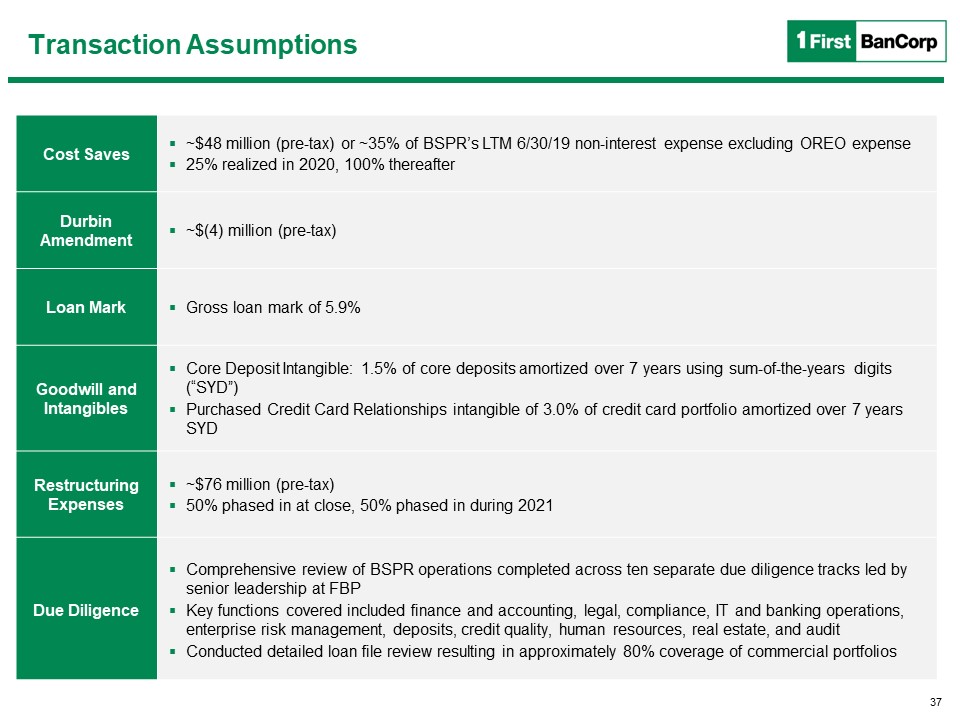
Transaction Assumptions Cost Saves ~$48 million (pre-tax) or ~35% of BSPR’s LTM 6/30/19 non-interest
expense excluding OREO expense25% realized in 2020, 100% thereafter Durbin Amendment ~$(4) million (pre-tax) Loan Mark Gross loan mark of 5.9% Goodwill and Intangibles Core Deposit Intangible: 1.5% of core deposits amortized over 7 years
using sum-of-the-years digits (“SYD”)Purchased Credit Card Relationships intangible of 3.0% of credit card portfolio amortized over 7 years SYD Restructuring Expenses ~$76 million (pre-tax)50% phased in at close, 50% phased in during
2021 Due Diligence Comprehensive review of BSPR operations completed across ten separate due diligence tracks led by senior leadership at FBPKey functions covered included finance and accounting, legal, compliance, IT and banking operations,
enterprise risk management, deposits, credit quality, human resources, real estate, and auditConducted detailed loan file review resulting in approximately 80% coverage of commercial portfolios 37
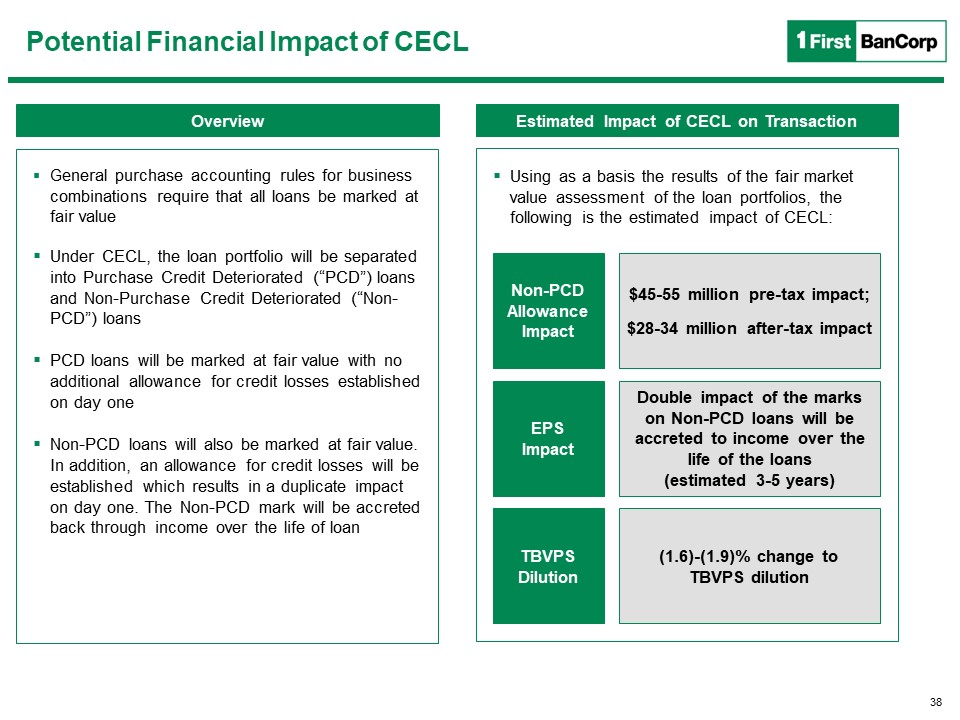
Potential Financial Impact of CECL Overview Estimated Impact of CECL on Transaction General purchase
accounting rules for business combinations require that all loans be marked at fair valueUnder CECL, the loan portfolio will be separated into Purchase Credit Deteriorated (“PCD”) loans and Non-Purchase Credit Deteriorated (“Non-PCD”) loansPCD
loans will be marked at fair value with no additional allowance for credit losses established on day oneNon-PCD loans will also be marked at fair value. In addition, an allowance for credit losses will be established which results in a
duplicate impact on day one. The Non-PCD mark will be accreted back through income over the life of loan $45-55 million pre-tax impact;$28-34 million after-tax impact Double impact of the marks on Non-PCD loans will be accreted to income
over the life of the loans (estimated 3-5 years) (1.6)-(1.9)% change to TBVPS dilution Non-PCD Allowance Impact EPS Impact TBVPS Dilution Using as a basis the results of the fair market value assessment of the loan portfolios, the
following is the estimated impact of CECL: 38