
HII 8-K
Huntington Ingalls Industries, Inc. (HII)
8-K
2020-08-06
For: 2020-08-06
View Original
Added on
April 08, 2026
UNITED STATES
SECURITIES AND EXCHANGE COMMISSION
Washington, D.C. 20549
_____________________________________
FORM 8-K
_____________________________________
CURRENT REPORT
Pursuant to Section 13 or 15(d) of the Securities Exchange Act of 1934
Date of Report (Date of earliest event reported)
_____________________________________
(Exact name of registrant as specified in its charter)
_____________________________________
| (State or other jurisdiction of incorporation) | (Commission File Number) | (IRS Employer Identification No.) | ||||||||||||
| (Address of principal executive offices) | (Zip Code) | |||||||||||||
(757 ) 380-2000
(Registrant’s telephone number, including area code)
(Former name or former address, if changed since last report)
Securities registered pursuant to Section 12(b) of the Act:
| Title of each class | Trading Symbol(s) | Name of each exchange on which registered | ||||||
Check the appropriate box below if the Form 8-K filing is intended to simultaneously satisfy the filing obligation of the registrant under any of the following provisions:
| Written communications pursuant to Rule 425 under the Securities Act (17 CFR 230.425) | |||||
| Soliciting material pursuant to Rule 14a-12 under the Exchange Act (17 CFR 240.14a-12) | |||||
| Pre-commencement communications pursuant to Rule 14d-2(b) under the Exchange Act (17 CFR 240.14d-2(b)) | |||||
| Pre-commencement communications pursuant to Rule 13e-4(c) under the Exchange Act (17 CFR 240.13e-4(c)) | |||||
Indicate by check mark whether the registrant is an emerging growth company as defined in Rule 405 of the Securities Act of 1933 (§230.405 of this chapter) or Rule 12b-2 of the Securities Exchange Act of 1934 (§240.12b-2 of this chapter).
Emerging growth company ☐
If an emerging growth company, indicate by check mark if the registrant has elected not to use the extended transition period for complying with any new or revised financial accounting standards provided pursuant to Section 13(a) of the Exchange Act. ☐
| Item 2.02. | Results of Operations and Financial Condition. | ||||
On August 6, 2020, Huntington Ingalls Industries, Inc. issued a press release announcing its financial results for the quarter ended June 30, 2020. A copy of the press release is furnished as Exhibit 99.1 hereto. Also furnished as Exhibit 99.2 is the corporation’s earnings presentation for the second quarter 2020 earnings release conference call.
| Item 9.01. | Financial Statements and Exhibits. | ||||
| (d) | Exhibits. | ||||
| Exhibit No. | Description | |||||||
| 99.1 | ||||||||
| 99.2 | ||||||||
| 104 | Cover Page Interactive Data File (embedded within Inline XBRL document) | |||||||
SIGNATURES
Pursuant to the requirements of the Securities Exchange Act of 1934, the registrant has duly caused this report to be signed on its behalf by the undersigned hereunto duly authorized.
| HUNTINGTON INGALLS INDUSTRIES, INC. | ||||||||||||||||||||
| Date: August 6, 2020 | By: | /s/ Christopher D. Kastner | ||||||||||||||||||
| Christopher D. Kastner | ||||||||||||||||||||
| Executive Vice President and Chief Financial Officer | ||||||||||||||||||||
 | Exhibit 99.1 News Release | |||||||
Contacts:
Jerri Fuller Dickseski (Media)
757-380-2341
Dwayne Blake (Investors)
757-380-2104
Huntington Ingalls Industries Reports Second Quarter 2020 Results, Provides COVID-19 Update and Updates 2020 Outlook
•Revenues were $2.0 billion in the quarter
•Operating margin was 2.8%
•Diluted earnings per share was $1.30
•Cash from operations was $201 million, and free cash flow1 was $126 million
•Backlog of $46.1 billion
NEWPORT NEWS, Va. (August 6, 2020) - Huntington Ingalls Industries (NYSE:HII) reported second quarter 2020 revenues of $2.0 billion, down 7.4% from the second quarter of 2019. Operating income in the quarter was $57 million and operating margin was 2.8%, compared to $175 million and 8.0%, respectively, in the second quarter of 2019.
The decreases in the quarter were primarily driven by unfavorable cumulative catch-up adjustments totaling $167 million resulting from updated cost and schedule assumptions across all programs. This includes $61 million resulting from discrete COVID-19 related delay and disruption estimates across all programs, including impacts from lower employee attendance, availability of critical skills, and out-of-sequence work, attributable to, among other things, orders of civil authorities associated with COVID-19 and steps taken to mitigate the effects of COVID-19.
The majority of the unfavorable adjustments were related to Block IV boats of the Virginia-class submarine program, totaling $111 million, for unfavorable cost and schedule performance and updates to our assumptions for future program efficiencies and performance as a result of cost and schedule trends, and includes impacts of COVID-19 delay and disruption totaling $16 million.
Net earnings in the quarter were $53 million, compared to $128 million in the second quarter of 2019. The decrease in net earnings for the quarter was the result of lower operating income, partially offset by a more favorable operating FAS/CAS adjustment and FAS (non-service) pension benefit.
Diluted earnings per share in the quarter was $1.30, compared to $3.07 in the same period of 2019.
Second quarter cash from operations was $201 million and free cash flow1 was $126 million, compared to negative $44 million and negative $135 million, respectively, in the second quarter of 2019.
New contract awards in the quarter were approximately $2.9 billion, bringing total backlog to approximately $46.1 billion as of June 30, 2020.
1Non-GAAP measure. See Exhibit B for definition and reconciliation.
Huntington Ingalls Industries
4101 Washington Ave. • Newport News, VA 23607
www.huntingtoningalls.com
Page 1 of 15
| Exhibit 99.1 News Release | |||||||
COVID-19 Update
"We continue to aggressively manage our response to the ongoing COVID-19 pandemic. The health and safety of our employees remains paramount as we continue our important work to support the nation’s defense,” said Mike Petters, HII president and CEO. "As we discussed when we provided our first quarter results, staffing at our shipyards has been significantly impacted by the pandemic as we worked to preserve the significant investments in human capital that we have made over the past five years. As a result of the pandemic and our response, hourly production workforce attendance at our shipyards averaged approximately 65% during the second quarter." Petters continued, "The delay and disruption from lower attendance, availability of critical skills, and out-of-sequence work caused by COVID-19 has impacted our ability to complete work as efficiently as initially planned and has added incremental program cost and pushed schedules and milestones to the right, which is incorporated in our results and updated outlook for 2020."
Virginia-class Submarine Program Update
"Our assumptions on Block IV of the Virginia-class submarine program called for boat-to-boat cost and schedule improvements as we worked down the learning curve," said Petters. "As we conducted our regular quarterly program status reviews, it became clear that performance trends, exacerbated by the COVID-19 pandemic environment, now make those improvements less likely to occur. As a result, we are resetting our risk registers to reflect the performance trends we experienced in the quarter, including the impacts of COVID-19."
In the quarter, the $111 million unfavorable cumulative catch-up adjustments on the Block IV boats of the Virginia-class submarine program included $95 million for cost and schedule performance and updates to our assumptions for future program efficiencies and performance as a result of cost and schedule trends, as well as $16 million from delay and disruption directly attributable to COVID-19.
“There is no doubt that this quarter was challenging,” said Petters. “However, when I look at the leadership team we have in place, the workforce we have hired, trained and certified over the past few years and the record backlog of work we have in front of us, I am very excited about the future of the shipbuilding business.”
Updated Financial Outlook
“We have revised our 2020 outlook for updated cost and schedule assumptions across our programs,” said Chris Kastner, HII chief financial officer. "Regarding COVID-19, we have assumed limited relief for costs directly related to our pandemic response but have made no assumption for equitable adjustments for the delay and disruption caused by COVID-19. Our guidance also assumes an orderly recovery to normalized attendance levels at both shipyards."
•Expect shipbuilding revenue between $7.6 and $7.9 billion; shipbuilding operating margin1 between 5.5% and 6.5%
•Expect Technical Solutions revenue between $1.2 and $1.25 billion and operating margin between 2.0% and 2.4%
◦Assumes San Diego Shipyard closing occurs in Q3 2020, and UPI closing occurs in Q4 2020
•Expect 2020 free cash flow1 in excess of $500 million
1Non-GAAP measure. See Exhibit B for definition and reconciliation
Huntington Ingalls Industries
4101 Washington Ave. • Newport News, VA 23607
www.huntingtoningalls.com
Page 2 of 15
Results of Operations
| Three Months Ended | Six Months Ended | ||||||||||||||||||||||||||||
| June 30 | June 30 | ||||||||||||||||||||||||||||
| ($ in millions, except per share amounts) | 2020 | 2019 | $ Change | % Change | 2020 | 2019 | $ Change | % Change | |||||||||||||||||||||
| Sales and service revenues | $ | 2,027 | $ | 2,188 | $ | (161) | (7.4) | % | $ | 4,290 | $ | 4,268 | $ | 22 | 0.5 | % | |||||||||||||
| Operating income | 57 | 175 | (118) | (67.4) | % | 272 | 336 | (64) | (19.0) | % | |||||||||||||||||||
| Operating margin % | 2.8 | % | 8.0 | % | (519) bps | 6.3 | % | 7.9 | % | (153) bps | |||||||||||||||||||
Segment operating income (loss)1 | (5) | 138 | (143) | (103.6) | % | 151 | 267 | (116) | (43.4) | % | |||||||||||||||||||
Segment operating margin %1 | (0.2) | % | 6.3 | % | (655) bps | 3.5 | % | 6.3 | % | (274) bps | |||||||||||||||||||
| Net earnings | 53 | 128 | (75) | (58.6) | % | 225 | 246 | (21) | (8.5) | % | |||||||||||||||||||
| Diluted earnings per share | $ | 1.30 | $ | 3.07 | $ | (1.77) | (57.7) | % | $ | 5.54 | $ | 5.91 | $ | (0.37) | (6.3) | % | |||||||||||||
| Pension Adjusted Figures | |||||||||||||||||||||||||||||
Net earnings2 | (20) | 97 | (117) | (120.6) | % | 78 | 186 | (108) | (58.1) | % | |||||||||||||||||||
Diluted earnings per share2 | $ | (0.49) | $ | 2.33 | $ | (2.82) | (121.0) | % | $ | 1.92 | $ | 4.47 | $ | (2.55) | (57.0) | % | |||||||||||||
1 Non-GAAP measures that exclude non-segment factors affecting operating income. See Exhibit B for definitions and reconciliations. | |||||||||||||||||||||||||||||
2 Non-GAAP measures that exclude the impacts of the FAS/CAS Adjustment. See Exhibit B for reconciliation. | |||||||||||||||||||||||||||||
Segment Operating Results
Ingalls Shipbuilding
| Three Months Ended | Six Months Ended | ||||||||||||||||||||||||||||
| June 30 | June 30 | ||||||||||||||||||||||||||||
| ($ in millions) | 2020 | 2019 | $ Change | % Change | 2020 | 2019 | $ Change | % Change | |||||||||||||||||||||
| Revenues | $ | 622 | $ | 622 | $ | — | — | % | $ | 1,251 | $ | 1,206 | $ | 45 | 3.7 | % | |||||||||||||
Segment operating income1 | 55 | 69 | (14) | (20.3) | % | 123 | 115 | 8 | 7.0 | % | |||||||||||||||||||
Segment operating margin %1 | 8.8 | % | 11.1 | % | (225) bps | 9.8 | % | 9.5 | % | 30 bps | |||||||||||||||||||
1 Non-GAAP measures. See Exhibit B for definitions and reconciliations. | |||||||||||||||||||||||||||||
Ingalls Shipbuilding revenues for the second quarter of 2020 were $622 million, flat from the same period in 2019, driven by higher revenues on the Legend-class National Security Cutter (NSC) program, the San Antonio-class LPD program and the America-class LHA program, offset by lower revenues on the Arleigh Burke-class DDG program. Higher NSC program revenues were primarily due to higher volumes on Calhoun (NSC 10) and Friedman (NSC 11), partially offset by lower volume on Midgett (NSC 8). Higher LPD and LHA program revenues were primarily due to higher volumes on Harrisburg (LPD 30), Richard M. McCool Jr. (LPD 29), and LHA 9 (unnamed), partially offset by lower volumes on Tripoli (LHA 7) and Bougainville (LHA 8). Lower DDG program revenues were primarily due to lower volumes on USS Fitzgerald (DDG 62) restoration and modernization, Jack H. Lucas (DDG 125), and Frank E. Petersen Jr. (DDG 121), partially offset by higher volumes on Ted Stevens (DDG 128), Delbert D. Black (DDG 119), and Sam Nunn (DDG 133).
Ingalls Shipbuilding segment operating income for the second quarter was $55 million, a decrease of $14 million from the same period last year. Segment operating margin in the quarter was 8.8%, compared to 11.1% in the same period last year. The decrease was primarily driven by unfavorable adjustments, including delay and disruption from COVID-19 and lower risk retirement on the Legend-class NSC program, partially offset by higher risk retirement on Delbert D. Black (DDG 119) in connection with its delivery and a capital expenditure contract incentive.
Huntington Ingalls Industries
4101 Washington Ave. • Newport News, VA 23607
www.huntingtoningalls.com
Page 3 of 15
Key Ingalls Shipbuilding milestones for the quarter:
•Delivered guided missile destroyer Delbert D. Black (DDG 119) to the U.S. Navy
•Redelivered USS Fitzgerald (DDG 62) after completion of restoration and modernization
•Awarded a $1.5 billion contract for the construction of amphibious transport dock LPD 31
•Awarded a $936 million contract for the construction of an additional Arleigh Burke-class (DDG 51) Flight III destroyer
•Awarded advance procurement contracts for amphibious assault ship LHA 9 totaling $332 million
•Awarded LCS planning yard contract worth a potential $108 million
Newport News Shipbuilding
| Three Months Ended | Six Months Ended | ||||||||||||||||||||||||||||
| June 30 | June 30 | ||||||||||||||||||||||||||||
| ($ in millions) | 2020 | 2019 | $ Change | % Change | 2020 | 2019 | $ Change | % Change | |||||||||||||||||||||
| Revenues | $ | 1,122 | $ | 1,279 | $ | (157) | (12.3) | % | $ | 2,463 | $ | 2,558 | $ | (95) | (3.7) | % | |||||||||||||
Segment operating income (loss)1 | (69) | 71 | (140) | (197.2) | % | 26 | 152 | (126) | (82.9) | % | |||||||||||||||||||
Segment operating margin %1 | (6.1) | % | 5.6 | % | (1170) bps | 1.1 | % | 5.9 | % | (489) bps | |||||||||||||||||||
1 Non-GAAP measures. See Exhibit B for definitions and reconciliations. | |||||||||||||||||||||||||||||
Newport News Shipbuilding revenues for the second quarter of 2020 were $1.1 billion, a decrease of $157 million, or 12.3%, from the same period in 2019, driven by lower revenues in aircraft carriers and submarine construction, partially offset by higher revenues in submarine and carrier fleet support services. Aircraft carrier revenues decreased primarily as a result of lower volumes on the refueling and complex overhaul (RCOH) of USS George Washington (CVN 73), USS Gerald R. Ford (CVN 78), and Kennedy (CVN 79), partially offset by higher volumes on the advance planning contract for the RCOH of USS John C. Stennis (CVN 74) and Enterprise (CVN 80). Submarine revenues decreased primarily as a result of lower volumes on the Virginia-class submarine program, partially offset by higher volume on the Columbia-class submarine program. The lower volume on the Virginia-class submarine program was due to lower volumes on Block IV and Block III boats, partially offset by higher volumes on Block V boats.
Newport News Shipbuilding segment operating loss for the second quarter was $69 million, compared to operating income of $71 million from the same period last year. Segment operating margin was (6.1)% for the quarter, compared to 5.6% in the same period last year. These decreases were primarily due to unfavorable cumulative catch-up adjustments on Block IV boats of the Virginia-class submarine program for unfavorable cost and schedule performance and updates to our assumptions for future program efficiencies and performance as a result of cost and schedule trends, as well as the impact of discrete COVID-19 delay and disruption.
Key Newport News Shipbuilding milestones for the quarter:
•John F. Kennedy (CVN 79) is approximately 74% complete
•The RCOH of USS George Washington (CVN 73) is approximately 78% complete
Huntington Ingalls Industries
4101 Washington Ave. • Newport News, VA 23607
www.huntingtoningalls.com
Page 4 of 15
Technical Solutions
| Three Months Ended | Six Months Ended | ||||||||||||||||||||||||||||
| June 30 | June 30 | ||||||||||||||||||||||||||||
| ($ in millions) | 2020 | 2019 | $ Change | % Change | 2020 | 2019 | $ Change | % Change | |||||||||||||||||||||
| Revenues | $ | 320 | $ | 321 | $ | (1) | (0.3) | % | $ | 637 | $ | 561 | 76 | 13.5 | % | ||||||||||||||
Segment operating income (loss)1 | 9 | (2) | $ | 11 | 550.0 | % | 2 | — | 2 | — | % | ||||||||||||||||||
Segment operating margin %1 | 2.8 | % | (0.6) | % | 344 bps | 0.3 | % | — | % | 31 bps | |||||||||||||||||||
1 Non-GAAP measures. See Exhibit B for definitions and reconciliations. | |||||||||||||||||||||||||||||
Technical Solutions revenues for the second quarter of 2020 were $320 million, a decrease of $1 million from the same period in 2019, primarily driven by lower mission driven innovative solutions (MDIS), fleet support and nuclear and environmental services revenues, partially offset by the acquisition of Hydroid in 2020 and higher revenues on oil and gas services.
Technical Solutions segment operating income for the second quarter was $9 million, compared to segment operating loss of $2 million in second quarter 2019. The increase was primarily driven by the loss on a fleet support contract in the prior year period.
Key Technical Solutions milestones for the quarter:
•Awarded a contract to provide analytical support services to the U.S. Special Operations Command’s Intelligence Directorate
•One of five companies awarded an indefinite delivery/indefinite quantity contract with the U.S. Postal Service Office of Inspector General to provide support services to the Office of the Chief Information Officer
2020 Outlook
The financial outlook, expectations and other forward looking statements provided by the company for 2020 and beyond, reflect the company's judgment based on the information available at the time of this release.
The COVID-19 global pandemic has had wide ranging effects on the global health environment and disrupted the global and U.S. economies and financial markets, including impacts to our employees, customers, suppliers, and communities. The pandemic is also impacting our operations, and the full impacts of COVID-19 on our fiscal year 2020 financial results and beyond are uncertain. We believe that the most significant elements of uncertainty are the intensity and duration of the impact on our employees’ ability to work effectively, disruption in our supply chain, disruption of the U.S. Government's and our other customers' abilities to perform their obligations, and impact on pension assets and other investment performance.
We have incurred and expect to continue incurring costs related to our COVID-19 response, including paid leave, quarantining employees and recurring facility cleaning. While our shipyards and other facilities remain open and productive, we have experienced a decrease in workforce attendance, which has impacted our operations with delay and disruption from availability of critical skills and out-of-sequence work. Continued lower staffing levels and lower employee productivity could impact our ability to achieve anticipated milestones and further affect our 2020 financial results and beyond.
Our employees, suppliers, customers, and communities are facing significant challenges, and we cannot predict how the COVID-19 environment will evolve or the impact it will have. For further information on the potential impact of COVID-19 to the company, see “Risk Factors” in our second quarter Form 10-Q.
Huntington Ingalls Industries
4101 Washington Ave. • Newport News, VA 23607
www.huntingtoningalls.com
Page 5 of 15
| 2020 Prior Outlook (May 2020) | 2020 Revised Outlook (Aug. 2020) | ||||||||||
Shipbuilding Revenue1 | Lower end of 3% to 5% YoY Growth | $7.6B - $7.9B | |||||||||
Shipbuilding Operating Margin1 | 9% | 5.5% - 6.5% | |||||||||
Technical Solutions Revenue2 Technical Solutions Revenue (Ex. UPI & SDSY) | N/A ~$1B | $1.2B - $1.25B$0.9B - $1.0B | |||||||||
Technical Solutions Operating Margin2 Technical Solutions Operating Margin (Ex. UPI & SDSY) | N/A N/A | 2.0% - 2.4% 2.8% - 3.2% | |||||||||
Technical Solutions EBITDA Margin1,2 Technical Solutions EBITDA Margin (Ex. UPI & SDSY)1 | N/A 7 - 9% | 5.7% - 6.0% 7.7% - 8.0% | |||||||||
| Operating FAS/CAS Adjustment | $247M | $247M | |||||||||
| Non-current State Income Tax Expense | $4M | $10M | |||||||||
Interest Expense3 | $104M | $106M | |||||||||
| Non-operating Retirement Benefit | $120M | $120M | |||||||||
| Effective Tax Rate | ~21% | ~21% | |||||||||
| Depreciation & Amortization | ~$250M | ~$250M | |||||||||
| Capital Expenditures | 4-5% of Sales | ~5% of Sales | |||||||||
Free Cash Flow1 | >$500M | >$500M | |||||||||
1 Non-GAAP measures. See Exhibit B for definition.
2 Includes results from San Diego Shipyard through August 2020 and includes results from Universal Pegasus International through Dec. 2020.
3 Includes a $15M call premium for 5.0% senior notes due 2025, with first call date in November 2020.
About Huntington Ingalls Industries
Huntington Ingalls Industries is America’s largest military shipbuilding company and a provider of professional services to partners in government and industry. For more than a century, HII’s Newport News and Ingalls shipbuilding divisions in Virginia and Mississippi have built more ships in more ship classes than any other U.S. naval shipbuilder. HII’s Technical Solutions division supports national security missions around the globe with unmanned systems, defense and federal solutions, and nuclear and environmental services. Headquartered in Newport News, Virginia, HII employs more than 42,000 people operating both domestically and internationally. For more information, please visit www.huntingtoningalls.com.
Conference Call Information
Huntington Ingalls Industries will webcast its earnings conference call at 9 a.m. Eastern time today. A live audio broadcast of the conference call and supplemental presentation will be available on the investor relations page of the company’s website: www.huntingtoningalls.com. A telephone replay of the conference call will be available from noon today through Wednesday, August 12 by calling toll-free (855) 859-2056 or (404) 537-3406 and using conference ID 8565843.
Huntington Ingalls Industries
4101 Washington Ave. • Newport News, VA 23607
www.huntingtoningalls.com
Page 6 of 15
Forward-Looking Statements
Statements in this release, other than statements of historical fact, constitute “forward-looking statements” within the meaning of the Private Securities Litigation Reform Act of 1995. Forward-looking statements involve risks and uncertainties that could cause our actual results to differ materially from those expressed in these statements. Factors that may cause such differences include: changes in government and customer priorities and requirements (including government budgetary constraints, shifts in defense spending, and changes in customer short-range and long-range plans); our ability to estimate our future contract costs and perform our contracts effectively; changes in procurement processes and government regulations and our ability to comply with such requirements; our ability to deliver our products and services at an affordable life cycle cost and compete within our markets; natural and environmental disasters and political instability; our ability to execute our strategic plan, including with respect to share repurchases, dividends, capital expenditures and strategic acquisitions; adverse economic conditions in the United States and globally; health epidemics, pandemics and similar outbreaks, including the COVID-19 pandemic; changes in key estimates and assumptions regarding our pension and retiree health care costs; security threats, including cyber security threats, and related disruptions; and other risk factors discussed in our filings with the U.S. Securities and Exchange Commission. There may be other risks and uncertainties that we are unable to predict at this time or that we currently do not expect to have a material adverse effect on our business, and we undertake no obligation to update any forward-looking statements. You should not place undue reliance on any forward-looking statements that we may make. This release also contains non-GAAP financial measures and includes a GAAP reconciliation of these financial measures. Non-GAAP financial measures should not be construed as being more important than comparable GAAP measures.
Huntington Ingalls Industries
4101 Washington Ave. • Newport News, VA 23607
www.huntingtoningalls.com
Page 7 of 15
Exhibit A: Financial Statements
HUNTINGTON INGALLS INDUSTRIES, INC.
CONSOLIDATED STATEMENTS OF OPERATIONS AND COMPREHENSIVE INCOME
| Three Months Ended June 30 | Six Months Ended June 30 | |||||||||||||||||||||||||
| (in millions, except per share amounts) | 2020 | 2019 | 2020 | 2019 | ||||||||||||||||||||||
| Sales and service revenues | ||||||||||||||||||||||||||
| Product sales | $ | 1,420 | $ | 1,520 | $ | 3,044 | $ | 3,010 | ||||||||||||||||||
| Service revenues | 607 | 668 | 1,246 | 1,258 | ||||||||||||||||||||||
| Sales and service revenues | 2,027 | 2,188 | 4,290 | 4,268 | ||||||||||||||||||||||
| Cost of sales and service revenues | ||||||||||||||||||||||||||
| Cost of product sales | 1,253 | 1,250 | 2,543 | 2,508 | ||||||||||||||||||||||
| Cost of service revenues | 510 | 584 | 1,060 | 1,078 | ||||||||||||||||||||||
| Income from operating investments, net | 7 | 5 | 13 | 9 | ||||||||||||||||||||||
| General and administrative expenses | 214 | 184 | 428 | 355 | ||||||||||||||||||||||
| Operating income | 57 | 175 | 272 | 336 | ||||||||||||||||||||||
| Other income (expense) | ||||||||||||||||||||||||||
| Interest expense | (25) | (18) | (41) | (34) | ||||||||||||||||||||||
| Non-operating retirement benefit | 30 | 2 | 60 | 5 | ||||||||||||||||||||||
| Other, net | 3 | 5 | (10) | 6 | ||||||||||||||||||||||
| Earnings before income taxes | 65 | 164 | 281 | 313 | ||||||||||||||||||||||
| Federal and foreign income taxes | 12 | 36 | 56 | 67 | ||||||||||||||||||||||
| Net earnings | $ | 53 | $ | 128 | $ | 225 | $ | 246 | ||||||||||||||||||
| Basic earnings per share | $ | 1.30 | $ | 3.07 | $ | 5.54 | $ | 5.91 | ||||||||||||||||||
| Weighted-average common shares outstanding | 40.7 | 41.7 | 40.6 | 41.6 | ||||||||||||||||||||||
| Diluted earnings per share | $ | 1.30 | $ | 3.07 | $ | 5.54 | $ | 5.91 | ||||||||||||||||||
| Weighted-average diluted shares outstanding | 40.7 | 41.7 | 40.6 | 41.6 | ||||||||||||||||||||||
| Dividends declared per share | $ | 1.03 | $ | 0.86 | $ | 2.06 | $ | 1.72 | ||||||||||||||||||
| Net earnings from above | $ | 53 | $ | 128 | $ | 225 | $ | 246 | ||||||||||||||||||
| Other comprehensive income | ||||||||||||||||||||||||||
| Change in unamortized benefit plan costs | 23 | 24 | 46 | 49 | ||||||||||||||||||||||
| Other | 1 | — | (1) | — | ||||||||||||||||||||||
| Tax expense for items of other comprehensive income | (6) | (6) | (12) | (12) | ||||||||||||||||||||||
| Other comprehensive income (loss), net of tax | 18 | 18 | 33 | 37 | ||||||||||||||||||||||
| Comprehensive income | $ | 71 | $ | 146 | $ | 258 | $ | 283 | ||||||||||||||||||
Huntington Ingalls Industries
4101 Washington Ave. • Newport News, VA 23607
www.huntingtoningalls.com
Page 8 of 15
HUNTINGTON INGALLS INDUSTRIES, INC.
CONSOLIDATED STATEMENTS OF FINANCIAL POSITION
| ($ in millions) | June 30, 2020 | December 31, 2019 | ||||||||||||
| Assets | ||||||||||||||
| Current Assets | ||||||||||||||
| Cash and cash equivalents | $ | 631 | $ | 75 | ||||||||||
| Accounts receivable, net of allowance for doubtful accounts of $1 million as of 2020 and $3 million as of 2019 | 494 | 318 | ||||||||||||
| Contract assets | 1,134 | 989 | ||||||||||||
| Inventoried costs, net | 160 | 136 | ||||||||||||
| Income taxes receivable | 104 | 148 | ||||||||||||
| Assets held for sale | 173 | 95 | ||||||||||||
| Prepaid expenses and other current assets | 43 | 24 | ||||||||||||
| Total current assets | 2,739 | 1,785 | ||||||||||||
| Property, plant, and equipment, net of accumulated depreciation of $1,975 million as of 2020 and $1,961 million as of 2019 | 2,879 | 2,832 | ||||||||||||
| Other Assets | ||||||||||||||
| Operating lease assets | 174 | 201 | ||||||||||||
| Goodwill | 1,576 | 1,373 | ||||||||||||
| Other intangible assets, net of accumulated amortization of $625 million as of 2020 and $599 million as of 2019 | 542 | 492 | ||||||||||||
| Deferred tax assets | 78 | 108 | ||||||||||||
| Miscellaneous other assets | 245 | 240 | ||||||||||||
| Total assets | $ | 8,233 | $ | 7,031 | ||||||||||
Huntington Ingalls Industries
4101 Washington Ave. • Newport News, VA 23607
www.huntingtoningalls.com
Page 9 of 15
HUNTINGTON INGALLS INDUSTRIES, INC.
CONSOLIDATED STATEMENTS OF FINANCIAL POSITION (continued)
| ($ in millions) | June 30, 2020 | December 31, 2019 | ||||||||||||
| Liabilities and Stockholders' Equity | ||||||||||||||
| Current Liabilities | ||||||||||||||
| Trade accounts payable | $ | 437 | $ | 497 | ||||||||||
| Accrued employees’ compensation | 301 | 265 | ||||||||||||
| Current portion of postretirement plan liabilities | 130 | 130 | ||||||||||||
| Current portion of workers’ compensation liabilities | 230 | 225 | ||||||||||||
| Contract liabilities | 573 | 373 | ||||||||||||
| Liabilities held for sale | 93 | 77 | ||||||||||||
| Other current liabilities | 350 | 323 | ||||||||||||
| Total current liabilities | 2,114 | 1,890 | ||||||||||||
| Long-term debt | 2,276 | 1,286 | ||||||||||||
| Pension plan liabilities | 882 | 975 | ||||||||||||
| Other postretirement plan liabilities | 376 | 380 | ||||||||||||
| Workers’ compensation liabilities | 464 | 457 | ||||||||||||
| Long-term operating lease liabilities | 147 | 164 | ||||||||||||
| Other long-term liabilities | 296 | 291 | ||||||||||||
| Total liabilities | 6,555 | 5,443 | ||||||||||||
| Commitments and Contingencies | ||||||||||||||
| Stockholders’ Equity | ||||||||||||||
| Common stock, $0.01 par value; 150 million shares authorized; 53.3 million shares issued and 40.5 million shares outstanding as of June 30, 2020, and 53.2 million shares issued and 40.8 million shares outstanding as of December 31, 2019 | 1 | 1 | ||||||||||||
| Additional paid-in capital | 1,961 | 1,961 | ||||||||||||
| Retained earnings | 3,150 | 3,009 | ||||||||||||
| Treasury stock | (2,058) | (1,974) | ||||||||||||
| Accumulated other comprehensive loss | (1,376) | (1,409) | ||||||||||||
| Total stockholders’ equity | 1,678 | 1,588 | ||||||||||||
| Total liabilities and stockholders’ equity | $ | 8,233 | $ | 7,031 | ||||||||||
Huntington Ingalls Industries
4101 Washington Ave. • Newport News, VA 23607
www.huntingtoningalls.com
Page 10 of 15
HUNTINGTON INGALLS INDUSTRIES, INC.
CONSOLIDATED STATEMENTS OF CASH FLOWS
| Six Months Ended June 30 | ||||||||||||||
| ($ in millions) | 2020 | 2019 | ||||||||||||
| Operating Activities | ||||||||||||||
| Net earnings | $ | 225 | $ | 246 | ||||||||||
| Adjustments to reconcile to net cash provided by (used in) operating activities | ||||||||||||||
| Depreciation | 92 | 83 | ||||||||||||
| Amortization of purchased intangibles | 26 | 23 | ||||||||||||
| Amortization of debt issuance costs | 3 | 1 | ||||||||||||
| Provision for doubtful accounts | 6 | (2) | ||||||||||||
| Stock-based compensation | 13 | 12 | ||||||||||||
| Deferred income taxes | 21 | 30 | ||||||||||||
| Loss (gain) on investments in marketable securities | 5 | (4) | ||||||||||||
| Change in | ||||||||||||||
| Accounts receivable | (167) | (301) | ||||||||||||
| Contract assets | (63) | (238) | ||||||||||||
| Inventoried costs | (13) | (1) | ||||||||||||
| Prepaid expenses and other assets | (4) | (39) | ||||||||||||
| Accounts payable and accruals | 172 | 107 | ||||||||||||
| Retiree benefits | (50) | 46 | ||||||||||||
| Other non-cash transactions, net | 3 | 4 | ||||||||||||
| Net cash provided by (used in) operating activities | 269 | (33) | ||||||||||||
| Investing Activities | ||||||||||||||
| Capital expenditures | ||||||||||||||
| Capital expenditure additions | (150) | (234) | ||||||||||||
| Grant proceeds for capital expenditures | 9 | 69 | ||||||||||||
| Acquisitions of businesses, net of cash received | (378) | (196) | ||||||||||||
| Net cash used in investing activities | (519) | (361) | ||||||||||||
| Financing Activities | ||||||||||||||
| Proceeds from issuance of long-term debt | 1,000 | — | ||||||||||||
| Proceeds from revolving credit facility borrowings | 385 | 3,286 | ||||||||||||
| Repayment of revolving credit facility borrowings | (385) | (2,872) | ||||||||||||
| Debt issuance costs | (13) | — | ||||||||||||
| Dividends paid | (84) | (72) | ||||||||||||
| Repurchases of common stock | (84) | (136) | ||||||||||||
| Employee taxes on certain share-based payment arrangements | (13) | (23) | ||||||||||||
| Net cash provided by financing activities | 806 | 183 | ||||||||||||
| Change in cash and cash equivalents | 556 | (211) | ||||||||||||
| Cash and cash equivalents, beginning of period | 75 | 240 | ||||||||||||
| Cash and cash equivalents, end of period | $ | 631 | $ | 29 | ||||||||||
| Supplemental Cash Flow Disclosure | ||||||||||||||
| Cash paid for income taxes | $ | 23 | $ | 89 | ||||||||||
| Cash paid for interest | $ | 32 | $ | 35 | ||||||||||
| Non-Cash Investing and Financing Activities | ||||||||||||||
| Capital expenditures accrued in accounts payable | $ | 5 | $ | 9 | ||||||||||
Huntington Ingalls Industries
4101 Washington Ave. • Newport News, VA 23607
www.huntingtoningalls.com
Page 11 of 15
Exhibit B: Non-GAAP Measures Definitions & Reconciliations
We make reference to "segment operating income," "segment operating margin," "shipbuilding revenue," "shipbuilding operating margin," "Technical Solutions EBITDA margin," "adjusted net earnings," "adjusted diluted earnings per share" and "free cash flow."
We internally manage our operations by reference to segment operating income and segment operating margin, which are not recognized measures under GAAP. When analyzing our operating performance, investors should use segment operating income and segment operating margin in addition to, and not as alternatives for, operating income and operating margin or any other performance measure presented in accordance with GAAP. They are measures that we use to evaluate our core operating performance. We believe that segment operating income, segment operating margin and shipbuilding operating margin reflect an additional way of viewing aspects of our operations that, when viewed with our GAAP results, provide a more complete understanding of factors and trends affecting our business. We believe these measures are used by investors and are a useful indicator to measure our performance. Because not all companies use identical calculations, our presentation of segment operating income and segment operating margin may not be comparable to similarly titled measures of other companies.
Adjusted net earnings and adjusted diluted earnings per share are not measures recognized under GAAP. They should be considered supplemental to and not a substitute for financial information prepared in accordance with GAAP. We believe these measures are useful to investors because they exclude items that do not reflect our core operating performance. They may not be comparable to similarly titled measures of other companies.
Shipbuilding revenue, shipbuilding operating margin and Technical Solutions EBITDA margin are not measures recognized under GAAP. They should be considered supplemental to and not a substitute for financial information prepared in accordance with GAAP. They may not be comparable to similarly titled measures of other companies.
Free cash flow is not a measure recognized under GAAP. Free cash flow has limitations as an analytical tool and should not be considered in isolation from, or as a substitute for, analysis of our results as reported under GAAP. We believe free cash flow is an important measure for our investors because it provides them insight into our current and period-to-period performance and our ability to generate cash from continuing operations. We also use free cash flow as a key operating metric in assessing the performance of our business and as a key performance measure in evaluating management performance and determining incentive compensation. Free cash flow may not be comparable to similarly titled measures of other companies.
Segment operating income (loss) is defined as operating income (loss) for the relevant segment(s) before the Operating FAS/CAS Adjustment and non-current state income taxes.
Segment operating margin is defined as segment operating income (loss) as a percentage of sales and service revenues.
Shipbuilding revenue is defined as the combined sales and service revenues from our Newport News Shipbuilding segment and Ingalls Shipbuilding segment.
Shipbuilding operating margin is defined as the combined segment operating margin of our Newport News Shipbuilding segment and Ingalls Shipbuilding segment as a percentage of combined sales and service revenues from our Newport News Shipbuilding segment and Ingalls Shipbuilding segment.
Technical Solutions EBITDA margin is defined as Technical Solutions segment operating income before interest expense, income taxes, depreciation, and amortization as a percentage of revenues.
Adjusted net earnings is defined as net earnings adjusted for the after-tax impact of the FAS/CAS Adjustment.
Adjusted diluted earnings per share is defined as adjusted net earnings divided by the weighted-average diluted common shares outstanding.
Huntington Ingalls Industries
4101 Washington Ave. • Newport News, VA 23607
www.huntingtoningalls.com
Page 12 of 15
Free cash flow is defined as net cash provided by (used in) operating activities less capital expenditures net of related grant proceeds.
FAS/CAS Adjustment is defined as the difference between expenses for pension and other postretirement benefits determined in accordance with GAAP (FAS) and the expenses determined in accordance with U.S. Cost Accounting Standards (CAS).
Operating FAS/CAS Adjustment is defined as the difference between the service cost component of our pension and other postretirement expense determined in accordance with GAAP (FAS) and our pension and other postretirement expense under U.S. Cost Accounting Standards (CAS).
Non-current state income taxes are defined as deferred state income taxes, which reflect the change in deferred state tax assets and liabilities and the tax expense or benefit associated with changes in state uncertain tax positions in the relevant period. These amounts are recorded within operating income. Current period state income tax expense is charged to contract costs and included in cost of sales and service revenues in segment operating income.
We present financial measures adjusted for the Operating FAS/CAS Adjustment and non-current state income taxes to reflect the company’s performance based upon the pension costs and state tax expense charged to our contracts under CAS. We use these adjusted measures as internal measures of operating performance and for performance-based compensation decisions.
Reconciliations of Segment Operating Income and Segment Operating Margin
| Three Months Ended | Six Months Ended | |||||||||||||||||||||||||
| June 30 | June 30 | |||||||||||||||||||||||||
| ($ in millions) | 2020 | 2019 | 2020 | 2019 | ||||||||||||||||||||||
| Ingalls revenues | $ | 622 | $ | 622 | $ | 1,251 | $ | 1,206 | ||||||||||||||||||
| Newport News revenues | 1,122 | 1,279 | 2,463 | 2,558 | ||||||||||||||||||||||
| Technical Solutions revenues | 320 | 321 | 637 | 561 | ||||||||||||||||||||||
| Intersegment eliminations | (37) | (34) | (61) | (57) | ||||||||||||||||||||||
| Sales and Service Revenues | 2,027 | 2,188 | 4,290 | 4,268 | ||||||||||||||||||||||
| Operating Income | 57 | 175 | 272 | 336 | ||||||||||||||||||||||
| Operating FAS/CAS Adjustment | (63) | (37) | (126) | (71) | ||||||||||||||||||||||
| Non-current state income taxes | 1 | — | 5 | 2 | ||||||||||||||||||||||
| Segment Operating Income (Loss) | (5) | 138 | 151 | 267 | ||||||||||||||||||||||
| As a percentage of sales and service revenues | (0.2) | % | 6.3 | % | 3.5 | % | 6.3 | % | ||||||||||||||||||
| Ingalls operating income | 55 | 69 | 123 | 115 | ||||||||||||||||||||||
| As a percentage of Ingalls revenues | 8.8 | % | 11.1 | % | 9.8 | % | 9.5 | % | ||||||||||||||||||
| Newport News operating income (loss) | (69) | 71 | 26 | 152 | ||||||||||||||||||||||
| As a percentage of Newport News revenues | (6.1) | % | 5.6 | % | 1.1 | % | 5.9 | % | ||||||||||||||||||
| Technical Solutions operating income (loss) | 9 | (2) | 2 | — | ||||||||||||||||||||||
| As a percentage of Technical Solutions revenues | 2.8 | % | (0.6) | % | 0.3 | % | — | % | ||||||||||||||||||
Huntington Ingalls Industries
4101 Washington Ave. • Newport News, VA 23607
www.huntingtoningalls.com
Page 13 of 15
Reconciliation of Adjusted Net Earnings and Adjusted Diluted Earnings Per Share
| Three Months Ended | Six Months Ended | |||||||||||||||||||||||||
| June 30 | June 30 | |||||||||||||||||||||||||
| (in millions, except per share amounts) | 2020 | 2019 | 2020 | 2019 | ||||||||||||||||||||||
| Net earnings | $ | 53 | $ | 128 | $ | 225 | $ | 246 | ||||||||||||||||||
After-tax FAS/CAS adjustment(1) | (73) | (31) | (147) | (60) | ||||||||||||||||||||||
| Adjusted Net Earnings | $ | (20) | $ | 97 | $ | 78 | $ | 186 | ||||||||||||||||||
| Diluted earnings per share | $ | 1.30 | $ | 3.07 | $ | 5.54 | $ | 5.91 | ||||||||||||||||||
After-tax FAS/CAS adjustment per share(1) | (1.79) | (0.74) | (3.62) | (1.44) | ||||||||||||||||||||||
| Adjusted Diluted EPS** | $ | (0.49) | $ | 2.33 | $ | 1.92 | $ | 4.47 | ||||||||||||||||||
| (1) FAS/CAS Adjustment | $ | (93) | $ | (39) | $ | (186) | $ | (76) | ||||||||||||||||||
| Tax effect* | (20) | (8) | (39) | (16) | ||||||||||||||||||||||
| After-tax impact | (73) | (31) | $ | (147) | $ | (60) | ||||||||||||||||||||
| Weighted-average diluted shares outstanding | 40.7 | 41.7 | 40.6 | 41.6 | ||||||||||||||||||||||
| Per share impact** | $ | (1.79) | $ | (0.74) | $ | (3.62) | $ | (1.44) | ||||||||||||||||||
| *The income tax impact is calculated using the tax rate in effect for the relevant non-GAAP adjustment. | ||||||||||||||||||||||||||
| **Amounts may not recalculate exactly due to rounding. | ||||||||||||||||||||||||||
Huntington Ingalls Industries
4101 Washington Ave. • Newport News, VA 23607
www.huntingtoningalls.com
Page 14 of 15
Reconciliation of Free Cash Flow
| Three Months Ended | Six Month Ended | |||||||||||||||||||||||||
| June 30 | June 30 | |||||||||||||||||||||||||
| (in millions) | 2020 | 2019 | 2020 | 2019 | ||||||||||||||||||||||
| Net cash provided by (used in) operating activities | $ | 201 | $ | (44) | $ | 269 | $ | (33) | ||||||||||||||||||
| Less capital expenditures: | ||||||||||||||||||||||||||
| Capital expenditure additions | (79) | (124) | (150) | (234) | ||||||||||||||||||||||
| Grant proceeds for capital expenditures | 4 | 33 | 9 | 69 | ||||||||||||||||||||||
| Free cash flow | $ | 126 | $ | (135) | $ | 128 | $ | (198) | ||||||||||||||||||
Huntington Ingalls Industries
4101 Washington Ave. • Newport News, VA 23607
www.huntingtoningalls.com
Page 15 of 15
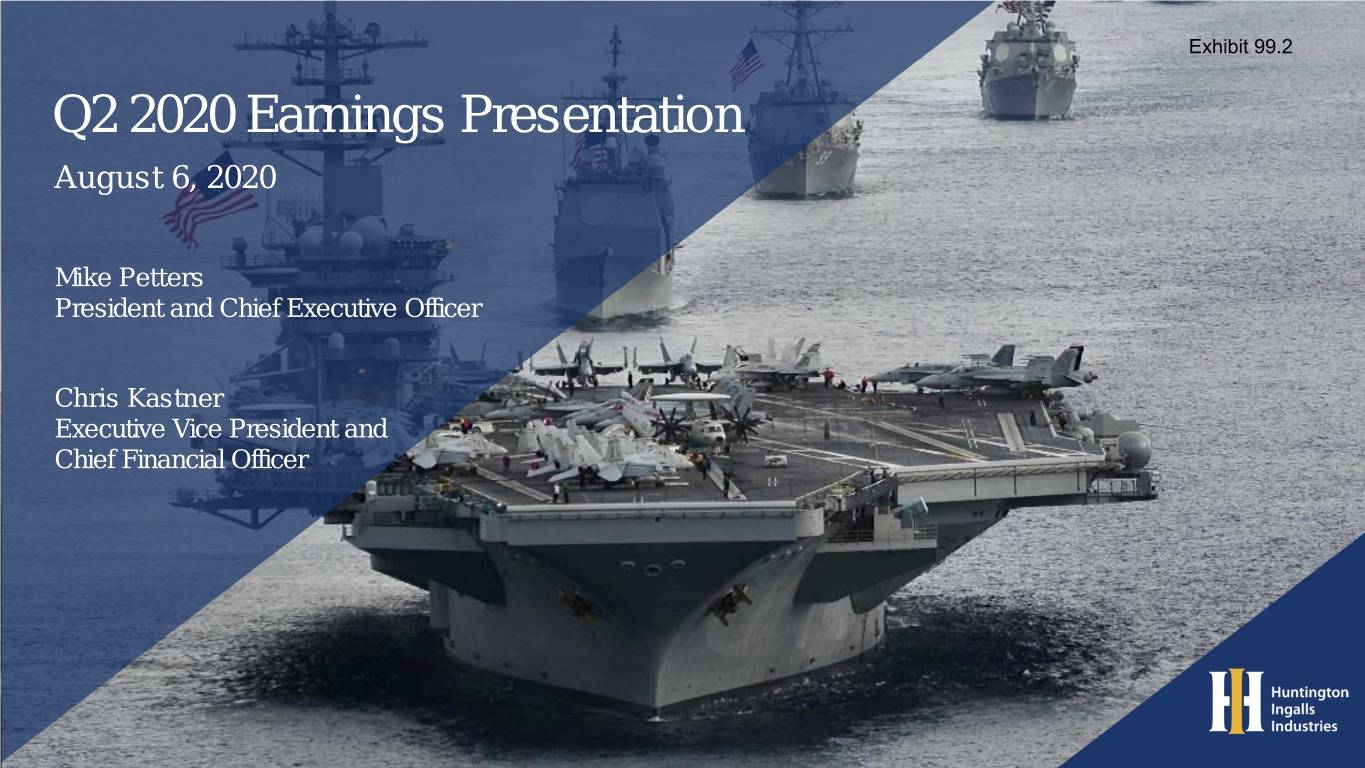
Exhibit 99.2 Q2 2020 Earnings Presentation August 6, 2020 Mike Petters President and Chief Executive Officer Chris Kastner Executive Vice President and Chief Financial Officer
Forward-Looking Statements Exhibit 99.2 Statements in this presentation, other than statements of historical fact, constitute "forward-looking statements" within the meaning of the Private Securities Litigation Reform Act of 1995. Forward-looking statements involve risks and uncertainties that could cause our actual results to differ materially from those expressed in these statements. Factors that may cause such differences include: changes in government and customer priorities and requirements (including government budgetary constraints, shifts in defense spending, and changes in customer short-range and long-range plans); our ability to estimate our future contract costs and perform our contracts effectively; changes in procurement processes and government regulations and our ability to comply with such requirements; our ability to deliver our products and services at an affordable life cycle cost and compete within our markets; natural and environmental disasters and political instability; our ability to execute our strategic plan, including with respect to share repurchases, dividends, capital expenditures, and strategic acquisitions; adverse economic conditions in the United States and globally; health epidemics, pandemics and similar outbreaks, including the COVID-19 pandemic; changes in key estimates and assumptions regarding our pension and retiree health care costs; security threats, including cyber security threats, and related disruptions; and other risk factors discussed in our filings with the U.S. Securities and Exchange Commission. There may be other risks and uncertainties that we are unable to predict at this time or that we currently do not expect to have a material adverse effect on our business, and we undertake no obligation to update any forward-looking statements. You should not place undue reliance on any forward-looking statements that we may make. This presentation also contains non-GAAP financial measures and includes a GAAP reconciliation of these financial measures. Non-GAAP financial measures should not be construed as being more important than comparable GAAP measures. 2 HUNTINGTON INGALLS INDUSTRIES HARD STUFF DONE RIGHT
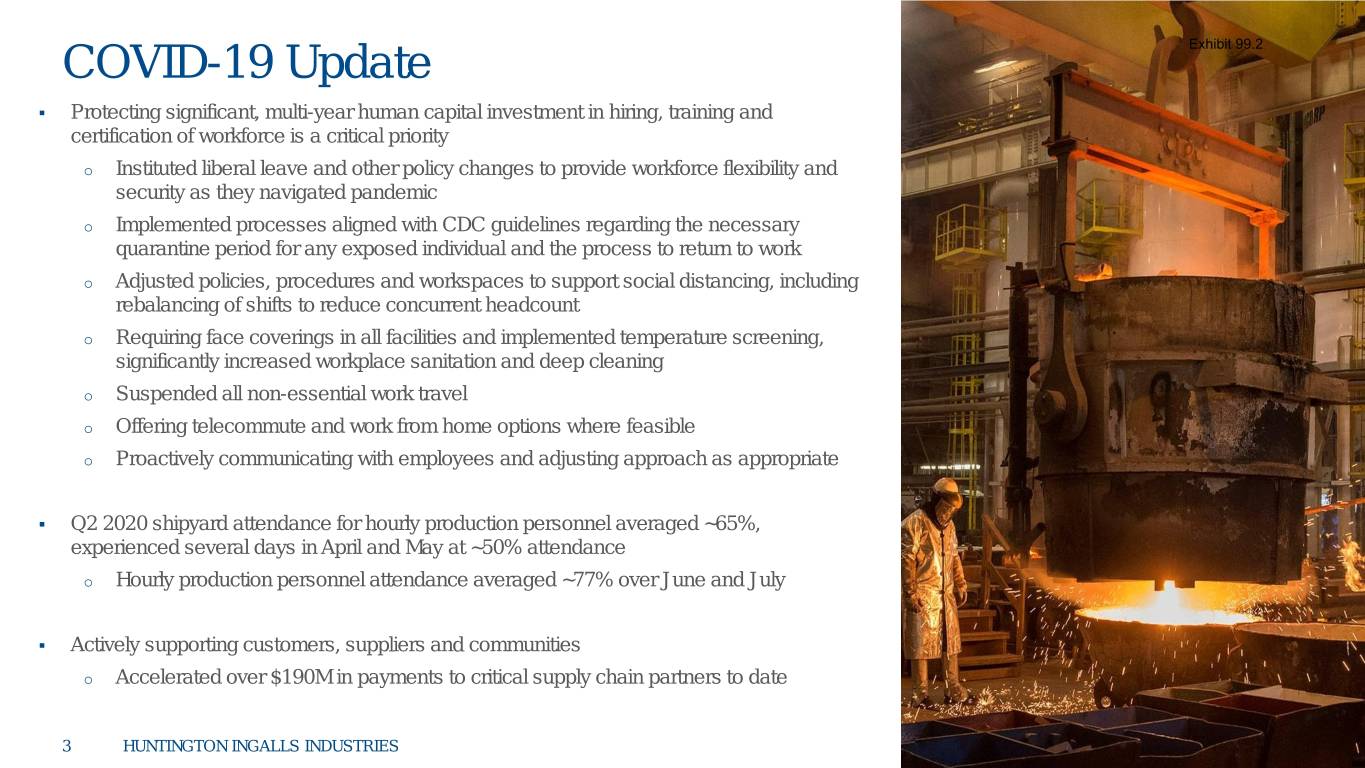
COVID-19 Update Exhibit 99.2 . Protecting significant, multi-year human capital investment in hiring, training and certification of workforce is a critical priority o Instituted liberal leave and other policy changes to provide workforce flexibility and security as they navigated pandemic o Implemented processes aligned with CDC guidelines regarding the necessary quarantine period for any exposed individual and the process to return to work o Adjusted policies, procedures and workspaces to support social distancing, including rebalancing of shifts to reduce concurrent headcount o Requiring face coverings in all facilities and implemented temperature screening, significantly increased workplace sanitation and deep cleaning o Suspended all non-essential work travel o Offering telecommute and work from home options where feasible o Proactively communicating with employees and adjusting approach as appropriate . Q2 2020 shipyard attendance for hourly production personnel averaged ~65%, experienced several days in April and May at ~50% attendance o Hourly production personnel attendance averaged ~77% over June and July . Actively supporting customers, suppliers and communities o Accelerated over $190M in payments to critical supply chain partners to date 3 HUNTINGTON INGALLS INDUSTRIES HARD STUFF DONE RIGHT
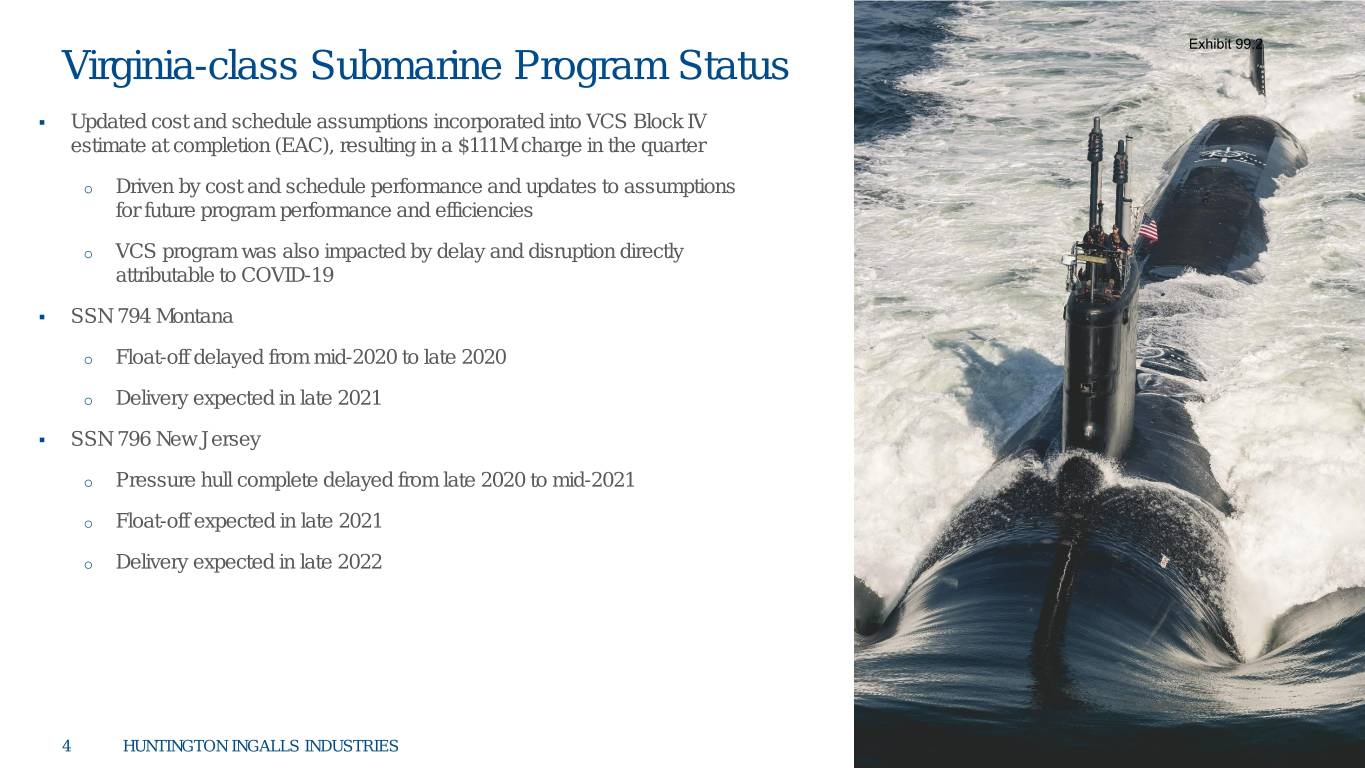
Exhibit 99.2 Virginia-class Submarine Program Status . Updated cost and schedule assumptions incorporated into VCS Block IV estimate at completion (EAC), resulting in a $111M charge in the quarter o Driven by cost and schedule performance and updates to assumptions for future program performance and efficiencies o VCS program was also impacted by delay and disruption directly attributable to COVID-19 . SSN 794 Montana o Float-off delayed from mid-2020 to late 2020 o Delivery expected in late 2021 . SSN 796 New Jersey o Pressure hull complete delayed from late 2020 to mid-2021 o Float-off expected in late 2021 o Delivery expected in late 2022 4 HUNTINGTON INGALLS INDUSTRIES HARD STUFF DONE RIGHT
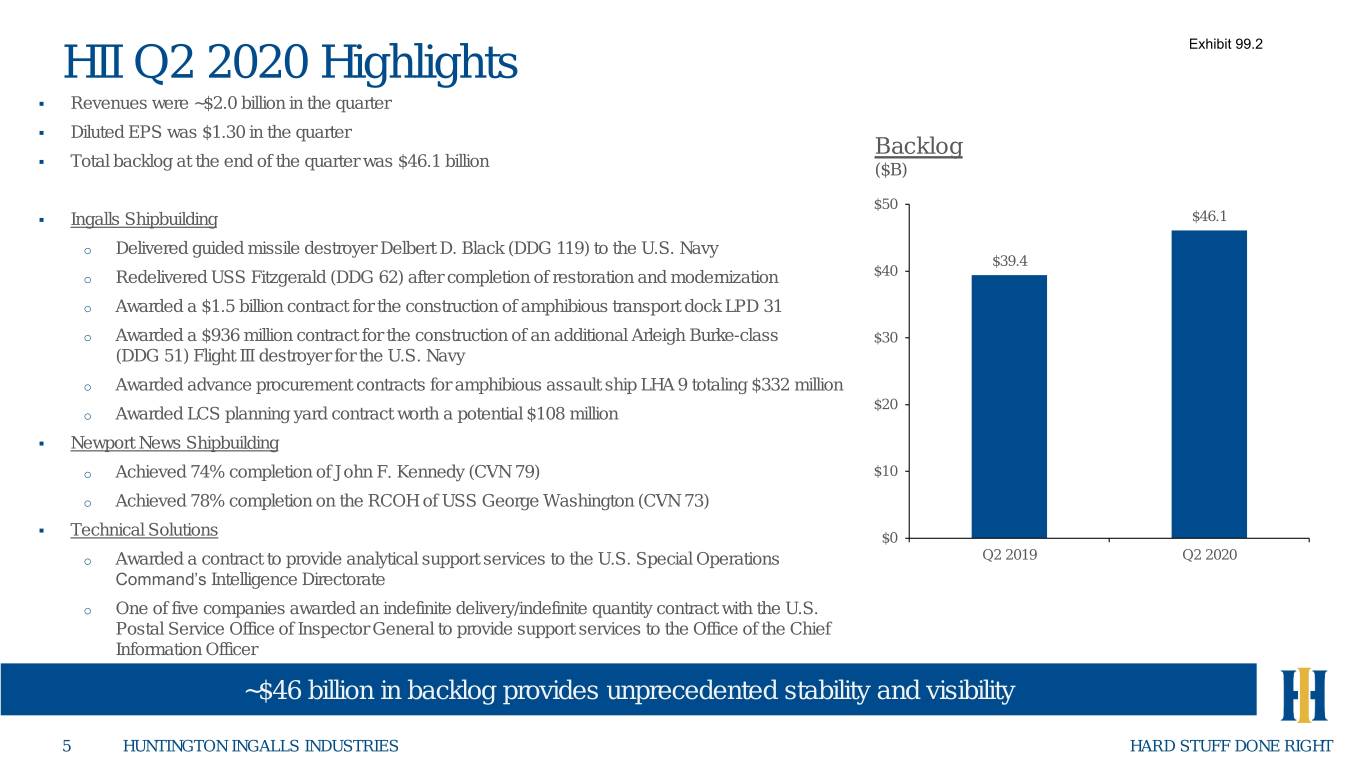
HII Q2 2020 Highlights Exhibit 99.2 . Revenues were ~$2.0 billion in the quarter . Diluted EPS was $1.30 in the quarter Backlog . Total backlog at the end of the quarter was $46.1 billion ($B) $50 . Ingalls Shipbuilding $46.1 o Delivered guided missile destroyer Delbert D. Black (DDG 119) to the U.S. Navy $39.4 $40 o Redelivered USS Fitzgerald (DDG 62) after completion of restoration and modernization o Awarded a $1.5 billion contract for the construction of amphibious transport dock LPD 31 o Awarded a $936 million contract for the construction of an additional Arleigh Burke-class $30 (DDG 51) Flight III destroyer for the U.S. Navy o Awarded advance procurement contracts for amphibious assault ship LHA 9 totaling $332 million $20 o Awarded LCS planning yard contract worth a potential $108 million . Newport News Shipbuilding o Achieved 74% completion of John F. Kennedy (CVN 79) $10 o Achieved 78% completion on the RCOH of USS George Washington (CVN 73) . Technical Solutions $0 o Awarded a contract to provide analytical support services to the U.S. Special Operations Q2 2019 Q2 2020 Command’s Intelligence Directorate o One of five companies awarded an indefinite delivery/indefinite quantity contract with the U.S. Postal Service Office of Inspector General to provide support services to the Office of the Chief Information Officer ~$46 billion in backlog provides unprecedented stability and visibility 5 HUNTINGTON INGALLS INDUSTRIES HARD STUFF DONE RIGHT
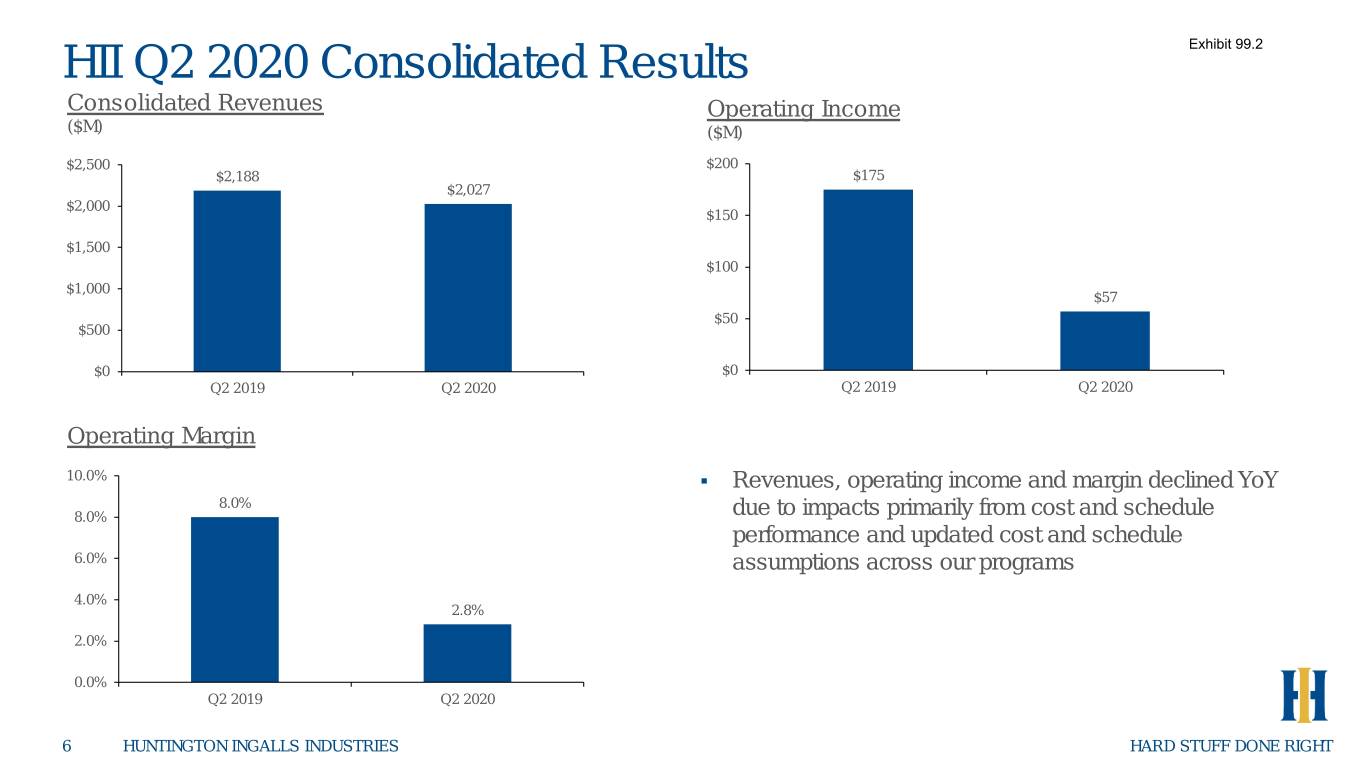
HII Q2 2020 Consolidated Results Exhibit 99.2 Consolidated Revenues Operating Income ($M) ($M) $2,500 $200 $2,188 $175 $2,027 $2,000 $150 $1,500 $100 $1,000 $57 $50 $500 $0 $0 Q2 2019 Q2 2020 Q2 2019 Q2 2020 Operating Margin 10.0% . Revenues, operating income and margin declined YoY 8.0% 8.0% due to impacts primarily from cost and schedule performance and updated cost and schedule 6.0% assumptions across our programs 4.0% 2.8% 2.0% 0.0% Q2 2019 Q2 2020 6 HUNTINGTON INGALLS INDUSTRIES HARD STUFF DONE RIGHT
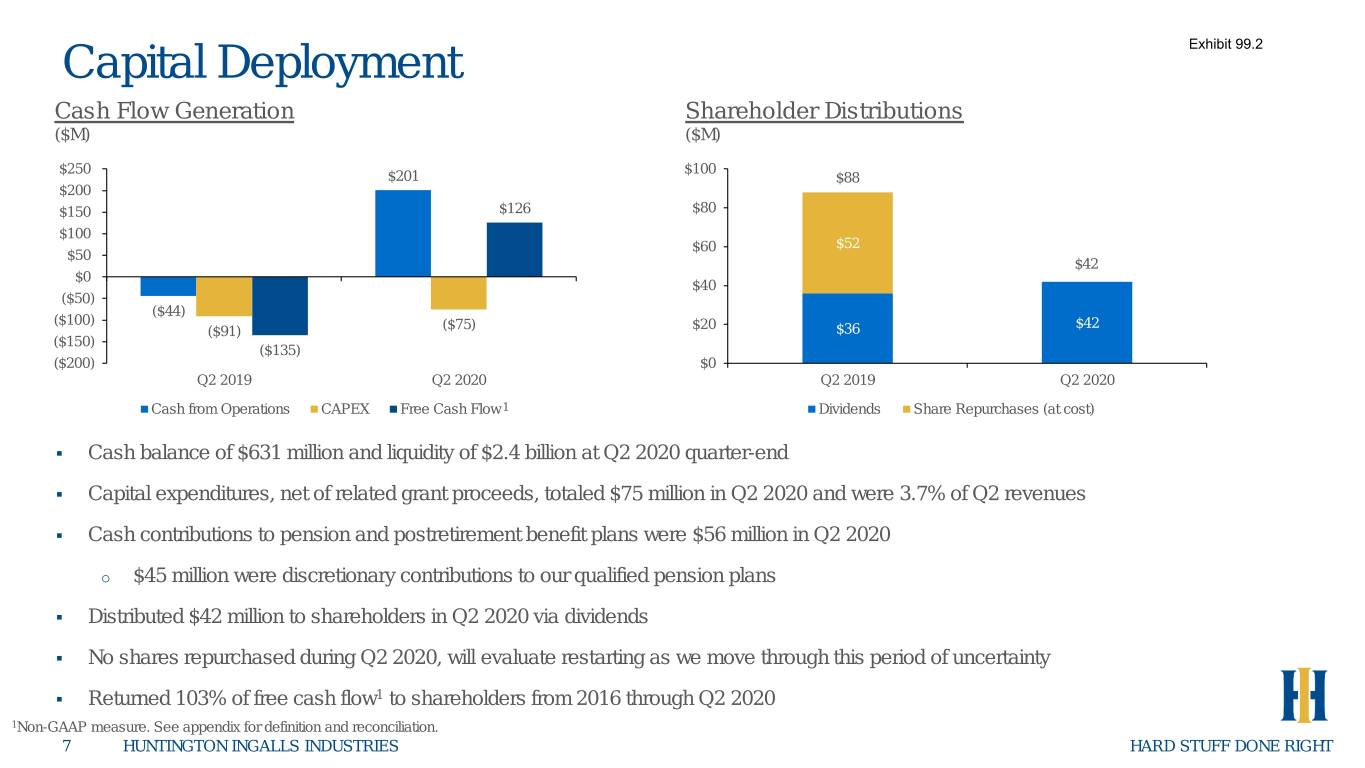
Capital Deployment Exhibit 99.2 Cash Flow Generation Shareholder Distributions ($M) ($M) $250 $100 $201 $88 $200 $150 $126 $80 $100 $60 $52 $50 $42 $0 $40 ($50) ($44) ($100) $20 $42 ($91) ($75) $36 ($150) ($135) ($200) $0 Q2 2019 Q2 2020 Q2 2019 Q2 2020 Cash from Operations CAPEX Free Cash Flow 1 Dividends Share Repurchases (at cost) . Cash balance of $631 million and liquidity of $2.4 billion at Q2 2020 quarter-end . Capital expenditures, net of related grant proceeds, totaled $75 million in Q2 2020 and were 3.7% of Q2 revenues . Cash contributions to pension and postretirement benefit plans were $56 million in Q2 2020 o $45 million were discretionary contributions to our qualified pension plans . Distributed $42 million to shareholders in Q2 2020 via dividends . No shares repurchased during Q2 2020, will evaluate restarting as we move through this period of uncertainty . Returned 103% of free cash flow1 to shareholders from 2016 through Q2 2020 1Non-GAAP measure. See appendix for definition and reconciliation. 7 HUNTINGTON INGALLS INDUSTRIES HARD STUFF DONE RIGHT
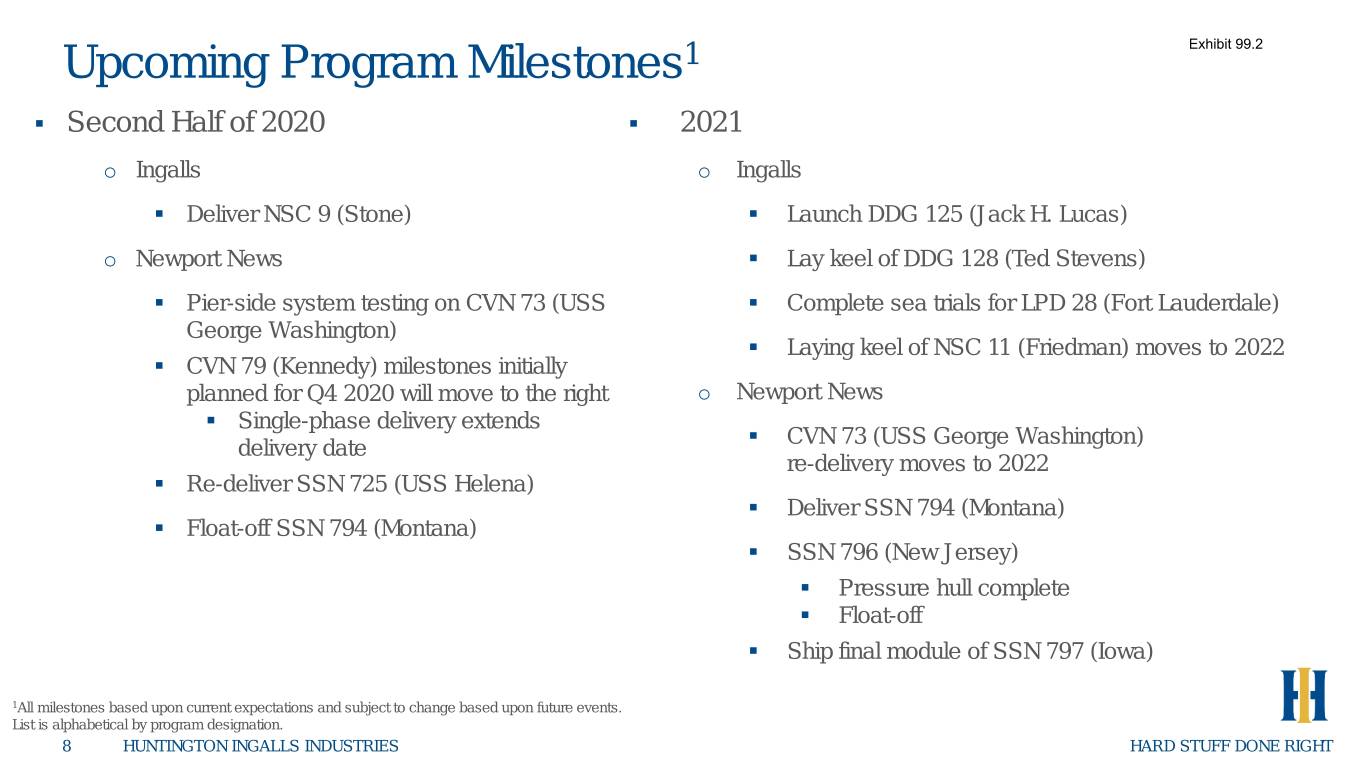
Upcoming Program Milestones1 Exhibit 99.2 . Second Half of 2020 . 2021 o Ingalls o Ingalls . Deliver NSC 9 (Stone) . Launch DDG 125 (Jack H. Lucas) o Newport News . Lay keel of DDG 128 (Ted Stevens) . Pier-side system testing on CVN 73 (USS . Complete sea trials for LPD 28 (Fort Lauderdale) George Washington) . Laying keel of NSC 11 (Friedman) moves to 2022 . CVN 79 (Kennedy) milestones initially planned for Q4 2020 will move to the right o Newport News . Single-phase delivery extends . CVN 73 (USS George Washington) delivery date re-delivery moves to 2022 . Re-deliver SSN 725 (USS Helena) . Deliver SSN 794 (Montana) . Float-off SSN 794 (Montana) . SSN 796 (New Jersey) . Pressure hull complete . Float-off . Ship final module of SSN 797 (Iowa) 1All milestones based upon current expectations and subject to change based upon future events. List is alphabetical by program designation. 8 HUNTINGTON INGALLS INDUSTRIES HARD STUFF DONE RIGHT
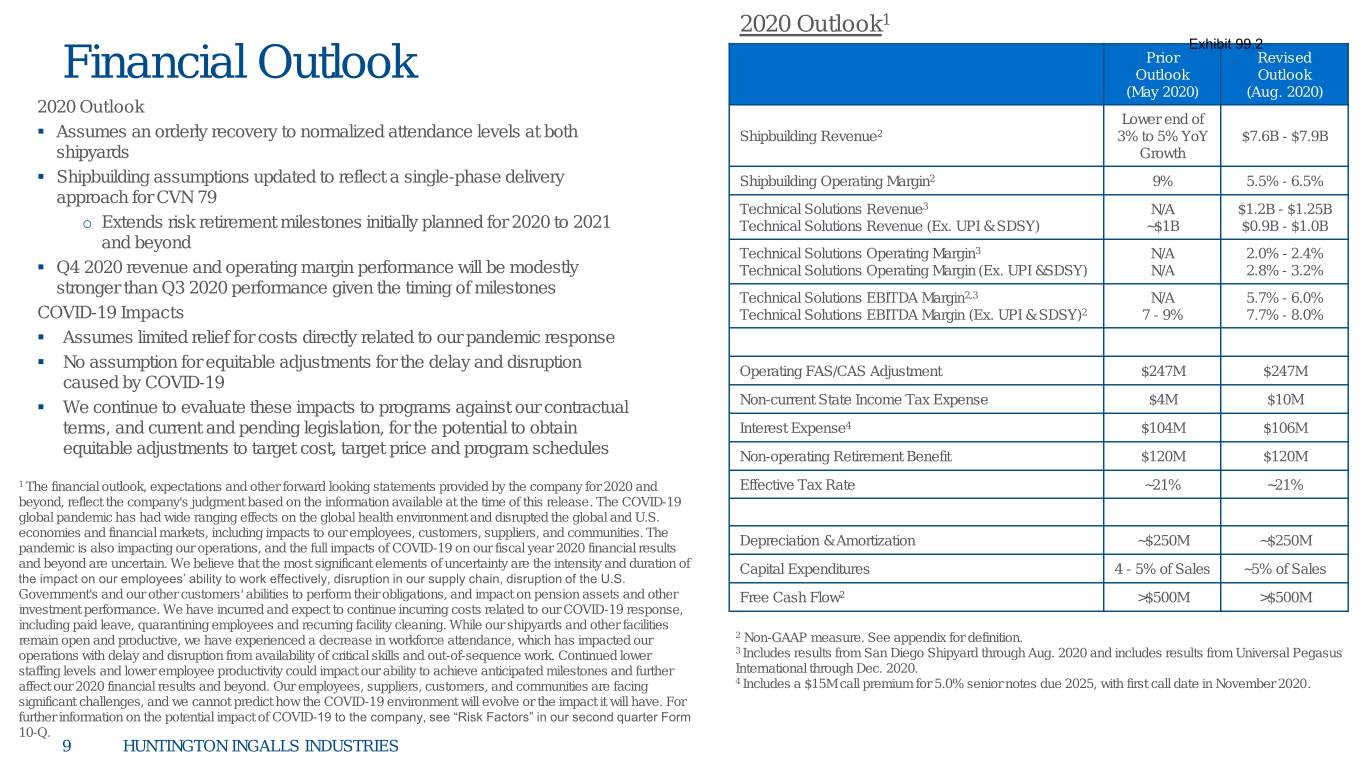
2020 Outlook1 Exhibit 99.2 Prior Revised Financial Outlook Outlook Outlook (May 2020) (Aug. 2020) 2020 Outlook Lower end of . Assumes an orderly recovery to normalized attendance levels at both Shipbuilding Revenue2 3% to 5% YoY $7.6B - $7.9B shipyards Growth . Shipbuilding assumptions updated to reflect a single-phase delivery Shipbuilding Operating Margin2 9% 5.5% - 6.5% approach for CVN 79 Technical Solutions Revenue3 N/A $1.2B - $1.25B o Extends risk retirement milestones initially planned for 2020 to 2021 Technical Solutions Revenue (Ex. UPI & SDSY) ~$1B $0.9B - $1.0B and beyond Technical Solutions Operating Margin3 N/A 2.0% - 2.4% . Q4 2020 revenue and operating margin performance will be modestly Technical Solutions Operating Margin (Ex. UPI &SDSY) N/A 2.8% - 3.2% stronger than Q3 2020 performance given the timing of milestones Technical Solutions EBITDA Margin2,3 N/A 5.7% - 6.0% COVID-19 Impacts Technical Solutions EBITDA Margin (Ex. UPI & SDSY)2 7 - 9% 7.7% - 8.0% . Assumes limited relief for costs directly related to our pandemic response . No assumption for equitable adjustments for the delay and disruption Operating FAS/CAS Adjustment $247M $247M caused by COVID-19 . We continue to evaluate these impacts to programs against our contractual Non-current State Income Tax Expense $4M $10M terms, and current and pending legislation, for the potential to obtain Interest Expense4 $104M $106M equitable adjustments to target cost, target price and program schedules Non-operating Retirement Benefit $120M $120M 1 The financial outlook, expectations and other forward looking statements provided by the company for 2020 and Effective Tax Rate ~21% ~21% beyond, reflect the company's judgment based on the information available at the time of this release. The COVID-19 global pandemic has had wide ranging effects on the global health environment and disrupted the global and U.S. economies and financial markets, including impacts to our employees, customers, suppliers, and communities. The Depreciation & Amortization ~$250M ~$250M pandemic is also impacting our operations, and the full impacts of COVID-19 on our fiscal year 2020 financial results and beyond are uncertain. We believe that the most significant elements of uncertainty are the intensity and duration of Capital Expenditures 4 - 5% of Sales ~5% of Sales the impact on our employees’ ability to work effectively, disruption in our supply chain, disruption of the U.S. Government's and our other customers' abilities to perform their obligations, and impact on pension assets and other Free Cash Flow2 >$500M >$500M investment performance. We have incurred and expect to continue incurring costs related to our COVID-19 response, including paid leave, quarantining employees and recurring facility cleaning. While our shipyards and other facilities remain open and productive, we have experienced a decrease in workforce attendance, which has impacted our 2 Non-GAAP measure. See appendix for definition. operations with delay and disruption from availability of critical skills and out-of-sequence work. Continued lower 3 Includes results from San Diego Shipyard through Aug. 2020 and includes results from Universal Pegasus staffing levels and lower employee productivity could impact our ability to achieve anticipated milestones and further International through Dec. 2020. affect our 2020 financial results and beyond. Our employees, suppliers, customers, and communities are facing 4 Includes a $15M call premium for 5.0% senior notes due 2025, with first call date in November 2020. significant challenges, and we cannot predict how the COVID-19 environment will evolve or the impact it will have. For further information on the potential impact of COVID-19 to the company, see “Risk Factors” in our second quarter Form 10-Q. 9 HUNTINGTON INGALLS INDUSTRIES HARD STUFF DONE RIGHT

Exhibit 99.2 Appendix HUNTINGTON INGALLS INDUSTRIES PROPRIETARY
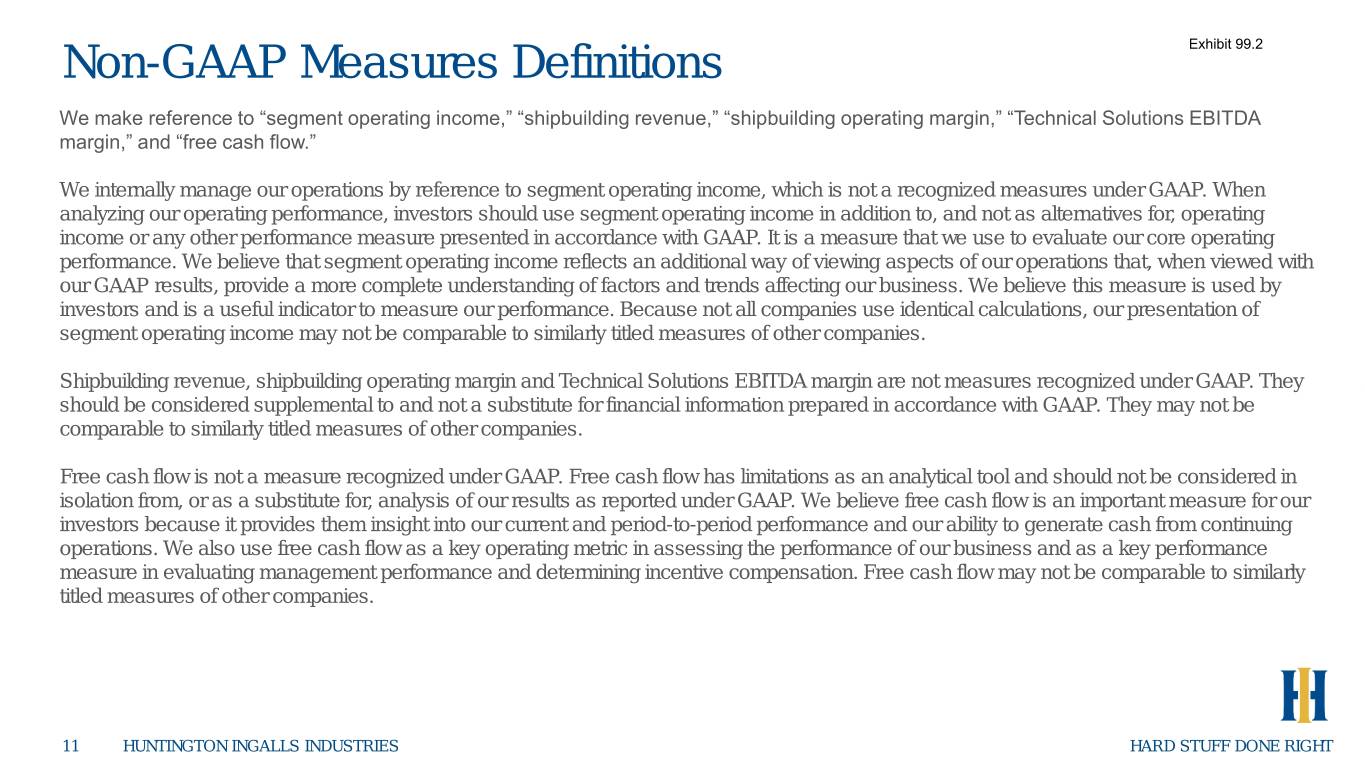
Non-GAAP Measures Definitions Exhibit 99.2 We make reference to “segment operating income,” “shipbuilding revenue,” “shipbuilding operating margin,” “Technical Solutions EBITDA margin,” and “free cash flow.” We internally manage our operations by reference to segment operating income, which is not a recognized measures under GAAP. When analyzing our operating performance, investors should use segment operating income in addition to, and not as alternatives for, operating income or any other performance measure presented in accordance with GAAP. It is a measure that we use to evaluate our core operating performance. We believe that segment operating income reflects an additional way of viewing aspects of our operations that, when viewed with our GAAP results, provide a more complete understanding of factors and trends affecting our business. We believe this measure is used by investors and is a useful indicator to measure our performance. Because not all companies use identical calculations, our presentation of segment operating income may not be comparable to similarly titled measures of other companies. Shipbuilding revenue, shipbuilding operating margin and Technical Solutions EBITDA margin are not measures recognized under GAAP. They should be considered supplemental to and not a substitute for financial information prepared in accordance with GAAP. They may not be comparable to similarly titled measures of other companies. Free cash flow is not a measure recognized under GAAP. Free cash flow has limitations as an analytical tool and should not be considered in isolation from, or as a substitute for, analysis of our results as reported under GAAP. We believe free cash flow is an important measure for our investors because it provides them insight into our current and period-to-period performance and our ability to generate cash from continuing operations. We also use free cash flow as a key operating metric in assessing the performance of our business and as a key performance measure in evaluating management performance and determining incentive compensation. Free cash flow may not be comparable to similarly titled measures of other companies. 11 HUNTINGTON INGALLS INDUSTRIES HARD STUFF DONE RIGHT
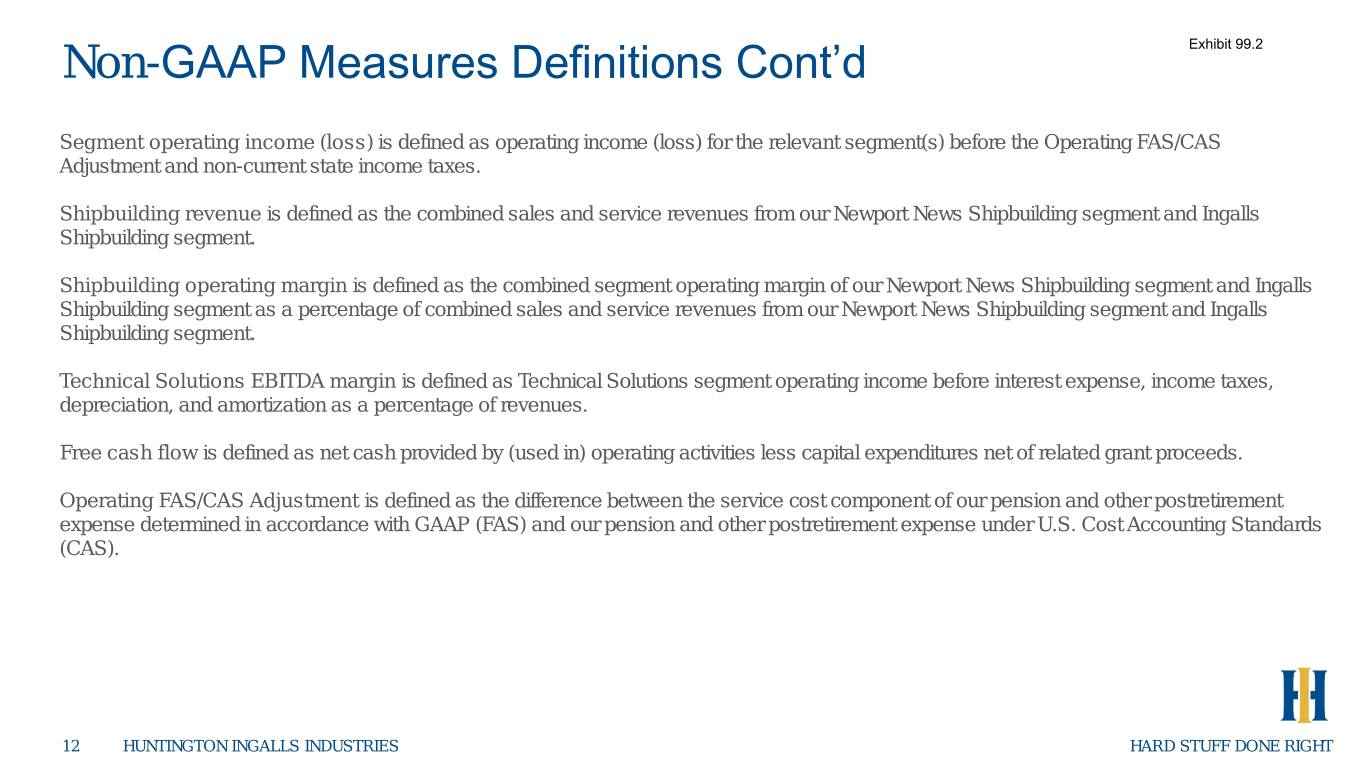
Non-GAAP Measures Definitions Cont’d Exhibit 99.2 Segment operating income (loss) is defined as operating income (loss) for the relevant segment(s) before the Operating FAS/CAS Adjustment and non-current state income taxes. Shipbuilding revenue is defined as the combined sales and service revenues from our Newport News Shipbuilding segment and Ingalls Shipbuilding segment. Shipbuilding operating margin is defined as the combined segment operating margin of our Newport News Shipbuilding segment and Ingalls Shipbuilding segment as a percentage of combined sales and service revenues from our Newport News Shipbuilding segment and Ingalls Shipbuilding segment. Technical Solutions EBITDA margin is defined as Technical Solutions segment operating income before interest expense, income taxes, depreciation, and amortization as a percentage of revenues. Free cash flow is defined as net cash provided by (used in) operating activities less capital expenditures net of related grant proceeds. Operating FAS/CAS Adjustment is defined as the difference between the service cost component of our pension and other postretirement expense determined in accordance with GAAP (FAS) and our pension and other postretirement expense under U.S. Cost Accounting Standards (CAS). 12 HUNTINGTON INGALLS INDUSTRIES HARD STUFF DONE RIGHT
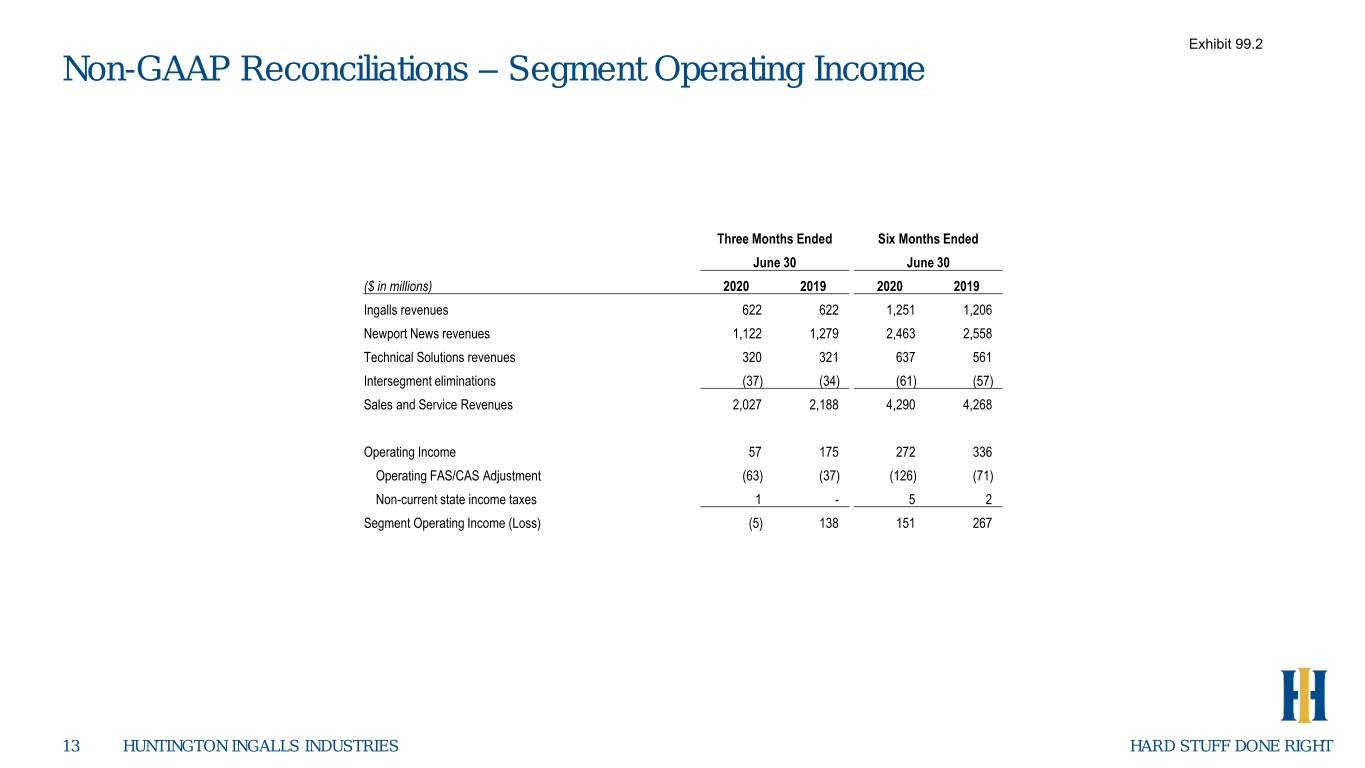
Exhibit 99.2 Non-GAAP Reconciliations – Segment Operating Income Three Months Ended Six Months Ended June 30 June 30 ($ in millions) 2020 2019 2020 2019 Ingalls revenues 622 622 1,251 1,206 Newport News revenues 1,122 1,279 2,463 2,558 Technical Solutions revenues 320 321 637 561 Intersegment eliminations (37) (34) (61) (57) Sales and Service Revenues 2,027 2,188 4,290 4,268 Operating Income 57 175 272 336 Operating FAS/CAS Adjustment (63) (37) (126) (71) Non-current state income taxes 1 - 5 2 Segment Operating Income (Loss) (5) 138 151 267 13 HUNTINGTON INGALLS INDUSTRIES HARD STUFF DONE RIGHT
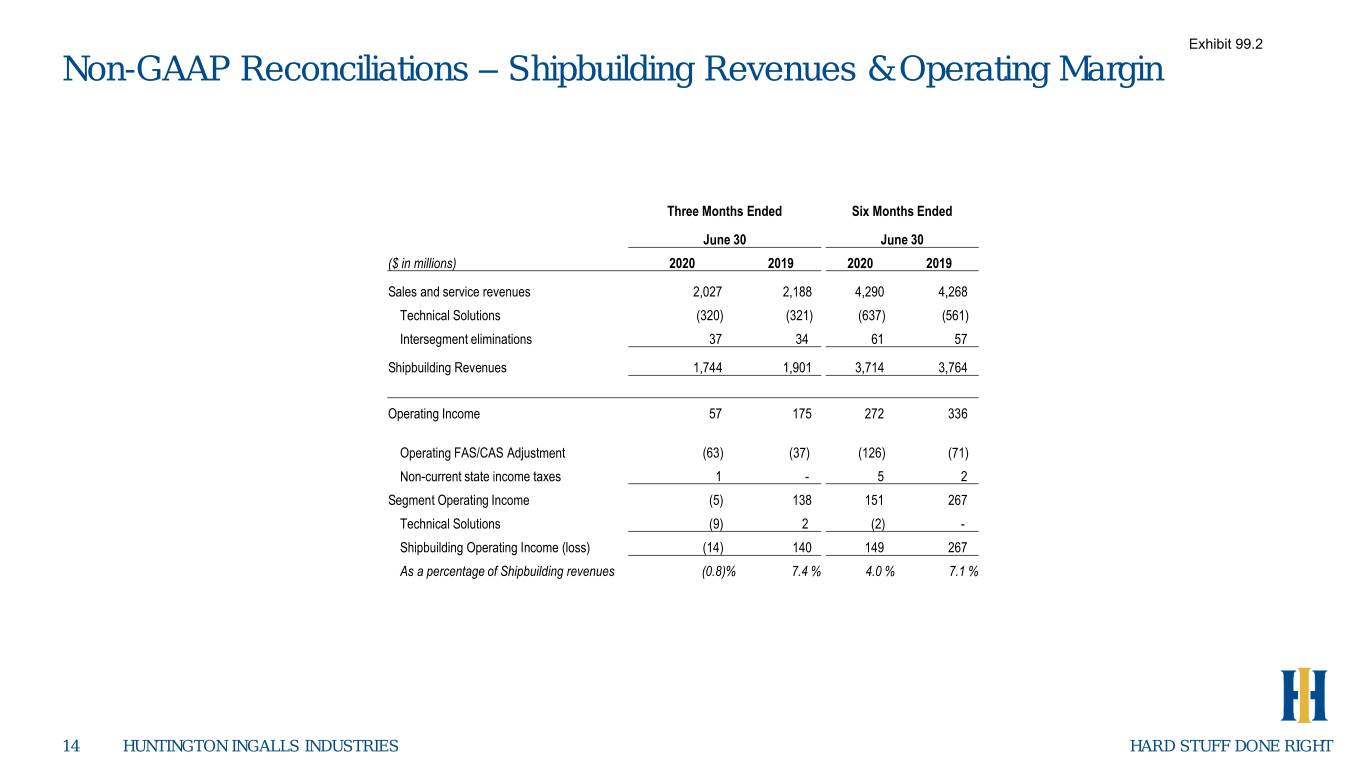
Exhibit 99.2 Non-GAAP Reconciliations – Shipbuilding Revenues & Operating Margin Three Months Ended Six Months Ended June 30 June 30 ($ in millions) 2020 2019 2020 2019 Sales and service revenues 2,027 2,188 4,290 4,268 Technical Solutions (320) (321) (637) (561) Intersegment eliminations 37 34 61 57 Shipbuilding Revenues 1,744 1,901 3,714 3,764 Operating Income 57 175 272 336 Operating FAS/CAS Adjustment (63) (37) (126) (71) Non-current state income taxes 1 - 5 2 Segment Operating Income (5) 138 151 267 Technical Solutions (9) 2 (2) - Shipbuilding Operating Income (loss) (14) 140 149 267 As a percentage of Shipbuilding revenues (0.8)% 7.4 % 4.0 % 7.1 % 14 HUNTINGTON INGALLS INDUSTRIES HARD STUFF DONE RIGHT
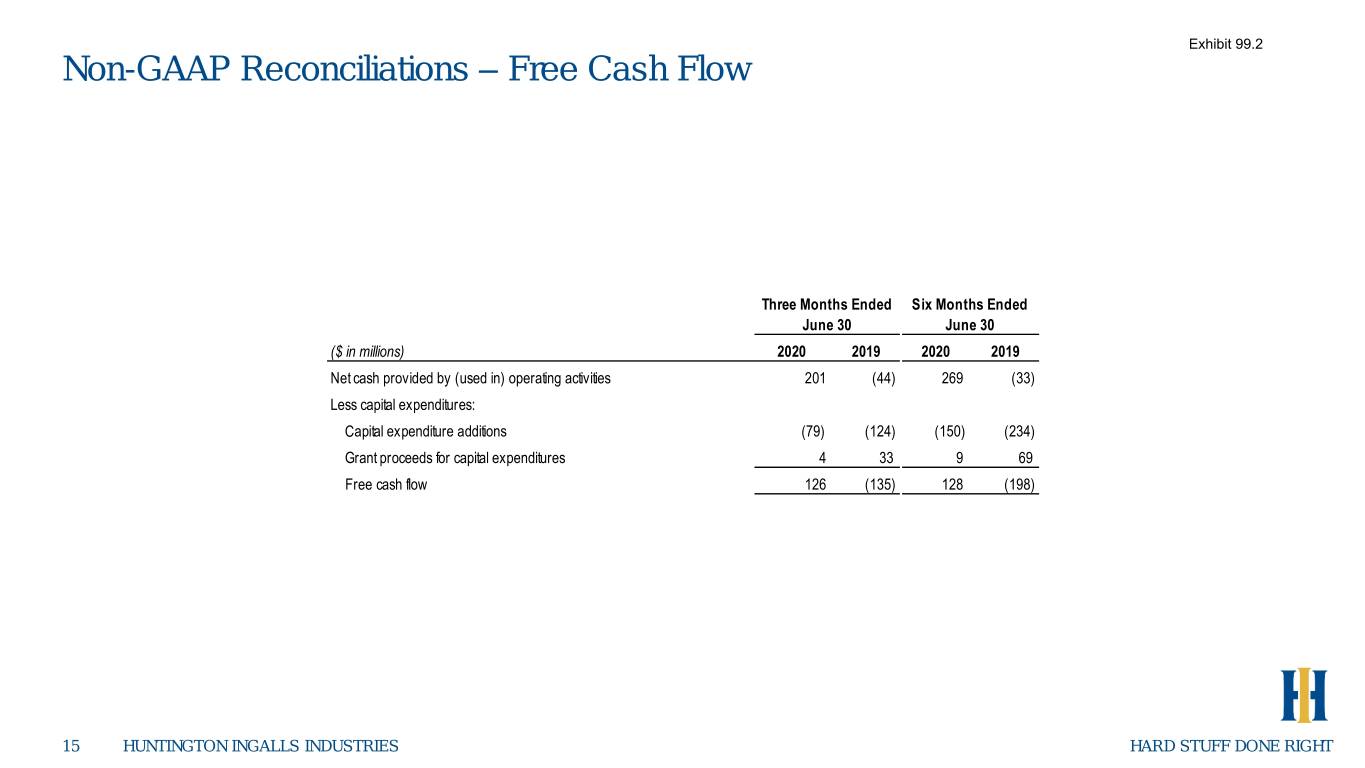
Exhibit 99.2 Non-GAAP Reconciliations – Free Cash Flow Three Months Ended Six Months Ended June 30 June 30 ($ in millions) 2020 2019 2020 2019 Net cash provided by (used in) operating activities 201 (44) 269 (33) Less capital expenditures: Capital expenditure additions (79) (124) (150) (234) Grant proceeds for capital expenditures 4 33 9 69 Free cash flow 126 (135) 128 (198) 15 HUNTINGTON INGALLS INDUSTRIES HARD STUFF DONE RIGHT
Exhibit 99.2 16 HUNTINGTON INGALLS INDUSTRIES HARD STUFF DONE RIGHT