
LDI 8-K
loanDepot, Inc. (LDI)
8-K
2021-11-01
For: 2021-11-01
View Original
Added on
April 09, 2026
UNITED STATES
SECURITIES AND EXCHANGE COMMISSION
Washington, D.C. 20549
_____________________
FORM 8-K
_____________________
CURRENT REPORT
Pursuant to Section 13 or 15(d)
of the Securities Exchange Act of 1934
Date of Report: November 1, 2021
_____________________
(Exact Name of Registrant as Specified in its Charter)
_____________________
(State or other jurisdiction of incorporation) | (Commission File Number) | (I.R.S. Employer Identification Number) | ||||||||||||
(Address of Principal Executive Offices) (Zip Code)
Registrant’s telephone number, including area code: (888) 337-6888
_____________________
Check the appropriate box below if the Form 8-K filing is intended to simultaneously satisfy the filing obligation of the registrant under any of the following provisions:
| Written communications pursuant to Rule 425 under the Securities Act (17 CFR 230.425) | ||||||||
| Soliciting material pursuant to Rule 14a-12 under the Exchange Act (17 CFR 240.14a-12) | ||||||||
| Pre-commencement communications pursuant to Rule 14d-2(b) under the Exchange Act (17 CFR 240.14d-2(b)) | ||||||||
| Pre-commencement communications pursuant to Rule 13e-4(c) under the Exchange Act (17 CFR 240.13e-4(c)) | ||||||||
Securities registered pursuant to Section 12(b) of the Act:
| Title of each class | Trading Symbol(s) | Name of each exchange on which registered | ||||||||||||
Indicate by check mark whether the registrant is an emerging growth company as defined in Rule 405 of the Securities Act of 1933 (§230.405 of this chapter) or Rule 12b-2 of the Securities Exchange Act of 1934 (§240.12b-2 of this chapter).
Emerging growth company ☐
If an emerging growth company, indicate by check mark if the registrant has elected not to use the extended transition period for complying with any new or revised financial accounting standards provided pursuant to Section 13(a) of the Exchange Act. o
Explanatory Notes
Item 2.02 Results of Operations and Financial Condition.
On November 1, 2021, loanDepot, Inc. (the "Company") issued a press release announcing its results for the third quarter ended September 30, 2021 (the “Earnings Press Release”). The full press release is furnished as Exhibit 99.1 to this Current Report on Form 8-K.
Item 7.01 Regulation FD Disclosure.
On November 1, 2021, the Company posted on its website at www.loandepot.com a presentation (the “loanDepot Presentation”) on certain financial and operating initiatives available for viewing during the Company’s conference call and webcast announcing its financial results for the third quarter of 2021 at 11:00 a.m. Eastern time on November 1, 2021.
A copy of the loanDepot Presentation is furnished pursuant to this Item 7.01 as Exhibit 99.2 to this Current Report on Form 8-K and incorporated by reference herein in its entirety. The loanDepot Presentation includes references to non-GAAP financial information. Reconciliations between the non-GAAP financial measures and the comparable GAAP financial measures are available in the loanDepot Presentation. The loanDepot Presentation should be read in conjunction with the Earnings Press Release. The Company reserves the right to discontinue availability of the loanDepot Presentation from its website at any time.
The information furnished pursuant to Items 2.02 and 7.01, including Exhibits 99.1 and 99.2, shall not be deemed “filed” for purposes of Section 18 of the Exchange Act nor shall it be deemed incorporated by reference into any filing under the Securities Act of 1933, or the Exchange Act, as amended, except as specifically identified therein as being incorporated by reference.
Additionally, the submission of the information set forth in this Item 7.01 is not deemed an admission as to the materiality of any information in this Current Report on Form 8-K that is required to be disclosed solely by Regulation FD.
Item 9.01 Financial Statements and Exhibits.
(d) Exhibits
Exhibit | Description | |||||||
| 99.1 | ||||||||
| 99.2 | ||||||||
104 | Cover Page Interactive Data File (embedded within the Inline XBRL document) | |||||||
SIGNATURE
Pursuant to the requirements of the Securities Exchange Act of 1934, the registrant has duly caused this report to be signed on its behalf by the undersigned hereunto duly authorized.
loanDepot, Inc. | ||||||||
By: | /s/ Patrick Flanagan | |||||||
Name: Patrick Flanagan | ||||||||
Title: Chief Financial Officer | ||||||||
Date: November 1, 2021

loanDepot announces third quarter 2021 financial results
Driven by a rising brand and a unique, diversified model, loanDepot successfully increased market share and purchase volume in the third quarter of 2021
•Reports quarterly total revenue of $923.8 million, diluted earnings per share of $0.40 and adjusted diluted earnings per share of $0.46, reflecting higher rate lock volume and gain on sale margins.
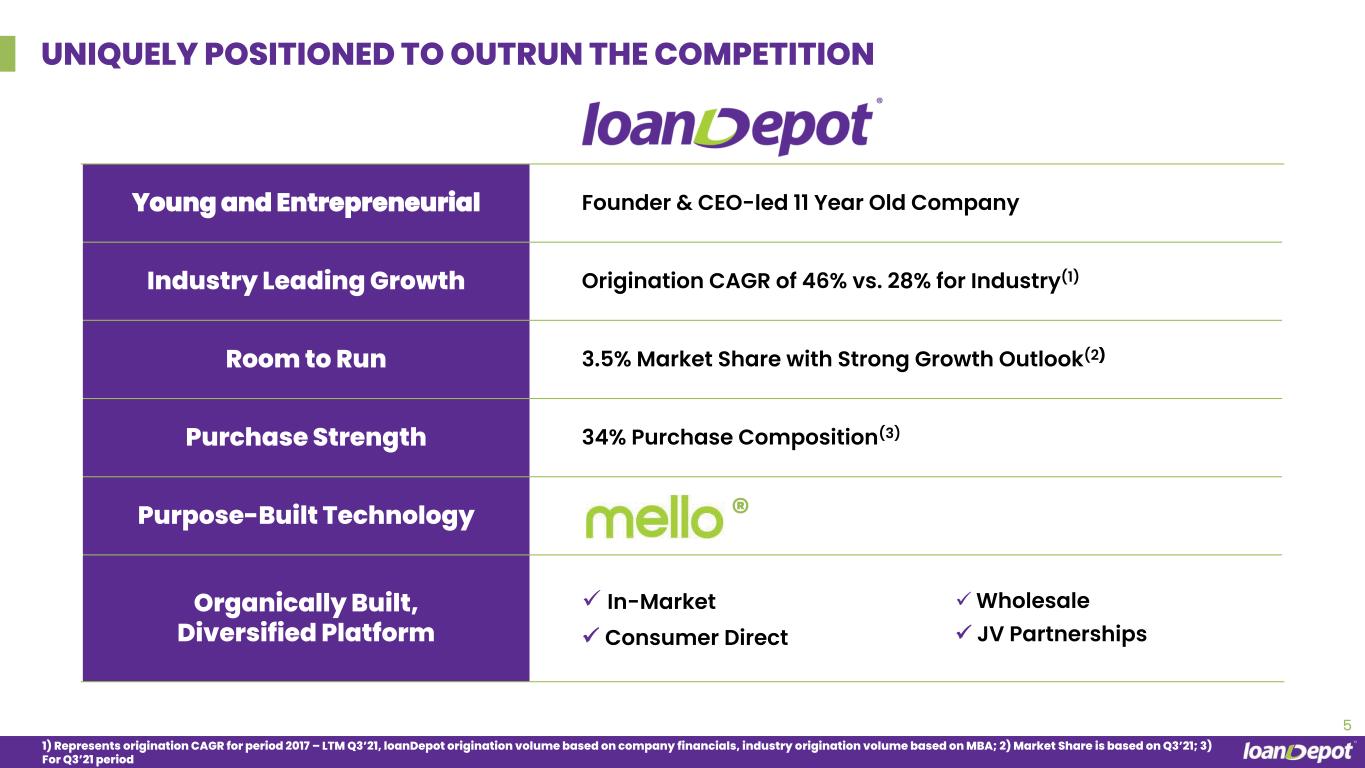
•9th consecutive quarter of year-over-year market share growth, growing 46% year-over-year to 3.5%1.
•Continued investments in brand and successful conclusion of first year of multi-year Major League Baseball partnership drove significant gains in brand awareness, growing by 14% quarter-over-quarter.
•Purchase mortgage transactions increased by 6% quarter-over-quarter and by 29% year-over-year demonstrating the power and resilience of loanDepot’s channel diversification strategy.
•Servicing portfolio increased to record $145 billion, representing over 469,000 homeowners, and resulted in quarterly servicing fee income of $102 million, increasing 112% year-over-year.
FOOTHILL RANCH, Calif., November 1, 2021 - loanDepot, Inc. (NYSE: LDI), (together with its subsidiaries, “loanDepot” or the “Company”), the innovative consumer lending and real estate services provider that is using its proprietary mello® technology to deliver best-in-class experiences to its customers, today announced results for the third quarter ended September 30, 2021.
“The third quarter proved to be another strong milestone in market share growth, increasing to 3.5% from 2.4% during the same quarter last year,” said loanDepot Founder and CEO Anthony Hsieh. “Our growing brand, proprietary mello tech stack, diversified channel strategy--which is the industry’s only at-scale model of this type--and the hard work and enthusiasm of our talented employees delivered higher revenues, higher earnings, and higher earnings per share.
“Our results demonstrate the agility and operational flexibility of our multi-channel strategy which enables us to succeed in any market condition, including challenging ones. The results of the third quarter are only a preview of what is to come in the future as we intend to continue to hire the best, leverage our brand, develop and apply innovative technology solutions, drive down costs and add more products and services to help our customers successfully navigate one of the most important financial transactions of their lives.
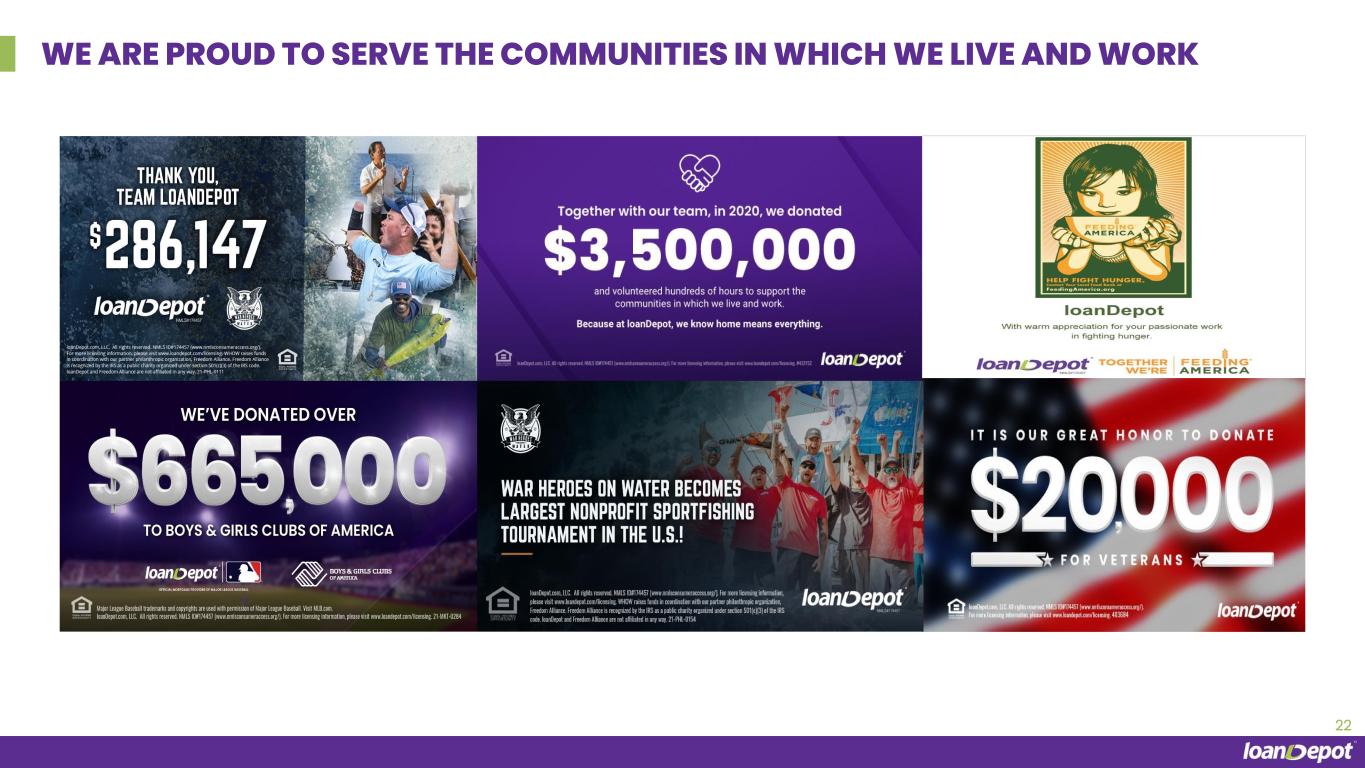
“Our marketing engine and customer acquisition abilities are one of the best in the business. Notably in October, we wrapped up the successful first year of our multi-year partnership with Major League Baseball by dominating media exposure at one of the biggest stages in professional sports: the League Championship Series presented by loanDepot. Our brand reached more than millions of baseball fans during ALCS and NLCS and was further supported by the launch of a new national advertising campaign featuring the success stories of real loanDepot customers. We believe our market share increase is a direct result of our growing investments and increased marketing reach, as well as our technology that matches customers to the best loan officer for their needs across our multi-channel strategy. And, thanks to our ‘Home Means Everything,’ RBI campaign, we donated more than $665,000 to the Boys & Girls Clubs of America, exemplifying our deep commitment to communities in which we live and work and delivering life-changing support for more than four million young people nationwide.
“Looking ahead, we believe our industry is moving towards consolidation of service providers for products and services for the homeowner and loanDepot is leading the way. We are uniquely positioned with the brand, technology and scale to invest in these additional products and services. The loanDepot Grand Slam is paving the way towards this consolidation with early success in the form of substantial increases in purchase lead volume,
1 Total market originations based on data as of October 17, 2021, from the Mortgage Bankers Association
1
real estate agent introductions, and real estate listings. We won’t stop there; we’re already planning to offer additional products and services for the benefit of our customers.”
Hsieh concluded, “We remain focused on our long-term strategy and vision to become the most trusted homeowner fulfillment company in the world, using our industry-leading position to drive the type of value and ease that today’s customers expect and demand. loanDepot represents an incredible value and we are confident we will continue to accelerate our growth, increase our market share, serve our customers, employees, shareholders and communities while outperforming in the long term.”
Current Market Conditions:
•Higher interest rates resulting in lower refinance transaction volumes.
•Continuing strong demand for purchase transactions, which is somewhat adversely impacted by supply constraints on new and resale housing and seasonal slowdown in buying activity.
•Increasing homeowners’ equity supports strong demand for cash-out refinance volume.
•Decreasing number of borrowers experiencing distress, with lower delinquencies and fewer borrowers in forbearance.
•Sharper focus on industry consolidation and expansion of ancillary products and services to capture additional revenue sources and expand customer engagement points.
Third Quarter Highlights:
Financial Summary
| Three Months Ended | Nine Months Ended | ||||||||||||||||||||||||||||
| ($ in thousands) (Unaudited) | September 30, 2021 | June 30, 2021 | September 30, 2020 | September 30, 2021 | September 30, 2020 | ||||||||||||||||||||||||
| Rate lock volume | $ | 43,673,515 | $ | 42,065,981 | $ | 49,280,386 | $ | 131,502,157 | $ | 111,273,261 | |||||||||||||||||||
Pull through weighted lock volume(1) | 30,354,123 | 29,787,081 | 35,596,250 | 93,603,559 | 78,689,036 | ||||||||||||||||||||||||
| Loan origination volume | 31,985,805 | 34,494,166 | 27,157,669 | 107,959,122 | 63,364,799 | ||||||||||||||||||||||||
Gain on sale margin(2) | 2.84 | % | 2.28 | % | 4.87 | % | 2.71 | % | 4.63 | % | |||||||||||||||||||
Pull through weighted gain on sale margin(3) | 2.99 | % | 2.64 | % | 3.72 | % | 3.13 | % | 3.73 | % | |||||||||||||||||||
| Financial Results | |||||||||||||||||||||||||||||
| Total revenue | $ | 923,756 | $ | 779,914 | $ | 1,368,930 | $ | 3,019,678 | $ | 3,013,780 | |||||||||||||||||||
| Total expense | 744,771 | 749,405 | 640,014 | 2,364,054 | 1,546,384 | ||||||||||||||||||||||||
| Net income | 154,277 | 26,284 | 728,349 | 608,414 | 1,465,939 | ||||||||||||||||||||||||
Diluted EPS(4) | $ | 0.40 | $ | 0.07 | N/A | $ | 0.82 | N/A | |||||||||||||||||||||
Non-GAAP Financial Measures(4) | |||||||||||||||||||||||||||||
| Adjusted total revenue | $ | 948,770 | $ | 825,330 | $ | 1,345,630 | $ | 3,015,540 | $ | 3,000,509 | |||||||||||||||||||
| Adjusted net income | 147,533 | 57,504 | 539,057 | 524,564 | 1,109,284 | ||||||||||||||||||||||||
| Adjusted EBITDA | 238,261 | 109,264 | 745,579 | 805,622 | 1,554,480 | ||||||||||||||||||||||||
| Adjusted Diluted EPS | $ | 0.46 | $ | 0.18 | N/A | $ | 1.62 | N/A | |||||||||||||||||||||
(1)Pull through weighted rate lock volume is the unpaid principal balance of loans subject to interest rate lock commitments, net of a pull-through factor for the loan funding probability.
(2)Gain on sale margin represents the total of (i) gain on origination and sale of loans, net, and (ii) origination income, net, divided by loan origination volume during period.
2
(3)Pull through weighted gain on sale margin represents the total of (i) gain on origination and sale of loans, net, and (ii) origination income, net, divided by the pull through weighted rate lock volume.
(4)On February 11, 2021, the Company’s common stock began trading on the New York Stock Exchange. Since loanDepot did not have any shares outstanding prior to this date, earnings per share (“EPS”) information was not determinable. The diluted EPS calculation includes net income attributable to loanDepot, Inc. divided by the diluted weighted average shares of Class A and Class D common stock outstanding for the period after February 11, 2021.
(5)See “Non-GAAP Financial Measures” for a discussion of how we define and calculate Adjusted Total Revenue, Adjusted Net Income, Adjusted Diluted EPS, and Adjusted EBITDA, and for a reconciliation of these metrics to their closest GAAP measure.
Operational Results
•Rate lock volume of $43.7 billion for the three months ended September 30, 2021 resulted in quarterly total revenue of $923.8 million, which represents an increase of $143.8 million, or 18%, from the second quarter of 2021.
•Loan origination volume for the third quarter of 2021 was $32.0 billion, a decrease of $2.5 billion or 7% from the second quarter of 2021.
•Our Retail and Partner strategies delivered $11.0 billion of purchase loan originations and $21.0 billion of refinance loan originations during the third quarter of 2021.
•Net income for the third quarter of 2021 increased to $154.3 million as compared to $26.3 million in the prior quarter. The quarter over quarter increase was primarily driven by the increase in rate lock volume and gain on sale margins, and a decrease in personnel expense.
•Primarily as a result of higher net income, adjusted EBITDA for the third quarter of 2021 increased to $238.3 million as compared to $109.3 million for the second quarter of 2021. Adjusted EBITDA excludes the impact of fair value changes of our mortgage servicing rights, net of hedging results, and other non-core operating expenses.
•Total expenses for the third quarter of 2021 decreased by $4.6 million, or 1% from the second quarter of 2021, due primarily to lower personnel expenses, partially due to the cost cutting initiatives that we initiated in the second quarter, and somewhat offset by higher marketing and advertising expenses.
Other Highlights
•Returned value to shareholders through a regular cash dividend of $0.08 per share paid on October 18, 2021, to shareholders of record on October 4, 2021.
•For the twelve month period ending September 30, 2021, our preliminary organic refinance consumer direct recapture rate2 increased to 71% as compared to the final recapture rate of 61% for the twelve month period ending September 30, 2020. This highlights the efficacy of our marketing efforts and the strength of our customer relationships, which includes our growing servicing portfolio that reached a record level of $145.3 billion in unpaid principal balance serviced as of September 30, 2021. This increase was against the backdrop of growing our servicing portfolio in-house and relying less on third party sub-servicing arrangements.
•We believe our position as the second largest independent retail mortgage brand grew even stronger through our ongoing national television ad campaign delivering over 20 billion household impressions from May 2020 through September 2021. This resulted in an increase in website visits during the third quarter by 16% from the third quarter of 2020.
•Millions of consumers recently interacted with the loanDepot brand as the presenting sponsor of two of the nation’s preeminent sporting events - the ALCS and NLCS, which averaged approximately five million viewers per game over each six game series.
2 We define organic refinance consumer direct recapture rate as the total unpaid principal balance (“UPB”) of loans in our servicing portfolio that are paid in full for purposes of refinancing the loan on the same property, with the Company acting as lender on both the existing and new loan, divided by the UPB of loans in our servicing portfolio that paid in full for the purpose of refinancing the loan on the same property. The recapture rate is finalized following the publication date of this release when external data becomes available. The second quarter 2021 final recapture rate was 78%.
3
•The fourth annual War Heroes on Water (WHOW) sport fishing tournament founded by loanDepot CEO Anthony Hsieh and supported by loanDepot, served 100 veterans directly and raised $1.4 million for WHOW’s philanthropic partner, Freedom Alliance, to serve the needs of thousands more. In addition to the “Home Means Everything” RBI Campaign, loanDepot was also honored as the first “Corporate Champion” for the Boys & Girls Clubs of Central Orange Coast in recognition of our continued passion and support for its mission.
Strategic Channel Overview
Our diverse origination strategy ensures we can serve customers in the way they want to be served, with the right mortgage professional, with the right product, at the right price, and at the right time. Complementing our origination strategy is our servicing portfolio, which ensures we can serve the customer through their entire mortgage journey.
Retail Channel
| Three Months Ended | Nine Months Ended | |||||||||||||||||||||||||||||||
| ($ in thousands) (Unaudited) | September 30, 2021 | June 30, 2021 | September 30, 2020 | September 30, 2021 | September 30, 2020 | |||||||||||||||||||||||||||
| Volume data: | ||||||||||||||||||||||||||||||||
| Rate locks | $ | 35,924,760 | $ | 33,925,833 | $ | 40,903,946 | $ | 106,924,605 | $ | 92,381,923 | ||||||||||||||||||||||
| Loan originations | 24,938,035 | 27,881,773 | 21,714,870 | 86,247,597 | 50,591,416 | |||||||||||||||||||||||||||
| Gain on sale margin | 3.28 | % | 2.50 | % | 5.07 | % | 3.02 | % | 4.96 | % | ||||||||||||||||||||||
The Company employs more than 3,000 licensed mortgage loan professionals who work in our Retail Channel that reach customers through our organic marketing or their own relationships in either our proprietary call centers or local in-market branches. During the third quarter of 2021, our Retail Channel accounted for $24.9 billion, or 78%, of our loan originations.
Partner Channel
| Three Months Ended | Nine Months Ended | |||||||||||||||||||||||||||||||
| ($ in thousands) (Unaudited) | September 30, 2021 | June 30, 2021 | September 30, 2020 | September 30, 2021 | September 30, 2020 | |||||||||||||||||||||||||||
| Volume data: | ||||||||||||||||||||||||||||||||
| Rate locks | $ | 7,748,755 | $ | 8,140,148 | $ | 8,376,440 | $ | 24,577,552 | $ | 18,891,338 | ||||||||||||||||||||||
| Loan originations | 7,047,770 | 6,612,393 | 5,442,799 | 21,711,525 | 12,773,383 | |||||||||||||||||||||||||||
| Gain on sale margin | 1.24 | % | 1.32 | % | 4.06 | % | 1.49 | % | 3.34 | % | ||||||||||||||||||||||
Our Partner Channel originates loans through our network of approved mortgage brokers, as well as a series of exclusive joint ventures with some of the nation’s largest homebuilders and depositories, who market our broad spectrum of products utilizing our innovative mello® technology platform to efficiently underwrite, process and fund mortgage loans, while delivering an exceptional customer experience. During the third quarter of 2021, our Partner Channel accounted for $7.0 billion, or 22%, of our loan originations. Margins in this channel have been adversely impacted by increased competitive pressures from some of the larger wholesale focused lenders.
The returns were complemented by $3.0 million of income recorded from our joint ventures for the third quarter of 2021, reflecting the wide variety of industry partners we work with in the channel.
4
Servicing
| Three Months Ended | Nine Months Ended | |||||||||||||||||||||||||||||||
Servicing Revenue Data: ($ in thousands) (Unaudited) | September 30, 2021 | June 30, 2021 | September 30, 2020 | September 30, 2021 | September 30, 2020 | |||||||||||||||||||||||||||
| Changes in fair value: | ||||||||||||||||||||||||||||||||
| Due to changes in valuation inputs or assumptions | $ | (3,461) | $ | (129,267) | $ | (3,009) | $ | 98,295 | $ | (112,059) | ||||||||||||||||||||||
Other changes in fair value(1) | (99,230) | (105,771) | (50,007) | (323,107) | (120,539) | |||||||||||||||||||||||||||
| Realized (losses) gains on sales of servicing rights | (14,218) | 6,089 | (2,606) | (8,224) | (2,549) | |||||||||||||||||||||||||||
| Net (loss) gain from derivatives hedging servicing rights | (21,553) | 83,851 | 26,309 | (94,158) | 125,330 | |||||||||||||||||||||||||||
| Changes in fair value of servicing rights, net | $ | (138,462) | $ | (145,098) | $ | (29,313) | $ | (327,194) | $ | (109,817) | ||||||||||||||||||||||
| Servicing fee income | $ | 102,429 | $ | 94,742 | $ | 48,406 | $ | 279,738 | $ | 121,520 | ||||||||||||||||||||||
(1)Other changes in fair value include fallout and decay from loan payoffs and principal amortization.
| Three Months Ended | Nine Months Ended | |||||||||||||||||||||||||||||||
Servicing Rights, at Fair Value: ($ in thousands) (Unaudited) | September 30, 2021 | June 30, 2021 | September 30, 2020 | September 30, 2021 | September 30, 2020 | |||||||||||||||||||||||||||
| Balance at beginning of period | $ | 1,776,395 | $ | 1,766,088 | $ | 569,927 | $ | 1,124,302 | $ | 444,443 | ||||||||||||||||||||||
| Additions | 345,882 | 427,458 | 262,401 | 1,302,884 | 574,768 | |||||||||||||||||||||||||||
| Sales proceeds, net | (182,892) | (182,113) | (2,319) | (365,680) | (9,620) | |||||||||||||||||||||||||||
| Changes in fair value: | ||||||||||||||||||||||||||||||||
| Due to changes in valuation inputs or assumptions | (3,461) | (129,267) | (3,009) | 98,295 | (112,059) | |||||||||||||||||||||||||||
| Other changes in fair value | (99,230) | (105,771) | (50,007) | (323,107) | (120,539) | |||||||||||||||||||||||||||
Balance at end of period (1) | $ | 1,836,694 | $ | 1,776,395 | $ | 776,993 | $ | 1,836,694 | $ | 776,993 | ||||||||||||||||||||||
(1)Balances are net of $4.8 million, $5.3 million, and $3.5 million of servicing rights liability as of September 30, 2021, June 30, 2021, and September 30, 2020, respectively.
5
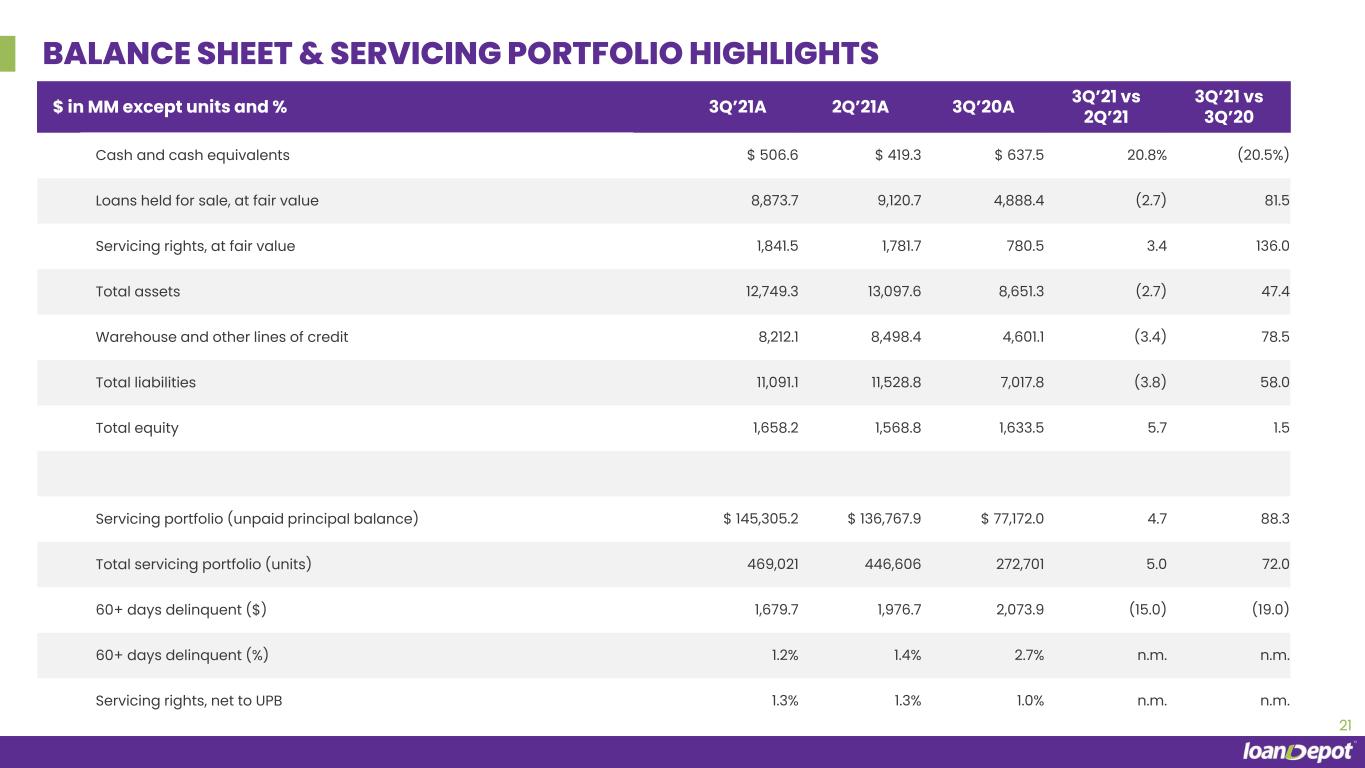
| % Change | ||||||||||||||||||||||||||||||||
Servicing Portfolio Data: ($ in thousands) (Unaudited) | September 30, 2021 | June 30, 2021 | September 30, 2020 | Sep - 21 vs Jun - 21 | Sep - 21 vs Sep - 20 | |||||||||||||||||||||||||||
| Servicing portfolio (unpaid principal balance) | $ | 145,305,182 | $ | 138,767,860 | $ | 77,171,998 | 4.7 | % | 88.3 | % | ||||||||||||||||||||||
| Total servicing portfolio (units) | 469,019 | 446,606 | 272,701 | 5.0 | 72.0 | |||||||||||||||||||||||||||
| 60+ days delinquent ($) | $ | 1,679,691 | $ | 1,976,658 | $ | 2,073,862 | (15.0) | (19.0) | ||||||||||||||||||||||||
| 60+ days delinquent (%) | 1.2 | % | 1.4 | % | 2.7 | % | ||||||||||||||||||||||||||
| Servicing rights, net to UPB | 1.3 | % | 1.3 | % | 1.0 | % | ||||||||||||||||||||||||||
The increase in unpaid principal balance of our servicing portfolio was driven by an increase in servicing-retained loan sales, offset somewhat by sales of $13.5 billion of unpaid principal balance during the quarter. We continued to invest in growing our high-quality servicing portfolio, which is also a valuable origination source for us.
As of September 30, 2021, approximately 1.1%, or $1.6 billion, of our servicing portfolio was in active forbearance. This represents a decrease from 1.4%, or $1.9 billion as of June 30, 2021.
Balance Sheet Highlights
| % Change | ||||||||||||||||||||||||||||||||
($ in thousands) (Unaudited) | September 30, 2021 | June 30, 2021 | September 30, 2020 | Sep - 21 vs. Jun - 21 | Sep - 21 vs. Sep-20 | |||||||||||||||||||||||||||
| Cash and cash equivalents | $ | 506,608 | $ | 419,283 | $ | 637,511 | 20.8 | % | (20.5) | % | ||||||||||||||||||||||
| Loans held for sale, at fair value | 8,873,736 | 9,120,653 | 4,888,364 | (2.7) | 81.5 | |||||||||||||||||||||||||||
| Servicing rights, at fair value | 1,841,512 | 1,781,686 | 780,451 | 3.4 | 136.0 | |||||||||||||||||||||||||||
| Total assets | 12,749,278 | 13,097,643 | 8,651,314 | (2.7) | 47.4 | |||||||||||||||||||||||||||
| Warehouse and other lines of credit | 8,212,142 | 8,498,365 | 4,601,062 | (3.4) | 78.5 | |||||||||||||||||||||||||||
| Total liabilities | 11,091,114 | 11,528,809 | 7,017,793 | (3.8) | 58.0 | |||||||||||||||||||||||||||
| Total equity | 1,658,164 | 1,568,834 | 1,633,521 | 5.7 | 1.5 | |||||||||||||||||||||||||||
The increase in cash and cash equivalents from June 30, 2021 was primarily due to net proceeds of $152.4 million from the bulk sale of MSR servicing rights and loans sold in excess of loans originated during the quarter, partially offset by a reduction in debt obligations from the paydown of repo facilities. A decrease in loans held for sale at September 30, 2021, resulted in a corresponding decrease in the balance on our warehouse lines of credit as loans sold exceeded loan originations. Total funding capacity with our lending partners increased to $11.1 billion at September 30, 2021 from $9.5 billion at June 30, 2021. The funding capacity increase of $1.6 billion was primarily due to the addition of one new facility and increased commitments on existing facilities. Available borrowing capacity was $2.8 billion at September 30, 2021.
6
Consolidated Statements of Operations
| ($ in thousands) | Three Months Ended | Nine Months Ended | |||||||||||||||||||||||||||
| September 30, 2021 | June 30, 2021 | September 30, 2020 | September 30, 2021 | September 30, 2020 | |||||||||||||||||||||||||
| (Unaudited) | (Unaudited) | ||||||||||||||||||||||||||||
| REVENUES: | |||||||||||||||||||||||||||||
| Interest income | $ | 71,020 | $ | 61,874 | $ | 31,453 | $ | 187,625 | $ | 98,149 | |||||||||||||||||||
| Interest expense | (56,785) | (54,848) | (29,553) | (165,130) | (88,881) | ||||||||||||||||||||||||
| Net interest income | 14,235 | 7,026 | 1,900 | 22,495 | 9,268 | ||||||||||||||||||||||||
| Gain on origination and sale of loans, net | 821,275 | 692,479 | 1,251,141 | 2,647,328 | 2,767,140 | ||||||||||||||||||||||||
| Origination income, net | 86,601 | 92,624 | 71,740 | 280,824 | 167,554 | ||||||||||||||||||||||||
| Servicing fee income | 102,429 | 94,742 | 48,406 | 279,738 | 121,520 | ||||||||||||||||||||||||
| Change in fair value of servicing rights, net | (138,462) | (145,098) | (29,313) | (327,194) | (109,817) | ||||||||||||||||||||||||
| Other income | 37,678 | 38,141 | 25,056 | 116,487 | 58,115 | ||||||||||||||||||||||||
| Total net revenues | 923,756 | 779,914 | 1,368,930 | 3,019,678 | 3,013,780 | ||||||||||||||||||||||||
| EXPENSES: | |||||||||||||||||||||||||||||
| Personnel expense | 449,152 | 470,125 | 441,818 | 1,523,012 | 1,022,734 | ||||||||||||||||||||||||
| Marketing and advertising expense | 131,971 | 114,133 | 60,435 | 355,730 | 173,628 | ||||||||||||||||||||||||
| Direct origination expense | 49,559 | 50,017 | 33,465 | 146,553 | 88,627 | ||||||||||||||||||||||||
| General and administrative expense | 50,013 | 48,654 | 52,372 | 149,984 | 120,565 | ||||||||||||||||||||||||
| Occupancy expense | 9,686 | 9,283 | 9,997 | 28,956 | 29,437 | ||||||||||||||||||||||||
| Depreciation and amortization | 8,688 | 8,686 | 8,585 | 25,827 | 27,122 | ||||||||||||||||||||||||
| Subservicing expense | 22,879 | 27,241 | 22,820 | 76,731 | 52,154 | ||||||||||||||||||||||||
| Other interest expense | 22,823 | 21,266 | 10,522 | 57,261 | 32,117 | ||||||||||||||||||||||||
| Total expenses | 744,771 | 749,405 | 640,014 | 2,364,054 | 1,546,384 | ||||||||||||||||||||||||
| Income before income taxes | 178,985 | 30,509 | 728,916 | 655,624 | 1,467,396 | ||||||||||||||||||||||||
| Income tax expense | 24,708 | 4,225 | 567 | 47,210 | 1,457 | ||||||||||||||||||||||||
| Net income | 154,277 | 26,284 | 728,349 | 608,414 | 1,465,939 | ||||||||||||||||||||||||
| Net income attributable to noncontrolling interests | 102,802 | 17,723 | 728,349 | 503,503 | 1,465,939 | ||||||||||||||||||||||||
| Net income attributable to loanDepot, Inc. | $ | 51,475 | $ | 8,561 | $ | — | $ | 104,911 | $ | — | |||||||||||||||||||
| Basic EPS | $ | 0.40 | $ | 0.07 | N/A | $ | 0.82 | N/A | |||||||||||||||||||||
| Diluted EPS | $ | 0.40 | $ | 0.07 | N/A | $ | 0.82 | N/A | |||||||||||||||||||||
7
Consolidated Balance Sheets
| ($ in thousands) | September 30, 2021 | June 30, 2021 | December 31, 2020 | ||||||||||||||
| (Unaudited) | |||||||||||||||||
| ASSETS | |||||||||||||||||
| Cash and cash equivalents | $ | 506,608 | $ | 419,283 | $ | 284,224 | |||||||||||
| Restricted cash | 97,805 | 217,435 | 204,465 | ||||||||||||||
| Accounts receivable, net | 68,050 | 65,185 | 138,122 | ||||||||||||||
| Loans held for sale, at fair value | 8,873,736 | 9,120,653 | 6,955,424 | ||||||||||||||
| Derivative assets, at fair value | 341,359 | 349,621 | 647,939 | ||||||||||||||
| Servicing rights, at fair value | 1,841,512 | 1,781,686 | 1,127,866 | ||||||||||||||
| Trading securities, at fair value | 56,412 | 16,757 | — | ||||||||||||||
| Property and equipment, net | 103,556 | 98,686 | 85,002 | ||||||||||||||
| Operating lease right-of-use asset | 58,002 | 60,123 | 66,433 | ||||||||||||||
| Prepaid expenses and other assets | 108,720 | 94,814 | 77,241 | ||||||||||||||
| Loans eligible for repurchase | 632,722 | 812,431 | 1,246,158 | ||||||||||||||
| Investments in joint ventures | 18,353 | 18,398 | 17,528 | ||||||||||||||
| Goodwill and other intangible assets, net | 42,443 | 42,571 | 42,826 | ||||||||||||||
| Total assets | $ | 12,749,278 | $ | 13,097,643 | $ | 10,893,228 | |||||||||||
| LIABILITIES AND EQUITY | |||||||||||||||||
| LIABILITIES: | |||||||||||||||||
| Warehouse and other lines of credit | $ | 8,212,142 | $ | 8,498,365 | $ | 6,577,429 | |||||||||||
| Accounts payable and accrued expenses | 715,615 | 607,767 | 446,370 | ||||||||||||||
| Derivative liabilities, at fair value | 48,899 | 58,805 | 168,169 | ||||||||||||||
| Liability for loans eligible for repurchase | 632,722 | 812,431 | 1,246,158 | ||||||||||||||
| Operating lease liability | 72,985 | 78,132 | 86,023 | ||||||||||||||
| Debt obligations, net | 1,408,751 | 1,473,309 | 712,466 | ||||||||||||||
| Total liabilities | 11,091,114 | 11,528,809 | 9,236,615 | ||||||||||||||
| EQUITY: | |||||||||||||||||
| Total equity | 1,658,164 | 1,568,834 | 1,656,613 | ||||||||||||||
| Total liabilities and equity | $ | 12,749,278 | $ | 13,097,643 | $ | 10,893,228 | |||||||||||
8
Loan Origination and Sales Data
($ in thousands) (Unaudited) | Three Months Ended | ||||||||||||||||||||||
| September 30, 2021 | June 30, 2021 | September 30, 2020 | |||||||||||||||||||||
| Loan origination volume by type: | |||||||||||||||||||||||
| Conventional conforming | $ | 23,621,149 | $ | 27,933,929 | $ | 22,034,957 | |||||||||||||||||
| FHA/VA/USDA | 4,784,112 | 4,231,466 | 4,532,290 | ||||||||||||||||||||
| Jumbo | 3,049,321 | 2,057,466 | 209,167 | ||||||||||||||||||||
| Other | 531,223 | 271,305 | 381,255 | ||||||||||||||||||||
| Total | $ | 31,985,805 | $ | 34,494,166 | $ | 27,157,669 | |||||||||||||||||
| Loan origination volume by channel: | |||||||||||||||||||||||
| Retail | $ | 24,938,035 | $ | 27,881,773 | $ | 21,714,870 | |||||||||||||||||
| Partnership | 7,047,770 | 6,612,393 | 5,442,799 | ||||||||||||||||||||
| Total | $ | 31,985,805 | $ | 34,494,166 | $ | 27,157,669 | |||||||||||||||||
| Loan origination volume by purpose: | |||||||||||||||||||||||
| Purchase | $ | 11,008,399 | $ | 10,382,964 | $ | 8,546,295 | |||||||||||||||||
| Refinance | 20,977,406 | 24,111,202 | 18,611,374 | ||||||||||||||||||||
| Total | $ | 31,985,805 | $ | 34,494,166 | $ | 27,157,669 | |||||||||||||||||
| Loans sold: | |||||||||||||||||||||||
| Servicing retained | $ | 26,520,547 | $ | 30,981,299 | $ | 24,402,497 | |||||||||||||||||
| Servicing released | 5,672,551 | 3,309,151 | 1,195,252 | ||||||||||||||||||||
| Total | $ | 32,193,098 | $ | 34,290,450 | $ | 25,597,749 | |||||||||||||||||
| Loan origination margins: | |||||||||||||||||||||||
| Gain on sale margin | 2.84 | % | 2.28 | % | 4.87 | % | |||||||||||||||||
Third Quarter Earnings Call
Management will host a conference call and live webcast today at 11:00 a.m. ET on loanDepot’s Investor Relations website, investors.loandepot.com, to discuss its earnings results.
The conference call can also be accessed by dialing 833-312-1365 (domestic) or 236-712-2485 (international) using pin number 8139358. Please call five minutes in advance to ensure that you are connected prior to the call. A replay of the webcast and transcript will also be made available on the Investor Relations website following the conclusion of the event.
For more information about loanDepot, please visit the company’s Investor Relations website: investors.loandepot.com.
9
Non-GAAP Financial Measures
To provide investors with information in addition to our results as determined by GAAP, we disclose Adjusted Total Revenue, Adjusted Net Income, Adjusted Diluted EPS, and Adjusted EBITDA as non-GAAP measures. We believe Adjusted Total Revenue, Adjusted Net Income, Adjusted Diluted EPS, and Adjusted EBITDA provide useful information to investors regarding our results of operations because each measure assists both investors and management in analyzing and benchmarking the performance and value of our business. They facilitate company-to-company operating performance comparisons by backing out potential differences caused by variations in hedging strategies, changes in valuations, capital structures (affecting net interest expense), taxation, the age and book depreciation of facilities (affecting relative depreciation expense) and the amortization of intangibles, which may vary for different companies for reasons unrelated to operating performance, as well as certain historical cost (benefit) items which may vary for different companies for reasons unrelated to operating performance. These measures are not financial measures calculated in accordance with GAAP and should not be considered as a substitute for revenue, net income, or any other operating performance measure calculated in accordance with GAAP, and may not be comparable to a similarly titled measure reported by other companies.
We define “Adjusted Total Revenue” as total revenues, net of the change in fair value of mortgage servicing rights (“MSRs”) and the related hedging gains and losses. We define “Adjusted Net Income” as tax-effected earnings before change in fair value of contingent consideration, stock compensation expense and management fees, IPO expense, and the change in fair value of MSRs, net of the related hedging gains and losses, and the tax effects of those adjustments. We define “Adjusted Diluted EPS” as Adjusted Net Income divided by the diluted weighted average number of shares of Class A common stock and Class D common stock outstanding for the applicable period, which assumes the proforma exchange of all outstanding Class C common shares for shares of Class A common stock. We define “Adjusted EBITDA” as earnings before interest expense and amortization of debt issuance costs on non-funding debt, income taxes, depreciation and amortization, change in fair value of MSRs, net of the related hedging gains and losses, change in fair value of contingent consideration, stock compensation expense and management fees, and IPO related expense. Adjustments for income taxes are made to reflect historical results of operations on the basis that it was taxed as a corporation under the Internal Revenue Code, and therefore subject to U.S. federal, state and local income taxes. We exclude from each of these non-GAAP measures the change in fair value of MSRs and related hedging gains and losses as this represents a non-cash non-realized adjustment to our total revenues, reflecting changes in assumptions including discount rates and prepayment speed assumptions, mostly due to changes in market interest rates, which is not indicative of our performance or results of operations. We also exclude stock compensation expense, which is a non-cash expense, management fees and IPO expenses as management does not consider these costs to be indicative of our performance or results of operations. Adjusted EBITDA includes interest expense on funding facilities, which are recorded as a component of “net interest income (expense)”, as these expenses are a direct operating expense driven by loan origination volume. By contrast, interest and amortization expense on non-funding debt is a function of our capital structure and is therefore excluded from Adjusted EBITDA.
Adjusted Total Revenue, Adjusted Net Income, Adjusted Diluted EPS, and Adjusted EBITDA have limitations as analytical tools, and you should not consider them in isolation or as a substitute for analysis of our results as reported under U.S. GAAP. Some of these limitations are:
•they do not reflect every cash expenditure, future requirements for capital expenditures or contractual commitments;
•Adjusted EBITDA does not reflect the significant interest expense or the cash requirements necessary to service interest or principal payment on our debt;
•although depreciation and amortization are non-cash charges, the assets being depreciated and amortized will often have to be replaced or require improvements in the future, and Adjusted Total Revenue,
10
Adjusted Net Income, and Adjusted EBITDA do not reflect any cash requirement for such replacements or improvements; and
•they are not adjusted for all non-cash income or expense items that are reflected in our statements of cash flows.
Because of these limitations, Adjusted Total Revenue, Adjusted Net Income, Adjusted Diluted EPS, and Adjusted EBITDA are not intended as alternatives to total revenue, net income (loss), net income attributable to the Company, or Diluted EPS or as an indicator of our operating performance and should not be considered as measures of discretionary cash available to us to invest in the growth of our business or as measures of cash that will be available to us to meet our obligations. We compensate for these limitations by using Adjusted Total Revenue, Adjusted Net Income, Adjusted Diluted EPS, and Adjusted EBITDA along with other comparative tools, together with U.S. GAAP measurements, to assist in the evaluation of operating performance. See below for a reconciliation of these non-GAAP measures to their most comparable U.S. GAAP measures.
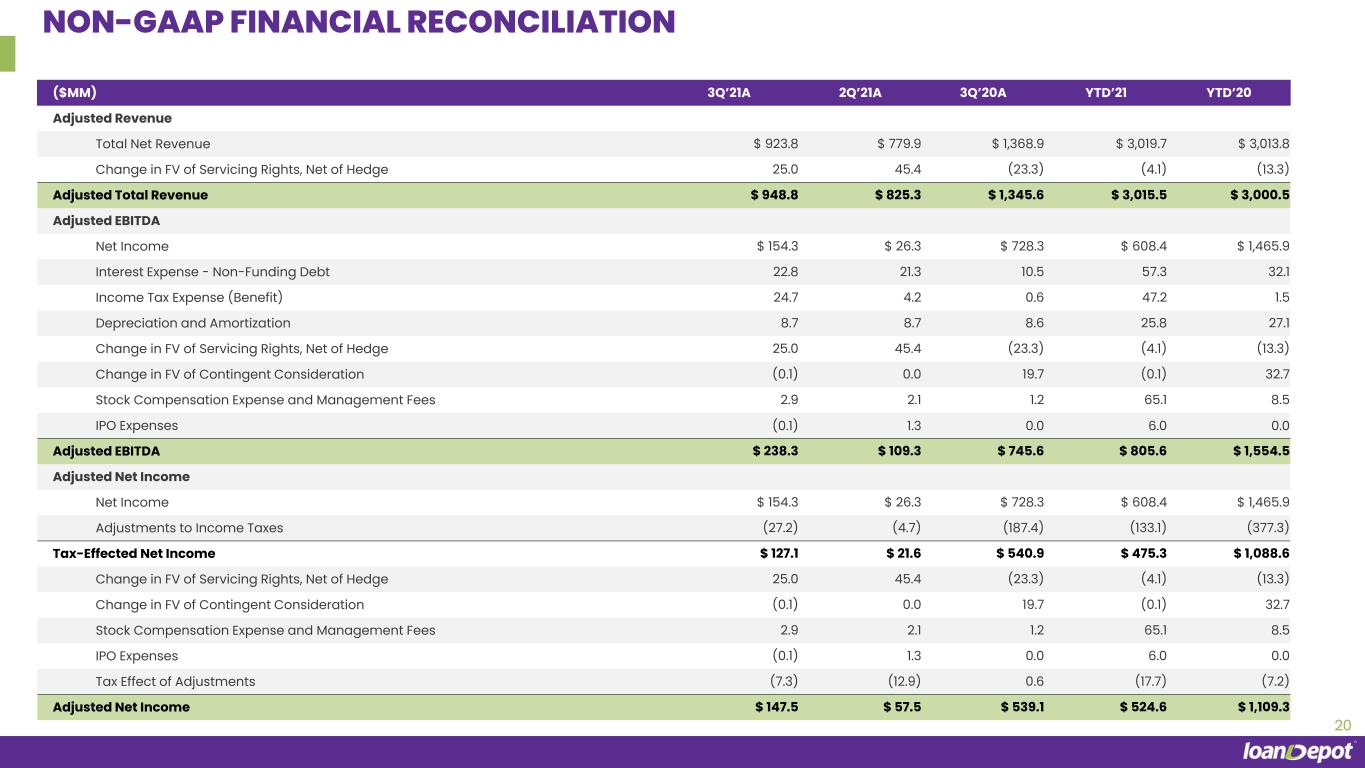
Reconciliation of Total Revenue to Adjusted Total Revenue ($ in thousands) (Unaudited) | Three Months Ended | Nine Months Ended | ||||||||||||||||||||||||||||||
| September 30, 2021 | June 30, 2021 | September 30, 2020 | September 30, 2021 | September 30, 2020 | ||||||||||||||||||||||||||||
| (Unaudited) | (Unaudited) | |||||||||||||||||||||||||||||||
| Total net revenue | $ | 923,756 | $ | 779,914 | $ | 1,368,930 | $ | 3,019,678 | $ | 3,013,780 | ||||||||||||||||||||||
Change in fair value of servicing rights, net of hedging gains and losses(1) | 25,014 | 45,416 | (23,300) | (4,138) | (13,271) | |||||||||||||||||||||||||||
| Adjusted total revenue | $ | 948,770 | $ | 825,330 | $ | 1,345,630 | $ | 3,015,540 | $ | 3,000,509 | ||||||||||||||||||||||
(1)Represents the change in the fair value of servicing rights attributable to changes in assumptions, net of hedging gains and losses.
11
Reconciliation of Net Income to Adjusted Net Income ($ in thousands) (Unaudited) | Three Months Ended | Nine Months Ended | ||||||||||||||||||||||||||||||
| September 30, 2021 | June 30, 2021 | September 30, 2020 | September 30, 2021 | September 30, 2020 | ||||||||||||||||||||||||||||
| Net income attributable to loanDepot, Inc. | $ | 51,475 | $ | 8,561 | $ | — | $ | 104,911 | $ | — | ||||||||||||||||||||||
Net income from the pro forma conversion of Class C common shares to Class A common shares (1) | 102,802 | 17,723 | 728,349 | 503,503 | 1,465,939 | |||||||||||||||||||||||||||
| Net income | $ | 154,277 | $ | 26,284 | $ | 728,349 | $ | 608,414 | $ | 1,465,939 | ||||||||||||||||||||||
Adjustments to the provision for income taxes(2) | (27,171) | (4,684) | (187,477) | (133,076) | (377,333) | |||||||||||||||||||||||||||
| Tax-effected net income | 127,106 | 21,600 | 540,872 | 475,338 | 1,088,606 | |||||||||||||||||||||||||||
Change in fair value of servicing rights, net of hedging gains and losses(3) | 25,014 | 45,416 | (23,300) | (4,138) | (13,271) | |||||||||||||||||||||||||||
| Change in fair value - contingent consideration | (77) | — | 19,670 | (77) | 32,650 | |||||||||||||||||||||||||||
| Stock compensation expense and management fees | 2,882 | 2,126 | 1,186 | 65,084 | 8,466 | |||||||||||||||||||||||||||
| IPO expenses | (54) | 1,261 | — | 6,041 | — | |||||||||||||||||||||||||||
Tax effect of adjustments(4) | (7,338) | (12,899) | 629 | (17,684) | (7,167) | |||||||||||||||||||||||||||
| Adjusted net income | $ | 147,533 | $ | 57,504 | $ | 539,057 | $ | 524,564 | $ | 1,109,284 | ||||||||||||||||||||||
(1)Reflects net income to Class A common stock and Class D common stock from the pro forma exchange of Class C common stock.
(2)loanDepot, Inc. is subject to federal, state and local income taxes. Adjustments to income tax (benefit) reflect the effective income tax rates below, and the pro forma assumption that loanDepot, Inc. owns 100% of LD Holdings.
| Three Months Ended | Nine Months Ended | ||||||||||||||||||||||||||||||||||
| September 30, 2021 | June 30, 2021 | September 30, 2020 | September 30, 2021 | September 30, 2020 | |||||||||||||||||||||||||||||||
| Statutory U.S. federal income tax rate | 21.00 | % | 21.00 | % | 21.00 | % | 21.00 | % | 21.00 | % | |||||||||||||||||||||||||
| State and local income taxes (net of federal benefit) | 5.43 | % | 5.43 | % | 4.74 | % | 5.43 | % | 4.74 | % | |||||||||||||||||||||||||
| Effective income tax rate | 26.43 | % | 26.43 | % | 25.74 | % | 26.43 | % | 25.74 | % | |||||||||||||||||||||||||
(3)Represents the change in the fair value of servicing rights attributable to changes in assumptions, net of hedging gains and losses.
(4)Amounts represent the income tax effect of (a) change in fair value of servicing rights, net of hedging gains and losses, (b) change in fair value of contingent consideration (c) stock compensation expense and management fees, and (d) IPO expense at the aforementioned effective income tax rates.
12
Reconciliation of Adjusted Diluted Weighted Average Shares Outstanding to Diluted Weighted Average Shares Outstanding(1) ($ in thousands except per share) (Unaudited) | Three Months Ended | Nine Months Ended | ||||||||||||||||||
| September 30, 2021 | June 30, 2021 | September 30, 2021 | ||||||||||||||||||
| Net income attributable to loanDepot, Inc. | $ | 51,475 | $ | 8,561 | $ | 104,911 | ||||||||||||||
| Adjusted net income | 147,533 | 57,504 | 524,564 | |||||||||||||||||
| Share Data: | ||||||||||||||||||||
| Diluted weighted average shares of Class A and Class D common stock outstanding | 130,297,565 | 126,726,876 | 127,941,331 | |||||||||||||||||
Assumed pro forma conversion of Class C shares to Class A common stock (2) | 191,579,524 | 196,741,703 | 195,111,599 | |||||||||||||||||
| Adjusted diluted weighted average shares outstanding | 321,877,089 | 323,468,579 | 323,052,930 | |||||||||||||||||
| Diluted EPS | $ | 0.40 | $ | 0.07 | $ | 0.82 | ||||||||||||||
| Adjusted Diluted EPS | 0.46 | 0.18 | 1.62 | |||||||||||||||||
(1)This non-GAAP measures was not applicable for the three or nine months ended September 30, 2020 as the IPO and reorganization transaction had not yet occurred.
(2)Reflects the assumed pro forma conversion of all outstanding shares of Class C common stock to Class A common stock.
Reconciliation of Net Income to Adjusted EBITDA ($ in thousands) (Unaudited) | Three Months Ended | Nine Months Ended | ||||||||||||||||||||||||||||||
| September 30, 2021 | June 30, 2021 | September 30, 2020 | September 30, 2021 | September 30, 2020 | ||||||||||||||||||||||||||||
| Net income | $ | 154,277 | $ | 26,284 | $ | 728,349 | $ | 608,414 | $ | 1,465,939 | ||||||||||||||||||||||
Interest expense - non-funding debt (1) | 22,823 | 21,266 | 10,522 | 57,261 | 32,117 | |||||||||||||||||||||||||||
| Income tax expense | 24,708 | 4,225 | 567 | 47,210 | 1,457 | |||||||||||||||||||||||||||
| Depreciation and amortization | 8,688 | 8,686 | 8,585 | 25,827 | 27,122 | |||||||||||||||||||||||||||
Change in fair value of servicing rights, net of hedging gains and losses(2) | 25,014 | 45,416 | (23,300) | (4,138) | (13,271) | |||||||||||||||||||||||||||
| Change in fair value - contingent consideration | (77) | — | 19,670 | (77) | 32,650 | |||||||||||||||||||||||||||
| Stock compensation expense and management fees | 2,882 | 2,126 | 1,186 | 65,084 | 8,466 | |||||||||||||||||||||||||||
| IPO expense | (54) | 1,261 | — | 6,041 | — | |||||||||||||||||||||||||||
| Adjusted EBITDA | $ | 238,261 | $ | 109,264 | $ | 745,579 | $ | 805,622 | $ | 1,554,480 | ||||||||||||||||||||||
(1)Represents other interest expense, which includes amortization of debt issuance costs, in the Company’s consolidated statement of operations.
(2)Represents the change in the fair value of servicing rights attributable to changes in assumptions, net of hedging gains and losses.
13
Forward-Looking Statements
This press release may contain "forward-looking statements," which reflect loanDepot's current views with respect to, among other things, its operations and financial performance. You can identify these statements by the use of words such as "outlook," "potential," "continue," "may," "seek," "approximately," "predict," "believe," "expect," "plan," "intend," "estimate" or "anticipate" and similar expressions or the negative versions of these words or comparable words, as well as future or conditional verbs such as "will," "should," "would" and "could." These forward-looking statements are based on current available operating, financial, economic and other information, and are not guarantees of future performance and are subject to risks, uncertainties and assumptions, including the risks in the "Risk Factors" section of loanDepot, Inc.'s Annual Report on Form 10-K for the year ended December 31, 2020, which are difficult to predict. Therefore, current plans, anticipated actions, financial results, as well as the anticipated development of the industry, may differ materially from what is expressed or forecasted in any forward-looking statement. loanDepot does not undertake any obligation to publicly update or revise any forward-looking statement to reflect future events or circumstances, except as required by applicable law.
About loanDepot
loanDepot (NYSE: LDI) is a digital commerce company committed to serving its customers throughout the home ownership journey. Since its launch in 2010, loanDepot has revolutionized the mortgage industry with a digital-first approach that makes it easier, faster and less stressful to purchase or refinance a home. Today, as the nation's second largest retail mortgage lender, loanDepot enables customers to achieve the American dream of homeownership through a broad suite of lending and real estate services that simplify one of life's most complex transactions. With headquarters in Southern California and offices nationwide, loanDepot is committed to serving the communities in which its team lives and works through a variety of local, regional and national philanthropic efforts.
Investor Relations Contact:
Gerhard Erdelji
Senior Vice President, Investor Relations
(949) 822-4074
Media Contact:
Rebecca Anderson
Senior Vice President, Communications & Public Relations
(949) 822-4024
LDI-IR
14

3Q 2021 INVESTOR PRESENTATION November 1, 2021
DISCLAIMER 2 Forward-Looking Statements and Other Information This presentation may contain "forward-looking statements," which reflect loanDepot's current views with respect to, among other things, its operations and financial performance. You can identify these statements by the use of words such as "outlook," "potential," "continue," "may," "seek," "approximately," "predict," "believe," "expect,“ "plan," "intend," "estimate" or "anticipate" and similar expressions or the negative versions of these words or comparable words, as well as future or conditional verbs such as "will," "should," "would" and "could.” All statements other than statements of historical fact are statements that could be deemed forward-looking statements, including, but not limited to, guidance to our pull-through weighted rate lock volume, origination volume and pull-through weighted gain-on-sale margin. These forward-looking statements are based on current available operating, financial, economic and other information, and are not guarantees of future performance and are subject to risks, uncertainties and assumptions, including the risks in the "Risk Factors" section of loanDepot, Inc.'s Annual Report on Form 10-K for the year ended December 31, 2020, which are difficult to predict. Therefore, current plans, anticipated actions, financial results, as well as the anticipated development of the industry, may differ materially from what is expressed or forecasted in any forward-looking statement. loanDepot does not undertake any obligation to publicly update or revise any forward-looking statement to reflect future events or circumstances, except as required by applicable law. Non-GAAP Financial Information To provide investors with information in addition to our results as determined by GAAP, we disclose Adjusted Total Revenue, Adjusted Net Income, Adjusted Diluted EPS, and Adjusted EBITDA as non-GAAP measures. We believe Adjusted Total Revenue, Adjusted Net Income, Adjusted Diluted EPS, and Adjusted EBITDA provide useful information to investors regarding our results of operations because each measure assists both investors and management in analyzing and benchmarking the performance and value of our business. They facilitate company-to-company operating performance comparisons by backing out potential differences caused by variations in hedging strategies, changes in valuations, capital structures (affecting net interest expense), taxation, the age and book depreciation of facilities (affecting relative depreciation expense) and the amortization of intangibles, which may vary for different companies for reasons unrelated to operating performance, as well as certain historical cost (benefit) items which may vary for different companies for reasons unrelated to operating performance. These measures are not financial measures calculated in accordance with GAAP and should not be considered as a substitute for revenue, net income, or any other operating performance measure calculated in accordance with GAAP, and may not be comparable to a similarly titled measure reported by other companies. Market and Industry Data This presentation also contains information regarding the loanDepot’s market and industry that is derived from third-party research and publications. That information may rely upon a number of assumptions and limitations, and the Company has not independently verified its accuracy or completeness.
$12 trillion total addressable market Culture focused on continuous innovation Relentless focus on delighting the customer Model positioned to continue capturing market share WE ARE DISRUPTING CONSUMER FINANCE THROUGH CONTINUOUS INNOVATION 3
WHY loanDepot WINS Scaled Leader in a Massive Ecosystem that is Ripe for Disruption Founder-Led Management Team with Unique Skillsets Innovative Workplace and Customer-Centric Culture Attractive Financial Model with Earnings Growth Opportunity Market-Leading Brand and Data-Driven Customer Acquisition Capabilities Interconnected Origination Strategy that Leverages the Same Technology Platform to Thrive in Any Market Environment Purpose-Built End-to-End Technology Platform that Drives Efficiency and Superior Customer Experience 4 1 2 6 3 4 5 7
5 UNIQUELY POSITIONED TO OUTRUN THE COMPETITION Young and Entrepreneurial Founder & CEO-led 11 Year Old Company Industry Leading Growth Origination CAGR of 46% vs. 28% for Industry(1) Room to Run 3.5% Market Share with Strong Growth Outlook(2) Purchase Strength 34% Purchase Composition(3) Purpose-Built Technology Organically Built, Diversified Platform ✓ In-Market ✓ Consumer Direct 1) Represents origination CAGR for period 2017 – LTM Q3’21, loanDepot origination volume based on company financials, industry origination volume based on MBA; 2) Market Share is based on Q3’21; 3) For Q3’21 period ® ✓Wholesale ✓ JV Partnerships
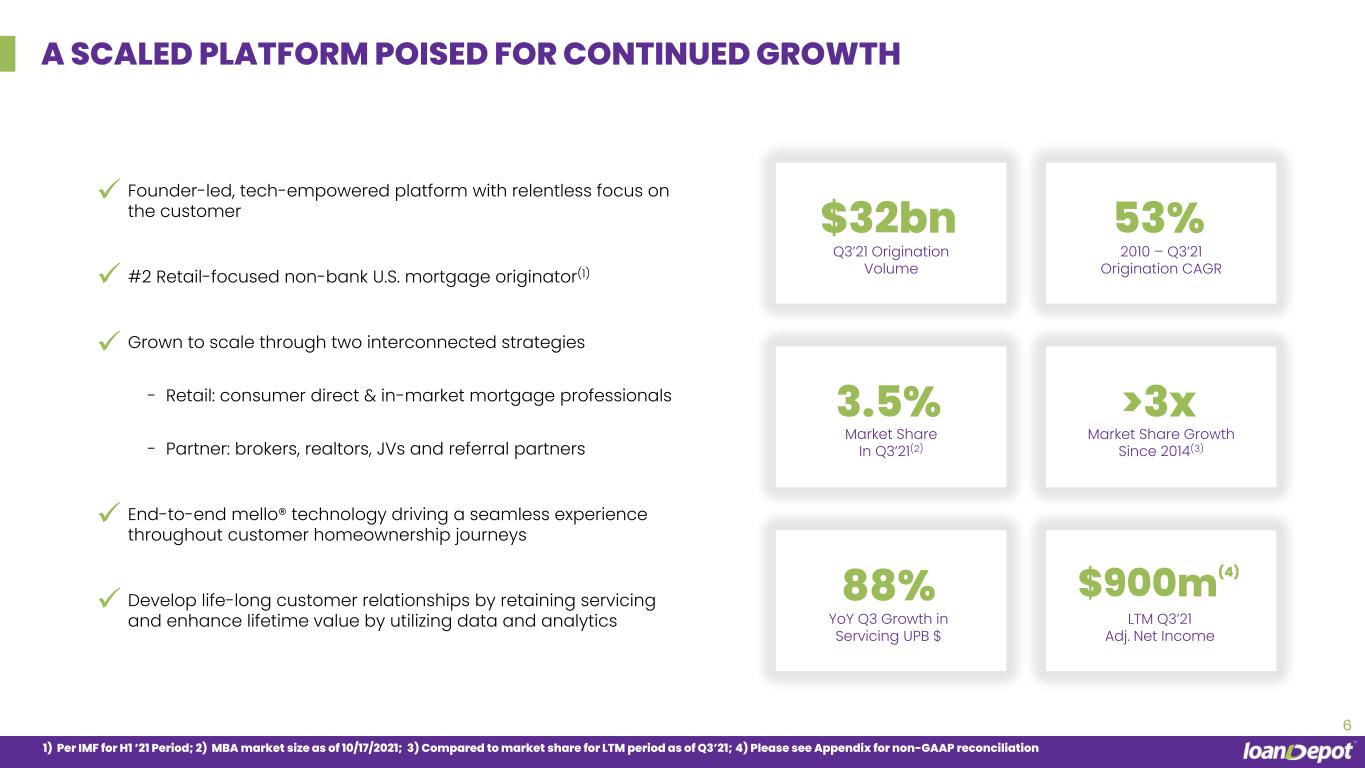
6 $32bn Q3’21 Origination Volume 88% YoY Q3 Growth in Servicing UPB $ Founder-led, tech-empowered platform with relentless focus on the customer #2 Retail-focused non-bank U.S. mortgage originator(1) Grown to scale through two interconnected strategies − Retail: consumer direct & in-market mortgage professionals − Partner: brokers, realtors, JVs and referral partners End-to-end mello® technology driving a seamless experience throughout customer homeownership journeys Develop life-long customer relationships by retaining servicing and enhance lifetime value by utilizing data and analytics ✓ 3.5% Market Share In Q3’21(2) ✓ ✓ ✓ ✓ 53% 2010 – Q3’21 Origination CAGR $900m(4) LTM Q3’21 Adj. Net Income >3x Market Share Growth Since 2014(3) 1) Per IMF for H1 ’21 Period; 2) MBA market size as of 10/17/2021; 3) Compared to market share for LTM period as of Q3’21; 4) Please see Appendix for non-GAAP reconciliation A SCALED PLATFORM POISED FOR CONTINUED GROWTH

7 FOUNDER LED MANAGEMENT TEAM WITH UNIQUE SKILLSETS ANTHONY HSIEH Founder, Chairman & CEO 30+ Years Experience Prior: PATRICK FLANAGAN Chief Financial Officer 30+ Years Experience Prior: JEFF WALSH Chief Revenue Officer 30+ Years Experience Prior: GEORGE BRADY Chief Digital Officer 30+ Years Experience Prior: TJ FREEBORN Chief Administrative Officer 25+ Years Experience Prior: RICK CALLE Chief Strategy Officer 10+ Years Experience Prior: JEFF DERGURAHIAN Chief Capital Markets Officer 20+ Years Experience NICOLE CARRILLO Chief Accounting Officer 15+ Years Experience Prior: PETER MACDONALD General Counsel 25+ Years Experience Prior: SUDHIR NAIR Chief Info. & Tech. Officer 25+ Years Experience Prior: Town & Country Credit Corp. Tuttle Risk Management JOHN LEE Chief Analytics Officer 30+ Years Experience Prior: KARIN LOCKOVITCH Chief Risk Officer 15+ Years Experience Prior:
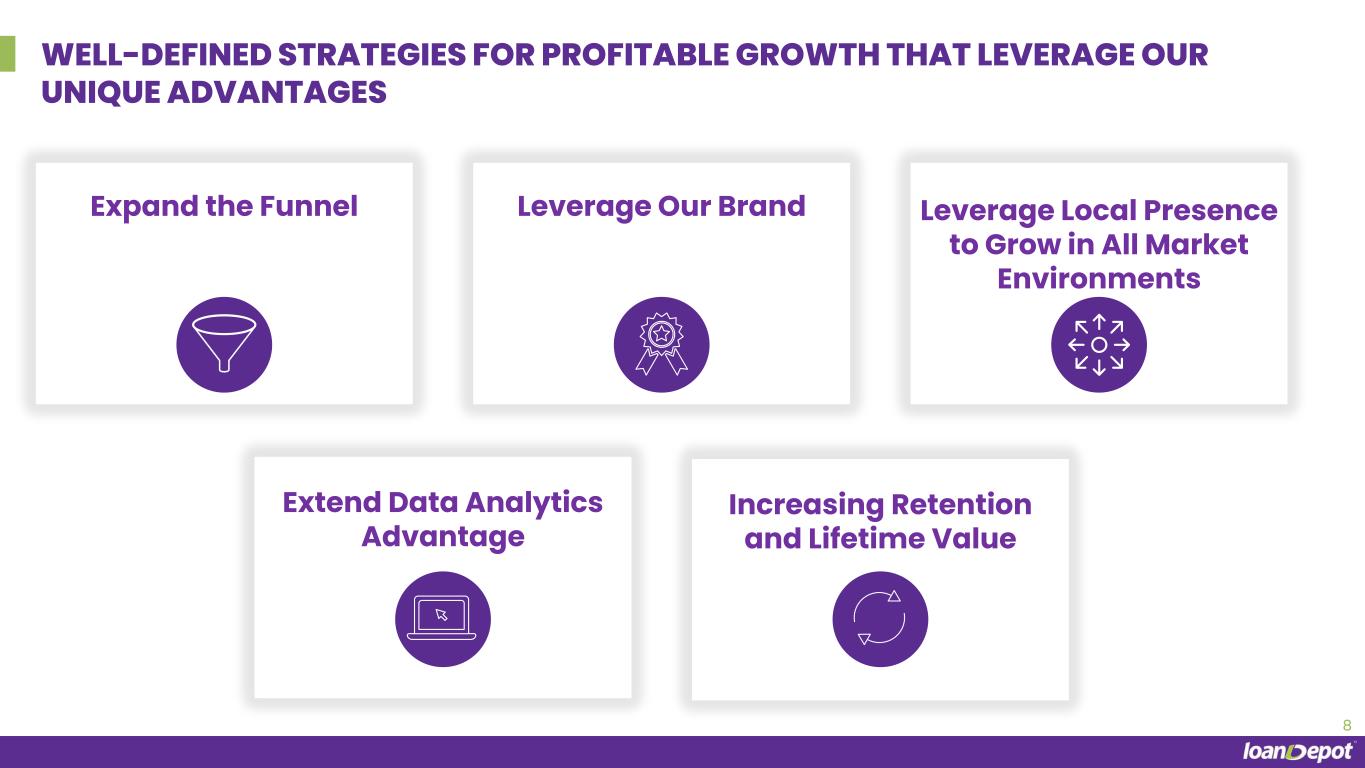
Extend Data Analytics Advantage Leverage Local Presence to Grow in All Market Environments Expand the Funnel WELL-DEFINED STRATEGIES FOR PROFITABLE GROWTH THAT LEVERAGE OUR UNIQUE ADVANTAGES Leverage Our Brand Increasing Retention and Lifetime Value 8
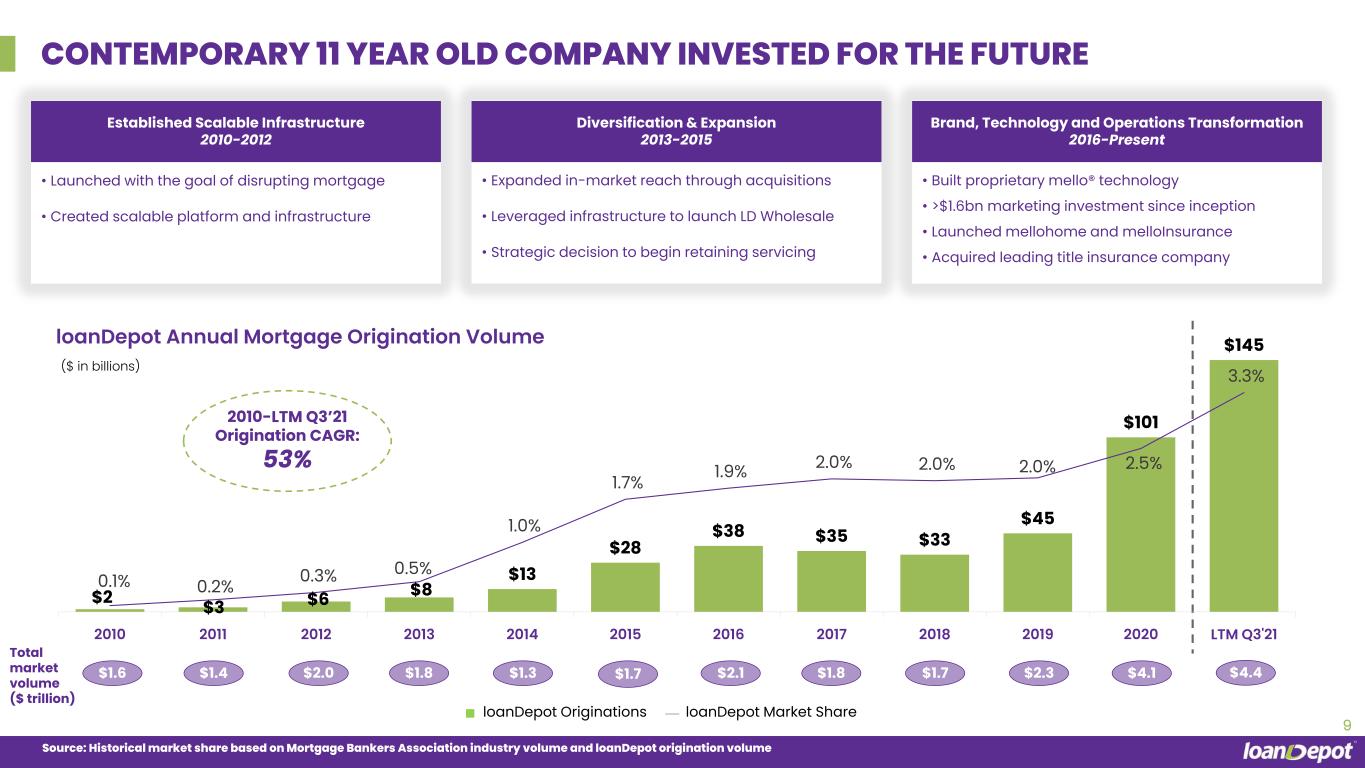
• Expanded in-market reach through acquisitions • Leveraged infrastructure to launch LD Wholesale • Strategic decision to begin retaining servicing • Launched with the goal of disrupting mortgage • Created scalable platform and infrastructure loanDepot Annual Mortgage Origination Volume Source: Historical market share based on Mortgage Bankers Association industry volume and loanDepot origination volume CONTEMPORARY 11 YEAR OLD COMPANY INVESTED FOR THE FUTURE 2010-LTM Q3’21 Origination CAGR: 53% 9 • Built proprietary mello® technology • >$1.6bn marketing investment since inception • Launched mellohome and melloInsurance • Acquired leading title insurance company Established Scalable Infrastructure 2010-2012 Diversification & Expansion 2013-2015 Brand, Technology and Operations Transformation 2016-Present $1.6 loanDepot Originations loanDepot Market Share $1.4 $2.0 $1.8 $1.3 $1.7 $2.1 $1.8 $1.7 $2.3 $4.1 Total market volume ($ trillion) ($ in billions) $4.4 $2 $3 $6 $8 $13 $28 $38 $35 $33 $45 $101 $145 0.1% 0.2% 0.3% 0.5% 1.0% 1.7% 1.9% 2.0% 2.0% 2.0% 2.5% 3.3% – 0.5% 1.0% 1.5% 2.0% 2.5% 3.0% 3.5% 0 20 40 60 80 100 120 140 2010 2011 2012 2013 2014 2015 2016 2017 2018 2019 2020 LTM Q3'21
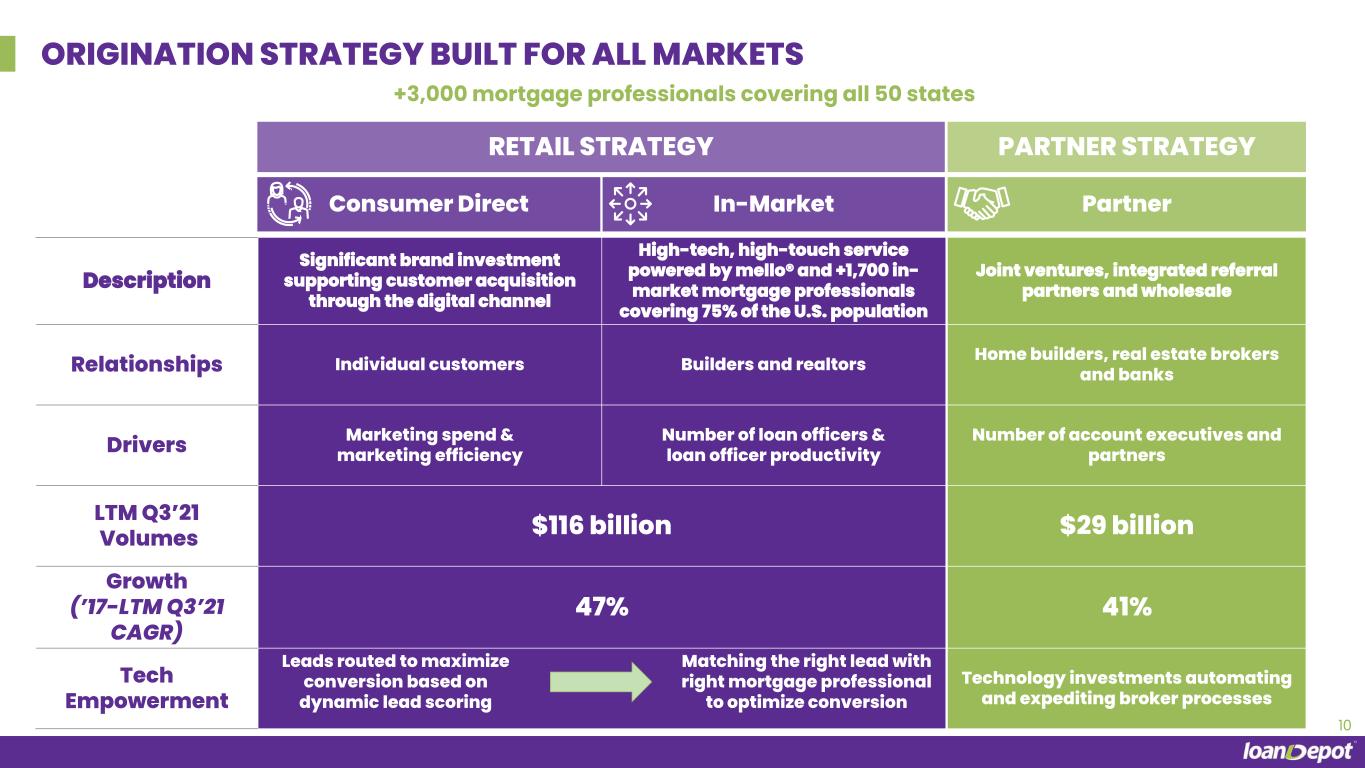
10 ORIGINATION STRATEGY BUILT FOR ALL MARKETS RETAIL STRATEGY PARTNER STRATEGY Consumer Direct PartnerIn-Market Description Significant brand investment supporting customer acquisition through the digital channel High-tech, high-touch service powered by mello® and +1,700 in- market mortgage professionals covering 75% of the U.S. population Joint ventures, integrated referral partners and wholesale Relationships Individual customers Builders and realtors Home builders, real estate brokers and banks Drivers Marketing spend & marketing efficiency Number of loan officers & loan officer productivity Number of account executives and partners LTM Q3’21 Volumes $116 billion $29 billion Growth (’17-LTM Q3’21 CAGR) 47% 41% Tech Empowerment Technology investments automating and expediting broker processes Leads routed to maximize conversion based on dynamic lead scoring Matching the right lead with right mortgage professional to optimize conversion +3,000 mortgage professionals covering all 50 states
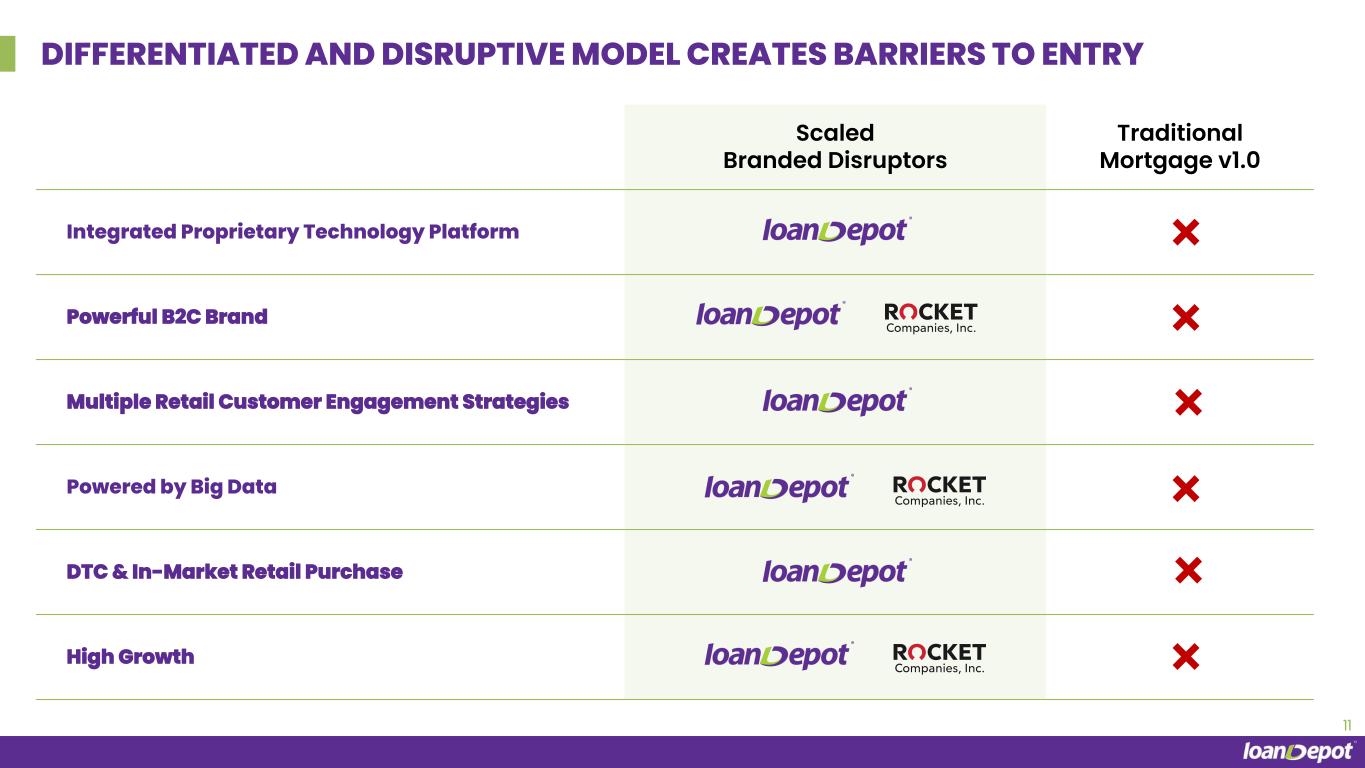
DIFFERENTIATED AND DISRUPTIVE MODEL CREATES BARRIERS TO ENTRY 11 Scaled Branded Disruptors Traditional Mortgage v1.0 Integrated Proprietary Technology Platform Powerful B2C Brand Multiple Retail Customer Engagement Strategies Powered by Big Data DTC & In-Market Retail Purchase High Growth
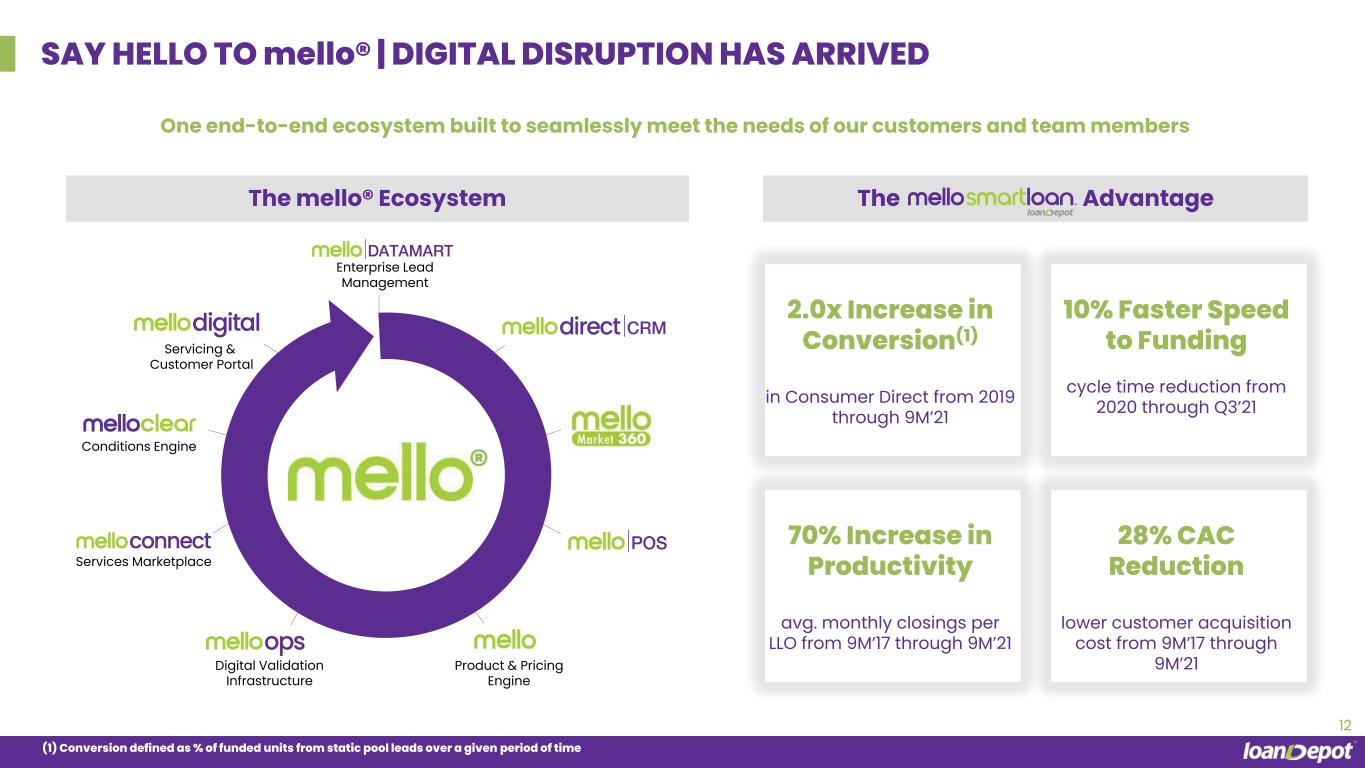
12 Conditions Engine Servicing & Customer Portal Enterprise Lead Management Services Marketplace Digital Validation Infrastructure Product & Pricing Engine SAY HELLO TO mello® | DIGITAL DISRUPTION HAS ARRIVED One end-to-end ecosystem built to seamlessly meet the needs of our customers and team members ® 2.0x Increase in Conversion(1) in Consumer Direct from 2019 through 9M’21 10% Faster Speed to Funding cycle time reduction from 2020 through Q3’21 70% Increase in Productivity avg. monthly closings per LLO from 9M’17 through 9M’21 28% CAC Reduction lower customer acquisition cost from 9M’17 through 9M’21 The AdvantageThe mello® Ecosystem (1) Conversion defined as % of funded units from static pool leads over a given period of time
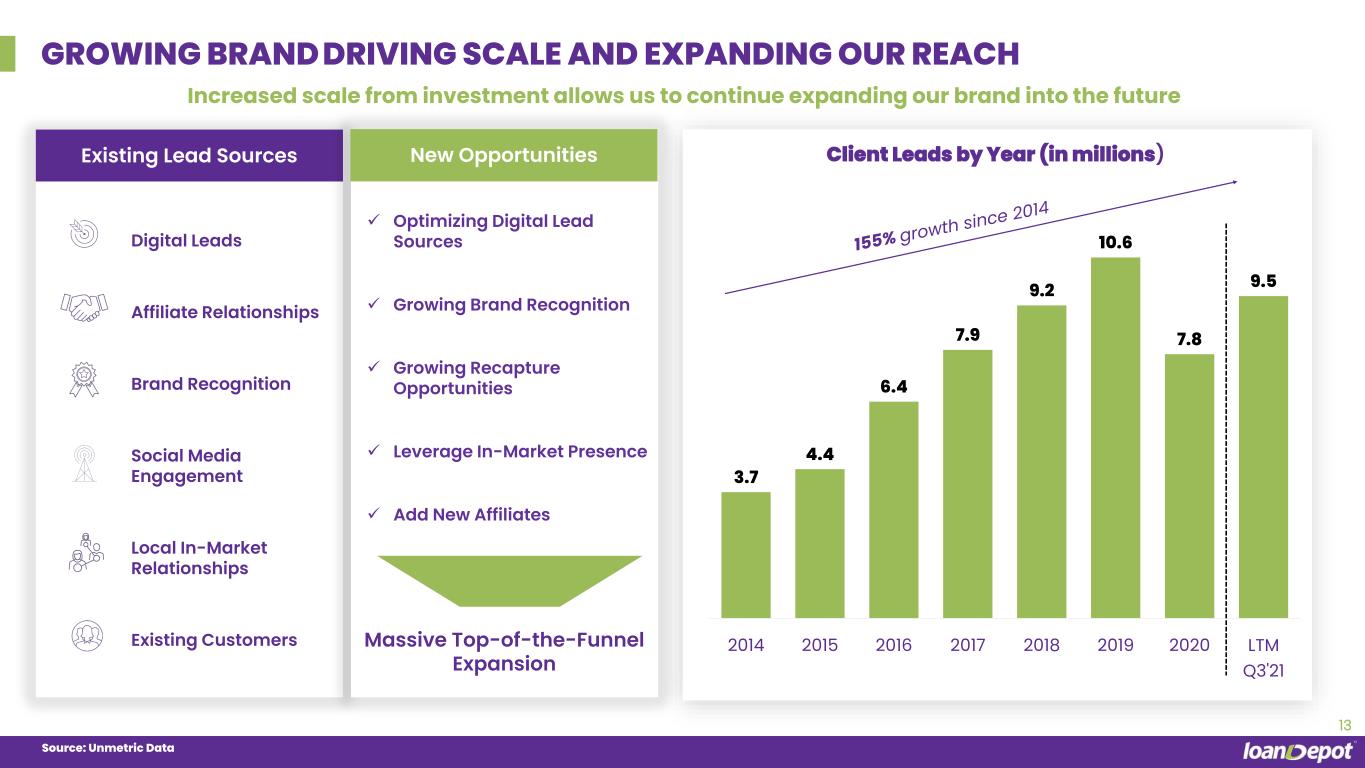
13 GROWING BRAND DRIVING SCALE AND EXPANDING OUR REACH Client Leads by Year (in millions) Source: Unmetric Data Increased scale from investment allows us to continue expanding our brand into the future • Digital Leads • Affiliate Relationships • Brand Recognition • Social Media Engagement • Local In-Market Relationships • Existing Customers Existing Lead Sources ✓ Optimizing Digital Lead Sources ✓ Growing Brand Recognition ✓ Growing Recapture Opportunities ✓ Leverage In-Market Presence ✓ Add New Affiliates Massive Top-of-the-Funnel Expansion New Opportunities 3.7 4.4 6.4 7.9 9.2 10.6 7.8 9.5 2014 2015 2016 2017 2018 2019 2020 LTM Q3'21

VAST MEDIA PRESENCE INTERACTS WITH MILLIONS OF CUSTOMERS DAILY 14 TV & Digital Media Social Media Web site visits in 9M‘21 YoY growth in daily website users from Q3’20 +81%15.9mm +26% Growth in Engagement from 9M’20 to 9M’21 MLB Partnership impressions since 2021 launch LCS coincided with ad spend increase 597m Impressions, in billions 0.8 1.9 2020 Sep'21 LTM
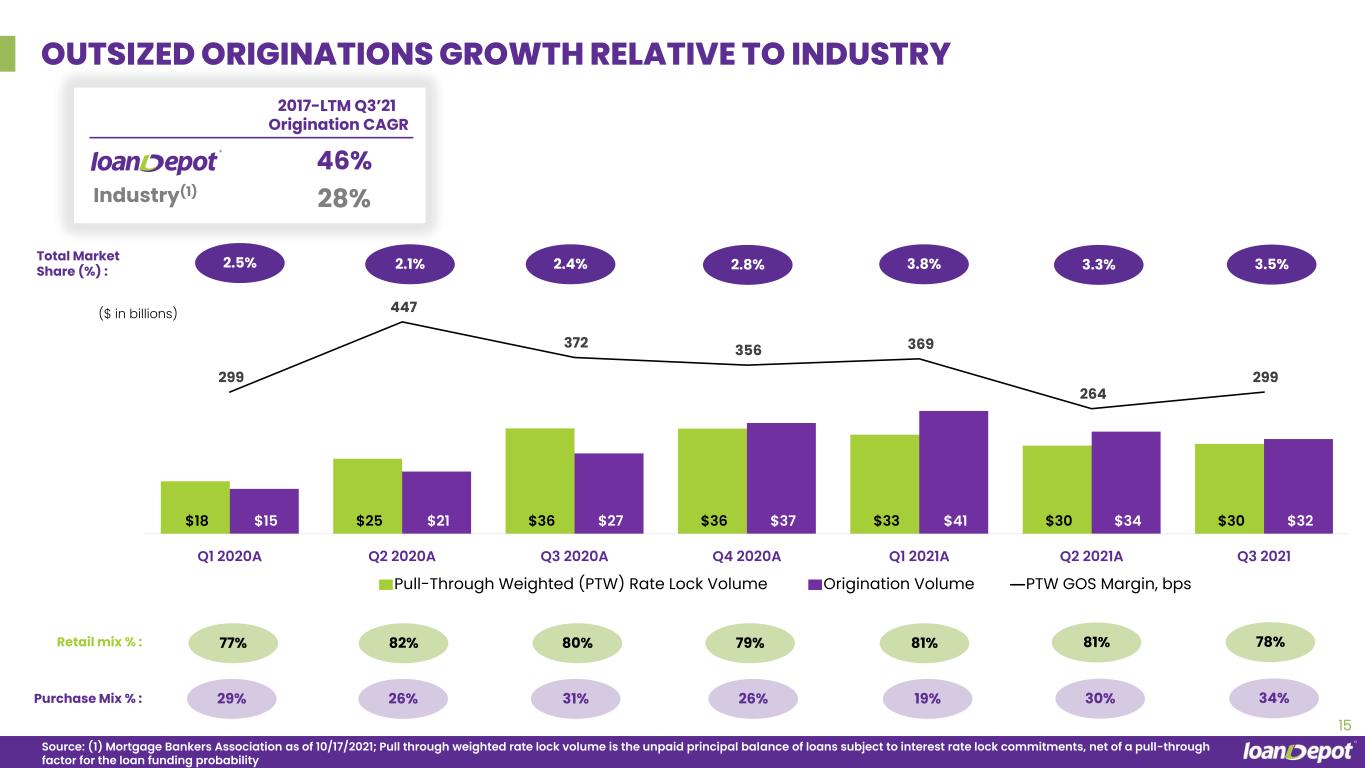
OUTSIZED ORIGINATIONS GROWTH RELATIVE TO INDUSTRY Source: (1) Mortgage Bankers Association as of 10/17/2021; Pull through weighted rate lock volume is the unpaid principal balance of loans subject to interest rate lock commitments, net of a pull-through factor for the loan funding probability 15 2017-LTM Q3’21 Origination CAGR 46% 28%Industry(1) Purchase Mix % : 26% 31% 26%29% Retail mix % : 82% 80% 79%77% ($ in billions) Total Market Share (%) : 2.1% 2.4% 2.8%2.5% 3.8% 81% 19% 3.3% 81% 30% 78% 34% 3.5% $18 $25 $36 $36 $33 $30 $30 $15 $21 $27 $37 $41 $34 $32 299 447 372 356 369 264 299 - 50 100 150 200 250 300 350 400 450 500 $0 $10 $20 $30 $40 $50 $60 $70 $80 Q1 2020A Q2 2020A Q3 2020A Q4 2020A Q1 2021A Q2 2021A Q3 2021 Pull-Through Weighted (PTW) Rate Lock Volume Origination Volume PTW GOS Margin, bps
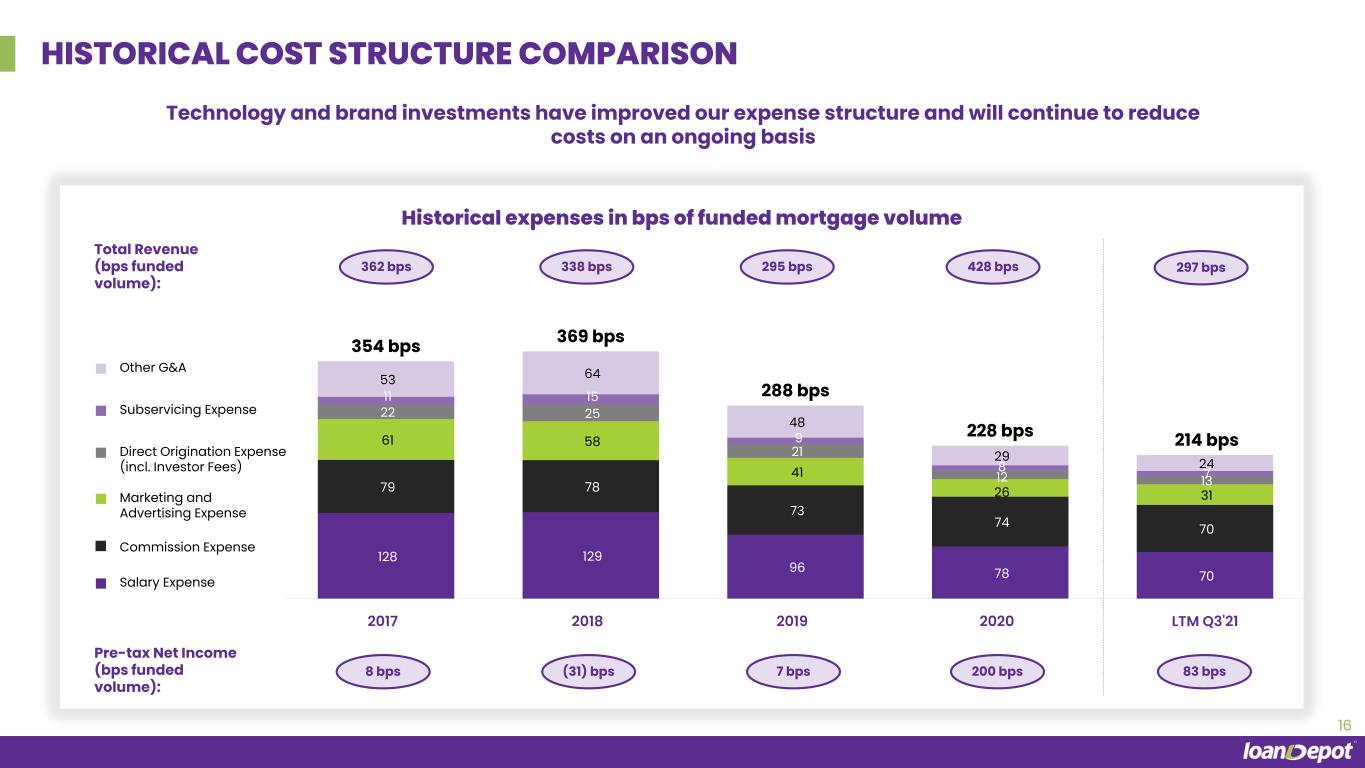
Historical expenses in bps of funded mortgage volume HISTORICAL COST STRUCTURE COMPARISON 16 338 bps 295 bps 428 bps362 bps Total Revenue (bps funded volume): Pre-tax Net Income (bps funded volume): (31) bps 7 bps 200 bps8 bps Salary Expense Marketing and Advertising Expense Direct Origination Expense (incl. Investor Fees) Subservicing Expense Other G&A Technology and brand investments have improved our expense structure and will continue to reduce costs on an ongoing basis 297 bps 83 bps 128 129 96 78 70 79 78 73 74 70 61 58 41 26 31 22 25 21 12 13 11 15 9 8 7 53 64 48 29 24 354 bps 369 bps 288 bps 228 bps 214 bps 2017 2018 2019 2020 LTM Q3'21 Commission Expense
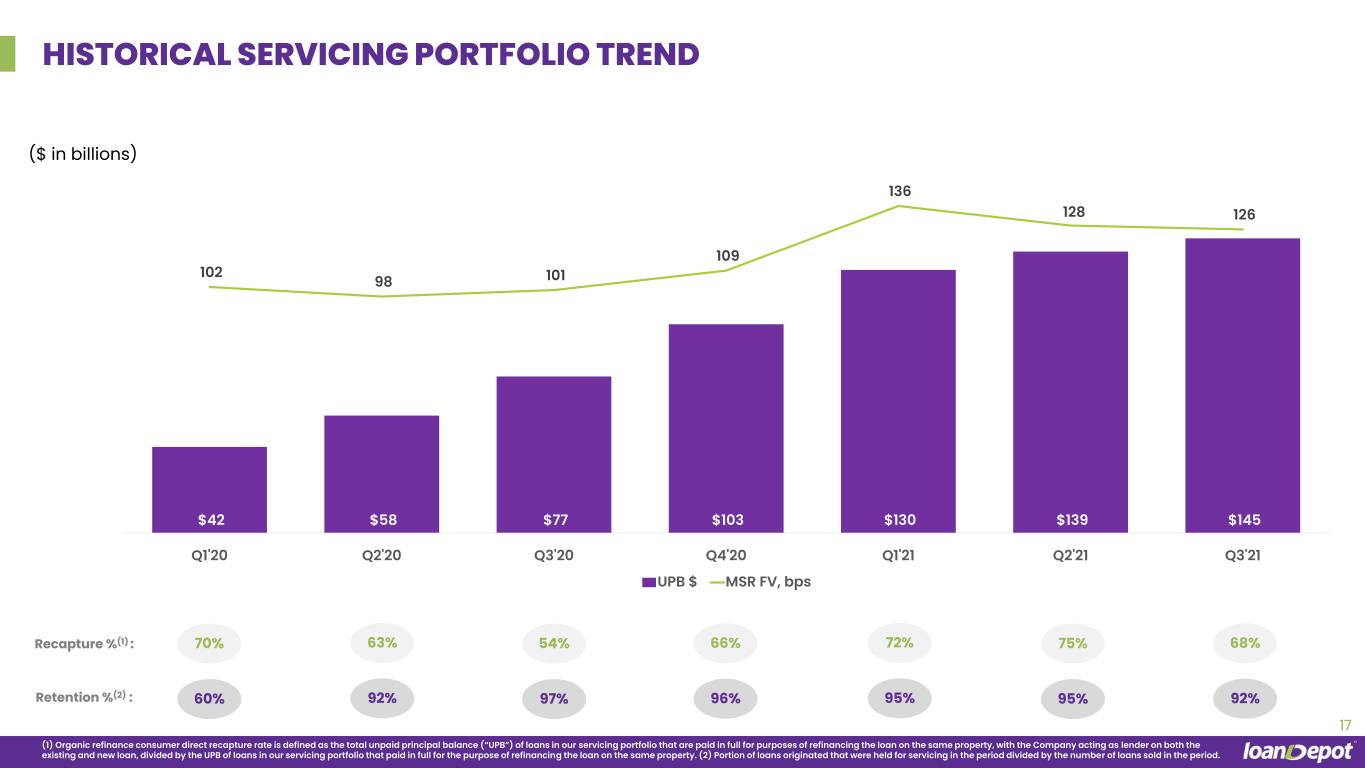
HISTORICAL SERVICING PORTFOLIO TREND 17 ($ in billions) Retention %(2) : Recapture %(1) : 60% 70% 92% 63% 97% 54% 96% 66% 95% 72% 95% 75% 92% 68% (1) Organic refinance consumer direct recapture rate is defined as the total unpaid principal balance (“UPB”) of loans in our servicing portfolio that are paid in full for purposes of refinancing the loan on the same property, with the Company acting as lender on both the existing and new loan, divided by the UPB of loans in our servicing portfolio that paid in full for the purpose of refinancing the loan on the same property. (2) Portion of loans originated that were held for servicing in the period divided by the number of loans sold in the period. $42 $58 $77 $103 $130 $139 $145 102 98 101 109 136 128 126 - 20 40 60 80 100 120 140 $- $20 $40 $60 $80 $100 $120 $140 $160 $180 Q1'20 Q2'20 Q3'20 Q4'20 Q1'21 Q2'21 Q3'21 UPB $ MSR FV, bps
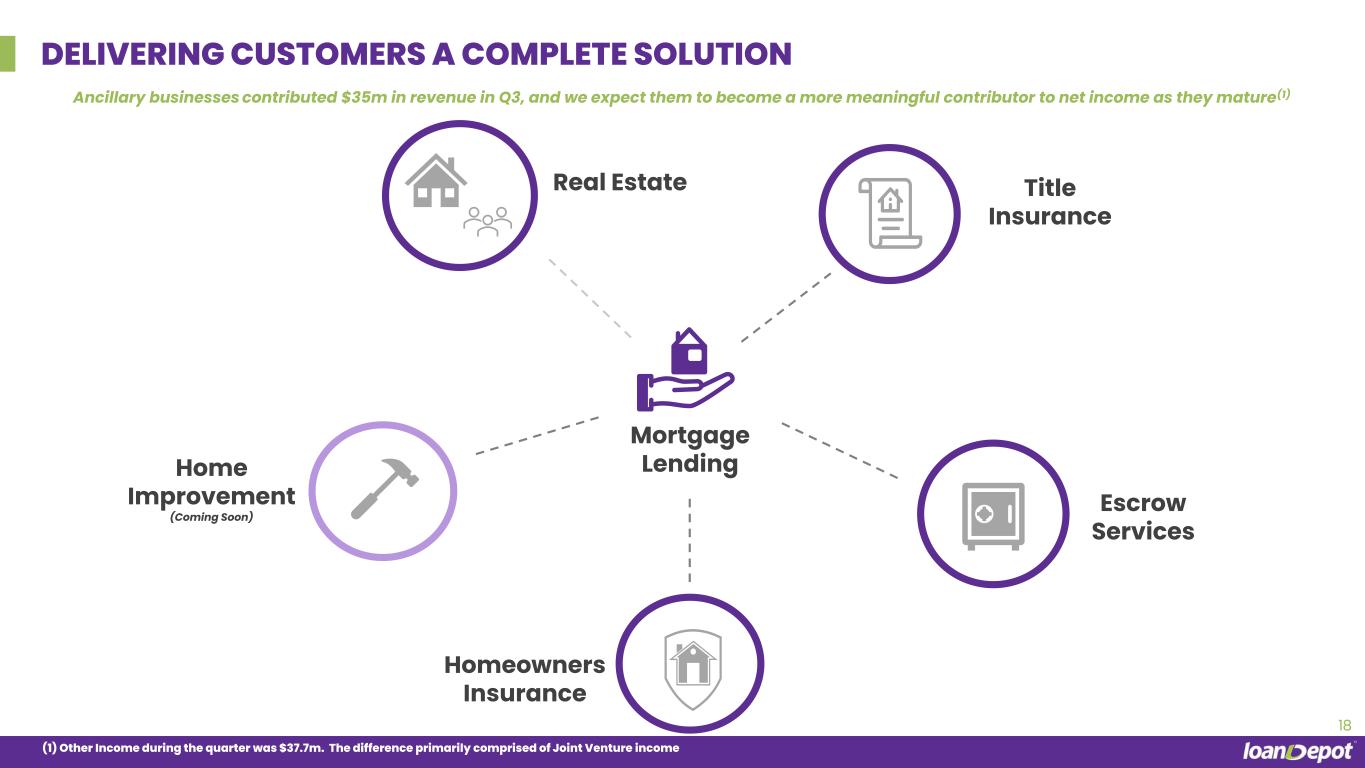
18 DELIVERING CUSTOMERS A COMPLETE SOLUTION Leads routed to maximize conversion based on dynamic lead scoring Mortgage Lending Title Insurance Escrow Services Homeowners Insurance Real Estate Home Improvement (Coming Soon) (1) Other Income during the quarter was $37.7m. The difference primarily comprised of Joint Venture income Ancillary businesses contributed $35m in revenue in Q3, and we expect them to become a more meaningful contributor to net income as they mature(1)
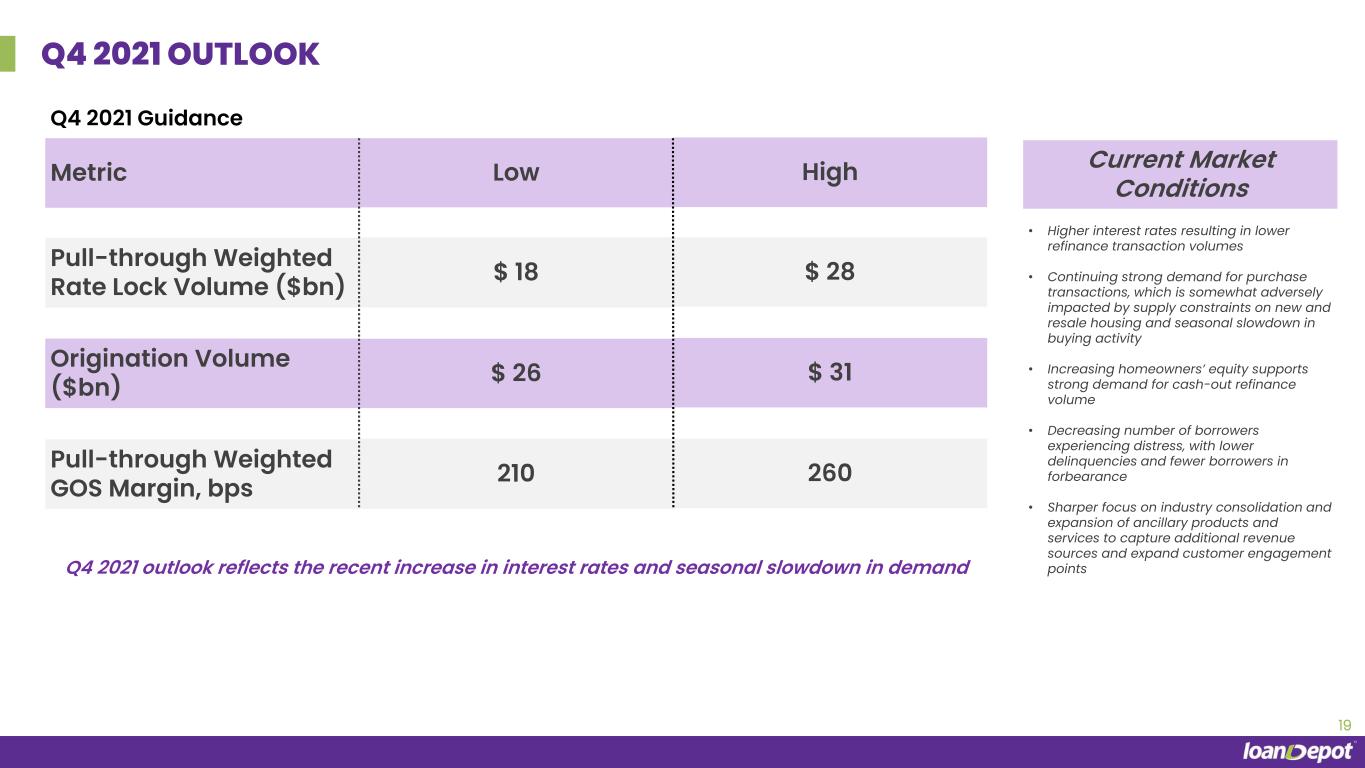
19 Q4 2021 OUTLOOK Q4 2021 Guidance Metric Low High Pull-through Weighted Rate Lock Volume ($bn) $ 18 $ 28 Origination Volume ($bn) $ 26 $ 31 Pull-through Weighted GOS Margin, bps 210 260 Current Market Conditions • Higher interest rates resulting in lower refinance transaction volumes • Continuing strong demand for purchase transactions, which is somewhat adversely impacted by supply constraints on new and resale housing and seasonal slowdown in buying activity • Increasing homeowners’ equity supports strong demand for cash-out refinance volume • Decreasing number of borrowers experiencing distress, with lower delinquencies and fewer borrowers in forbearance • Sharper focus on industry consolidation and expansion of ancillary products and services to capture additional revenue sources and expand customer engagement pointsQ4 2021 outlook reflects the recent increase in interest rates and seasonal slowdown in demand
NON-GAAP FINANCIAL RECONCILIATION 20 ($MM) 3Q’21A 2Q’21A 3Q’20A YTD’21 YTD’20 Adjusted Revenue Total Net Revenue $ 923.8 $ 779.9 $ 1,368.9 $ 3,019.7 $ 3,013.8 Change in FV of Servicing Rights, Net of Hedge 25.0 45.4 (23.3) (4.1) (13.3) Adjusted Total Revenue $ 948.8 $ 825.3 $ 1,345.6 $ 3,015.5 $ 3,000.5 Adjusted EBITDA Net Income $ 154.3 $ 26.3 $ 728.3 $ 608.4 $ 1,465.9 Interest Expense - Non-Funding Debt 22.8 21.3 10.5 57.3 32.1 Income Tax Expense (Benefit) 24.7 4.2 0.6 47.2 1.5 Depreciation and Amortization 8.7 8.7 8.6 25.8 27.1 Change in FV of Servicing Rights, Net of Hedge 25.0 45.4 (23.3) (4.1) (13.3) Change in FV of Contingent Consideration (0.1) 0.0 19.7 (0.1) 32.7 Stock Compensation Expense and Management Fees 2.9 2.1 1.2 65.1 8.5 IPO Expenses (0.1) 1.3 0.0 6.0 0.0 Adjusted EBITDA $ 238.3 $ 109.3 $ 745.6 $ 805.6 $ 1,554.5 Adjusted Net Income Net Income $ 154.3 $ 26.3 $ 728.3 $ 608.4 $ 1,465.9 Adjustments to Income Taxes (27.2) (4.7) (187.4) (133.1) (377.3) Tax-Effected Net Income $ 127.1 $ 21.6 $ 540.9 $ 475.3 $ 1,088.6 Change in FV of Servicing Rights, Net of Hedge 25.0 45.4 (23.3) (4.1) (13.3) Change in FV of Contingent Consideration (0.1) 0.0 19.7 (0.1) 32.7 Stock Compensation Expense and Management Fees 2.9 2.1 1.2 65.1 8.5 IPO Expenses (0.1) 1.3 0.0 6.0 0.0 Tax Effect of Adjustments (7.3) (12.9) 0.6 (17.7) (7.2) Adjusted Net Income $ 147.5 $ 57.5 $ 539.1 $ 524.6 $ 1,109.3
BALANCE SHEET & SERVICING PORTFOLIO HIGHLIGHTS 21 $ in MM except units and % 3Q’21A 2Q’21A 3Q’20A 3Q’21 vs 2Q’21 3Q’21 vs 3Q’20 Cash and cash equivalents $ 506.6 $ 419.3 $ 637.5 20.8% (20.5%) Loans held for sale, at fair value 8,873.7 9,120.7 4,888.4 (2.7) 81.5 Servicing rights, at fair value 1,841.5 1,781.7 780.5 3.4 136.0 Total assets 12,749.3 13,097.6 8,651.3 (2.7) 47.4 Warehouse and other lines of credit 8,212.1 8,498.4 4,601.1 (3.4) 78.5 Total liabilities 11,091.1 11,528.8 7,017.8 (3.8) 58.0 Total equity 1,658.2 1,568.8 1,633.5 5.7 1.5 Servicing portfolio (unpaid principal balance) $ 145,305.2 $ 136,767.9 $ 77,172.0 4.7 88.3 Total servicing portfolio (units) 469,021 446,606 272,701 5.0 72.0 60+ days delinquent ($) 1,679.7 1,976.7 2,073.9 (15.0) (19.0) 60+ days delinquent (%) 1.2% 1.4% 2.7% n.m. n.m. Servicing rights, net to UPB 1.3% 1.3% 1.0% n.m. n.m.
WE ARE PROUD TO SERVE THE COMMUNITIES IN WHICH WE LIVE AND WORK 22