
OCFC 8-K
Oceanfirst Financial Corp (OCFC)
8-K
2022-10-24
For: 2022-10-24
View Original
Added on
April 08, 2026
UNITED STATES
SECURITIES AND EXCHANGE COMMISSION
WASHINGTON, DC
FORM 8-K
CURRENT REPORT
Pursuant to Section 13 or 15(d)
of the Securities Exchange Act of 1934
Date of report (Date of earliest event reported): October 24, 2022
(Exact name of registrant as specified in its charter)
| (State or other jurisdiction of incorporation or organization) | (Commission File No.) | (IRS Employer Identification No.) | ||||||||||||
(Address of principal executive offices, including zip code)
(732 )240-4500
(Registrant’s telephone number, including area code)
Not Applicable
(Former name or former address, if changed since last report)
Check the appropriate box below if the Form 8-K filing is intended to simultaneously satisfy the filing obligation of the registrant under any of the following provisions:
| Written communications pursuant to Rule 425 under the Securities Act (17 CFR 230.425) | |||||
| Soliciting material pursuant to Rule 14a-12 under the Exchange Act (17 CFR 240.14a-12) | |||||
| Pre-commencement communications pursuant to Rule 14d-2(b) under the Exchange Act (17 CFR 240.14d-2(b)) | |||||
| Pre-commencement communications pursuant to Rule 13e-4(c) under the Exchange Act (17 CFR 240.13e-4(c)) | |||||
Securities registered pursuant to Section 12(b) of the Act:
| Title of each class | Trading symbol | Name of each exchange in which registered | ||||||||||||
Indicate by check mark whether the registrant is an emerging growth company as defined in Rule 405 of the Securities Act of 1933 (17 CFR 230.405) or Rule 12b-2 of the Securities Exchange Act of 1934 (17 CFR 240.12b-2).
Emerging growth company ☐
If an emerging growth company, indicate by check mark if the registrant has elected not to use the extended transition period for complying with any new or revised financial accounting standards provided pursuant to Section 13(a) of the Exchange Act. ☐
ITEM 2.02RESULTS OF OPERATIONS AND FINANCIAL CONDITION
On October 24, 2022, OceanFirst Financial Corp. (the “Company”) issued a press release announcing its financial results for the quarter ended September 30, 2022. That press release is attached to this Report as Exhibit 99.1.
ITEM 7.01 REGULATION FD DISCLOSURE
The Company is scheduled to make presentations to current and prospective investors after October 24, 2022. Attached as Exhibit 99.2 of this Form 8-K is a copy of the presentation which OceanFirst Financial Corp. will make available at these presentations and will post on its website at www.oceanfirst.com. This report is being furnished to the SEC and shall not be deemed “filed” for any purpose.
ITEM 8.01OTHER EVENTS
In the press release described in Item 2.02, the Company announced that the Board of Directors declared a regular quarterly cash dividend on the Company’s outstanding common stock. The cash dividend will be in the amount of $0.20 per share and will be payable on November 18, 2022 to the stockholders of record at the close of business on November 7, 2022.
ITEM 9.01FINANCIAL STATEMENTS AND EXHIBITS
| (d) | EXHIBITS | |||||||
| Press Release dated | October 24, 2022 | |||||||
Text of written presentation which OceanFirst Financial Corp. intends to provide to current and prospective investors after October 24, 2022. | ||||||||
SIGNATURES
Pursuant to the requirements of the Securities Exchange Act of 1934, the Registrant has duly caused this report to be signed on its behalf by the undersigned hereunto duly authorized.
| OCEANFIRST FINANCIAL CORP. | ||||||||
| Dated: | October 24, 2022 | /s/ Patrick S. Barrett | ||||||
| Patrick S. Barrett | ||||||||
| Executive Vice President and Chief Financial Officer | ||||||||
 | Press Release | |||||||
Exhibit 99.1
Company Contact:
Patrick S. Barrett
Chief Financial Officer
OceanFirst Financial Corp.
Tel: (732) 240-4500, ext. 7507
Email: [email protected]
FOR IMMEDIATE RELEASE
OCEANFIRST FINANCIAL CORP.
ANNOUNCES THIRD QUARTER
FINANCIAL RESULTS
RED BANK, NEW JERSEY, October 24, 2022 - OceanFirst Financial Corp. (NASDAQ:“OCFC”) (the “Company”), the holding company for OceanFirst Bank N.A. (the “Bank”), announced net income available to common stockholders of $37.6 million, or $0.64 per diluted share, for the three months ended September 30, 2022, as compared to $28.0 million, or $0.47 per diluted share, for the prior linked quarter, and $23.2 million, or $0.39 per diluted share, for the corresponding prior year period. For the nine months ended September 30, 2022, the Company reported net income available to common stockholders of $90.3 million, or $1.53 per diluted share, as compared to $84.4 million, or $1.41 per diluted share, for the corresponding prior year period. Selected performance metrics are as follows (refer to “Selected Quarterly Financial Data” for additional information):
| For the Three Months Ended, | For the Nine Months Ended, | ||||||||||||||||||||||||||||
| Performance Ratios (Annualized): | September 30, | June 30, | September 30, | September 30, | September 30, | ||||||||||||||||||||||||
| 2022 | 2022 | 2021 | 2022 | 2021 | |||||||||||||||||||||||||
| Return on average assets | 1.19 | % | 0.92 | % | 0.78 | % | 0.99 | % | 0.98 | % | |||||||||||||||||||
| Return on average stockholders’ equity | 9.68 | 7.31 | 6.05 | 7.87 | 7.49 | ||||||||||||||||||||||||
Return on average tangible stockholders’ equity (a) | 14.62 | 11.08 | 9.20 | 11.91 | 11.46 | ||||||||||||||||||||||||
| Efficiency ratio | 53.10 | 59.65 | 67.43 | 57.90 | 60.62 | ||||||||||||||||||||||||
| Net interest margin | 3.36 | 3.29 | 2.93 | 3.28 | 2.91 | ||||||||||||||||||||||||
(a) Return on average tangible stockholders’ equity, a non-GAAP (“generally accepted accounting principles”) financial measure, excludes the impact of intangible assets and goodwill from both assets and stockholders’ equity. Refer to “Explanation of Non-GAAP Financial Measures” and the “Non-GAAP Reconciliation” tables for additional information regarding non-GAAP financial measures.
Core earnings1 for the three and nine months ended September 30, 2022 amounted to $35.0 million and $98.4 million, respectively, or $0.60 and $1.67 per diluted share, an increase from core earnings of $26.7 million and $82.7 million, or $0.45 and $1.38 per diluted share, for the corresponding prior year periods. Non-core operations, net of tax, had a favorable impact of $2.6 million, and an adverse impact of $8.1 million, for the three and nine months ended September 30, 2022, respectively. Non-core operations, net of tax, had an adverse impact of $3.6 million, and a favorable impact of $1.7 million, for the three and nine months ended September 30, 2021, respectively.
Core earnings for the three months ended September 30, 2022 increased $376,000 from $34.6 million, or $0.59 per diluted share, for the prior linked quarter. Non-core operations, net of tax, had an adverse impact of $6.7 million for the prior linked quarter.
Core earnings PTPP for the three and nine months ended September 30, 2022 were $47.5 million and $134.2 million, respectively, or $0.81 and $2.28 per diluted share, respectively. Selected performance metrics are as follows:
| For the Three Months Ended, | For the Nine Months Ended, | ||||||||||||||||||||||||||||
| September 30, | June 30, | September 30, | September 30, | September 30, | |||||||||||||||||||||||||
Core Ratios1 (Annualized): | 2022 | 2022 | 2021 | 2022 | 2021 | ||||||||||||||||||||||||
| Return on average assets | 1.11 | % | 1.13 | % | 0.90 | % | 1.08 | % | 0.95 | % | |||||||||||||||||||
| Return on average tangible stockholders’ equity | 13.62 | 13.73 | 10.62 | 12.98 | 11.23 | ||||||||||||||||||||||||
| Efficiency ratio | 54.80 | 54.43 | 62.22 | 55.51 | 60.23 | ||||||||||||||||||||||||
| Core diluted earnings per share | $ | 0.60 | $ | 0.59 | $ | 0.45 | $ | 1.67 | $ | 1.38 | |||||||||||||||||||
| Core PTPP diluted earnings per share | 0.81 | 0.80 | 0.54 | 2.28 | 1.67 | ||||||||||||||||||||||||
1 Core earnings and core earnings before income taxes and credit loss provision (“PTPP or Pre-Tax-Pre-Provision”), and ratios derived therefrom, are non-GAAP financial measures. For the periods presented, core earnings exclude merger related expenses, net branch consolidation (benefit) expense, net loss (gain) on equity investments, and the income tax effect of these items, (collectively referred to as “non-core” operations). PTPP excludes the aforementioned pre-tax “non-core” items along with income tax expense (benefit) and credit loss provision (benefit). Refer to “Explanation of Non-GAAP Financial Measures” and the “Non-GAAP Reconciliation” tables for additional information regarding non-GAAP financial measures.
2
Key developments for the recent quarter are described below:
•Strengthening Net Interest Income and Margin: Net interest income increased by $5.2 million to $96.0 million, from $90.8 million in the prior linked quarter. Net interest margin increased to 3.36%, as compared to 3.29% in the prior linked quarter, largely driven by the impact of the rising rate environment on interest earning assets, and to a lesser extent an increase in loan balances, partly offset by an increased cost of funds and lower prepayment fees.
•Loan and Deposit Growth: Loan growth for the quarter was $293.9 million, reflecting originations of $543.8 million. The committed loan pipeline increased to $439.5 million as of September 30, 2022. Deposits grew by $128.0 million for the quarter and $226.7 million year-to-date.
•Interchange Fees: Effective July 1, 2022, the Bank became subject to the Durbin amendment, as contained in the Dodd-Frank Act, which imposes limitations on debit card interchange fees collected by banks with assets of $10 billion or more. As a result, bankcard services revenue was adversely impacted by $1.7 million. The Company is strategically positioned to absorb the decreased fee income and continue to grow earnings.
•Partners Bancorp Acquisition: The Company continues to work towards regulatory approval for the Partners Bancorp (“Partners”) acquisition. The one-year anniversary of the agreement to acquire Partners is November 4, 2022. If the transaction is not completed by that date, either party may (but is not obligated to) terminate the agreement without penalty.
Chairman and Chief Executive Officer, Christopher D. Maher, commented on the Company’s results, “Our Company delivered another quarter of strong financial performance driven by expansion of net interest income and margin, continued organic loan and deposit growth, and disciplined expense
3
management.” Mr. Maher added, “In addition to financial performance, I’m proud of our team’s continuing efforts to support our community. On October 6th, approximately 750 employees participated in our inaugural CommunityFirst day, providing service to over 100 different non-profits in the five primary states that OceanFirst serves.”
The Company’s Board of Directors declared its 103rd consecutive quarterly cash dividend on common stock. The quarterly cash dividend on common stock of $0.20 per share will be paid on November 18, 2022 to common stockholders of record on November 7, 2022. The Board previously declared a quarterly cash dividend on preferred stock of $0.4375 per depositary share, representing 1/40th interest in the Series A Preferred Stock. This dividend will be paid on November 15, 2022 to preferred stockholders of record on October 31, 2022.
Results of Operations
On April 1, 2022, the Company completed its acquisition of a majority interest in Trident Abstract Title Agency, LLC (“Trident”) and its results of operations are included in the consolidated results for the three and nine months ended September 30, 2022, but are excluded from the results of operations for the period from January 1, 2021 to March 31, 2022. Refer to “Supplemental Information on Trident” for the impact of Trident on the Company’s consolidated results.
Net Interest Income and Margin
Net interest income for the three and nine months ended September 30, 2022 increased to $96.0 million and $271.0 million, respectively, as compared to $77.1 million and $224.8 million for the corresponding prior year periods, reflecting an increase in average interest-earning assets and net interest margin.
Net interest margin for the three and nine months ended September 30, 2022 increased to 3.36% and 3.28%, respectively, from 2.93% and 2.91% for the same prior year periods. Excluding the impact of purchase accounting accretion and prepayment fees of 0.08% and 0.18% for the three months ended September 30, 2022 and 2021, respectively, net interest margin increased to 3.28% from 2.75%.
4
Excluding the impact of purchase accounting accretion and prepayment fees of 0.13% and 0.17% for the nine months ended September 30, 2022 and 2021, respectively, net interest margin increased to 3.15% from 2.74%. Net interest margin for both the three and nine months ended September 30, 2022 were positively impacted by the redeployment of excess cash into loans and the impact of the rising rate environment on interest earning assets, partly offset by an increased cost of funds and the growth in interest-bearing liabilities balances.
Average interest-earning assets increased by $865.6 million and $739.5 million for the three and nine months ended September 30, 2022, respectively, as compared to the same prior year periods, primarily due to loan and securities growth funded by the redeployment of excess cash. Average loans receivable, net of allowance for loan credit losses, increased by $1.65 billion and $1.38 billion for the three and nine months ended September 30, 2022, respectively, as compared to the same prior year periods.
For the three months ended September 30, 2022, the cost of average interest-bearing liabilities increased to 0.69% from 0.44% for the corresponding prior year period, as a result of higher costs associated with Federal Home Loan Bank (“FHLB”) advances and time deposits issued in an elevated rate environment in 2022. The total cost of deposits (including non-interest bearing deposits) was 0.36% for the three months ended September 30, 2022, as compared to 0.22% for the same prior year period.
For the nine months ended September 30, 2022, the cost of average interest-bearing liabilities decreased to 0.49% from 0.52% for the corresponding prior year period, as a result of downward repricing of deposits that began in the prior year and continued through the current year, partly offset by the recent pace of the rising rate environment in the current quarter and increased funding costs on
5
FHLB advances. The total cost of deposits (including non-interest bearing deposits) was 0.24% for the nine months ended September 30, 2022, as compared to 0.28% for the same prior year period.
Net interest income for the three months ended September 30, 2022 increased by $5.2 million, as compared to the prior linked quarter, reflecting an increase in net interest margin to 3.36%, as compared to 3.29% for the prior linked quarter. Excluding the impact of purchase accounting accretion and prepayment fees of 0.08% and 0.17% for the three months ended September 30, 2022 and June 30, 2022, respectively, net interest margin increased to 3.28%, from 3.12%. The expansion in net interest margin was primarily attributable to the impact of the rising rate environment on interest earning assets and to a lesser extent loan growth, partly offset by increased costs of funds. Average interest-earning assets increased by $242.9 million for the quarter ended September 30, 2022, as compared to the prior linked quarter, primarily due to loan growth. The yield on average interest-earning assets increased to 3.88% for the three months ended September 30, 2022, from 3.60% in the prior linked quarter. The total cost of average interest-bearing liabilities was 0.69% for the three months ended September 30, 2022, as compared to 0.42% in the prior linked quarter, primarily due to the impact of brokered deposits issued in the prior linked quarter and increased rates on FHLB advances.
Credit Loss Expense (Benefit)
Credit loss expense for the three and nine months ended September 30, 2022 was $1.0 million and $4.1 million, respectively, as compared to a credit loss benefit of $3.2 million and $10.3 million for the corresponding prior year periods, and a credit loss expense of $1.3 million in the prior linked quarter. The credit loss expense for the three and nine months ended September 30, 2022 was influenced by loan growth, slowing prepayment rates, and increasingly uncertain macro-economic forecasts due to rising interest rates, inflation, and global economic headwinds, partly offset by positive trends in the Company’s criticized and classified assets.
6
Net loan recoveries were $252,000 and $386,000 for the three months ended September 30, 2022 and 2021, respectively. Net loan recoveries were $335,000 and $442,000 for the nine months ended September 30, 2022 and 2021, respectively. Net loan charge-offs were $9,000 in the prior linked quarter. Refer to “Asset Quality” section for further discussion.
Non-interest Income
For the three months ended September 30, 2022, other income increased to $15.2 million, as compared to $9.9 million for the corresponding prior year period. For the nine months ended September 30, 2022, other income decreased to $31.5 million, as compared to $42.5 million for the corresponding prior year period.
Other income for the three and nine months ended September 30, 2022 was impacted by non-core operations of $3.4 million related to gains on equity investments and $7.5 million related to net losses on equity investments, respectively. The nine months ended September 30, 2022 included $11.3 million of net unrealized losses, mostly on preferred stock equity investments, primarily due to the impact of the rising interest rate environment. The preferred stock equity investments carry a weighted average yield of 5.1% and an amortized cost of $73.3 million at September 30, 2022. Other income for the three and nine months ended September 30, 2021 was impacted by non-core operations of $466,000 related to net losses on equity investments and $8.4 million related to net gains on equity investments, respectively.
Excluding non-core operations noted above, other income increased by $1.4 million for the three months ended September 30, 2022, as compared to the corresponding prior year period. This increase was primarily due to the acquisition of a majority interest in Trident, which added $3.3 million of title-related fees and service charges. This increase was partly offset by a decrease in income from bankcard services of $1.9 million, primarily as a result of the Durbin amendment, which became effective for the Company on July 1, 2022.
7
Excluding non-core operations noted above, other income increased by $4.9 million for the nine months ended September 30, 2022, as compared to the corresponding prior year period. The increase was primarily due to the impact of Trident, which added $7.8 million of title-related fees and services charges, and an increase in commercial loan swap income of $3.8 million. These increases were partly offset by decreases in net gain on sale of loans of $2.8 million, income from bankcard services of $2.3 million primarily as a result of the Durbin amendment, fees and service charges of $849,000, and Paycheck Protection Program (“PPP”) loan origination referral fees of $800,000.
Excluding non-core operations of $8.1 million related to net losses on equity investments in the prior linked quarter, other income for the three months ended September 30, 2022 decreased by $3.8 million, primarily due to decreases in income from bankcard services of $1.8 million primarily as a result of the Durbin amendment, fees and service charges of $1.3 million due to seasonality and market conditions impacting Trident’s performance, and commercial loan swap income of $823,000.
Non-interest Expense
Operating expenses increased to $59.0 million and $175.2 million for the three and nine months ended September 30, 2022, respectively, as compared to $58.7 million and $162.0 million for the same prior year periods. Operating expenses for the three and nine months ended September 30, 2022 were favorably impacted by $48,000 and adversely impacted by $3.1 million of non-core operations, respectively. Operating expenses were adversely impacted by non-core operations for the three and nine months ended September 30, 2021 of $4.2 million and $6.1 million, respectively.
Excluding non-core operations, operating expenses increased by $4.6 million for the three months ended September 30, 2022, as compared to the corresponding prior year period. This increase was partly due to the acquisition of a majority interest in Trident, which added $2.8 million of expenses for the three months ended September 30, 2022, and increases, excluding Trident, in compensation and benefits expense of $1.8 million primarily related to increased employee medical benefit claims, and
8
data processing expense of $1.2 million, as a result of the migration to a new core banking system. These increases were partly offset by a decrease in professional fees of $615,000.
Excluding non-core operations, operating expenses increased by $16.2 million for the nine months ended September 30, 2022, as compared to the corresponding prior year period. This increase was partly due to the impact of Trident, which added $6.0 million of expenses and increases, excluding Trident, in compensation and benefits expense of $5.3 million partly relating to the commercial banking strategy and commercial banking hires in expansion markets of Boston and Baltimore, data processing expense of $4.6 million as a result of the migration to a new core banking system, and federal deposit insurance and regulatory assessments of $1.0 million as a result of a higher assessment base and multiplier. These increases were partly offset by a decrease in amortization of core deposit intangible by $551,000.
Excluding non-core operations, operating expenses for the three months ended September 30, 2022 increased $1.1 million as compared to the prior linked quarter, primarily due to increases in compensation and benefits of $971,000, primarily related to increased employee medical benefit claims, and occupancy expense of $530,000.
Income Tax Expense
The provision for income taxes was $12.3 million and $29.2 million for the three and nine months ended September 30, 2022, respectively, as compared to $7.4 million and $28.1 million for the same prior year periods, and $8.9 million for the prior linked quarter. The effective tax rate was 24.1% and 23.7% for the three and nine months ended September 30, 2022, respectively, as compared to 23.3% and 24.3% for the same prior year periods, respectively, and 23.3% for the prior linked quarter.
9
Financial Condition
Total assets increased by $943.8 million to $12.68 billion at September 30, 2022, from $11.74 billion at December 31, 2021. Total loans increased by $1.10 billion to $9.72 billion at September 30, 2022, from $8.62 billion at December 31, 2021, due to strong loan originations. Total debt securities decreased by $209.4 million at September 30, 2022, as compared to December 31, 2021, primarily due to principal repayments and maturities, and to a lesser extent, an increase in unrealized losses driven by the rising rate environment. Other assets increased by $81.1 million to $228.1 million at September 30, 2022 from $147.0 million at December 31, 2021, primarily due to an increase in market values associated with customer interest rate swap programs.
Total liabilities increased by $920.2 million to $11.14 billion at September 30, 2022, from $10.22 billion at December 31, 2021. Deposits increased by $226.7 million to $9.96 billion at September 30, 2022, from $9.73 billion at December 31, 2021. Total deposits, excluding time deposits, decreased by $402.7 million to $8.56 billion at September 30, 2022, from $8.96 billion at December 31, 2021, due to the net runoff of interest-bearing checking balances. Time deposits increased to $1.40 billion at September 30, 2022, from $775.0 million at December 31, 2021, primarily due to an increase in brokered time deposits. The loans-to-deposit ratio at September 30, 2022 was 97.6%, as compared to 88.6% at December 31, 2021.
FHLB advances increased to $514.2 million at September 30, 2022 from $0 at December 31, 2021 to fund liquidity needs. Other borrowings decreased by $34.2 million to $194.9 million at September 30, 2022, from $229.1 million at December 31, 2021, primarily due to the extinguishment of $35.0 million of subordinated debt in March 2022. Other liabilities increased by $230.9 million to $352.9 million at September 30, 2022, from $122.0 million at December 31, 2021, primarily due to an increase in the market values associated with customer interest rate swap programs and related collateral received from counterparties.
10
Stockholders’ equity increased to $1.54 billion at September 30, 2022, as compared to $1.52 billion at December 31, 2021. Accumulated other comprehensive loss increased by $35.7 million to $38.5 million at September 30, 2022 from $2.8 million at December 31, 2021, primarily due to unrealized losses on debt securities available-for-sale which were adversely impacted by the rising interest rate environment. For the nine months ended September 30, 2022, the Company repurchased 373,223 shares totaling $7.4 million under its stock repurchase program at a weighted average cost of $19.82. There were 2,934,438 shares available for repurchase at September 30, 2022 under the existing repurchase program. Stockholders’ equity per common share increased to $26.04 at September 30, 2022, as compared to $25.63 at December 31, 2021. Tangible common equity per common share2 increased to $16.30 at September 30, 2022, as compared to $15.93 at December 31, 2021.
Asset Quality
The Company’s non-performing loans decreased to $21.5 million at September 30, 2022, as compared to $25.5 million at December 31, 2021. The Company’s non-performing loans, excluding $3.0 million and $6.5 million of non-performing purchased with credit deterioration (“PCD”) loans from prior bank acquisitions at September 30, 2022 and December 31, 2021, respectively, decreased to $18.5 million at September 30, 2022, as compared to $18.9 million at December 31, 2021. The allowance for loan credit losses as a percentage of total non-performing loans was 248.96% at September 30, 2022, as compared to 191.61% at December 31, 2021. The allowance for loan credit losses as a percentage of total non-performing loans, excluding PCD loans, was 290.01% at September 30, 2022, as compared to 257.81% at December 31, 2021. The level of 30 to 89 days delinquent loans improved to $11.8 million at September 30, 2022, from $14.5 million at December 31, 2021. The level of 30 to 89 days delinquent loans, excluding non-performing and PCD loans, improved to $10.4 million at September 30, 2022, from $13.5 million at December 31, 2021.
2 Tangible common equity per common share, a non-GAAP financial measure, excludes the impact of intangible assets, goodwill, and preferred equity from stockholders’ equity. Refer to “Explanation of Non-GAAP Financial Measures” and the “Non-GAAP Reconciliation” tables for additional information regarding non-GAAP financial measures.
11
The Company’s allowance for loan credit losses was 0.55% of total loans at September 30, 2022, as compared to 0.57% at December 31, 2021. The allowance for loan credit losses plus the unamortized credit and PCD marks amounted to $67.1 million, or 0.69% of total loans, at September 30, 2022, as compared to $67.8 million, or 0.79% of total loans at December 31, 2021.
12
Explanation of Non-GAAP Financial Measures
Reported amounts are presented in accordance with GAAP. The Company’s management believes that the supplemental non-GAAP information, which consists of reported net income excluding non-core operations and in some instances excluding income taxes and credit loss provision, and reporting equity and asset amounts excluding intangible assets and goodwill, which can vary from period to period, provides a better comparison of period-to-period operating performance. In addition, a non-GAAP table has been presented excluding the results associated with the acquisition of a majority interest in Trident for better comparison period over period. Additionally, the Company believes this information is utilized by regulators and market analysts to evaluate a company’s financial condition and, therefore, such information is useful to investors. These disclosures should not be viewed as a substitute for financial results in accordance with GAAP, nor are they necessarily comparable to non-GAAP performance measures which may be presented by other companies. Refer to the Non-GAAP Reconciliation table at the end of this document for details on the earnings impact of these items.
Conference Call
As previously announced, the Company will host an earnings conference call on Tuesday, October 25, 2022 at 11:00 a.m. Eastern Time. The direct dial number for the call is (844) 200-6205, using the access code 225620. For those unable to participate in the conference call, a replay will be available. To access the replay, dial (866) 813-9403, access code 477430, from one hour after the end of the call until January 26, 2023. The conference call, as well as the replay, are also available (listen-only) by internet webcast at www.oceanfirst.com in the Investor Relations section.
* * *
13
OceanFirst Financial Corp.’s subsidiary, OceanFirst Bank N.A., founded in 1902, is a $12.7 billion regional bank providing financial services throughout New Jersey and in the major metropolitan markets of Philadelphia, New York, Baltimore, and Boston. OceanFirst Bank delivers commercial and residential financing, treasury management, trust and asset management, and deposit services and is one of the largest and oldest community-based financial institutions headquartered in New Jersey. To learn more about OceanFirst, go to www.oceanfirst.com.
Forward-Looking Statements
In addition to historical information, this news release contains certain forward-looking statements within the meaning of the Private Securities Litigation Reform Act of 1995, which are based on certain assumptions and describe future plans, strategies and expectations of the Company. These forward-looking statements are generally identified by use of the words “believe,” “expect,” “intend,” “anticipate,” “estimate,” “project,” “will,” “should,” “may,” “view,” “opportunity,” “potential,” or similar expressions or expressions of confidence. The Company’s ability to predict results or the actual effect of future plans or strategies is inherently uncertain. Factors which could have a material adverse effect on the operations of the Company and its subsidiaries include, but are not limited to: management plans relating to the proposed transaction with Partners Bancorp (the “Transaction”); the ability to complete the Transaction; the ability to obtain any regulatory, stockholder or other approvals, authorizations or consents; the expected timing of the completion of the Transaction; any statements of the plans and objectives of management for future operations, products or services, including the execution of integration plans relating to the Transaction; the impact of the COVID-19 or any other pandemic on our operations and financial results and those of our customers, changes in interest rates, inflation, general economic conditions, levels of unemployment in the Bank’s lending area, real estate market values in the Bank’s lending area, future natural disasters and increases to flood insurance premiums, the current or anticipated impact of military conflict, terrorism or other geopolitical events, the level of prepayments on loans and mortgage-backed securities, legislative/regulatory changes, monetary and fiscal policies of the U.S. Government including policies of the U.S. Treasury and the Board of Governors of the Federal Reserve System, the quality or composition of the loan or investment portfolios, demand for loan products, deposit flows, competition, demand for financial services in the Company’s market area, accounting principles, a failure in or breach of the Company’s operational or security systems or infrastructure, including cyberattacks; and guidelines and the Bank’s ability to successfully integrate acquired operations. These risks and uncertainties are further discussed in the Company’s Annual Report on Form 10-K for the year ended December 31, 2021, under Item 1A - Risk Factors and elsewhere, and subsequent securities filings and should be considered in evaluating forward-looking statements and undue reliance should not be placed on such statements. The Company does not undertake, and specifically disclaims any obligation, to publicly release the result of any revisions which may be made to any forward-looking statements to reflect events or circumstances after the date of such statements or to reflect the occurrence of anticipated or unanticipated events.
14
OceanFirst Financial Corp.
CONSOLIDATED STATEMENTS OF FINANCIAL CONDITION
(dollars in thousands)
| September 30, | June 30, | December 31, | September 30, | |||||||||||||||||||||||
| 2022 | 2022 | 2021 | 2021 | |||||||||||||||||||||||
| (Unaudited) | (Unaudited) | (Unaudited) | ||||||||||||||||||||||||
| Assets | ||||||||||||||||||||||||||
| Cash and due from banks | $ | 170,668 | $ | 189,019 | $ | 204,949 | $ | 981,126 | ||||||||||||||||||
| Debt securities available-for-sale, at estimated fair value | 470,300 | 507,276 | 568,255 | 314,620 | ||||||||||||||||||||||
Debt securities held-to-maturity, net of allowance for securities credit losses of $1,234 at September 30, 2022, $1,293 at June 30, 2022, $1,467 at December 31, 2021, and $1,503 at September 30, 2021 (estimated fair value of $905,426 at September 30, 2022, $987,532 at June 30, 2022, $1,152,744 at December 31, 2021 and $1,143,381 at September 30, 2021) | 1,027,712 | 1,068,034 | 1,139,193 | 1,125,382 | ||||||||||||||||||||||
| Equity investments | 81,722 | 75,269 | 101,155 | 101,314 | ||||||||||||||||||||||
| Restricted equity investments, at cost | 77,556 | 76,047 | 53,195 | 53,017 | ||||||||||||||||||||||
Loans receivable, net of allowance for loan credit losses of $53,521 at September 30, 2022, $52,061 at June 30, 2022, $48,850 at December 31, 2021 and $50,153 at September 30, 2021 | 9,672,488 | 9,380,688 | 8,583,352 | 8,139,961 | ||||||||||||||||||||||
| Loans held-for-sale | 3,549 | — | — | 13,428 | ||||||||||||||||||||||
| Interest and dividends receivable | 38,388 | 34,184 | 32,606 | 32,512 | ||||||||||||||||||||||
| Other real estate owned | — | — | 106 | 106 | ||||||||||||||||||||||
| Premises and equipment, net | 127,868 | 128,118 | 125,828 | 123,669 | ||||||||||||||||||||||
| Bank owned life insurance | 261,118 | 260,230 | 259,207 | 260,072 | ||||||||||||||||||||||
| Assets held for sale | 3,216 | 4,263 | 6,229 | 4,613 | ||||||||||||||||||||||
| Goodwill | 506,146 | 506,146 | 500,319 | 500,319 | ||||||||||||||||||||||
| Core deposit intangible | 14,656 | 15,827 | 18,215 | 19,558 | ||||||||||||||||||||||
| Other assets | 228,066 | 193,552 | 147,007 | 159,991 | ||||||||||||||||||||||
| Total assets | $ | 12,683,453 | $ | 12,438,653 | $ | 11,739,616 | $ | 11,829,688 | ||||||||||||||||||
| Liabilities and Stockholders’ Equity | ||||||||||||||||||||||||||
| Deposits | $ | 9,959,469 | $ | 9,831,484 | $ | 9,732,816 | $ | 9,774,097 | ||||||||||||||||||
| Federal Home Loan Bank advances | 514,200 | 488,750 | — | — | ||||||||||||||||||||||
| Securities sold under agreements to repurchase with customers | 96,289 | 105,495 | 118,769 | 143,292 | ||||||||||||||||||||||
| Other borrowings | 194,914 | 194,654 | 229,141 | 228,887 | ||||||||||||||||||||||
| Advances by borrowers for taxes and insurance | 25,457 | 23,640 | 20,305 | 22,214 | ||||||||||||||||||||||
| Other liabilities | 352,908 | 273,198 | 122,032 | 147,949 | ||||||||||||||||||||||
| Total liabilities | 11,143,237 | 10,917,221 | 10,223,063 | 10,316,439 | ||||||||||||||||||||||
| OceanFirst Financial Corp. stockholders’ equity | 1,539,253 | 1,520,488 | 1,516,553 | 1,513,249 | ||||||||||||||||||||||
| Non-controlling interest | 963 | 944 | — | — | ||||||||||||||||||||||
| Total stockholders’ equity | 1,540,216 | 1,521,432 | 1,516,553 | 1,513,249 | ||||||||||||||||||||||
| Total liabilities and stockholders’ equity | $ | 12,683,453 | $ | 12,438,653 | $ | 11,739,616 | $ | 11,829,688 | ||||||||||||||||||
15
OceanFirst Financial Corp.
CONSOLIDATED STATEMENTS OF INCOME
(in thousands, except per share amounts)
| For the Three Months Ended, | For the Nine Months Ended, | |||||||||||||||||||||||||||||||
| September 30, | June 30, | September 30, | September 30, | September 30, | ||||||||||||||||||||||||||||
| 2022 | 2022 | 2021 | 2022 | 2021 | ||||||||||||||||||||||||||||
| |---------------------- (Unaudited) ----------------------| | |---------- (Unaudited) -----------| | |||||||||||||||||||||||||||||||
| Interest income: | ||||||||||||||||||||||||||||||||
| Loans | $ | 100,141 | $ | 90,731 | $ | 78,889 | $ | 273,340 | $ | 233,845 | ||||||||||||||||||||||
| Debt securities | 8,479 | 7,473 | 5,040 | 23,456 | 16,379 | |||||||||||||||||||||||||||
| Equity investments and other | 1,879 | 1,212 | 1,491 | 4,102 | 3,411 | |||||||||||||||||||||||||||
| Total interest income | 110,499 | 99,416 | 85,420 | 300,898 | 253,635 | |||||||||||||||||||||||||||
| Interest expense: | ||||||||||||||||||||||||||||||||
| Deposits | 9,238 | 4,317 | 5,379 | 17,596 | 20,200 | |||||||||||||||||||||||||||
| Borrowed funds | 5,296 | 4,302 | 2,909 | 12,313 | 8,683 | |||||||||||||||||||||||||||
| Total interest expense | 14,534 | 8,619 | 8,288 | 29,909 | 28,883 | |||||||||||||||||||||||||||
| Net interest income | 95,965 | 90,797 | 77,132 | 270,989 | 224,752 | |||||||||||||||||||||||||||
| Credit loss expense (benefit) | 1,016 | 1,254 | (3,179) | 4,121 | (10,259) | |||||||||||||||||||||||||||
| Net interest income after credit loss expense (benefit) | 94,949 | 89,543 | 80,311 | 266,868 | 235,011 | |||||||||||||||||||||||||||
| Other income: | ||||||||||||||||||||||||||||||||
| Bankcard services revenue | 1,509 | 3,310 | 3,409 | 7,782 | 10,052 | |||||||||||||||||||||||||||
| Trust and asset management revenue | 568 | 658 | 584 | 1,835 | 1,774 | |||||||||||||||||||||||||||
| Fees and service charges | 6,320 | 7,646 | 2,973 | 17,026 | 10,519 | |||||||||||||||||||||||||||
| Net gain (loss) on sales of loans | 168 | 3 | (15) | 348 | 3,180 | |||||||||||||||||||||||||||
| Net gain (loss) on equity investments | 3,362 | (8,078) | (466) | (7,502) | 8,397 | |||||||||||||||||||||||||||
| Net gain (loss) from other real estate operations | — | 50 | (3) | 48 | (12) | |||||||||||||||||||||||||||
| Income from bank owned life insurance | 1,356 | 1,422 | 1,640 | 4,881 | 4,771 | |||||||||||||||||||||||||||
| Commercial loan swap income | 1,471 | 2,294 | 1,588 | 6,546 | 2,772 | |||||||||||||||||||||||||||
| Other | 396 | 236 | 173 | 579 | 1,068 | |||||||||||||||||||||||||||
| Total other income | 15,150 | 7,541 | 9,883 | 31,543 | 42,521 | |||||||||||||||||||||||||||
| Operating expenses: | ||||||||||||||||||||||||||||||||
| Compensation and employee benefits | 34,124 | 33,153 | 30,730 | 97,972 | 89,008 | |||||||||||||||||||||||||||
| Occupancy | 5,288 | 4,758 | 5,005 | 15,790 | 15,380 | |||||||||||||||||||||||||||
| Equipment | 1,150 | 1,336 | 1,124 | 3,856 | 4,008 | |||||||||||||||||||||||||||
| Marketing | 655 | 971 | 496 | 2,242 | 1,555 | |||||||||||||||||||||||||||
| Federal deposit insurance and regulatory assessments | 1,757 | 1,788 | 1,459 | 5,435 | 4,422 | |||||||||||||||||||||||||||
| Data processing | 6,560 | 6,170 | 5,363 | 18,466 | 13,796 | |||||||||||||||||||||||||||
| Check card processing | 1,231 | 1,515 | 1,337 | 3,728 | 4,012 | |||||||||||||||||||||||||||
| Professional fees | 2,502 | 2,472 | 3,089 | 8,296 | 8,317 | |||||||||||||||||||||||||||
| Amortization of core deposit intangible | 1,171 | 1,178 | 1,354 | 3,559 | 4,110 | |||||||||||||||||||||||||||
| Branch consolidation (benefit) expense, net | (346) | 546 | 4,014 | 602 | 5,051 | |||||||||||||||||||||||||||
| Merger related expenses | 298 | 196 | 225 | 2,459 | 1,052 | |||||||||||||||||||||||||||
| Other operating expense | 4,607 | 4,578 | 4,477 | 12,748 | 11,315 | |||||||||||||||||||||||||||
| Total operating expenses | 58,997 | 58,661 | 58,673 | 175,153 | 162,026 | |||||||||||||||||||||||||||
| Income before provision for income taxes | 51,102 | 38,423 | 31,521 | 123,258 | 115,506 | |||||||||||||||||||||||||||
| Provision for income taxes | 12,298 | 8,940 | 7,354 | 29,212 | 28,087 | |||||||||||||||||||||||||||
| Net income | 38,804 | 29,483 | 24,167 | 94,046 | 87,419 | |||||||||||||||||||||||||||
| Net income attributable to non-controlling interest | 193 | 522 | — | 715 | — | |||||||||||||||||||||||||||
| Net income attributable to OceanFirst Financial Corp. | 38,611 | 28,961 | 24,167 | 93,331 | 87,419 | |||||||||||||||||||||||||||
| Dividends on preferred shares | 1,004 | 1,004 | 1,004 | 3,012 | 3,012 | |||||||||||||||||||||||||||
| Net income available to common stockholders | $ | 37,607 | $ | 27,957 | $ | 23,163 | $ | 90,319 | $ | 84,407 | ||||||||||||||||||||||
| Basic earnings per share | $ | 0.64 | $ | 0.48 | $ | 0.40 | $ | 1.54 | $ | 1.42 | ||||||||||||||||||||||
| Diluted earnings per share | $ | 0.64 | $ | 0.47 | $ | 0.39 | $ | 1.53 | $ | 1.41 | ||||||||||||||||||||||
| Average basic shares outstanding | 58,681 | 58,894 | 59,311 | 58,777 | 59,619 | |||||||||||||||||||||||||||
| Average diluted shares outstanding | 58,801 | 58,995 | 59,515 | 58,918 | 59,862 | |||||||||||||||||||||||||||
16
OceanFirst Financial Corp.
SELECTED LOAN AND DEPOSIT DATA
(dollars in thousands)
| LOANS RECEIVABLE | At | ||||||||||||||||||||||||||||||||||
| September 30, | June 30, | March 31, | December 31, | September 30, | |||||||||||||||||||||||||||||||
| 2022 | 2022 | 2022 | 2021 | 2021 | |||||||||||||||||||||||||||||||
| Commercial: | |||||||||||||||||||||||||||||||||||
| Commercial real estate - investor | $ | 5,007,637 | $ | 4,808,965 | $ | 4,607,880 | $ | 4,378,061 | $ | 3,922,983 | |||||||||||||||||||||||||
| Commercial real estate - owner-occupied | 983,784 | 1,020,873 | 1,057,246 | 1,055,065 | 1,123,973 | ||||||||||||||||||||||||||||||
| Commercial and industrial | 652,620 | 584,464 | 502,739 | 449,224 | 457,674 | ||||||||||||||||||||||||||||||
| Total commercial | 6,644,041 | 6,414,302 | 6,167,865 | 5,882,350 | 5,504,630 | ||||||||||||||||||||||||||||||
| Consumer: | |||||||||||||||||||||||||||||||||||
| Residential real estate | 2,813,209 | 2,758,269 | 2,687,927 | 2,479,701 | 2,401,240 | ||||||||||||||||||||||||||||||
| Home equity loans and lines and other consumer ("other consumer") | 261,510 | 252,314 | 253,184 | 260,819 | 275,962 | ||||||||||||||||||||||||||||||
| Total consumer | 3,074,719 | 3,010,583 | 2,941,111 | 2,740,520 | 2,677,202 | ||||||||||||||||||||||||||||||
| Total loans | 9,718,760 | 9,424,885 | 9,108,976 | 8,622,870 | 8,181,832 | ||||||||||||||||||||||||||||||
| Deferred origination costs (fees), net | 7,249 | 7,864 | 7,301 | 9,332 | 8,282 | ||||||||||||||||||||||||||||||
| Allowance for loan credit losses | (53,521) | (52,061) | (50,598) | (48,850) | (50,153) | ||||||||||||||||||||||||||||||
| Loans receivable, net | $ | 9,672,488 | $ | 9,380,688 | $ | 9,065,679 | $ | 8,583,352 | $ | 8,139,961 | |||||||||||||||||||||||||
| Mortgage loans serviced for others | $ | 53,869 | $ | 56,045 | $ | 58,089 | $ | 60,447 | $ | 64,840 | |||||||||||||||||||||||||
| At September 30, 2022 Average Yield | |||||||||||||||||||||||||||||||||||
Loan pipeline (1): | |||||||||||||||||||||||||||||||||||
| Commercial | 5.21 | % | $ | 339,487 | $ | 273,843 | $ | 385,986 | $ | 539,426 | $ | 482,942 | |||||||||||||||||||||||
| Residential real estate | 5.20 | 80,591 | 104,920 | 116,554 | 123,211 | 160,070 | |||||||||||||||||||||||||||||
| Other consumer | 5.24 | 19,395 | 6,278 | 12,814 | 8,381 | 8,420 | |||||||||||||||||||||||||||||
| Total | 5.21 | % | $ | 439,473 | $ | 385,041 | $ | 515,354 | $ | 671,018 | $ | 651,432 | |||||||||||||||||||||||
| For the Three Months Ended | ||||||||||||||||||||||||||||||||||||||
| September 30, | June 30, | March 31, | December 31, | September 30, | ||||||||||||||||||||||||||||||||||
| 2022 | 2022 | 2022 | 2021 | 2021 | ||||||||||||||||||||||||||||||||||
| Average Yield | ||||||||||||||||||||||||||||||||||||||
| Loan originations: | ||||||||||||||||||||||||||||||||||||||
| Commercial | 5.11 | % | $ | 356,726 | $ | 645,863 | $ | 816,517 | $ | 780,464 | $ | 585,667 | ||||||||||||||||||||||||||
| Residential real estate | 4.72 | 129,808 | 173,365 | 192,721 | (2) | 195,942 | (2) | 174,365 | (2) | |||||||||||||||||||||||||||||
| Other consumer | 3.90 | 57,254 | 16,253 | 12,718 | 12,552 | 11,782 | ||||||||||||||||||||||||||||||||
| Total | 4.89 | % | $ | 543,788 | $ | 835,481 | $ | 1,021,956 | $ | 988,958 | $ | 771,814 | ||||||||||||||||||||||||||
| Loans sold | $ | 9,425 | (3) | $ | — | $ | 703 | (4) | $ | 649 | $ | 1,756 | ||||||||||||||||||||||||||
(1)Loan pipeline includes loans approved but not funded.
(2)Excludes residential real estate loan pool purchases of $161.7 million, $82.2 million and $219.7 million for the three months ended March 31, 2022, December 31, 2021 and September 30, 2021, respectively.
(3)Excludes the sale of a small business administration loan of $1.2 million for the three months ended September 30, 2022
(4)Excludes the sale of higher risk commercial loans of $12.0 million for the three months ended March 31, 2022.
| DEPOSITS | At | ||||||||||||||||||||||||||||
| September 30, | June 30, | March 31, | December 31, | September 30, | |||||||||||||||||||||||||
| 2022 | 2022 | 2022 | 2021 | 2021 | |||||||||||||||||||||||||
| Type of Account | |||||||||||||||||||||||||||||
| Non-interest-bearing | $ | 2,325,547 | $ | 2,312,126 | $ | 2,444,833 | $ | 2,412,056 | $ | 2,467,952 | |||||||||||||||||||
| Interest-bearing checking | 3,909,864 | 3,696,067 | 4,287,745 | 4,201,736 | 4,013,565 | ||||||||||||||||||||||||
| Money market | 749,229 | 716,782 | 811,588 | 736,090 | 816,691 | ||||||||||||||||||||||||
| Savings | 1,570,472 | 1,606,534 | 1,624,751 | 1,607,933 | 1,620,447 | ||||||||||||||||||||||||
| Time deposits | 1,404,357 | 1,499,975 | 887,316 | 775,001 | 855,442 | ||||||||||||||||||||||||
| Total deposits | $ | 9,959,469 | $ | 9,831,484 | $ | 10,056,233 | $ | 9,732,816 | $ | 9,774,097 | |||||||||||||||||||
17
OceanFirst Financial Corp.
ASSET QUALITY
(dollars in thousands)
| ASSET QUALITY | September 30, | June 30, | March 31, | December 31, | September 30, | ||||||||||||||||||||||||
| 2022 | 2022 | 2022 | 2021 | 2021 | |||||||||||||||||||||||||
| Non-performing loans: | |||||||||||||||||||||||||||||
| Commercial real estate - investor | $ | 9,866 | $ | 2,609 | $ | 3,575 | $ | 3,614 | $ | 8,506 | |||||||||||||||||||
| Commercial real estate - owner-occupied | 1,976 | 8,233 | 9,632 | 11,904 | 12,524 | ||||||||||||||||||||||||
| Commercial and industrial | 321 | 364 | 2,830 | 277 | 418 | ||||||||||||||||||||||||
| Residential real estate | 5,958 | 5,846 | 7,047 | 6,114 | 5,505 | ||||||||||||||||||||||||
| Other consumer | 3,377 | 3,701 | 3,841 | 3,585 | 3,351 | ||||||||||||||||||||||||
| Total non-performing loans | 21,498 | 20,753 | 26,925 | 25,494 | 30,304 | ||||||||||||||||||||||||
| Other real estate owned | — | — | 106 | 106 | 106 | ||||||||||||||||||||||||
| Total non-performing assets | $ | 21,498 | $ | 20,753 | $ | 27,031 | $ | 25,600 | $ | 30,410 | |||||||||||||||||||
| Delinquent loans 30 to 89 days | $ | 11,846 | $ | 9,558 | $ | 18,691 | $ | 14,546 | $ | 7,840 | |||||||||||||||||||
| Troubled debt restructuring (“TDR”): | |||||||||||||||||||||||||||||
| Non-performing (included in total non-performing loans above) | $ | 10,047 | $ | 10,493 | $ | 11,914 | $ | 11,311 | $ | 9,962 | |||||||||||||||||||
| Performing | 6,065 | 6,946 | 7,716 | 12,320 | 9,661 | ||||||||||||||||||||||||
| Total TDRs | $ | 16,112 | $ | 17,439 | $ | 19,630 | $ | 23,631 | $ | 19,623 | |||||||||||||||||||
| Allowance for loan credit losses | $ | 53,521 | $ | 52,061 | $ | 50,598 | $ | 48,850 | $ | 50,153 | |||||||||||||||||||
Allowance for loan credit losses as a percent of total loans receivable (1) | 0.55 | % | 0.55 | % | 0.56 | % | 0.57 | % | 0.61 | % | |||||||||||||||||||
Allowance for loan credit losses as a percent of total non-performing loans (1) | 248.96 | 250.86 | 187.92 | 191.61 | 165.50 | ||||||||||||||||||||||||
| Non-performing loans as a percent of total loans receivable | 0.22 | 0.22 | 0.30 | 0.30 | 0.37 | ||||||||||||||||||||||||
| Non-performing assets as a percent of total assets | 0.17 | 0.17 | 0.22 | 0.22 | 0.26 | ||||||||||||||||||||||||
| PCD loans | |||||||||||||||||||||||||||||
| PCD loans, net of allowance for loan credit losses | $ | 29,249 | $ | 35,227 | $ | 37,032 | $ | 41,817 | $ | 41,372 | |||||||||||||||||||
| Non-performing PCD loans | 3,043 | 3,529 | 3,745 | 6,546 | 6,960 | ||||||||||||||||||||||||
| Delinquent PCD and non-performing loans 30 to 89 days | 1,434 | 1,381 | 2,749 | 1,000 | 1,193 | ||||||||||||||||||||||||
| TDR PCD loans | 715 | 997 | 1,033 | 337 | 345 | ||||||||||||||||||||||||
Asset quality, excluding PCD loans (2) | |||||||||||||||||||||||||||||
| Non-performing loans | 18,455 | 17,224 | 23,180 | 18,948 | 23,344 | ||||||||||||||||||||||||
| Non-performing assets | 18,455 | 17,224 | 23,286 | 19,054 | 23,450 | ||||||||||||||||||||||||
Delinquent loans 30 to 89 days (excludes non-performing loans) | 10,412 | 8,177 | 15,942 | 13,546 | 6,647 | ||||||||||||||||||||||||
TDRs | 15,397 | 16,442 | 18,597 | 23,294 | 19,278 | ||||||||||||||||||||||||
Allowance for loan credit losses as a percent of total non-performing loans (1) | 290.01 | % | 302.26 | % | 218.28 | % | 257.81 | % | 214.84 | % | |||||||||||||||||||
Non-performing loans as a percent of total loans receivable | 0.19 | 0.18 | 0.25 | 0.22 | 0.29 | ||||||||||||||||||||||||
| Non-performing assets as a percent of total assets | 0.15 | 0.14 | 0.19 | 0.16 | 0.20 | ||||||||||||||||||||||||
(1)Loans acquired from prior bank acquisitions were recorded at fair value. The net unamortized credit and PCD marks on these loans, not reflected in the allowance for loan credit losses, was $13.6 million, $15.5 million, $16.9 million, $18.9 million and $21.3 million at September 30, 2022, June 30, 2022, March 31, 2022, December 31, 2021 and September 30, 2021, respectively.
(2)All balances and ratios exclude PCD loans.
18
(continued)
| NET LOAN RECOVERIES (CHARGE-OFFS) | For the Three Months Ended | ||||||||||||||||||||||||||||
| September 30, | June 30, | March 31, | December 31, | September 30, | |||||||||||||||||||||||||
| 2022 | 2022 | 2022 | 2021 | 2021 | |||||||||||||||||||||||||
| Net loan recoveries (charge-offs): | |||||||||||||||||||||||||||||
| Loan charge-offs | $ | (5) | $ | (287) | $ | (143) | $ | (92) | $ | (163) | |||||||||||||||||||
| Recoveries on loans | 257 | 278 | 235 | 111 | 549 | ||||||||||||||||||||||||
| Net loan recoveries (charge-offs) | $ | 252 | $ | (9) | $ | 92 | $ | 19 | $ | 386 | |||||||||||||||||||
| Net loan recoveries (charge-offs) to average total loans (annualized) | NM* | — | % | NM* | NM* | NM* | |||||||||||||||||||||||
| Net loan recoveries (charge-offs) detail: | |||||||||||||||||||||||||||||
| Commercial | $ | 117 | $ | 154 | $ | 25 | $ | (24) | $ | (33) | |||||||||||||||||||
| Residential real estate | 44 | (47) | 94 | 21 | 280 | ||||||||||||||||||||||||
| Other consumer | 91 | (116) | (27) | 22 | 139 | ||||||||||||||||||||||||
| Net loan recoveries (charge-offs) | $ | 252 | $ | (9) | $ | 92 | $ | 19 | $ | 386 | |||||||||||||||||||
* Not meaningful as amounts are net loan recoveries.
19
OceanFirst Financial Corp.
ANALYSIS OF NET INTEREST INCOME
| For the Three Months Ended | |||||||||||||||||||||||||||||||||||||||||||||||||||||
| September 30, | June 30, | September 30, | |||||||||||||||||||||||||||||||||||||||||||||||||||
| 2022 | 2022 | 2021 | |||||||||||||||||||||||||||||||||||||||||||||||||||
| (dollars in thousands) | Average Balance | Interest | Average Yield/ Cost (1) | Average Balance | Interest | Average Yield/ Cost (1) | Average Balance | Interest | Average Yield/ Cost (1) | ||||||||||||||||||||||||||||||||||||||||||||
| Assets: | |||||||||||||||||||||||||||||||||||||||||||||||||||||
| Interest-earning assets: | |||||||||||||||||||||||||||||||||||||||||||||||||||||
| Interest-earning deposits and short-term investments | $ | 65,648 | $ | 336 | 2.03 | % | $ | 67,440 | $ | 100 | 0.59 | % | $ | 1,053,797 | $ | 441 | 0.17 | % | |||||||||||||||||||||||||||||||||||
Securities (2) | 1,748,687 | 10,022 | 2.27 | 1,811,869 | 8,585 | 1.90 | 1,542,630 | 6,090 | 1.57 | ||||||||||||||||||||||||||||||||||||||||||||
Loans receivable, net (3) | |||||||||||||||||||||||||||||||||||||||||||||||||||||
| Commercial | 6,509,515 | 74,309 | 4.53 | 6,278,465 | 65,390 | 4.18 | 5,361,472 | 55,387 | 4.10 | ||||||||||||||||||||||||||||||||||||||||||||
| Residential real estate | 2,791,067 | 22,818 | 3.27 | 2,718,787 | 22,742 | 3.35 | 2,260,673 | 20,076 | 3.55 | ||||||||||||||||||||||||||||||||||||||||||||
| Other consumer | 256,638 | 3,014 | 4.66 | 251,014 | 2,599 | 4.15 | 289,011 | 3,426 | 4.70 | ||||||||||||||||||||||||||||||||||||||||||||
| Allowance for loan credit losses, net of deferred loan costs and fees | (44,773) | — | — | (43,683) | — | — | (46,436) | — | — | ||||||||||||||||||||||||||||||||||||||||||||
| Loans receivable, net | 9,512,447 | 100,141 | 4.18 | 9,204,583 | 90,731 | 3.95 | 7,864,720 | 78,889 | 3.98 | ||||||||||||||||||||||||||||||||||||||||||||
| Total interest-earning assets | 11,326,782 | 110,499 | 3.88 | 11,083,892 | 99,416 | 3.60 | 10,461,147 | 85,420 | 3.24 | ||||||||||||||||||||||||||||||||||||||||||||
| Non-interest-earning assets | 1,191,173 | 1,168,093 | 1,276,890 | ||||||||||||||||||||||||||||||||||||||||||||||||||
| Total assets | $ | 12,517,955 | $ | 12,251,985 | $ | 11,738,037 | |||||||||||||||||||||||||||||||||||||||||||||||
Liabilities and Stockholders’ Equity: | |||||||||||||||||||||||||||||||||||||||||||||||||||||
| Interest-bearing liabilities: | |||||||||||||||||||||||||||||||||||||||||||||||||||||
| Interest-bearing checking | $ | 3,873,968 | 2,671 | 0.27 | % | $ | 4,020,474 | 1,612 | 0.16 | % | $ | 3,841,475 | 2,854 | 0.29 | % | ||||||||||||||||||||||||||||||||||||||
| Money market | 793,230 | 721 | 0.36 | 739,647 | 279 | 0.15 | 767,854 | 245 | 0.13 | ||||||||||||||||||||||||||||||||||||||||||||
| Savings | 1,603,147 | 187 | 0.05 | 1,639,568 | 161 | 0.04 | 1,609,197 | 146 | 0.04 | ||||||||||||||||||||||||||||||||||||||||||||
| Time deposits | 1,467,297 | 5,659 | 1.53 | 937,387 | 2,265 | 0.97 | 904,384 | 2,134 | 0.94 | ||||||||||||||||||||||||||||||||||||||||||||
| Total | 7,737,642 | 9,238 | 0.47 | 7,337,076 | 4,317 | 0.24 | 7,122,910 | 5,379 | 0.30 | ||||||||||||||||||||||||||||||||||||||||||||
| FHLB Advances | 352,392 | 2,208 | 2.49 | 538,754 | 1,647 | 1.23 | — | — | — | ||||||||||||||||||||||||||||||||||||||||||||
| Securities sold under agreements to repurchase | 96,147 | 35 | 0.14 | 103,929 | 41 | 0.16 | 142,494 | 51 | 0.14 | ||||||||||||||||||||||||||||||||||||||||||||
| Other borrowings | 194,755 | 3,053 | 6.22 | 194,481 | 2,614 | 5.39 | 228,695 | 2,858 | 4.96 | ||||||||||||||||||||||||||||||||||||||||||||
| Total borrowings | 643,294 | 5,296 | 3.27 | 837,164 | 4,302 | 2.06 | 371,189 | 2,909 | 3.11 | ||||||||||||||||||||||||||||||||||||||||||||
| Total interest-bearing liabilities | 8,380,936 | 14,534 | 0.69 | 8,174,240 | 8,619 | 0.42 | 7,494,099 | 8,288 | 0.44 | ||||||||||||||||||||||||||||||||||||||||||||
| Non-interest-bearing deposits | 2,328,700 | 2,328,124 | 2,576,123 | ||||||||||||||||||||||||||||||||||||||||||||||||||
| Non-interest-bearing liabilities | 266,564 | 214,900 | 148,327 | ||||||||||||||||||||||||||||||||||||||||||||||||||
| Total liabilities | 10,976,200 | 10,717,264 | 10,218,549 | ||||||||||||||||||||||||||||||||||||||||||||||||||
Stockholders’ equity | 1,541,755 | 1,534,721 | 1,519,488 | ||||||||||||||||||||||||||||||||||||||||||||||||||
| Total liabilities and equity | $ | 12,517,955 | $ | 12,251,985 | $ | 11,738,037 | |||||||||||||||||||||||||||||||||||||||||||||||
| Net interest income | $ | 95,965 | $ | 90,797 | $ | 77,132 | |||||||||||||||||||||||||||||||||||||||||||||||
Net interest rate spread (4) | 3.19 | % | 3.18 | % | 2.80 | % | |||||||||||||||||||||||||||||||||||||||||||||||
Net interest margin (5) | 3.36 | % | 3.29 | % | 2.93 | % | |||||||||||||||||||||||||||||||||||||||||||||||
Total cost of deposits (including non-interest-bearing deposits) | 0.36 | % | 0.18 | % | 0.22 | % | |||||||||||||||||||||||||||||||||||||||||||||||
20
(continued)
| For the Nine Months Ended September 30, | |||||||||||||||||||||||||||||||||||
| 2022 | 2021 | ||||||||||||||||||||||||||||||||||
| (dollars in thousands) | Average Balance | Interest | Average Yield/ Cost (1) | Average Balance | Interest | Average Yield/ Cost (1) | |||||||||||||||||||||||||||||
| Assets: | |||||||||||||||||||||||||||||||||||
| Interest-earning assets: | |||||||||||||||||||||||||||||||||||
| Interest-earning deposits and short-term investments | $ | 73,886 | $ | 472 | 0.85 | % | $ | 1,061,419 | $ | 958 | 0.12 | % | |||||||||||||||||||||||
Securities (2) | 1,801,978 | 27,086 | 2.01 | 1,452,778 | 18,832 | 1.73 | |||||||||||||||||||||||||||||
Loans receivable, net (3) | |||||||||||||||||||||||||||||||||||
| Commercial | 6,275,836 | 198,054 | 4.22 | 5,270,138 | 163,315 | 4.14 | |||||||||||||||||||||||||||||
| Residential real estate | 2,685,080 | 66,899 | 3.32 | 2,269,066 | 59,242 | 3.48 | |||||||||||||||||||||||||||||
| Other consumer | 254,891 | 8,387 | 4.40 | 306,681 | 11,288 | 4.92 | |||||||||||||||||||||||||||||
| Allowance for loan credit losses, net of deferred loan costs and fees | (42,987) | — | — | (50,912) | — | — | |||||||||||||||||||||||||||||
| Loans receivable, net | 9,172,820 | 273,340 | 3.98 | 7,794,973 | 233,845 | 4.01 | |||||||||||||||||||||||||||||
| Total interest-earning assets | 11,048,684 | 300,898 | 3.64 | 10,309,170 | 253,635 | 3.29 | |||||||||||||||||||||||||||||
| Non-interest-earning assets | 1,191,358 | 1,264,347 | |||||||||||||||||||||||||||||||||
| Total assets | $ | 12,240,042 | $ | 11,573,517 | |||||||||||||||||||||||||||||||
| Liabilities and Stockholders’ Equity: | |||||||||||||||||||||||||||||||||||
| Interest-bearing liabilities: | |||||||||||||||||||||||||||||||||||
| Interest-bearing checking | $ | 4,088,759 | 6,433 | 0.21 | % | $ | 3,753,457 | 10,549 | 0.38 | % | |||||||||||||||||||||||||
| Money market | 773,666 | 1,317 | 0.23 | 761,975 | 823 | 0.14 | |||||||||||||||||||||||||||||
| Savings | 1,617,354 | 473 | 0.04 | 1,571,345 | 490 | 0.04 | |||||||||||||||||||||||||||||
| Time deposits | 1,060,027 | 9,373 | 1.18 | 1,041,371 | 8,338 | 1.07 | |||||||||||||||||||||||||||||
| Total | 7,539,806 | 17,596 | 0.31 | 7,128,148 | 20,200 | 0.38 | |||||||||||||||||||||||||||||
| FHLB Advances | 308,043 | 3,890 | 1.69 | — | — | — | |||||||||||||||||||||||||||||
| Securities sold under agreements to repurchase | 105,821 | 117 | 0.15 | 135,754 | 203 | 0.20 | |||||||||||||||||||||||||||||
| Other borrowings | 205,796 | 8,306 | 5.40 | 228,472 | 8,480 | 4.96 | |||||||||||||||||||||||||||||
| Total borrowings | 619,660 | 12,313 | 2.66 | 364,226 | 8,683 | 3.19 | |||||||||||||||||||||||||||||
| Total interest-bearing liabilities | 8,159,466 | 29,909 | 0.49 | 7,492,374 | 28,883 | 0.52 | |||||||||||||||||||||||||||||
| Non-interest-bearing deposits | 2,352,606 | 2,416,866 | |||||||||||||||||||||||||||||||||
| Non-interest-bearing liabilities | 193,147 | 157,821 | |||||||||||||||||||||||||||||||||
| Total liabilities | 10,705,219 | 10,067,061 | |||||||||||||||||||||||||||||||||
| Stockholders’ equity | 1,534,823 | 1,506,456 | |||||||||||||||||||||||||||||||||
| Total liabilities and equity | $ | 12,240,042 | $ | 11,573,517 | |||||||||||||||||||||||||||||||
| Net interest income | $ | 270,989 | $ | 224,752 | |||||||||||||||||||||||||||||||
Net interest rate spread (4) | 3.15 | % | 2.77 | % | |||||||||||||||||||||||||||||||
Net interest margin (5) | 3.28 | % | 2.91 | % | |||||||||||||||||||||||||||||||
Total cost of deposits (including non-interest-bearing deposits) | 0.24 | % | 0.28 | % | |||||||||||||||||||||||||||||||
(1) Average yields and costs are annualized.
(2) Amounts represent debt and equity securities, including FHLB and Federal Reserve Bank stock, and are recorded at average amortized cost, net of allowance for securities credit losses.
(3) Amount is net of deferred loan costs and fees, undisbursed loan funds, discounts and premiums and allowance for loan credit losses, and includes loans held for sale and non-performing loans.
(4) Net interest rate spread represents the difference between the yield on interest-earning assets and the cost of interest-bearing liabilities.
(5) Net interest margin represents net interest income divided by average interest-earning assets.
21
OceanFirst Financial Corp.
SELECTED QUARTERLY FINANCIAL DATA
(in thousands, except per share amounts)
| September 30, | June 30, | March 31, | December 31, | September 30, | ||||||||||||||||||||||||||||
| 2022 | 2022 | 2022 | 2021 | 2021 | ||||||||||||||||||||||||||||
| Selected Financial Condition Data: | ||||||||||||||||||||||||||||||||
| Total assets | $ | 12,683,453 | $ | 12,438,653 | $ | 12,164,945 | $ | 11,739,616 | $ | 11,829,688 | ||||||||||||||||||||||
Debt securities available-for-sale, at estimated fair value | 470,300 | 507,276 | 546,470 | 568,255 | 314,620 | |||||||||||||||||||||||||||
| Debt securities held-to-maturity, net of allowance for securities credit losses | 1,027,712 | 1,068,034 | 1,099,514 | 1,139,193 | 1,125,382 | |||||||||||||||||||||||||||
| Equity investments | 81,722 | 75,269 | 93,888 | 101,155 | 101,314 | |||||||||||||||||||||||||||
| Restricted equity investments, at cost | 77,556 | 76,047 | 56,704 | 53,195 | 53,017 | |||||||||||||||||||||||||||
| Loans receivable, net of allowance for loan credit losses | 9,672,488 | 9,380,688 | 9,065,679 | 8,583,352 | 8,139,961 | |||||||||||||||||||||||||||
| Deposits | 9,959,469 | 9,831,484 | 10,056,233 | 9,732,816 | 9,774,097 | |||||||||||||||||||||||||||
| Federal Home Loan Bank advances | 514,200 | 488,750 | 75,002 | — | — | |||||||||||||||||||||||||||
| Securities sold under agreements to repurchase and other borrowings | 291,203 | 300,149 | 312,178 | 347,910 | 372,179 | |||||||||||||||||||||||||||
| Total stockholders’ equity | 1,540,216 | 1,521,432 | 1,519,334 | 1,516,553 | 1,513,249 | |||||||||||||||||||||||||||
| For the Three Months Ended, | ||||||||||||||||||||||||||||||||
| September 30, | June 30, | March 31, | December 31, | September 30, | ||||||||||||||||||||||||||||
| 2022 | 2022 | 2022 | 2021 | 2021 | ||||||||||||||||||||||||||||
| Selected Operating Data: | ||||||||||||||||||||||||||||||||
| Interest income | $ | 110,499 | $ | 99,416 | $ | 90,983 | $ | 88,457 | $ | 85,420 | ||||||||||||||||||||||
| Interest expense | 14,534 | 8,619 | 6,756 | 7,871 | 8,288 | |||||||||||||||||||||||||||
| Net interest income | 95,965 | 90,797 | 84,227 | 80,586 | 77,132 | |||||||||||||||||||||||||||
| Credit loss expense (benefit) | 1,016 | 1,254 | 1,851 | (1,573) | (3,179) | |||||||||||||||||||||||||||
| Net interest income after credit loss expense (benefit) | 94,949 | 89,543 | 82,376 | 82,159 | 80,311 | |||||||||||||||||||||||||||
| Other income (excluding net gain (loss) on equity investments) | 11,788 | 15,619 | 11,638 | 10,662 | 10,349 | |||||||||||||||||||||||||||
| Net gain (loss) on equity investments | 3,362 | (8,078) | (2,786) | (1,252) | (466) | |||||||||||||||||||||||||||
| Operating expenses (excluding merger related and branch consolidation (benefit) expense, net) | 59,045 | 57,919 | 55,128 | 57,097 | 54,434 | |||||||||||||||||||||||||||
| Branch consolidation (benefit) expense, net | (346) | 546 | 402 | 7,286 | 4,014 | |||||||||||||||||||||||||||
| Merger related expenses | 298 | 196 | 1,965 | 451 | 225 | |||||||||||||||||||||||||||
| Income before provision for income taxes | 51,102 | 38,423 | 33,733 | 26,735 | 31,521 | |||||||||||||||||||||||||||
| Provision for income taxes | 12,298 | 8,940 | 7,974 | 4,078 | 7,354 | |||||||||||||||||||||||||||
| Net income | 38,804 | 29,483 | 25,759 | 22,657 | 24,167 | |||||||||||||||||||||||||||
| Net income attributable to non-controlling interest | 193 | 522 | — | — | — | |||||||||||||||||||||||||||
| Net income attributable to OceanFirst Financial Corp. | $ | 38,611 | $ | 28,961 | $ | 25,759 | $ | 22,657 | $ | 24,167 | ||||||||||||||||||||||
| Net income available to common stockholders | $ | 37,607 | $ | 27,957 | $ | 24,755 | $ | 21,653 | $ | 23,163 | ||||||||||||||||||||||
| Diluted earnings per share | $ | 0.64 | $ | 0.47 | $ | 0.42 | $ | 0.37 | $ | 0.39 | ||||||||||||||||||||||
| Net accretion/amortization of purchase accounting adjustments included in net interest income | $ | 2,004 | $ | 2,196 | $ | 2,953 | $ | 3,610 | $ | 3,644 | ||||||||||||||||||||||
22
(continued)
| At or For the Three Months Ended | ||||||||||||||||||||||||||||||||
| September 30, | June 30, | March 31, | December 31, | September 30, | ||||||||||||||||||||||||||||
| 2022 | 2022 | 2022 | 2021 | 2021 | ||||||||||||||||||||||||||||
Selected Financial Ratios and Other Data(1) (2): | ||||||||||||||||||||||||||||||||
| Performance Ratios (Annualized): | ||||||||||||||||||||||||||||||||
Return on average assets (3) | 1.19 | % | 0.92 | % | 0.84 | % | 0.72 | % | 0.78 | % | ||||||||||||||||||||||
Return on average tangible assets (3) (4) | 1.24 | 0.96 | 0.88 | 0.75 | 0.82 | |||||||||||||||||||||||||||
Return on average stockholders’ equity (3) | 9.68 | 7.31 | 6.57 | 5.65 | 6.05 | |||||||||||||||||||||||||||
Return on average tangible stockholders’ equity (3) (4) | 14.62 | 11.08 | 9.94 | 8.59 | 9.20 | |||||||||||||||||||||||||||
| Stockholders’ equity to total assets | 12.14 | 12.23 | 12.49 | 12.92 | 12.79 | |||||||||||||||||||||||||||
Tangible stockholders’ equity to tangible assets (4) | 8.38 | 8.39 | 8.60 | 8.89 | 8.78 | |||||||||||||||||||||||||||
Tangible common equity to tangible assets (4) | 7.92 | 7.92 | 8.13 | 8.40 | 8.29 | |||||||||||||||||||||||||||
| Net interest rate spread | 3.19 | 3.18 | 3.08 | 2.88 | 2.80 | |||||||||||||||||||||||||||
| Net interest margin | 3.36 | 3.29 | 3.18 | 2.99 | 2.93 | |||||||||||||||||||||||||||
| Operating expenses to average assets | 1.87 | 1.92 | 1.95 | 2.15 | 1.98 | |||||||||||||||||||||||||||
Efficiency ratio (5) | 53.10 | 59.65 | 61.77 | 72.04 | 67.43 | |||||||||||||||||||||||||||
| Loans-to-deposits | 97.60 | 95.90 | 90.60 | 88.60 | 83.71 | |||||||||||||||||||||||||||
| For the Nine Months Ended September 30, | ||||||||||||||
| 2022 | 2021 | |||||||||||||
| Performance Ratios (Annualized): | ||||||||||||||
Return on average assets (3) | 0.99 | % | 0.98 | % | ||||||||||
Return on average tangible assets (3) (4) | 1.03 | 1.02 | ||||||||||||
Return on average stockholders’ equity (3) | 7.87 | 7.49 | ||||||||||||
Return on average tangible stockholders’ equity (3) (4) | 11.91 | 11.46 | ||||||||||||
| Net interest rate spread | 3.15 | 2.77 | ||||||||||||
| Net interest margin | 3.28 | 2.91 | ||||||||||||
| Operating expenses to average assets | 1.91 | 1.87 | ||||||||||||
Efficiency ratio (5) | 57.90 | 60.62 | ||||||||||||
23
(continued)
| At or For the Three Months Ended | ||||||||||||||||||||||||||||||||
| September 30, | June 30, | March 31, | December 31, | September 30, | ||||||||||||||||||||||||||||
| 2022 | 2022 | 2022 | 2021 | 2021 | ||||||||||||||||||||||||||||
| Trust and Asset Management: | ||||||||||||||||||||||||||||||||
| Wealth assets under administration and management (“AUA/M”) | $ | 273,815 | $ | 279,222 | $ | 296,818 | $ | 287,404 | $ | 274,807 | ||||||||||||||||||||||
| Nest Egg AUA/M | 402,256 | 398,344 | 415,478 | 428,558 | 423,563 | |||||||||||||||||||||||||||
| Total AUA/M | 676,071 | 677,566 | 712,296 | 715,962 | 698,370 | |||||||||||||||||||||||||||
| Per Share Data: | ||||||||||||||||||||||||||||||||
| Cash dividends per common share | $ | 0.20 | $ | 0.17 | $ | 0.17 | $ | 0.17 | $ | 0.17 | ||||||||||||||||||||||
| Stockholders' equity per common share at end of period | 26.04 | 25.73 | 25.58 | 25.63 | 25.47 | |||||||||||||||||||||||||||
Tangible common equity per common share at end of period (4) (5) | 16.30 | 15.96 | 15.94 | 15.93 | 15.78 | |||||||||||||||||||||||||||
| Common shares outstanding at end of period | 59,138,507 | 59,130,236 | 59,388,983 | 59,175,046 | 59,417,266 | |||||||||||||||||||||||||||
| Preferred shares outstanding at end of period | 57,370 | 57,370 | 57,370 | 57,370 | 57,370 | |||||||||||||||||||||||||||
| Number of full-service customer facilities: | 38 | 38 | 38 | 47 | 58 | |||||||||||||||||||||||||||
| Quarterly Average Balances | ||||||||||||||||||||||||||||||||
| Total securities | $ | 1,748,687 | $ | 1,811,869 | $ | 1,846,452 | $ | 1,710,143 | $ | 1,542,630 | ||||||||||||||||||||||
| Loans receivable, net | 9,512,447 | 9,204,583 | 8,796,861 | 8,297,395 | 7,864,720 | |||||||||||||||||||||||||||
| Total interest-earning assets | 11,326,782 | 11,083,892 | 10,732,139 | 10,706,190 | 10,461,147 | |||||||||||||||||||||||||||
| Total goodwill and core deposit intangible | 521,566 | 522,666 | 518,106 | 519,401 | 520,765 | |||||||||||||||||||||||||||
| Total assets | 12,517,955 | 12,251,985 | 11,947,210 | 11,953,610 | 11,738,037 | |||||||||||||||||||||||||||
| Time deposits | 1,467,297 | 937,387 | 767,709 | 819,025 | 904,384 | |||||||||||||||||||||||||||
| Total deposits (including non-interest-bearing deposits) | 10,066,342 | 9,665,200 | 9,944,352 | 9,937,607 | 9,699,033 | |||||||||||||||||||||||||||
| Total borrowings | 643,294 | 837,164 | 375,578 | 361,500 | 371,189 | |||||||||||||||||||||||||||
| Total interest-bearing liabilities | 8,380,936 | 8,174,240 | 7,918,133 | 7,831,519 | 7,494,099 | |||||||||||||||||||||||||||
| Non-interest bearing deposits | 2,328,700 | 2,328,124 | 2,401,797 | 2,467,588 | 2,576,123 | |||||||||||||||||||||||||||
| Stockholders' equity | 1,541,755 | 1,534,721 | 1,527,839 | 1,519,976 | 1,519,488 | |||||||||||||||||||||||||||
| Tangible stockholders’ equity | 1,020,189 | 1,012,055 | 1,009,733 | 1,000,575 | 998,723 | |||||||||||||||||||||||||||
| Quarterly Yields and Costs | ||||||||||||||||||||||||||||||||
| Total securities | 2.27 | % | 1.90 | % | 1.86 | % | 1.57 | % | 1.57 | % | ||||||||||||||||||||||
| Loans receivable, net | 4.18 | 3.95 | 3.79 | 3.89 | 3.98 | |||||||||||||||||||||||||||
| Total interest-earning assets | 3.88 | 3.60 | 3.43 | 3.28 | 3.24 | |||||||||||||||||||||||||||
| Time deposits | 1.53 | 0.97 | 0.77 | 0.84 | 0.94 | |||||||||||||||||||||||||||
| Total cost of deposits (including non-interest-bearing deposits) | 0.36 | 0.18 | 0.16 | 0.20 | 0.22 | |||||||||||||||||||||||||||
| Total borrowed funds | 3.27 | 2.06 | 2.93 | 3.14 | 3.11 | |||||||||||||||||||||||||||
| Total interest-bearing liabilities | 0.69 | 0.42 | 0.35 | 0.40 | 0.44 | |||||||||||||||||||||||||||
| Net interest spread | 3.19 | 3.18 | 3.08 | 2.88 | 2.80 | |||||||||||||||||||||||||||
| Net interest margin | 3.36 | 3.29 | 3.18 | 2.99 | 2.93 | |||||||||||||||||||||||||||
(1) With the exception of end of quarter ratios, all ratios are based on average daily balances.
(2) Performance ratios for each period are presented on a GAAP basis and include non-core operations. Refer to “Non-GAAP Reconciliation.”
(3) Ratios for each period are based on net income available to common stockholders.
(4) Tangible stockholders’ equity and tangible assets exclude intangible assets related to goodwill and core deposit intangible. Tangible common equity excludes goodwill, core deposit intangible and preferred equity. Refer to “Non-GAAP Reconciliation.”
(5) Efficiency ratio represents the ratio of operating expenses to the aggregate of other income and net interest income.
24
OceanFirst Financial Corp.
OTHER ITEMS
(dollars in thousands, except per share amounts)
NON-GAAP RECONCILIATION
| For the Three Months Ended | ||||||||||||||||||||||||||||||||
| September 30, | June 30, | March 31, | December 31, | September 30, | ||||||||||||||||||||||||||||
| 2022 | 2022 | 2022 | 2021 | 2021 | ||||||||||||||||||||||||||||
| Core Earnings: | ||||||||||||||||||||||||||||||||
Net income available to common stockholders (GAAP) | $ | 37,607 | $ | 27,957 | $ | 24,755 | $ | 21,653 | $ | 23,163 | ||||||||||||||||||||||
| Add (less) non-recurring and non-core items: | ||||||||||||||||||||||||||||||||
| Merger related expenses | 298 | 196 | 1,965 | 451 | 225 | |||||||||||||||||||||||||||
Branch consolidation (benefit) expense, net (1) | (346) | 546 | 402 | 7,286 | 4,014 | |||||||||||||||||||||||||||
| Net (gain) loss on equity investments | (3,362) | 8,078 | 2,786 | 1,252 | 466 | |||||||||||||||||||||||||||
| Income tax expense (benefit) on items | 824 | (2,132) | (1,141) | (2,144) | (1,138) | |||||||||||||||||||||||||||
Core earnings (Non-GAAP) | $ | 35,021 | $ | 34,645 | $ | 28,767 | $ | 28,498 | $ | 26,730 | ||||||||||||||||||||||
| Income tax expense | $ | 12,298 | $ | 8,940 | $ | 7,974 | $ | 4,078 | $ | 7,354 | ||||||||||||||||||||||
| Credit loss provision (benefit) | 1,016 | 1,254 | 1,851 | (1,573) | (3,179) | |||||||||||||||||||||||||||
| Less: income tax expense (benefit) on non-core items | 824 | (2,132) | (1,141) | (2,144) | (1,138) | |||||||||||||||||||||||||||
Core earnings PTPP (Non-GAAP) | $ | 47,511 | $ | 46,971 | $ | 39,733 | $ | 33,147 | $ | 32,043 | ||||||||||||||||||||||
| Core earnings diluted earnings per share | $ | 0.60 | $ | 0.59 | $ | 0.49 | $ | 0.48 | $ | 0.45 | ||||||||||||||||||||||
| Core earnings PTPP diluted earnings per share | $ | 0.81 | $ | 0.80 | $ | 0.67 | $ | 0.56 | $ | 0.54 | ||||||||||||||||||||||
| Core Ratios (Annualized): | ||||||||||||||||||||||||||||||||
| Return on average assets | 1.11 | % | 1.13 | % | 0.98 | % | 0.95 | % | 0.90 | % | ||||||||||||||||||||||
| Return on average tangible stockholders’ equity | 13.62 | 13.73 | 11.55 | 11.30 | 10.62 | |||||||||||||||||||||||||||
| Efficiency ratio | 54.80 | 54.43 | 57.51 | 62.57 | 62.22 | |||||||||||||||||||||||||||
(1) Includes $2.0 million of gains related to the sale of two branches for the three months ended December 31, 2021. | ||||||||||||||||||||||||||||||||
25
(continued)
| For the Nine Months Ended September 30, | ||||||||||||||
| 2022 | 2021 | |||||||||||||
| Core Earnings: | ||||||||||||||
Net income available to common stockholders (GAAP) | $ | 90,319 | $ | 84,407 | ||||||||||
| Add (less) non-recurring and non-core items: | ||||||||||||||
| Merger related expenses | 2,459 | 1,052 | ||||||||||||
| Branch consolidation expense, net | 602 | 5,051 | ||||||||||||
| Net loss (gain) on equity investments | 7,502 | (8,397) | ||||||||||||
| Income tax (benefit) expense on items | (2,449) | 554 | ||||||||||||
Core earnings (Non-GAAP) | $ | 98,433 | $ | 82,667 | ||||||||||
| Income tax expense | $ | 29,212 | $ | 28,087 | ||||||||||
| Credit loss provision (benefit) | 4,121 | (10,259) | ||||||||||||
| Less: income tax expense (benefit) on non-core items | (2,449) | 554 | ||||||||||||
Core earnings PTPP (Non-GAAP) | $ | 134,215 | $ | 99,941 | ||||||||||
| Core diluted earnings per share | $ | 1.67 | $ | 1.38 | ||||||||||
| Core earnings PTPP diluted earnings per share | $ | 2.28 | $ | 1.67 | ||||||||||
| Core Ratios (Annualized): | ||||||||||||||
| Return on average assets | 1.08 | % | 0.95 | % | ||||||||||
| Return on average tangible stockholders’ equity | 12.98 | 11.23 | ||||||||||||
| Efficiency ratio | 55.51 | 60.23 | ||||||||||||
26
(continued)
| September 30, | June 30, | March 31, | December 31, | September 30, | ||||||||||||||||||||||||||||
| 2022 | 2022 | 2022 | 2021 | 2021 | ||||||||||||||||||||||||||||
| Tangible Equity: | ||||||||||||||||||||||||||||||||
| Total stockholders' equity | $ | 1,540,216 | $ | 1,521,432 | $ | 1,519,334 | $ | 1,516,553 | $ | 1,513,249 | ||||||||||||||||||||||
| Less: | ||||||||||||||||||||||||||||||||
| Goodwill | 506,146 | 506,146 | 500,319 | 500,319 | 500,319 | |||||||||||||||||||||||||||
| Core deposit intangible | 14,656 | 15,827 | 17,005 | 18,215 | 19,558 | |||||||||||||||||||||||||||
| Tangible stockholders' equity | 1,019,414 | 999,459 | 1,002,010 | 998,019 | 993,372 | |||||||||||||||||||||||||||
| Less: | ||||||||||||||||||||||||||||||||
| Preferred stock | 55,527 | 55,527 | 55,527 | 55,527 | 55,527 | |||||||||||||||||||||||||||
| Tangible common equity | $ | 963,887 | $ | 943,932 | $ | 946,483 | $ | 942,492 | $ | 937,845 | ||||||||||||||||||||||
| Tangible Assets: | ||||||||||||||||||||||||||||||||
| Total assets | $ | 12,683,453 | $ | 12,438,653 | $ | 12,164,945 | $ | 11,739,616 | $ | 11,829,688 | ||||||||||||||||||||||
| Less: | ||||||||||||||||||||||||||||||||
| Goodwill | 506,146 | 506,146 | 500,319 | 500,319 | 500,319 | |||||||||||||||||||||||||||
| Core deposit intangible | 14,656 | 15,827 | 17,005 | 18,215 | 19,558 | |||||||||||||||||||||||||||
| Tangible assets | $ | 12,162,651 | $ | 11,916,680 | $ | 11,647,621 | $ | 11,221,082 | $ | 11,309,811 | ||||||||||||||||||||||
| Tangible stockholders' equity to tangible assets | 8.38 | % | 8.39 | % | 8.60 | % | 8.89 | % | 8.78 | % | ||||||||||||||||||||||
| Tangible common equity to tangible assets | 7.92 | % | 7.92 | % | 8.13 | % | 8.40 | % | 8.29 | % | ||||||||||||||||||||||
27
(continued)
SUPPLEMENTAL INFORMATION ON TRIDENT
| For the Three Months Ended, | For the Nine Months Ended, | |||||||||||||||||||
| September 30, 2022 | June 30, 2022 | September 30, 2022 | ||||||||||||||||||
| GAAP Measures: | ||||||||||||||||||||
| Net interest income | $ | 95,965 | $ | 90,797 | $ | 270,989 | ||||||||||||||
| Other income | 15,150 | 7,541 | 31,543 | |||||||||||||||||
| Total income | 111,115 | 98,338 | 302,532 | |||||||||||||||||
Less: income attributable to Trident (1) | 3,259 | 4,510 | 7,769 | |||||||||||||||||
| Total income, excluding Trident | 107,856 | 93,828 | 294,763 | |||||||||||||||||
| Total operating expense | 58,997 | 58,661 | 175,153 | |||||||||||||||||
Less: expense attributable to Trident (2) | 2,777 | 3,206 | 5,983 | |||||||||||||||||
| Total operating expense, excluding Trident | 56,220 | 55,455 | 169,170 | |||||||||||||||||
| Efficiency ratio | 53.10 | % | 59.65 | % | 57.90 | % | ||||||||||||||
| Efficiency ratio, excluding Trident | 52.13 | 59.10 | 57.39 | |||||||||||||||||
| Core Measures (non-GAAP): | ||||||||||||||||||||
| Net interest income | $ | 95,965 | $ | 90,797 | $ | 270,989 | ||||||||||||||
| Other income | 11,788 | 15,619 | 39,045 | |||||||||||||||||
| Total income | 107,753 | 106,416 | 310,034 | |||||||||||||||||
Less: income attributable to Trident (1) | 3,259 | 4,510 | 7,769 | |||||||||||||||||
| Total core income, excluding Trident | 104,494 | 101,906 | 302,265 | |||||||||||||||||
| Core operating expense | 59,045 | 57,919 | 172,092 | |||||||||||||||||
Less: expense attributable to Trident (2) | 2,777 | 3,206 | 5,983 | |||||||||||||||||
| Total operating expense, excluding Trident | 56,268 | 54,713 | 166,109 | |||||||||||||||||
| Core efficiency ratio | 54.80 | % | 54.43 | % | 55.51 | % | ||||||||||||||
| Core efficiency ratio, excluding Trident | 53.85 | 53.69 | 54.95 | |||||||||||||||||
(1) Trident title-related activity is primarily included in fees and service charges in the Consolidated Statements of Income.
(2) Trident operating expenses are primarily included in compensation and employee benefits and other operating expenses in the Consolidated Statements of Income.
28
. . . 1 The 3Q 2022 Investor Presentation should be read in conjunction with the Earnings Release furnished as Exhibit 99.1 to Form 8-K filed with the SEC on October 24, 2022. Exhibit 99.2 OceanFirst Financial Corp. 3Q 2022 Investor Presentation1 October 2022
. . .Legal Disclaimer FORWARD LOOKING STATEMENTS. In addition to historical information, this news release contains certain forward-looking statements within the meaning of the Private Securities Litigation Reform Act of 1995, which are based on certain assumptions and describe future plans, strategies and expectations of the Company. These forward-looking statements are generally identified by use of the words “believe,” “expect,” “intend,” “anticipate,” “estimate,” “project,” “will,” “should,” “may,” “view,” “opportunity,” “potential,” or similar expressions or expressions of confidence. The Company’s ability to predict results or the actual effect of future plans or strategies is inherently uncertain. Factors which could have a material adverse effect on the operations of the Company and its subsidiaries include, but are not limited to: management plans relating to the proposed transaction with Partners Bancorp (the “Transaction”); the ability to complete the Transaction; the ability to obtain any required regulatory, stockholder or other approvals, authorizations or consents; the expected timing of the completion of the Transaction; any statements of the plans and objectives of management for future operations, products or services, including the execution of integration plans relating to the Transaction; the continuing impact of the COVID-19 or any other pandemic on our operations and financial results and those of our customers, changes in interest rates, inflation, general economic conditions, levels of unemployment in the Bank’s lending area, real estate market values in the Bank’s lending area, future natural disasters and increases to flood insurance premiums, the current or potential impact of military conflict, terrorism or other geopolitical events, the level of prepayments on loans and mortgage-backed securities, legislative/regulatory changes, monetary and fiscal policies of the U.S. Government including policies of the U.S. Treasury and the Board of Governors of the Federal Reserve System, the quality or composition of the loan or investment portfolios, demand for loan products, deposit flows, competition, demand for financial services in the Company’s market area, change in accounting principles, a failure in or breach of the Company’s operational or security systems or infrastructure, including cyberattacks; and guidelines and the Bank’s ability to successfully integrate acquired operations. These risks and uncertainties are further discussed in the Company’s Annual Report on Form 10-K for the year ended December 31, 2021, under Item 1A - Risk Factors and elsewhere, and in subsequent securities filings and should be considered in evaluating forward-looking statements and undue reliance should not be placed on such statements. The Company does not undertake, and specifically disclaims any obligation, to publicly release the result of any revisions which may be made to any forward-looking statements to reflect events or circumstances after the date of such statements or to reflect the occurrence of anticipated or unanticipated events. NON-GAAP FINANCIAL INFORMATION. This presentation contains certain non-GAAP (generally accepted accounting principles) measures. These non-GAAP measures, as calculated by the Company, are not necessarily comparable to similarly titled measures reported by other companies. Additionally, these non-GAAP measures are not measures of financial performance or liquidity under GAAP and should not be considered alternatives to the Company's other financial information determined under GAAP. See reconciliations of certain non-GAAP measures included in the Company’s Earnings Release furnished as Exhibit 99.1 to Form 8-K as filed with the SEC on October 24, 2022. MARKET AND INDUSTRY DATA. This presentation references certain market, industry and demographic data, forecasts and other statistical information. We have obtained this data, forecasts and information from various independent, third-party industry sources and publications. Nothing in the data, forecasts or information used or derived from third party sources should be construed as advice. Some data and other information are also based on our good faith estimates, which are derived from our review of industry publications and surveys and independent sources. We believe that these sources and estimates are reliable but have not independently verified them. Statements as to our market position are based on market data currently available to us. These estimates involve inherent risks and uncertainties and are based on assumptions that are subject to change. 2
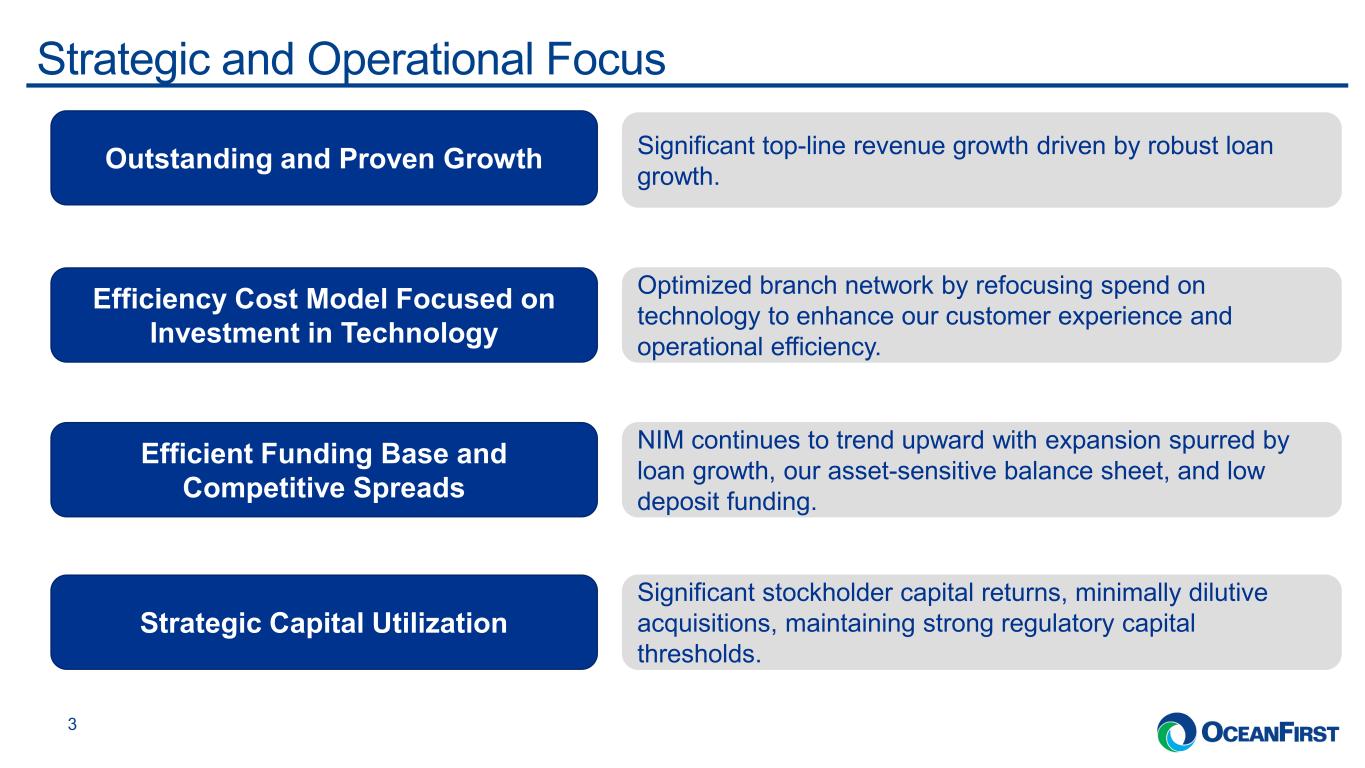
. . .Strategic and Operational Focus 3 Outstanding and Proven Growth Efficiency Cost Model Focused on Investment in Technology Efficient Funding Base and Competitive Spreads Strategic Capital Utilization Significant top-line revenue growth driven by robust loan growth. Optimized branch network by refocusing spend on technology to enhance our customer experience and operational efficiency. NIM continues to trend upward with expansion spurred by loan growth, our asset-sensitive balance sheet, and low deposit funding. Significant stockholder capital returns, minimally dilutive acquisitions, maintaining strong regulatory capital thresholds.
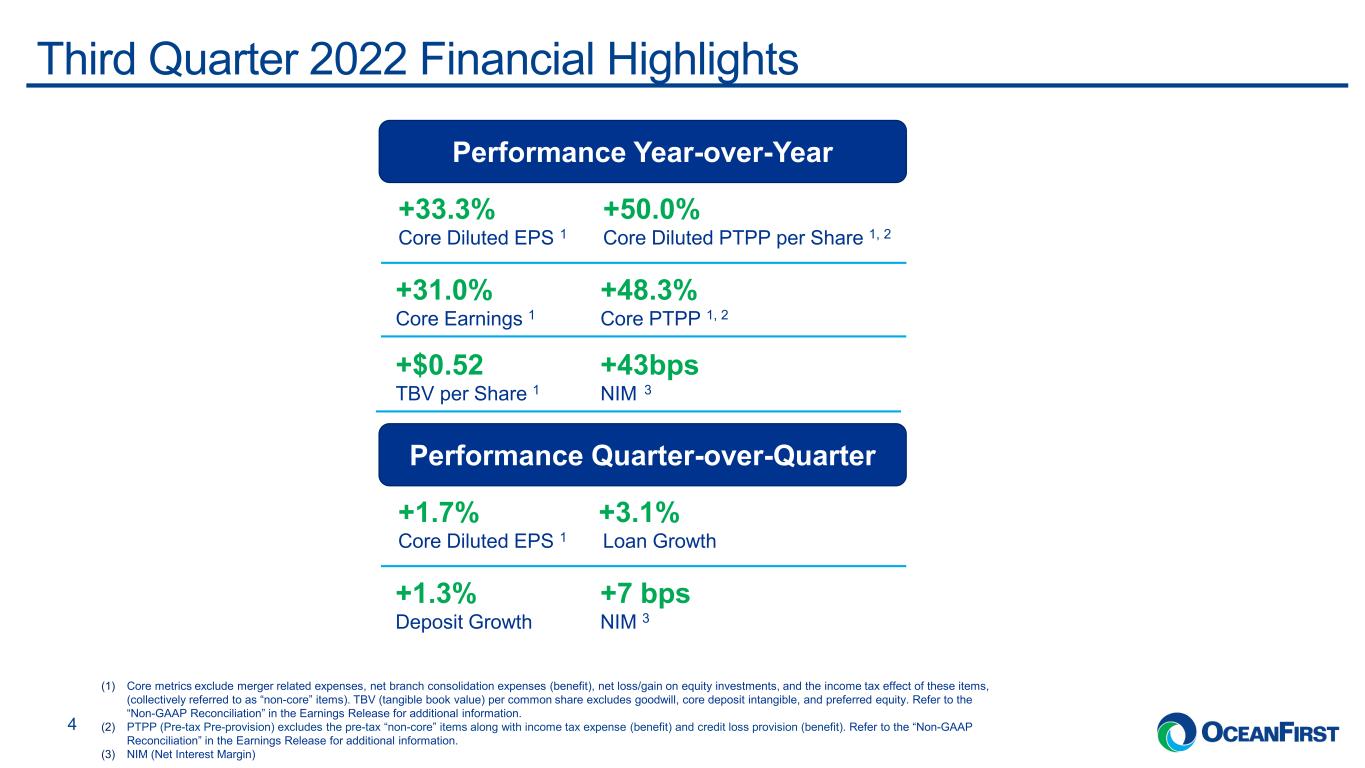
. . .Third Quarter 2022 Financial Highlights 4 Performance Year-over-Year (1) Core metrics exclude merger related expenses, net branch consolidation expenses (benefit), net loss/gain on equity investments, and the income tax effect of these items, (collectively referred to as “non-core” items). TBV (tangible book value) per common share excludes goodwill, core deposit intangible, and preferred equity. Refer to the “Non-GAAP Reconciliation” in the Earnings Release for additional information. (2) PTPP (Pre-tax Pre-provision) excludes the pre-tax “non-core” items along with income tax expense (benefit) and credit loss provision (benefit). Refer to the “Non-GAAP Reconciliation” in the Earnings Release for additional information. (3) NIM (Net Interest Margin) +33.3% +50.0% Core Diluted EPS 1 Core Diluted PTPP per Share 1, 2 +31.0% +48.3% Core Earnings 1 Core PTPP 1, 2 +$0.52 +43bps TBV per Share 1 NIM 3 Performance Quarter-over-Quarter +1.7% +3.1% Core Diluted EPS 1 Loan Growth +1.3% +7 bps Deposit Growth NIM 3
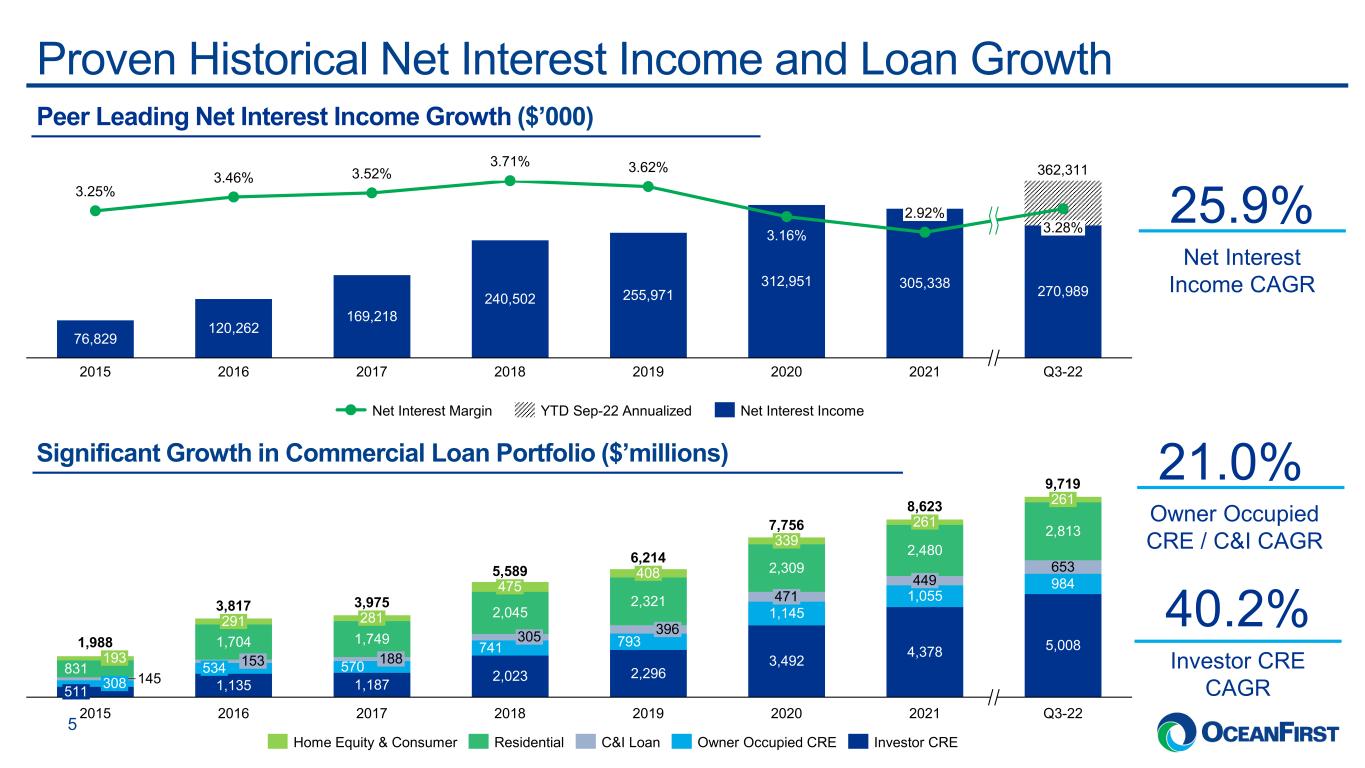
. . .Proven Historical Net Interest Income and Loan Growth 5 76,829 120,262 169,218 240,502 255,971 312,951 305,338 270,989 Q3-222017 3.25% 2015 3.71% 2016 3.46% 3.52% 3.62% 2018 2019 3.16% 362,311 2020 2.92% 2021 3.28% YTD Sep-22 AnnualizedNet Interest Margin Net Interest Income Peer Leading Net Interest Income Growth ($’000) Net Interest Income CAGR 25.9% 1,135 1,187 2,023 2,296 3,492 4,378 5,008 570 741 793 1,145 1,055 984 145 653 831 1,704 1,749 2,045 2,321 2,309 2,480 2,813 1,988 308 291 193 5,589 534 9,719 2015 153 3,975 261 339 408 511 2016 281 Q3-22 188 6,214 201920182017 475 305 396 471 2020 3,817 261 449 2021 7,756 8,623 C&I LoanResidentialHome Equity & Consumer Investor CREOwner Occupied CRE Significant Growth in Commercial Loan Portfolio ($’millions) Investor CRE CAGR 40.2% Owner Occupied CRE / C&I CAGR 21.0%
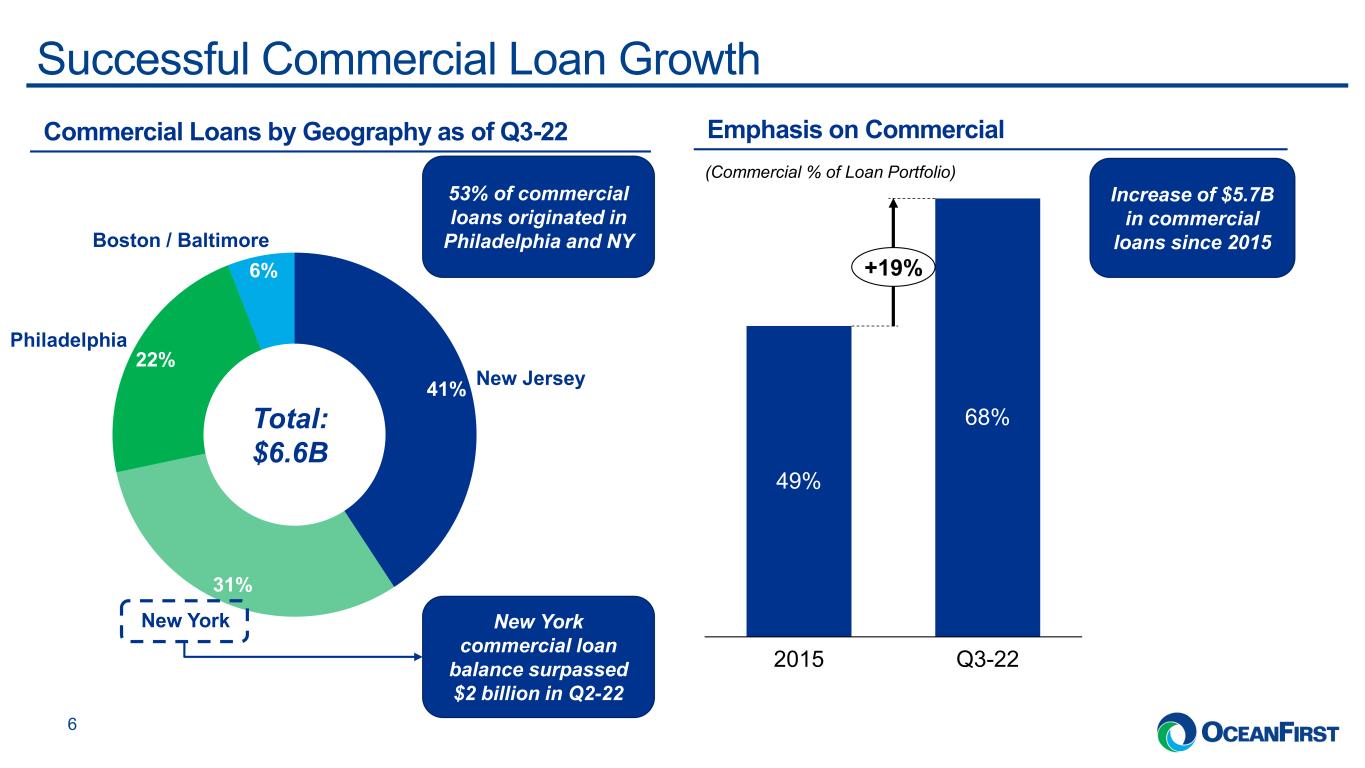
. . .Successful Commercial Loan Growth 6 Q3-22 68% 2015 49% +19% (Commercial % of Loan Portfolio) Commercial Loans by Geography as of Q3-22 53% of commercial loans originated in Philadelphia and NY Emphasis on Commercial Increase of $5.7B in commercial loans since 2015 41% 31% 22% 6% New Jersey New York Boston / Baltimore Philadelphia Total: $6.6B New York commercial loan balance surpassed $2 billion in Q2-22
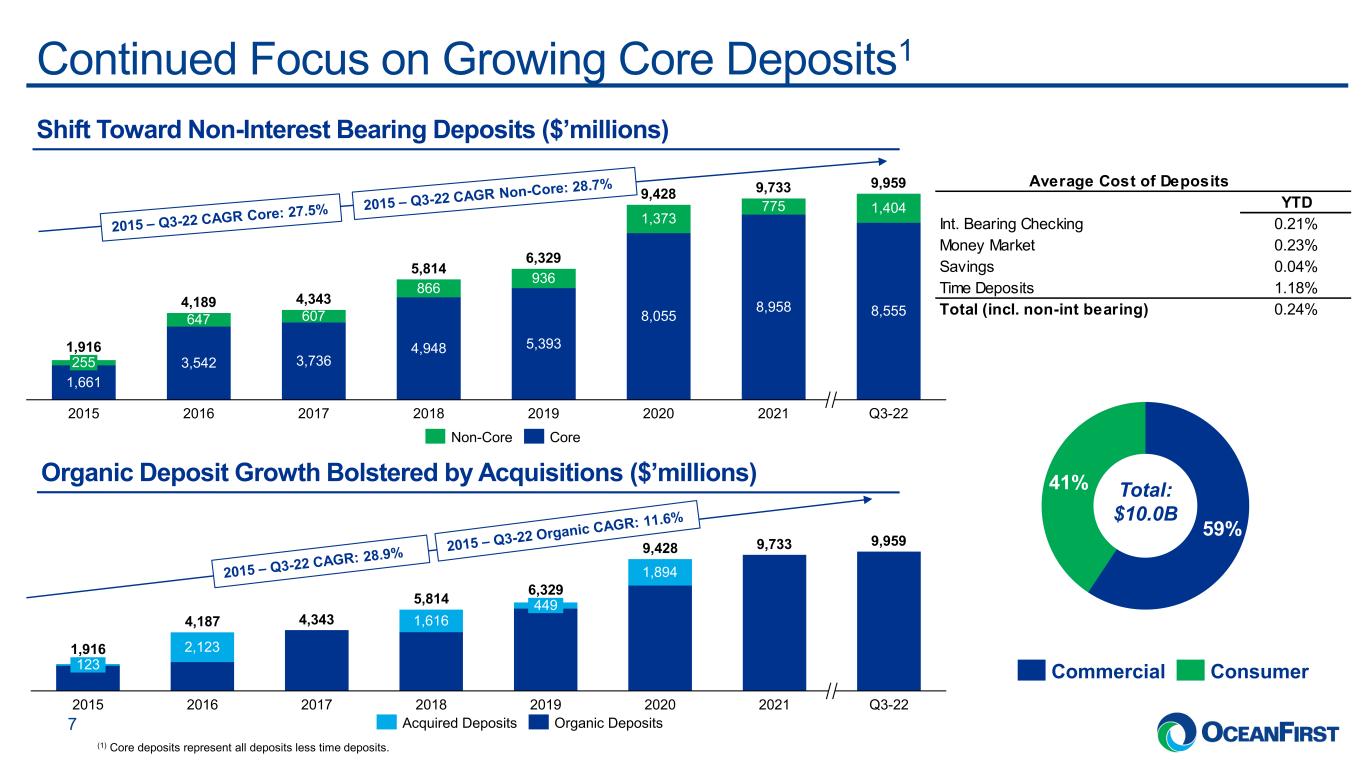
. . .Continued Focus on Growing Core Deposits1 7 Shift Toward Non-Interest Bearing Deposits ($’millions) 1,661 3,542 3,736 4,948 5,393 8,055 8,958 8,555647 607 866 936 1,373 775 1,404 20212016 255 2015 6,329 20192017 2018 2020 Q3-22 1,916 4,189 4,343 5,814 9,428 9,733 9,959 Non-Core Core (1) Core deposits represent all deposits less time deposits. Organic Deposit Growth Bolstered by Acquisitions ($’millions) 4,343 9,733 9,959 2,123 1,616 1,894 20182016 123 20172015 449 2019 2020 2021 Q3-22 1,916 4,187 5,814 6,329 9,428 Acquired Deposits Organic Deposits 59% 41% Commercial Consumer Total: $10.0B Average Cost of Deposits YTD Int. Bearing Checking 0.21% Money Market 0.23% Savings 0.04% Time Deposits 1.18% Total (incl. non-int bearing) 0.24%
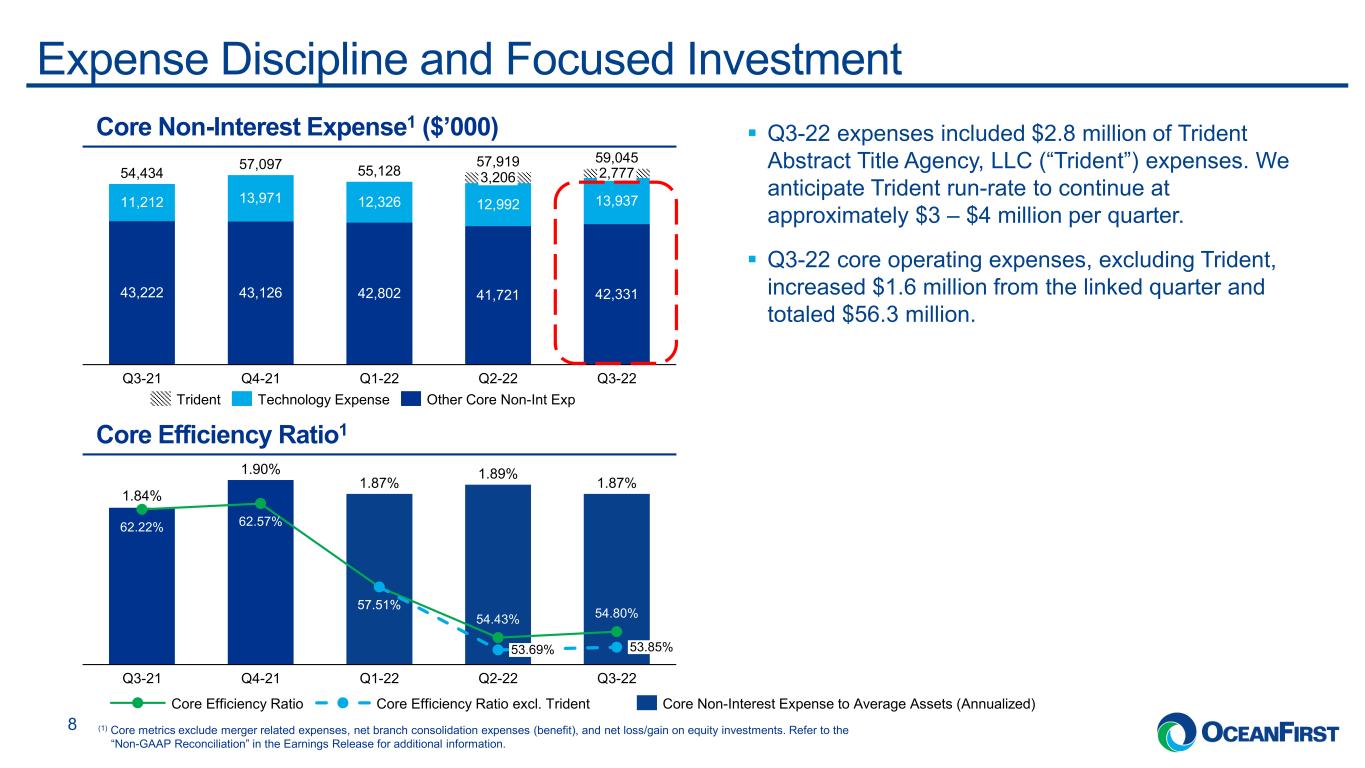
. . . Core Efficiency Ratio1 Expense Discipline and Focused Investment 8 Core Non-Interest Expense1 ($’000) 43,222 43,126 42,802 41,721 42,331 11,212 13,971 12,326 12,992 13,937 Q4-21 Q2-22 3,206 Q3-21 54,434 Q1-22 Q3-22 57,097 2,77755,128 57,919 59,045 Trident Technology Expense Other Core Non-Int Exp 57.51% 53.69% 62.22% Q3-21 62.57% Q1-22Q4-21 54.43% Q2-22 54.80% 53.85% Q3-22 1.84% 1.90% 1.87% 1.89% 1.87% Core Efficiency Ratio Core Non-Interest Expense to Average Assets (Annualized)Core Efficiency Ratio excl. Trident (1) Core metrics exclude merger related expenses, net branch consolidation expenses (benefit), and net loss/gain on equity investments. Refer to the “Non-GAAP Reconciliation” in the Earnings Release for additional information. Q3-22 expenses included $2.8 million of Trident Abstract Title Agency, LLC (“Trident”) expenses. We anticipate Trident run-rate to continue at approximately $3 – $4 million per quarter. Q3-22 core operating expenses, excluding Trident, increased $1.6 million from the linked quarter and totaled $56.3 million.
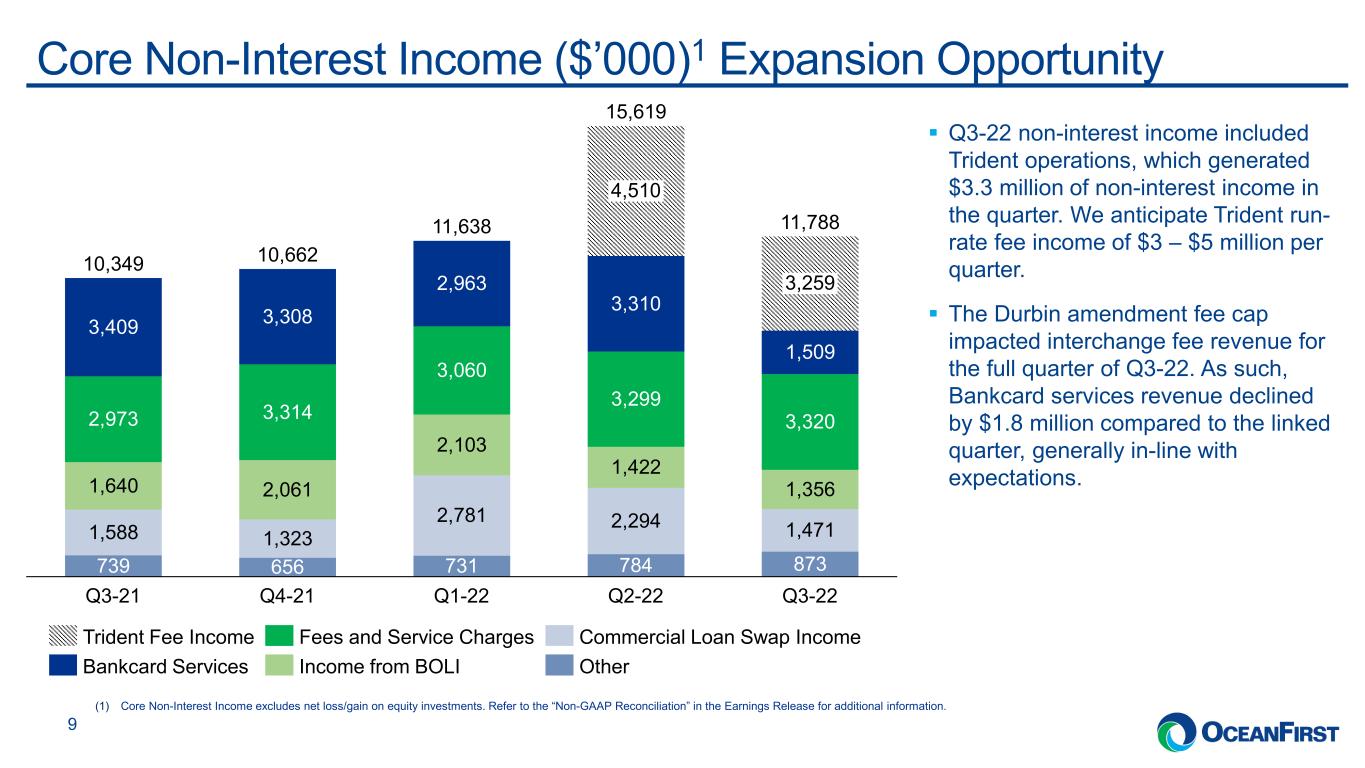
. . .Core Non-Interest Income ($’000)1 Expansion Opportunity 9 Q3-22 non-interest income included Trident operations, which generated $3.3 million of non-interest income in the quarter. We anticipate Trident run- rate fee income of $3 – $5 million per quarter. The Durbin amendment fee cap impacted interchange fee revenue for the full quarter of Q3-22. As such, Bankcard services revenue declined by $1.8 million compared to the linked quarter, generally in-line with expectations. 739 656 731 784 873 1,588 1,323 2,781 2,294 1,471 1,640 2,061 2,103 1,422 1,356 2,973 3,314 3,060 3,299 3,320 3,409 3,308 2,963 3,310 1,509 3,259 10,349 Q3-22Q3-21 Q4-21 Q2-22Q1-22 4,510 10,662 11,638 15,619 11,788 Fees and Service ChargesTrident Fee Income Bankcard Services Commercial Loan Swap Income Income from BOLI Other (1) Core Non-Interest Income excludes net loss/gain on equity investments. Refer to the “Non-GAAP Reconciliation” in the Earnings Release for additional information.
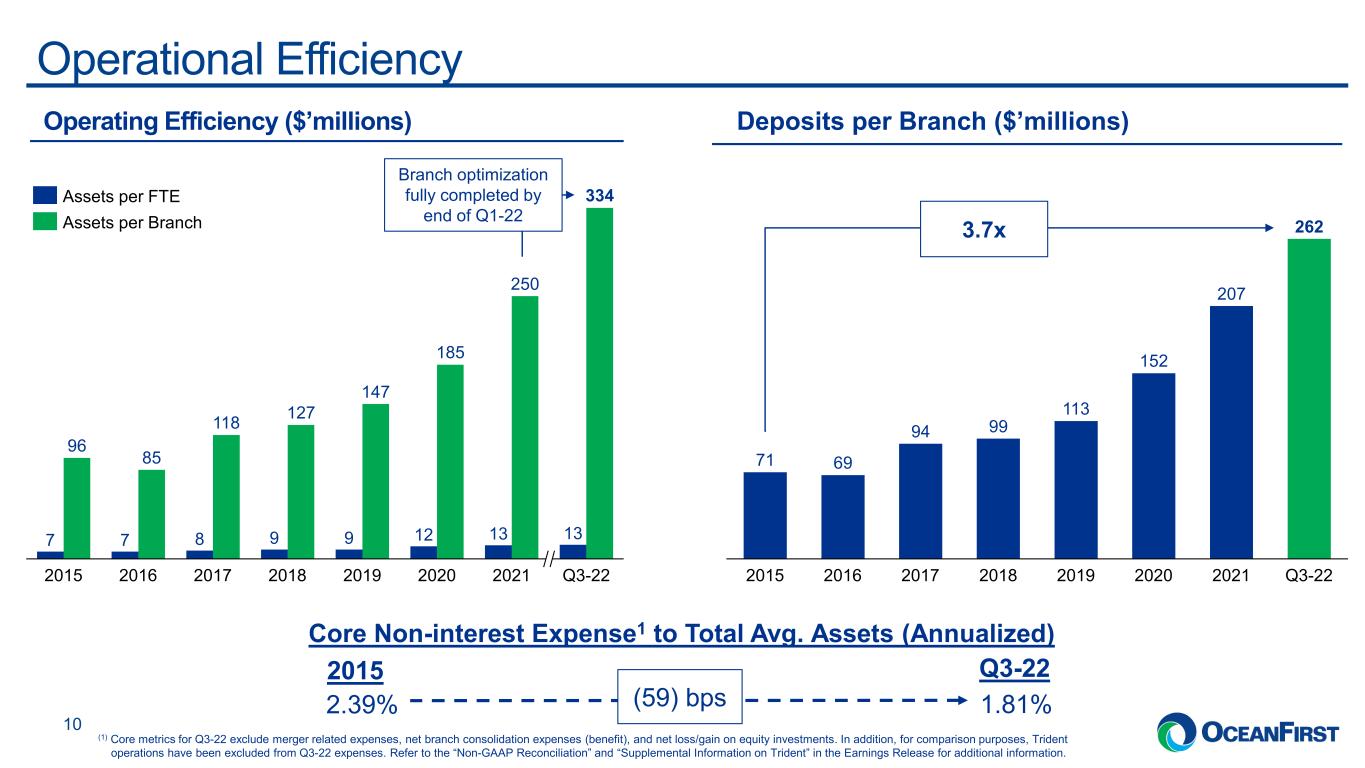
. . .Operational Efficiency 10 Deposits per Branch ($’millions) (59) bps2.39% 1.81% 2015 Q3-22 Core Non-interest Expense1 to Total Avg. Assets (Annualized) 71 69 94 99 113 152 207 262 20212015 Q3-222016 2018 20192017 2020 3.7x Operating Efficiency ($’millions) Branch optimization fully completed by end of Q1-22 (1) Core metrics for Q3-22 exclude merger related expenses, net branch consolidation expenses (benefit), and net loss/gain on equity investments. In addition, for comparison purposes, Trident operations have been excluded from Q3-22 expenses. Refer to the “Non-GAAP Reconciliation” and “Supplemental Information on Trident” in the Earnings Release for additional information. 7 7 8 9 9 12 13 13 96 85 118 127 147 185 250 334 202120202015 20192017 Q3-222016 2018 Assets per FTE Assets per Branch
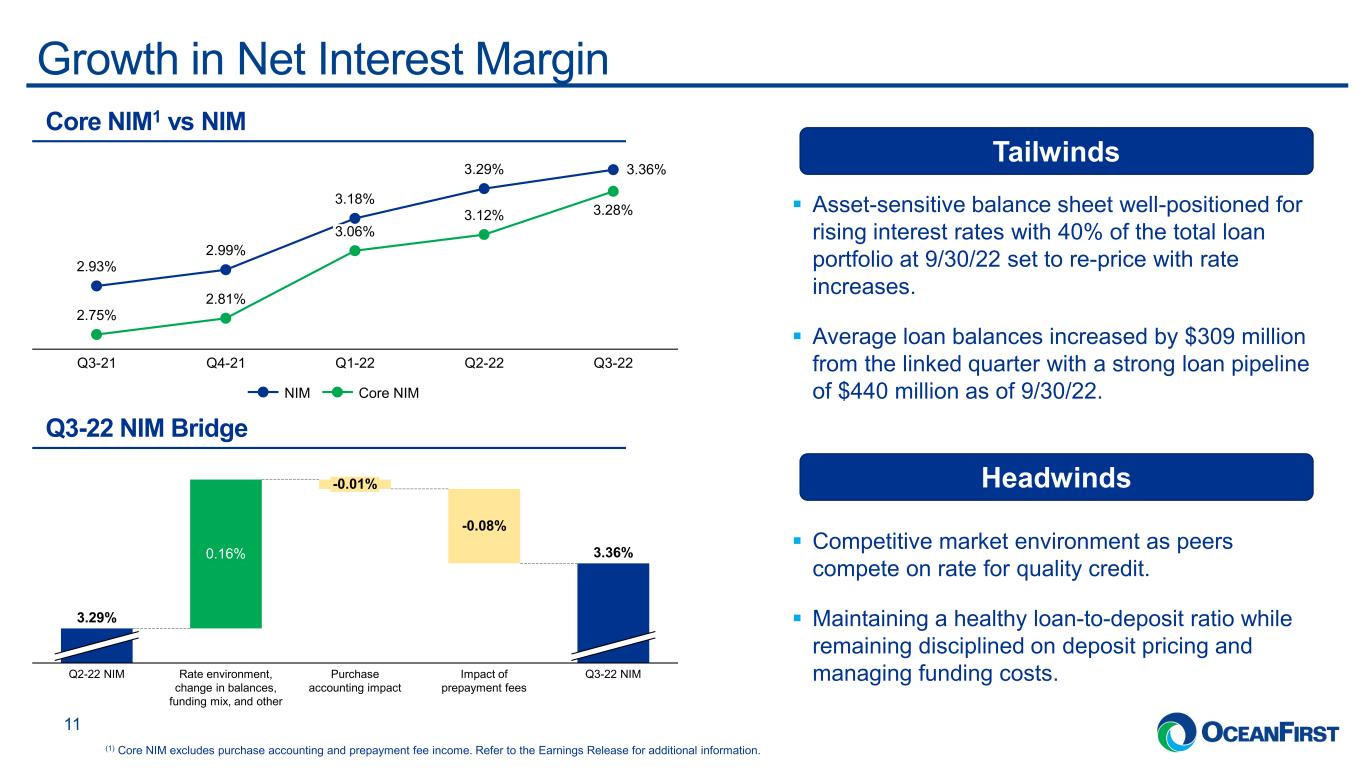
. . .Growth in Net Interest Margin 11 Asset-sensitive balance sheet well-positioned for rising interest rates with 40% of the total loan portfolio at 9/30/22 set to re-price with rate increases. Average loan balances increased by $309 million from the linked quarter with a strong loan pipeline of $440 million as of 9/30/22. Competitive market environment as peers compete on rate for quality credit. Maintaining a healthy loan-to-deposit ratio while remaining disciplined on deposit pricing and managing funding costs. (1) Core NIM excludes purchase accounting and prepayment fee income. Refer to the Earnings Release for additional information. Core NIM1 vs NIM Q3-22 NIM Bridge Headwinds Tailwinds 3.29% 0.16% Q2-22 NIM Rate environment, change in balances, funding mix, and other -0.01% Purchase accounting impact -0.08% Impact of prepayment fees Q3-22 NIM 3.36% Q3-22 3.28% 3.06% 3.18% 2.93% Q1-22 2.75% Q3-21 2.99% 2.81% Q4-21 3.29% 3.12% Q2-22 3.36% NIM Core NIM
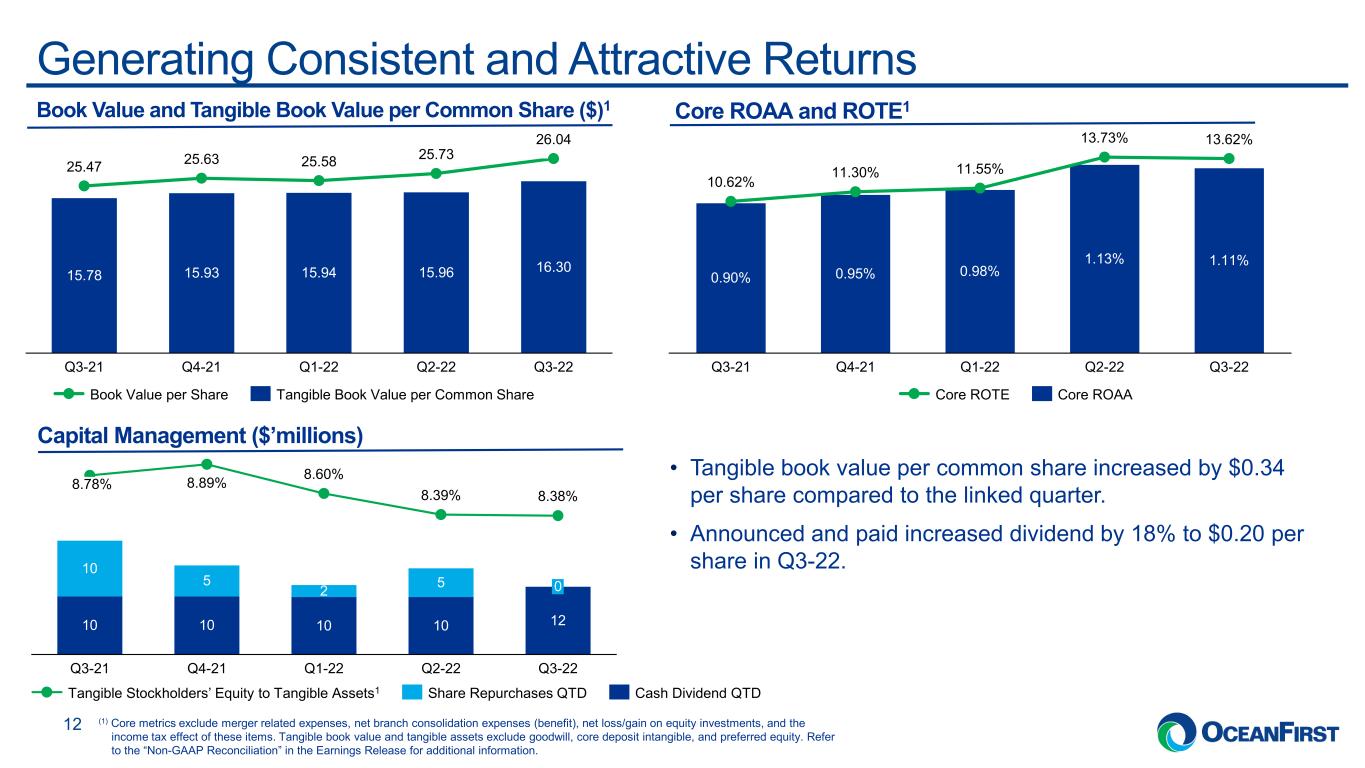
. . .Generating Consistent and Attractive Returns 12 Book Value and Tangible Book Value per Common Share ($)1 Core ROAA and ROTE1 • Tangible book value per common share increased by $0.34 per share compared to the linked quarter. • Announced and paid increased dividend by 18% to $0.20 per share in Q3-22. Capital Management ($’millions) 15.78 15.93 15.94 15.96 16.30 25.47 25.63 25.58 25.73 26.04 Q3-21 Q3-22Q2-22Q4-21 Q1-22 Book Value per Share Tangible Book Value per Common Share Q1-22Q3-21 0.95% 10.62% 0.90% 11.30% Q4-21 0.98% 11.55% 13.73% 1.13% Q2-22 13.62% 1.11% Q3-22 Core ROTE Core ROAA 10 10 10 10 12 10 5 2 5 Q4-21 8.78% Q3-21 8.89% Q1-22 8.60% Q2-22 8.38% 0 Q3-22 8.39% Share Repurchases QTDTangible Stockholders’ Equity to Tangible Assets1 Cash Dividend QTD (1) Core metrics exclude merger related expenses, net branch consolidation expenses (benefit), net loss/gain on equity investments, and the income tax effect of these items. Tangible book value and tangible assets exclude goodwill, core deposit intangible, and preferred equity. Refer to the “Non-GAAP Reconciliation” in the Earnings Release for additional information.
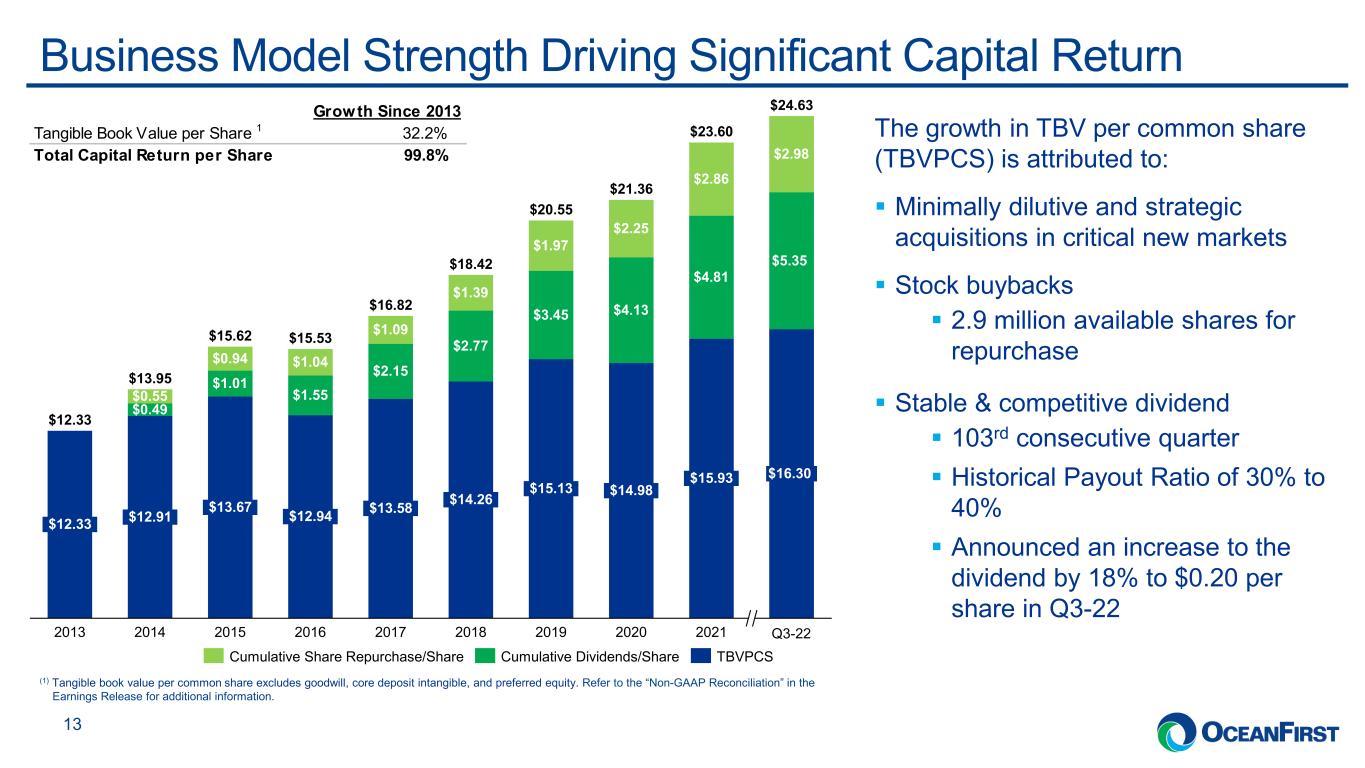
. . .Business Model Strength Driving Significant Capital Return 13 $0.49 $1.01 $1.55 $2.15 $2.77 $3.45 $4.13 $4.81 $5.35 $0.55 $0.94 $1.04 $1.09 $1.39 $1.97 $2.25 $2.86 $2.98 $12.33 Q3-222014 $13.67 $12.94 2016 $13.58 2017 $14.26 2018 $15.13 2019 $14.98 $13.95 2020 $15.93 2021 $16.30 $12.33 $15.62 $15.53 $16.82 $18.42 $20.55 $21.36 $24.63 2013 2015 $12.91 $23.60 Cumulative Dividends/ShareCumulative Share Repurchase/Share TBVPCS The growth in TBV per common share (TBVPCS) is attributed to: Minimally dilutive and strategic acquisitions in critical new markets Stock buybacks 2.9 million available shares for repurchase Stable & competitive dividend 103rd consecutive quarter Historical Payout Ratio of 30% to 40% Announced an increase to the dividend by 18% to $0.20 per share in Q3-22 (1) Tangible book value per common share excludes goodwill, core deposit intangible, and preferred equity. Refer to the “Non-GAAP Reconciliation” in the Earnings Release for additional information. Q3-22 Growth Since 2013 Tangible Book Value per Share 1 32.2% Total Capital Return per Share 99.8%
. . . I N V E S T O R P R E S E N T A T I O N 14 Appendix
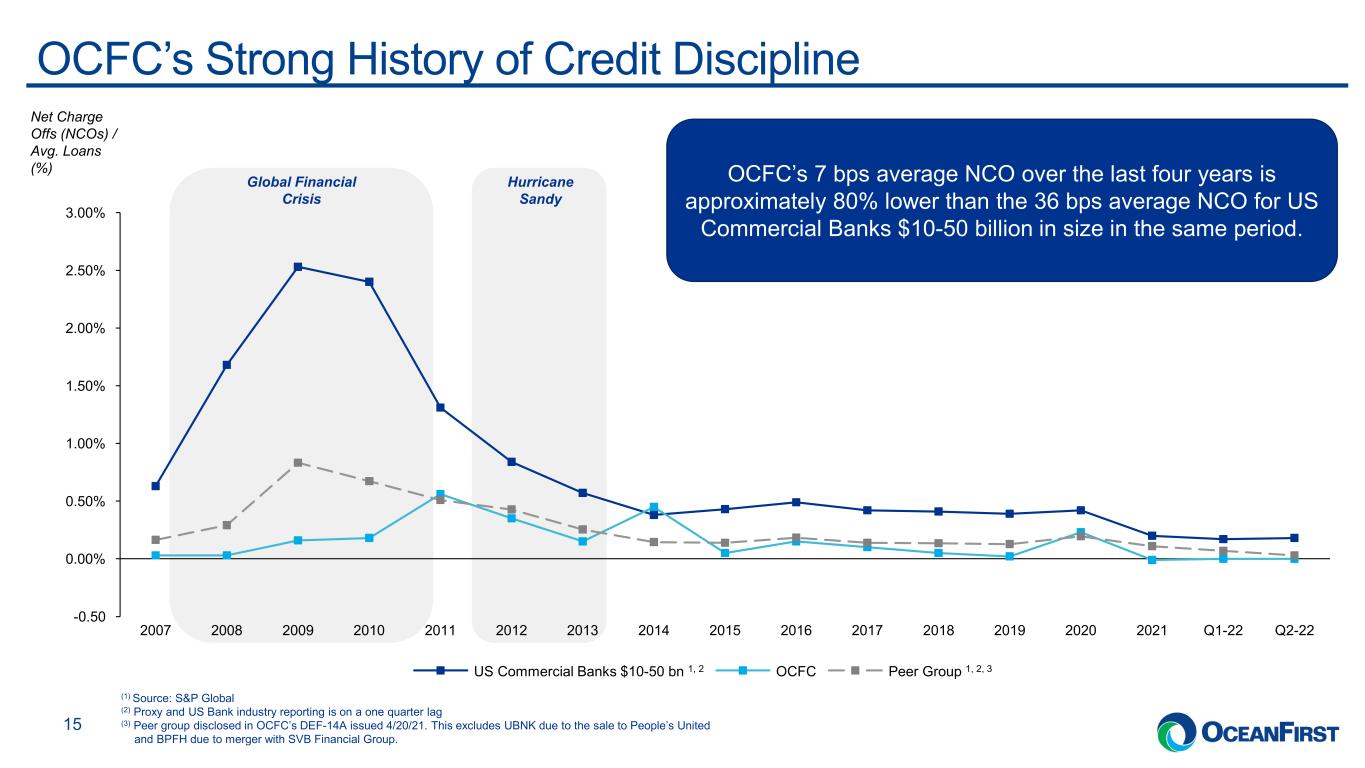
. . .OCFC’s Strong History of Credit Discipline 15 Global Financial Crisis Net Charge Offs (NCOs) / Avg. Loans (%) Hurricane Sandy (1) Source: S&P Global (2) Proxy and US Bank industry reporting is on a one quarter lag (3) Peer group disclosed in OCFC’s DEF-14A issued 4/20/21. This excludes UBNK due to the sale to People’s United and BPFH due to merger with SVB Financial Group. -0.50 0.00% 3.00% 0.50% 1.00% 1.50% 2.50% 2.00% 2011 Q2-222007 20192008 2009 2010 2012 2013 2014 20212015 2016 202020182017 Q1-22 US Commercial Banks $10-50 bn 1, 2 OCFC Peer Group 1, 2, 3 OCFC’s 7 bps average NCO over the last four years is approximately 80% lower than the 36 bps average NCO for US Commercial Banks $10-50 billion in size in the same period.
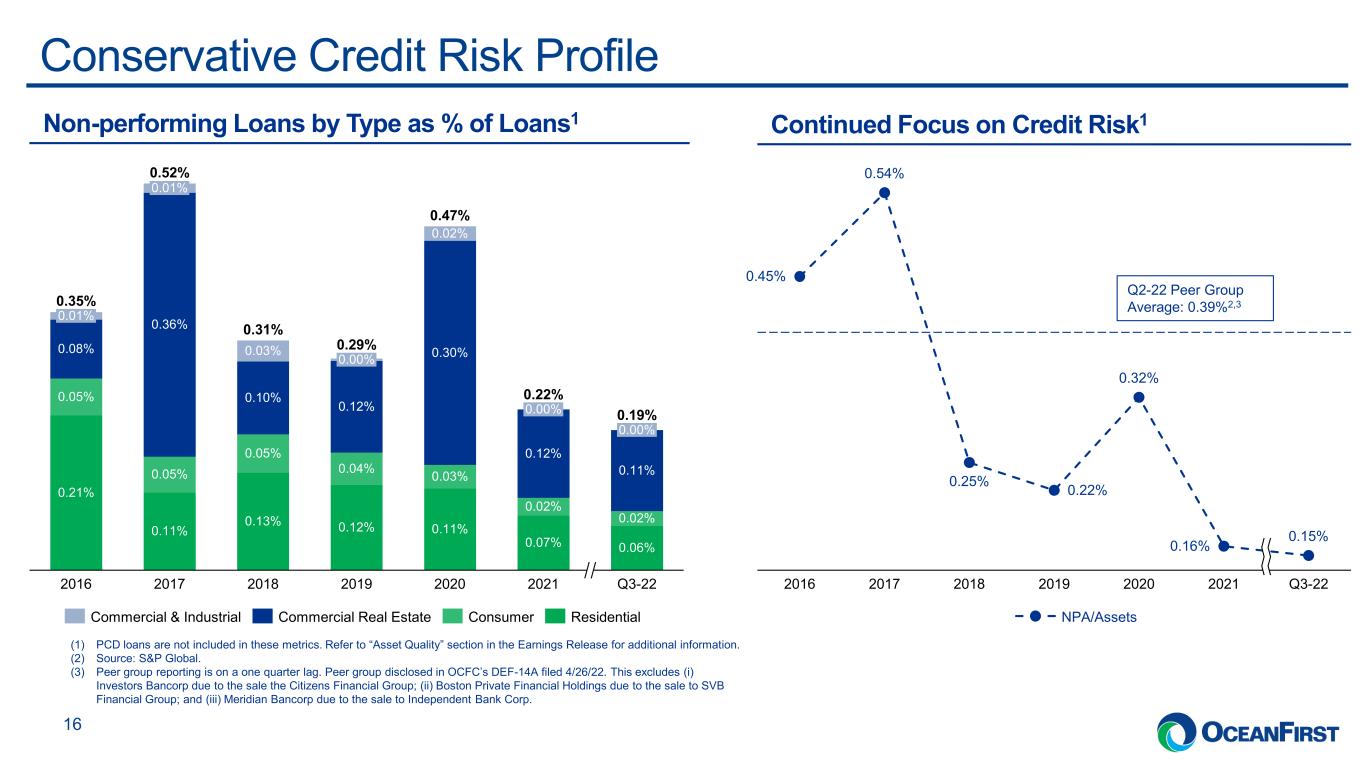
. . .Conservative Credit Risk Profile 16 0.13% 0.21% 0.05% 0.19% 0.11% 0.01% 0.05% 0.08% 0.12% 0.01% 2020 0.36% 2017 0.03% 0.02% 0.10% 0.52% 0.05% 2018 0.30% 0.04% 0.12% 2019 0.02% Q3-22 0.03% 0.11% 0.00% 0.12% 0.02% 0.07% 2016 0.00% 0.35% 0.11% 0.06% 0.00% 0.31% 0.29% 0.47% 0.22% 2021 Commercial & Industrial Commercial Real Estate Consumer Residential (1) PCD loans are not included in these metrics. Refer to “Asset Quality” section in the Earnings Release for additional information. (2) Source: S&P Global. (3) Peer group reporting is on a one quarter lag. Peer group disclosed in OCFC’s DEF-14A filed 4/26/22. This excludes (i) Investors Bancorp due to the sale the Citizens Financial Group; (ii) Boston Private Financial Holdings due to the sale to SVB Financial Group; and (iii) Meridian Bancorp due to the sale to Independent Bank Corp. 20202019 0.22% 0.15% 0.45% 2016 0.54% 2017 0.25% 2018 0.32% 0.16% 2021 Q3-22 Q2-22 Peer Group Average: 0.39%2,3 NPA/Assets Continued Focus on Credit Risk1Non-performing Loans by Type as % of Loans1
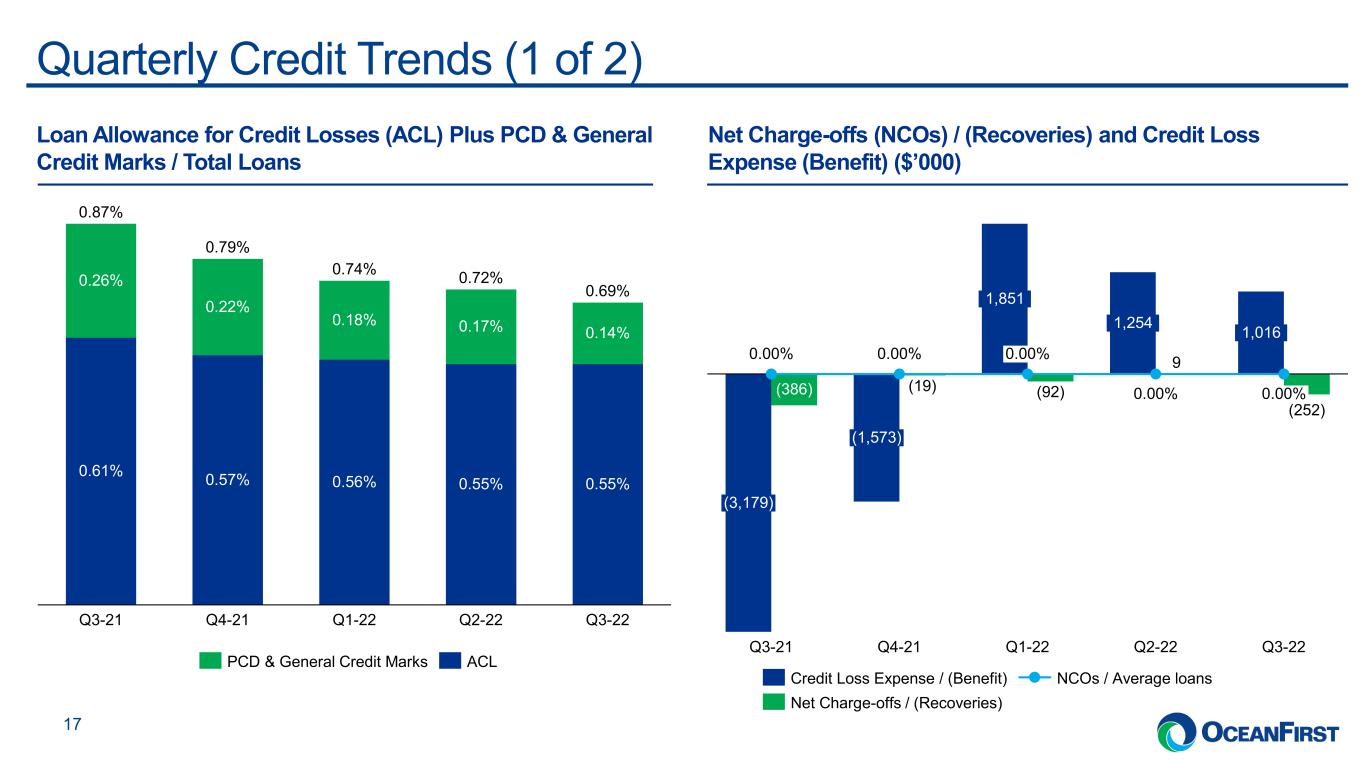
. . .Quarterly Credit Trends (1 of 2) 17 Loan Allowance for Credit Losses (ACL) Plus PCD & General Credit Marks / Total Loans Net Charge-offs (NCOs) / (Recoveries) and Credit Loss Expense (Benefit) ($’000) 0.87% 0.57% Q3-21 0.61% Q3-22 0.26% 0.14% 0.22% Q4-21 0.18% 0.56% Q1-22 0.17% 0.55% Q2-22 0.79% 0.55% 0.74% 0.72% 0.69% PCD & General Credit Marks ACL (386) (19) (92) 9 (252) (3,179) 0.00% Q3-21 (1,573) 0.00% Q4-21 1,851 0.00% Q1-22 1,254 0.00% Q2-22 Q3-22 1,016 0.00% Net Charge-offs / (Recoveries) Credit Loss Expense / (Benefit) NCOs / Average loans
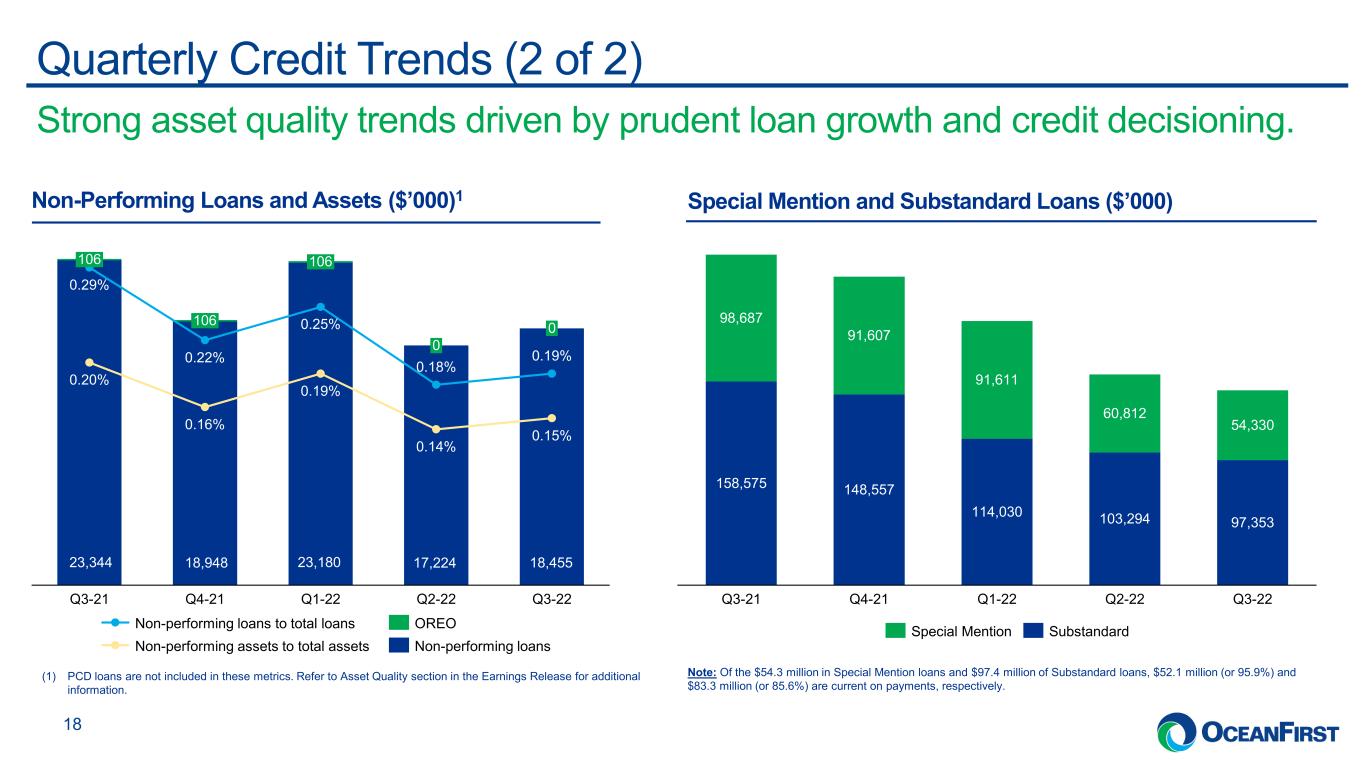
. . . Strong asset quality trends driven by prudent loan growth and credit decisioning. Quarterly Credit Trends (2 of 2) 18 Non-Performing Loans and Assets ($’000)1 Special Mention and Substandard Loans ($’000) Note: Of the $54.3 million in Special Mention loans and $97.4 million of Substandard loans, $52.1 million (or 95.9%) and $83.3 million (or 85.6%) are current on payments, respectively. Q3-21 0.29% 0.19% 0.16% Q3-22 0.20% 106 Q2-22Q4-21 0.22% 0.14% 106 0.15% 0.25% 0.19% 106 Q1-22 0.18% 0 0 Non-performing loans to total loans OREO Non-performing assets to total assets Non-performing loans 23,344 18,948 23,180 17,224 18,455 158,575 148,557 114,030 103,294 97,353 98,687 91,607 91,611 60,812 54,330 Q3-22Q2-22Q4-21Q3-21 Q1-22 Special Mention Substandard (1) PCD loans are not included in these metrics. Refer to Asset Quality section in the Earnings Release for additional information.
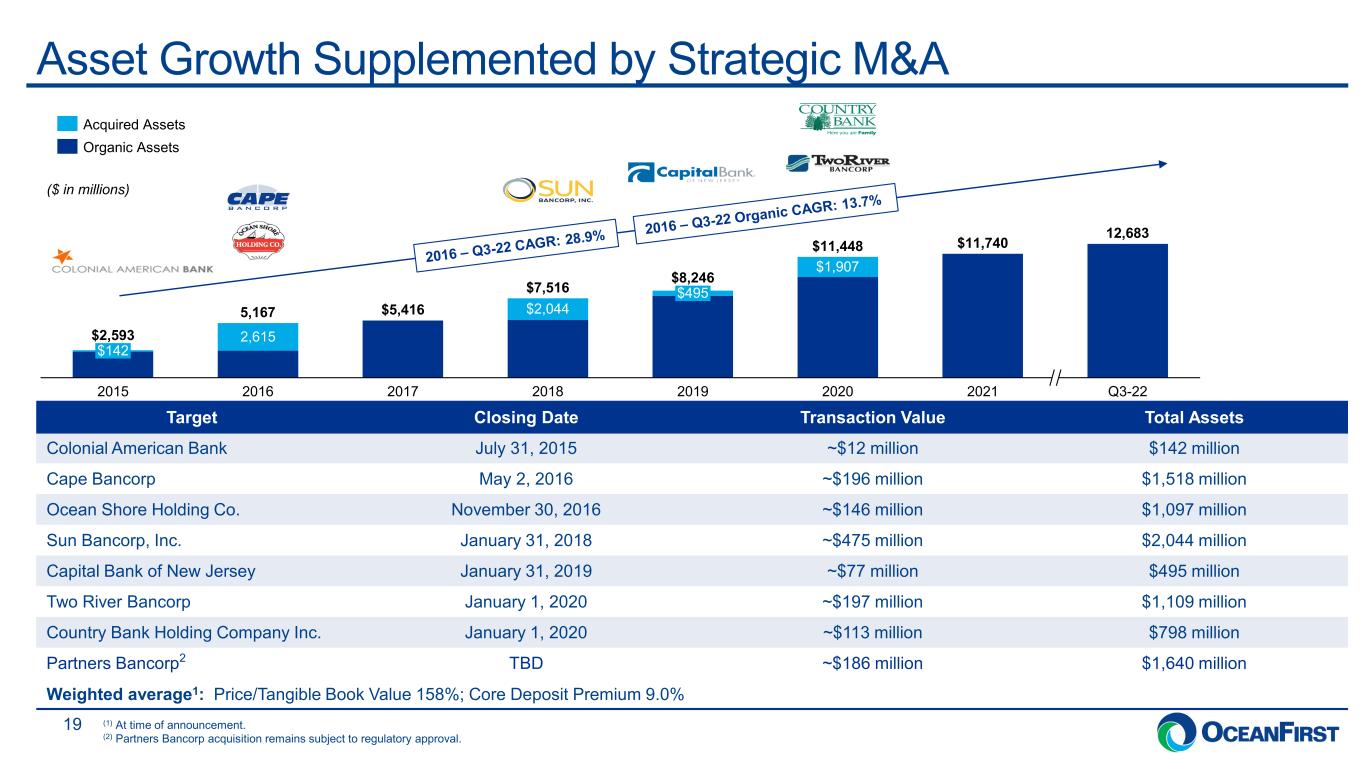
. . .Asset Growth Supplemented by Strategic M&A 19 ($ in millions) Target Closing Date Transaction Value Total Assets Colonial American Bank July 31, 2015 ~$12 million $142 million Cape Bancorp May 2, 2016 ~$196 million $1,518 million Ocean Shore Holding Co. November 30, 2016 ~$146 million $1,097 million Sun Bancorp, Inc. January 31, 2018 ~$475 million $2,044 million Capital Bank of New Jersey January 31, 2019 ~$77 million $495 million Two River Bancorp January 1, 2020 ~$197 million $1,109 million Country Bank Holding Company Inc. January 1, 2020 ~$113 million $798 million Partners Bancorp2 TBD ~$186 million $1,640 million Weighted average1: Price/Tangible Book Value 158%; Core Deposit Premium 9.0% 2,615 2017 $142 2015 2016 $2,044 2018 2019 $495 $1,907 2020 2021 Q3-22 $2,593 5,167 $5,416 $7,516 $8,246 $11,448 $11,740 12,683 Acquired Assets Organic Assets (1) At time of announcement. (2) Partners Bancorp acquisition remains subject to regulatory approval.
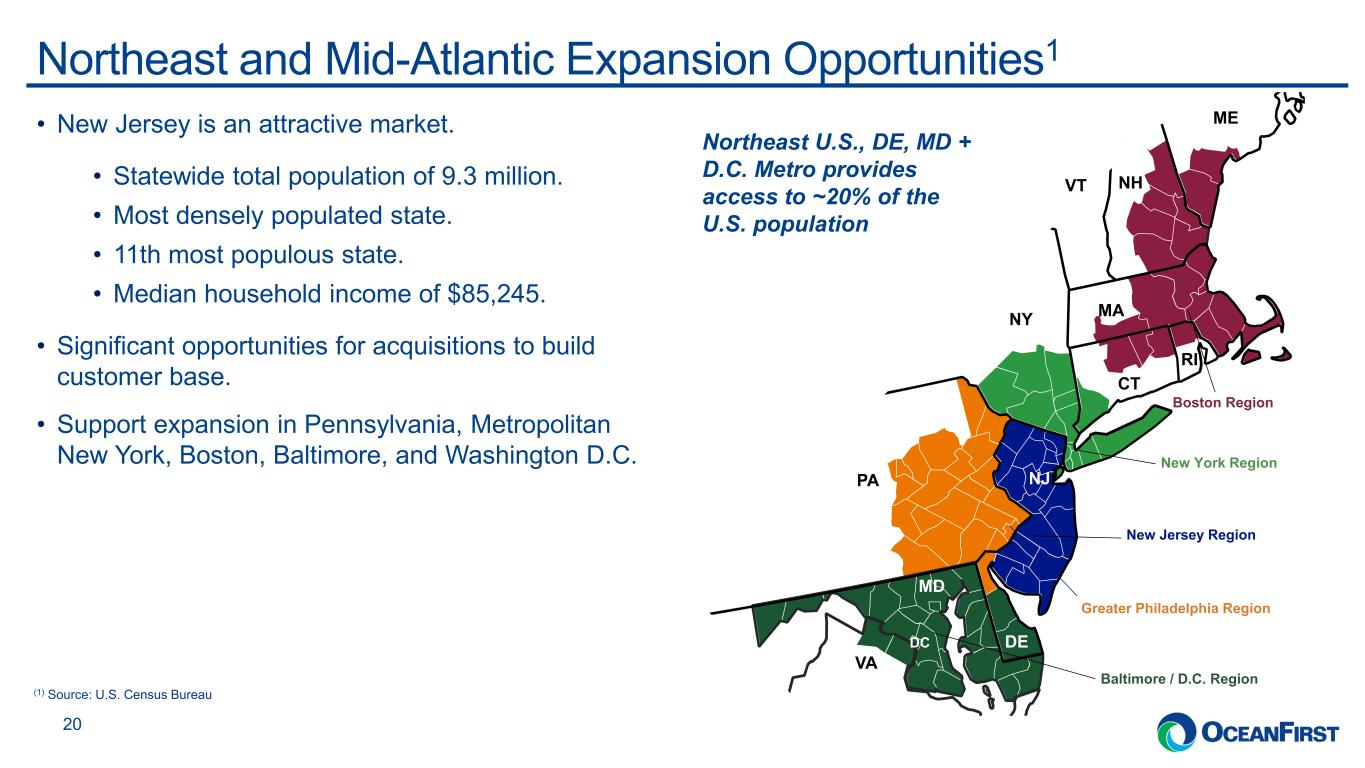
. . .Northeast and Mid-Atlantic Expansion Opportunities1 20 • New Jersey is an attractive market. • Statewide total population of 9.3 million. • Most densely populated state. • 11th most populous state. • Median household income of $85,245. • Significant opportunities for acquisitions to build customer base. • Support expansion in Pennsylvania, Metropolitan New York, Boston, Baltimore, and Washington D.C. Northeast U.S., DE, MD + D.C. Metro provides access to ~20% of the U.S. population (1) Source: U.S. Census Bureau VA PA NY MA CT RI MD DC DE NJ NH ME VT New Jersey Region Greater Philadelphia Region New York Region Boston Region Baltimore / D.C. Region
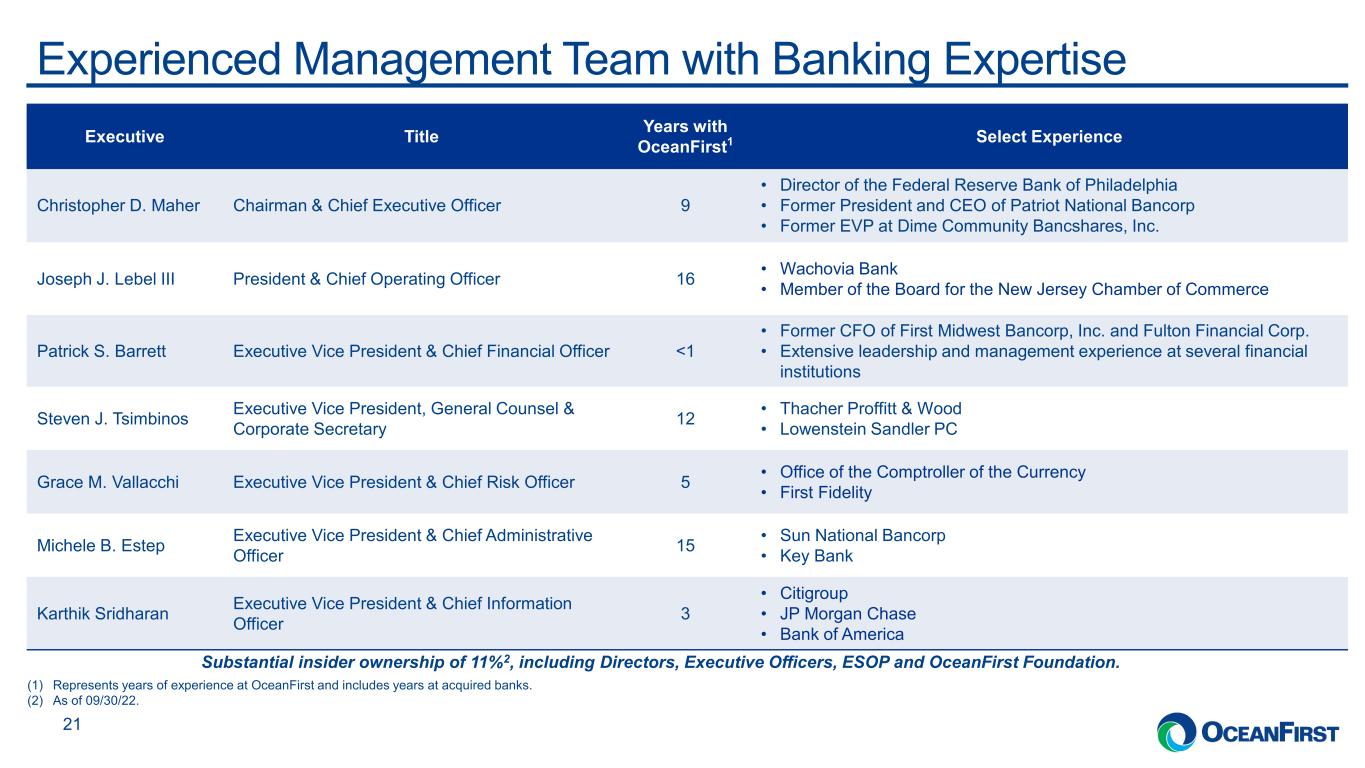
. . .Experienced Management Team with Banking Expertise 21 Substantial insider ownership of 11%2, including Directors, Executive Officers, ESOP and OceanFirst Foundation. Executive Title Years with OceanFirst1 Select Experience Christopher D. Maher Chairman & Chief Executive Officer 9 • Director of the Federal Reserve Bank of Philadelphia • Former President and CEO of Patriot National Bancorp • Former EVP at Dime Community Bancshares, Inc. Joseph J. Lebel III President & Chief Operating Officer 16 • Wachovia Bank • Member of the Board for the New Jersey Chamber of Commerce Patrick S. Barrett Executive Vice President & Chief Financial Officer <1 • Former CFO of First Midwest Bancorp, Inc. and Fulton Financial Corp. • Extensive leadership and management experience at several financial institutions Steven J. Tsimbinos Executive Vice President, General Counsel & Corporate Secretary 12 • Thacher Proffitt & Wood • Lowenstein Sandler PC Grace M. Vallacchi Executive Vice President & Chief Risk Officer 5 • Office of the Comptroller of the Currency • First Fidelity Michele B. Estep Executive Vice President & Chief Administrative Officer 15 • Sun National Bancorp • Key Bank Karthik Sridharan Executive Vice President & Chief Information Officer 3 • Citigroup • JP Morgan Chase • Bank of America (1) Represents years of experience at OceanFirst and includes years at acquired banks. (2) As of 09/30/22.
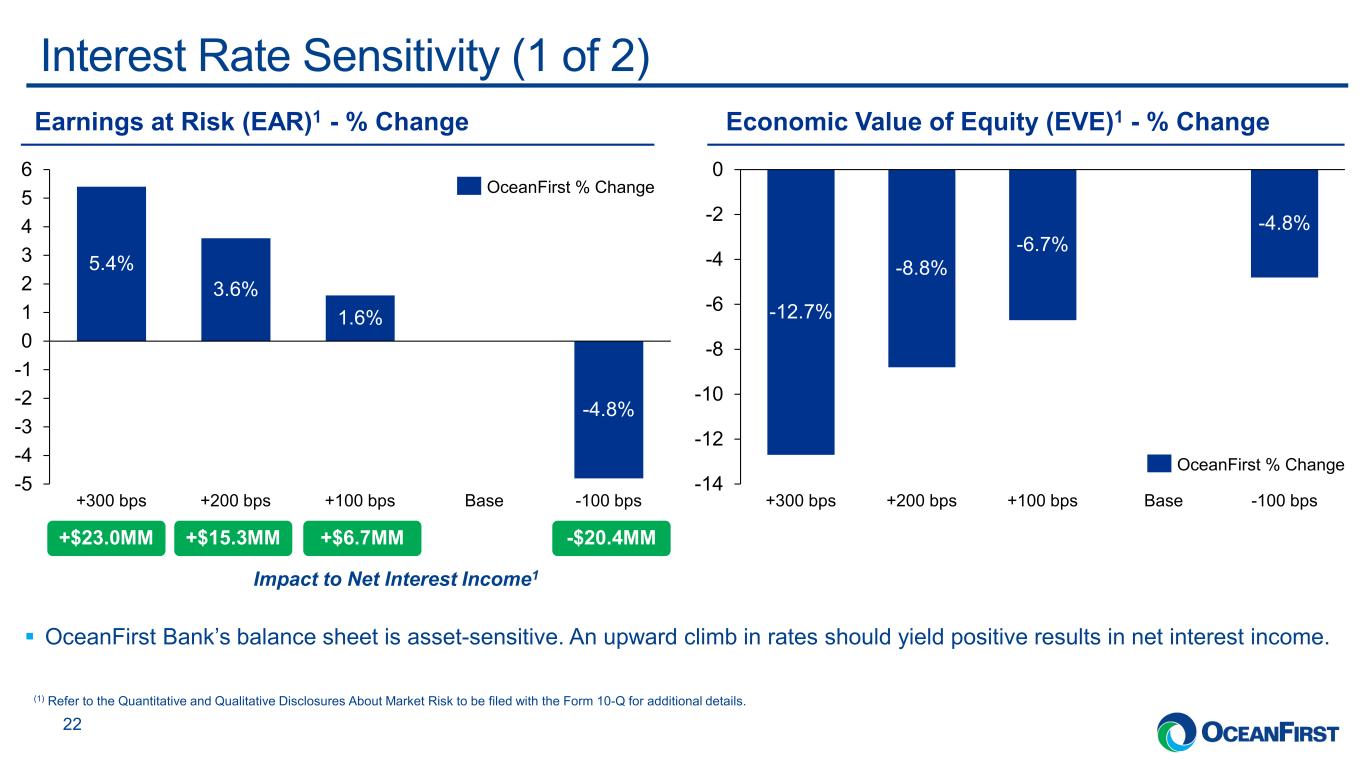
. . .Interest Rate Sensitivity (1 of 2) 22 OceanFirst Bank’s balance sheet is asset-sensitive. An upward climb in rates should yield positive results in net interest income. Economic Value of Equity (EVE)1 - % ChangeEarnings at Risk (EAR)1 - % Change -14 -12 -10 -8 -6 -4 -2 0 +200 bps -12.7% Base -4.8% +300 bps -8.8% -6.7% +100 bps -100 bps OceanFirst % Change -5 -4 -3 -2 -1 0 1 2 3 4 5 6 +200 bps 5.4% +300 bps +100 bps 3.6% 1.6% Base -4.8% -100 bps OceanFirst % Change Impact to Net Interest Income1 +$23.0MM +$15.3MM +$6.7MM -$20.4MM (1) Refer to the Quantitative and Qualitative Disclosures About Market Risk to be filed with the Form 10-Q for additional details.
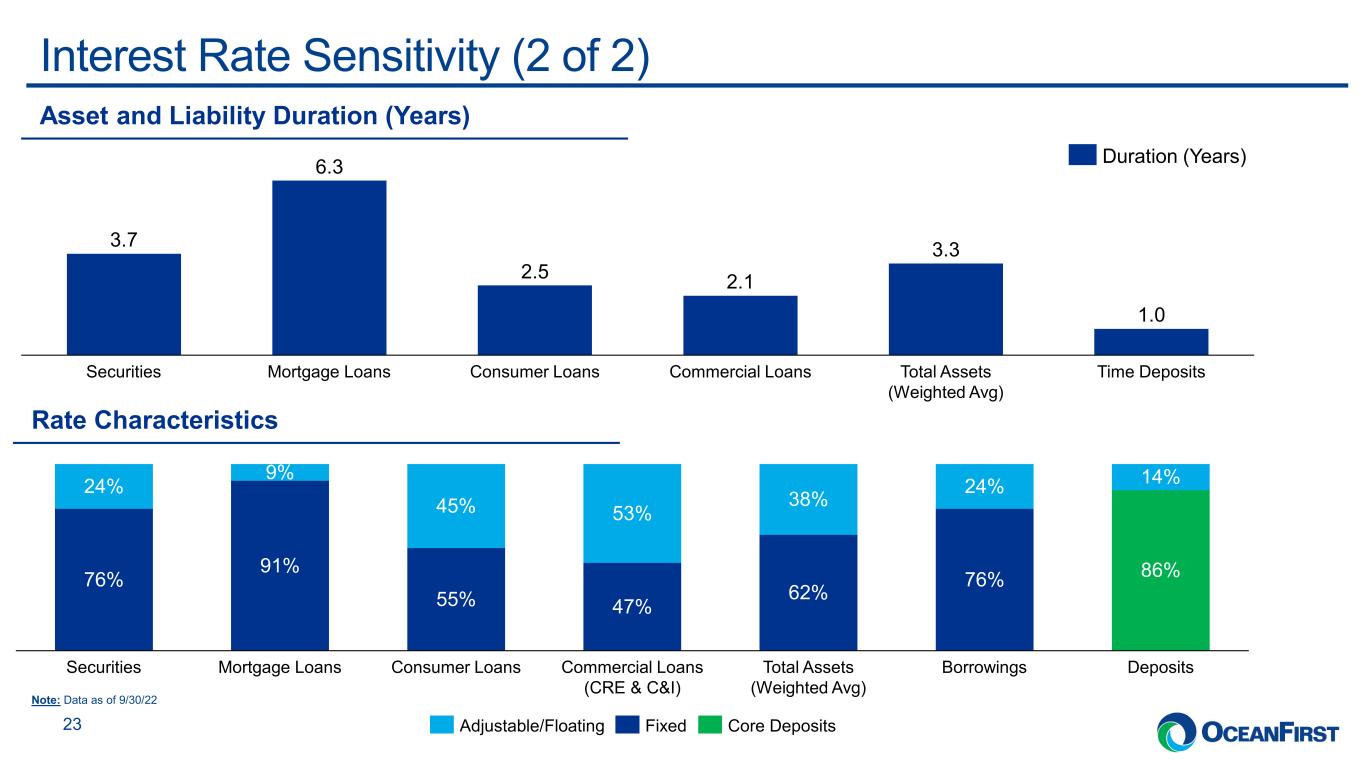
. . .Interest Rate Sensitivity (2 of 2) 23 Rate Characteristics 76% 91% 55% 47% 62% 76% 86% 24% 9% 45% 53% 38% 24% 14% Securities Mortgage Loans Total Assets (Weighted Avg) Consumer Loans Commercial Loans (CRE & C&I) DepositsBorrowings Adjustable/Floating Fixed Core Deposits Note: Data as of 9/30/22 3.7 6.3 2.5 2.1 3.3 1.0 Securities Mortgage Loans Consumer Loans Commercial Loans Total Assets (Weighted Avg) Time Deposits Duration (Years) Asset and Liability Duration (Years)