
OPFI 8-K
OppFi Inc. (OPFI)
UNITED STATES
SECURITIES AND EXCHANGE COMMISSION
Washington, D.C. 20549
FORM
CURRENT REPORT
PURSUANT TO SECTION 13 OR 15(d)
OF THE SECURITIES EXCHANGE ACT OF 1934
DATE OF REPORT (DATE OF EARLIEST EVENT REPORTED):
(Exact Name of Registrant as Specified in its Charter)
| (State or Other Jurisdiction of Incorporation) |
(Commission File Number) |
(IRS Employer Identification No.) |
(Address of Principal Executive Office) (Zip Code)
Registrant’s telephone number, including area code:
Not Applicable
(Former name or former address, if changed since last report)
Check the appropriate box below if the Form 8-K filing is intended to simultaneously satisfy the filing obligation of the registrant under any of the following provisions:
| Written communications pursuant to Rule 425 under the Securities Act (17 CFR 230.425) |
| Soliciting material pursuant to Rule 14a-12 under the Exchange Act (17 CFR 240.14a-12) |
| Pre-commencement communications pursuant to Rule 14d-2(b) under the Exchange Act (17 CFR 240.14d-2(b)) |
| Pre-commencement communications pursuant to Rule 13e-4(c) under the Exchange Act (17 CFR 240.13e-4(c)) |
Securities registered pursuant to Section 12(b) of the Act:
| Title of Each Class |
Trading |
Name of Each Exchange | ||
Indicate by check mark whether the registrant is an emerging growth company as defined in Rule 405 of the Securities Act of 1933 (§230-405) or Rule 12b-2 of the Securities Exchange Act of 1934 (§240.12b-2).
Emerging growth company
If an emerging growth company, indicate by check mark if the registrant has elected not to use the extended transition period for complying with any new or revised financial accounting standards provided pursuant to Section 13(a) of the Exchange Act.
Item 2.02 Results of Operations and Financial Condition.
The information contained in Item 7.01 of this Current Report on Form 8-K is incorporated by reference in this Item 2.02.
Item 7.01 Regulation FD Disclosure.
On November 11, 2021, OppFi Inc. (the “Company”) issued a press release and held a webcast and conference call announcing its financial results for the third quarter ended September 30, 2021. Additionally, the Company provided an earnings presentation to accompany the press release. Copies of the press release, the transcript of the conference call and the earnings presentation are furnished as Exhibits 99.1, 99.2 and 99.3, respectively, to this Current Report on Form 8-K and are incorporated herein by reference.
This information and the information contained in Exhibits 99.1, 99.2 and 99.3 is furnished and shall not be deemed “filed” for purposes of Section 18 of the Securities Exchange Act of 1934, as amended (the “Exchange Act”), or incorporated by reference in any filing under the Securities Act of 1933, as amended, or the Exchange Act, except as may be expressly set forth by specific reference in any such filing, regardless of any general incorporation language in the filing.
Item 9.01 Financial Statements and Exhibits.
(d) Exhibits
Exhibit Index
| Exhibit |
Description | |
| 99.1 | Press Release from OppFi Inc., dated November 11, 2021, entitled “OppFi Reports Third Quarter 2021 Financial Results.” | |
| 99.2 | Transcript of Webcast and Conference Call held by OppFi Inc. on November 11, 2021. | |
| 99.3 | OppFi Inc. Earnings Presentation dated November 11, 2021. | |
| 104 | Cover Page Interactive Data File (the cover page tags are embedded within the Inline XBRL document). | |
SIGNATURES
Pursuant to the requirements of the Securities Exchange Act of 1934, the registrant has duly caused this report to be signed on its behalf by the undersigned hereunto duly authorized.
| Date: November 12, 2021 | OPPFI INC. | |||||
| By: | /s/ Shiven Shah | |||||
| Name: | Shiven Shah | |||||
| Title | Chief Financial Officer | |||||
Exhibit 99.1

OppFi Reports Third Quarter 2021 Financial Results
Revenue up 47% and Adjusted Revenue for the third quarter of 2021 up 25% year over year
Net Originations for the third quarter of 2021 up 25% year over year and 14% sequentially to a
record $165 million
Ending Receivables for the third quarter of 2021 up 22% year over year and 13% sequentially
Net Income of $30.4 million for the third quarter of 2021, $72.8 million for the first nine months
of 2021
Adjusted Net Income of $17.4 million for the third quarter of 2021, $54.4 million for the first nine
months of 2021, up 60% over the first nine months of 2020
Basic and Diluted EPS of $1.06 for the third quarter of 2021
Adjusted Basic and Diluted EPS of $0.21 for the third quarter of 2021
CHICAGO, November 11, 2021— OppFi Inc. (NYSE: OPFI) (“OppFi” and “the Company”), a leading financial technology platform that powers banks to help the everyday consumer gain access to credit, today reported financial results for the third quarter ended September 30, 2021.
“We are pleased with our results for the third quarter as growth continued to rebound with a record $165 million in quarterly originations together with strong revenue and profitability, ” said Jared Kaplan, Chief Executive Officer of OppFi. “We remain excited about our ability to scale the OppFi platform with a multi-product solution to serve the everyday consumer. Recently we secured financing for our SalaryTap and OppFi Card businesses which we plan to use to allow those businesses to scale. We are piloting a more personalized approach to pricing with our bank partners in our flagship installment business. We believe personalized pricing could allow us to serve an even larger portion of our addressable market and drive stronger growth over time. Furthermore, we delivered our inaugural Social Impact Report which highlights our mission of expanding credit access, while building financial health for our customers.”
Financial Summary
The following table presents a summary of OppFi’s results for the three and nine months ended September 30, 2021.
| (in Thousands, except per share | Three Months Ended September 30, | Variance | ||||||||||
| values) Unaudited |
2021 | 2020 | % | |||||||||
| Total revenue |
$ | 91,977 | $ | 62,759 | 46.6 | % | ||||||
| Adjusted revenue1 |
$ | 91,977 | $ | 73,577 | 25.0 | % | ||||||
| Net income |
$ | 30,392 | $ | 19,342 | 57.1 | % | ||||||
| Adjusted net income1 |
$ | 17,362 | $ | 19,484 | (10.9 | %) | ||||||
| Adjusted EBITDA1 |
$ | 31,779 | $ | 32,402 | (1.9 | %) | ||||||
| Basic and diluted EPS |
$ | 1.06 | $ | — | — | |||||||
| Adjusted basic and diluted EPS1 |
$ | 0.21 | $ | — | — | |||||||
| (in Thousands, except per share | Nine Months Ended September 30, | Variance | ||||||||||
| values) Unaudited |
2021 | 2020 | % | |||||||||
| Total revenue |
$ | 254,610 | $ | 198,693 | 28.1 | % | ||||||
| Adjusted revenue1 |
$ | 254,610 | $ | 236,157 | 7.8 | % | ||||||
| Net income |
$ | 72,763 | $ | 61,358 | 18.6 | % | ||||||
| Adjusted net income1 |
$ | 54,439 | $ | 34,079 | 59.7 | % | ||||||
| Adjusted EBITDA1 |
$ | 96,418 | $ | 66,445 | 45.1 | % | ||||||
| Basic and diluted EPS |
$ | 1.08 | $ | — | — | |||||||
| Adjusted basic and diluted EPS1 |
$ | 0.64 | $ | — | — | |||||||
Third Quarter Key Performance Metrics
The following table represents key third quarter metrics.
| ($ in Thousands, except marketing cost per loan | As of and for the Three Months Ended | |||||||||||
| information) Unaudited |
Sept. 30, 2021 | June 30, 2021 | Sept. 30, 2020 | |||||||||
| Total Net Originations(a) |
$ | 164,547 | $ | 143,983 | $ | 131,236 | ||||||
| Ending Receivables(b) |
$ | 293,279 | $ | 260,377 | $ | 240,275 | ||||||
| % of Originations by Bank Partners |
93 | % | 93 | % | 65 | % | ||||||
| Net Charge-Offs as % of Average Receivables(c) |
36 | % | 28 | % | 24 | % | ||||||
| Auto-Approval Rate(d) |
58 | % | 51 | % | 21 | % | ||||||
| Marketing Cost per Funded Loan(e) |
$ | 89 | $ | 72 | $ | 62 | ||||||
| Marketing Cost per New Funded Loan(f) |
$ | 255 | $ | 245 | $ | 212 | ||||||
| a. | Total net originations include both originations by bank partners on the OppFi platform, as well as direct originations by OppFi. |
| b. | Receivables are defined as unpaid principal balances of both on- and off-balance sheet loans. |
| c. | Annualized net charge-offs as a percentage of average receivables (defined as unpaid principal of both on- and off-balance sheet loans) represents total charge offs from the period less recoveries as a percent of average receivables. Finance receivables are charged off at the earlier of the time when accounts reach 90 days past due on a recency basis, when OppFi receives notification of a customer bankruptcy or is otherwise deemed uncollectible. |
| d. | Auto-Approval Rate is calculated by taking the number of approved loans that are not decisioned by a loan advocate or underwriter (auto-approval) divided by the total number of loans approved. |
| e. | Marketing Cost per Funded Loan represents marketing cost per funded loan for new and refinanced loans. This metric is the amount of direct marketing costs incurred during a period divided by the number of loans originated during that same period. |
| f. | Marketing Cost per New Funded Loan represents marketing cost for new loans. This metric is the amount of direct marketing costs incurred during a period divided by the number of new loans originated during that same period. |
Financial Capacity and Capital Resources
As of September 30, 2021, the Company had $56.8 million in total cash and an additional $225.5 million of unused debt capacity under its financing facilities for future availability, representing a 52% overall undrawn capacity. Including total financing commitments of $433.0 million, and cash on the balance sheet of $56.8 million, the Company had approximately $490 million in funding capacity as of September 30, 2021. On September 30, 2021 OppFi expanded its existing bank credit facility to $45 million to facilitate the growth and expansion of its SalaryTap business.
Full Year 2021 Outlook
The company is reiterating its expected full year 2021 financial outlook:
| • | Revenue between $350 and $360 million |
| • | Adjusted EBITDA between $120 million to $125 million(1) |
| • | Adjusted Net Income between $62 million and $66 million(1) |
OppFi’s expectations for its full year 2021 Revenue, Adjusted EBITDA and Adjusted Net Income were prepared based on various material assumptions, including the following:
| • | Ending receivables(2) of approximately $315- $325 million, which would represent approximately 15 to 20% year over year growth, reduced from previous expectations due to the slower than expected demand recovery |
| • | Net charge-offs as a percentage of average receivables(2) of approximately 35% to 40% due to lower growth in receivables |
| • | Yield consistent with historical levels for fourth quarter 2021 |
The Company plans to provide its full year 2022 financial outlook in connection with reporting 2021 year end results.
Conference Call
Management will host a webcast and conference call on Thursday, November 11, 2021 at 5:00 pm ET to discuss the Company’s financial results for the third quarter ended September 30, 2021. The conference call will be made available in the Investor Relations page of the Company’s website. To listen to a live broadcast, go to the site at least 15 minutes prior to the scheduled start time in order to register.
The conference call can also be accessed by the following dial-in information:
| • | Conference ID: 13724191 |
| • | Domestic: 1-877-705-6003 |
| • | International: 1-201-493-6725 |
A replay of the call will also be available on the Company’s website approximately two hours after the live call through November 25, 2021. To access the replay, dial 1-844-512-2921 (Domestic) or 1-412-317-6671 (International). The replay pin number is 13724191.
Third Quarter Results of Operations
The following table presents OppFi’s consolidated results of operations for the three and nine months ended September 30, 2021 and September 30, 2020. The consolidated results of operations reflect the transition on January 1, 2021, to the fair value (“FV”) accounting method for certain receivables from the incurred credit loss application method. The below tables represent unaudited income statements that compare year over year performance as well as a pro forma basis for the application of the FV methodology.
GAAP Income Statements
| Three Months Ended | ||||||||||||
| September 30, | Change | |||||||||||
| (in Thousands, except per share values) Unaudited | 2021 | 2020 | % | |||||||||
| Interest and loan related income, gross (a) |
$ | 91,448 | $ | 73,311 | 24.7 | % | ||||||
| Other income |
529 | 266 | 98.9 | % | ||||||||
|
|
|
|
|
|
|
|||||||
| Interest, loan related, and other Income |
$ | 91,977 | $ | 73,577 | 25.0 | % | ||||||
|
|
|
|
|
|
|
|||||||
| Amortization of loan origination costs |
— | (10,818 | ) | — | ||||||||
|
|
|
|
|
|
|
|||||||
| Total revenue |
$ | 91,977 | $ | 62,759 | 46.6 | % | ||||||
|
|
|
|
|
|
|
|||||||
| Total provision |
(143 | ) | (17,880 | ) | 99.2 | % | ||||||
| Change in fair value of finance receivables |
(18,940 | ) | — | — | ||||||||
|
|
|
|
|
|
|
|||||||
| Net revenue |
$ | 72,894 | $ | 44,879 | 62.4 | % | ||||||
|
|
|
|
|
|
|
|||||||
| Total expenses |
61,382 | 25,537 | 140.4 | % | ||||||||
|
|
|
|
|
|
|
|||||||
| Income from operations |
$ | 11,512 | $ | 19,342 | (40.5 | )% | ||||||
|
|
|
|
|
|
|
|||||||
| Gain of loan forgiveness of Paycheck Protection Program loan |
6,444 | — | — | |||||||||
| Change in fair value of warrant liability |
13,139 | — | — | |||||||||
|
|
|
|
|
|
|
|||||||
| Income before income taxes |
$ | 31,095 | $ | 19,342 | 60.8 | % | ||||||
|
|
|
|
|
|
|
|||||||
| Provision for income taxes |
703 | — | — | |||||||||
|
|
|
|
|
|
|
|||||||
| Net income |
$ | 30,392 | $ | 19,342 | 57.1 | % | ||||||
|
|
|
|
|
|
|
|||||||
| Less: net income attributable to noncontrolling interest |
16,267 | |||||||||||
|
|
|
|||||||||||
| Net income attributable to OppFi Inc. |
$ | 14,125 | ||||||||||
|
|
|
|||||||||||
| Earnings per share attributable to OppFi Inc. (b): |
||||||||||||
| Earnings per common share: |
||||||||||||
| Basic |
$ | 1.06 | $ | — | ||||||||
| Diluted |
$ | 1.06 | $ | — | ||||||||
| Weighted average common shares outstanding: |
||||||||||||
| Basic |
13,363,995 | — | ||||||||||
| Diluted |
13,363,995 | — | ||||||||||
| (a) | Loan Related Income primarily consists of non-sufficient funds fees, which are immaterial and were discontinued during Q1 2021. Interest income related to finance receivables accounted for under the fair value option is included in “Interest and loan related income, gross” in the consolidated statements of operations. |
| (b) | Prior to the Reverse Recapitalization, all net income was attributable to the noncontrolling interest. For the periods prior to July 20, 2021, earnings per share was not calculated, as net income prior to the Business Combination was attributable entirely to OppFi-LLC. |
| Nine Months Ended | ||||||||||||
| September 30, | Change | |||||||||||
| (in Thousands, except per share values) Unaudited | 2021 | 2020 | % | |||||||||
| Interest and loan related income, gross (a) |
$ | 253,581 | $ | 235,651 | 7.6 | % | ||||||
| Other income |
1,029 | 506 | 106.4 | % | ||||||||
|
|
|
|
|
|
|
|||||||
| Interest, loan related, and other Income |
$ | 254,610 | $ | 236,157 | 7.8 | % | ||||||
|
|
|
|
|
|
|
|||||||
| Amortization of loan origination costs |
— | (37,464 | ) | — | ||||||||
|
|
|
|
|
|
|
|||||||
| Total revenue |
$ | 254,610 | $ | 198,693 | 28.1 | % | ||||||
|
|
|
|
|
|
|
|||||||
| Total provision |
(181 | ) | (62,755 | ) | 99.7 | % | ||||||
| Change in fair value of finance receivables |
(52,635 | ) | — | — | ||||||||
|
|
|
|
|
|
|
|||||||
| Net revenue |
$ | 201,794 | $ | 135,938 | 48.4 | % | ||||||
|
|
|
|
|
|
|
|||||||
| Total expenses |
147,911 | 74,580 | 98.3 | % | ||||||||
|
|
|
|
|
|
|
|||||||
| Income from operations |
$ | 53,883 | $ | 61,358 | (12.2 | )% | ||||||
|
|
|
|
|
|
|
|||||||
| Gain of loan forgiveness of Paycheck Protection Program loan |
6,444 | — | — | |||||||||
| Change in fair value of warrant liability |
13,139 | — | — | |||||||||
|
|
|
|
|
|
|
|||||||
| Income before income taxes |
$ | 73,466 | $ | 61,358 | 19.7 | % | ||||||
|
|
|
|
|
|
|
|||||||
| Provision for income taxes |
703 | — | — | |||||||||
|
|
|
|
|
|
|
|||||||
| Net income |
$ | 72,763 | $ | 61,358 | 18.6 | % | ||||||
|
|
|
|
|
|
|
|||||||
| Less: net income attributable to noncontrolling interest |
58,638 | |||||||||||
|
|
|
|||||||||||
| Net income attributable to OppFi Inc. |
$ | 14,125 | ||||||||||
|
|
|
|||||||||||
| Earnings per share attributable to OppFi Inc. (b): |
||||||||||||
| Earnings per common share: |
||||||||||||
| Basic |
$ | 1.08 | $ | — | ||||||||
| Diluted |
$ | 1.08 | $ | — | ||||||||
| Weighted average common shares outstanding: |
||||||||||||
| Basic |
13,107,873 | — | ||||||||||
| Diluted |
13,107,873 | — | ||||||||||
| (a) | Loan Related Income primarily consists of non-sufficient funds fees, which are immaterial and were discontinued during Q1 2021. Interest income related to finance receivables accounted for under the fair value option is included in “Interest and loan related income, gross” in the consolidated statements of operations. |
| (b) | Prior to the Reverse Recapitalization, all net income was attributable to the noncontrolling interest. For the periods prior to July 20, 2021, earnings per share was not calculated, as net income prior to the Business Combination was attributable entirely to OppFi-LLC. |
Fair Value Pro Forma Income Statements (a)
| Three Months Ended | ||||||||||||
| (in Thousands, except per share values) Unaudited | September 30, | Change | ||||||||||
| 2021 | 2020 | % | ||||||||||
| Total revenue |
$ | 91,977 | $ | 73,577 | 25.0 | % | ||||||
| Total provision |
(143 | ) | — | — | ||||||||
| Fair value adjustment (b) |
(18,940 | ) | (11,880 | ) | (59.4 | )% | ||||||
|
|
|
|
|
|
|
|||||||
| Net revenue |
$ | 72,894 | $ | 61,697 | 18.1 | % | ||||||
|
|
|
|
|
|
|
|||||||
| Expenses |
||||||||||||
| Sales and marketing |
15,633 | 9,513 | 64.3 | % | ||||||||
| Customer operations |
10,550 | 9,414 | 12.1 | % | ||||||||
| Technology, products, and analytics |
7,329 | 5,080 | 44.3 | % | ||||||||
| General, administrative, and other |
21,456 | 7,982 | 168.8 | % | ||||||||
|
|
|
|
|
|
|
|||||||
| Total expenses before interest expense |
$ | 54,968 | $ | 31,989 | 71.8 | % | ||||||
|
|
|
|
|
|
|
|||||||
| Interest expense (c) |
6,414 | 4,653 | 37.8 | % | ||||||||
|
|
|
|
|
|
|
|||||||
| Income from operations |
$ | 11,512 | $ | 25,055 | (54.1 | )% | ||||||
|
|
|
|
|
|
|
|||||||
| Gain of forgiveness of PPP loan |
6,444 | — | — | |||||||||
| Change in fair value of warrant liability |
13,139 | — | — | |||||||||
|
|
|
|
|
|
|
|||||||
| Income before income taxes |
$ | 31,095 | $ | 25,055 | 24.1 | % | ||||||
|
|
|
|
|
|
|
|||||||
| Provision for income taxes |
703 | — | — | |||||||||
|
|
|
|
|
|
|
|||||||
| Net income |
$ | 30,392 | $ | 25,055 | 21.3 | % | ||||||
|
|
|
|
|
|
|
|||||||
| Less: net income attributable to noncontrolling interest |
16,267 | |||||||||||
|
|
|
|||||||||||
| Net income attributable to OppFi Inc. |
$ | 14,125 | ||||||||||
|
|
|
|||||||||||
| Earnings per share attributable to OppFi Inc. (d): |
||||||||||||
| Earnings per common share: |
||||||||||||
| Basic |
$ | 1.06 | $ | — | ||||||||
| Diluted |
$ | 1.06 | $ | — | ||||||||
| Weighted average common shares outstanding: |
||||||||||||
| Basic |
13,363,995 | — | ||||||||||
| Diluted |
13,363,995 | — | ||||||||||
| (a) | The pro forma fair value accounting adjustments are due to OppFi’s transition from an incurred credit loss application to a fair value application acceptable under US GAAP. Historically, under the incurred credit loss application, OppFi has reserved for life losses due to the short duration of receivables. These financial measures are not prepared in accordance with accounting principles generally accepted in the United States and may be different from non-GAAP financial measures used by other companies. |
| (b) | Fair value adjustment of $11.9 million includes net charge-offs of $13.9 million and a fair market value adjustment of ($2.0 million) driven by higher receivables and a higher fair market value mark. |
| (c) | Includes debt amortization costs. |
| (d) | Prior to the Reverse Recapitalization, all net income was attributable to the noncontrolling interest. For the periods prior to July 20, 2021, earnings per share was not calculated, as net income prior to the Business Combination was attributable entirely to OppFi-LLC. |
| Nine Months Ended | ||||||||||||
| (in Thousands, except per share values) Unaudited | September 30, | Change | ||||||||||
| 2021 | 2020 | % | ||||||||||
| Total revenue |
$ | 254,610 | $ | 236,157 | 7.8 | % | ||||||
| Total provision |
(181 | ) | — | — | ||||||||
| Fair value adjustment (a) |
(52,635 | ) | (87,470 | ) | 39.8 | % | ||||||
|
|
|
|
|
|
|
|||||||
| Net revenue |
$ | 201,794 | $ | 148,687 | 35.7 | % | ||||||
|
|
|
|
|
|
|
|||||||
| Expenses |
||||||||||||
| Sales and marketing |
35,114 | 25,539 | 38.5 | % | ||||||||
| Customer operations |
30,036 | 28,030 | 7.2 | % | ||||||||
| Technology, products, and analytics |
19,669 | 14,254 | 38.0 | % | ||||||||
| General, administrative, and other |
45,687 | 21,200 | 115.5 | % | ||||||||
|
|
|
|
|
|
|
|||||||
| Total expenses before interest expense |
$ | 130,506 | $ | 88,843 | 46.9 | % | ||||||
|
|
|
|
|
|
|
|||||||
| Interest expense (b) |
17,405 | 16,582 | 5.0 | % | ||||||||
|
|
|
|
|
|
|
|||||||
| Income from operations |
$ | 53,883 | $ | 43,262 | 24.6 | % | ||||||
|
|
|
|
|
|
|
|||||||
| Gain of forgiveness of PPP loan |
6,444 | — | — | |||||||||
| Change in fair value of warrant liability |
13,139 | — | — | |||||||||
|
|
|
|
|
|
|
|||||||
| Income before income taxes |
$ | 73,466 | $ | 43,262 | 69.8 | % | ||||||
|
|
|
|
|
|
|
|||||||
| Provision for income taxes |
703 | — | — | |||||||||
|
|
|
|
|
|
|
|||||||
| Net income |
$ | 72,763 | $ | 43,262 | 68.2 | % | ||||||
|
|
|
|
|
|
|
|||||||
| Less: net income attributable to noncontrolling interest |
58,638 | |||||||||||
|
|
|
|||||||||||
| Net income attributable to OppFi Inc. |
$ | 14,125 | ||||||||||
|
|
|
|||||||||||
| Earnings per share attributable to OppFi Inc. (c): |
||||||||||||
| Earnings per common share: |
||||||||||||
| Basic |
$ | 1.08 | — | |||||||||
| Diluted |
$ | 1.08 | — | |||||||||
| Weighted average common shares outstanding: |
||||||||||||
| Basic |
13,107,873 | — | ||||||||||
| Diluted |
13,107,873 | — | ||||||||||
| (a) | Fair value adjustment of $87.5 million includes net charge-offs of $69.8 million and a fair market value Adjustment of $17.6 million driven by lower receivables and a lower fair market value mark as a result of the COVID-19 pandemic. |
| (b) | Includes debt amortization costs. |
| (c) | Prior to the Reverse Recapitalization, all net income was attributable to the noncontrolling interest. For the periods prior to July 20, 2021, earnings per share was not calculated, as net income prior to the Business Combination was attributable entirely to OppFi-LLC. |
Condensed Balance Sheets
Comparison September 30, 2021 and December 31, 2020
The following table presents OppFi’s condensed balance sheet for September 30, 2021 and December 31, 2020:
| (in Thousands, except per share values) Unaudited |
September 30, 2021 | December 31, 2020 | ||||||
| Assets |
||||||||
| Cash and restricted cash |
$ | 56,802 | $ | 45,657 | ||||
| Finance receivables at fair value |
334,114 | — | ||||||
| Finance receivables at amortized cost, net |
1,269 | 222,243 | ||||||
| Other Assets |
48,469 | 17,943 | ||||||
|
|
|
|
|
|||||
| Total assets |
$ | 440,654 | $ | 285,843 | ||||
|
|
|
|
|
|||||
| Liabilities and stockholders’/members’ equity |
||||||||
| Other liabilities |
$ | 51,976 | $ | 28,406 | ||||
| Total debt |
225,759 | 158,105 | ||||||
| Warrant liability |
24,506 | — | ||||||
|
|
|
|
|
|||||
| Total liabilities |
302,241 | 186,511 | ||||||
| Total stockholders’/members’ equity |
138,413 | 99,332 | ||||||
|
|
|
|
|
|||||
| Total liabilities and stockholders’/members’ equity |
$ | 440,654 | $ | 285,843 | ||||
|
|
|
|
|
|||||
Total cash increased by $11.1 million as of September 30, 2021, driven by free cash flow from operations as well as increased borrowings under OppFi’s refinanced corporate credit facility and higher utilization of senior debt to finance receivables growth, transaction expenses, and tax distributions. Finance receivables in 2021 increased due to higher unpaid on-balance principal balances as well as the election of the fair value option in 2021. Other assets grew by $30.5 million driven by the addition of a deferred tax asset of $23.9 million related to the business combination, as well as $4.3 million of prepaid expenses and $3.3 million of property, equipment and capitalized technology costs, partially offset by a reduction of $0.9 million of debt issuance costs.
Other liabilities increased by $23.6 million driven by the creation of a tax receivable agreement liability of $22.9 million related to the business combination. Total debt increased by $67.7 million driven by an increase in utilization of leverage facilities of $49.2 million and a $24.8 million net impact of the corporate credit facility refinancing, partially offset by $6.4 million of loan forgiveness of the PPP loan.
Total equity increased by $39.1 million driven by net income for the first nine months of $72.8 million and the impact of the adoption of the fair value method of accounting of $69.4 million, partially offset by distributions of $50.8 million and transaction related adjustments to equity of $52.3 million.
As of September 30, 2021, OppFi had 84.5 million shares of common stock outstanding, excluding 25.5 million shares of common stock associated with earnouts. Adjusted earnings per share for the third quarter was $0.20 and for the first nine months of 2021 was $0.64. Earnings per share for the three and nine months ended September 20, 2021 excludes 15.3 million warrants outstanding with exercise prices at $11.50 and $15.00 per share as well as 5.6 million of employee stock options at exercise prices of $10.45 and $20.00 per share as these securities are anti-dilutive.
About OppFi
OppFi (NYSE: OPFI) is a leading financial technology platform that powers banks to offer accessible products and a top-rated experience to everyday consumers. OppFi’s platform facilitates the installment loan products, OppLoans and SalaryTap, and the credit card product, OppFi Card. The company has been an Inc. 5000 company for six straight years, a two-time Deloitte’s Technology Fast 500™, and the seventh fastest-growing company in Chicagoland in 2021 by Crain’s Chicago Business. The company was also listed on the Forbes America 2021 list of America’s Best Startup Employers and Built In’s 2021 Best Places to Work in Chicago. OppFi maintains an A+ rating from the Better Business Bureau (BBB) and maintains a 4.8/5 star rating with more than 14,000 online customer reviews, making it one of the top customer-rated financial platforms online. For more information, please visit oppfi.com.
Contacts:
Investor Relations: [email protected]
Media Relations: [email protected]
Forward-Looking Statements
This press release includes “forward-looking statements’’ within the meaning of the “safe harbor” provisions of the Private Securities Litigation Reform Act of 1995, Section 27A of the Securities Act of 1933, as amended, and Section 21E of the Securities Exchange Act of 1934, as amended. OppFi’s actual results may differ from its expectations, estimates and projections and consequently, you should not rely on these forward-looking statements as predictions of future events. Words such as “expect,” “estimate,” “project,” “budget,” “forecast,” “anticipate,” “intend,” “plan,” “may,” “will,” “could,” “should,” “believes,” “predicts,” “potential,” “possible,” “continue,” and similar expressions may identify forward-looking statements, but the absence of these words does not mean that a statement is not forward-looking. These forward-looking statements include, without limitation, OppFi’s expectations for its full year 2021 revenue, Adjusted EBITDA and Adjusted Net Income, OppFi’s expectations with respect to the future performance of OppFi’s platform, OppFi’s expectations for its growth and profitability and OppFi’s new products, including SalaryTap and OppFi Card, and their performance. These forward-looking statements are based on OppFi’s current expectations and assumptions about future events and are based on currently available information as to the outcome and timing of future events. These forward-looking statements involve significant risks and uncertainties that could cause the actual results to differ materially from the expected results. Most of these factors are outside OppFi’s control and are difficult to predict. Factors that may cause such differences include, but are not limited to: the impact of COVID-19 on OppFi’s business; the impact of stimulus or other government programs; the risk that the business combination disrupts current plans and operations; the ability to recognize the anticipated benefits of the business combination, which may be affected by, among other things, competition, the ability of OppFi to
grow and manage growth profitably and retain its key employees; costs related to the business combination; changes in applicable laws or regulations; the possibility that OppFi may be adversely affected by other economic, business, and/or competitive factors; and other risks and uncertainties indicated from time to time in OppFi’s filings with the United States Securities and Exchange Commission, in particular, contained in the section or sections captioned “Risk Factors.” OppFi cautions that the foregoing list of factors is not exclusive, and readers should not place undue reliance upon any forward-looking statements, which speak only as of the date made. OppFi does not undertake or accept any obligation or undertaking to release publicly any updates or revisions to any forward-looking statements to reflect any change in its expectations or any change in events, conditions or circumstances on which any such statement is based.
Non-GAAP Financial Measures
This press release includes certain non-GAAP financial measures that are unaudited and do not conform to GAAP, such as Adjusted Revenue, Adjusted Basic and Diluted EPS, Adjusted Net Income and Adjusted EBITDA. Adjusted Revenue is defined as Total Revenue adjusted to include amortization of loan origination costs. Adjusted Net Income is defined as current earnings before tax for audited annual financials and unaudited for quarterly financials, pro forma for fair value accounting for finance receivables adoption, plus (1) recruiting fees, severance and relocation, (2) amortization of debt transaction costs and (3) other addbacks and one-time expenses following the closing of the business combination, including one-time implementation fees, stock compensation expenses, IPO readiness costs and management fees; and assumes a tax rate of 25% prior to the three months ended September 30, 2021 and a 23.99% tax rate after . Adjusted EBITDA is defined as Adjusted Net Income, pro forma for fair value accounting for finance receivables adoption, plus (1) taxes at an assumed 25% tax rate prior to the three months ended September 30, 2021 and a 23.99% tax rate after for change in tax status upon completion of the business combination, (2) depreciation and amortization, (3) interest expense and (4) business (non-income) taxes. Adjusted Basic and Diluted EPS is defined as adjusted net income divided by adjusted shares outstanding, which represent shares outstanding as of September 30, 2021 excluding earnout shares. The pro forma fair value accounting adjustments are due to OppFi’s transition from an incurred credit loss application to a fair value application acceptable under US GAAP. Historically, under the incurred credit loss application, OppFi has reserved for life losses due to the short duration of receivables. These financial measures are not prepared in accordance with accounting principles generally accepted in the United States and may be different from non-GAAP financial measures used by other companies. OppFi believes that the use of these non-GAAP financial measures provides an additional tool for investors to use in evaluating ongoing operating results and trends. These non-GAAP measures with comparable names should not be considered in isolation from, or as an alternative to, financial measures determined in accordance with GAAP. A reconciliation for OppFi’s non-GAAP financial measures to the most directly comparable GAAP financial measures is in the table below.
The Non-GAAP financial measures of Adjusted EBITDA and Adjusted Net Income for the full year 2021 are provided in this press release only on a non-GAAP basis because a reconciliation to the most comparable GAAP financial measures, Net Revenue and GAAP Net Income, is not available without unreasonable effort. OppFi believes that such items and, accordingly, the other items of the reconciliation, would require an unreasonable effort to predict with reasonable certainty the amount or timing of non-GAAP adjustments used to calculate these Non-GAAP financial measures. OppFi believes that any such forecast would result in a broad range of projected values that would not be meaningful to investors.
Reconciliation of Non-GAAP Financial Measures
Adjusted EBITDA
| Three Months Ended | ||||||||||||
| (in Thousands, except per share values) Unaudited | September 30, | Change | ||||||||||
| 2021 | 2020 | % | ||||||||||
| Net income |
$ | 30,392 | $ | 19,342 | 57.1 | % | ||||||
| Provision for income taxes |
703 | — | — | |||||||||
| FV adjustments |
— | 5,713 | — | |||||||||
| Debt amortization |
572 | 474 | 20.7 | % | ||||||||
| Other addback and one-time expenses (a) |
(8,825 | ) | 450 | (2,061.1 | )% | |||||||
|
|
|
|
|
|
|
|||||||
| Adjusted EBT1 |
$ | 22,842 | $ | 25,979 | (12.1 | )% | ||||||
|
|
|
|
|
|
|
|||||||
| Less: pro forma taxes (b) |
(5,480 | ) | (6,495 | ) | (15.6 | )% | ||||||
|
|
|
|
|
|
|
|||||||
| Adjusted net income1 |
$ | 17,362 | $ | 19,484 | (10.9 | )% | ||||||
|
|
|
|
|
|
|
|||||||
| Pro forma taxes (b) |
5,480 | 6,495 | (15.6 | )% | ||||||||
| Depreciation and amortization |
2,712 | 1,799 | 50.8 | % | ||||||||
| Interest expense |
5,841 | 4,180 | 39.7 | % | ||||||||
| Business (non-income) taxes |
383 | 444 | (13.7 | ) | ||||||||
| Net gain/loss on sale of asset |
1 | — | — | |||||||||
|
|
|
|
|
|
|
|||||||
| Adjusted EBITDA1 |
$ | 31,779 | $ | 32,402 | (1.9 | )% | ||||||
|
|
|
|
|
|
|
|||||||
| Adjusted basic and diluted EPS1 (c): |
$ | 0.21 | $ | — | ||||||||
| Adjusted weighted average shares outstanding: |
84,464,783 | — | ||||||||||
| (a) | Other addback and one-time expense of ($8.8 million) includes a ($13.1 million) addback due to change in fair value of warrant liability, a ($6.4 million) addback due to gain of forgiveness of PPP loan, and a $10.7 million impact to the G&A line item in expenses comprised of: $8.5 million in one-time expenses related to the business combination, $0.9 million in profit interest and stock compensation, $0.9 million in a change in fair value of warrant outstanding prior to business combination, and $0.4 million in other one-time expense. |
| (b) | Assumes a tax rate of 25% prior to the three months ended September 30, 2021 and a 23.99% tax rate after reflecting the U.S. federal statutory rate of 21% and a blended statutory rate for state income taxes, in order to allow for a comparison with other publicly traded companies. |
| (c) | Prior to the Reverse Recapitalization, all net income was attributable to the noncontrolling interest. For the periods prior to July 20, 2021, earnings per share was not calculated, as net income prior to the Business Combination was attributable entirely to OppFi-LLC. |
| Nine Months Ended | ||||||||||||
| (in Thousands, except per share values) Unaudited | September 30, | Change | ||||||||||
| 2021 | 2020 | % | ||||||||||
| Net income |
$ | 72,763 | $ | 61,358 | 18.6 | % | ||||||
| Provision for income taxes |
703 | — | — | |||||||||
| FV adjustments |
— | (18,096 | ) | — | ||||||||
| Debt amortization |
1,735 | 1,451 | 19.6 | % | ||||||||
| Other addback and one-time expenses (a) |
(2,923 | ) | 726 | (502.6 | )% | |||||||
|
|
|
|
|
|
|
|||||||
| Adjusted EBT1 |
$ | 72,278 | $ | 45,439 | 59.1 | % | ||||||
|
|
|
|
|
|
|
|||||||
| Less: pro forma taxes (b) |
(17,839 | ) | (11,360 | ) | 57.0 | % | ||||||
|
|
|
|
|
|
|
|||||||
| Adjusted net income1 |
$ | 54,439 | $ | 34,079 | 59.7 | % | ||||||
|
|
|
|
|
|
|
|||||||
| Pro forma taxes (b) |
17,839 | 11,360 | 57.0 | % | ||||||||
| Depreciation and amortization |
7,289 | 4,775 | 52.6 | % | ||||||||
| Interest expense |
15,671 | 15,131 | 3.6 | % | ||||||||
| Business (non-income) taxes |
1,175 | 1,100 | 6.8 | % | ||||||||
| Net gain/loss on sale of asset |
5 | — | — | % | ||||||||
|
|
|
|
|
|
|
|||||||
| Adjusted EBITDA1 |
$ | 96,418 | $ | 66,445 | 45.1 | % | ||||||
|
|
|
|
|
|
|
|||||||
| Adjusted basic and diluted EPS1 (c): |
$ | 0.64 | $ | — | ||||||||
| Adjusted weighted average shares outstanding: |
84,464,783 | — | ||||||||||
| (a) | Other addback and one-time expense of ($2.9 million) includes a ($13.1 million) addback due to change in fair value of warrant liability, a ($6.4 million) addback due to gain of forgiveness of PPP loan, and a $16.6 million impact to the G&A line item in expenses comprised of: $10.1 million in one-time expenses related to the business combination, $1.2 million in profit interest and stock compensation, $4.2 million in a change in fair value of warrant outstanding prior to business combination, and $1.1 million in other one-time expense. |
| (b) | Assumes a tax rate of 25% prior to the three months ended September 30, 2021 and a 23.99% tax rate after reflecting the U.S. federal statutory rate of 21% and a blended statutory rate for state income taxes, in order to allow for a comparison with other publicly traded companies. |
| (c) | Prior to the Reverse Recapitalization, all net income was attributable to the noncontrolling interest. For the periods prior to July 20, 2021, earnings per share was not calculated, as net income prior to the Business Combination was attributable entirely to OppFi-LLC. |
Adjusted Revenue
| (in Thousands, except per share values) | Three Months Ended September 30, | Variance | ||||||||||
| Unaudited |
2021 | 2020 | % | |||||||||
| Total revenue |
$ | 91,977 | $ | 62,759 | 46.6 | % | ||||||
|
|
|
|
|
|
|
|||||||
| Amortization of loan origination costs |
— | 10,818 | — | |||||||||
|
|
|
|
|
|
|
|||||||
| Adjusted revenue1 |
$ | 91,977 | $ | 73,577 | 25.0 | % | ||||||
|
|
|
|
|
|
|
|||||||
| (in Thousands, except per share values) | Nine Months Ended September 30, | Variance | ||||||||||
| Unaudited |
2021 | 2020 | % | |||||||||
| Total revenue |
$ | 254,610 | $ | 198,693 | 28.1 | % | ||||||
|
|
|
|
|
|
|
|||||||
| Amortization of loan origination costs |
— | 37,464 | — | |||||||||
|
|
|
|
|
|
|
|||||||
| Adjusted revenue1 |
$ | 254,610 | $ | 236,157 | 7.8 | % | ||||||
|
|
|
|
|
|
|
|||||||
Adjusted Shares as Reflected in Adjusted Basic and Diluted Earnings Per Share
| Three Months and Nine Months | ||||||||
| Ended September 30, | ||||||||
| Unaudited | 2021 | 2020 | ||||||
| Class A Common Stock outstanding at period end |
13,464,542 | — | ||||||
| Class V Common Stock outstanding at period end |
96,500,241 | — | ||||||
| Elimination of earnouts at period end |
(25,500,000 | ) | — | |||||
|
|
|
|
|
|||||
| Adjusted shares outstanding |
84,464,783 | — | ||||||
Adjusted Basic and Diluted EPS
| Three Months Ended September 30, | ||||||||
| Unaudited | 2021 | 2020 | ||||||
| Adjusted net income (thousands)1 |
$ | 17,362 | $ | 19,484 | ||||
| Adjusted shares outstanding |
84,464,783 | — | ||||||
|
|
|
|
|
|||||
| Adjusted basic and diluted EPS: |
$ | 0.21 | $ | — | ||||
| Nine Months Ended September 30, | ||||||||
| Unaudited | 2021 | 2020 | ||||||
| Adjusted net income (in thousands)1 |
$ | 54,439 | $ | 34,079 | ||||
| Adjusted shares outstanding |
84,464,783 | — | ||||||
|
|
|
|
|
|||||
| Adjusted basic and diluted EPS: |
$ | 0.64 | $ | — | ||||
Fair Value Pro Forma
| (in Thousands, except per share values) | Three Months Ended September 30, 2020 | |||||||||||
| Unaudited |
As Reported | FV Adjustments | FV Pro Forma | |||||||||
| Total revenue |
$ | 62,759 | $ | 10,818 | $ | 73,577 | ||||||
| Total provision |
(17,880 | ) | 17,880 | — | ||||||||
| Fair value adjustment (a) |
— | (11,880 | ) | (11,880 | ) | |||||||
|
|
|
|
|
|
|
|||||||
| Net revenue |
$ | 44,879 | $ | 16,818 | $ | 61,697 | ||||||
|
|
|
|
|
|
|
|||||||
| Expenses |
— | |||||||||||
| Sales and marketing |
3,693 | 5,820 | 9,513 | |||||||||
| Customer operations |
4,129 | 5,285 | 9,414 | |||||||||
| Technology, products, and analytics |
5,080 | — | 5,080 | |||||||||
| General, administrative, and other |
7,982 | — | 7,982 | |||||||||
|
|
|
|
|
|
|
|||||||
| Total expenses before interest expense |
$ | 20,884 | $ | 11,105 | $ | 31,989 | ||||||
|
|
|
|
|
|
|
|||||||
| Interest expense (b) |
4,653 | — | 4,653 | |||||||||
| Income from operations |
$ | 19,342 | $ | 5,713 | $ | 25,055 | ||||||
|
|
|
|
|
|
|
|||||||
| (a) | FV Adjustment of $11.9M includes net charge-offs of $13.9M and FMV Adjustment of ($2.0M) driven by higher receivables and FMV mark. |
| (b) | Includes debt amortization costs. |
| (in Thousands, except per share values) | Nine Months Ended September 30, 2020 | |||||||||||
| Unaudited |
As Reported | FV Adjustments | FV Pro Forma | |||||||||
| Total revenue |
$ | 198,693 | $ | 37,464 | $ | 236,157 | ||||||
| Total provision |
(62,755 | ) | 62,755 | — | ||||||||
| Fair value adjustment (a) |
— | (87,470 | ) | (87,470 | ) | |||||||
|
|
|
|
|
|
|
|||||||
| Net revenue |
$ | 135,938 | $ | 12,749 | $ | 148,687 | ||||||
|
|
|
|
|
|
|
|||||||
| Expenses |
— | — | ||||||||||
| Sales and marketing |
10,185 | 15,174 | 25,359 | |||||||||
| Customer operations |
12,359 | 15,671 | 28,030 | |||||||||
| Technology, products, and analytics |
14,254 | — | 14,254 | |||||||||
| General, administrative, and other |
21,200 | — | 21,200 | |||||||||
|
|
|
|
|
|
|
|||||||
| Total expenses before interest expense |
$ | 57,998 | $ | 30,845 | $ | 88,843 | ||||||
|
|
|
|
|
|
|
|||||||
| Interest expense (b) |
16,582 | — | 16,582 | |||||||||
| Income from operations |
$ | 61,358 | $ | (18,096 | ) | $ | 43,262 | |||||
|
|
|
|
|
|
|
|||||||
| (a) | FV Adjustment of $87.5 million includes net charge-offs of $69.8M and FMV Adjustment of $17.6M driven by lower receivables and lower FMV mark as a result of the COVID-19 pandemic. |
| (b) | Includes debt amortization costs. |
| [1] | Non-GAAP Financial Measures: Adjusted Net Income, Adjusted Revenue and Adjusted EBITDA are financial measures that have not been prepared in accordance with Generally Accepted Accounting Principles (“GAAP”). See the “Note Regarding Non-GAAP Financial Measures” below for a detailed description and reconciliation of such Non-GAAP financial measures to their most directly comparable GAAP financial measures. |
| [2] | Receivables defined as unpaid principal of both on- and off-balance sheet loans. |
Exhibit 99.2
OppFi – Third Quarter 2021 Earnings Call, November 11, 2021
C O R P O R A T E P A R T I C I P A N T S
Jason Rosenthal, Vice President, Finance
Jared Kaplan, Chief Executive Officer
Shiven Shah, Chief Financial Officer
C O N F E R E N C E C A L L P A R T I C I P A N T S
David Scharf, JMP Securities
Mayank Tandon, Needham & Company
Mike Grondahl, Northland Securities
Chris Donat, Piper Sandler
Chris Brendler, D.A. Davidson
P R E S E N T A T I O N
Operator
Greetings and welcome to OppFi’s Third Quarter 2021 Earnings Call.
As a reminder, this conference is being recorded. It is now my pleasure to introduce your host Jason Rosenthal, Vice President of Finance. Thank you. You may begin.
Jason Rosenthal
Thank you, Operator. On today’s call are Jared Kaplan, OppFi’s Chief Executive Officer, and Shiven Shah, Chief Financial Officer.
The Company’s third quarter 2021 earnings press release and supplemental presentation can be found at investors.oppfi.com.
During the call, the Company will be discussing certain forward-looking information. These forward-looking statements are based on assumptions and assessments made by OppFi’s management in light of their experience and assessment of historical trends, current conditions, expected future developments and other factors they believe to be appropriate. Any forward-looking statements made during this call are made as of today and OppFi undertakes no duty to update or revise any such statement, whether as a result of new information, future events or otherwise. Important factors that could cause actual results, developments and business decisions to differ materially from forward-looking statements are described in the Company’s filings with the SEC, including the sections entitled Risk Factors.
1
ViaVid has made considerable efforts to provide an accurate transcription. There may be material errors, omissions, or inaccuracies in the reporting of the substance of the conference call. This transcript is being made available for information purposes only.
1-888-562-0262 1-604-929-1352 www.viavid.com
OppFi – Third Quarter 2021 Earnings Call, November 11, 2021
In today’s remarks by management, the Company will be discussing non-GAAP financial metrics. A reconciliation of these non-GAAP financial measures to the most comparable GAAP measures can be found in this afternoon’s earnings press release.
This call is being webcast live and will be available for replay for one month on our website.
I would now like to turn the call over to Jared.
Jared Kaplan
Thank you, and good afternoon everyone. While Shiven will discuss our financial results in more detail, I wanted to start by hitting a few key highlights for what was a strong third quarter.
Originations totaled a record $165 million, up 25% compared to the prior-year quarter, and up 14% on a sequential quarter basis, as demand for short-term credit continued to rebound. As a result, receivables ended the quarter at $293 million, up 22% year-over-year and 13% compared to the end of the second quarter, boding well for ongoing revenue growth. In fact, we now have served over 700,000 unique customers to date and expect to facilitate our two millionth loan this month, reinforcing the strength and durability of our platform and robustness of our data set.
Turning to the income statement, adjusted revenue for the quarter of $92 million grew 25% compared to the third quarter of 2020 and 17% on a sequential basis.
Profitability remained strong for the third quarter with $32 million of Adjusted EBITDA, representing a 35% margin and $17 million of adjusted net income. Through the first three quarters of 2021, we have generated Adjusted EBITDA of $96 million and adjusted net income of $54 million. Adjusted diluted earnings per share was $0.21 for the third quarter of 2021 and $0.64 for the first nine months of 2021.
We continue to invest heavily in our platform, particularly in talent, product and technology including our artificial intelligence and machine learning tools. Automation creates less friction for our customers and this quarter we continued to make strides in automating the credit approval process on behalf of our bank partners. The percentage of applications automatically approved increased from just above 50% for June to almost 60% for September. Eighty percent of credit decisions, whether approvals or denials, are now automated.
Speaking of investment, we continue to develop our recently launched new products, SalaryTap and the OppFi Credit Card, and we secured significant capital under our credit facilities to fund future growth for these products.
Starting with SalaryTap, our recently introduced sub-36% APR, payroll deductible, installment loan product. We believe we have built the foundation for SalaryTap to grow into an innovative and market leading product. We are seeing very high customer Net Promoter Scores, as well as strong customer metrics. This gives us confidence in our ability to scale the product over time, having identified a strong product/market fit. We are currently mostly focused on our direct-to-customer offering, which has become quite viable considering advances in payroll verification technology without having to directly link through employers. That being said, we still anticipate partnering with additional companies to offer SalaryTap to their employees down the road, and from a funding perspective, we recently expanded our existing bank credit facility by $20 million at favorable terms to support the growth and expansion of SalaryTap.
2
ViaVid has made considerable efforts to provide an accurate transcription. There may be material errors, omissions, or inaccuracies in the reporting of the substance of the conference call. This transcript is being made available for information purposes only.
1-888-562-0262 1-604-929-1352 www.viavid.com
OppFi – Third Quarter 2021 Earnings Call, November 11, 2021
Similar to SalaryTap, we are still in the early stages with OppFi Card, and are testing a wide range of product designs, price points and underwriting criteria to develop innovative card products. We have built a strong team and recently amended a $75 million credit line to fund card receivables growth.
It appears most customers prefer the OppFi Credit Card as a credit line for everyday purchases, whereas our installment loan products provide financing for more emergent needs. We believe that our SalaryTap and OppFi card products, together with further scaling and innovating our OppLoans business are the beginning of a strong product suite that will take market share away from legacy players, allowing us to increase our active users and customer lifetime value while reducing our customer acquisition costs.
Finally, we recently published the inaugural Social Impact report as part of our company’s ongoing efforts to measure the financial impact of products and services on the OppFi platform. Highlights from the report include OppFi reported over 400,000 consumers’ payment histories to all three major credit bureaus. According to an internal study, OppFi found that consumers who paid off their loans with OppFi experienced a 32 point average Vantage Score increase. Through the OppFi TurnUp program, if a consumer qualifies for a sub-36% APR product, OppFi’s platform will help ensure they have access to that product; however, our data indicates that less than 2% of consumers who opt into the OppFi TurnUp program receive a loan with one of these lenders.
OppU, OppFi’s online financial education hub and blog, had more than 1 million user visits in 2020. Furthermore, through our mission-aligned relationships, OppFi provided consumers with more than 100,000 referrals to free financial health resources in 2020.
OppFi’s success is reflected in the effectiveness of our social impact initiatives and measurable outcomes for consumers. We plan to continue to measure how our business model enables us to facilitate financial inclusion to the millions of everyday consumers who need access to credit.
Now, I’d like to talk a bit more on the overall demand environment and how it compares to pre-pandemic times.
While originations accelerated to record levels in the third quarter, the demand rebound was less steep than we had anticipated. We believe there are several factors still holding back borrowing. Our target consumer still has higher than usual cash on hand. These savings are likely the combination of a pandemic-influenced reduction in spending, increased income from wage inflation, and the impact of various government stimulus programs, some of which are still ongoing.
Of those consumers that have returned to the credit market, we are seeing a higher percentage from our lower proprietary scoring risk segments. This phenomenon typically occurs after tax season where less creditworthy borrowers come back to the market first. We now expect a more gradual return to normalized demand as consumers work through their savings glut.
As we look to the future, we are ramping investment in our AI credit models, talent, and brand while working with our bank partners to refine product designs to better align with the needs of today’s consumer.
We believe a more personalized pricing approach may better position us for accelerating growth going forward, particularly as borrowing behaviors and trends normalize. Looking ahead, we believe Q4 revenue will be supported by our ongoing growth in originations and the higher level of receivables entering the quarter, while earnings will be impacted by credit normalization, the scaling up of our marketing and branding efforts, and investment in our future growth.
3
ViaVid has made considerable efforts to provide an accurate transcription. There may be material errors, omissions, or inaccuracies in the reporting of the substance of the conference call. This transcript is being made available for information purposes only.
1-888-562-0262 1-604-929-1352 www.viavid.com
OppFi – Third Quarter 2021 Earnings Call, November 11, 2021
We are very early in evolving our platform to be the premier digital financial services destination for the everyday consumer. We plan to achieve this by offering our customers a comprehensive product suite to serve their financial needs while lowering their overall financial service costs and providing exceptional customer experience. What’s becoming clear is that even though 100% of our customers are employed, they remain income constrained and asset light, we believe due to the high frictional costs among many different types of products used to smooth cashflow. Our current products are starting to address this pain and we believe there is a substantial opportunity to further expand our product suite moving forward so we can quantifiably reduce these frictional costs which should help smooth cash flow and enable savings for our customers.
We have begun a thoughtful shift to optimize for active customer growth and average revenue per customer growth at attractive unit economics going forward. As a private company, we optimize for net income, including on balance sheet financing, to differentiate ourselves from other fintech platforms who were largely reliant on large outside equity funding to grow. We see great opportunities to rapidly grow our customer base with thoughtful investment to support an array of products with attractive margins. And we have started to explore more off-balance sheet funding opportunities to optimize financial flexibility and accelerate growth.
This is all part of our goal to create a platform and a brand as the premier financial destination for the everyday consumer. We look forward to revealing more about our evolving long term strategy in the near future.
With that, I would now like to turn the call over to Shiven to review our financials.
Shiven Shah
Thanks, Jared, and good afternoon everyone.
Now, turning to our third quarter 2021 financial results, I would like to note that all comparisons to 2020 from an income statement perspective are based on a pro forma fair value adjusted view for 2020 to be able to present a like-for-like comparison.
You will recall that on January 1, 2021, the Company transitioned to the fair value accounting method for its core installment receivables from the incurred credit loss application method.
We had solid financial performance in the third quarter, highlighted by strong profitability, robust originations and receivables growth, and a healthy balance sheet. Third quarter adjusted revenue was $92 million, an increase of 25% versus adjusted revenue for the third quarter a year ago and up 17% sequentially. Ending receivables balance on an amortized cost basis was $293 million at the end of the third quarter, up 13% sequentially and 22% compared to the third quarter a year ago.
Originations continued to rebound during the quarter as customer demand returned. Total originations were a record $165 million, up 14% sequentially, 25% from the third quarter a year ago, and 14% from the third quarter of 2019. Fifty-one percent of originations were from new customers, which was up from approximately 40% last quarter and a year ago. Originations from new customers grew 57% year-over-year and 41% sequentially.
Our annualized net charge-off ratio as a percentage of average receivables was 36% for the third quarter. As expected, we saw charge-offs begin returning to pre-COVID levels, increasing 750 bps from the 28% net charge-off ratio for the second quarter and up 1,150 bps from the net charge-off ratio for the third quarter of 2020. Looking ahead, we expect the net charge-off ratio to approach historical levels in the mid to high 30% range annually.
4
ViaVid has made considerable efforts to provide an accurate transcription. There may be material errors, omissions, or inaccuracies in the reporting of the substance of the conference call. This transcript is being made available for information purposes only.
1-888-562-0262 1-604-929-1352 www.viavid.com
OppFi – Third Quarter 2021 Earnings Call, November 11, 2021
Change in fair value premium was in line with the previous quarter as growth in ending receivables of $33 million was offset by a lower increase in the fair value premium which increased 90 basis points versus a 110 basis points increase in the previous quarter. The increase in fair value premium was driven by origination growth leading to a longer remaining life of the portfolio, as well as an increase in portfolio yield due to a shift to more bank partner originations and fewer customers enrolled in hardship programs.
Turning now to expenses, total operating expenses for the third quarter excluding interest expense as well as addbacks and one time items were $44 million or 48% of revenue compared to $37 million or 48% of revenue for last quarter, and from $32 million or 43% of revenue for the third quarter of 2020. This increase versus last year was primarily driven by an acceleration of originations in the 2021 third quarter and the corresponding impact on direct marketing and acquisition expenses.
Sales and marketing expenses increased to $16 million or 17% of total revenues for the third quarter from $12 million or 15% of total revenue last quarter and from $10 million or 13% of revenue for the third quarter of 2020 as demand accelerated, coupled with a higher percentage of originations coming from new customers. As demand returns we expect a balanced mix between new and returning customers as we saw this quarter and marketing costs as a percentage of revenue to remain near third quarter levels for the remainder of the year.
Customer operations expenses for the third quarter totaled $11 million or 11% of total revenue compared to $10 million or 13% of total revenue last quarter and $9 million or 12% of total revenue for the third quarter of 2020. We continue to drive operating efficiency in our customer center with our automatic approval rate up to 58% versus 51% last quarter and 21% a year ago. This has led our customer center headcount to be down since the beginning of the year. Looking ahead, we expect customer operations expense percentage growth to be less than half of origination percentage growth sequentially, as we saw this quarter with origination growth of over 14% and customer operations expense growth of less than 7%.
Technology, product and analytics expenses for the third quarter totaled $7 million or 8%, which was the same as last quarter, and $5 million or 7% of total revenue for the third quarter of 2020. We continue to invest in technology resources to support enhancements of our AI-powered underwriting engine as well as support the scaling of new products, and as a result we expect technology expenses as a percentage of revenues to remain in the high single digits.
G&A expenses excluding one-time and buybacks for the third quarter totaled $11 million or 12% of total revenue compared to $10 million or 12% of total revenue last quarter, and $8 million or 10% of total revenue for the third quarter of 2020. The increase in G&A expenses was driven by investments in personnel and infrastructure to support the Company’s augmentation of internal controls, operational risk and compliance functions, in addition to higher insurance expenses, as the Company transitioned to becoming a public entity. We expect G&A expenses as a percentage of revenues to remain consistent with the third quarter of 2021 for the remainder of the year.
Adjusted EBITDA was approximately flat sequentially and year-over-year at $32 million as higher net revenues were offset by increased expenses, primarily related to sales and marketing, to drive origination growth. For the nine months ending September 30, 2021, Adjusted EBITDA was $96 million, up 46% versus the nine months ending September 30, 2020, driven by receivables growth and a lower net charge-off ratio.
Our Adjusted EBITDA margin for the quarter was 35% compared to 44% last year and 41% for the second quarter of 2021. As we expected, Adjusted EBITDA margin began normalizing in the third quarter as net charge-offs began returning to pre-COVID levels, coupled with increased marketing spend driven by origination growth.
Interest expenses excluding debt amortization for the third quarter totaled $6 million or 6% of total revenue compared to $4 million or 6% of total revenue last year, and $6 million or 7% of total revenue for the second quarter of 2021. Interest expense was flat versus the previous quarter as we self-funded all of our receivables growth from our cash flow from operations and did not draw additional net senior debt.
5
ViaVid has made considerable efforts to provide an accurate transcription. There may be material errors, omissions, or inaccuracies in the reporting of the substance of the conference call. This transcript is being made available for information purposes only.
1-888-562-0262 1-604-929-1352 www.viavid.com
OppFi – Third Quarter 2021 Earnings Call, November 11, 2021
We recognized adjusted net income of $17 million for the third quarter compared to $18 million the previous quarter and $19 million for the third quarter of 2020. Adjusted net income for the first 9 months of the year was $54 million, up $20 million or 60% from the first nine months of 2020.
As of September 30, 2021, OppFi had 84.5 million total shares outstanding excluding 25.5 million earnout shares. Adjusted earnings per share for the third quarter was $0.21, and $0.64 for the first nine months of the year.
Turning now to the balance sheet, our balance sheet continues to remain healthy driven by strong free cash flows with Q3 2021 cash balances ending at $57 million and a net debt to equity ratio of less than 2 times. As I mentioned, we did not draw additional net senior debt in the third quarter and self-funded receivables growth, transaction expenses and tax distributions. Equity grew $39 million, which includes $69 million of one-time fair value adoption impact and net income of $73 million, partially offset by tax distributions and transaction-related adjustments to equity.
From a funding capacity standpoint, we have a diversified capital structure with nearly $500 million of funding capacity to support our future growth plans including securing financing recently to fund our SalaryTap and Credit Card businesses.
I now want to turn to our 2021 guidance on our financials.
The Company is reiterating its full year 2021 financial outlook with revenues between $350 and $360 million, Adjusted EBITDA between $120 million to $125 million, and adjusted net income between $62 million and $66 million.
OppFi’s expectations for its full year 2021 revenue, Adjusted EBITDA and adjusted net income were based on various material assumptions, including the following: ending receivables of approximately $315 million to $325 million, which would represent approximately 15% to 20% year-over-year growth, reduced from previous expectations due to slower-than-expected demand recovery; net charge-offs as a percentage of average receivables of approximately 35% to 40% due to lower growth in receivables; and yield consistent with historical levels for fourth quarter of 2021.
As Jared highlighted earlier, we are focusing on capturing more market share through product innovation and design. We are confident that our growth trajectory next year will show year-over-year growth in a more normalized demand environment coupled with our product extensions.
Having said that, we remain focused on positioning the platform to capitalize on accelerating volumes over time. More specifically, in tandem with our bank partners, we recently introduced a more personalized approach to pricing. As we roll out more competitive rates for stronger-credit customers, we believe the shift will drive higher volumes and lower net charge-offs, partially offset by a slightly lower gross revenue yield.
To conclude, we remain confident in the long-term prospects of being able to execute our mission to serve the millions of U.S. consumers who are unable to access credit from traditional sources. We are committed to investing in our platform to drive future growth and increased market share. We are currently working through 2022 key assumptions and investment scenarios that will be finalized based on consumer demand at year end, as well as on our Q4 traction on new products and personalized price testing. As such, we plan to provide 2022 guidance on the next earnings call.
With that, we would now like to turn the call over to the operator for the Q&A section of our call. Operator?
6
ViaVid has made considerable efforts to provide an accurate transcription. There may be material errors, omissions, or inaccuracies in the reporting of the substance of the conference call. This transcript is being made available for information purposes only.
1-888-562-0262 1-604-929-1352 www.viavid.com
OppFi – Third Quarter 2021 Earnings Call, November 11, 2021
Operator
Thank you. Ladies and gentlemen, at this time we will be conducting a question-and-answer session.
Our first question comes from the line of David Scharf with JMP Securities. Please proceed with your question.
David Scharf
Hi, good afternoon. Thanks for taking my questions, guys.
Maybe I guess just one and then a follow-up. Jared, kind of reflecting on the demand environment right now, obviously there’s a kind of pretty steep decline in the outlook for year-end balances and kind of in contrast to what a lot of lenders have been sort of noting as maybe some kind of macro tailwinds, in fact, as Delta recedes and employment improves. I’m wondering, as you reflect on kind of the lessening near-term demand relative to kind of your expectations a few months ago, is there any particular channel where conversion rates—either conversion rates or inflow of applications may have fallen off more than others, or is it pretty broad based kind of across all your marketing channels?
Jared Kaplan
I think it’s broad based but it’s more about the difficulty in forecasting demand in an exogenous environment. If you look at the growth versus 2019, it’s quite healthy and unlike a lot of others we never really pulled back in facilitating originations for the bank partners through the pandemic period. We absolutely thought that we would see the continued acceleration, which we did, but it was less so just because I think it’s really challenging in this environment to figure out exactly when people are coming back to the market and that’s driven by the factors that we outlined in the script, I think, on people having more cash and some of the government stimulus pieces and just overall less spending. It’s not a channel-driven phenomenon.
Just overall less than we had expected but at the same time healthy and certainly healthy when you compare us to 2019, the last pre-pandemic period.
David Scharf
Got it. Maybe a related question—it may or may not be, you tell me. I’m wondering, the comments about sort of the personalized pricing approach that you’re exploring, is this something that is in response to potentially either competitive factors, issues over market share, just the current demand environment? Or is this completely separate and it’s just sort of a widening of the funnel and broadening the target consumer base you’re going after?
Jared Kaplan
It’s separate. We’re always looking at elasticity curves and have been looking at a number of things for the last couple of quarters to get conviction on where we think you can drive accelerated customer and revenue growth and the profit pool stays relatively flat, so that’s a good thing for everyone. Plus with more products we can offer more products to these customers once they’re in the ecosystem with us. That’s a driving factor.
I do think we alluded to who’s coming back to the market and we see these lower proprietary scoring customers coming back to the market first, which is in line with what you see after a tax refund season. There are some pieces of what’s happening macroeconomically, right, specifically as it relates to higher wages and some of the government stimulus programs that may be here for a while. So, making sure that we can be flexible and have a win-win where we’re able to offer through the banks lower price products and able to generate additional customer growth I think is a good answer. We would be doing that anyway even without a pandemic, but it’s all in the realm of getting the best price to these customers and making sure we can build up the product suite for them over time.
7
ViaVid has made considerable efforts to provide an accurate transcription. There may be material errors, omissions, or inaccuracies in the reporting of the substance of the conference call. This transcript is being made available for information purposes only.
1-888-562-0262 1-604-929-1352 www.viavid.com
OppFi – Third Quarter 2021 Earnings Call, November 11, 2021
David Scharf
Got it. Great, thank you.
Operator
Our next question comes from the line of Mayank Tandon with Needham & Company. Please proceed with your question.
Mayank Tandon
Thank you. Good evening.
Jared, could you talk a little bit more about the impact of SalaryTap and the credit card product? What should we think in terms of timeline, when it’s going to start to maybe impact the model? And just from a longer term perspective, how does that scale over time, just based on your sort initial investment and plans around that and what you’re hearing in the market?
Jared Kaplan
Both are going to be really interesting products for us, we believe. They’re in slightly different stages; the SalaryTap piece where we think we’ve got the product market fit today and we expect that to continue to scale over time. I think for both SalaryTap and the credit card, they’re still immaterial to the overall receivables picture. I think we are hopeful that we can start breaking them out as separate products in 2022 as those continue to scale.
On the credit card side, we’re testing a number of different options in the marketplace to make sure we’ve got the right product market fit, and we’re pretty confident on the use case by the customer, and that will continue here for the near future, for sure, but we expect that to scale nicely in 2022 as well.
As they become bigger parts of the portfolio we’ll begin breaking them out and talking about them individually, but before we really step on the gas there’s still pieces of both that we are making sure are ready to go so that when we do it we can scale profitably.
Mayank Tandon
Got it. That’s helpful color.
Then just as a quick follow-up—I’m sorry if you already gave this metric—if you look at the marketing cost for funded loan growth, both sequentially and year-over-year, how much of that was driven by higher advertising costs versus a mix shift towards repeat borrowers?
Shiven Shah
Mayank, good question. That was mainly driven by a mix shift. We saw the partner channel continues to take—kind of be the first place where the demand returned, so the partner channel mix was in the high 60s this year versus in the high 50s last year. And then that came from more of the organic channel, so that’s really what drove the increase.
8
ViaVid has made considerable efforts to provide an accurate transcription. There may be material errors, omissions, or inaccuracies in the reporting of the substance of the conference call. This transcript is being made available for information purposes only.
1-888-562-0262 1-604-929-1352 www.viavid.com
OppFi – Third Quarter 2021 Earnings Call, November 11, 2021
Mayank Tandon
Okay. Thanks so much.
Operator
Our next question comes from the line of Mike Grondahl with Northland Securities. Please proceed with your question.
Mike Grondahl
Hey, thank you, guys, and good evening.
Could you talk a little bit about the cadence of originations over July, August, September, and then any comments on October origination activity?
Jared Kaplan
I think in the quarter the origination growth was kind of steady year-over-year in the kind of 20% range year-over-year, and that’s what we’re kind of looking also—you saw that in October and that’s kind of what we’re projecting in the fourth quarter as well.
Mike Grondahl
Got it, got it.
Clearly you’re making progress with SalaryTap and credit card. Is there a next product on the roadmap that we should be thinking about that you guys are working on? What do you think number four and number five might be?
Jared Kaplan
We’ve got some ideas on that. It’s a little premature to talk about them publicly. We did allude to this interesting phenomenon that we’re seeing in the customer base where they’re using lots of different products to smooth cash flow, each of them with high frictional costs, and so this opportunity to provide a bundled suite to a customer and to dramatically reduce their frictional cost is a very interesting strategy that we’ll have more to talk about in the future. You can imagine that additional products will be set up to serve that vision.
Mike Grondahl
Got it, got it. Okay.
I guess lastly, just anything to call out on the competitive environment? Over the last 90 days did you see any major swings?
Jared Kaplan
No. We haven’t. We haven’t seen any new entrants. It is interesting, the TurnUp program, which is a pretty good barometer. We saw that—the match rate tick down a little bit in the quarter, so it was just shy of 2% in the second quarter and it was right around 1.5% for the third quarter, so we saw it drop off a little bit which may suggest that some of the near-prime folks who have come into the market when the pandemic was still full blare have been pulling out a little bit, but nothing material.
9
ViaVid has made considerable efforts to provide an accurate transcription. There may be material errors, omissions, or inaccuracies in the reporting of the substance of the conference call. This transcript is being made available for information purposes only.
1-888-562-0262 1-604-929-1352 www.viavid.com
OppFi – Third Quarter 2021 Earnings Call, November 11, 2021
Mike Grondahl
Got it. Okay, thank you.
Operator
Our next question comes from the line of Chris Donat with Piper Sandler. Please proceed with your question.
Chris Donat
Hey, good afternoon gentlemen.
I know you’re not going to comment much on 2022 but just to kind of follow-up on the question of rollout of SalaryTap and card—and I think I know what your answer is going to be—but should we expect any material impact on yield in 2022 or are they likely to be still pretty darned small in 2022?
Jared Kaplan
We do expect to scale those businesses in ’22, so the overall portfolio yield will kind of come down based on the mix of those products, but we will kind of expect that the volume to be kind of material to offset that.
Chris Donat
Okay. I guess I’m partly asking so if we see an impact in the future we’ll probably—you’ll parse it out for us so that we know that change in mix rather than something else going on.
Jared Kaplan
Yes, we will explain kind of what the drivers of the yield change are and just be very clear on kind of how much of that is mix versus how much of that is other factors.
Chris Donat
Okay. Then just the improvement in your new customer originations in the quarter, are we getting sort of back to normal with that or, like, normal being sort of pre-pandemic, or? I’m just trying to put this in context, your new customer originations as part of the mix.
Jared Kaplan
Yes. Yeah, it’s definitely headed back to normal. I think the mix of those customers did look like what you would see after a typical tax refund season and we think of the pandemic as being like a big tax refund season, so we would expect that pattern to continue as macro economy renormalizes here.
Chris Donat
Okay. Then just thinking a couple of quarters ahead because we had sort of a funky tax season timing-wise during the pandemic, and then there’s some I think normal seasonality and consumer credit has been a little disrupted. Just anything you’re thinking about in terms of seasonal fluctuations that we should be aware of as we think about the fourth quarter and first quarter? Or should we just focus really on your 2021 guidance for the fourth quarter and that kind of hits the highlights?
10
ViaVid has made considerable efforts to provide an accurate transcription. There may be material errors, omissions, or inaccuracies in the reporting of the substance of the conference call. This transcript is being made available for information purposes only.
1-888-562-0262 1-604-929-1352 www.viavid.com
OppFi – Third Quarter 2021 Earnings Call, November 11, 2021
Jared Kaplan
Yes. I think it hits the highlights. We’re not projecting anything atypical into the future. We would expect a much more normal seasonality cadence next year.
Chris Donat
Okay. Okay. Thanks very much. Appreciate it.
Operator
Our next question comes from the line of Chris Brendler with D.A. Davidson. Please proceed with your question.
Chris Brendler
Thanks and good afternoon, guys. Good to hear from you again. Congrats on the results.
I wanted to start with credit quality. Just any sort of color commentary on what you’re seeing. I feel like the demand environment is still somewhat reduced but we’re sure getting back to that 35% to 40% charge-off rate, and I was just wondering sort of how the forward markers were looking as you head into the fourth quarter on credit?
Jared Kaplan
We had guided in the second quarter that we expected charge-offs to renormalize back to kind of pre-pandemic levels as stimulus programs kind of wane. Going into the fourth quarter we expect that to happen. Fourth quarter typically is also a seasonally higher charge-off month based on the seasoning of the vintages normally, so that’s baked into that 35% to 40% kind of projections. Kind of historically, like 2019—sorry.
Historically, 2019, the charge-off rate as a percentage of average receivables was 42%, so that’s kind of at a more normalized level.
Chris Brendler
Got it. Okay, great.
This increasing automation you point to, it’s been a regular disclosure obviously but it’s nice to see that improving. Where does that show up, or is it material, I guess, as you increase that, is it a material reduction in cost?
Jared Kaplan
That comes in customer operations expenses. Normally you’d expect customer operations expenses without any automation to grow in line with origination growth, and what we have seen is that that customer operation growth has grown half of origination growth and that’s where that kind of comes into play. We also mentioned—I mentioned on the script that we haven’t added any customer center headcount during the growth this year.
Chris Brendler
Great. Okay.
11
ViaVid has made considerable efforts to provide an accurate transcription. There may be material errors, omissions, or inaccuracies in the reporting of the substance of the conference call. This transcript is being made available for information purposes only.
1-888-562-0262 1-604-929-1352 www.viavid.com
OppFi – Third Quarter 2021 Earnings Call, November 11, 2021
The fair value receivables are the OppLoan. Accrual accounting is the new products, is that right?
Shiven Shah
Yes. On the OppLoan product we are on fair value accounting, and on the other two products we are continuing to reserve under the old methodology.
Chris Brendler
Okay, so it’s a good way of tracking the progress there is to watch that level.
Shiven Shah
Yes.
Chris Brendler
Let’s see, I think I had one more that I was going to ask.
Any receivables? Pretty close to our number. What are you seeing in terms of the churn for the paydowns or early paydowns? Has that started to improve yet?
Jared Kaplan
The repayment rate is starting to kind of get back to normalized levels. They were elevated during the stimulus period and those are kind of returning back, which is kind of corresponding to what you see on the charge-offs as well.
Chris Brendler
Okay. I apologize if this was asked before but I’ll ask it anyway. Just (cross-talking) from a demand perspective and heading into the holiday season, I don’t think this business has typically been seasonal; it’s more for like auto repairs and stuff like that. We shouldn’t expect a holiday ramp; it’s more steady on a quarter-by-quarter basis?
Jared Kaplan
Fourth quarter is typically a very robust quarter for demand during the holiday season, partly due to spending on the family but also because cash is fungible so if you spend it elsewhere and then you don’t have the money for the holiday season you may use the product to do that. Typically between Thanksgiving and Christmas is a pretty busy time period. We would expect that again this year.
Chris Brendler
Thanks, guys. Appreciate it.
Shiven Shah
Thanks, Chris.
12
ViaVid has made considerable efforts to provide an accurate transcription. There may be material errors, omissions, or inaccuracies in the reporting of the substance of the conference call. This transcript is being made available for information purposes only.
1-888-562-0262 1-604-929-1352 www.viavid.com
OppFi – Third Quarter 2021 Earnings Call, November 11, 2021
Operator
That is all the time we have for questions. I’d like to turn the call back to management for closing remarks.
Jared Kaplan
Thank you so much to everyone that has joined us today. We look forward to continuing to make progress on this story, this platform of the everyday consumer. Lots of good things in the future. Talk to you soon.
Operator
Ladies and gentlemen, this does conclude today’s teleconference. Thank you for your participation. You may disconnect your lines at this time and have a wonderful day.
13
ViaVid has made considerable efforts to provide an accurate transcription. There may be material errors, omissions, or inaccuracies in the reporting of the substance of the conference call. This transcript is being made available for information purposes only.
1-888-562-0262 1-604-929-1352 www.viavid.com
Exhibit 99.3
A Leading FinTech Platform for the Everyday Consumer Q3 2021 Earnings Presentation November 2021
Disclaimer This presentation (the “Presentation”) of OppFi Inc. (“OppFi” or the “Company”) is for information purposes only. Certain information contained herein has been derived from sources prepared by third parties. While such information is believed to be reliable for the purposes used herein, the Company makes no representation or warranty with respect to the accuracy of such information. Trademarks and trade names referred to in this Presentation are the property of their respective owners. The information contained herein does not purport to be all-inclusive. This Presentation does not constitute investment, tax, or legal advice. No representation or warranty, express or implied, is or will be given by the Company or any of its respective affiliates, directors, officers, employees or advisers or any other person as to the accuracy or completeness of the information in this Presentation, and no responsibility or liability whatsoever is accepted for the accuracy or sufficiency thereof or for any errors, omissions or misstatements, negligent or otherwise, relating thereto. The information contained in this Presentation is preliminary in nature and is subject to change, and any such changes may be material. The Company disclaims any duty to update the information contained in this Presentation, which information is given only as of the date of this Presentation unless otherwise stated herein. Forward-Looking Statements This Presentation includes “forward-looking statements” within the meaning of the “safe harbor” provisions of the Private Securities Litigation Reform Act of 1995, Section 27A of the Securities Act of 1933, as amended, and Section 21E of the Securities Exchange Act of 1934, as amended. OppFi’s actual results may differ from its expectations, estimates and projections and consequently, you should not rely on these forward-looking statements as predictions of future events. Words such as “expect,” “estimate,” “project,” “budget,” “forecast,” “anticipate,” “intend,” “plan,” “may,” “will,” “could,” “should,” “believes,” “predicts,” “potential,” “possible,” “continue,” and similar expressions may identify forward-looking statements, but the absence of these words does not mean that a statement is not forward-looking. These forward-looking statements include, without limitation, OppFi’s expectations for its full year 2021 revenue, Adjusted EBITDA and Adjusted Net Income, OppFi’s assumptions underlying any projections, OppFi’s expectations with respect to the future performance of OppFi’s platform, OppFi’s expectations for its growth and profitability and OppFi’s new products, including SalaryTap and OppFi Card, and their performance. These forward-looking statements are based on OppFi’s current expectations and assumptions about future events and are based on currently available information as to the outcome and timing of future events. These forward-looking statements involve significant risks and uncertainties that could cause the actual results to differ materially from the expected results. Most of these factors are outside OppFi’s control and are difficult to predict. Factors that may cause such differences include, but are not limited to: any changes in assumptions underlying projections, such as yield levels, charge off percentages, and receivables growth; the impact of COVID-19 on OppFi’s business; the impact of stimulus or other government programs; the risk that the business combination disrupts current plans and operations; the ability to recognize the anticipated benefits of the business combination, which may be affected by, among other things, competition, the ability of OppFi to grow and manage growth profitably and retain its key employees; costs related to the business combination; changes in applicable laws or regulations; the possibility that OppFi may be adversely affected by other economic, business, and/or competitive factors; and other risks and uncertainties indicated from time to time in OppFi’s filings with the United States Securities and Exchange Commission, in particular, contained in the section or sections captioned “Risk Factors.” OppFi cautions that the foregoing list of factors is not exclusive, and readers should not place undue reliance upon any forward-looking statements, which speak only as of the date made. OppFi does not undertake or accept any obligation or undertaking to release publicly any updates or revisions to any forward-looking statements to reflect any change in its expectations or any change in events, conditions or circumstances on which any such statement is based. Non-GAAP Financial Measures Certain financial information and data contained this Presentation is unaudited and does not conform to Regulation S-X. Accordingly, such information and data may not be included in, may be adjusted in or may be presented differently in, any periodic filing, information or proxy statement, or prospectus or registration statement to be filed by the Company with the SEC. Some of the financial information and data contained in this Presentation, such as Adjusted Net Income and CAGR and Margin thereof, and Adjusted EBITDA, Adjusted EBT and CAGR and Margin thereof, Adjusted Basic and Diluted Earnings Per Share and Fair Value Pro Forma information, including fair value adjustments, have not been prepared in accordance with United States generally accepted accounting principles (“GAAP”). These non-GAAP measures of financial results are not GAAP measures of our financial results or liquidity and should not be considered as an alternative to net income (loss) as a measure of financial results, cash flows from operating activities as a measure of liquidity, or any other performance measure derived in accordance with GAAP. The Company believes these non-GAAP measures of financial results provide useful information to management and investors regarding certain financial and business trends relating to the Company’s financial condition and results of operations. The Company’s management uses these non-GAAP measures for trend analyses and for budgeting and planning purposes. The Company believes that the use of these non-GAAP financial measures provides an additional tool for investors to use in evaluating projected operating results and trends in and in comparing the Company’s financial measures with other similar companies, many of which present similar non-GAAP financial measures to investors. Management does not consider these non-GAAP measures in isolation or as an alternative to financial measures determined in accordance with GAAP. The principal limitation of these non-GAAP financial measures is that they exclude significant expenses and income that are required by GAAP to be recorded in the Company’s financial statements. In addition, they are subject to inherent limitations as they reflect the exercise of judgments by management about which expense and income are excluded or included in determining these non-GAAP financial measures. In order to compensate for these limitations, management presents non-GAAP financial measures in connection with GAAP results. You should review the Company’s audited financial statements, which have been filed by the Company with the SEC. A reconciliation for the Company’s non-GAAP financial measures to the most directly comparable GAAP financial measures is located in the Appendix. A reconciliation of the 2021 full year non-GAAP financial measures to the most directly comparable GAAP financial measures is not included in this Presentation, because, without unreasonable efforts, the Company is unable to predict with reasonable certainty the amount or timing of non-GAAP adjustments that are used to calculate these Non-GAAP financial measures. Projected Financial Information This Presentation contains financial forecasts, including with respect to the Company’s estimated and projected revenue, revenue growth, Adjusted Net Income, Adjusted EBT, Adjusted EBITDA, and CAGR and margins with respect to Adjusted Net Income and Adjusted EBITDA. The Company’s certified public accountant has not audited, reviewed, compiled, or performed any procedures with respect to the projections for the purpose of their inclusion in this Presentation, and accordingly, has not expressed an opinion or provided any other form of assurance with respect thereto for the purpose of this Presentation. These projections should not be relied upon as being necessarily indicative of future results. Any estimates, forecasts or projections set forth in the Presentation have been prepared by the Company in good faith on a basis believed to be reasonable. Such estimates, forecasts and projections involve significant elements of subjective judgment and analysis and reflect numerous judgments, estimates and assumptions that are inherently uncertain in prospective financial information of any kind. As such, no representation can be made as to the attainability of such estimates, forecasts and projections. The recipient is cautioned that such estimates, forecasts or projections have not been audited and have not been prepared in conformity with GAAP. The estimates, forecasts and projections included in this Presentation are subject to a wide variety of significant business, economic and competitive risks and uncertainties that could cause actual results to differ materially from those contained in the prospective financial information, which include, but are not limited to, those mentioned in the prior paragraphs under the caption “Forward-Looking Statements.” The recipient therefore should not rely on the estimates, forecasts or projections contained in the Presentation. No Offer or Solicitation This presentation does not constitute an offer to sell, or the solicitation of an offer to buy, any securities, nor shall there be any sale of securities in any states or jurisdictions in which such offer, solicitation or sale would be unlawful. No offer of securities shall be made except by means of a prospectus meeting the requirements of Section 10 of the Securities Act. Website This Presentation contains reproductions and references to the Company’s website and mobile content. The contents of the website and mobile content are not incorporated into this Presentation. Any references to URLs for the websites are intended to be inactive textual references only. 1
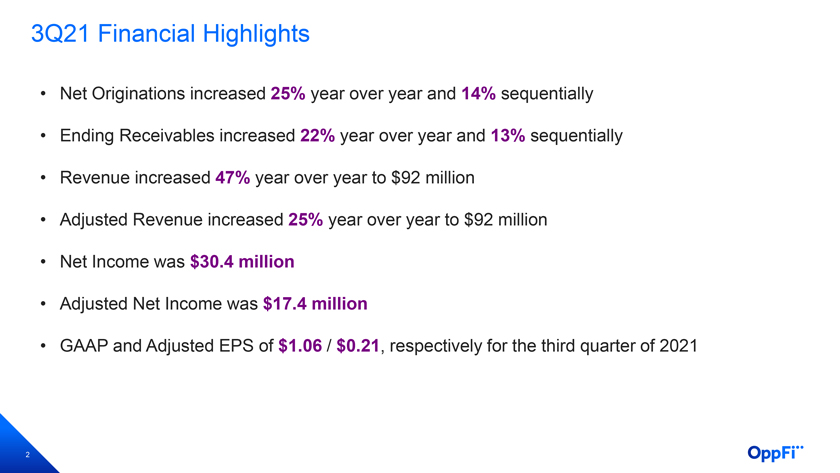
3Q21 Financial Highlights • Net Originations increased 25% year over year and 14% sequentially • Ending Receivables increased 22% year over year and 13% sequentially • Revenue increased 47% year over year to $92 million • Adjusted Revenue increased 25% year over year to $92 million • Net Income was $30.4 million • Adjusted Net Income was $17.4 million • GAAP and Adjusted EPS of $1.06 / $0.21, respectively for the third quarter of 2021 2
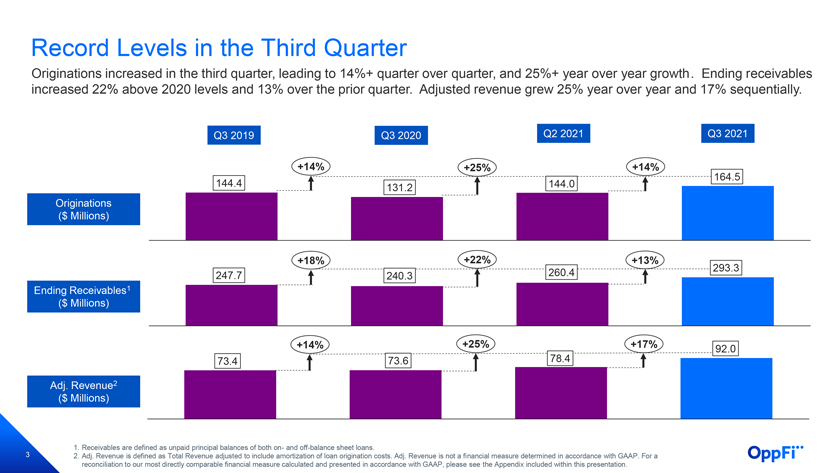
Record Levels in the Third Quarter Originations increased in the third quarter, leading to 14%+ quarter over quarter, and 25%+ year over year growth. Ending receivables increased 22% above 2020 levels and 13% over the prior quarter. Adjusted revenue grew 25% year over year and 17% sequentially. Q3 2019 Q3 2020 Q2 2021 Q3 2021 +14% +25% +14% 164.5 144.4 131.2 144.0 Originations ($ Millions) +18% +22% +13% 260.4 293.3 247.7 240.3 Ending Receivables1 ($ Millions) +14% +25% +17% 92.0 73.4 73.6 78.4 Adj. Revenue2 ($ Millions) 1. Receivables are defined as unpaid principal balances of both on- and off-balance sheet loans. 3 2. Adj. Revenue is defined as Total Revenue adjusted to include amortization of loan origination costs. Adj. Revenue is not a financial measure determined in accordance with GAAP. For a reconciliation to our most directly comparable financial measure calculated and presented in accordance with GAAP, please see the Appendix included within this presentation.
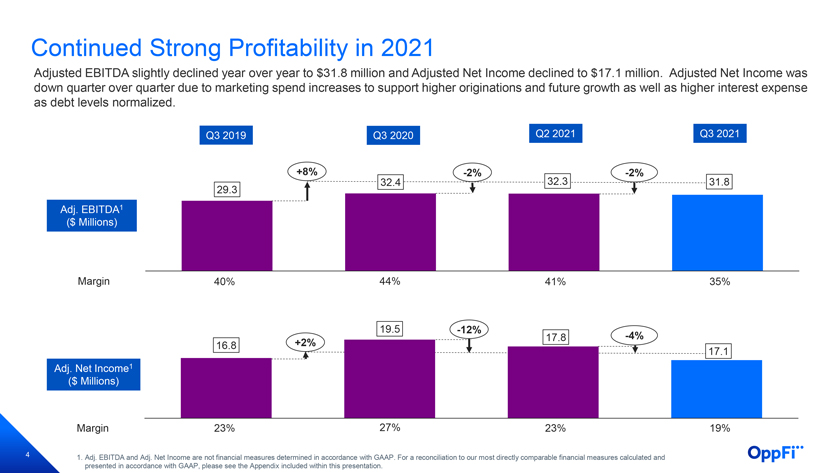
Continued Strong Profitability in 2021 Adjusted EBITDA slightly declined year over year to $31.8 million and Adjusted Net Income declined to $17.1 million. Adjusted Net Income was down quarter over quarter due to marketing spend increases to support higher originations and future growth as well as higher interest expense as debt levels normalized. Q3 2019 Q3 2020 Q2 2021 Q3 2021 +8% -2% 32.3 -2% 32.4 31.8 29.3 Adj. EBITDA1 ($ Millions) Margin 40% 44% 41% 35% 19.5 -12% 17.8 -4% 16.8 +2% 17.1 Adj. Net Income1 ($ Millions) Margin 23% 27% 23% 19% 4 1. Adj. EBITDA and Adj. Net Income are not financial measures determined in accordance with GAAP. For a reconciliation to our most directly comparable financial measures calculated and presented in accordance with GAAP, please see the Appendix included within this presentation.
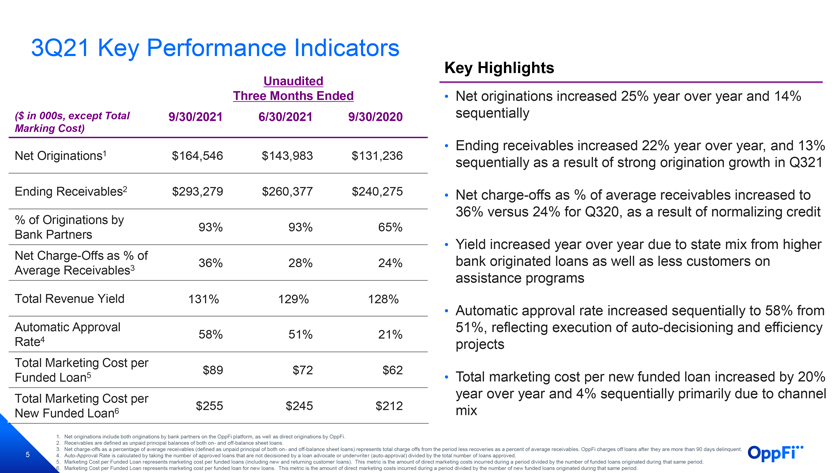
3Q21 Key Performance Indicators Key Highlights Unaudited Three Months Ended • Net originations increased 25% year over year and 14% ($ in 000s, except Total 9/30/2021 6/30/2021 9/30/2020 sequentially Marking Cost) • Ending receivables increased 22% year over year, and 13% Net Originations1 $164,546 $143,983 $131,236 sequentially as a result of strong origination growth in Q321 Ending Receivables2 $293,279 $260,377 $240,275 Net charge-offs as % average receivables increased • of to 36% versus 24% for Q320, as a result of normalizing credit % of Originations by 93% 93% 65% Bank Partners Net Charge-Offs as % of • Yield increased year over year due to state mix from higher 36% 28% 24% bank originated loans as well as less customers on Average Receivables3 assistance programs Total Revenue Yield 131% 129% 128% approval rate increased sequentially to • Automatic 58% from Automatic Approval 51%, reflecting execution of auto-decisioning and efficiency 58% 51% 21% Rate4 projects Total Marketing Cost per $89 $72 $62 Funded Loan5 • Total marketing cost per new funded loan increased by 20% Total Marketing Cost per year over year and 4% sequentially primarily due to channel $255 $245 $212 New Funded Loan6 mix 1. Net originations include both originations by bank partners on the OppFi platform, as well as direct originations by OppFi. 2. Receivables are defined as unpaid principal balances of both on- and off-balance sheet loans. 5 3. Net charge-offs as a percentage of average receivables (defined as unpaid principal of both on- and off-balance sheet loans) represents total charge offs from the period less recoveries as a percent of average receivables. OppFi charges off loans after they are more than 90 days delinquent. 4. Auto-Approval Rate is calculated by taking the number of approved loans that are not decisioned by a loan advocate or underwriter (auto-approval) divided by the total number of loans approved. 5. Marketing Cost per Funded Loan represents marketing cost per funded loans (including new and returning customer loans). This metric is the amount of direct marketing costs incurred during a period divided by the number of funded loans originated during that same period. 6. Marketing Cost per Funded Loan represents marketing cost per funded loan for new loans. This metric is the amount of direct marketing costs incurred during a period divided by the number of new funded loans originated during that same period.
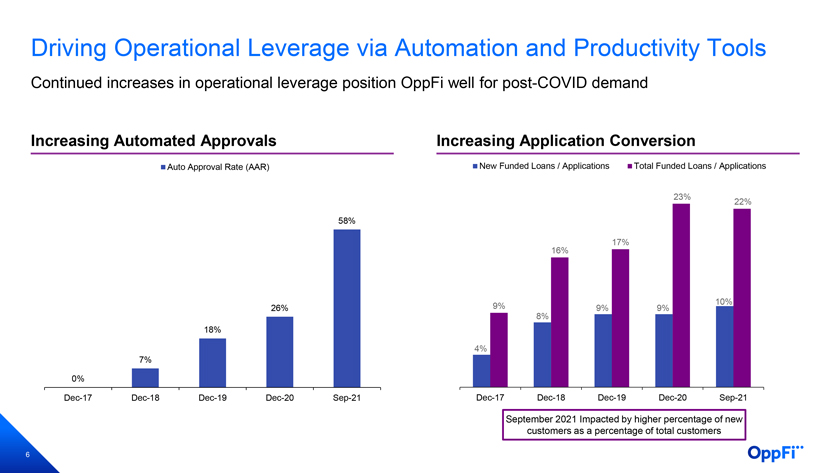
Driving Operational Leverage via Automation and Productivity Tools Continued increases in operational leverage position OppFi well for post-COVID demand Increasing Automated Approvals Increasing Application Conversion Auto Approval Rate (AAR) New Funded Loans / Applications Total Funded Loans / Applications 23% 22% 58% 17% 16% 10% 26% 9% 9% 9% 8% 18% 4% 7% 0% Dec-17 Dec-18 Dec-19 Dec-20 Sep-21 Dec-17 Dec-18 Dec-19 Dec-20 Sep-21 September 2021 Impacted by higher percentage of new customers as a percentage of total customers 6

Balance Sheet Highlights Unaudited ($ in 000s) 9/30/2021 12/31/2020 Key Highlights of Changes from 12/31/2020 Assets • Year-to-date cash growth of $11 million driven by higher Cash and restricted cash $56,802 $45,657 free cash flow from operations and financing activities, Finance Receivables at Fair offset partially by transaction expenses and tax 334,114 - Value distributions Finance Receivables at 1,269 222,243 Amortized Cost, Net • Total debt increased $68 million, driven by an increase in Other Assets 48,469 17,943 leverage facilities due to higher receivables and utilization and net impact from corporate credit facility refinancing Total Assets $440,654 $285,843 • Equity growth of $39 million includes $69 million of one-Liabilities and Stockholders’/Members’ Equity time fair value adoption impact and net income of $73 million, partially offset by tax distributions and transaction Other Liabilities $51,976 $28,406 related adjustments to equity. Total Debt 225,759 158,105 Warrant Liability 24,506 - Total Liabilities $302,241 $186,511 Total Equity 138,413 99,332 Total Liabilities and Equity $440,654 $285,843 7
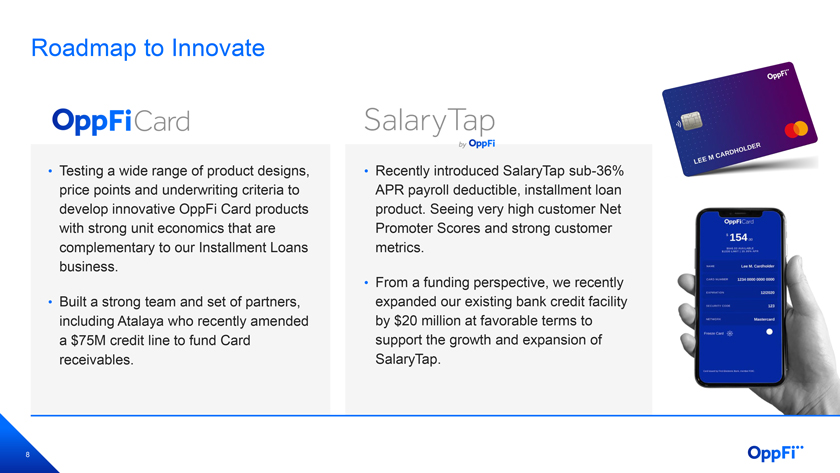
Roadmap to Innovate • Testing a wide range of product designs, • Recently introduced SalaryTap sub-36% price points and underwriting criteria to APR payroll deductible, installment loan develop innovative OppFi Card products product. Seeing very high customer Net with strong unit economics that are Promoter Scores and strong customer complementary to our Installment Loans metrics. business. • From a funding perspective, we recently • Built a strong team and set of partners, expanded our existing bank credit facility including Atalaya who recently amended by $20 million at favorable terms to a $75M credit line to fund Card support the growth and expansion of receivables. SalaryTap. 8
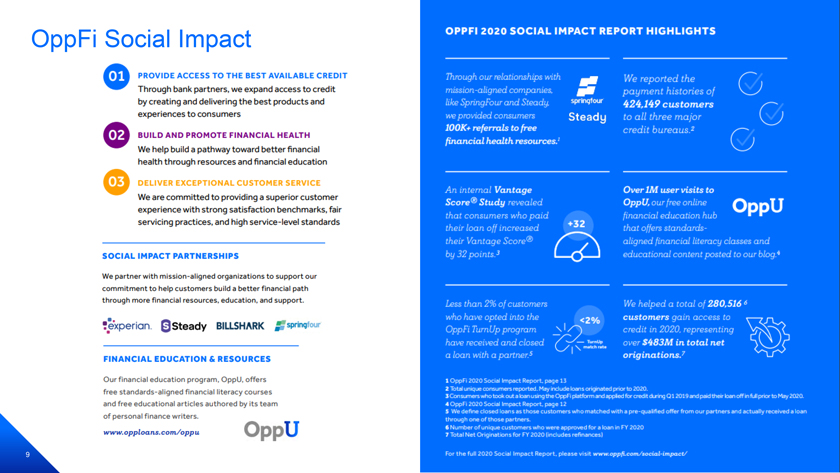
OppFi Social Impact 9 OPPFI 2020 SOCIAL IMPACT REPORT HIGHLIGHTS
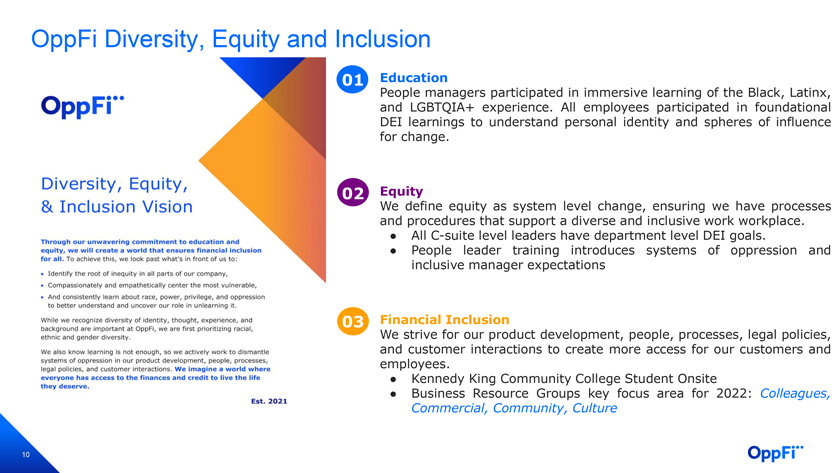
OppFi Diversity, Equity and Inclusion 01 Education People managers participated in immersive learning of the Black, Latinx, and LGBTQIA+ experience. All employees participated in foundational DEI learnings to understand personal identity and spheres of influence for change. 02 Equity We define equity as system level change, ensuring we have processes and procedures that support a diverse and inclusive work workplace. • All C-suite level leaders have department level DEI goals. • People leader training introduces systems of oppression and inclusive manager expectations 03 Financial Inclusion We strive for our product development, people, processes, legal policies, and customer interactions to create more access for our customers and employees. • Kennedy King Community College Student Onsite • Business Resource Groups key focus area for 2022: Colleagues, Commercial, Community, Culture 10
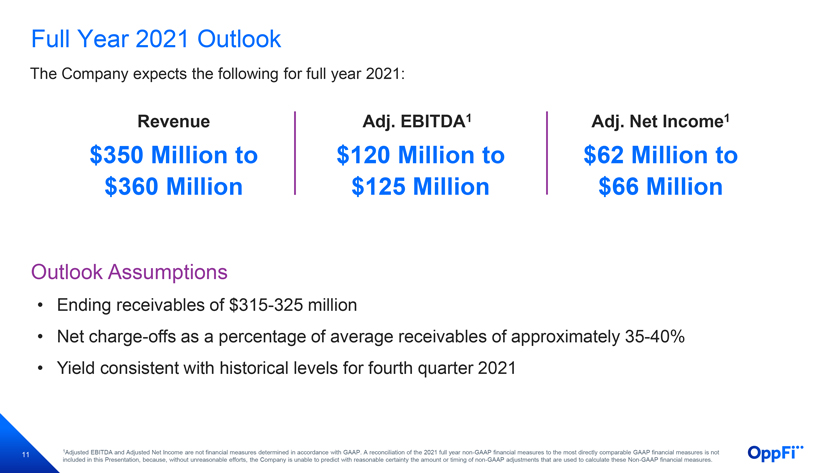
Full Year 2021 Outlook The Company expects the following for full year 2021: Revenue Adj. EBITDA1 Adj. Net Income1 $350 Million to $120 Million to $62 Million to $360 Million $125 Million $66 Million Outlook Assumptions • Ending receivables of $315-325 million • Net charge-offs as a percentage of average receivables of approximately 35-40% • Yield consistent with historical levels for fourth quarter 2021 1Adjusted EBITDA and Adjusted Net Income are not financial measures determined in accordance with GAAP. A reconciliation of the 2021 full year non-GAAP financial measures to the most directly comparable GAAP financial measures is not 11 included in this Presentation, because, without unreasonable efforts, the Company is unable to predict with reasonable certainty the amount or timing of non-GAAP adjustments that are used to calculate these Non-GAAP financial measures.
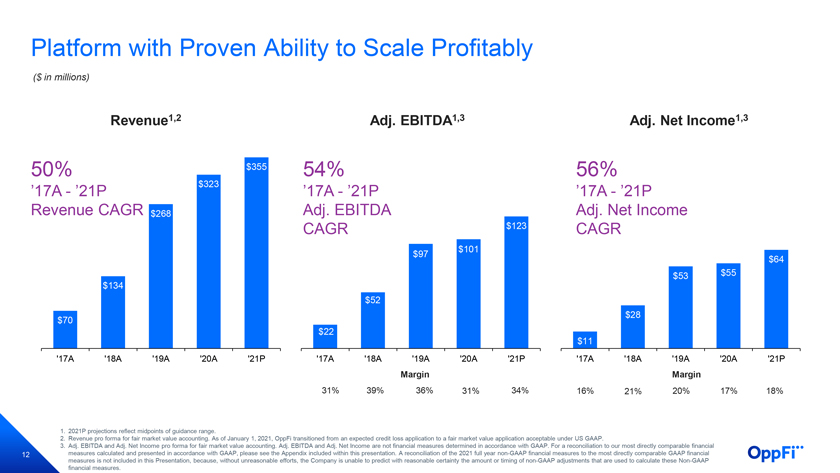
Platform with Proven Ability to Scale Profitably ($ in millions) Revenue1,2 Adj. EBITDA1,3 Adj. Net Income1,3 50% $355 54% 56% ’17A—’21P $323 ’17A—’21P ’17A—’21P Revenue CAGR $268 Adj. EBITDA Adj. Net Income CAGR $123 CAGR $101 $97 $64 $53 $55 $134 $52 $28 $70 $22 $11 ’17A ‘18A ‘19A ‘20A ‘21P ‘17A ‘18A ‘19A ‘20A ‘21P ‘17A ‘18A ‘19A ‘20A ‘21P Margin Margin 31% 39% 36% 31% 34% 16% 21% 20% 17% 18% 1. 2021P projections reflect midpoints of guidance range. 2. Revenue pro forma for fair market value accounting. As of January 1, 2021, OppFi transitioned from an expected credit loss application to a fair market value application acceptable under US GAAP. 3. Adj. EBITDA and Adj. Net Income pro forma for fair market value accounting. Adj. EBITDA and Adj. Net Income are not financial measures determined in accordance with GAAP. For a reconciliation to our most directly comparable financial 12 measures calculated and presented in accordance with GAAP, please see the Appendix included within this presentation. A reconciliation of the 2021 full year non-GAAP financial measures to the most directly comparable GAAP financial measures is not included in this Presentation, because, without unreasonable efforts, the Company is unable to predict with reasonable certainty the amount or timing of non-GAAP adjustments that are used to calculate these Non-GAAP financial measures.

Appendix 13
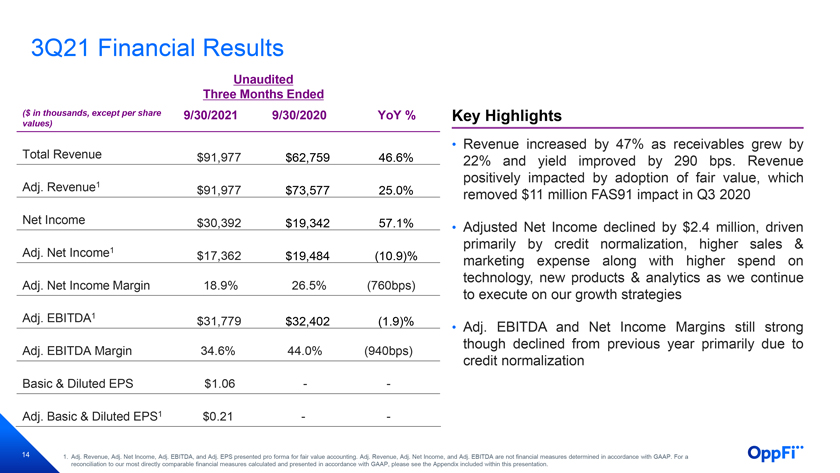
3Q21 Financial Results Unaudited Three Months Ended ($ in thousands, except per share 9/30/2021 9/30/2020 YoY % Key Highlights values) • Revenue increased by 47% as receivables grew by Total Revenue $91,977 $62,759 46.6% 22% and yield improved by 290 bps. Revenue positively impacted by adoption of fair value, which Adj. Revenue1 $91,977 $73,577 25.0% removed $11 million FAS91 impact in Q3 2020 Net Income $30,392 $19,342 57.1% • Adjusted Net Income declined by $2.4 million, driven primarily by credit normalization, higher sales & Adj. Net Income1 $17,362 $19,484 (10.9)% marketing expense along with higher spend on technology, new products & analytics as we continue Adj. Net Income Margin 18.9% 26.5% (760bps) to execute on our growth strategies Adj. EBITDA1 $31,779 $32,402 (1.9)% • Adj. EBITDA and Net Income Margins still strong though declined from previous year primarily due to Adj. EBITDA Margin 34.6% 44.0% (940bps) credit normalization Basic & Diluted EPS $1.06 — Adj. Basic & Diluted EPS1 $0.21 — 14 1. Adj. Revenue, Adj. Net Income, Adj. EBITDA, and Adj. EPS presented pro forma for fair value accounting. Adj. Revenue, Adj. Net Income, and Adj. EBITDA are not financial measures determined in accordance with GAAP. For a reconciliation to our most directly comparable financial measures calculated and presented in accordance with GAAP, please see the Appendix included within this presentation.
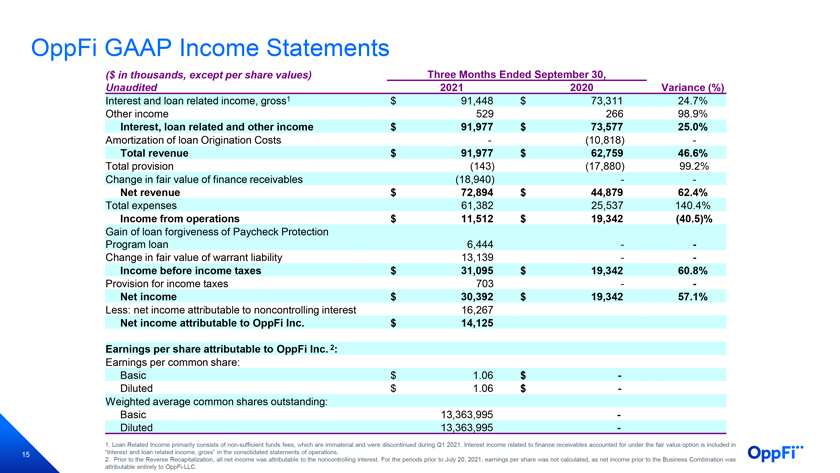
OppFi GAAP Income Statements ($ in thousands, except per share values) Three Months Ended September 30, Unaudited 2021 2020 Variance (%) Interest and loan related income, gross1 $ 91,448 $ 73,311 24.7% Other income 529 266 98.9% Interest, loan related and other income $ 91,977 $ 73,577 25.0% Amortization of loan Origination Costs—(10,818) - Total revenue $ 91,977 $ 62,759 46.6% Total provision (143) (17,880) 99.2% Change in fair value of finance receivables (18,940) — Net revenue $ 72,894 $ 44,879 62.4% Total expenses 61,382 25,537 140.4% Income from operations $ 11,512 $ 19,342 (40.5)% Gain of loan forgiveness of Paycheck Protection Program loan 6,444—-Change in fair value of warrant liability 13,139—-Income before income taxes $ 31,095 $ 19,342 60.8% Provision for income taxes 703—-Net income $ 30,392 $ 19,342 57.1% Less: net income attributable to noncontrolling interest 16,267 Net income attributable to OppFi Inc. $ 14,125 Earnings per share attributable to OppFi Inc. 2: Earnings per common share: Basic $ 1.06 $ -Diluted $ 1.06 $ - Weighted average common shares outstanding: Basic 13,363,995 -Diluted 13,363,995 - 1. Loan Related Income primarily consists of non-sufficient funds fees, which are immaterial and were discontinued during Q1 2021. Interest income related to finance receivables accounted for under the fair value option is included in 15 “Interest and loan related income, gross” in the consolidated statements of operations. 2. Prior to the Reverse Recapitalization, all net income was attributable to the noncontrolling interest. For the periods prior to July 20, 2021, earnings per share was not calculated, as net income prior to the Business Combination was attributable entirely to OppFi-LLC.
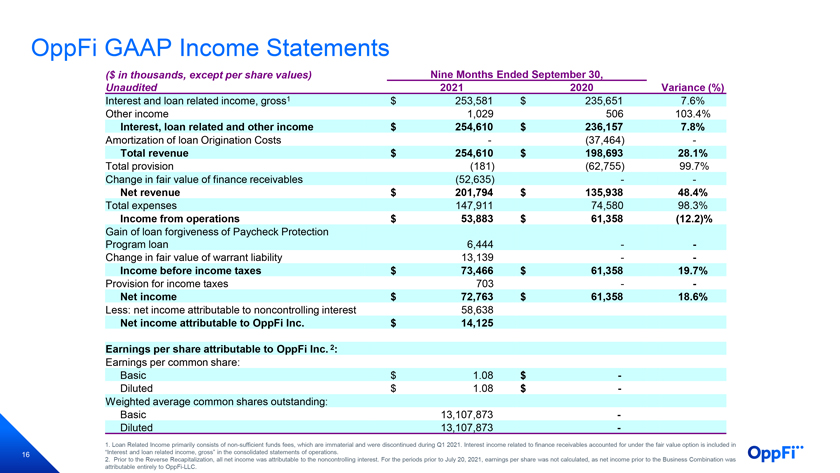
OppFi GAAP Income Statements ($ in thousands, except per share values) Nine Months Ended September 30, Unaudited 2021 2020 Variance (%) Interest and loan related income, gross1 $ 253,581 $ 235,651 7.6% Other income 1,029 506 103.4% Interest, loan related and other income $ 254,610 $ 236,157 7.8% Amortization of loan Origination Costs—(37,464) - Total revenue $ 254,610 $ 198,693 28.1% Total provision (181) (62,755) 99.7% Change in fair value of finance receivables (52,635) — Net revenue $ 201,794 $ 135,938 48.4% Total expenses 147,911 74,580 98.3% Income from operations $ 53,883 $ 61,358 (12.2)% Gain of loan forgiveness of Paycheck Protection Program loan 6,444—-Change in fair value of warrant liability 13,139—-Income before income taxes $ 73,466 $ 61,358 19.7% Provision for income taxes 703—-Net income $ 72,763 $ 61,358 18.6% Less: net income attributable to noncontrolling interest 58,638 Net income attributable to OppFi Inc. $ 14,125 Earnings per share attributable to OppFi Inc. 2: Earnings per common share: Basic $ 1.08 $ -Diluted $ 1.08 $ - Weighted average common shares outstanding: Basic 13,107,873 -Diluted 13,107,873 - 1. Loan Related Income primarily consists of non-sufficient funds fees, which are immaterial and were discontinued during Q1 2021. Interest income related to finance receivables accounted for under the fair value option is included in 16 “Interest and loan related income, gross” in the consolidated statements of operations. 2. Prior to the Reverse Recapitalization, all net income was attributable to the noncontrolling interest. For the periods prior to July 20, 2021, earnings per share was not calculated, as net income prior to the Business Combination was attributable entirely to OppFi-LLC.
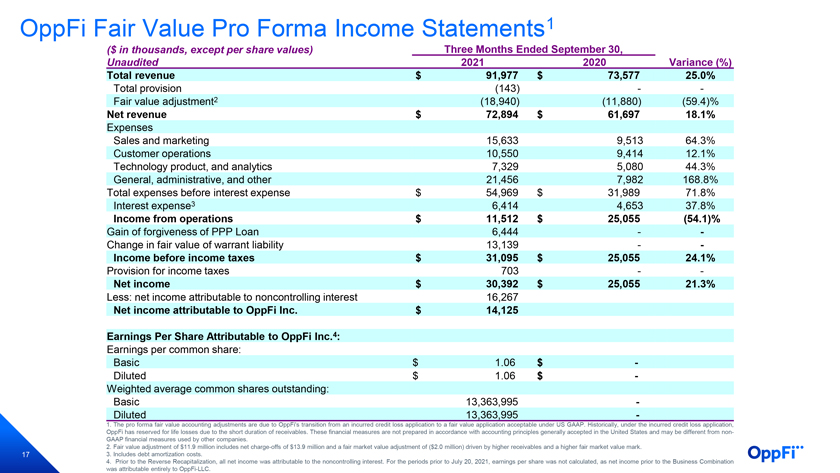
OppFi Fair Value Pro Forma Income Statements1 ($ in thousands, except per share values) Three Months Ended September 30, Unaudited 2021 2020 Variance (%) Total revenue $ 91,977 $ 73,577 25.0% Total provision (143) —Fair value adjustment2 (18,940) (11,880) (59.4)% Net revenue $ 72,894 $ 61,697 18.1% Expenses Sales and marketing 15,633 9,513 64.3% Customer operations 10,550 9,414 12.1% Technology product, and analytics 7,329 5,080 44.3% General, administrative, and other 21,456 7,982 168.8% Total expenses before interest expense $ 54,969 $ 31,989 71.8% Interest expense3 6,414 4,653 37.8% Income from operations $ 11,512 $ 25,055 (54.1)% Gain of forgiveness of PPP Loan 6,444—-Change in fair value of warrant liability 13,139—-Income before income taxes $ 31,095 $ 25,055 24.1% Provision for income taxes 703 — Net income $ 30,392 $ 25,055 21.3% Less: net income attributable to noncontrolling interest 16,267 Net income attributable to OppFi Inc. $ 14,125 Earnings Per Share Attributable to OppFi Inc.4: Earnings per common share: Basic $ 1.06 $ -Diluted $ 1.06 $ - Weighted average common shares outstanding: Basic 13,363,995 -Diluted 13,363,995 - 1. The pro forma fair value accounting adjustments are due to OppFi’s transition from an incurred credit loss application to a fair value application acceptable under US GAAP. Historically, under the incurred credit loss application, OppFi has reserved for life losses due to the short duration of receivables. These financial measures are not prepared in accordance with accounting principles generally accepted in the United States and may be different from non-GAAP financial measures used by other companies. 2. Fair value adjustment of $11.9 million includes net charge-offs of $13.9 million and a fair market value adjustment of ($2.0 million) driven by higher receivables and a higher fair market value mark. 17 3. Includes debt amortization costs. 4. Prior to the Reverse Recapitalization, all net income was attributable to the noncontrolling interest. For the periods prior to July 20, 2021, earnings per share was not calculated, as net income prior to the Business Combination was attributable entirely to OppFi-LLC.
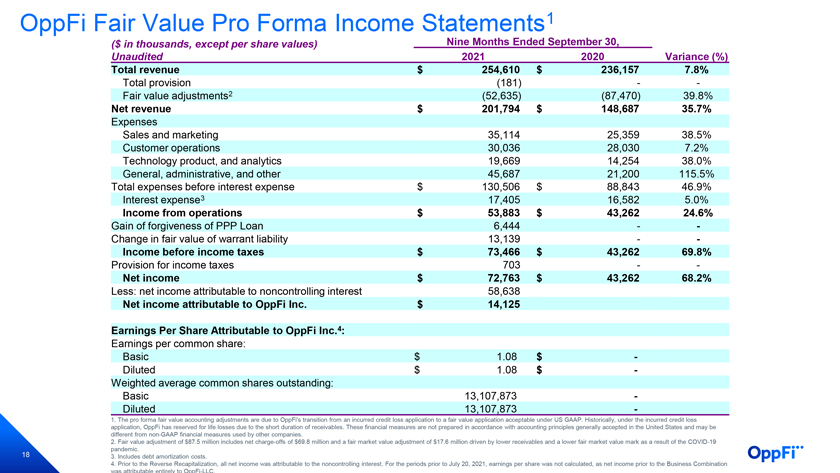
OppFi Fair Value Pro Forma Income Statements1 ($ in thousands, except per share values) Nine Months Ended September 30, Unaudited 2021 2020 Variance (%) Total revenue $ 254,610 $ 236,157 7.8% Total provision (181) —Fair value adjustments2 (52,635) (87,470) 39.8% Net revenue $ 201,794 $ 148,687 35.7% Expenses Sales and marketing 35,114 25,359 38.5% Customer operations 30,036 28,030 7.2% Technology product, and analytics 19,669 14,254 38.0% General, administrative, and other 45,687 21,200 115.5% Total expenses before interest expense $ 130,506 $ 88,843 46.9% Interest expense3 17,405 16,582 5.0% Income from operations $ 53,883 $ 43,262 24.6% Gain of forgiveness of PPP Loan 6,444—-Change in fair value of warrant liability 13,139—-Income before income taxes $ 73,466 $ 43,262 69.8% Provision for income taxes 703 — Net income $ 72,763 $ 43,262 68.2% Less: net income attributable to noncontrolling interest 58,638 Net income attributable to OppFi Inc. $ 14,125 Earnings Per Share Attributable to OppFi Inc.4: Earnings per common share: Basic $ 1.08 $ -Diluted $ 1.08 $ - Weighted average common shares outstanding: Basic 13,107,873 -Diluted 13,107,873 - 1. The pro forma fair value accounting adjustments are due to OppFi’s transition from an incurred credit loss application to a fair value application acceptable under US GAAP. Historically, under the incurred credit loss application, OppFi has reserved for life losses due to the short duration of receivables. These financial measures are not prepared in accordance with accounting principles generally accepted in the United States and may be different from non-GAAP financial measures used by other companies. 2. Fair value adjustment of $87.5 million includes net charge-offs of $69.8 million and a fair market value adjustment of $17.6 million driven by lower receivables and a lower fair market value mark as a result of the COVID-19 18 pandemic. 3. Includes debt amortization costs. 4. Prior to the Reverse Recapitalization, all net income was attributable to the noncontrolling interest. For the periods prior to July 20, 2021, earnings per share was not calculated, as net income prior to the Business Combination was attributable entirely to OppFi-LLC.
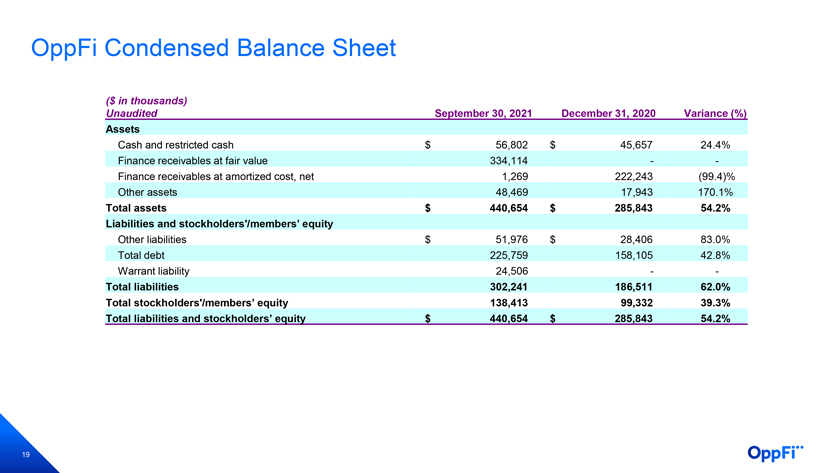
OppFi Condensed Balance Sheet ($ in thousands) Unaudited September 30, 2021 December 31, 2020 Variance (%) Assets Cash and restricted cash $ 56,802 $ 45,657 24.4% Finance receivables at fair value 334,114 —Finance receivables at amortized cost, net 1,269 222,243 (99.4)% Other assets 48,469 17,943 170.1% Total assets $ 440,654 $ 285,843 54.2% Liabilities and stockholders’/members’ equity Other liabilities $ 51,976 $ 28,406 83.0% Total debt 225,759 158,105 42.8% Warrant liability 24,506 — Total liabilities 302,241 186,511 62.0% Total stockholders’/members’ equity 138,413 99,332 39.3% Total liabilities and stockholders’ equity $ 440,654 $ 285,843 54.2% 19
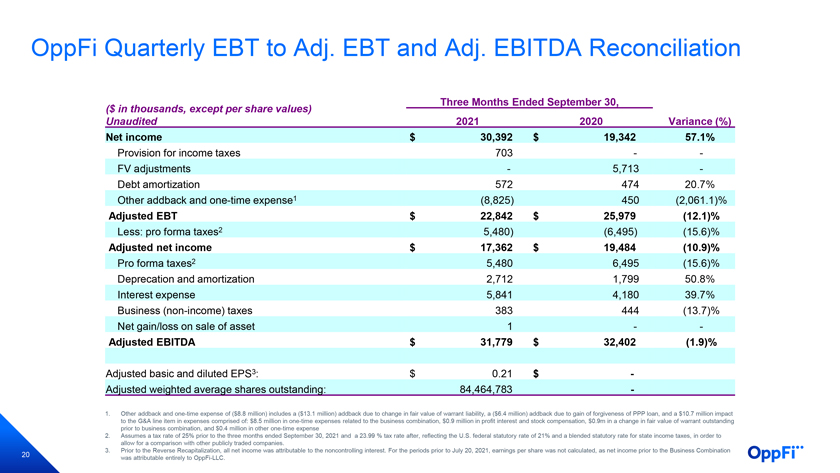
OppFi Quarterly EBT to Adj. EBT and Adj. EBITDA Reconciliation Three Months Ended September 30, ($ in thousands, except per share values) Unaudited 2021 2020 Variance (%) Net income $ 30,392 $ 19,342 57.1% Provision for income taxes 703—-FV adjustments—5,713 -Debt amortization 572 474 20.7% Other addback and one-time expense1 (8,825) 450 (2,061.1)% Adjusted EBT $ 22,842 $ 25,979 (12.1)% Less: pro forma taxes2 5,480) (6,495) (15.6)% Adjusted net income $ 17,362 $ 19,484 (10.9)% Pro forma taxes2 5,480 6,495 (15.6)% Deprecation and amortization 2,712 1,799 50.8% Interest expense 5,841 4,180 39.7% Business (non-income) taxes 383 444 (13.7)% Net gain/loss on sale of asset 1 — Adjusted EBITDA $ 31,779 $ 32,402 (1.9)% Adjusted basic and diluted EPS3: $ 0.21 $ -Adjusted weighted average shares outstanding: 84,464,783 - 1. Other addback and one-time expense of ($8.8 million) includes a ($13.1 million) addback due to change in fair value of warrant liability, a ($6.4 million) addback due to gain of forgiveness of PPP loan, and a $10.7 million impact to the G&A line item in expenses comprised of: $8.5 million in one-time expenses related to the business combination, $0.9 million in profit interest and stock compensation, $0.9m in a change in fair value of warrant outstanding prior to business combination, and $0.4 million in other one-time expense 2. Assumes a tax rate of 25% prior to the three months ended September 30, 2021 and a 23.99 % tax rate after, reflecting the U.S. federal statutory rate of 21% and a blended statutory rate for state income taxes, in order to allow for a comparison with other publicly traded companies. 3. Prior to the Reverse Recapitalization, all net income was attributable to the noncontrolling interest. For the periods prior to July 20, 2021, earnings per share was not calculated, as net income prior to the Business Combination 20 was attributable entirely to OppFi-LLC.
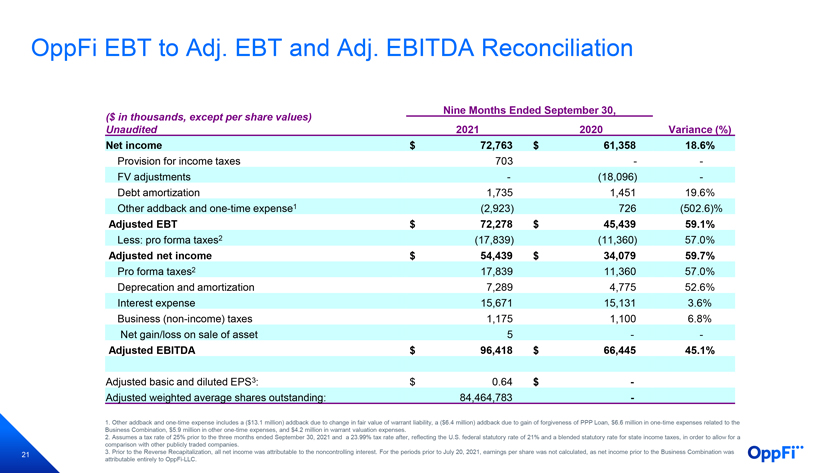
OppFi EBT to Adj. EBT and Adj. EBITDA Reconciliation Nine Months Ended September 30, ($ in thousands, except per share values) Unaudited 2021 2020 Variance (%) Net income $ 72,763 $ 61,358 18.6% Provision for income taxes 703—-FV adjustments—(18,096) -Debt amortization 1,735 1,451 19.6% Other addback and one-time expense1 (2,923) 726 (502.6)% Adjusted EBT $ 72,278 $ 45,439 59.1% Less: pro forma taxes2 (17,839) (11,360) 57.0% Adjusted net income $ 54,439 $ 34,079 59.7% Pro forma taxes2 17,839 11,360 57.0% Deprecation and amortization 7,289 4,775 52.6% Interest expense 15,671 15,131 3.6% Business (non-income) taxes 1,175 1,100 6.8% Net gain/loss on sale of asset 5 — Adjusted EBITDA $ 96,418 $ 66,445 45.1% Adjusted basic and diluted EPS3: $ 0.64 $ -Adjusted weighted average shares outstanding: 84,464,783 - 1. Other addback and one-time expense includes a ($13.1 million) addback due to change in fair value of warrant liability, a ($6.4 million) addback due to gain of forgiveness of PPP Loan, $6.6 million in one-time expenses related to the Business Combination, $5.9 million in other one-time expenses, and $4.2 million in warrant valuation expenses. 2. Assumes a tax rate of 25% prior to the three months ended September 30, 2021 and a 23.99% tax rate after, reflecting the U.S. federal statutory rate of 21% and a blended statutory rate for state income taxes, in order to allow for a comparison with other publicly traded companies. 21 3. Prior to the Reverse Recapitalization, all net income was attributable to the noncontrolling interest. For the periods prior to July 20, 2021, earnings per share was not calculated, as net income prior to the Business Combination was attributable entirely to OppFi-LLC.
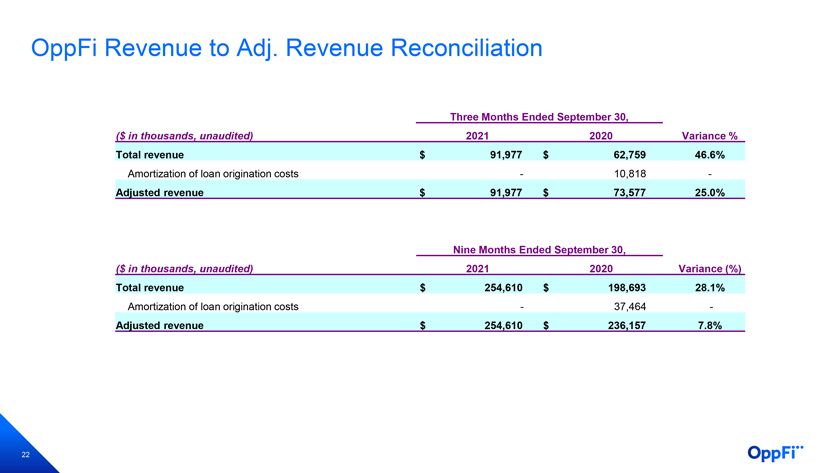
OppFi Revenue to Adj. Revenue Reconciliation Three Months Ended September 30, ($ in thousands, unaudited) 2021 2020 Variance % Total revenue $ 91,977 $ 62,759 46.6% Amortization of loan origination costs—10,818 - Adjusted revenue $ 91,977 $ 73,577 25.0% Nine Months Ended September 30, ($ in thousands, unaudited) 2021 2020 Variance (%) Total revenue $ 254,610 $ 198,693 28.1% Amortization of loan origination costs—37,464 - Adjusted revenue $ 254,610 $ 236,157 7.8% 22
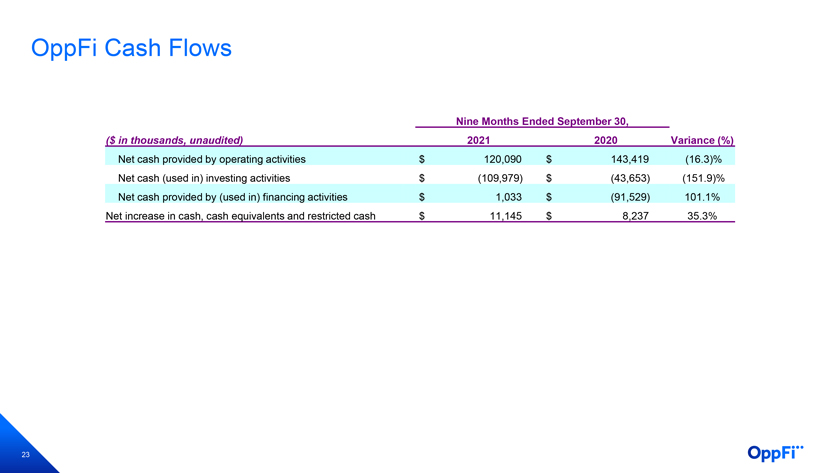
OppFi Cash Flows Nine Months Ended September 30, ($ in thousands, unaudited) 2021 2020 Variance (%) Net cash provided by operating activities $ 120,090 $ 143,419 (16.3)% Net cash (used in) investing activities $ (109,979) $ (43,653) (151.9)% Net cash provided by (used in) financing activities $ 1,033 $ (91,529) 101.1% Net increase in cash, cash equivalents and restricted cash $ 11,145 $ 8,237 35.3% 23
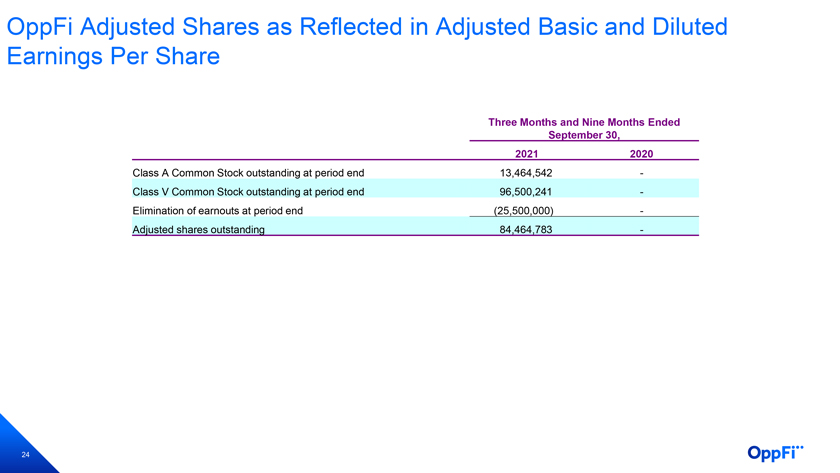
OppFi Adjusted Shares as Reflected in Adjusted Basic and Diluted Earnings Per Share Three Months and Nine Months Ended September 30, 2021 2020 Class A Common Stock outstanding at period end 13,464,542 -Class V Common Stock outstanding at period end 96,500,241 -Elimination of earnouts at period end (25,500,000) -Adjusted shares outstanding 84,464,783 - 24
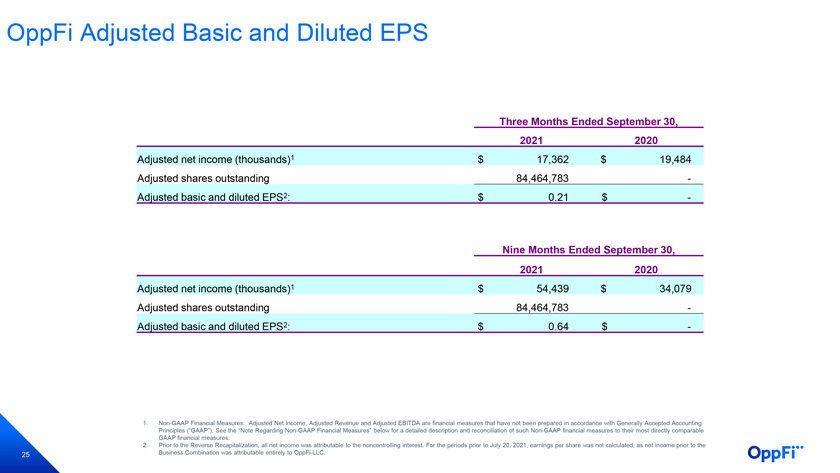
OppFi Adjusted Basic and Diluted EPS Three Months Ended September 30, 2021 2020 Adjusted net income (thousands)1 $ 17,362 $ 19,484 Adjusted shares outstanding 84,464,783 -Adjusted basic and diluted EPS2: $ 0.21 $ - Nine Months Ended September 30, 2021 2020 Adjusted net income (thousands)1 $ 54,439 $ 34,079 Adjusted shares outstanding 84,464,783 -Adjusted basic and diluted EPS2: $ 0.64 $ - 1. Non-GAAP Financial Measures: Adjusted Net Income, Adjusted Revenue and Adjusted EBITDA are financial measures that have not been prepared in accordance with Generally Accepted Accounting Principles (“GAAP”). See the “Note Regarding Non-GAAP Financial Measures” below for a detailed description and reconciliation of such Non-GAAP financial measures to their most directly comparable GAAP financial measures. 2. Prior to the Reverse Recapitalization, all net income was attributable to the noncontrolling interest. For the periods prior to July 20, 2021, earnings per share was not calculated, as net income prior to the 25 Business Combination was attributable entirely to OppFi-LLC.
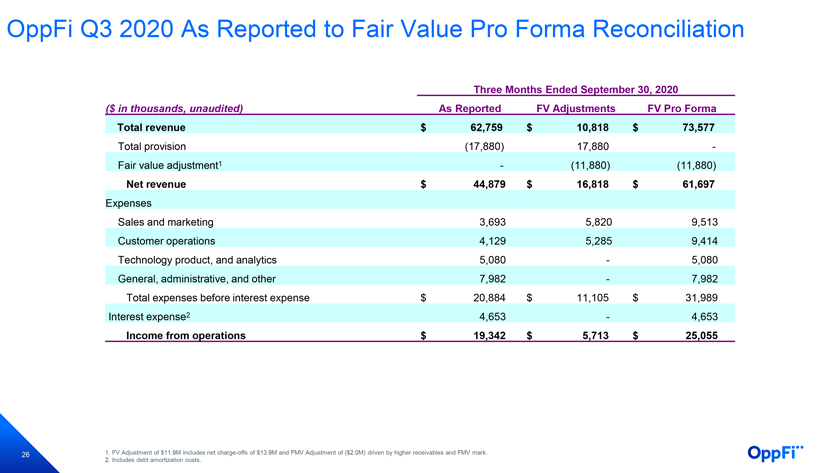
OppFi Q3 2020 As Reported to Fair Value Pro Forma Reconciliation Three Months Ended September 30, 2020 ($ in thousands, unaudited) As Reported FV Adjustments FV Pro Forma Total revenue $ 62,759 $ 10,818 $ 73,577 Total provision (17,880) 17,880 -Fair value adjustment1—(11,880) (11,880) Net revenue $ 44,879 $ 16,818 $ 61,697 Expenses Sales and marketing 3,693 5,820 9,513 Customer operations 4,129 5,285 9,414 Technology product, and analytics 5,080—5,080 General, administrative, and other 7,982—7,982 Total expenses before interest expense $ 20,884 $ 11,105 $ 31,989 Interest expense2 4,653—4,653 Income from operations $ 19,342 $ 5,713 $ 25,055 26 1. FV Adjustment of $11.9M includes net charge-offs of $13.9M and FMV Adjustment of ($2.0M) driven by higher receivables and FMV mark. 2. Includes debt amortization costs.
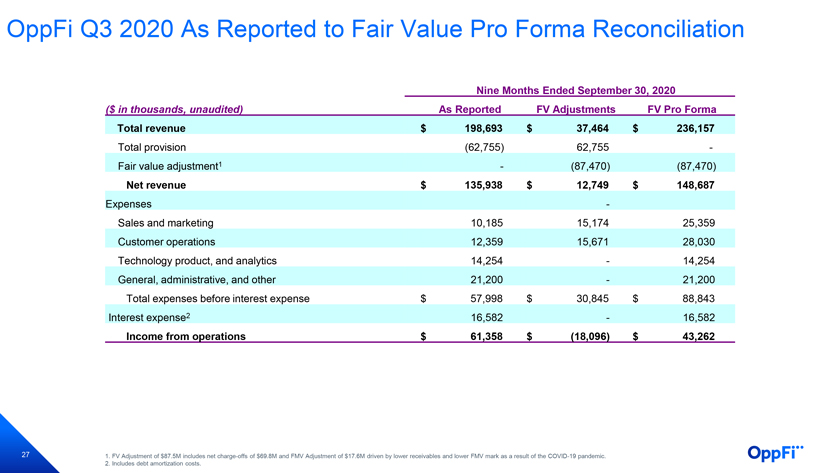
OppFi Q3 2020 As Reported to Fair Value Pro Forma Reconciliation Nine Months Ended September 30, 2020 ($ in thousands, unaudited) As Reported FV Adjustments FV Pro Forma Total revenue $ 198,693 $ 37,464 $ 236,157 Total provision (62,755) 62,755 -Fair value adjustment1—(87,470) (87,470) Net revenue $ 135,938 $ 12,749 $ 148,687 Expenses - Sales and marketing 10,185 15,174 25,359 Customer operations 12,359 15,671 28,030 Technology product, and analytics 14,254—14,254 General, administrative, and other 21,200—21,200 Total expenses before interest expense $ 57,998 $ 30,845 $ 88,843 Interest expense2 16,582—16,582 Income from operations $ 61,358 $ (18,096) $ 43,262 27 1. FV Adjustment of $87.5M includes net charge-offs of $69.8M and FMV Adjustment of $17.6M driven by lower receivables and lower FMV mark as a result of the COVID-19 pandemic. 2. Includes debt amortization costs.
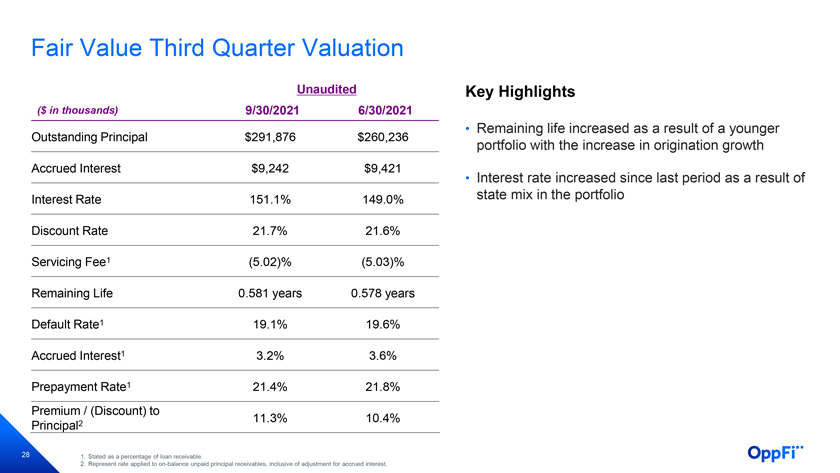
Fair Value Third Quarter Valuation Unaudited Key Highlights ($ in thousands) 9/30/2021 6/30/2021 • Remaining life increased as a result of a younger Outstanding Principal $291,876 $260,236 portfolio with the increase in origination growth Accrued Interest $9,242 $9,421 • Interest rate increased since last period as a result of Interest Rate 151.1% 149.0% state mix in the portfolio Discount Rate 21.7% 21.6% Servicing Fee1 (5.02)% (5.03)% Remaining Life 0.581 years 0.578 years Default Rate1 19.1% 19.6% Accrued Interest1 3.2% 3.6% Prepayment Rate1 21.4% 21.8% Premium / (Discount) to 11.3% 10.4% Principal2 28 1. Stated as a percentage of loan receivable. 2. Represent rate applied to on-balance unpaid principal receivables, inclusive of adjustment for accrued interest.
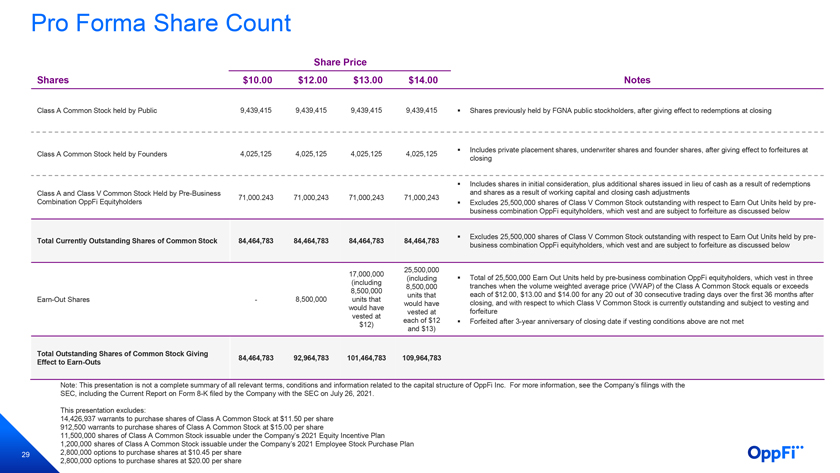
Pro Forma Share Count Share Price Shares $10.00 $12.00 $13.00 $14.00 Notes Class A Common Stock held by Public 9,439,415 9,439,415 9,439,415 9,439,415 Shares previously held by FGNA public stockholders, after giving effect to redemptions at closing Includes private placement shares, underwriter shares and founder shares, after giving effect to forfeitures at Class A Common Stock held by Founders 4,025,125 4,025,125 4,025,125 4,025,125 closing Includes shares in initial consideration, plus additional shares issued in lieu of cash as a result of redemptions Class A and Class V Common Stock Held by Pre-Business and shares as a result of working capital and closing cash adjustments 71,000.243 71,000,243 71,000,243 71,000,243 Combination OppFi Equityholders Excludes 25,500,000 shares of Class V Common Stock outstanding with respect to Earn Out Units held by pre-business combination OppFi equityholders, which vest and are subject to forfeiture as discussed below Excludes 25,500,000 shares of Class V Common Stock outstanding with respect to Earn Out Units held by pre- Total Currently Outstanding Shares of Common Stock 84,464,783 84,464,783 84,464,783 84,464,783 business combination OppFi equityholders, which vest and are subject to forfeiture as discussed below 25,500,000 17,000,000 (including Total of 25,500,000 Earn Out Units held by pre-business combination OppFi equityholders, which vest in three (including 8,500,000 tranches when the volume weighted average price (VWAP) of the Class A Common Stock equals or exceeds 8,500,000 units that each of $12.00, $13.00 and $14.00 for any 20 out of 30 consecutive trading days over the first 36 months after Earn-Out Shares—8,500,000 units that would have closing, and with respect to which Class V Common Stock is currently outstanding and subject to vesting and would have vested at forfeiture vested at each of $12 Forfeited after 3-year anniversary of closing date if vesting conditions above are not met $12) and $13) Total Outstanding Shares of Common Stock Giving 84,464,783 92,964,783 101,464,783 109,964,783 Effect to Earn-Outs Note: This presentation is not a complete summary of all relevant terms, conditions and information related to the capital structure of OppFi Inc. For more information, see the Company’s filings with the SEC, including the Current Report on Form 8-K filed by the Company with the SEC on July 26, 2021. This presentation excludes: 14,426,937 warrants to purchase shares of Class A Common Stock at $11.50 per share 912,500 warrants to purchase shares of Class A Common Stock at $15.00 per share 11,500,000 shares of Class A Common Stock issuable under the Company’s 2021 Equity Incentive Plan 1,200,000 shares of Class A Common Stock issuable under the Company’s 2021 Employee Stock Purchase Plan 29 2,800,000 options to purchase shares at $10.45 per share 2,800,000 options to purchase shares at $20.00 per share